Article

A Modified Three-Stage Inversion Algorithm Based on R-RVoG Model for Pol-InSAR Data

Beijing Key Laboratory of Embedded Real-Time Information Processing Technology, Beijing Institute of Technology, Beijing 100081, China
*
Author to whom correspondence should be addressed.
Remote Sens. 2016, 8(10), 861; https://doi.org/10.3390/rs8100861
Submission received: 20 June 2016 / Revised: 5 September 2016 / Accepted: 14 October 2016 / Published: 20 October 2016

Abstract

:
In this paper, a modified two-layer scattering model is applied to a three-stage algorithm for high-precision retrieval of forest parameters from Polarimetric Synthetic Aperture Radar Interferometry (Pol-InSAR) data. Traditional Random-Volume-over-Ground (RVoG) model considers forest target as a two-layer combination of flat ground and volumetric canopy. However, when it comes to sloped terrain, the inversion accuracy of three-stage process deteriorates with the ascending estimation error in volume correlation which is mainly caused by the existence of underlying terrain slope. Aiming at this problem, a Range-sloped RVoG (R-RVoG) model is presented in this paper. By modifying the ground layer as a range-sloped plane, the complex correlation of R-RVoG model can be amended as a function of ground phase, ground-to-volume scattering ratio, forest height, mean extinction and range slope. The introduction of range slope variable makes this modified model better resemble to real scene and thus improves the performance of three-stage algorithm. Both of the simulated data with different terrain slopes and the Space-borne Imaging Radar-C (SIR-C) real data in Tianshan test area are processed to verify the validity of this modification.

Graphical Abstract

1. Introduction

Polarimetric Synthetic Aperture Radar Interferometry (Pol-InSAR) is known as a technical fusion of Polarimetric Synthetic Aperture Radar (Pol-SAR) and Interferometric Synthetic Aperture Radar (In-SAR) [1]. In a Pol-InSAR system, two Pol-SAR sensors work at slightly different positions in space to acquire fully polarimetric data sets. This technique has been widely used for forest parameter inversion by virtue of its sensibility to both vertical structures and physical characteristics of the scattering media without the influence from time and weather. By extracting the phase and amplitude information from the observed complex correlations, Pol-InSAR can effectively separate the vertical locations of different phase centers with different polarization scattering mechanisms [2,3]. So far, there are various inversion algorithms for Pol-InSAR data, but in terms of model-based retrieval methods, the estimation accuracy is closely related to the coherent scattering model [4].
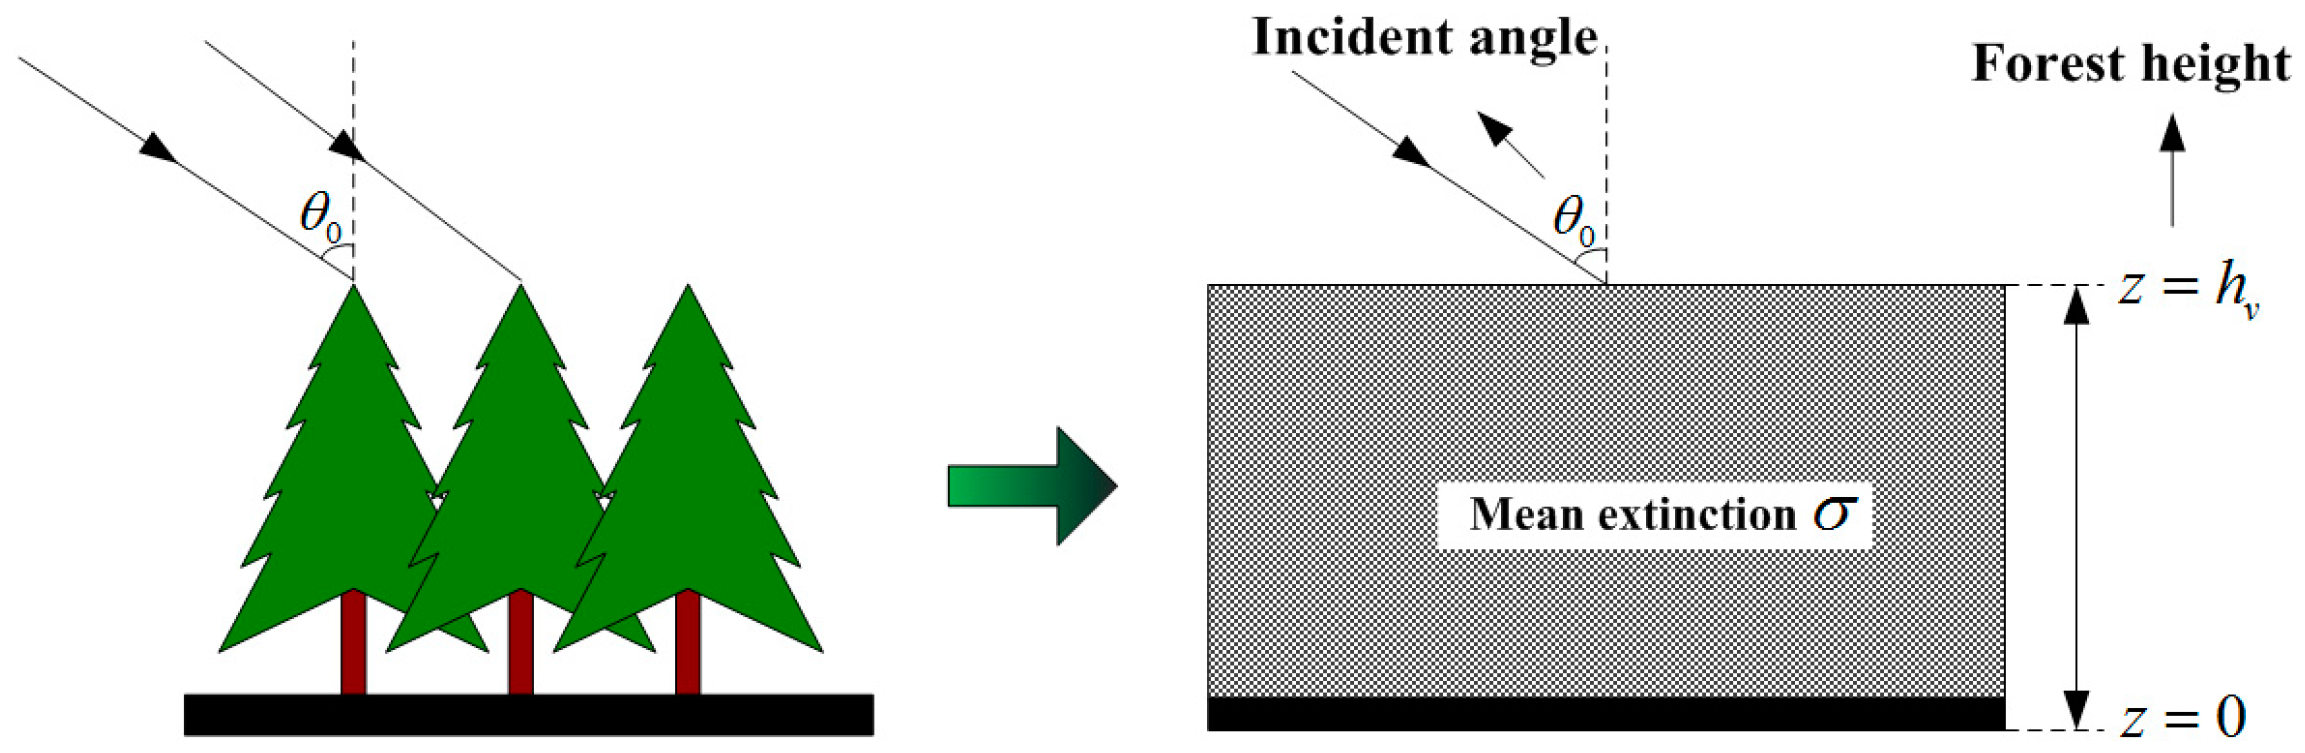
RVoG model is a two-layer scattering construction which considers forest target as a combination of flat ground and volumetric canopy [5,6]. In RVoG model, the underlying topography is regarded as a flat plane so that its complex correlation can be approximated as a function of ground phase, ground-to-volume scattering ratio and volume correlation, where the volume correlation can be fully defined by forest height, mean extinction and other system parameters [7,8,9].
As for model-based inversion methods for Pol-InSAR data, three-stage process is widely applied owing to its low complexity and high efficiency. The union of three-stage algorithm and RVoG model is a typical scheme for forest parameter extraction [
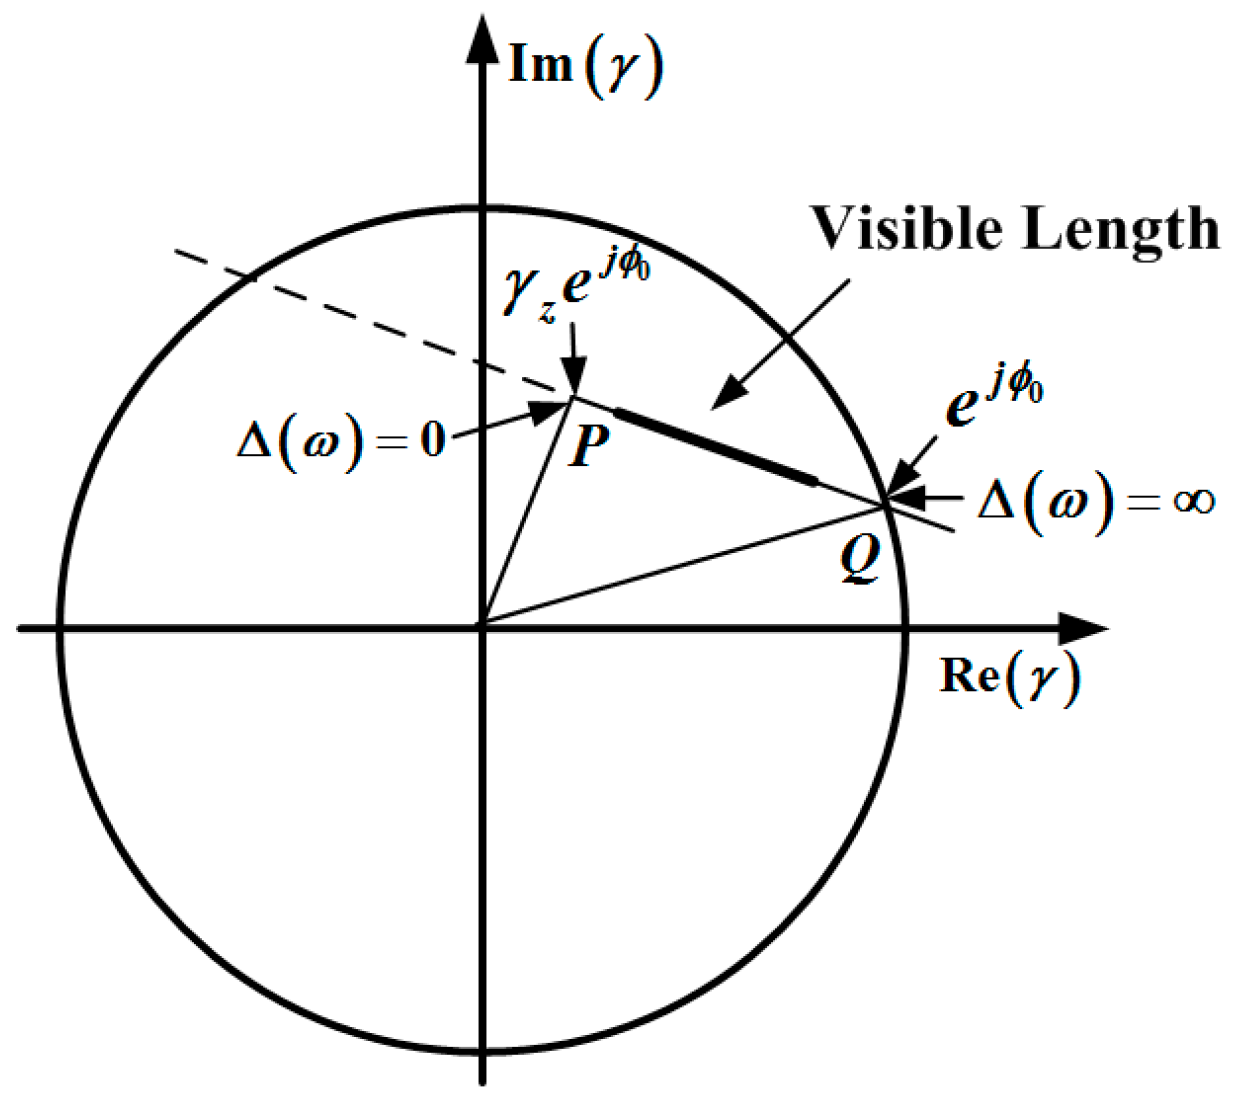
10]. The complex correlation of RVoG model can be visualized as a straight line in the complex plane which is the prior foundation of three-stage process [11]. Through the least square fitting of the observed complex correlations under different polarimetric channels, the ground phase and volume correlation can be extracted from the geometric relationship between the coherent line and unit circle [12]. After that, allowing for the nonlinear property of the volume coherent function, two dimensional (2D) search is carried out to accomplish the estimation of forest height and mean extinction [13].
Three-stage process based on RVoG model has been extensively applied for forest parameter extraction from Pol-InSAR data. However, the inversion accuracy of this scheme is rigorously limited by underlying terrain [14]. In real scenario, the ground topography intricately fluctuates with the coexistence of azimuth and range slopes, which leads to an extremely complex scattering contribution from the ground and volume components. Under this situation, the flat-ground approximation in RVoG model is likely to cause incorrect separation of the volume and ground correlations and thus influences the estimation accuracy of related parameters. Therefore, the adjustment of RVoG model need to be promoted from this aspect.
In order to restrain the deterioration of inversion precision derived from azimuth slope, literatures [15,16,17] put forward a series of estimation and compensation algorithms based on the polarization orientation angle of Pol-InSAR data. However, for the disturbance from range terrain distortion, effective solutions are rare. Reference [
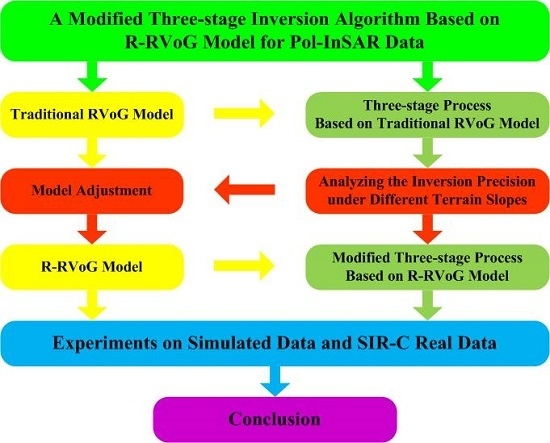
18] proposes an improved algorithm from this aspect, but its inversion accuracy strictly depends on the precision of external input. Motivated by this purpose, this paper proposes an R-RVoG model to replace traditional RVoG model. By modifying the underlying topography as a range-sloped plane, the complex correlation of R-RVoG model can be amended as a function of ground phase, ground-to-volume scattering ratio, forest height, mean extinction and range slope. The introduction of range slope factor makes this modified model better resemble to real scene and thus improves the performance of three-stage algorithm. Both of the simulated data with different terrain slopes and the Space-borne Imaging Radar-C (SIR-C) real data in Tianshan test area are processed to verify the validity of this modification.
This paper is organized as follows: Through the processing of simulated data with different range slopes, Section 2 analyzes the influence of range slope factor on the performance of traditional RVoG inversion. In order to suppress this impact, Section 3 develops an R-RVoG scattering model and deduces its complex correlation from the original echo signal of Pol-InSAR. By processing both of the simulated data and SIR-C real data with the modified three-stage operation based on R-RVoG model, Section 4 and Section 5 respectively provide corresponding analysis of the inversed results and thus manifest the outperformance of this modification. Conclusions are drawn in Section 6.

2. Three-Stage Process Based on RVoG Model

2.1. RVoG Model

The second-order statistics of RVoG model is contributed by the scattering properties from two different layers, the ground layer and the volume layer. Under the flat-ground assumption, both layers can be considered as horizontally homogeneous with a normalized distribution in vertical direction because the influence of terrain slope is neglected [19]. Figure 1 shows the two-layer structure of RVoG scattering model.
However, attributed to the distinctive characteristics of internal structures, the vertically normalized functions of these two layers are different, which can be respectively given by [20]:
ρ 1 ( z ) = δ ( z ) δ ( z ) d z ,   ρ 2 ( z ) = e 2 σ cos θ 0 z e 2 σ cos θ 0 z d z
After further deductions, the complex correlation of RVoG model can be depicted as [21]:
γ e i ϕ 0 ( Δ ( ω ) + γ z Δ ( ω ) + 1 ) = e j ϕ 0 ( γ z + Δ ( ω ) 1 + Δ ( ω ) ( 1 γ z ) )
where, ϕ 0 denotes the ground phase, Δ ( ω ) = 2 σ cos θ 0 ( e 2 σ h v / cos θ 0 1 ) ω H T g ω ω H T v ω is the ground-to-volume scattering ratio varying with polarization ω and γ z represents the volume correlation which can be expressed as a function of forest height h v and mean extinction σ [22]:
γ z = 2 σ ( exp ( 2 σ + j κ z cos θ 0 ) h v cos θ 0 1 ) ( 2 σ + j κ z cos θ 0 ) ( exp 2 σ h v cos θ 0 1 )
where, θ 0 is the incident angle and κ z is the effective wave number which can be defined as follow:
κ z = 4 π Δ θ λ sin θ 0 4 π B n λ R sin θ 0
where, λ is the wavelength, B n stands for the effective baseline, R represents the slant range and Δ θ denotes the incident angle difference caused by the existence of baseline.
Equation (2) can be approximately visualized as a straight line in the complex plane, which is also known as the coherent line [23]. The geometric relationship between this line and the unit circle is shown in Figure 2.
In practical circumstances, the scattering from the ground and volume layers coexist with each other, which means Δ ( ω )   =   0 and Δ ( ω )   =   are two extreme conditions that cannot be obtained by regular observation [24]. Therefore, the observed complex correlations are distributed in the range of visible length which is demonstrated in Figure 2.
Three-stage algorithm takes advantage of the geometric features in Figure 2 to fulfill the forest parameter inversion. However, the ground topographies in real scenes are so fluctuant sometimes that the approximate hypotheses in RVoG model are broken. In this context, simulations of forest areas with different terrains are carried out to analyze the behavior of three-stage process based on RVoG model.

2.2. Three-Stage Processing under Different Range Slopes

In order to explore the influence of range slope variation on the performance of three-stage algorithm based on traditional RVoG model. Three-stage processes are carried out within simulated data with different range slopes. Forest simulation software is employed as a primary tool to generate the full polarimetric forest data. Relevant simulation parameters are provided in Table 1.
Back Projection (BP) imaging algorithm is recruited here to achieve fully polarimetric SAR imaging without destructing any phase information [25]. Figure 3 gives the imaging results of Horizontal transmit and Horizontal receive (HH), Horizontal transmit and Vertical receive (HV), Vertical transmit and Horizontal receive (VH) and Vertical transmit and Vertical receive (VV) polarimetric data derived from the master sensor when range slope is set as 0°.
After the execution of three-stage process based on RVoG model, Figure 4, Figure 5, Figure 6 and Figure 7 respectively demonstrate the retrieved forest heights of simulated data when their range slopes are set at 0°, 10°, 20° and 30°.
As a standard to evaluate the performance of forest parameter inversion algorithm, the Average (AVG) bias, Standard Deviation (SDEV) and Root Mean Square Error (RMSE) of the inversed forest heights are calculated in Table 2. These three parameters separately stand for the estimation error, variance and residual error of the estimated results. Normally, values with lower AVG bias and RMSE at appropriate SDEV level are equipped with better inversion precisions [26].
It can be concluded from Table 2 that the ascending tendency of absolute range slope gives rise to abrupt increase in AVG bias, SDEV and RMSE, which implies severe deviation between the estimated result and the correct answer. Therefore, RVoG model need to be further improved for better adaptation to the fluctuation of range slope.

3. R-RVoG Model

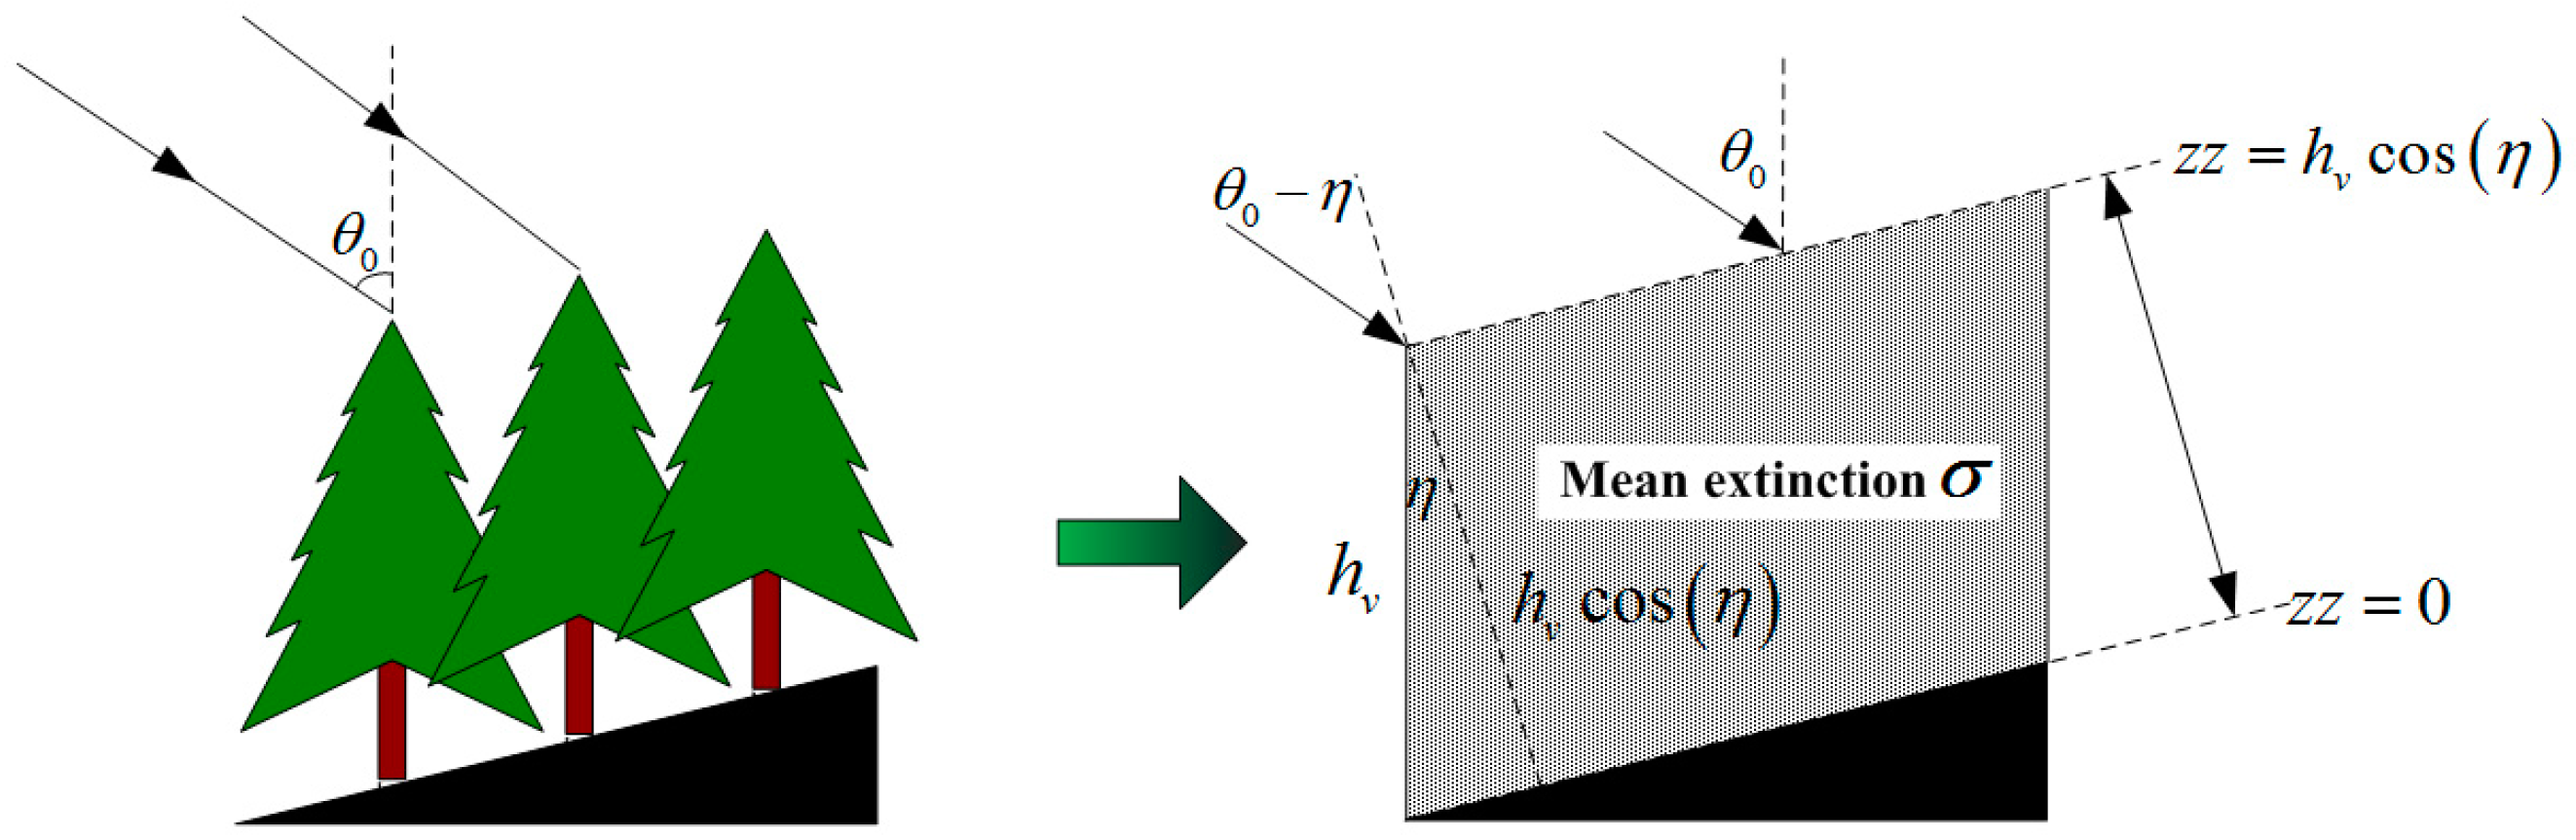
In this section, an R-RVoG model is proposed to compensate the precision deterioration of three-stage process which is mainly caused by the existence of range slope. After relevant adjustments, the constitution of the modified two-layer scattering model is presented in Figure 8.
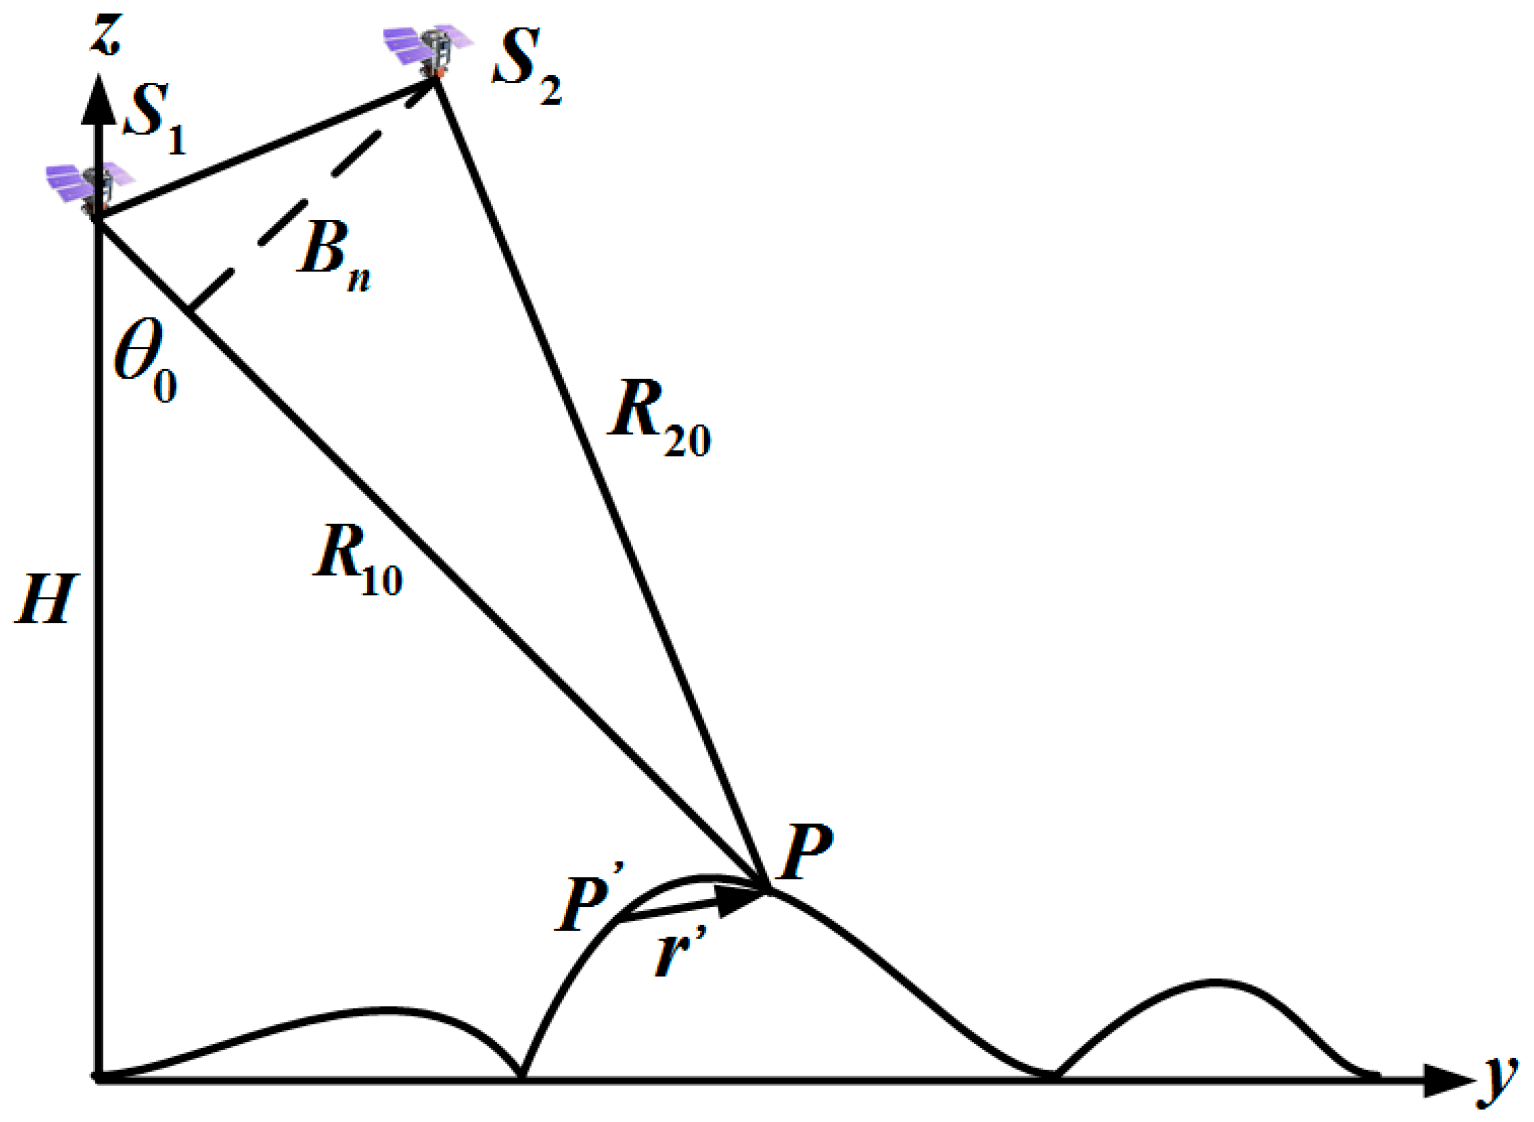
The R-RVoG model can be regarded as a modified version of traditional RVoG model where the ground layer is amended as an inclined plane in range direction. The gradient of this plane can be either positive or negative which respectively stands for the phenomenon of front and back slope. Accordingly, the complex correlation of this model needs to be re-deduced from the original echo signal due to the intrinsic change of physical characteristics.
Figure 9 demonstrates the irradiation geometry of Pol-InSAR system.
Figure 9. Two-layer structure of R-RVoG model.
Remotesensing 08 00861 g009
where, S 1 , 2 are the two Pol-SAR sensors used for the acquisition of Pol-InSAR data, P and P respectively stand for the referential and certain scattering points where the relative position between them is denoted as r , R 10 , 20 represent the referential slant range distances of two sensors, θ 0 is the incident angle, B n indicates the effective baseline and H is the height of the platform.
According to the geometrical relationship in Figure 9, the SAR signals for interferometry can be given as:
s 1 ( x , R 1 ) = A e i 2 k 0 R 10 f 1 ( r ) e 2 i k 0 r × h ( x x , R 1 R 1 ) d V + n s 2 ( x , R 2 ) = A e i 2 k 0 R 20 f 2 ( r ) e 2 i k 0 r × h ( x x , R 2 R 2 ) d V + n
where, A denotes the amplitude loss, k 0 stands for the wave number, f 1 , 2 ( · ) are the scattering functions submitting to circular complex Gaussian distribution, h ( x x , R 1 ,   2 R 1 , 2 ) refer to the SAR impulse response functions at ( x , R 1 , 2 ) and n denotes the additive Gaussian noise.
The cross and auto- correlations of s 1 and s 2 can be respectively described as:
E { s 1 s 2 } = A 2 E { f 1 ( r ) f 2 ( r ) } | h ( ) | 2 × e i 2 k 0 ( R 2 R 1 ) d V E { s 1 , 2 s 1 , 2 } = A 2 E { f 1 , 2 ( r ) f 1 , 2 ( r ) } | h ( ) | 2 d V + σ n
where, σ n = E { | n | 2 } is the noise variance.
Considering that both of the volume and ground layers rotate with the ground plane, therefore, they are horizontally homogeneous along the inclined range direction with a normalized distribution perpendicular to the slant ground.
The normalized functions of the ground and volume layers can be separately updated as:
ρ 1 ( z z ) = δ ( z z ) δ ( z z ) d z z ,   ρ 2 ( z z ) = e 2 σ cos ( θ 0 η ) z z e 2 σ cos ( θ 0 η ) z z d z z
where, z z is the height variable in the direction vertical to the range-sloped ground and factor η quantitatively describes the gradient of underlying topography.
Then, the second-order scattering statistics of R-RVoG model can be expressed as:
E { f 1 ( r ) f 2 ( r ) } = δ ( r r ) ( σ v 1 e 0 ρ 1 ( z z ) + σ v 2 e 0 ρ 2 ( z z ) ) E { f 1 , 2 ( r ) f 1 , 2 ( r ) } = δ ( r r ) ( σ v 1 0 ρ 1 ( z z ) + σ v 2 0 ρ 2 ( z z ) )
where, σ v 1 , 2 0 and σ v 1 , 2 e 0 respectively denote the total backscattering coefficients and the temporally stable backscattering coefficients of two layers.
For further deductions, the phase delay in Equation (6) needs to be expanded at relevant reference point in the inclined ground plane.
2 i k 0 ( R 2 R 1 ) i ϕ 0 + i k r r ( R R R R 0 ) + i k z z ( z z z z 0 )
where, ϕ 0 is the phase difference at reference point caused by the slant range deviation between two SAR platforms, k r r and k z z are the wave numbers along slant and vertical directions.
k r r = 4 π B λ R 0 tan ( θ 0 η ) ,   k z z = 4 π B λ R 0 sin ( θ 0 η )
Corresponding integrals in vertical direction can be defined as:
I z z 1 = ρ 1 ( z z ) e i k z z ( z z z z 0 ) d z z ,   I z z 2 = ρ 2 ( z z ) e i k z z ( z z z z 0 ) d z z I z z 1 0 = ρ 1 ( z z ) d z z ,   I z z 2 0 = ρ 2 ( z z ) d z z
As for the inclined ground plane, relevant integrals can be expressed as:
I r r x = | h ( ) | 2 e i k r r ( R R R 0 ) d R R d x I r r x 0 = | h ( ) | 2 d R R d x
According to above-mentioned deductions, Equation (6) can be simplified as:
E { s 1 s 2 } = A 2 e i ϕ 0 ( σ v e 1 0 I z z 1 + σ v e 2 0 I z z 2 ) I r r x E { s 1 , 2 s 1 , 2 } = A 2 ( σ v 1 0 I z z 1 0 + σ v 2 0 I z z 2 0 ) I r r x 0 + σ n
Therefore, the complex correlation of R-RVoG model can be written as:
γ = E { s 1 s 2 } E { | s 1 | 2 } E { | s 2 | 2 } = e i ϕ 0 ( σ v 1 0 I z z 1 0 σ v 2 0 I z z 2 0 σ v e 1 0 σ v 1 0 I z z 1 I z z 1 0 + σ v e 2 0 σ v 2 0 I z z 2 I z z 2 0 σ v 1 0 I z z 1 0 σ v 2 0 I z z 2 0 + 1 ) I r r x I r r x 0 σ 0 σ 0 + σ n = e i ϕ 0 ( Δ ( ω ) γ t e m p 1 γ z z 1 + γ t e m p 2 γ z z 2 Δ ( ω ) + 1 ) γ r r γ S N R
where, Δ ( ω ) is the ground-to-volume scattering ratio, γ t e m p 1 , 2 = σ v e 1 , 2 0 σ v 1 , 2 0 and γ z z 1 , 2 = I z z 1 , 2 I z z 1 , 2 0 respectively stand for the temporal and volumetric decorrelations at different SAR platforms, γ r r = I r r x I r r x 0 refers to the baseline decorrelation and γ S N R = σ 0 σ 0 + σ n is the thermal decorrelation mainly related to the SNR of the system [27].
In conjunction with Equations (7) and (11), it is not difficult to find that γ z z 1 equals to one and γ z z 2 is a function of h v , σ and η .
γ z z 2 = I z z 2 I z z 2 0 { I z z 2 = 0 h v cos ( η ) exp ( 2 σ z cos ( θ 0 η ) ) exp ( j κ z z z z ) d z z I z z 2 0 = 0 h v cos ( η ) exp ( 2 σ z z cos ( θ 0 η ) ) d z z = 2 σ { exp [ ( 2 σ cos ( θ 0 η ) + j k z z ) h v cos η ] 1 } [ 2 σ + j k z z cos ( θ 0 η ) ] { exp [ 2 σ cos ( θ 0 η ) h v cos η ] 1 }
When the range slope variable η comes to zero, Equation (15) will convert into the volume coherent function in flat terrain as Equation (3).
Furthermore, assuming that Pol-InSAR systems satisfy relations of γ t e m p 1 , 2 1 , γ r r 1 and γ S N R 1 . Then, Equation (14) can be further simplified as:
γ e i ϕ 0 ( Δ ( ω ) + γ z z 2 Δ ( ω ) + 1 ) = e j ϕ 0 ( γ z z 2 + Δ ( ω ) 1 + Δ ( ω ) ( 1 γ z z 2 ) )
What can be concluded from Equation (16) is that the introduction of range slope variable does not break the linearity of the complex coherent function. Thus, three-stage operation is still available based on this R-RVoG model.

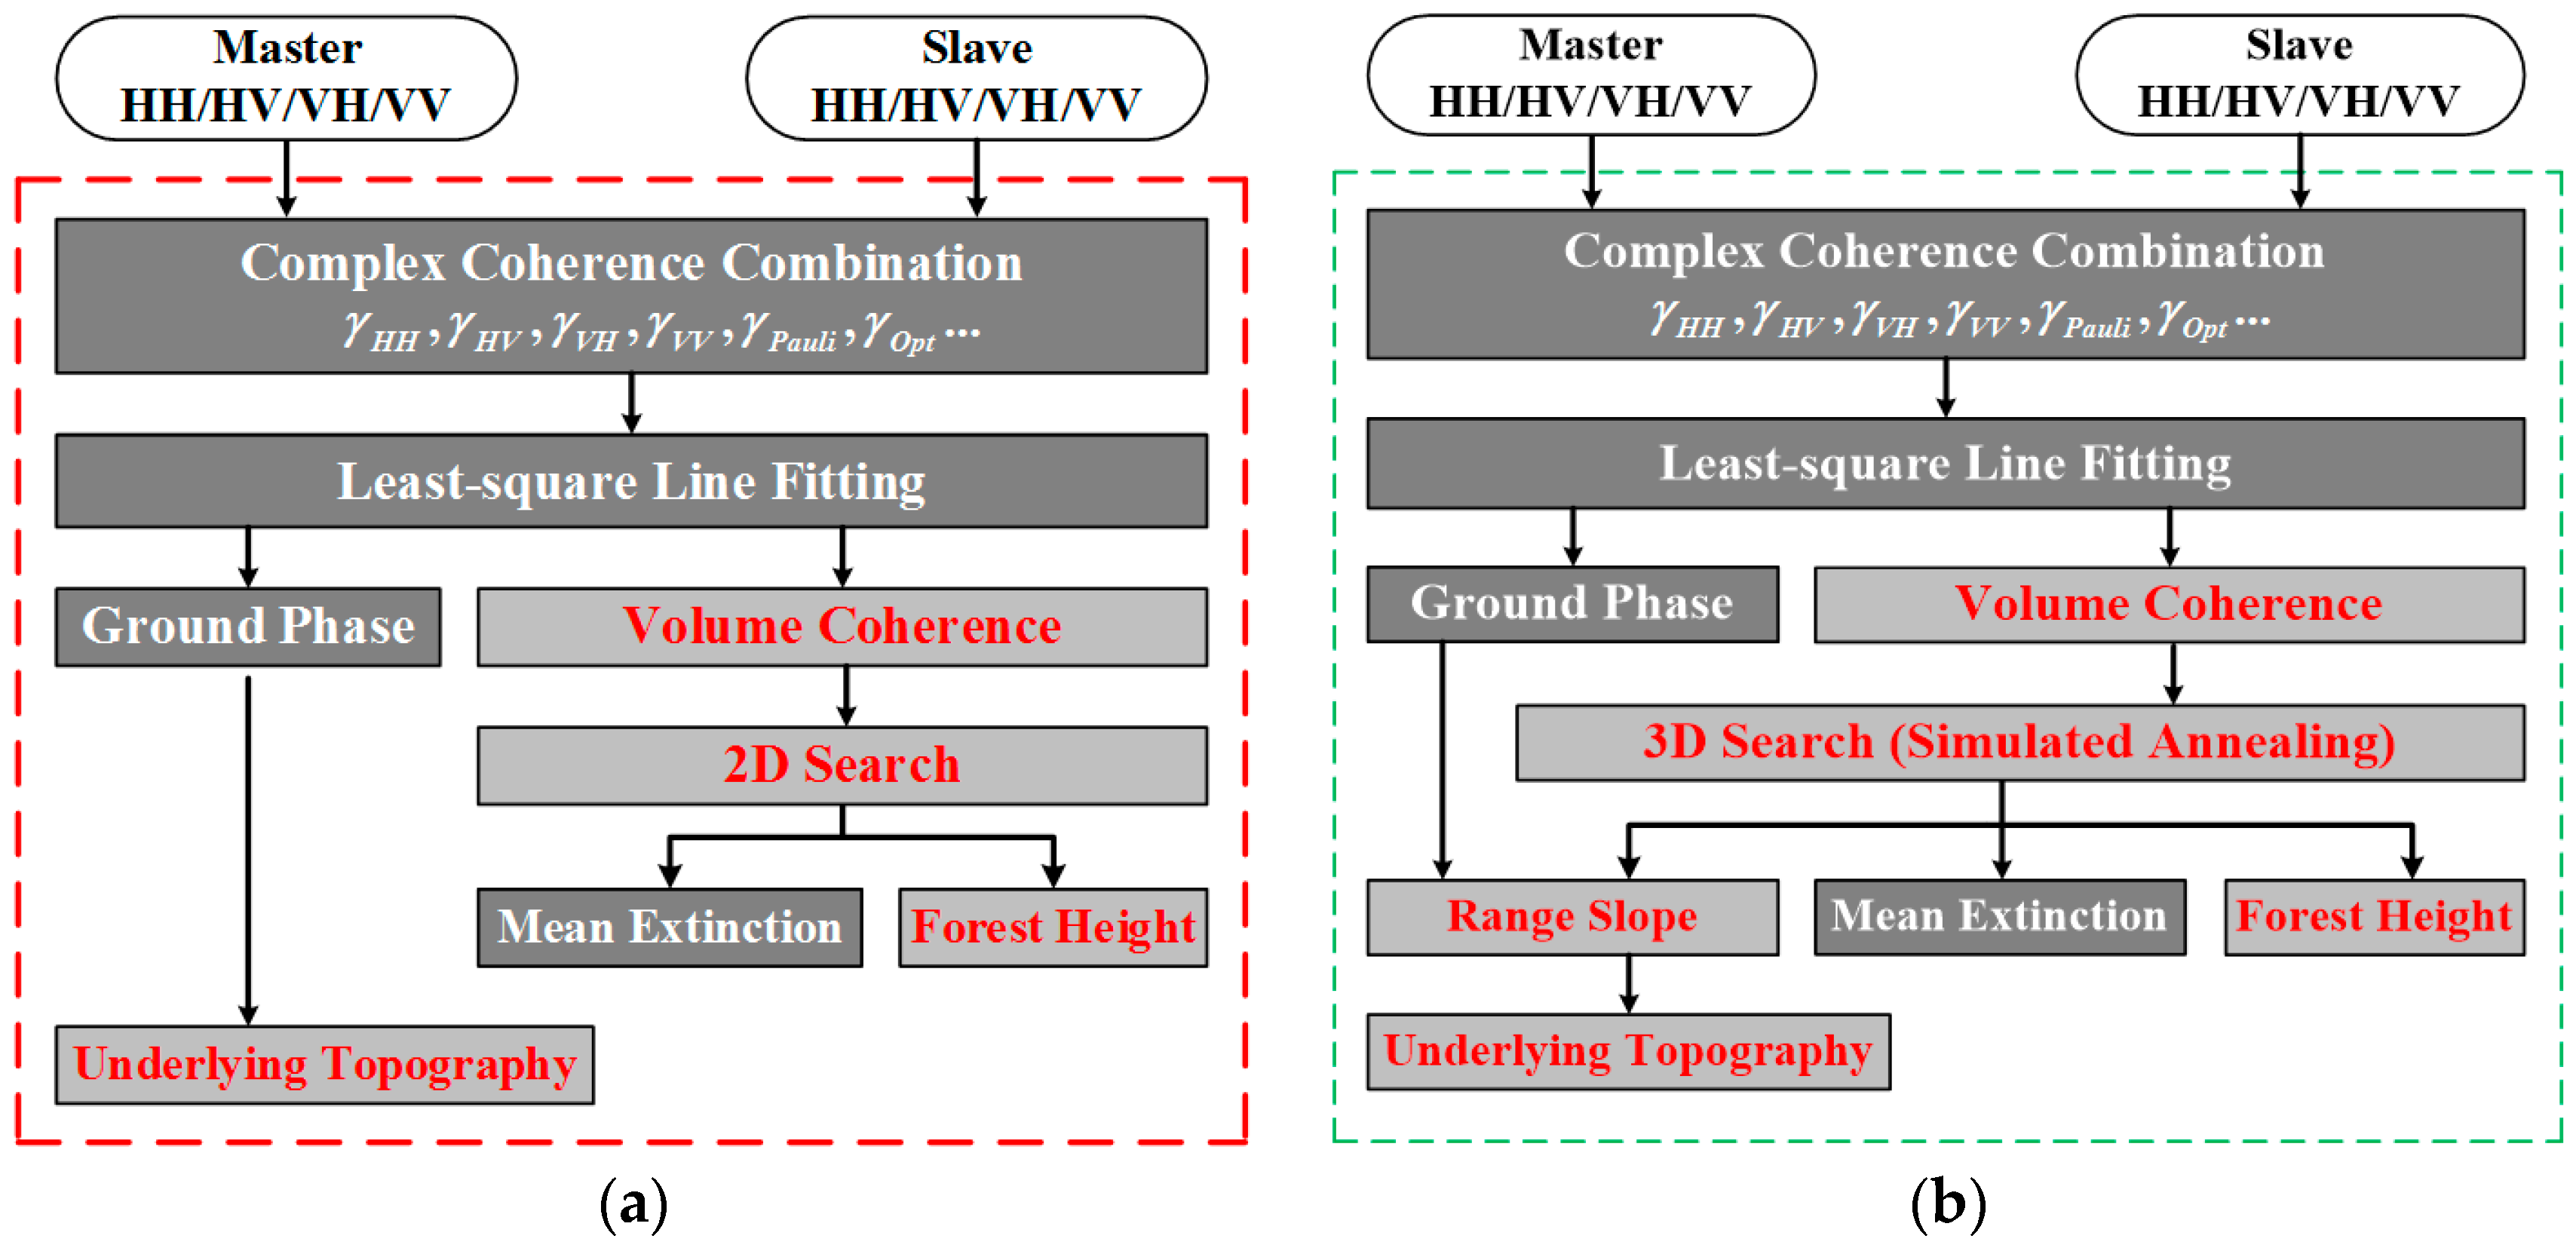
4. Three-Stage Processing of Simulated Data Based on R-RVoG Model

In this part, three-stage operations based on R-RVoG model are performed under the same conditions as in Section 2. However, the participation of range slope factor increases the complexity of three-stage algorithm and also brings down its calculation efficiency. In this context, Simulated Annealing (SA) optimization algorithm is employed and incorporated into iteration to improve the computing efficiency of three dimensional (3D) search [28,29,30]. The detailed procedures of three-stage process before and after adjustment are listed in Figure 10.
During the process, Matlab is employed as a primary programming language under the hardware condition of 2.6 GHz main frequency Central Processing Unit (CPU) and 4 GB internal storage. After the execution of three-stage process based on R-RVoG model, Figure 11, Figure 12, Figure 13 and Figure 14 respectively present the inversion results of forest height when the range slopes are set at 0°, 10°, 20° and 30°.
Table 3 lists the AVG bias, SDEV and RMSE of the estimated forest heights just like Section 2 so that the performance of three-stage process based on R-RVoG model can be equivalently assessed.
In combination with Table 2, Figure 15 plots the variation tendencies of the height estimation biases based on RVoG and R-RVoG inversions under different range slopes.
As it is indicated in Figure 15, the increasing tendency of estimation biases is effectively under control with the introduction of the range slope parameter in R-RVoG correlated model.
Figure 16 shows the inversed underlying topographies in three-dimension by utilizing both of the retrieved ground phase and the estimated range slope.
Table 4 calculates the absolute biases between the estimated range slopes and the real ones to evaluate the accuracy of reconstructed underlying topographies.
The conclusion can be made from above analysis that the R-RVoG model not only can prevent three-stage algorithm from the influence of range slope variation but also has the ability to improve the reconstructed precision of underlying topography.

5. Three-Stage Processing of Real Data Based on R-RVoG Model

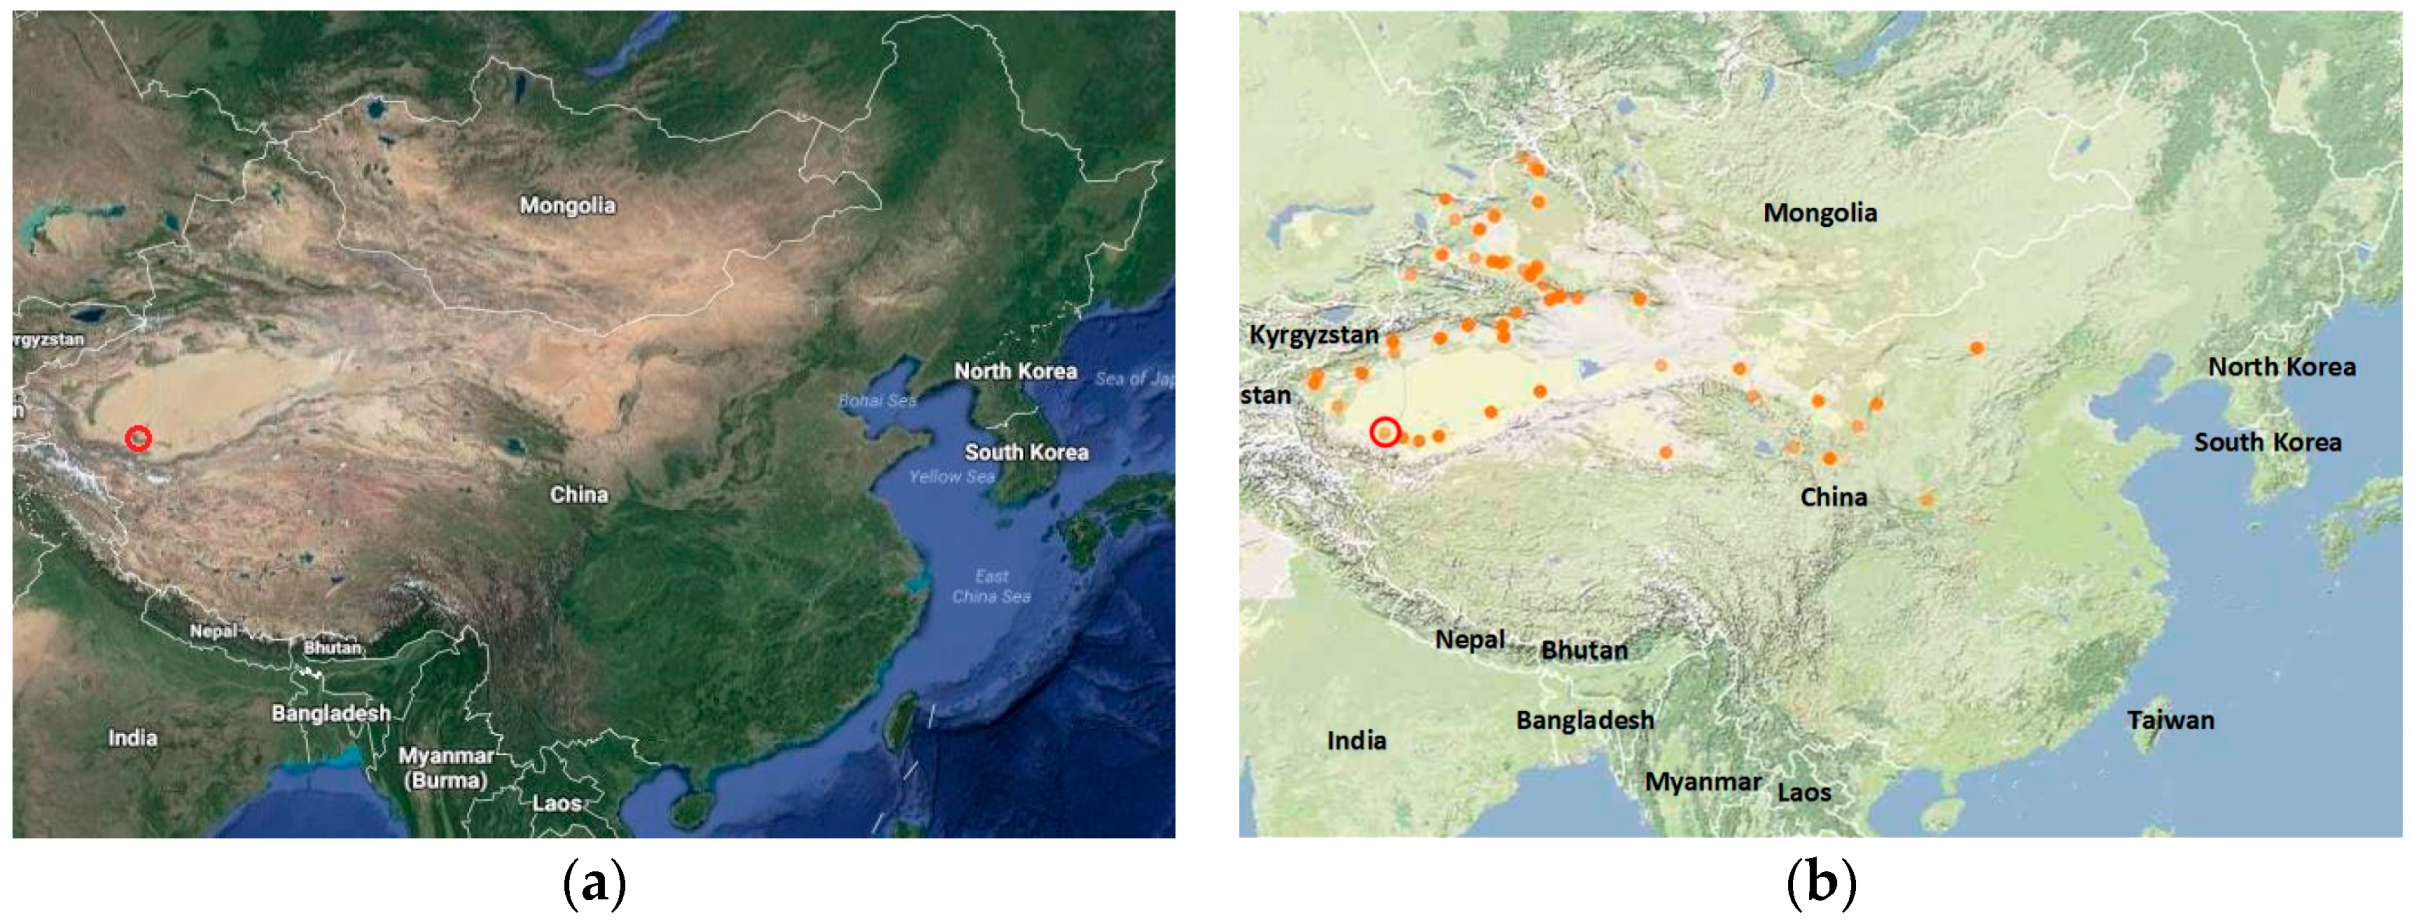
In this section, the parameter estimation behavior of three-stage algorithm based on R-RVoG model is evaluated from the aspect of real space-borne L-band SAR data in Tianshan forest test site, acquired by SIR-C sensors in 1994.
The Tianshan test area is located in Hotan, Sinkiang Province, mainly covered by deserts. The primary tree species in that area is Populus Euphratica which generally grows in dry environment at altitudes of up to 4000 m above sea level with average height between 15 m and 25 m. Figure 17 shows the location of the test area and the distribution of Populus diversifolia in China [31].
According to [32], the Space-borne Imaging Radar-C/X-band Synthetic Aperture Radar (SIR-C and X-SAR) sensors are recruited to obtain Digital Elevation Models (DEMs) on a near-global scale from 56°S to 60°N for the Shuttle Radar Topography Mission (SRTM) research. The data sets utilized in our research are acquired by SIR-C sensor in repeat-pass configuration. Relevant parameters of SIR-C sensor are provided in 
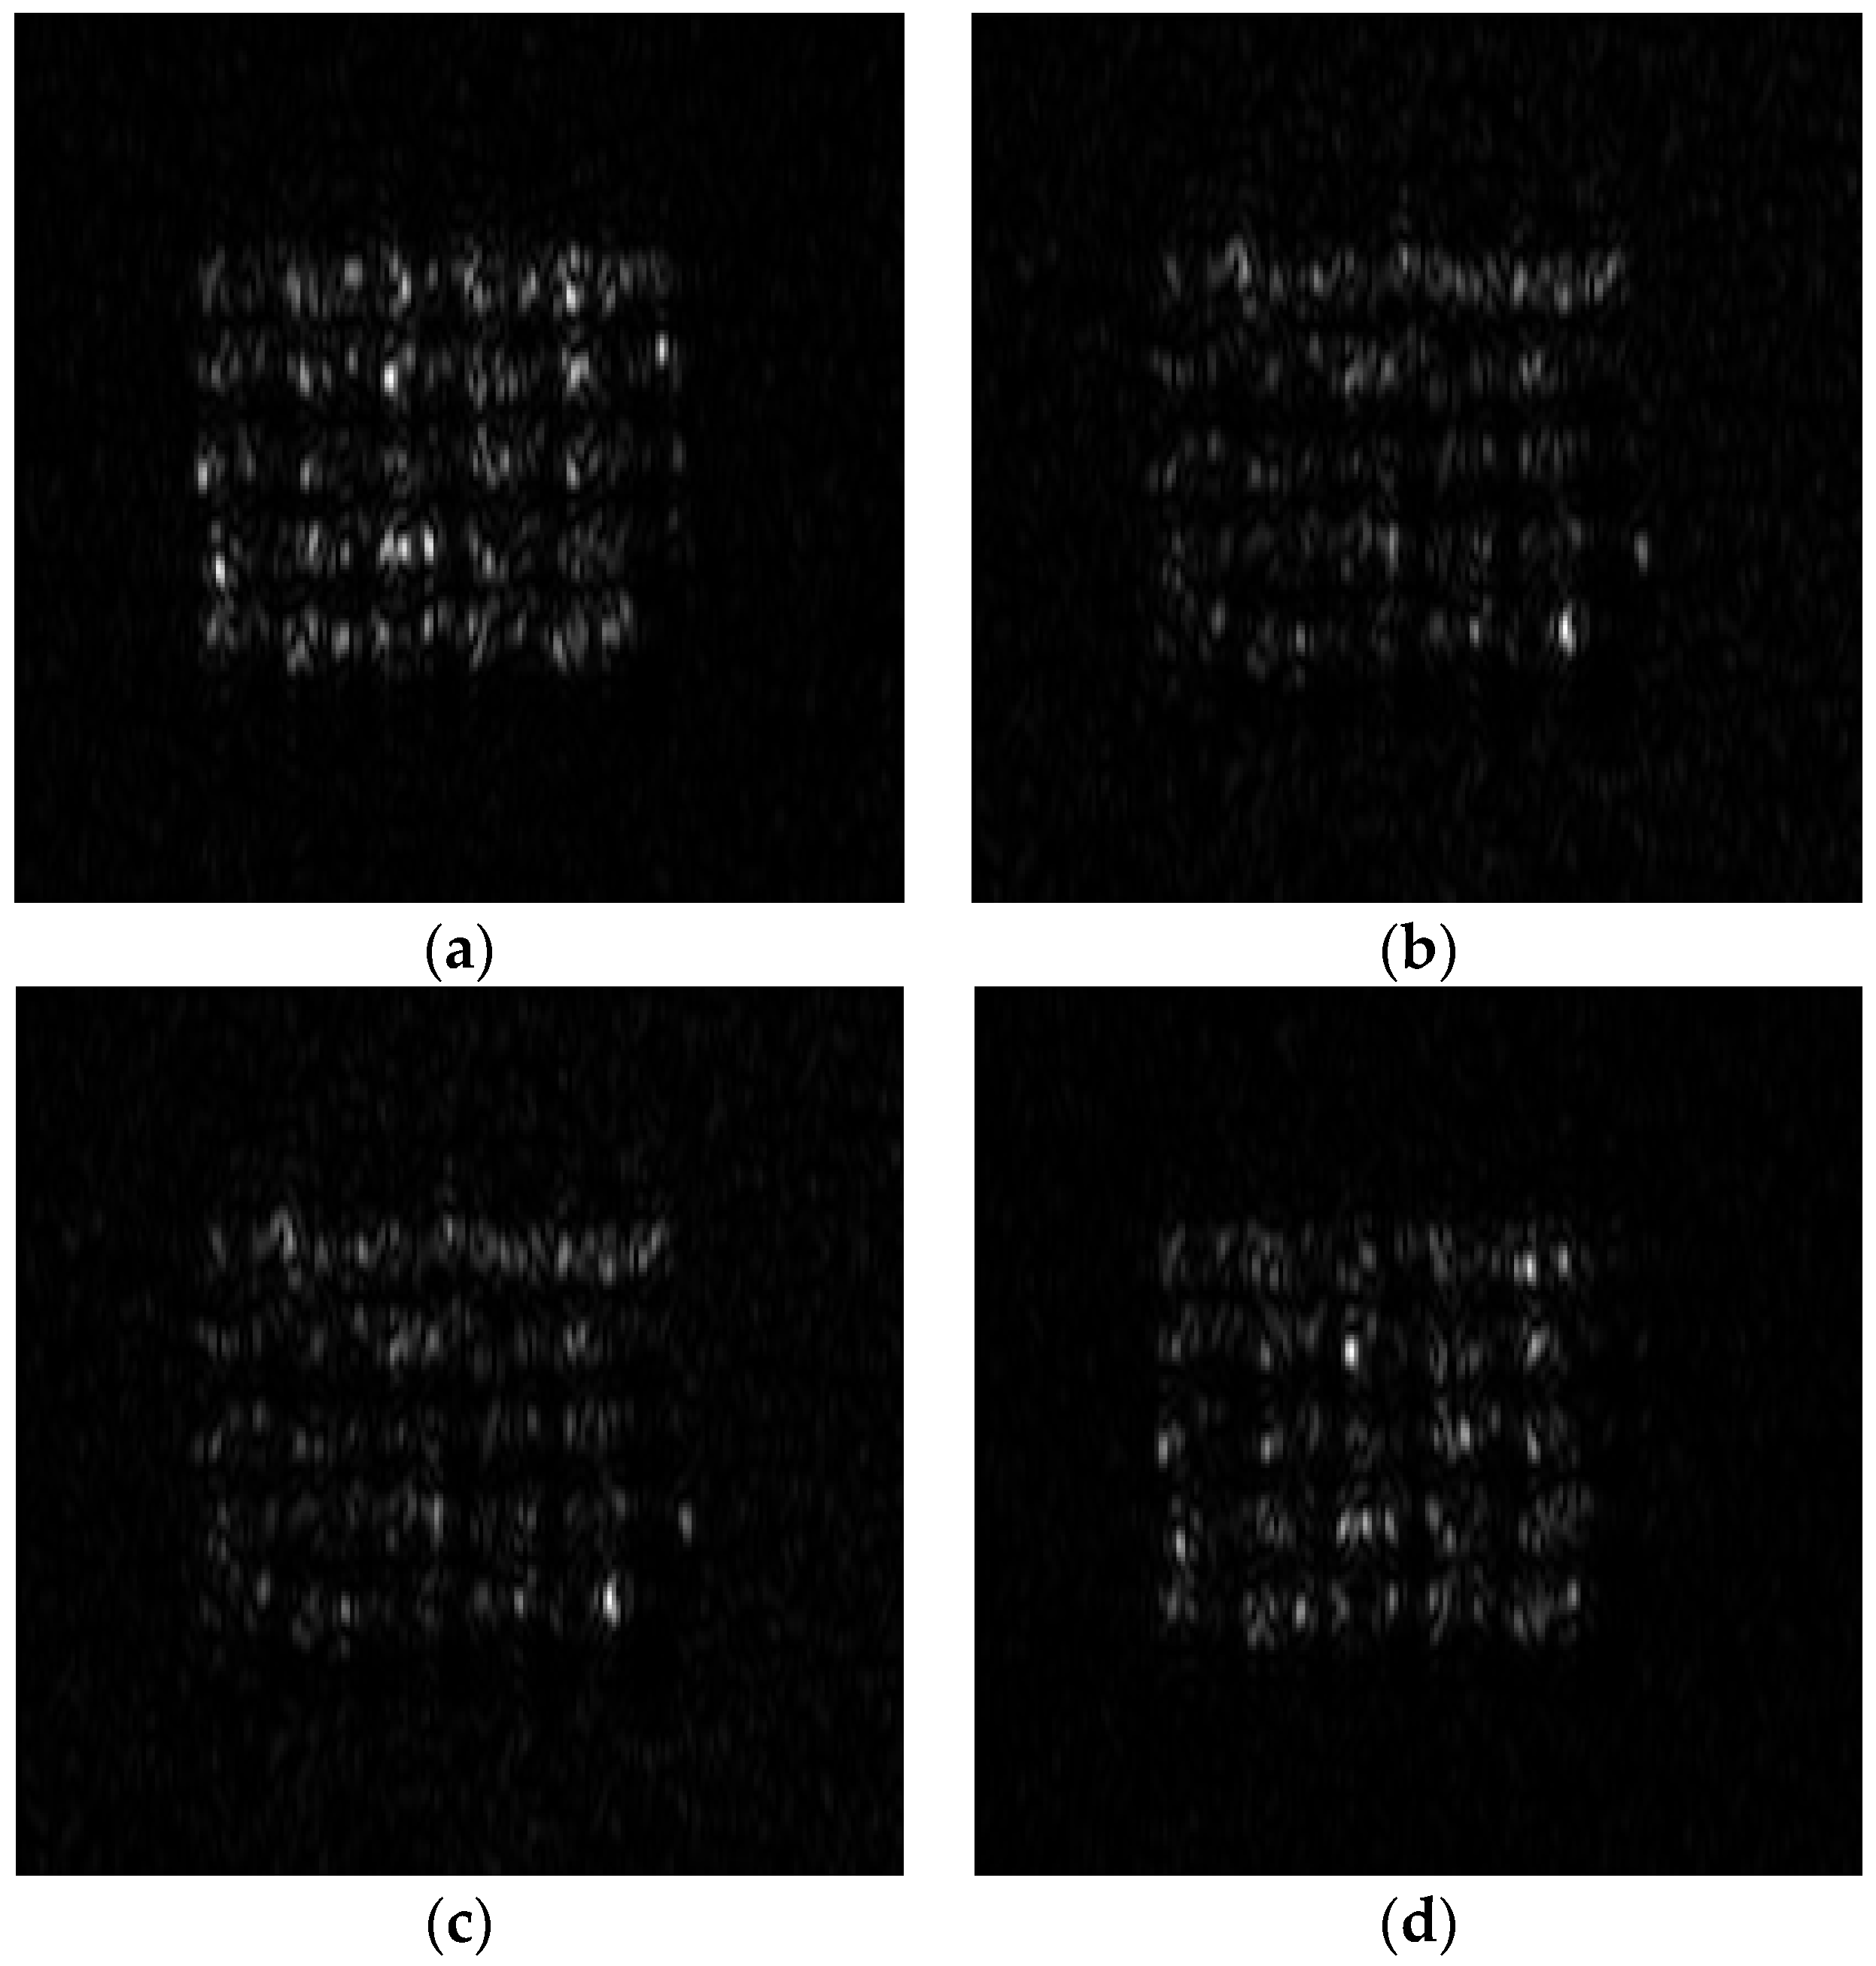
Table 5 and the fully polarimetric SAR images of the first orbit are displayed in Figure 18.
As an evaluation criteria, the forest height and underlying ground phase used as true value are separately acquired by PolSARpro software and DEM difference [33,34].
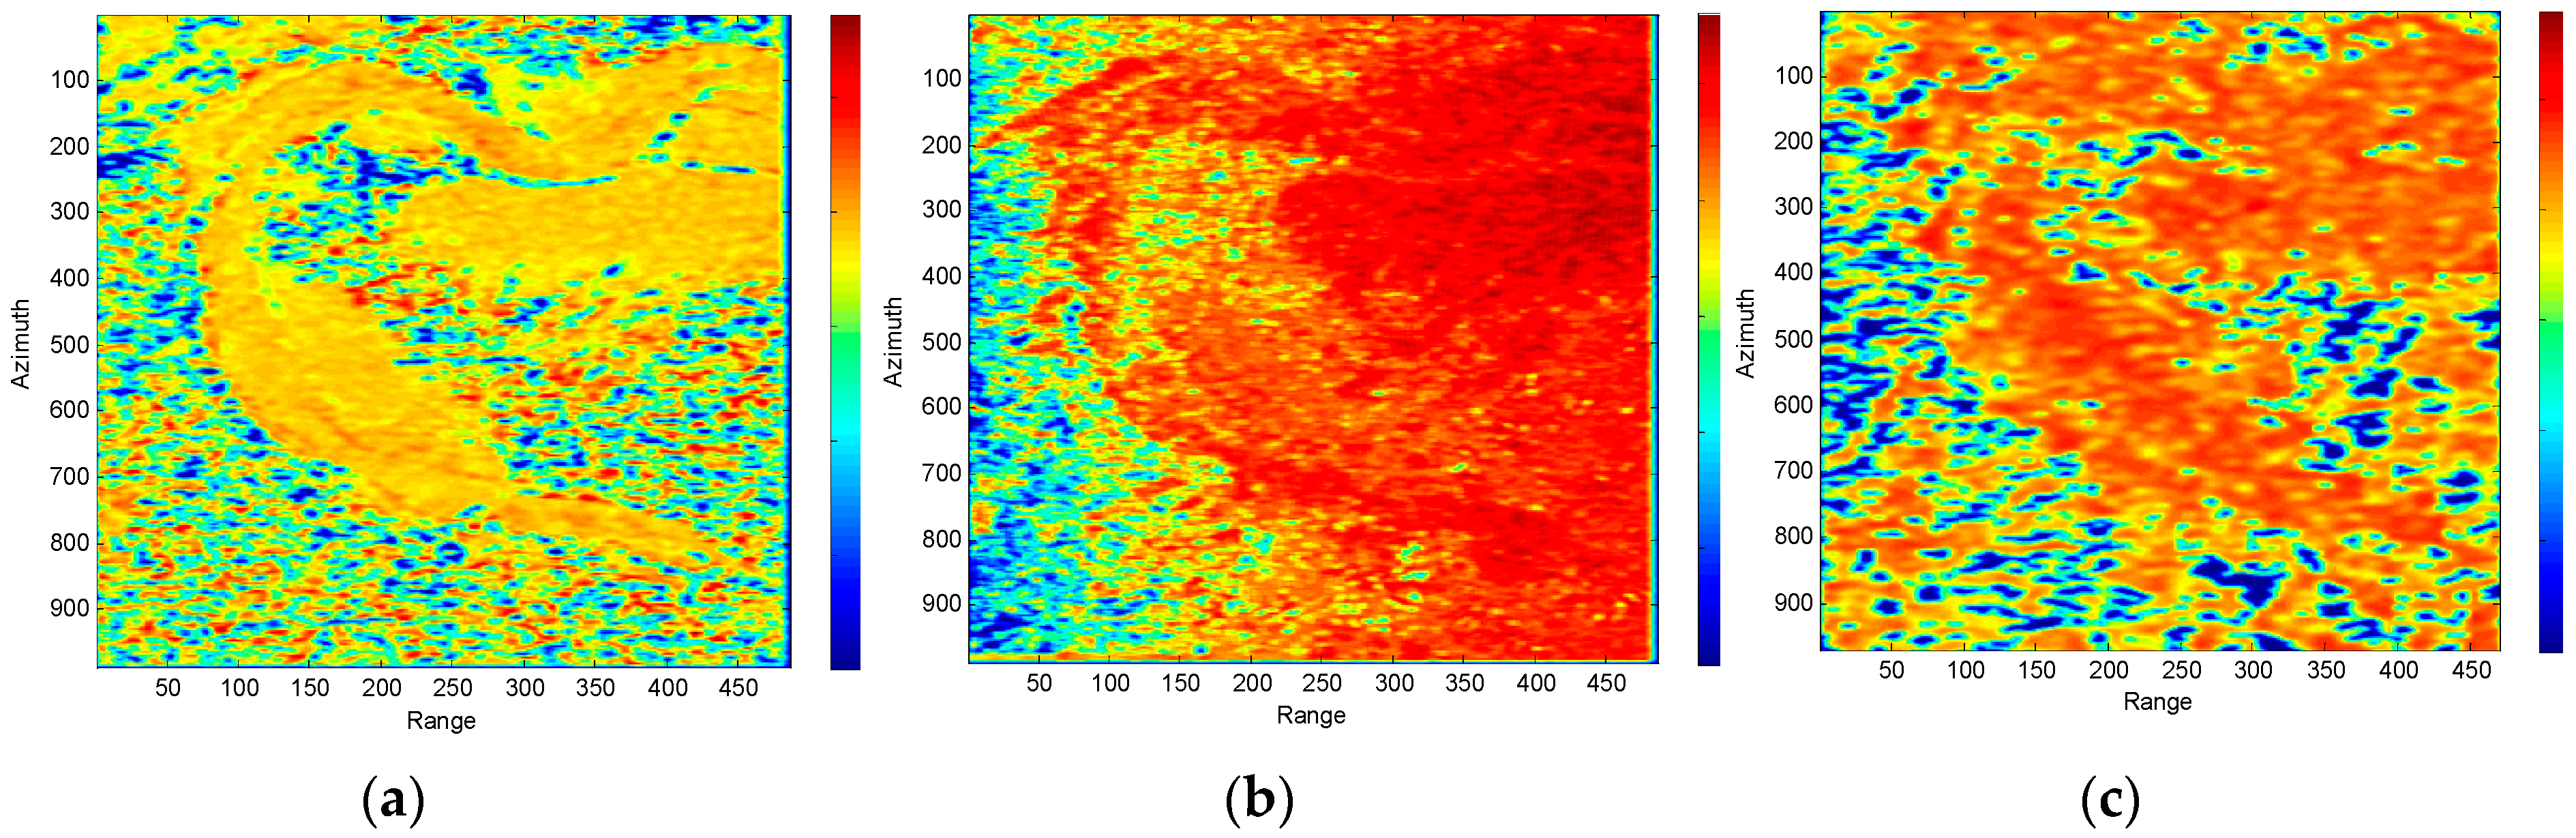
For the purpose of comparison, the same data set is respectively processed by three-stage algorithm based on traditional RVoG model and modified R-RVoG model. Corresponding inversion results are demonstrated in the following figures where 
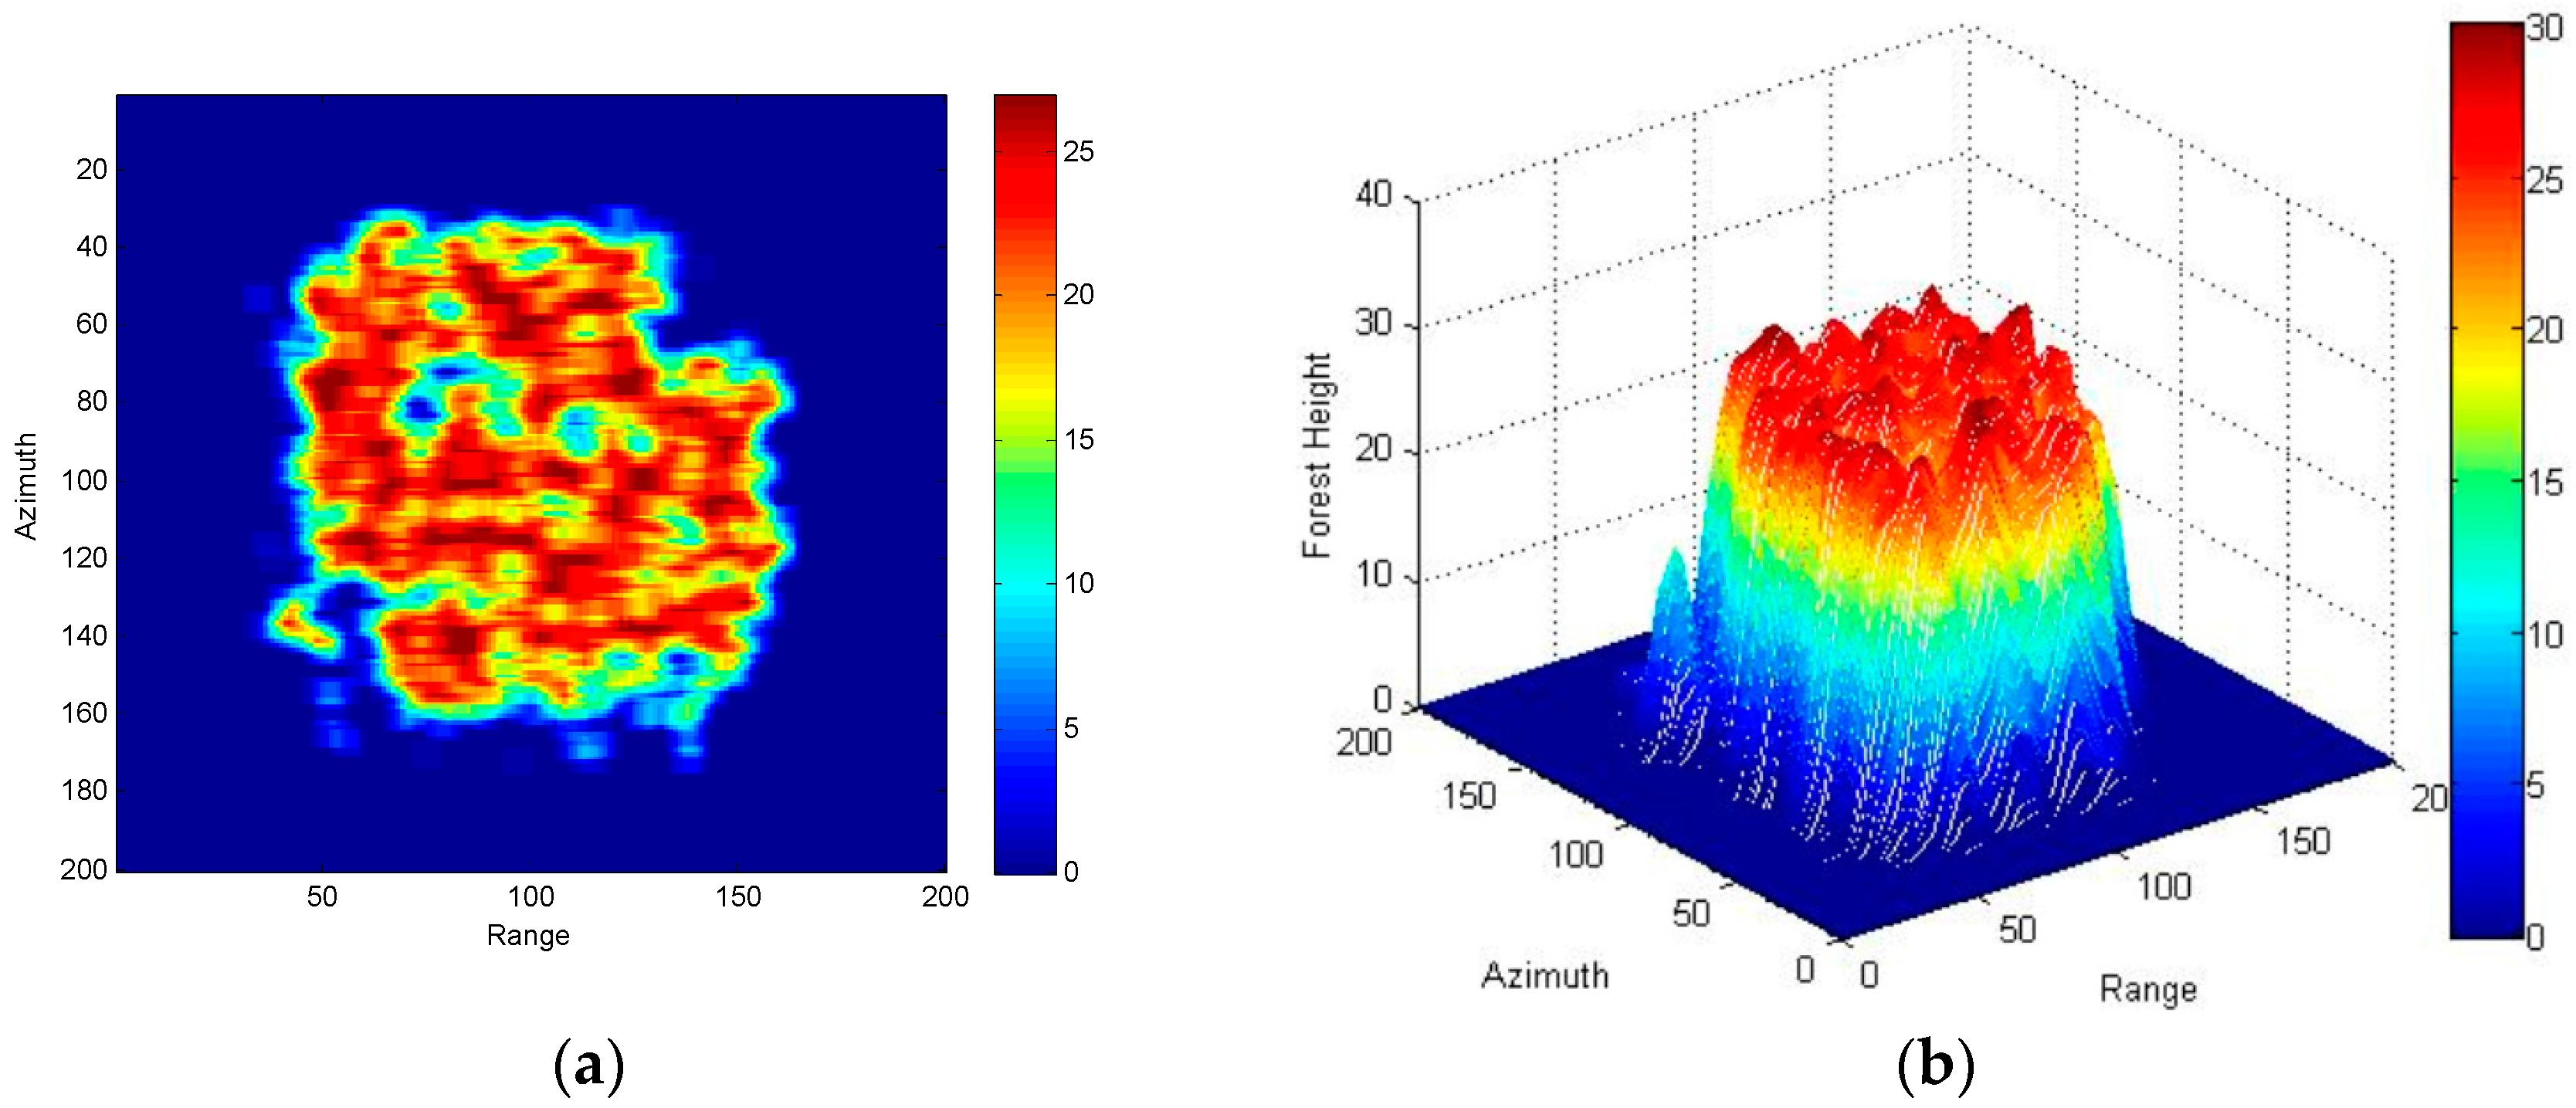
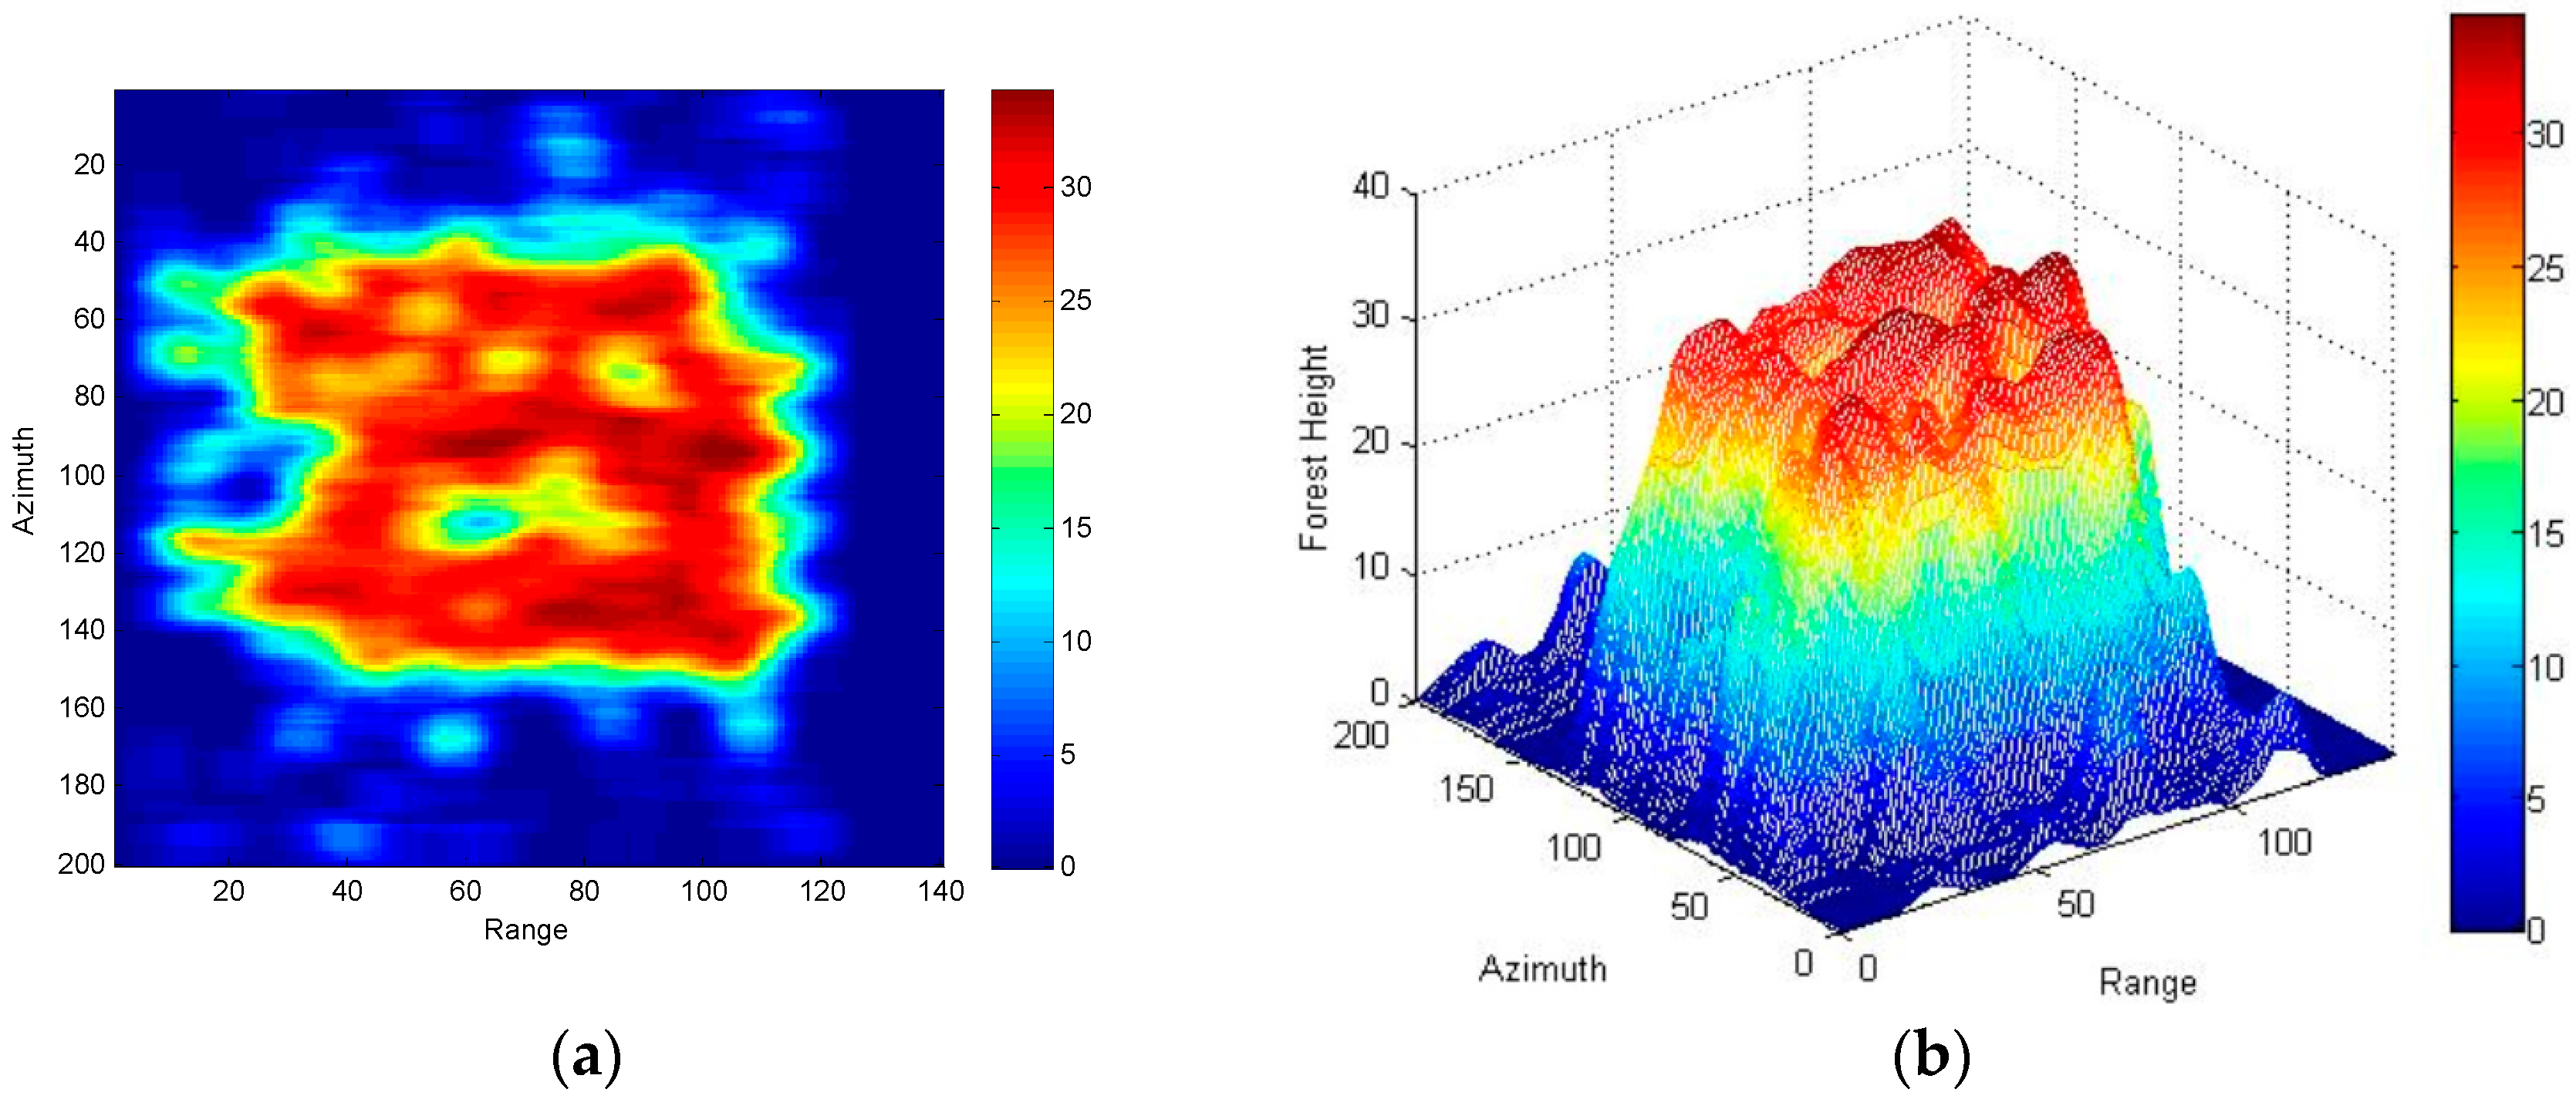
Figure 19 demonstrates the inversion results of forest height, Figure 20 and Figure 21 depicts the estimated ground phase before and after the operation of phase unwrapping. The effectiveness of the inversion results can be easily recognized through comparison.
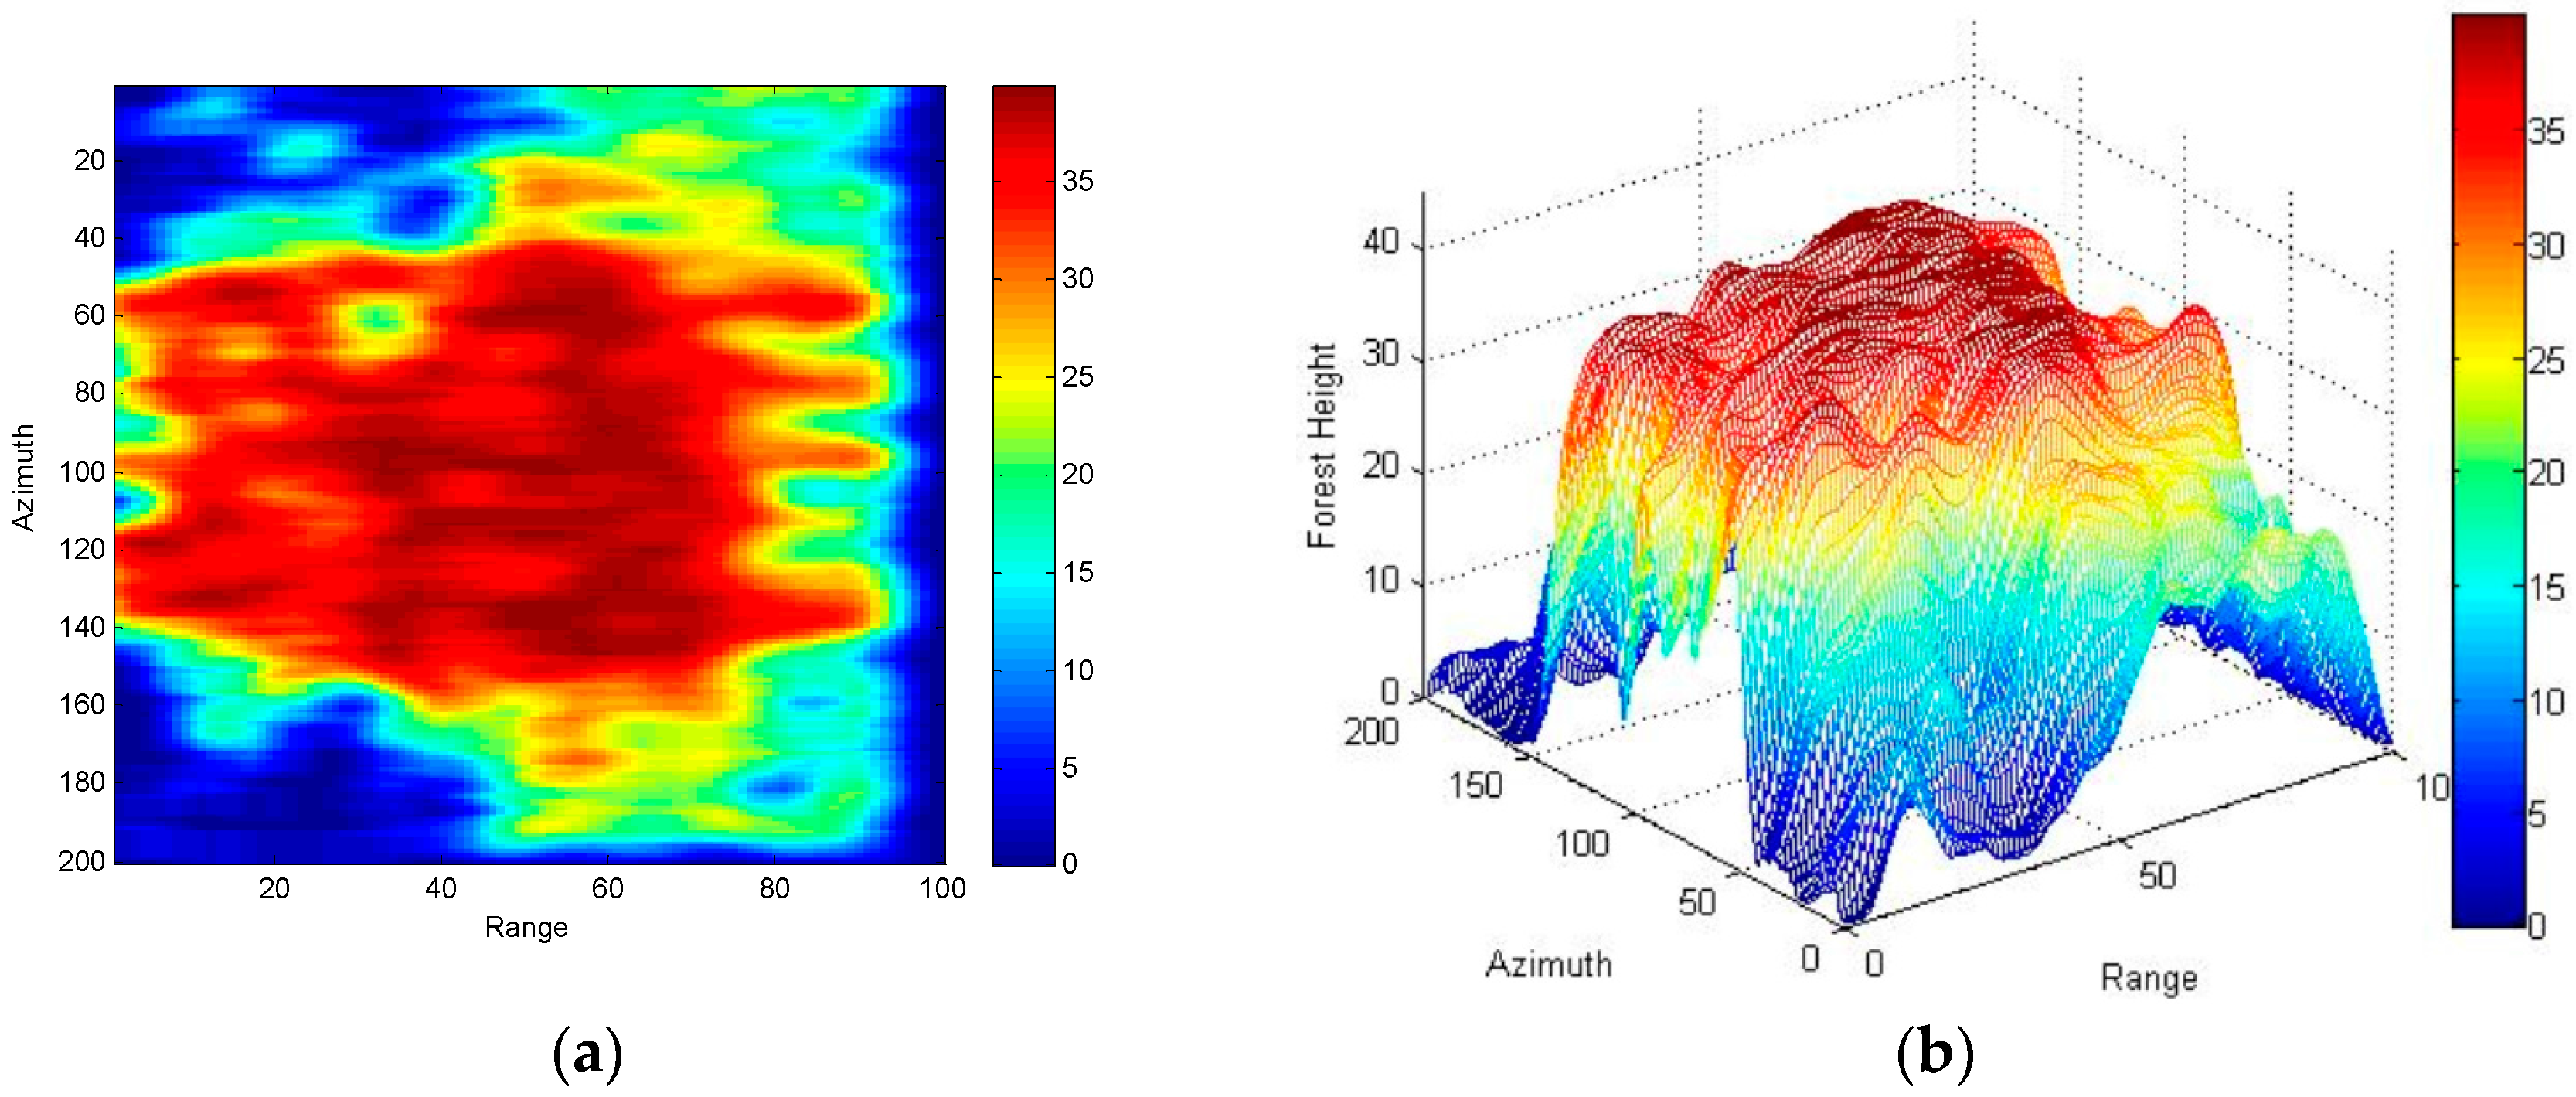
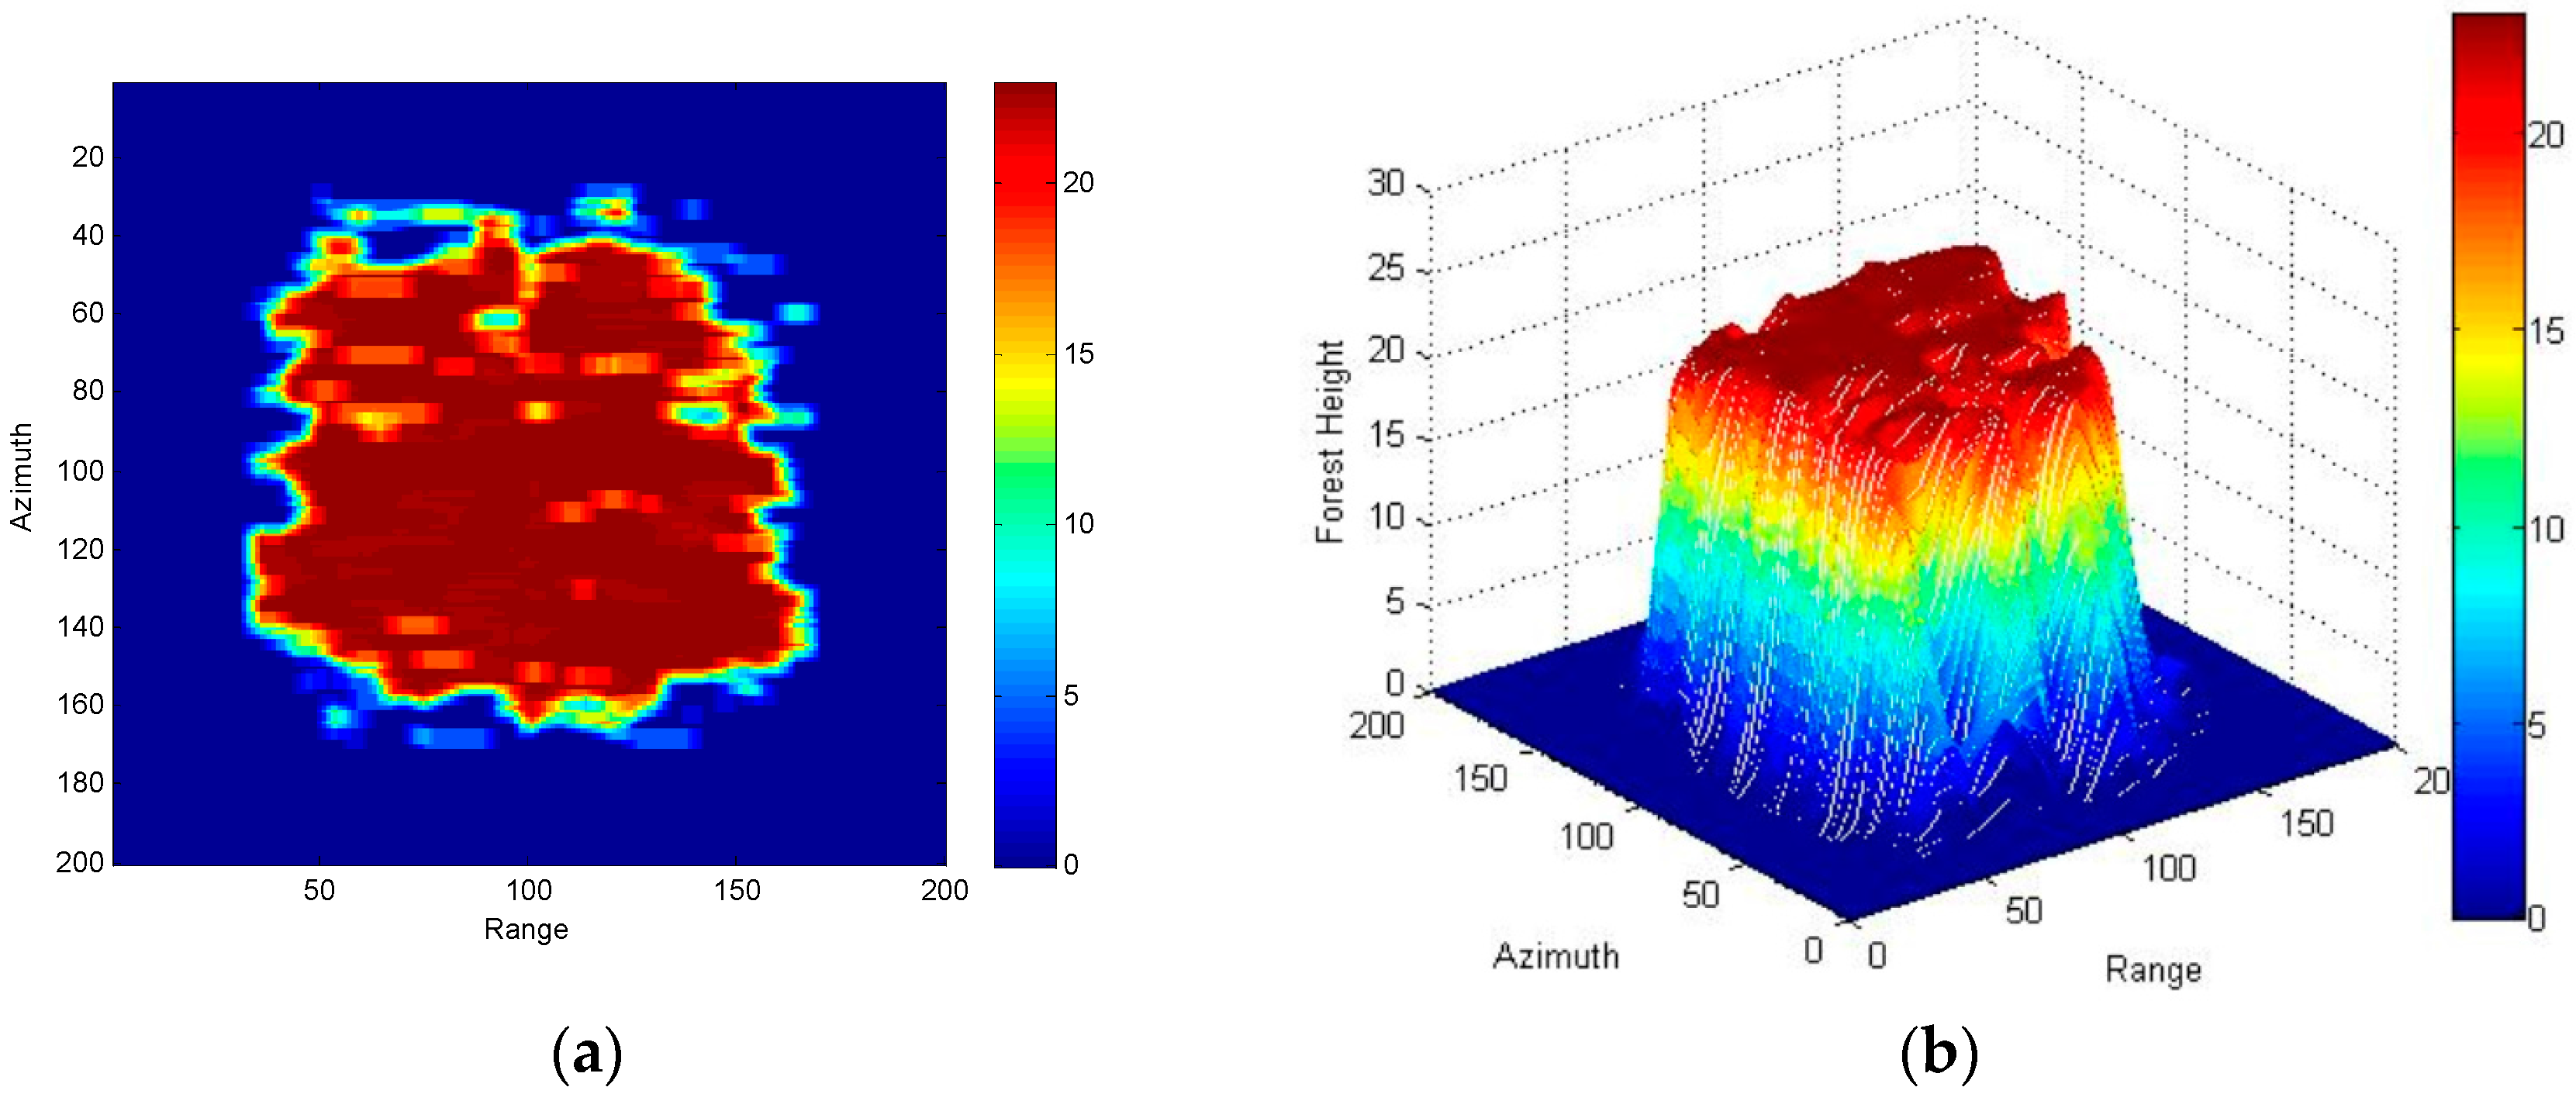
Intuitively, it can be seen from the estimated forest heights in Figure 19 that in comparison with traditional three-stage algorithm based on RVoG model, the improved algorithm can better reconstruct the basic profile of forest area. Quantitatively, in Table 6, the AVG bias, SDEV and RMSE of the estimated forest heights are respectively calculated as above to evaluate the performance of different algorithms.
Comparing with traditional estimation scheme based on RVoG model, the AVG bias, SDEV and RMSE of R-RVoG inversion are correspondingly 1.6885 m, 0.1405 m and 0.9893 m closer to the true value. Therefore, the estimated forest heights based on the modified algorithm validate the improvement of height inversion precision.
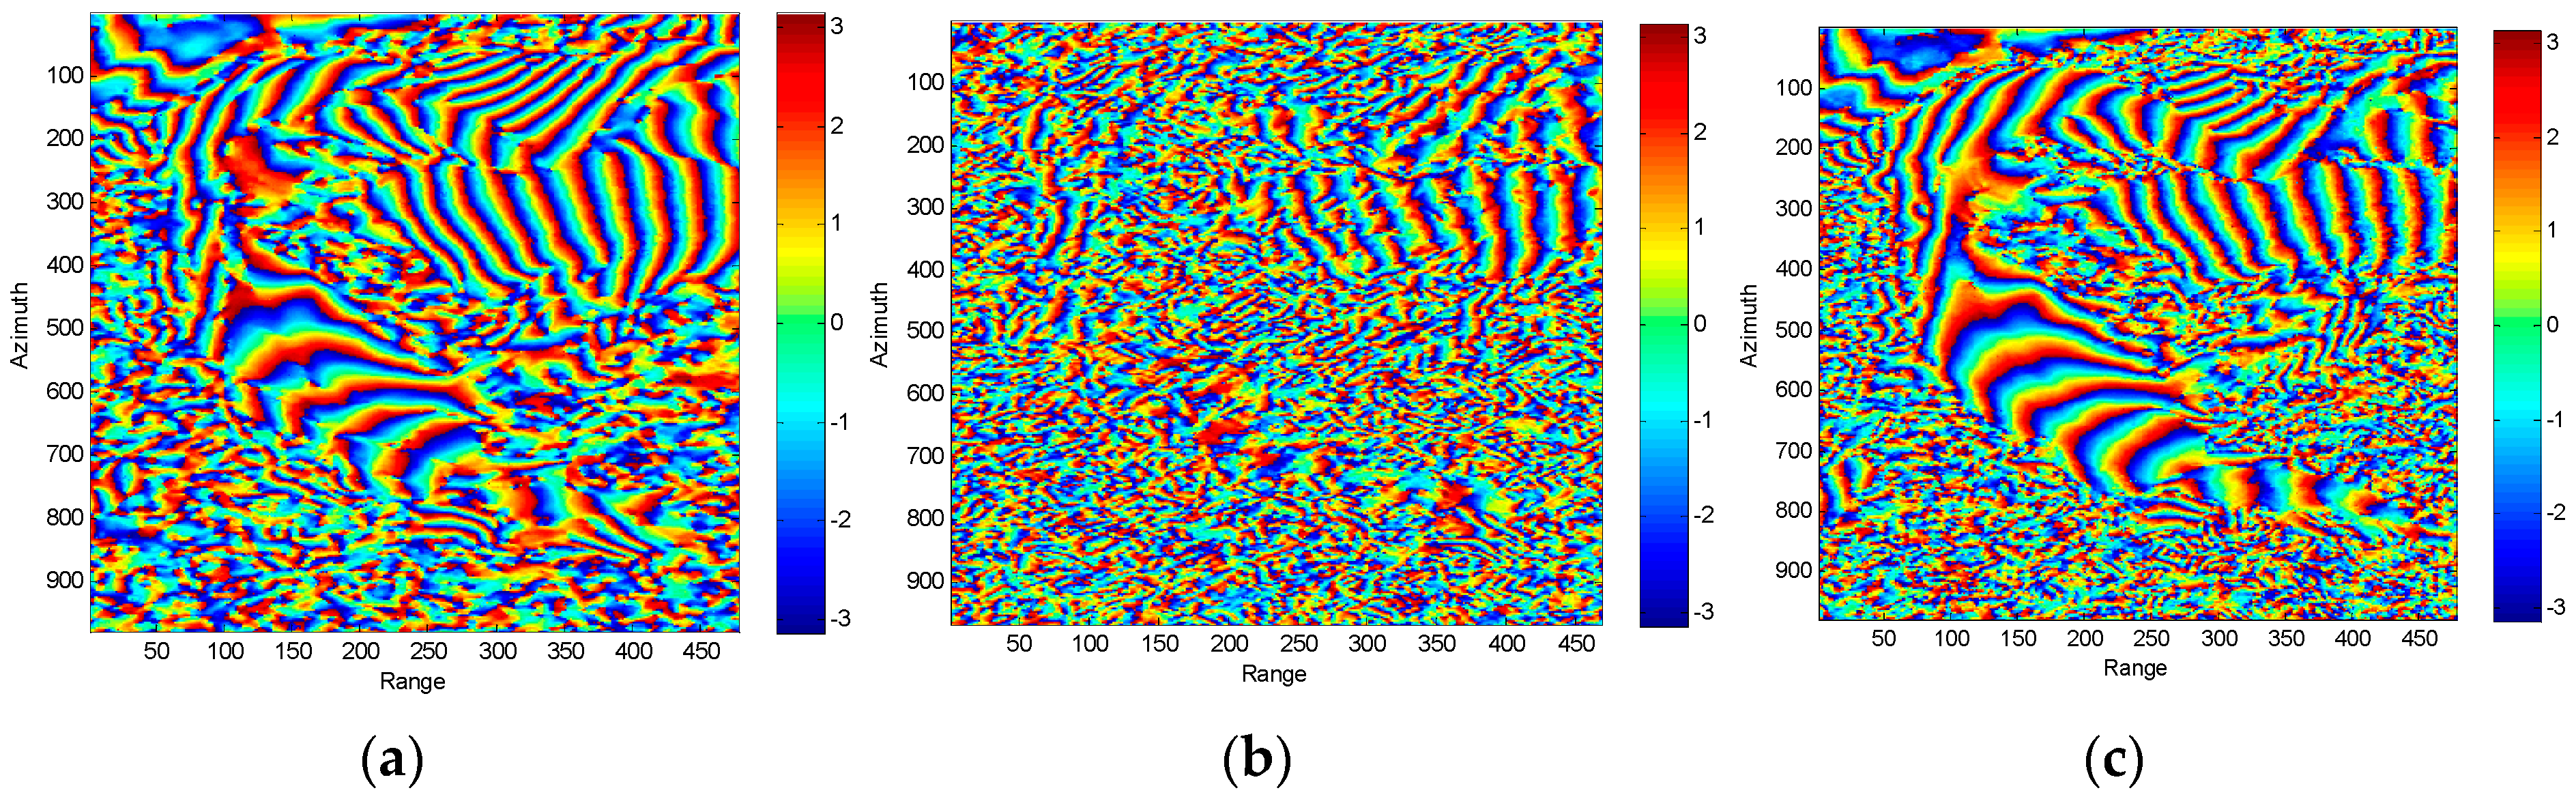
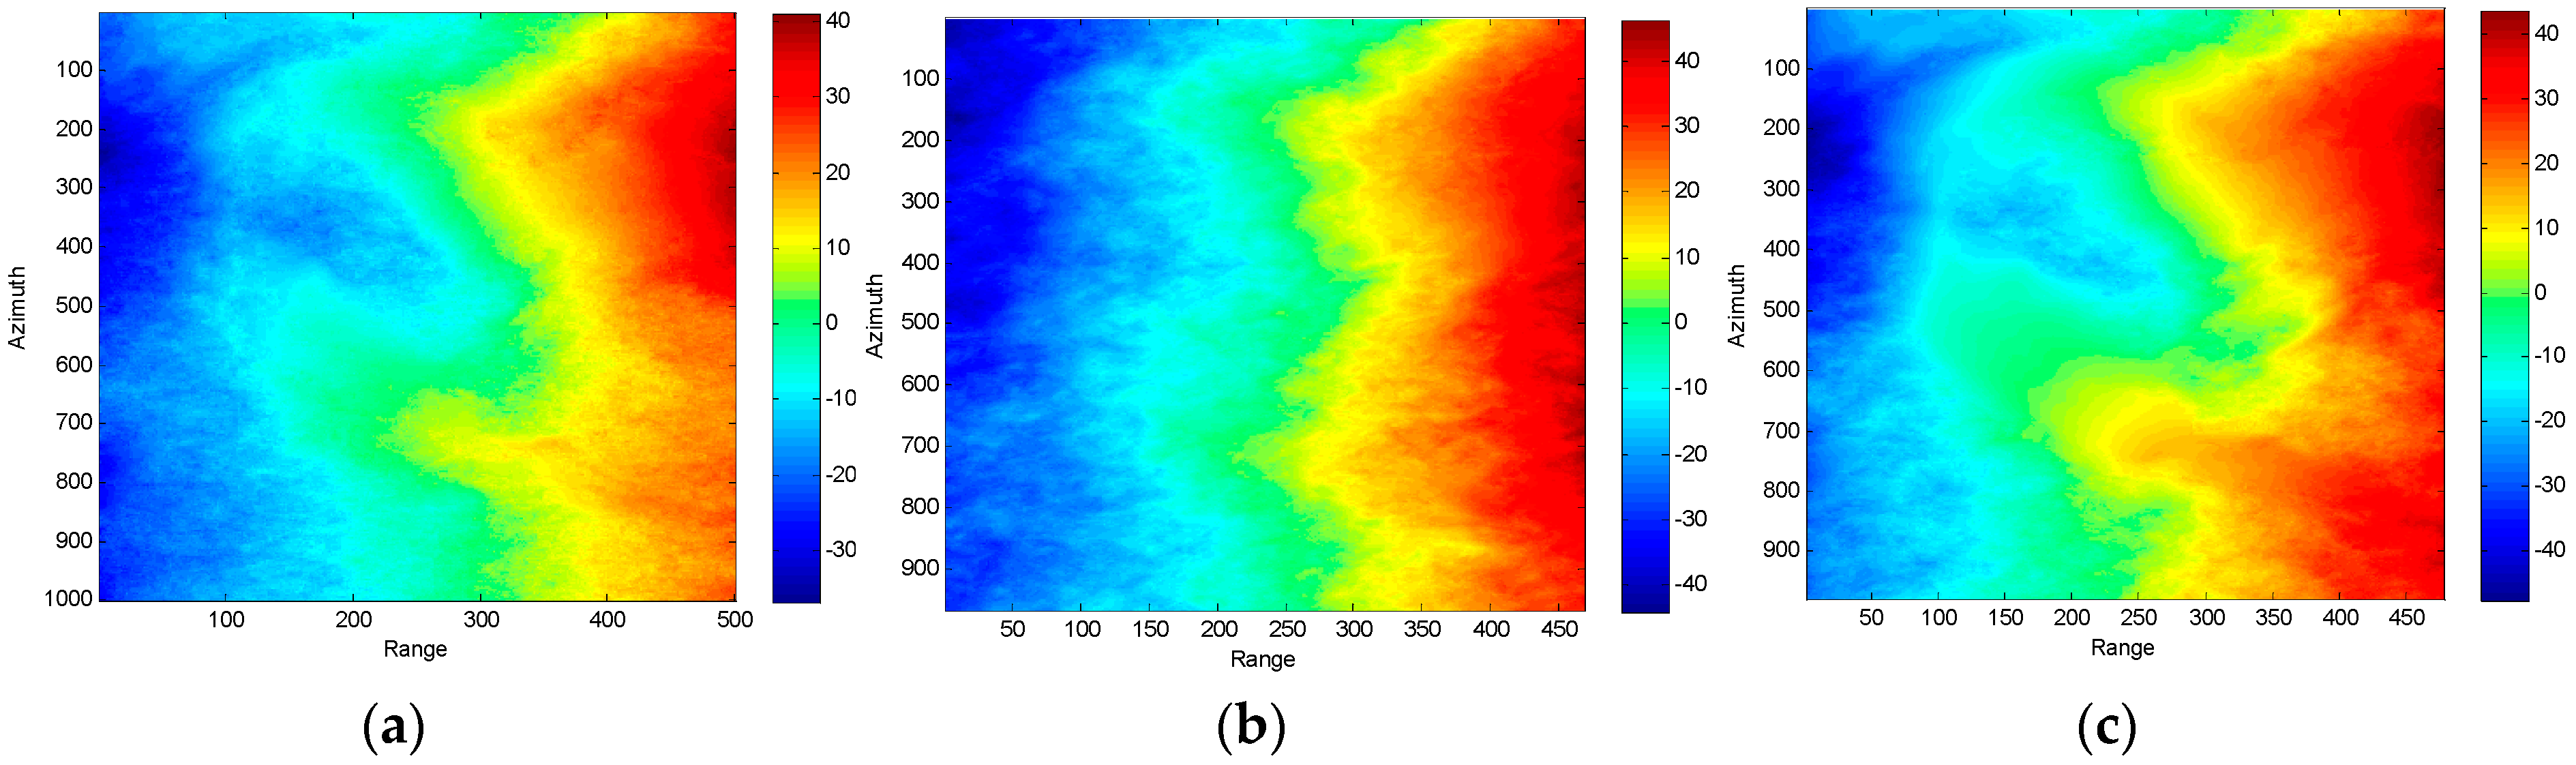
Figure 20 and Figure 21 respectively demonstrate the estimated ground phase before and after phase unwrapping. Here, Least Square Phase Unwrapping algorithm based on Discrete Cosine Transformation (DCT) is employed to accomplish the phase unwrapping operation [35].
The inversion results in Figure 20 and Figure 21 can draw to the conclusion that the modified algorithm effectively prevents the interferometric fringes of the ground phase from the destruction of range slope variation and thus provides a vital premise for the further phase unwrapping and elevation reconstruction.
Despite that the inversion precision of three-stage algorithm is enhanced with the introduction of R-RVoG model, there are still differences between the true value and the estimated result. This is mainly caused by the small error imported during the estimation of range slope and the unexecuted pre-compensation of azimuth slope. Further works will concentrate on the improvements of these two aspects.

6. Conclusions

This paper proposes a modified three-stage algorithm based on R-RVoG model to extract forest parameters from Pol-InSAR data. Similarly to traditional RVoG model, R-RVoG model is contributed by both of the volume and ground layers. Differences are that in R-RVoG model the ground component is amended as a range-sloped plane and the volume part is characterized as an inclined cloud of discrete particles. After detailed deduction, a new range slope parameter is introduced into the complex correlation of this modified model and the three-stage procedure is further rebuilt to develop the estimation operation where the SA optimization algorithm is employed to ensure the calculation efficiency and accuracy. The performance of this modified algorithm is further evaluated on both of the simulated data and SIR-C real data. Estimation results indicates that in comparison with the traditional RVoG model, the retrieved forest heights based on R-RVoG model are less affected by the range slope variation in terms of AVG bias, RMSE, and SDEV. Furthermore, from the perspective of ground phase, the reconstruction precision of underlying topography is also improved.
The modified three-stage algorithm based on R-RVoG model is quite applicable for the processing of Pol-InSAR data. However, further theoretical and experimental researches need to be conducted when both of the range and azimuth slope are under consideration so that the possibilities and limits of Pol-InSAR system can be better investigated.

Acknowledgments

This work is supported by the National Basic Research Program of China under Grant No. 2013CB733404, the Major Project of High-resolution Earth Observation System under Grant No. 12-Y20A15-9001-15/16 and the National Natural Science Foundation of China under Grant Nos. 61370017, 61225005, 61120106004.

Author Contributions

Qi Zhang conceived the idea, performed the experiments and wrote the paper; Tiandong Liu analyzed the data; Zegang Ding, Tao Zeng and Teng Long supervised the research, including the experiments and development.

Conflicts of Interest

The authors declare no conflict of interest.

References

  1. Cloude, S.R.; Papathanassiou, K.P. Polarimetric SAR interferometry. IEEE Trans. Geosci. Remote Sens. 1998, 36, 1551–1565. [Google Scholar] [CrossRef]
  2. Papathanassiou, K.P.; Cloude, S.R. Single-baseline polarimetric SAR interferometry. IEEE Trans. Geosci. Remote Sens. 2001, 39, 2352–2363. [Google Scholar] [CrossRef]
  3. Margarit, G.; Mallorqui, J.J.; Fabregas, X. Single-pass polarimetric SAR interferometry for vessel classification. IEEE Trans. Geosci. Remote Sens. 2007, 45, 3494–3502. [Google Scholar] [CrossRef]
  4. Zhang, H.; Wang, C.; Liu, Z. Polarimetric SAR interferometry for vegetable vertical structure parameters extraction. In Proceedings of the IEEE International Geoscience and Remote Sensing Symposium (IGARSS), Toronto, ON, Canada, 24–28 June 2002; pp. 2611–2613.
  5. Carlos, L.; Alberto, A. Assessment and estimation of the RVoG model in polarimetric SAR interferometry. IEEE Trans. Geosci. Remote Sens. 2014, 52, 3091–3106. [Google Scholar]
  6. Philippe, R.; Antoine, R.; Aurelien, A.; Pascale, C.D. Invariant contrast parameters of PolInSAR homogenous RVoG model. IEEE Geosci. Remote Sens. Lett. 2014, 11, 1414–1417. [Google Scholar]
  7. Carlos, L.; Alberto, A. A study of the RVoG coherent scattering model validity in PolInSAR for forests studies. In Proceedings of the IEEE International Geoscience and Remote Sensing Symposium (IGARSS), Melbourne, Australia, 21–26 July 2013; pp. 2349–2352.
  8. Bassam, E.H.; Laurent, F. Polarimetric tomography for forest parameters retrieval. In Proceedings of the IEEE International Geoscience and Remote Sensing Symposium (IGARSS), Melbourne, Australia, 21–26 July 2013; pp. 4340–4343.
  9. Gustavo, H.X.; Karlus, A. Estimating a preliminary terrain model from the X-band InSAR and the RVoG model. In Proceedings of the IEEE International Geoscience and Remote Sensing Symposium (IGARSS), Milan, Italy, 26–31 July 2015; pp. 4089–4092.
  10. Fu, W.X.; Guo, H.D.; Li, X.W.; Tian, B.S.; Sun, Z.C. Extended three-stage polarimetric SAR interferometry algorithm by dual-polarization data. IEEE Trans. Geosci. Remote Sens. 2016, 54, 2792–2802. [Google Scholar]
  11. Li, Z.; Guo, M. A new three-stage inversion procedure of forest height with the improved temporal decorrelation RVoG model. In Proceedings of the IEEE International Geoscience and Remote Sensing Symposium (IGARSS), Munich, Germany, 22–27 July 2012; pp. 5141–5144.
  12. Cloude, S.R.; Papathanassiou, K.P. Three-stage inversion process for polarimetric SAR interferometry. IEE Proc. Radar Sonar Navig. 2003, 150, 125–134. [Google Scholar] [CrossRef]
  13. Tan, L.L.; Yang, R.L. Investigation on tree height retrieval with polarimetric SAR interferometry. In Proceedings of the IEEE International Geoscience and Remote Sensing Symposium (IGARSS), Boston, MA, USA, 7–11 July 2008; pp. 546–549.
  14. Treuhaft, R.N.; Madsen, S.; Moghaddam, M.; Van Zyl, J.J. Vegetation characteristics and underlying topography from interferometric data. Radio Sci. 1996, 31, 1449–1485. [Google Scholar] [CrossRef]
  15. Lee, J.S.; Schuler, D.L.; Ainsworth, T.L.; Krogager, E.; Kasilingam, D.; Boerner, W.M. On the estimation of radar polarization orientation shifts induced by terrain slopes. IEEE Trans. Geosci. Remote Sens. 2002, 40, 30–41. [Google Scholar]
  16. Moghaddam, M. Effect of medium symmetries in limiting the number of parameters estimated with polarimetric interferometry. In Proceedings of the IEEE International Geoscience and Remote Sensing Symposium (IGARSS), Hamburg, Germany, 28 June–2 July 1999; pp. 2221–2223.
  17. Schuler, D.L.; Lee, J.S.; Kasilingam, D.; Nesti, G. Surface roughness and slope measurements using polarimetric SAR data. IEEE Trans. Geosci. Remote Sens. 2002, 40, 687–698. [Google Scholar] [CrossRef]
  18. Lu, H.; Suo, Z.; Guo, R.; Bao, Z. S-RVoG model for forest parameters inversion over underlying topography. Electron. Lett. 2013, 49, 618–620. [Google Scholar] [CrossRef]
  19. Alberga, V. Volume decorrelation effects in polarimetric SAR interferometry. IEEE Trans. Geosci. Remote Sens. 2004, 42, 2467–2478. [Google Scholar] [CrossRef]
  20. Zhou, Y.S.; Hong, W.; Cao, F. Investigation on the applications of decorrelation analysis in polarimetric SAR Interferometry. In Proceedings of the IEEE International Geoscience and Remote Sensing Symposium (IGARSS), Cape Town, South Africa, 12–17 July 2009; pp. 254–257.
  21. Irena, H.; Florian, K.; Seung-Kuk, L.; Konstantinos, P.P. Tropical-forest-parameter estimation by means of Pol-InSAR: The INDREX-II campaign. IEEE Trans. Geosci. Remote Sens. 2009, 47, 481–493. [Google Scholar]
  22. Aurelien, A.; Antoine, R.; Pascale, C.D.; Philippe, R. Vegetation height estimation precision with compact PolInSAR and homogeneous random volume over ground model. IEEE Trans. Geosci. Remote Sens. 2014, 52, 1879–1891. [Google Scholar]
  23. Florian, K.; Daniel, S.; Irena, H.; Hans, P.; Konstantinos, P.P. TanDEM-X Pol-InSAR performance for forest height estimation. IEEE Trans. Geosci. Remote Sens. 2014, 52, 6404–6422. [Google Scholar]
  24. Qing, H.X.; Jian, J.Z.; Chang, C.W.; Hai, Q.F. Boreal forest height inversion using E-SAR PolInSAR data based coherence optimization methods and three-stage algorithm. In Proceedings of the Earth Observation and Remote Sensing Applications (EORSA), Changsha, China, 11–14 June 2014; pp. 145–150.
  25. Quan, X.Y.; Zhang, Z.; Zhang, B.C.; Hong, W.; Wu, Y.R. A study of BP-camp algorithm for SAR imaging. In Proceedings of the IEEE International Geoscience and Remote Sensing Symposium (IGARSS), Milan, Italy, 26–31 July 2015; pp. 4480–4483.
  26. Maxim, N.; Laurent, F.; Andreas, R. Estimation of Forest Structure, Ground, and Canopy Layer Characteristics from Multi-Baseline Polarimetric Interferometric SAR Data. IEEE Trans. Geosci. Remote Sens. 2010, 48, 1086–1104. [Google Scholar]
  27. Michele, M.; Benjamin, B.; Gerhard, K. Decorrelation effects in bistatic TanDEM-X data. In Proceedings of the IEEE International Geoscience and Remote Sensing Symposium (IGARSS), Munich, Germany, 22–27 July 2012; pp. 5558–5561.
  28. Wang, Y.H.; Yan, W.L.; Zhang, G.S. Adaptive simulated annealing for the optimal design of electromagnetic devices. IEEE Trans. Magn. 1996, 32, 1214–1217. [Google Scholar] [CrossRef]
  29. Soo, Y.L.; Kyung, G.L. Synchronous and asynchronous parallel simulated annealing with multiple Markov chains. IEEE Trans. Parallel Distrib. Syst. 1996, 7, 993–1008. [Google Scholar]
  30. Kevin, I.S.; Richard, M.E.; Jonathan, E.F.; Chris, M.; Rashmi, M. Dominance-based multiobjective simulated annealing. IEEE Trans. Evol. Comput. 2008, 12, 323–342. [Google Scholar]
  31. Polulus of China. Available online: http://populus.forestry.gov.cn/hyzyfb.jhtml (accessed on 20 June 2016).
  32. Hensley, S.; Rosen, P.; Gurrola, E. The SRTM topographic mapping processor. In Proceedings of the IEEE International Geoscience and Remote Sensing Symposium (IGARSS), Honolulu, HI, USA, 24–28 July 2000; pp. 1168–1170.
  33. Wael, A.J.; Dana, F.; Helmut, R.; Michael, E. Surface elevation changes of glaciers derived from SRTM and TanDEM-X DEM differences. In Proceedings of the IEEE International Geoscience and Remote Sensing Symposium (IGARSS), Melbourne, Australia, 21–26 July 2013; pp. 1893–1896.
  34. Eric, P.; Laurent, F. PolSARPro V5.0: An ESA educational toolbox used for self-education in the field of PoLSAR and Pol-INSAR data analysis. In Proceedings of the IEEE International Geoscience and Remote Sensing Symposium (IGARSS), Munich, Germany, 22–27 July 2012; pp. 7737–7380.
  35. Fornaro, G.; Sansosti, E. A two-dimensional region growing least squares phase unwrapping algorithm for interferometric SAR processing. IEEE Trans. Geosci. Remote Sens. 1999, 37, 2215–2226. [Google Scholar] [CrossRef]
Figure 1. Two-layer structure of RVoG model.
Remotesensing 08 00861 g001
Figure 2. Geometric diagram of complex coherence.
Remotesensing 08 00861 g002
Figure 3. BP Imaging results of forest simulated data: (a) HH amplitude image; (b) HV amplitude image; (c) VH amplitude image; (d) VV amplitude image.
Remotesensing 08 00861 g003
Figure 4. Estimated forest height when range slope is 0°: (a) 2D demonstration of retrieved forest height; (b) 3D demonstration of retrieved forest height.
Remotesensing 08 00861 g004
Figure 5. Estimated forest height when range slope is 10°: (a) 2D demonstration of retrieved forest height; (b) 3D demonstration of retrieved forest height.
Remotesensing 08 00861 g005
Figure 6. Estimated forest height when range slope is 20°: (a) 2D demonstration of retrieved forest height; (b) 3D demonstration of retrieved forest height.
Remotesensing 08 00861 g006
Figure 7. Estimated forest height when range slope is 30°: (a) 2D demonstration of retrieved forest height; (b) 3D demonstration of retrieved forest height.
Remotesensing 08 00861 g007
Figure 8. Two-layer structure of R-RVoG model.
Remotesensing 08 00861 g008
Figure 10. The flow charts of three-stage process before and after modification: (a) RVoG model; (b) R-RVoG model.
Remotesensing 08 00861 g010
Figure 11. Estimated forest height when range slope is 0°: (a) 2D demonstration of retrieved forest height; (b) 3D demonstration of retrieved forest height.
Remotesensing 08 00861 g011
Figure 12. Estimated forest height when range slope is 10°: (a) 2D demonstration of retrieved forest height; (b) 3D demonstration of retrieved forest height.
Remotesensing 08 00861 g012
Figure 13. Estimated forest height when range slope is 20°: (a) 2D demonstration of retrieved forest height; (b) 3D demonstration of retrieved forest height.
Remotesensing 08 00861 g013
Figure 14. Estimated forest height when range slope is 30°: (a) 2D demonstration of retrieved forest height; (b) 3D demonstration of retrieved forest height.
Remotesensing 08 00861 g014
Figure 15. Height estimation biases of RVoG and R-RVoG inversions: (a) Forest height bias; (b) RMSE.
Remotesensing 08 00861 g015
Figure 16. Estimated underlying topography: (a) Range slope of 0°; (b) Range slope of 10°; (c) Range slope of 20°; (d) Range slope of 30°.
Remotesensing 08 00861 g016
Figure 17. Forest species in test area: (a) Location of Tianshan test area from Google Earth database (image © 2016 DigitalGlobe); (b) Distribution of Populus diversifolia in China.
Remotesensing 08 00861 g017
Figure 18. Fully polarimetric SAR images of Space-borne Imaging Radar-C (SIR-C) real data: (a) HH amplitude image; (b) HV amplitude image; (c) VH amplitude image; (d) VV amplitude image.
Remotesensing 08 00861 g018
Figure 19. Estimated forest height of SIR-C real data: (a) True value; (b) Traditional RVOG model; (c) R-RVOG model.
Remotesensing 08 00861 g019
Figure 20. Estimated ground phase of SIR-C real data (before phase unwrapping): (a) True value; (b) Traditional RVoG model; (c) R-RVoG model.
Remotesensing 08 00861 g020
Figure 21. Estimated ground phase of SIR-C real data (after phase unwrapping): (a) True value; (b) Traditional RVoG model; (c) R-RVoG model.
Remotesensing 08 00861 g021
Table 1. Simulation parameters.
Satellite OrbitScene
Semi-major Axis6871 kmRange Slope0°/10°/20°/30°
Angle of Inclination97.42°Azimuth Slope
Eccentricity0.0011Size of Scene200 m × 200 m
Argument of Perigee90°Size of Forest100 m × 100 m
Right Ascension of Ascending Node (RAAN)180°Average Height20 m
Baseline Length800 mStandard Deviation0 m
Table 2. Analysis of inversed forest heights.
Range SlopeAVGAVG BiasSDEVRMSE
21.4928 m1.4928 m3.7126 m4.0015 m
10°24.6080 m4.6080 m5.3019 m7.0245 m
20°26.0583 m6.0583 m6.3778 m8.7965 m
30°29.6715 m9.6715 m8.3581 m12.7826 m
Table 3. Analysis of inversed forest heights.
Range SlopeAVGAVG BiasSDEVRMSE
21.2126 m1.2126 m2.7657 m3.0198 m
10°22.3838 m2.3838 m2.9972 m3.8295 m
20°22.7107 m2.7107 m3.1673 m4.1689 m
30°22.8127 m2.8127 m3.3546 m4.3777 m
Table 4. Analysis of estimated range slopes.
Range SlopeEstimated Range SlopeAbsolute Biases
2.2341°2.2341°
10°12.2707°2.2707°
20°22.4373°2.4373°
30°32.9703°2.9703°
Table 5. Sensor parameters.
SensorScene
Semi-major Axis6583 kmCentral Longtitude79.4871979°
Angle of Inclination57°Central Latitude37.0295486°
Eccentricity0.00168Size of Scene18.79 km × 3.735 km
Wavelength0.24 mRange Resolution18.79 m
Incident Angle24.373°Azimuth Resolution7.47 m
Table 6. Analysis of inversed forest heights.
ModelAVGAVG BiasSDEVRMSE
True Value19.3987 m0 m2.5564 m0 m
RVoG23.2689 m3.8702 m2.0548 m8.2556 m
R-RVoG21.5804 m2.1817 m2.1953 m7.2663 m

