1. Introduction
Aerosol optical depth (AOD) is ‘the single most comprehensive variable to remotely assess the aerosol burden in the atmosphere’ [
1]. It is used to characterize ambient aerosols, either for land-based remote sensing applications where it is used to remove atmospheric influences, or directly, to assess atmospheric pollution, primarily fine particulate matter, and its impacts on the climate, ecosystems, and human populations. Exposure to fine particulate matter (PM
2.5, airborne particles with an aerodynamic diameter of 2.5 micrometers or less) was identified as a leading risk factor for global disease burden with an estimated 2.9 million attributable deaths in the year 2013 [
2]. Historically, the estimation of population exposure to PM
2.5 depends on filter-based ground monitors. However, because of its high operation and maintenance costs, these ground-based monitoring networks do not achieve comprehensive spatial coverage. With its comprehensive spatial coverage, spatial models driven by MODIS AOD are able to estimate the PM
2.5 exposure levels in many parts of the world where ground observations are sparse or nonexistent [
3]. The MODerate Resolution Imaging Spectroradiometer (MODIS) instruments on board the Aqua and Terra satellite platforms have been providing daily, near-global satellite coverage since 2000 and 2002, respectively [
4]. MODIS-retrieved aerosol optical depth (AOD) has been used extensively in estimating ground-level fine particulate matter (PM
2.5) concentrations [
5]. Over the past decade, various MODIS-driven PM
2.5 exposure models have been developed, from relatively simple linear regressions [
6] to complex multi-level spatial models [
7] and Bayesian hierarchical models [
8]. Because PM
2.5 is linked to adverse health outcomes even at the low concentrations commonly observed in the cities of North America [
9], PM
2.5 models based on MODIS retrievals have been used to extend ground air quality monitoring networks to cover the suburban and rural populations in the U.S. [
10] and Canada [
11].
Accuracy and coverage are the most important factors affecting the application of satellite AOD in air quality research. The retrieval error in AOD has a major influence in the PM
2.5 prediction error, as AOD is often used as the primary predictor in various PM
2.5 exposure models. If the AOD retrieval error varies by season or with land use types, the PM
2.5 prediction error will also display spatiotemporal patterns. This is especially true at the low AOD levels, typically below 0.2, commonly observed in developed countries [
12]. On the one hand, availability of AOD data coverage determines whether satellite-driven models are feasible for a given study region. On the other hand, it plays an important role in determining the design of PM
2.5 health effect studies [
13]. For example, the health effect of short-term PM
2.5 exposure such as asthma exacerbation is often evaluated in a time series model where temporal missingness of exposure estimates can substantially limit model performance [
10]. Cohort studies designed for associating long-term PM
2.5 exposure with cardiovascular morbidity and mortality would benefit from complete spatial coverage [
14].
The most recent MODIS collection 6 (C6) aerosol products include enhanced Dark-Target (10 km DT) and Deep-Blue (10 km DB) AOD present in collection 5 (C5), a ‘merged’ DB-DT parameter (10 km DB-DT) and a 3 km AOD based off of the 10 km DT retrieval algorithm (3 km DT) [
15,
16]. The MODIS science team has conducted a few global validation studies to document the collective impact of these changes and differences between the various parameters [
12,
16,
17,
18]. These studies mainly focused on estimating the AOD retrieval errors by comparing with collocated measurements from the Aerosol Robotic Network (AERONET) at the global scale. Because of the large spatial differences in aerosol loading, global performance metrics such as regression slopes and correlation coefficients are often driven by regions of high AOD values. To date, only a handful of evaluation studies were reported in North America, none of which had both accuracy and coverage as their primary research objectives [
19,
20]. Therefore, there remains a need for detailed validation studies in dominantly low-AOD regions to investigate issues related to surface reflectance treatment and extreme events [
12]. In addition, the accuracy and potential usability of lower quality retrievals needs to be better characterized, and could have important implications on the coverage issue in air quality applications of MODIS data.
In the current analysis, we focused on characterizing the accuracy and coverage of various MODIS AOD parameters in the continental US, a dominantly low-AOD area. We focused on examining the degree to which changes in surface properties and retrieval conditions, such as viewing angle and land use, affect AOD retrieval error. In addition to the highest quality AOD data, we evaluate the impact of including lower quality AOD values on the spatial and temporal coverage statistics. Additionally, we use a case study to demonstrate the practical implications of including lower-quality retrievals and accounting for major sources of bias on the ability of each AOD parameter to accurately estimate ground-level PM2.5 concentrations. Finally, we summarize the strengths and weaknesses of these AOD parameters in the context of air quality research.
2. Materials and Methods
2.1. Satellite and Ground Datasets
We collected Aqua MODIS level 2 AOD data [
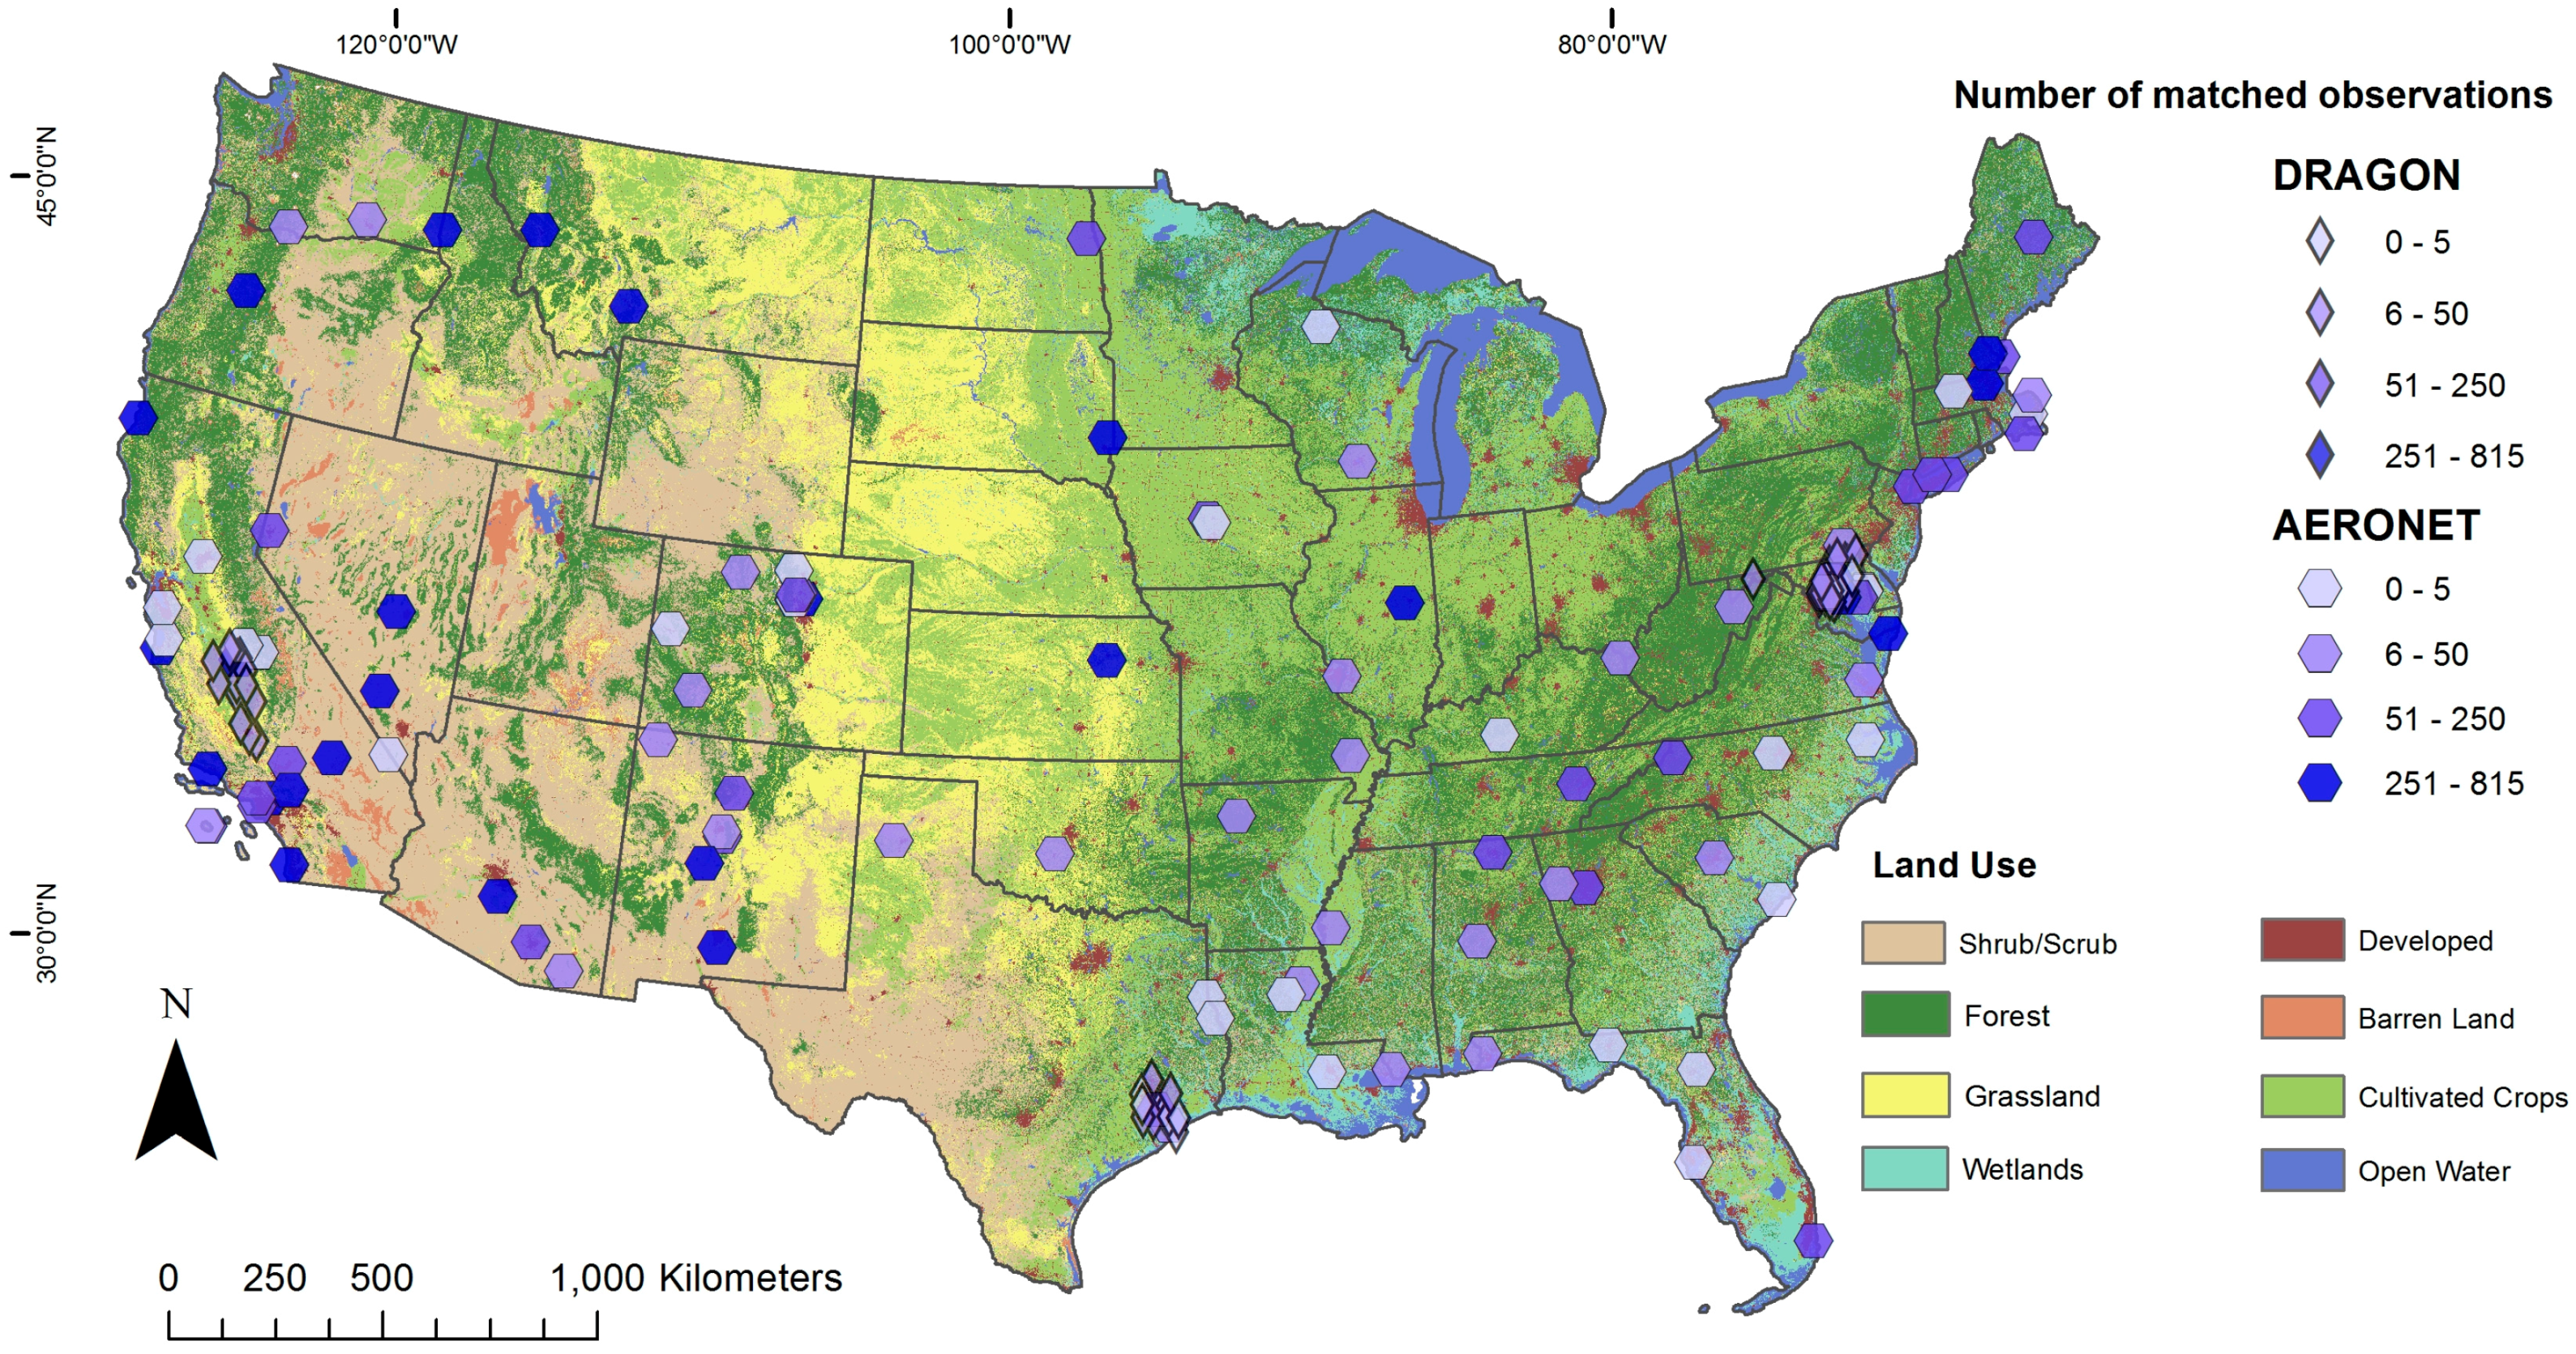
21] between 1 January 2004 and 31 December 2013 in the Continental US. Level 2 cloud-screened and quality assured AOD retrievals from 120 permanent AERONET stations and 73 temporary stations from the Distributed Regional Aerosol Gridded Observation Networks (DRAGON) were collected to validate MODIS retrievals. Out of the 120 permanent AERONET stations, 48% had been in operation for less than one year (
Figure 1). Total column precipitable water estimates were also collected from these stations to evaluate their impact on MODIS AOD retrieval error. Since AERONET does not directly measure AOD at the 0.55 µm wavelength reported by MODIS, values were interpolated to this wavelength with a quadratic fit in log-log space based on valid AOD values at a minimum of 4 of any of the 15 wavelengths potentially reported by AERONET [
22]. Ancillary datasets were collected for identifying surface properties and retrieval conditions that could have affected MODIS retrieval accuracy. The MODIS 16-day gridded NDVI parameter at 1 km spatial resolution [
23] was used to calculate NDVI values at individual MODIS level 2 AOD pixels. The National Land Cover Database (NLCD) with a 30 m spatial resolution was used for land cover type calculation at individual MODIS level 2 AOD pixels [
24]. The 2006 NLCD was used for collocations occurring prior to 2009 and the 2011 NLCD was used for collocations occurring after 2009. Information on scattering, viewing, and solar angles for each AOD retrieval was obtained for each MODIS pixel from the MODIS AQUA level 2 Aerosol product [
21].
2.2. Coverage
Since MODIS pixels are created relative to each satellite view and the MODIS instrument exhibits a fish-eye effect, the size and location of individual pixels is not constant from one day to the next. To compensate for this, a 12 km grid commonly used in the Community Multi-scale Air Quality (CMAQ) modeling system was created for our coverage calculation (a total of 55,031 cells). The grid size roughly corresponds to the nadir resolution of the MODIS 10 km AOD parameters and represents an important application of the MODIS data, where AOD observations are assimilated into air quality models to improve model performance [
25]. MODIS pixels were determined to be within a grid cell if, for the 10 km DT, 10 km DB, and 10 km DB-DT AOD, the polygon representing the pixel area, reconstructed from the pixel centroids using a Voronoi tessellation algorithm [
26], lay at least partially within the grid cell. Pixels from the 3 km DT parameter were determined to be within a grid cell if the centroid of the 3 km pixel fell within the grid cell, allowing the increased resolution of the 3 km DT parameter relative to the grid to compensate for the lack of smoothing between cells that the Voronoi tessellation would have provided. The percentage of days with a valid, QAC 3 retrieval were calculated for each grid cell and parameter. Results were interpreted relative to averages over the continental U.S. (CONUS) for each parameter. Coverage statistics were also calculated for QAC 1, 2, and 3 retrievals together to provide an accounting of the gains in coverage by including lower confidence retrievals in an analysis.
2.3. Accuracy
AERONET observations were collocated with each MODIS AOD parameter respectively, so that a temporal average of AERONET observations within ±30 min of the MODIS pass was compared to the spatial average of MODIS pixels within a ~25 km radius for the 10 km DT, DB and DB-DT AOD, and a ~7.5 km radius for the 3 km DT AOD [
17]. Following previous work, a collocation was only considered valid if a minimum of three MODIS pixels, two AERONET measurements, and at least 20% of the total number of MODIS pixels included in the 25/7.5 km radius had valid values with a QAC code of 3 assigned to the pixel [
27]. AERONET stations were categorized as either being in the East or the West, using the 100° W longitude line [
16]. The east/west division was necessary because previous work had found large differences in MODIS performance between the two regions [
25]. Retrieval error, or the difference between MODIS and AERONET AOD at each collocation (τ
M − τ
A) and the percentage of MODIS observations within the 10 km DT expected error envelope (EE
DT)—defined as ±(0.05 + 0.15)τ—[
16] were calculated and linear regression models were used to quantify retrieval errors. In order to evaluate the QAC code assignments as indicators of retrieval errors, independent collocations were created for QAC 1 and QAC 2 retrievals with AERONET, using the same criteria as for the QAC 3 collocations. Finally, for each AOD parameter, retrieval error in MODIS AOD relative to AERONET was examined within quintiles of the surface and retrieval parameters. These parameters include median NDVI, total column precipitable water from AERONET, land-cover type mode, mean solar zenith, sensor zenith, and scattering angles. Linear regression models were used to identify any significant linear trends in retrieval error for each surface and retrieval parameter.
3. Results
During our study period, 193 ground stations reported a total of 286,055 observations that could be interpolated to AOD at 550 nm. Of these, 262,491 originated from a permanent AERONET station and 23,564 were recorded during a DRAGON campaign. In the Eastern US, the number of valid collocations at the 127 stations with high confidence MODIS retrievals ranges from 5616 for 3 km DT to 6617 for 10 km DB observations. AERONET AOD ranged from 0.0005 to 1.26, with mean values of 0.12, 0.12, 0.12, and 0.10 for collocations with the high confidence 3 km DT, 10 km DT, 10 km DB-DT and 10 km DB parameters, respectively. MODIS AOD ranged from −0.05 to 2.77, with mean values of 0.13, 0.13, 0.13, and 0.11 for these four AOD parameters, respectively. In the Western US, the number of valid collocations at 66 AERONET stations with high confidence MODIS retrievals ranges from 6251 for 3 km DT to 11,590 for 10 km DB-DT AOD. AERONET AOD values ranged from 0.0003 to 1.43, with mean values of 0.09, 0.09, 0.08, and 0.08 for collocations with the high confidence 3 km DT, 10 km DT, 10 km DB-DT, and 10 km DB parameters, respectively. MODIS AOD values ranged from −0.05 to 2.35, with mean values of 0.09, 0.12, 0.10, and 0.08 for these parameters, respectively. In both regions, and for all four products, the majority of collocations occurred in the fall and summer, while the fewest occurred in winter months.
3.1. Coverage of High-Confidence Retrievals
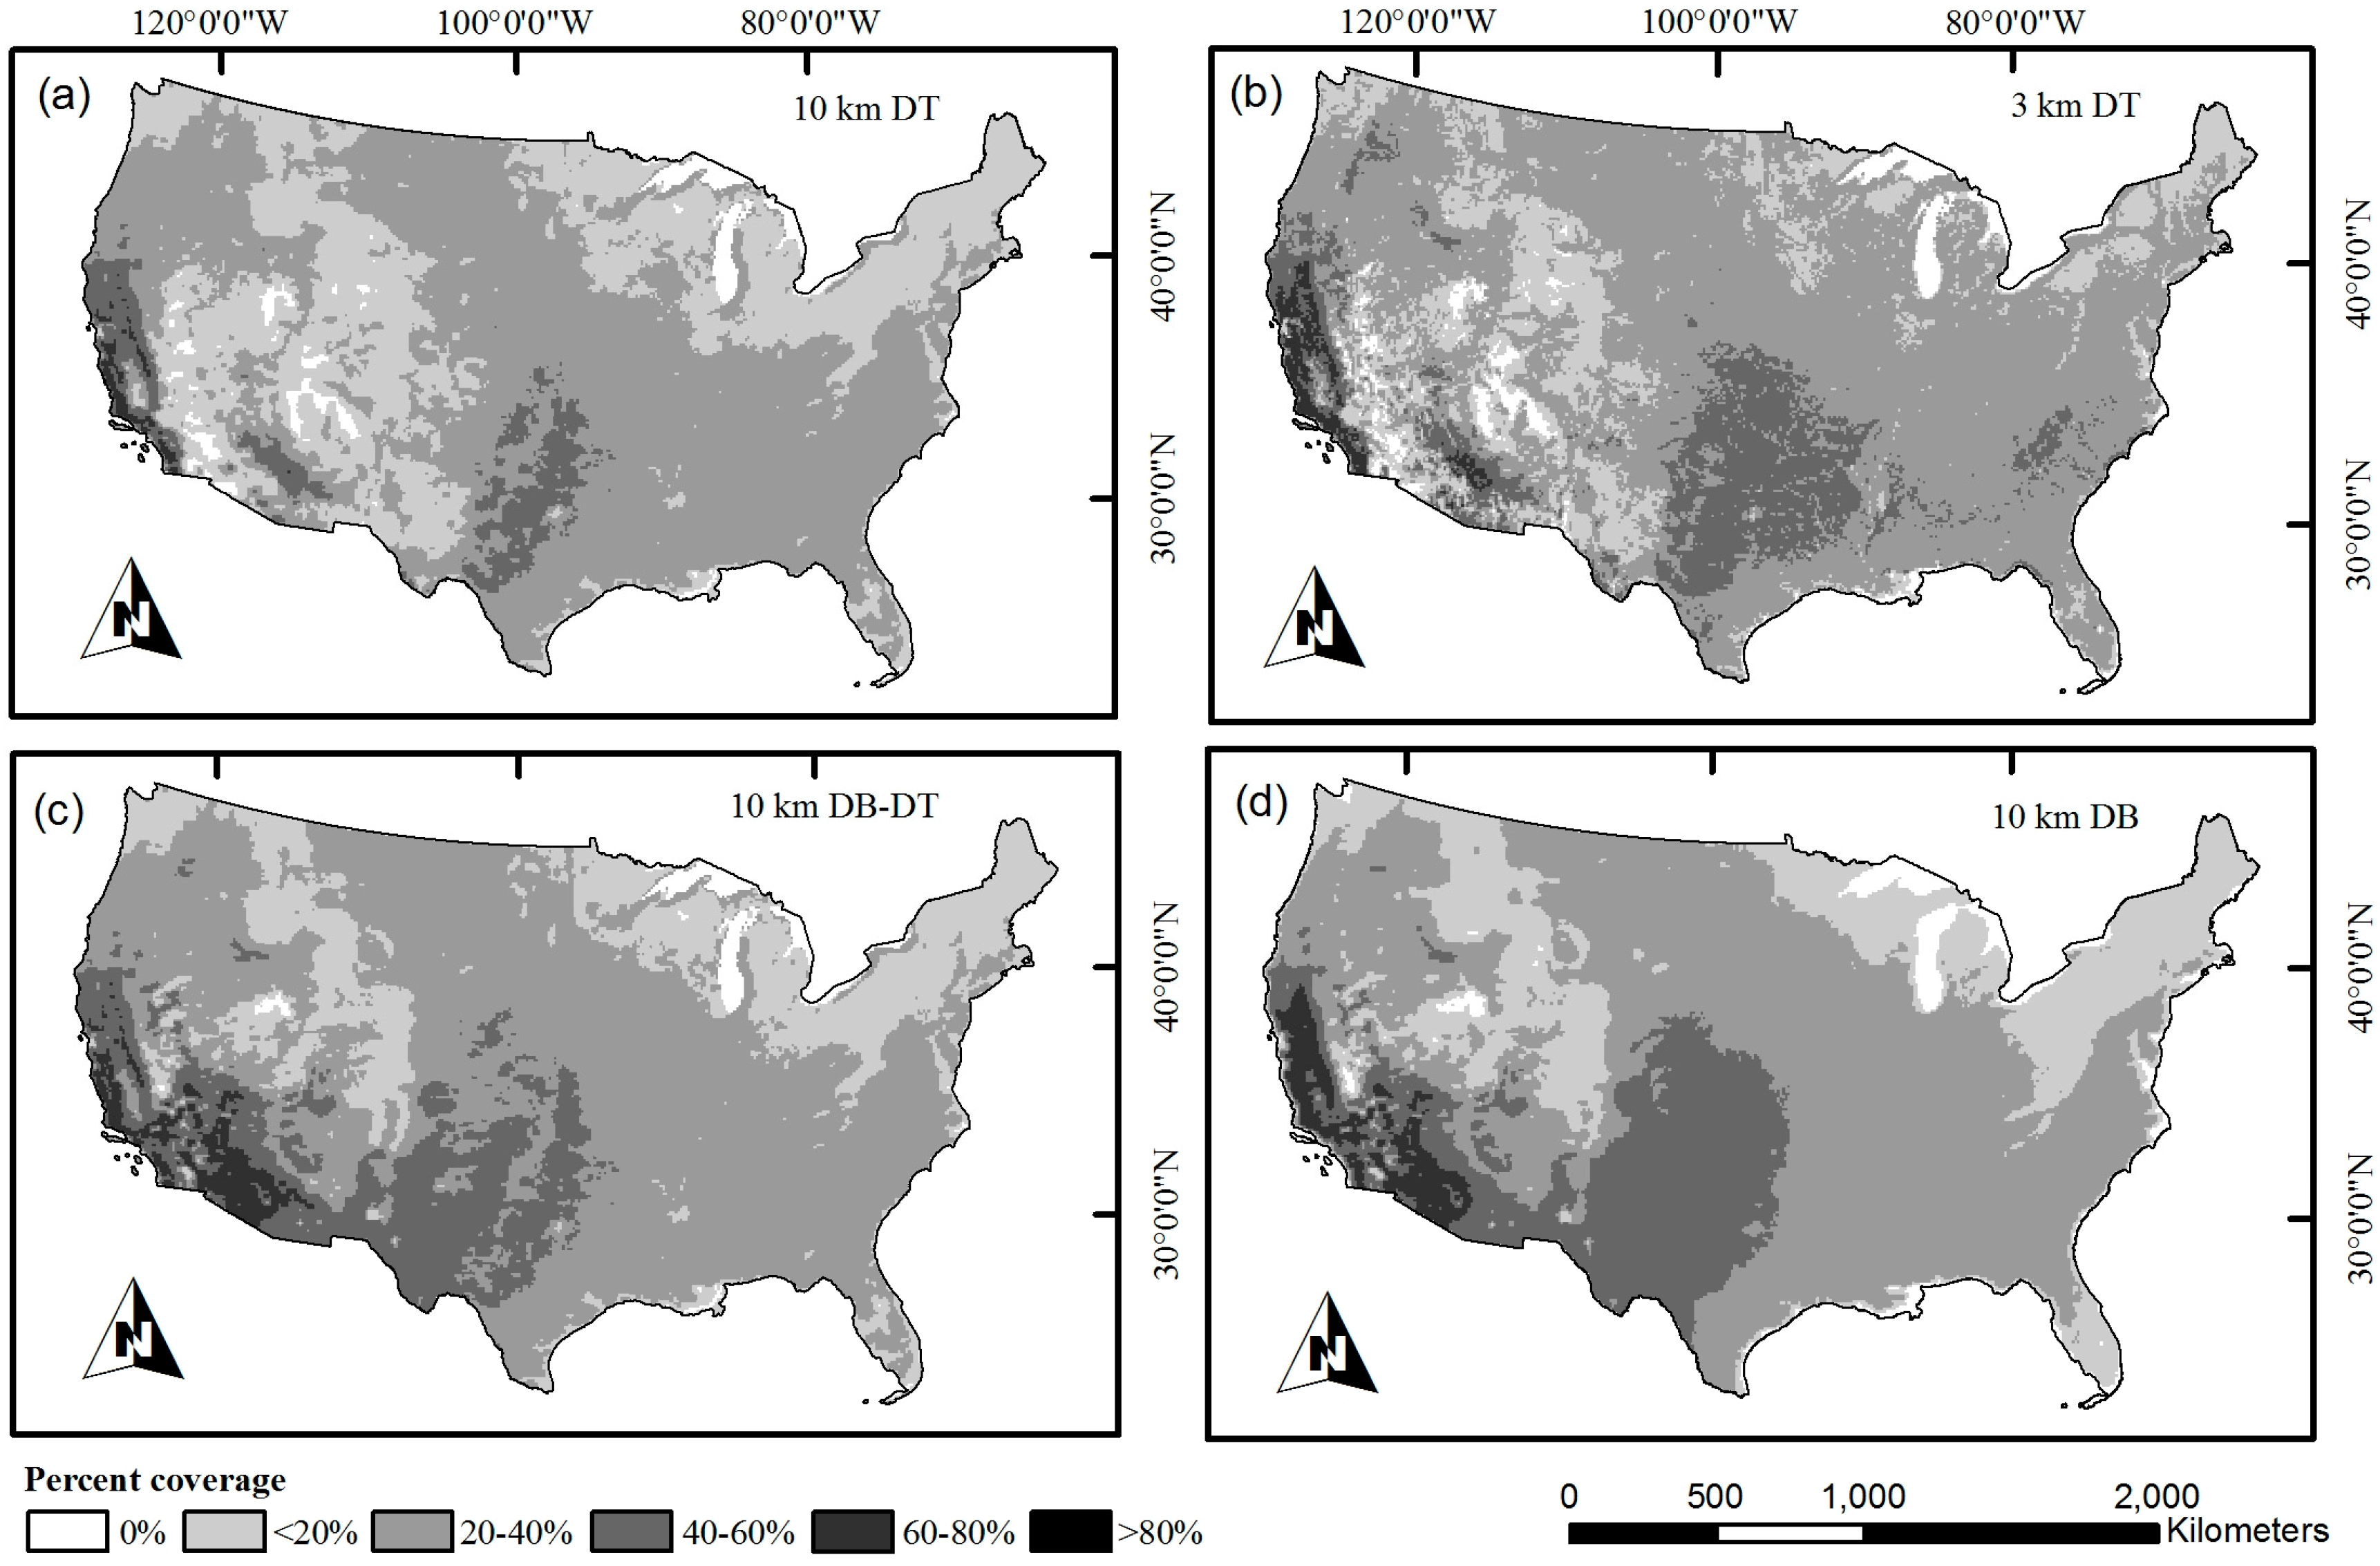
Table 1 shows that on average, a valid AOD retrieval was available on 25%–30% of days in any given grid cell. However, there is considerable spatial heterogeneity in coverage rates for each parameter (
Figure 1). The highest rates of coverage are found on the western coast, near the large cities of Los Angeles and San Francisco, and in California’s central valley. In these areas, all four AOD parameters achieve coverage rates of over 55%, and in the area right around Los Angeles, coverage rates are above 70%. Similarly high coverage rates, between 50% and 60%, are also observed over the national forests north of Phoenix in Arizona and rates of 40%–50% are observed over the south-central plains covering the areas of central Texas, Oklahoma, and Kansas. A north-to-south and elevation gradient in coverage rates can also be observed in
Figure 2. The lowest coverage rates were observed over the Great Salt Lake desert, where a few locations had no valid retrieval. Outside of the Rockies, average coverage rates in the northern parts of the CONUS—an area that includes the large cities of Chicago and New York—were typically only 10%–20%. Coverage rates further south were 30%–40%, slightly higher than the CONUS-wide average. This north-south and elevation-based gradient in coverage rates can be linked to seasonal snow-cover occurring primarily at higher latitudes and elevations.
The 3 km DT AOD, with a CONUS-wide coverage rate of 28.2%, is comparable to the 10 km AOD parameters in terms of coverage. In contrast to the 10 km products, the 3 km DT AOD excels over areas where the surface is more complex but not arid, such as the Pacific Northwest, and over the Carolinas. It achieves slightly higher coverage rates on the eastern coast than the 10 km parameters, and retrieves at higher rates at high to moderate latitudes and elevations than the 10 km AOD parameters (
Figure 2a). The most likely explanation for these higher coverage rates at higher elevations and latitudes would be an increased ability, on the part of the higher resolution parameter, to retrieve aerosols over patchy snow-cover. However, while it has been previously noted that the higher resolution parameter is able to retrieve aerosol information at higher rates over complex landscapes, coastlines, and between clouds, the extension of this ability to complex snow-cover has not been investigated [
17,
19]. The 10 km merged AOD has the highest overall coverage, averaging 29.7% for the CONUS. This parameter aims to maximize the number of high-confidence AOD retrievals by using AOD values from the 10 km DT algorithm over locations where the NDVI is higher and to use 10 km DB AOD values over locations where NDVI is lower and the 10 km DT algorithm is less likely to accurately retrieve AOD. The result is that the spatial patterns of coverage for the merged AOD are similar to 10 km DT AOD, but without the gaps in coverage over the arid southwest. The coverage of 10 km DB AOD along the east coast is lower than the other three AOD parameters especially in the summer months (see
Supplementary Figure S1) and over Florida, and balances out the additional coverage gained in the west and south-central plains (
Figure 2). The reasons for this are currently unknown, but slight differences exist between the DT and DB retrieval processes in the tests used to identify cloud-cover and distinguish it from aerosols and this could explain summertime differences in coverage over the highly vegetated Eastern CONUS [
15,
16].
3.2. Coverage Gains with Lower-Quality Retrievals
When lower-quality retrievals were included, coverage rates increased for all AOD parameters. However, there were large differences in relative increases between products, reflective of differences in QAC code assignments among AOD parameters. On the one hand, coverage rates for the 3 km DT AOD increased only slightly from 28.2% to 28.9%, similar to that observed for the 10 km DB-DT AOD. Coverage rates for the 10 km DT parameter increased substantially from 24.3% to 32.8%. On the other hand, coverage of the 10 km DB AOD increased dramatically from 28.9% to 49.6% when lower-confidence retrievals were included. Of the four AOD parameters, the 10 km merged AOD provides the highest overall coverage over the CONUS if only high-confidence retrievals are considered. Coverage patterns are similar to those observed for high confidence observations (
Supplementary Figure S2). Previous studies have examined how AOD missingness impacts the representativeness of the sample within the CONUS, with mixed results [
28,
29]. For some applications, the typical coverage rates from high quality retrievals of ~30% may be too low to preserve study power, and investigators may seek to boost coverage rates through the use of noisier, lower-confidence observations. In this instance, the 10 km DB AOD offers the greatest potential gains in coverage.
3.3. Accuracy of High-Confidence Retrievals
Error statistics for all four AOD parameters, broken down by region, are presented in
Table 2. In the eastern region, 76% of QAC 3 3 km DT AOD retrievals were within pre-launch expectations with a mean retrieval error of 0.01, and the correlation coefficient between AERONET and MODIS values was 0.89. However, the slope of a regression line fit between the two was 1.24, indicating over-prediction. In the western region, 49% of 3 km DT observations were within the EE and the slope of a line relating AERONET AOD values to MODIS observations was 1.41. The QAC 3 10 km DT AOD retrievals in the East had a slightly positive, but near 0 retrieval error, and its correlation coefficient with AERONET observations (0.92) was the highest of the four parameters. Over-prediction was a problem in the western region, but was more problematic at low AOD levels. The performance of the 10 km DB-DT AOD across accuracy metrics was nearly identical to the 10 km DT AOD in the Eastern US, but it had an additional 341 QAC 3 collocations. In the western region, it was the most highly correlated with AERONET (0.73). The QAC 3 10 km DB AOD had somewhat uneven performance across accuracy metrics relative to findings from global validations [
12]. It had the highest percentage of observations within EE
DT (87% in the East, 83% in the West). Correlation coefficients, however, were lower than the other three parameters (0.80 in the East, 0.63 in the West) and global estimates [
12]. Median retrieval error estimates in both regions were low (0.01 in the East, −0.00 in the West), but intercepts from regression modeling were higher (0.03 in the East, 0.02 in the West) and slopes were below 1 (0.79 in the East, 0.75 in the West). When assessed together, these metrics indicated over-prediction at lower AOD values and under-prediction at higher AOD values. Previous global validations have found similar patterns for 10 km DB retrievals, but over-prediction was more severe in the Western US than was noted in the global studies.
3.4. Accuracy Assessment of Lower-Confidence Retrievals
The more mature 10 km DB and 10 km DT AOD had 20,306 and 6924 valid lower-confidence collocations, respectively. In contrast, the less mature 3 km DT and 10 km DB-DT products had only 1429 and 2259 valid lower-confidence collocations, respectively. As expected, lower confidence collocations for the 10 km DB and 10 km DT AOD were noisier and had larger retrieval errors when compared to QAC 3 observations (
Table 2). For both parameters, a lower proportion of low-confidence observations were within EE
DT, ranging from 40% to 68% of retrievals, median retrieval error estimates were higher, ranging from 0.02 to 0.09, and correlation coefficients were lower, ranging from 0.52 to 0.88. There were a substantial number of valid QAC 1 10 km DB collocations with a positive retrieval error at lower AOD values. This is typically attributable to cloud contamination, and so it may be possible to use some of these observations in an analysis with caution and additional cloud screening procedures [
25]. Accuracy statistics for lower-confidence 3 km DT and 10 km merged AOD, on the other hand, were comparable with high confidence retrievals (
Table 2). The 3 km DT AOD had a high percentage of observations within EE
DT, 83 and 90% for the eastern and western regions, respectively, and strong correlations (0.79 in the East, 0.85 in the West). All low-confidence 10 km DB-DT AOD except QAC 2 retrievals in the eastern region (only 16 valid collocations) met pre-launch expectations, having between 70% and 90% of retrievals within EE
DT. The QAC code assignments for the two new AOD parameters do not seem to accurately reflect retrieval errors in the same way as for the more mature AOD parameters.
3.5. Dependence of Retrieval Errors on Flight Geometry and Land Cover Type
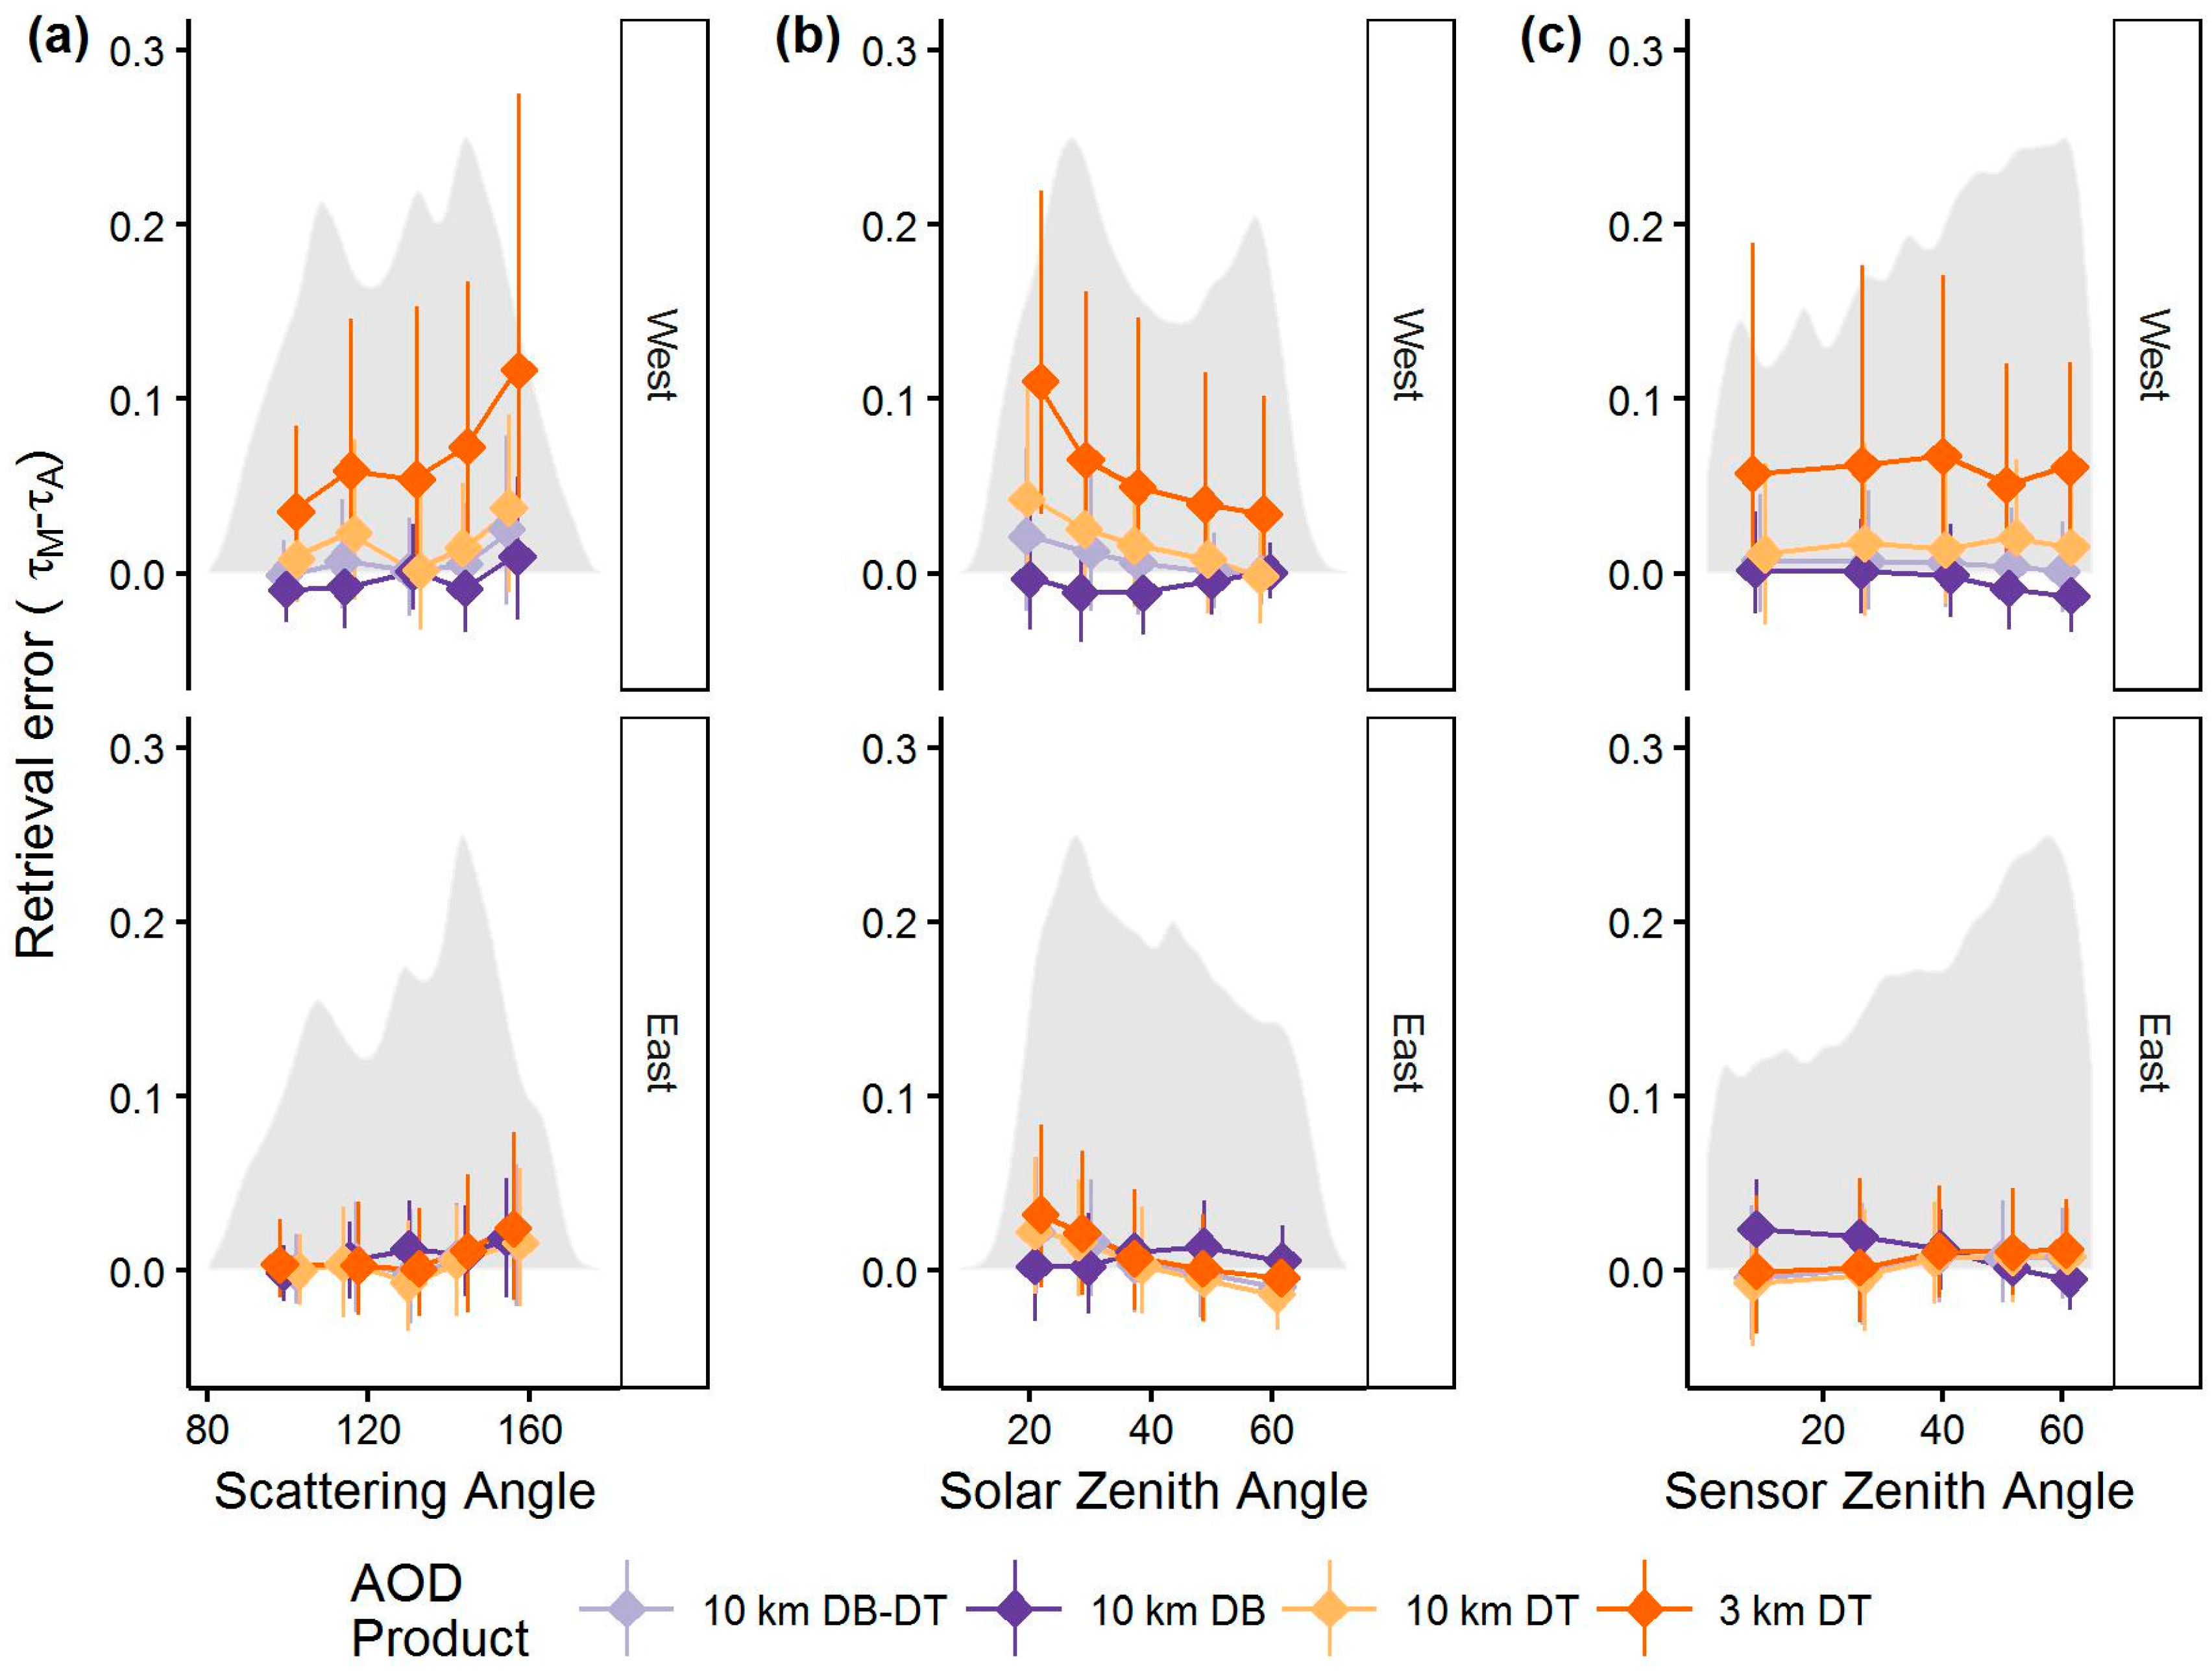
Figure 3 illustrates the dependence of AOD errors on the scattering, solar zenith, and viewing angles for QAC 3 retrievals. Scattering angle was associated with a statistically significant, positive trend in retrieval error in all four parameters in both regions. This trend is most pronounced for 3 km DT AOD in the western region with a median retrieval error of 0.12 for the highest quintile, and 0.04 for the lowest quintile of scattering angle. The median retrieval errors of 10 km DT, DB, and DB-DT AOD in both regions, and 3 km DT observations in the eastern region increase slightly with scattering angle (but remain below 0.04). This type of dependence could be related to issues with accounting for anisotropy in the surface reflectance over the CONUS [
30]. Our findings in the CONUS disagree with those presented in global evaluations, which found tendencies of median retrieval error with scattering angle to be small and negative [
12]. Our findings on the association between retrieval errors and solar zenith angles are only partially consistent with Sayer et al. [
12] which found solar zenith angles below 20 degrees to have positive retrieval errors for the 10 km DT parameter and negative retrieval errors for the 10 km DB parameter, but retrievals at angles greater than 20 to be relatively unbiased. In the Eastern US, our results show a similar pattern to those present in Sayer et al. [
12] for 10 km DB retrievals relative to 10 km DT retrievals, but with a slight positive retrieval error for 10 km DB. Additionally, we observed fairly substantial retrieval errors at solar zenith angles greater than 20 degrees. In the Western US, we observed negative retrieval errors in 10 km DB observations spanning solar zenith angles from 25 to 43 degrees, while the first quintile, containing observations with solar zenith angles less than 25 degrees, was relatively unbiased. This finding runs contrary to previous observations which have suggested that it is primarily low solar zenith angles that are problematic [
12,
25]. AOD retrieval error shows a small negative trend with sensor zenith angle for the 10 km DB AOD in both regions and for the 3 km DT in the West, and a small positive trend for the 10 km DT, 10 km DB-DT, and 3 km DT AOD in the East. The largest change was for 10 km DB observations in the East, where the median retrieval error estimate in AOD within the first quintile of sensor zenith angle, near the nadir, was 0.024 and the median retrieval error in the highest quintile was −0.005.
We assessed AOD retrieval errors by six land cover types, i.e., developed, forest, shrub, grass, cultivated, and wetland (see
Supplementary Figure S3). All AOD parameters showed positive retrieval errors over developed areas, particularly in the Western US (0.03 for 10 km DB, and 0.21 for 3 km DT AOD). Small but consistent positive errors were also observed over wetlands in the Eastern US (mean retrieval errors of 0.04 for 3 km DT, 0.03 for 10 km DT, 0.03 for 10 km DB-DT, and 0.02 for 10 km DB). The 3 km DT and, to a lesser degree, 10 km DT AOD also showed significant positive errors over shrub lands in the Western US (mean retrieval errors were 0.10 and 0.06 for 3 km DT and 10 km DT, respectively). The best agreement between MODIS and AERONET was over forests, grasslands, and cultivated lands. Overall, the 10 DB AOD had the least retrieval errors across all land cover types (<0.03), followed by the 10 km DB-DT AOD (greatest mean retrieval error of 0.10 over developed areas in the Western US). Previous studies have identified high retrieval error in AOD retrievals over developed areas, and the retrieval error in DT products over poorly vegetated surfaces to which 10 km DB retrievals are more robust [
16,
20,
31].
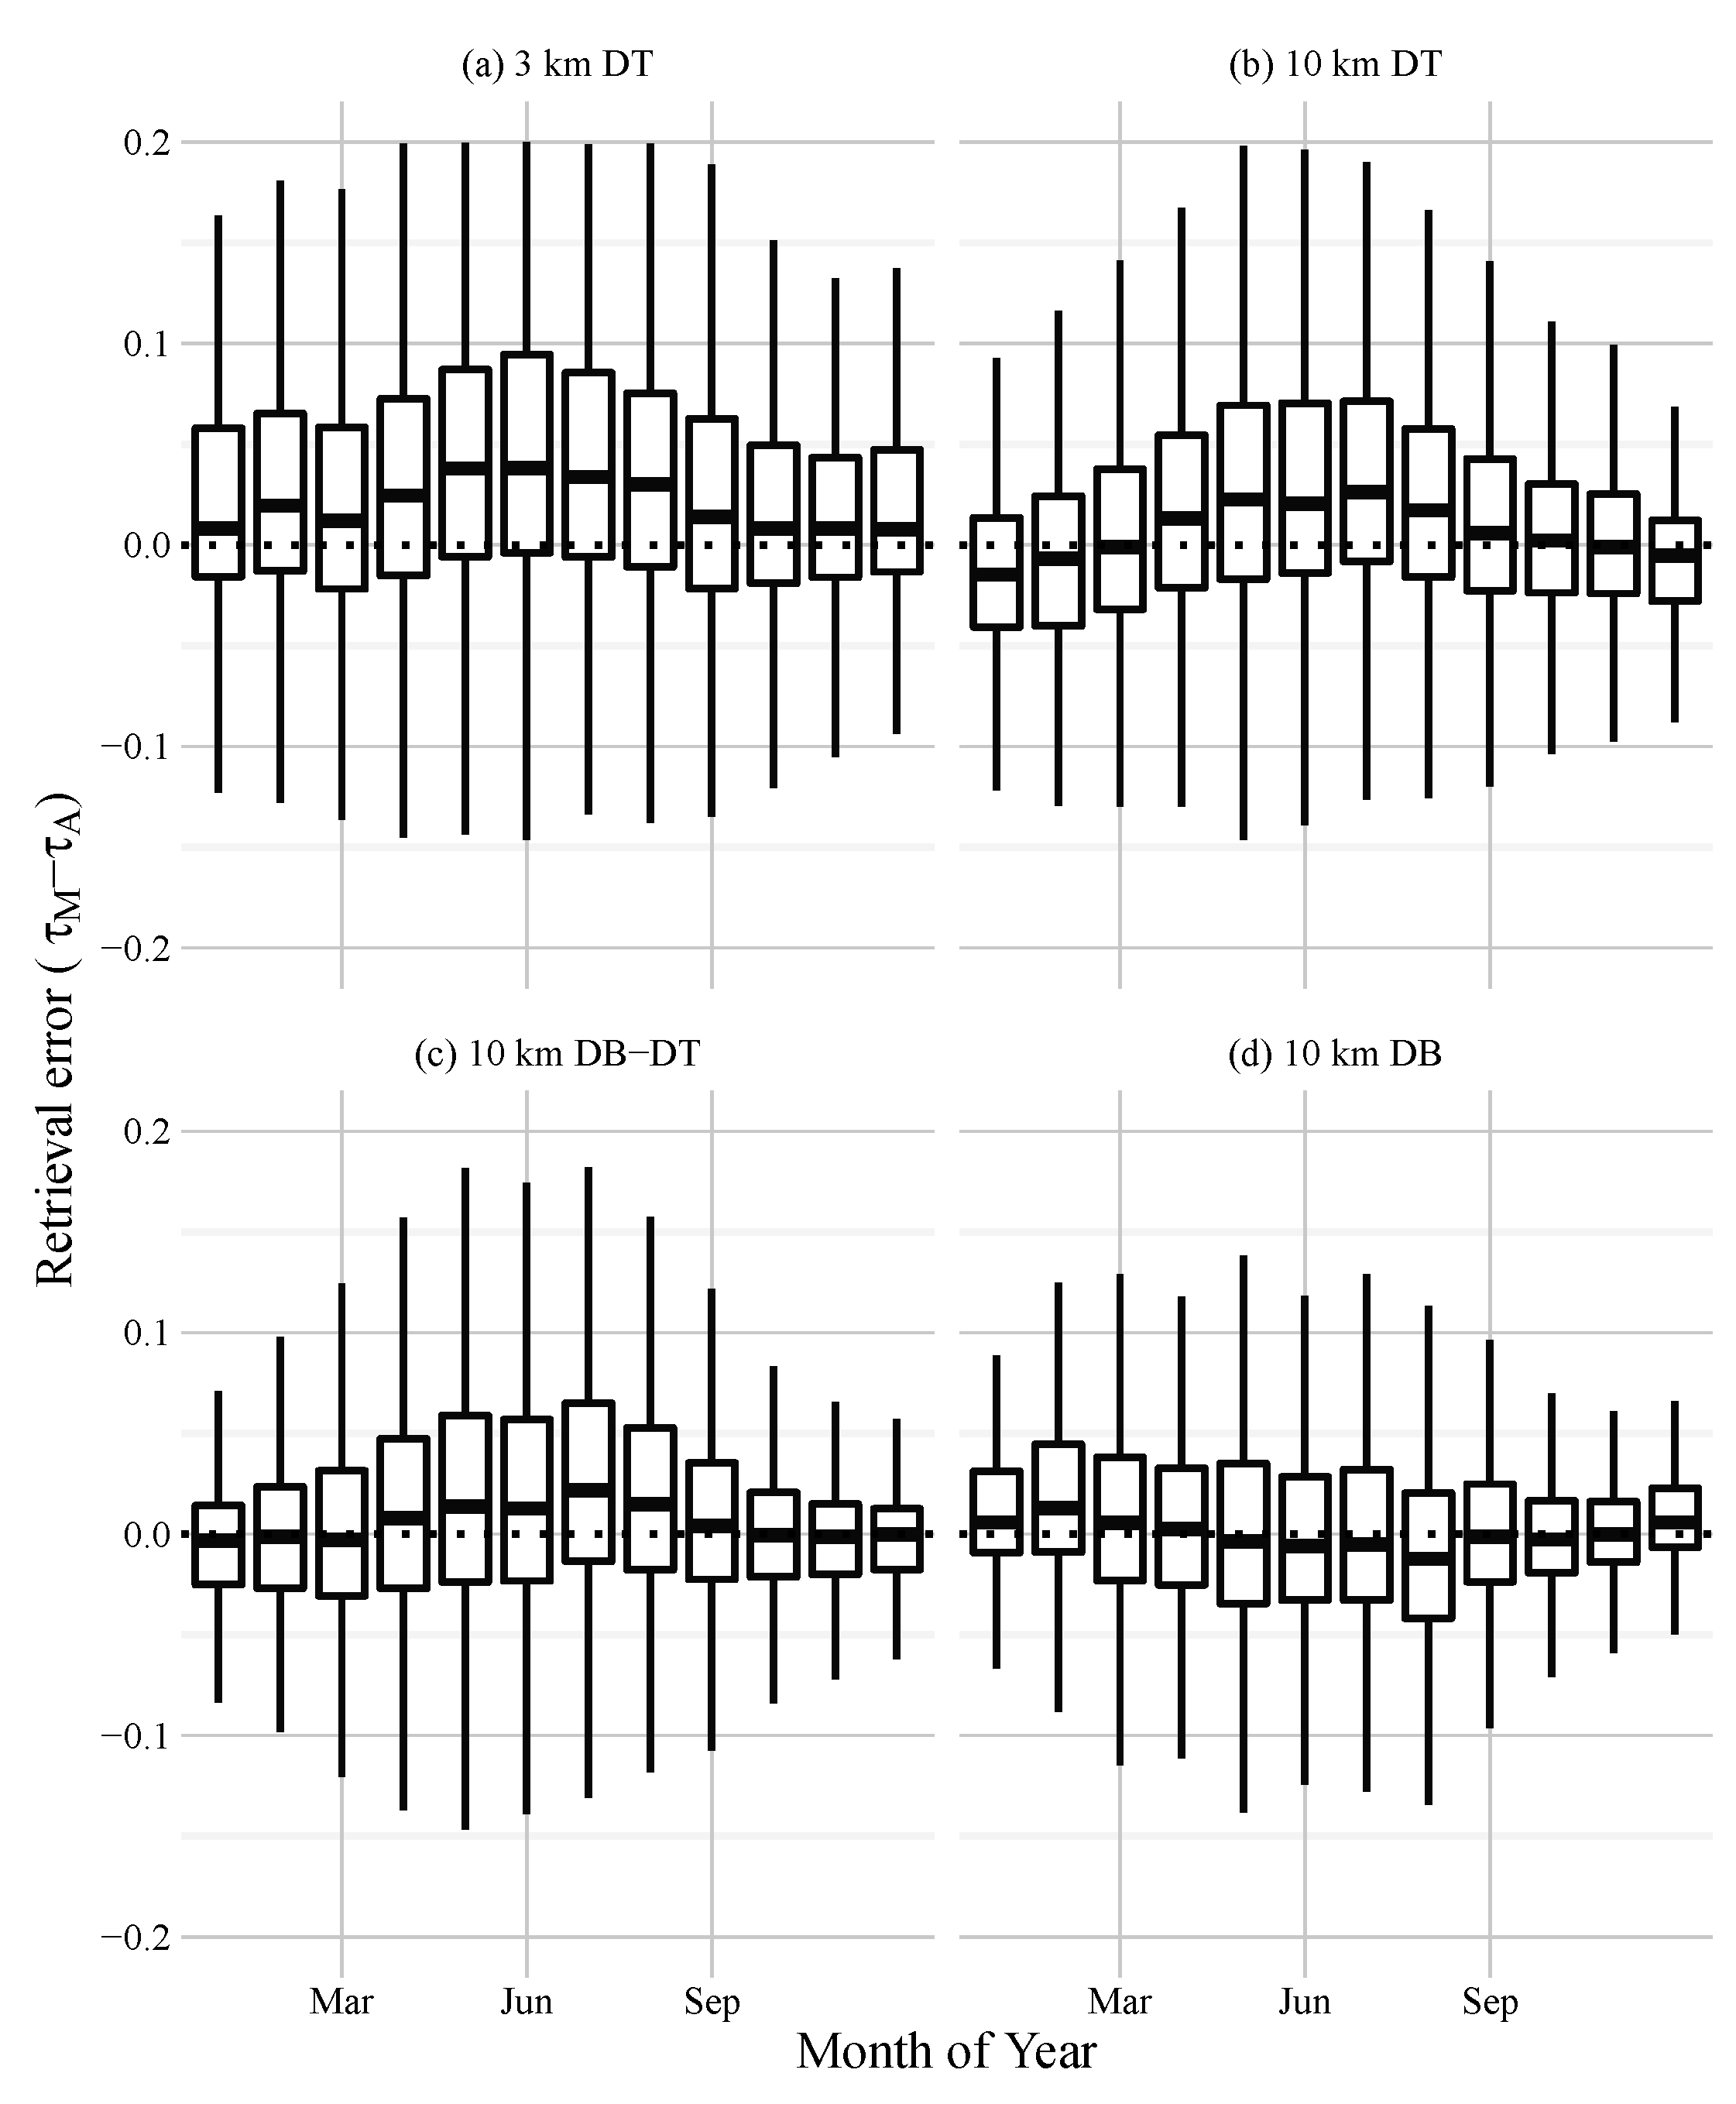
3.6. Dependence of Retrieval Errors on Season and Weather Conditions
Figure 4 summarizes monthly retrieval errors from each AOD parameter. Median retrieval errors in the 10 km DT, 10 km DB-DT, and 3 km DT parameters were the highest in the summer months. The 3 km DT AOD had the widest fluctuation of retrieval errors over the course of the year (0.009 in December to 0.056 in May). The 10 km DB product had a more even distribution over time, from −0.01 in August to 0.01 in February. The reasons for the increased positive retrieval error in the DT-based AOD parameters in the summer months is unclear, and has not been well-characterized in previous work on this collection. However, despite the fact that collocations in summer months are associated with increased mean NDVI values, which typically result in better accuracy statistics for DT products, collocations in these months also have higher scattering angles, lower solar zenith angles, and higher values of total column precipitable water, all factors that result in positive retrieval errors over the CONUS.
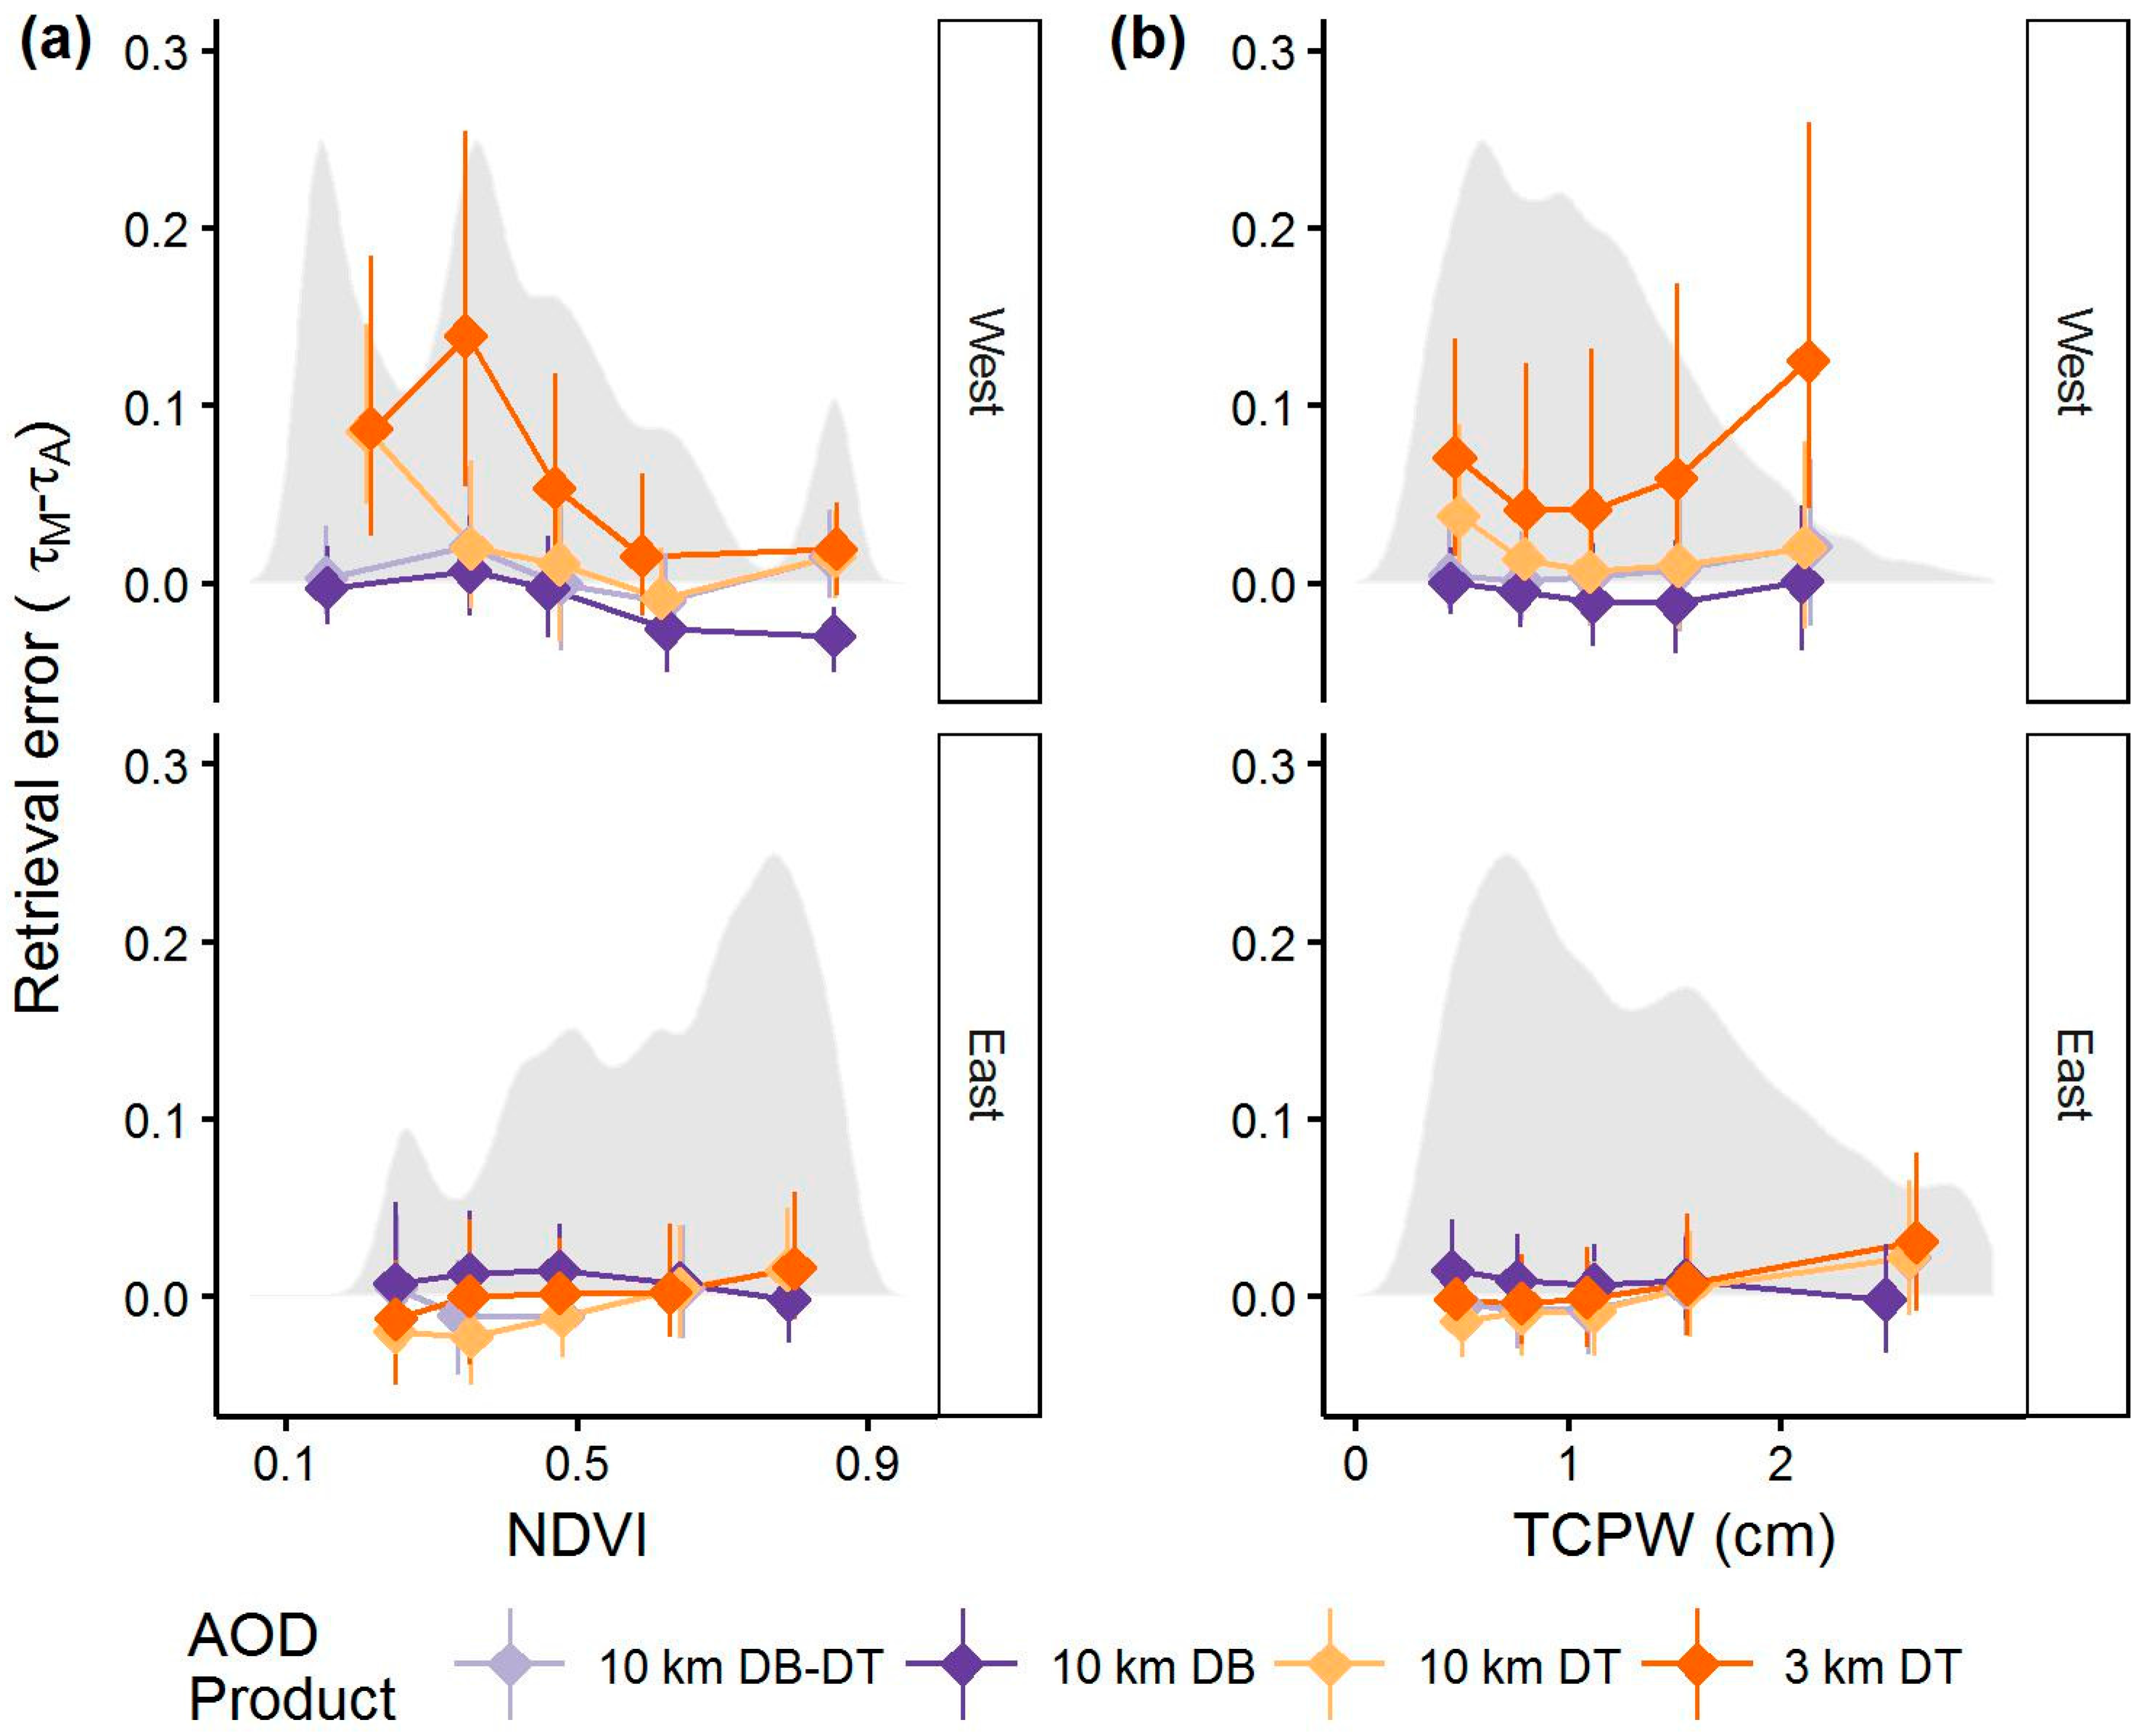
As mentioned above, lower NDVI has been associated with increased retrieval error and noise in MODIS AOD retrievals, particularly for DT-based products, in previous works [
16]. In the West, this is clearly shown in the 3 km DT AOD, and to a lesser degree in 10 km DT AOD (
Figure 5). The 10 km DB AOD in the Western US was unbiased in the lowest three quintiles of NDVI, but was negatively biased in the upper two quintiles (up to −0.03 in the highest quintile). This pattern was observed in the global validations as well [
12] and it likely points to an overestimation of the surface reflectance over vegetated areas in the eastern US. In the East, AOD retrieval errors are less dependent on NDVI, and the negative retrieval error observed for DB at higher NDVI values was not observed. Both humidity and potential cloud contamination have been shown to bias MODIS observations, and total column precipitable water (TCPW) can be a marker for both factors [
32].
Figure 5 shows a complex relationship between AOD retrieval errors and TCPW. In the Western US, TCPW has little impact on the retrieval errors of 10 km DB and DB-DT AOD, but both very high or very low TCPW values are associated with positive retrieval errors in the 3 km and 10 km DT AOD. In the Eastern US, the 10 km DB AOD is negatively associated with TCPW. However, the impact of TCPW is generally small for all AOD parameters, except at very high levels where both the 3 km and 10 km DT AOD showed a small positive retrieval error. At higher TCPW values, this bias is likely indicative of cloud contamination, and the lack of retrieval error in 10 km DB product under these conditions fits with our coverage results, which suggests more conservative cloud screening procedures for this product.
4. Case Study
We conducted a case study over the Atlanta Metropolitan Area from 1 January 2004 to 31 December 2013. The study area stretched from 32°N to 36°N latitude and from 83°W to 86°W longitude, and included 23 ground-level PM
2.5 monitors in 19 distinct grid cells from the same ~12 km × 12 km grid used in the coverage analysis. This case study compared the ability of each of the four MODIS AOD products to predict ground-level PM
2.5 in a widely used linear mixed effect (LME) model framework [
33]. Three AOD datasets were generated for each of the four MODIS AOD products: (1) AOD values with only QAC = 3; (2) AOD values with the highest available QAC (1, 2 or 3); and (3) filtered and corrected AOD values using the relationships examined in
Section 3.5 and
Section 3.6 prior to inclusion in the model. To produce the filtered and corrected dataset, AOD values from dataset #2 with scattering angles over 165° or solar zenith angles less than 15° were first eliminated. This removed ~9% of observations while some were additionally lost in the matching process. This filtered dataset was then corrected, using a linear regression model fit to the dataset of matched AERONET and MODIS AOD observations in the Eastern CONUS, used in the accuracy analysis, for QAC value, land use type, sensor zenith angle, total column precipitable water, and NDVI. All 12 combinations of AOD were fit using the LME model, of the form: PM
2.5,s,t = (b
0 + b
0,t) + (b
1 + b
1,t)AOD
s,t, where b
0 is the fixed intercept, b
0,t the random intercept for each day, b
1 the fixed slope, and b
1,t the random slope for each day [
33]. These results are presented in
Table 3.
For the parameters where the number of observations increased with the addition of lower QAC valued observations, 10 km DB and 10 km DT, R2 values for a model relating ground-level PM2.5 concentrations to AOD actually increased slightly. Increasing from 0.80 to 0.83 for 10 km DB and from 0.72 to 0.75 for 10 km DT. When AOD values were filtered and corrected to remove potentially biased observations, model fits for the 10 km DT product decreased slightly, from 0.77 to 0.75 and remained the same for the 10 km DB product. For the parameters with relatively few lower quality observations, 10 km DB-DT and 3 km DT, neither the number of observations included in the model nor the resulting R2 values changed when lower confidence observations were included in the model. When filtering and correction was applied, model fits, as measured by the R2 values, actually decreased by 0.01 relative to the ‘best of’ models. These results run counter to what would be expected: that R2 values for all four parameters would decrease slightly with the inclusion of lower-confidence retrievals, given the fact that the lower confidence observations for the 10 km DB and 10 km DT parameters are noisier. However, in this case study, the additional number of observations appears to have offset the additional noise introduced via these observations in the model and resulted in better prediction of ground-level PM2.5 via this simple model. Despite the smaller sample sizes, the models using the corrected and filtered AOD values achieved similar R2 values as the uncorrected AOD models.
These results illustrate some of the key points made in this paper, namely that coverage is an often-overlooked but important factor, when considering AOD accuracy statistics, and that, because of the role played by coverage, the inclusion of lower-quality AOD observations in a model can provide some benefit. These results additionally highlight our observation that the lower confidence designations for the newer products, 10 km DB-DT and 3 km DT, are very few in number. The utility of correcting for major sources of bias or error in the AOD values was demonstrated in this limited example by greater fixed effect regression slopes, indicating greater sensitivity of the corrected and filtered AOD values to PM2.5 concentrations.
5. Conclusions
We conducted a detailed analysis on the coverage and accuracy of Collection 6 MODIS AOD parameters in the CONUS. With their applications in air quality research in mind, we examined the benefits and risks of including lower QAC retrievals in order to improve data coverage, as well as how AOD retrieval errors depend on various factors. Our recommendation is that, for inexperienced users who are beginning to explore MODIS AOD data for air quality research, the QAC 3 10 km DB-DT AOD is their best choice. For more experienced users, the ideal AOD parameter could depend on the purpose as well as domain of their study. The coverage of QAC 3 retrievals is comparable among all four AOD parameters, ranging from 25% to 30%. The Eastern US in general had higher and more consistent data coverage. However, much higher coverage rates were found in highly developed Southern California and over the south-central plains with limited ground-level air pollution monitoring, a surprising fact since these areas are traditionally regarded as having too high of surface brightness for DT to retrieve reliably. These findings are promising to researchers interested in conducting regional air quality assessments in these regions. Including lower QAC retrievals marginally improved coverage for the 3 km DT and 10 km DB-DT AOD. However, since these QAC assignments do not appear to reflect retrieval accuracy and are few in number, including lower QAC retrievals of these two parameters is probably beneficial, and unlikely to be harmful. On the other hand, lower QAC retrievals could increase the coverage of 10 km DT AOD by ~20% and that of 10 km DB AOD by ~70% on average. Caution must be given when including them to enhance coverage as these retrievals are often noisier, as shown in
Table 2. However, as demonstrated in the case study, sufficient daily sample sizes can sometimes be more important than retaining only the high quality AOD values for the purposes of improving prediction errors with ground-level PM
2.5. To take advantage of the dramatic coverage gain offered by these lower QAC retrievals, retrieval error correction steps using local AERONET observations could be valuable [
7].
In terms of data accuracy, the 10 km DB-DT AOD had the best performance in terms of correlation and linear model fit statistics, although QAC 3 retrievals for all but the 3 km DT AOD over the Western US met pre-launch expectations for the percentage of collocations within EEDT. However, the 10 km DB product performs well in the context of a prediction model and may be an understudied AOD parameter in the US, where the 10 km DT product is currently used more frequently. The robustness of this product to major sources of bias additionally makes it an attractive option in the Western United States. The noisier 3-km DT AOD, however, can be valuable over dark targets in the Eastern US, particularly over areas where it tends to retrieve at higher rates than the lower-resolution products, such as in the Northeast and Northern Midwest, over the South Central plains in Texas, and over Southern Florida. The errors in MODIS AOD parameters vary in time and space, and are dependent on various retrieval conditions. Additional data screening and retrieval error correction steps should be considered other than simply relying on the QAC values, particularly in the Western United states, where these biases tend to have a larger impact. For example, AOD retrievals associated with high scattering angles and lower solar zenith angles may be excluded to avoid data contamination. Such parameters can be found in the operational MODIS aerosol product. In addition, categorical variables of land cover types as well as time trends can be introduced in PM2.5 exposure models to control for the systematic retrieval errors in DT-based AOD retrievals. NDVI and TCPW had statistically significant, distinct impacts on all AOD parameters in the Western US, and therefore are probably worth considering when analyzing AOD data. Since they must be extracted from separate MODIS data products, users would need to consider the nontrivial time and computational demands associated with dealing with these large datasets.


