
Evaluation of the Initial Thematic Output from a Continuous Change-Detection Algorithm for Use in Automated Operational Land-Change Mapping by the U.S. Geological Survey


Abstract
:1. Introduction
2. Materials and Methods
2.1. Data
2.1.1. Land Cover Trends
2.1.2. CCDC Annual Land Cover
2.2. Methods of Land Cover Product Comparison
3. Results
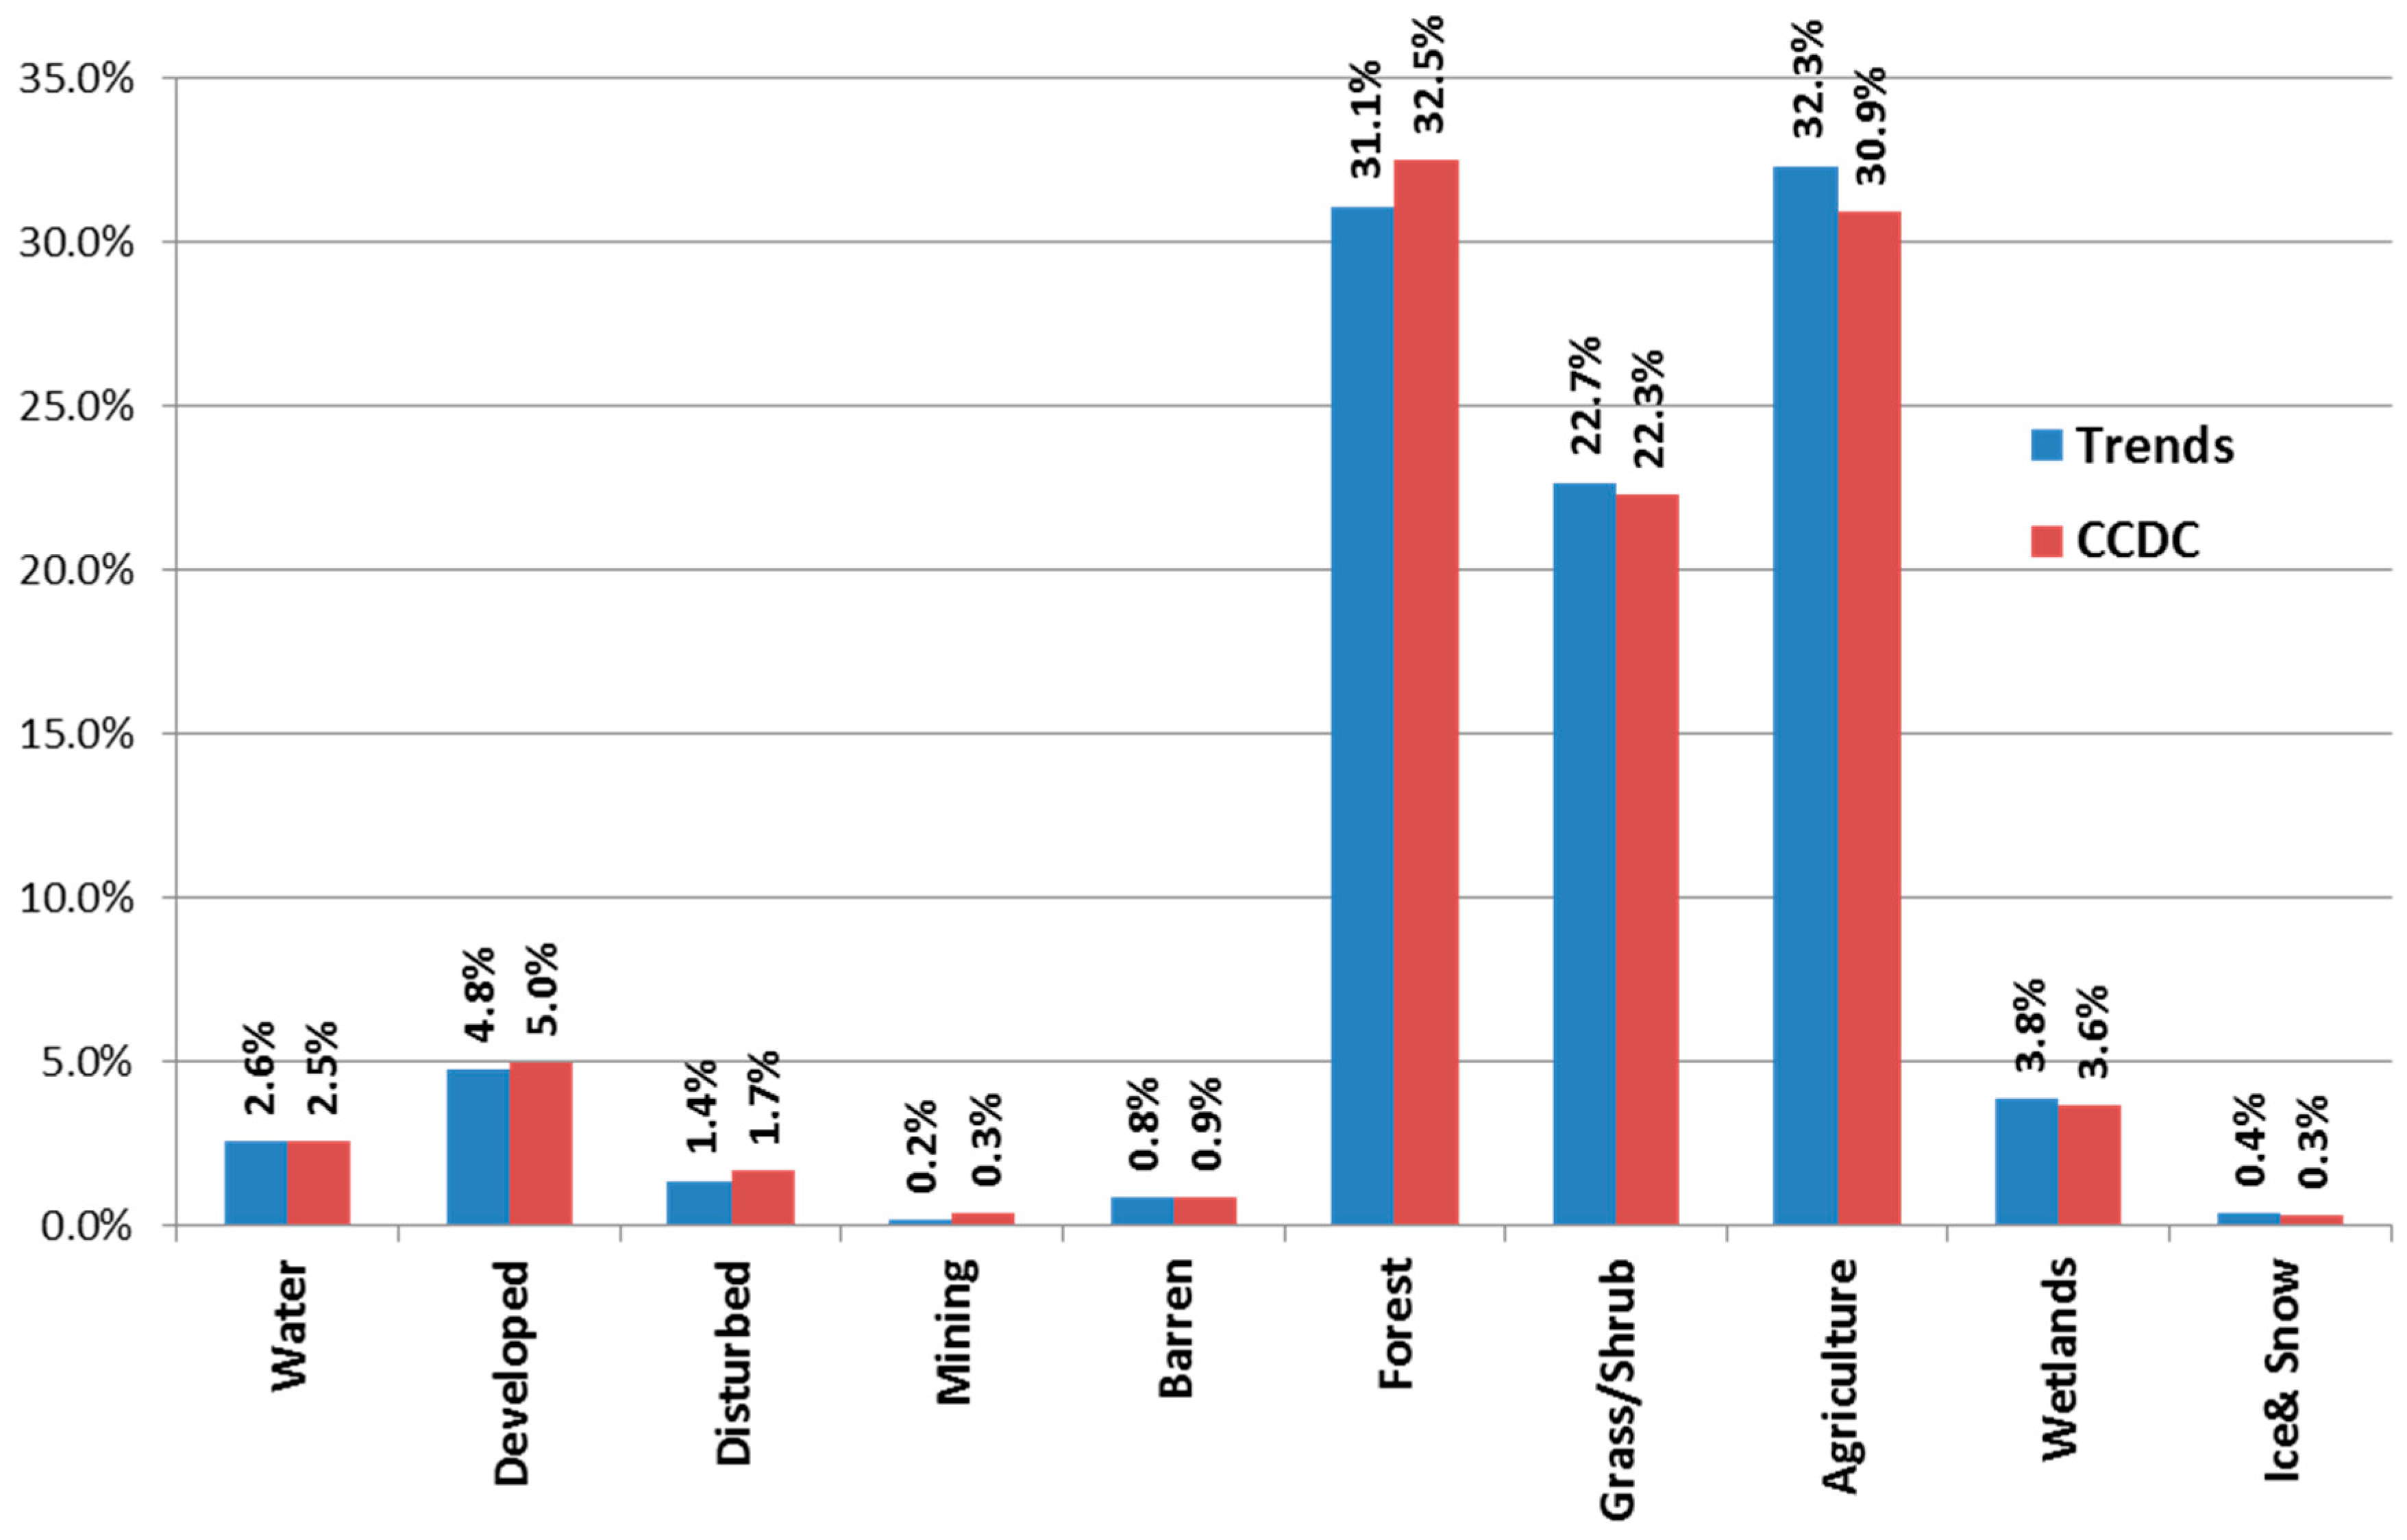
3.1. Class Distribution
3.2. Per-Pixel Agreement
3.2.1. Summary of Per-Pixel Agreement
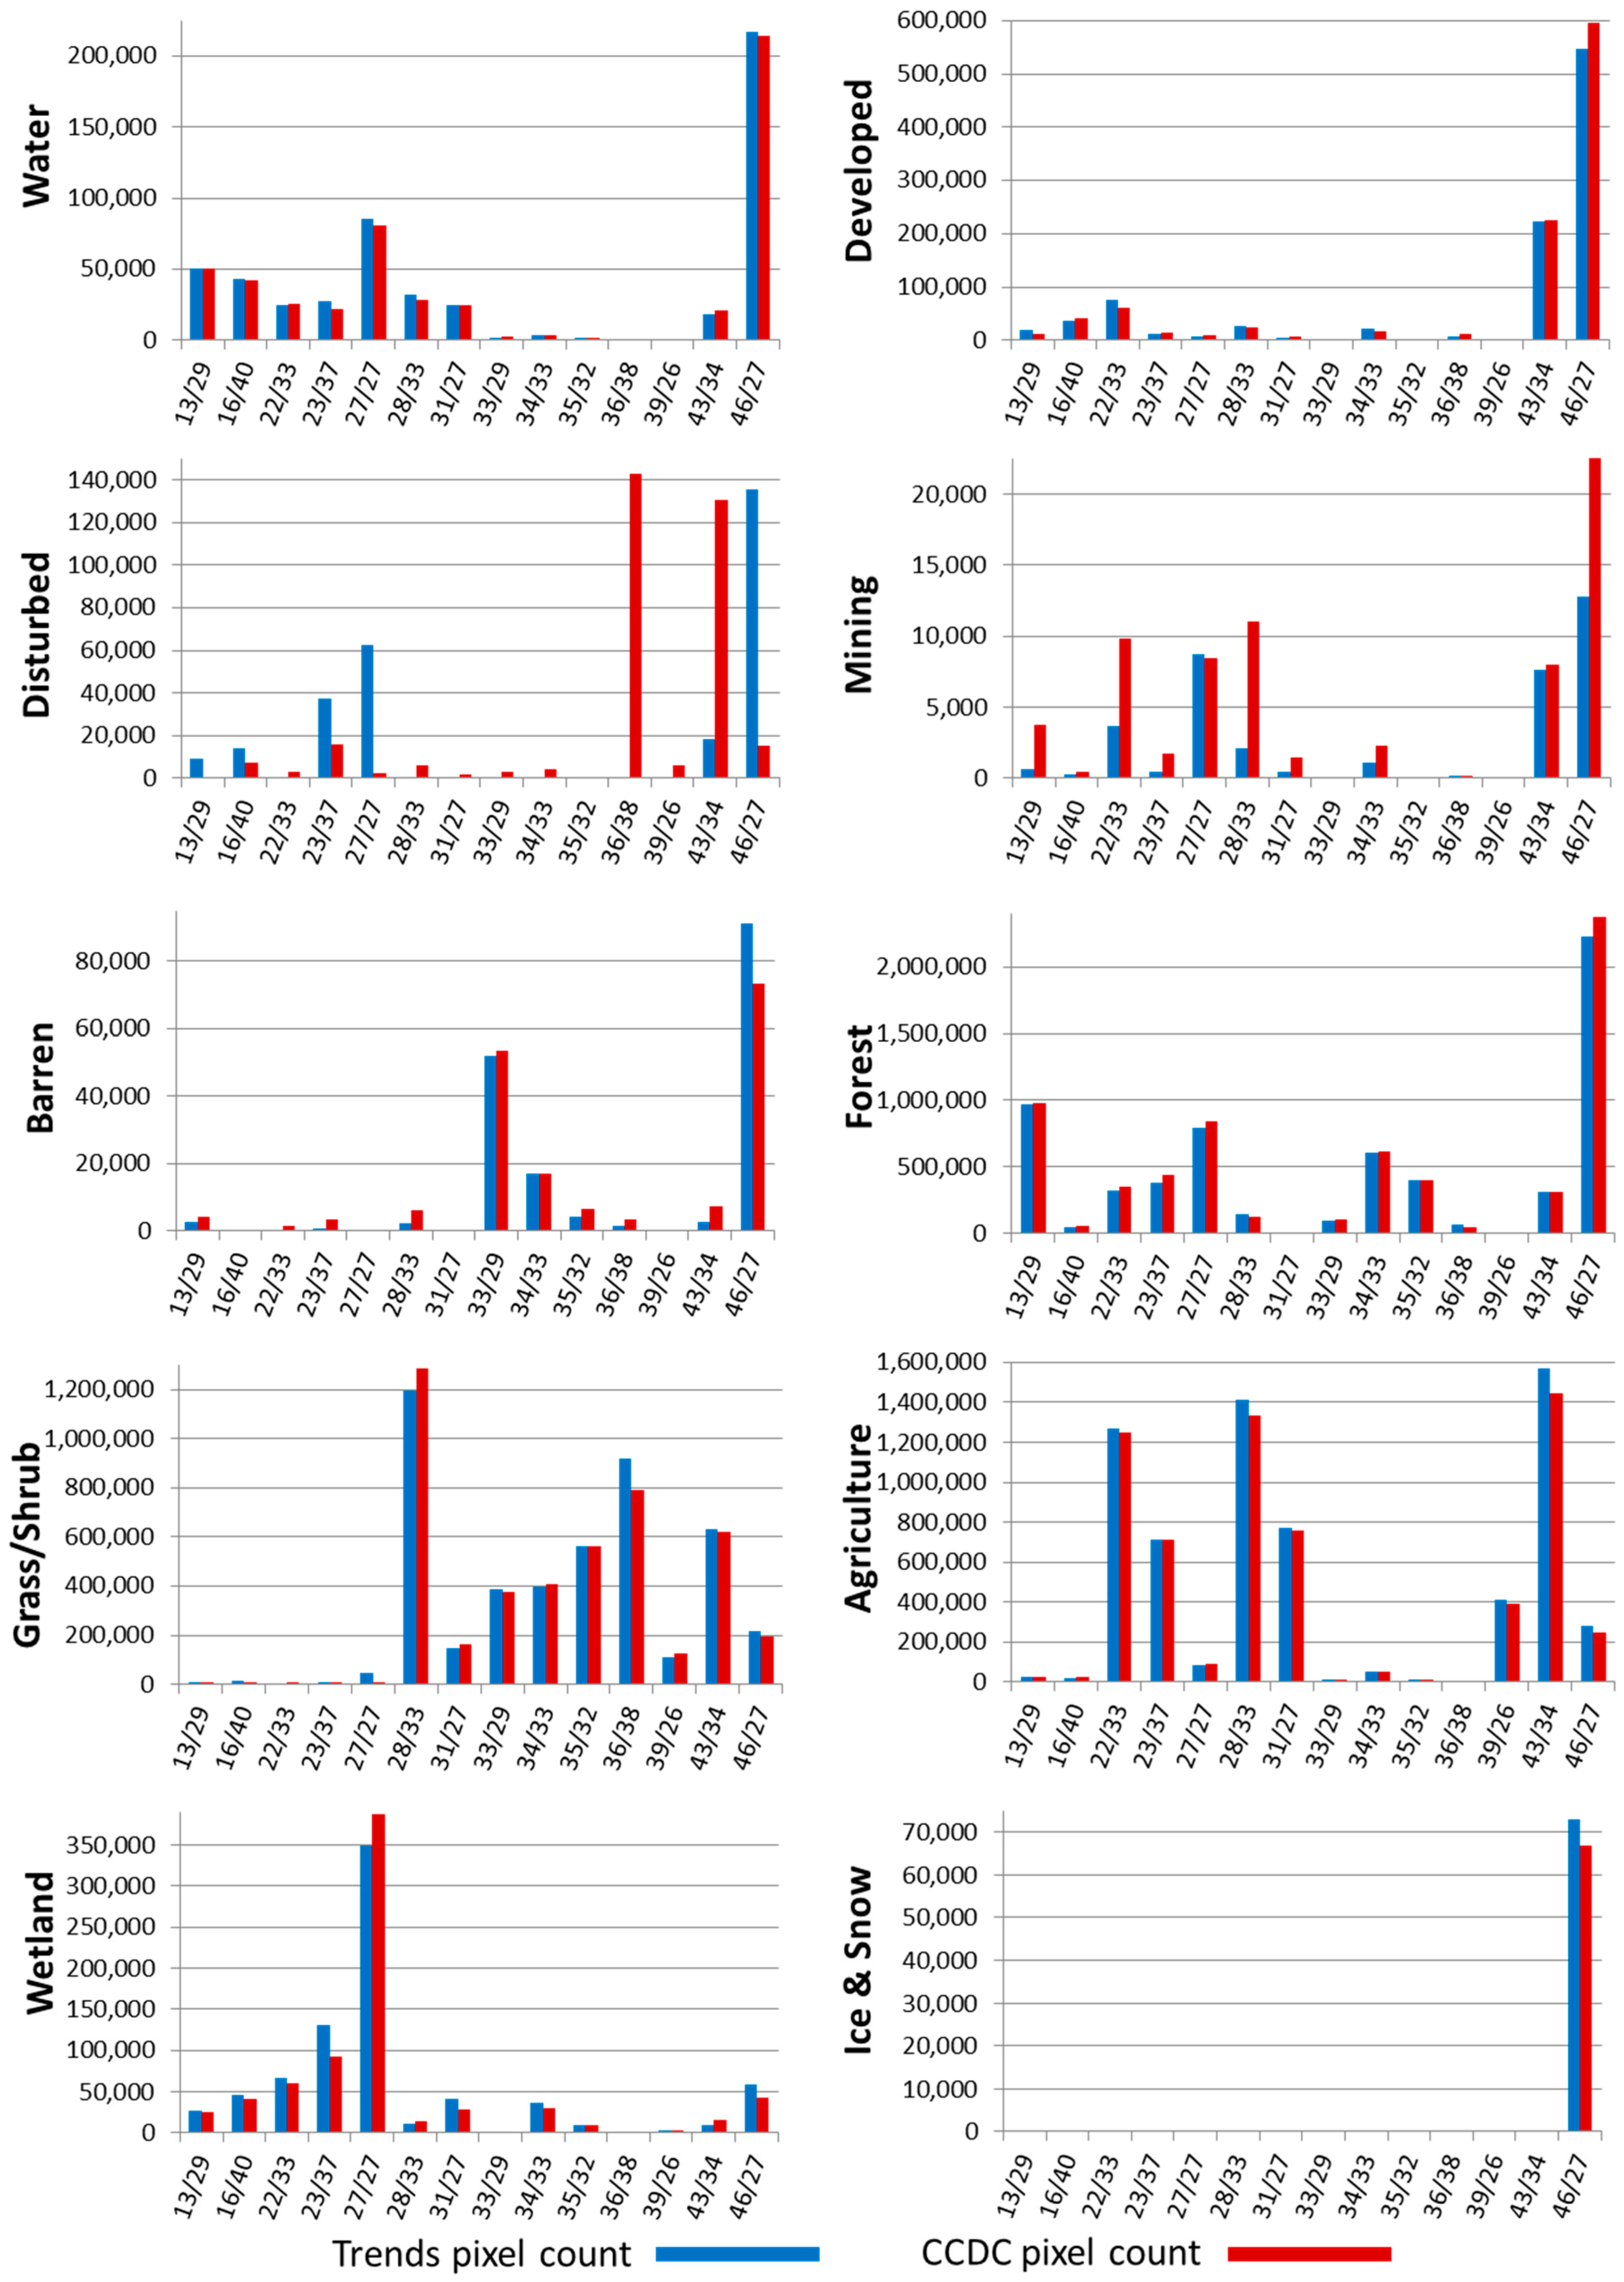
3.2.2. Per-Pixel Agreement by Path/Row
3.2.3. Per-Pixel Agreement by Land Cover Class
Forest Class Agreement
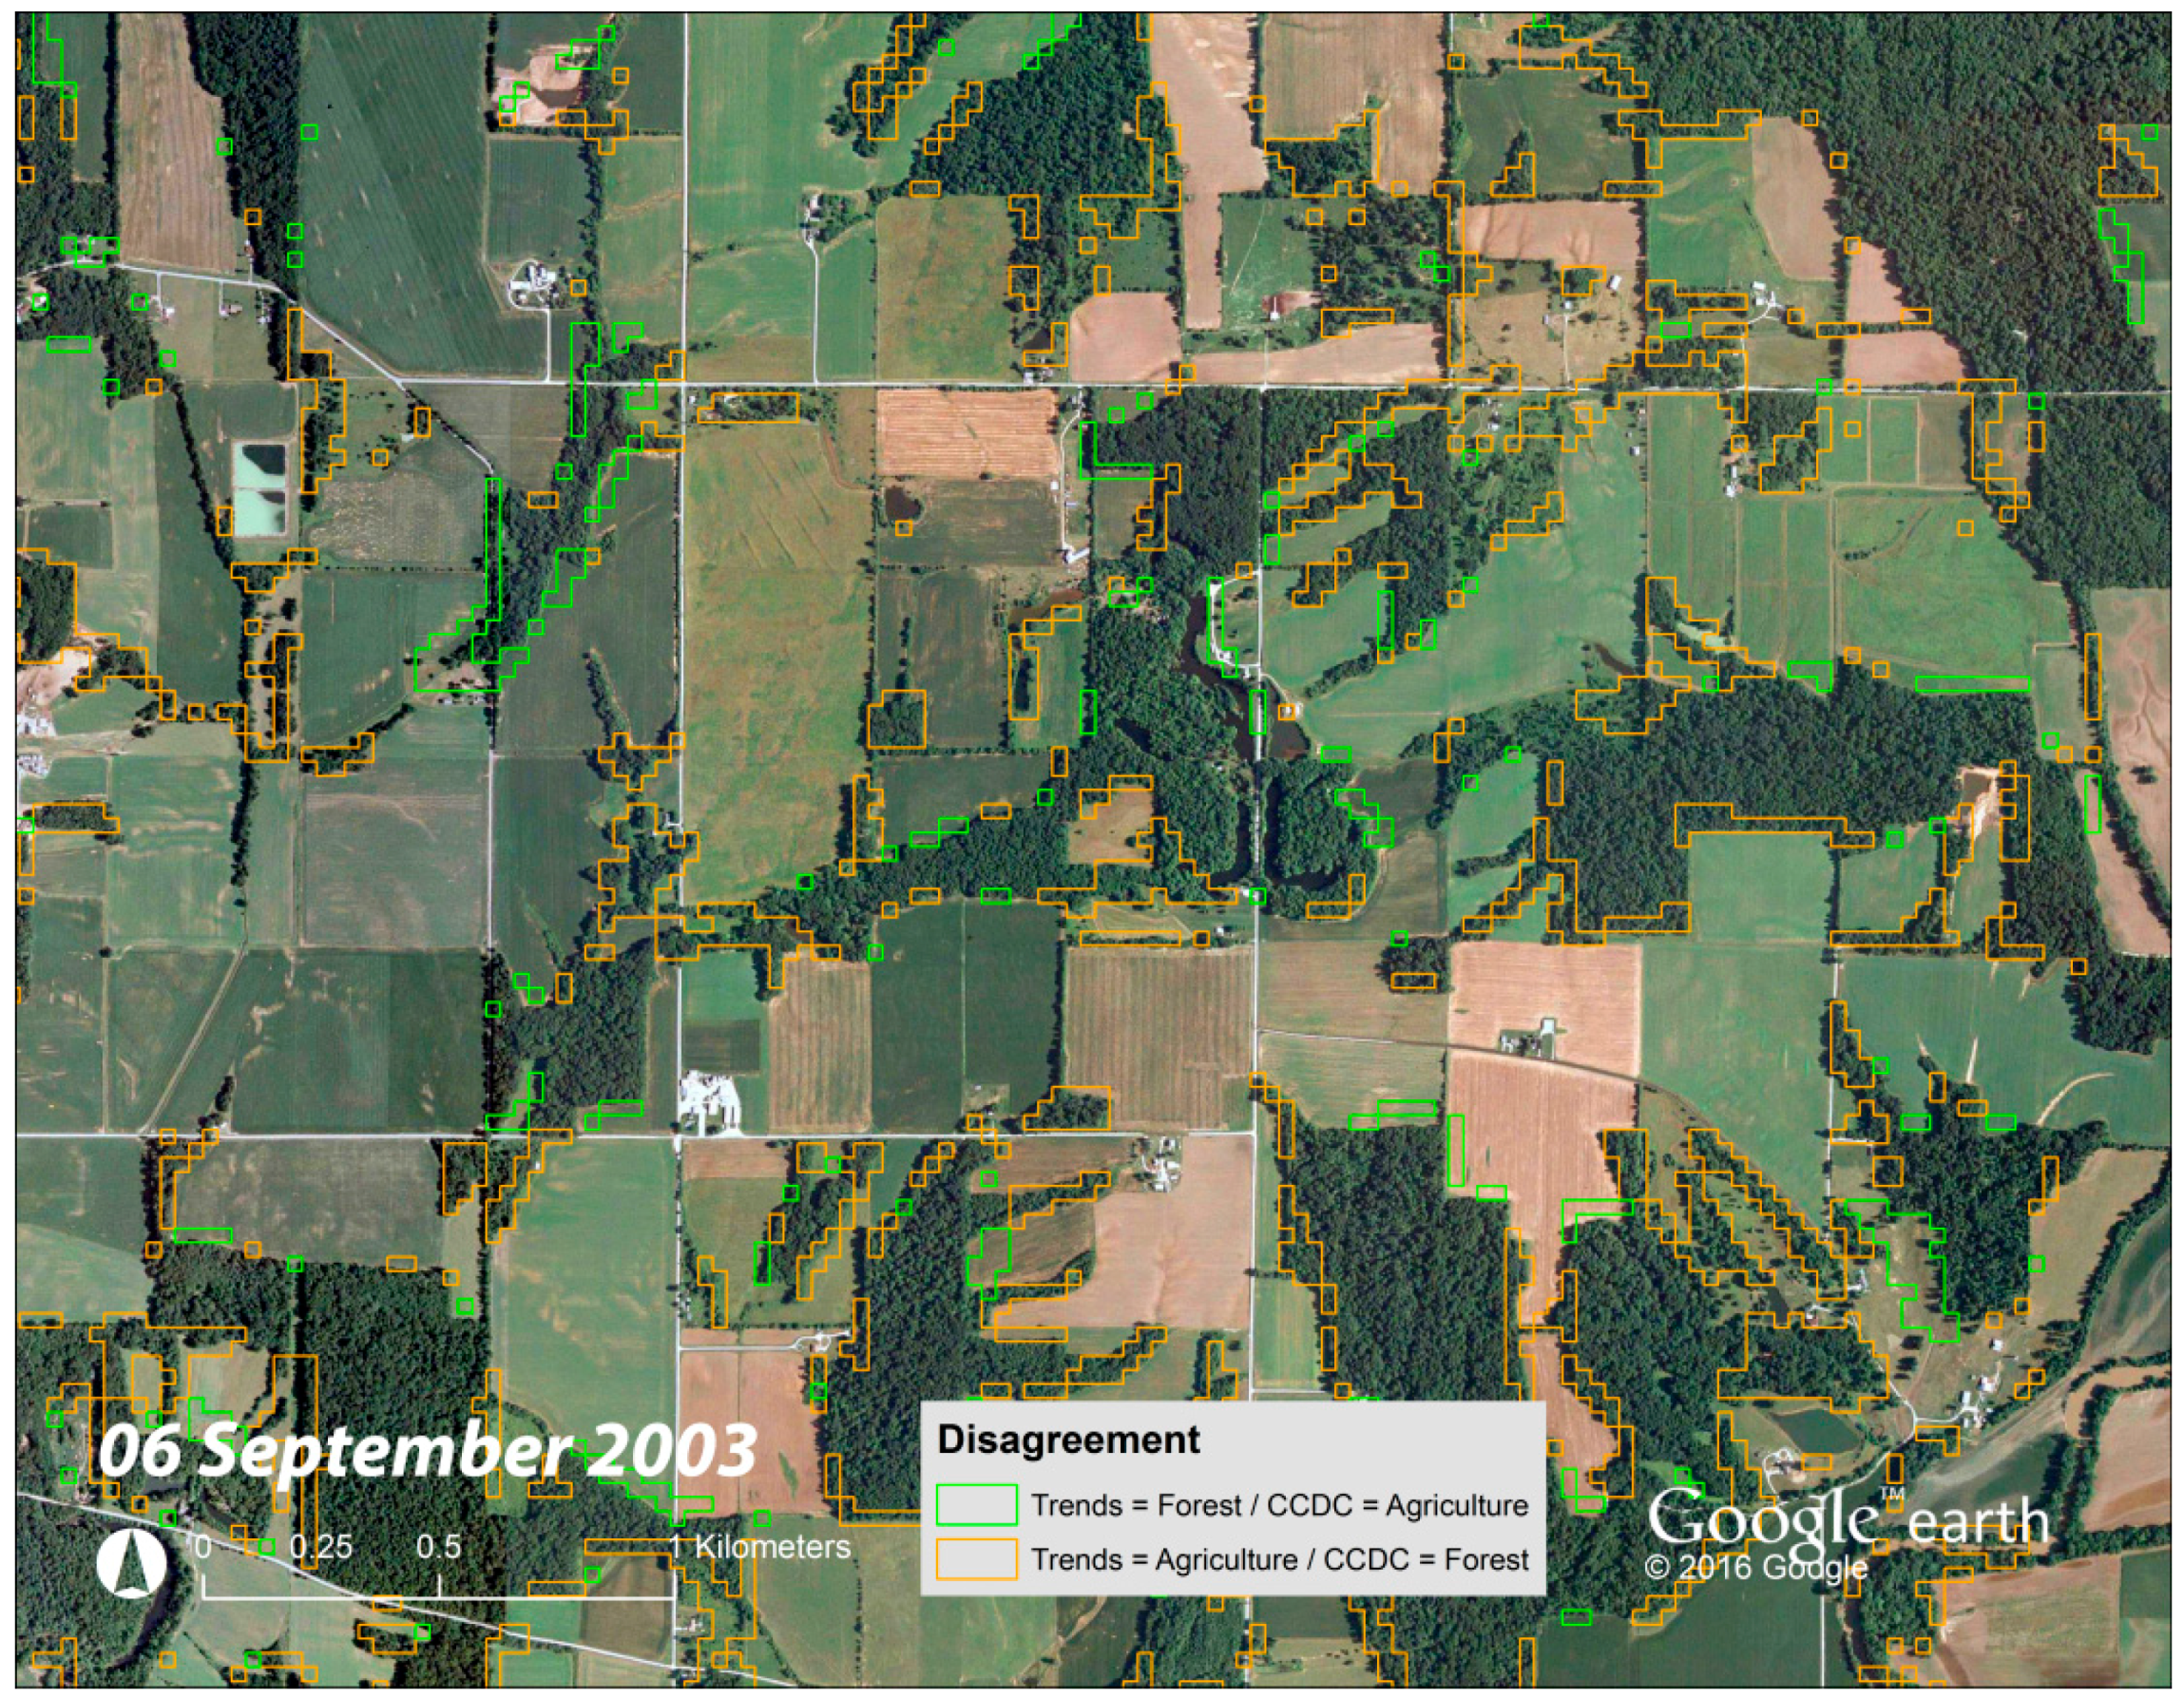
Agriculture Class Agreement
Grass/Shrub Class Agreement
Developed Class Agreement
Wetland Class Agreement
Water Class Agreement
Barren Class Agreement
Mining and Ice-Snow Classes Agreement
Disturbed Class Agreement
4. Discussion
5. Conclusions
Supplementary Materials
Acknowledgments
Author Contributions
Conflicts of Interest
References
- Homer, C.; Dewitz, J.; Fry, J.; Coan, M.; Hossain, N.; Larson, C.; Herold, N.; McKerrow, A.; VanDriel, J.N.; Wickham, J. Completion of the 2001 National Land Cover Database for the counterminous United States. Photogramm. Eng. Remote Sens. 2007, 73, 337. [Google Scholar]
- Bounoua, L.; DeFries, R.; Collatz, G.J.; Sellers, P.; Khan, H. Effects of land cover conversion on surface climate. Clim. Chang. 2002, 52, 29–64. [Google Scholar] [CrossRef]
- Running, S.W. Ecosystem disturbance, carbon, and climate. Science 2008, 321, 652–653. [Google Scholar] [CrossRef] [PubMed]
- Foley, J.A.; DeFries, R.; Asner, G.P.; Barford, C.; Bonan, G.; Carpenter, S.R.; Chapin, F.S.; Coe, M.T.; Daily, G.C.; Gibbs, H.K. Global consequences of land use. Science 2005, 309, 570–574. [Google Scholar] [CrossRef] [PubMed]
- Turner, W.; Rondinini, C.; Pettorelli, N.; Mora, B.; Leidner, A.K.; Szantoi, Z.; Buchanan, G.; Dech, S.; Dwyer, J.; Herold, M. Free and open-access satellite data are key to biodiversity conservation. Biol. Conserv. 2015, 182, 173–176. [Google Scholar] [CrossRef]
- Zhu, Z.; Woodcock, C.E. Continuous change detection and classification of land cover using all available Landsat data. Remote Sens. Environ. 2014, 144, 152–171. [Google Scholar] [CrossRef]
- Loveland, T.; Sohl, T.; Stehman, S.; Gallant, A.; Sayler, K.; Napton, D. A strategy for estimating the rates of recent United States land-cover changes. Photogramm. Eng. Remote Sens. 2002, 68, 1091–1099. [Google Scholar]
- Sleeter, B.M.; Wilson, T.S.; Acevedo, W. Status and Trends of Land Change in the Western United States—1973 to 2000; U.S. Geological Survey Professional Paper 1794A; US Geological Survey: Menlo Park, CA, USA, 2012; p. 324.
- Taylor, J.L.; Acevedo, W.; Auch, R.F.; Drummond, M.A. Status and Trends of land Change in the Great Plains of the United States—1973 to 2000; U.S. Geological Survey Professional Paper 1794B; U.S. Geological Survey: Reston, VA, USA, 2015; p. 190.
- Auch, R.F.; Karstensen, K.A. Status and Trends of Land Change in the Midwest-South Central United States—1973 to 2000; U.S. Geological Survey Professional Paper 1794C; U.S. Geological Survey: Reston, VA, USA, 2015; p. 200.
- Soulard, C.E.; Acevedo, W.; Auch, R.F.; Sohl, T.L.; Drummond, M.A.; Sleeter, B.M.; Sorenson, D.G.; Kambly, S.; Wilson, T.S.; Taylor, J.L. Land Cover Trends Dataset, 1973–2000; U.S. Geological Survey: Reston, VA, USA, 2014.
- Anderson, J.R. A Land Use and Land Cover Classification System for Use with Remote Sensor Data; US Government Printing Office: Washington, DC, USA, 1976.
- U.S. Geological Survey. Land Cover Trends Project Classification System. Available online: http://landcovertrends.usgs.gov/main/classification.html (accessed on 8 March 2016).
- U.S. Environmental Protection Agency. Level III Ecoregions of the Continental United States (Revision of Omernik, 1987); Environmental Protection Agency—National Health and Environmental Effects Research Laboratory: Corvallis, OR, USA, 1999.
- Omernik, J.M. Map supplement: Ecoregions of the conterminous United States. Ann. Assoc. Am. Geogr. 1987, 77, 118–125. [Google Scholar] [CrossRef]
- Auch, R.F.; Drummond, M.A.; Sayler, K.L.; Gallant, A.L.; Acevedo, W. An approach to assess land-cover trends in the conterminous United States (1973–2000). In Remote Sensing of Land Use and Land Cover, Principles and Applications; Giri, C., Ed.; CRC Press: Boca Raton, FL, USA, 2012; pp. 351–368. [Google Scholar]
- U.S. Geological Survey. National Land Cover Dataset 1992 (NLCD1992). Available online: http://www.mrlc.gov/nlcd1992.php (accessed on 8 March 2016).
- Cochran, W.G. Sampling Techniques; Wiley and Sons: New York, NY, USA, 1977; Volume 98, pp. 259–261. [Google Scholar]
- U.S. Geological Survey. Landsat 4–7 Climate Data Record (CDR) Surface Reflectance—User’s Guide. Available online: http://landsat.usgs.gov/documents/cdr_sr_product_guide.pdf (accessed on 8 March 2016).
- U.S. Geological Survey. Provisional Landsat 8 Surface Reflectance Product—Product Guide. Available online: http://landsat.usgs.gov/documents/provisional_l8sr_product_guide.pdf (accessed on 8 March 2016).
- U.S. Geological Survey. Earth Resources Observation and Science (EROS) Center Science Processing Architecture (ESPA) on Demand Interface—User Guide. Available online: http://landsat.usgs.gov/documents/espa_odi_userguide.pdf (accessed on 8 March 2016).
- U.S. Geological Survey. Landsat Processing Details. Available online: http://landsat.usgs.gov/Landsat_Processing_Details.php (accessed on 8 March 2016).
- Zhu, Z.; Woodcock, C.E. Object-based cloud and cloud shadow detection in Landsat imagery. Remote Sens. Environ. 2012, 118, 83–94. [Google Scholar] [CrossRef]
- Zhu, Z.; Wang, S.; Woodcock, C.E. Improvement and expansion of the Fmask algorithm: Cloud, cloud shadow, and snow detection for Landsats 4–7, 8, and Sentinel 2 images. Remote Sens. Environ. 2015, 159, 269–277. [Google Scholar] [CrossRef]
- Zhu, Z.; Woodcock, C.E. Automated cloud, cloud shadow, and snow detection in multitemporal landsat data: An algorithm designed specifically for monitoring land cover change. Remote Sens. Environ. 2014, 152, 217–234. [Google Scholar] [CrossRef]
- Zhu, Z.; Woodcock, C.E.; Holden, C.; Yang, Z. Generating synthetic Landsat images based on all available Landsat data: Predicting Landsat surface reflectance at any given time. Remote Sens. Environ. 2015, 162, 67–83. [Google Scholar] [CrossRef]
- Davis, J.C.; Sampson, R.J. Statistics and Data Analysis in Geology; Wiley: New York, NY, USA, 1986; Volume 646. [Google Scholar]
- Rayner, J.N. Introduction to Spectral Analysis; Pion: London, UK, 1971. [Google Scholar]
- Breiman, L. Random forests. Mach. Learn. 2001, 45, 5–32. [Google Scholar] [CrossRef]
- Zhu, Z. Optimizing selection of training and auxillary data for operational land cover classification for the LCMAP initiative. ISPRS J. Photogramm. Remote Sens. 2016. submitted. [Google Scholar]
- U.S. Geological Survey. National Land Cover Database 2006 (NLCD 2006). Available online: http://www.mrlc.gov/nlcd2006.php (accessed on 11 March 2016).
- U.S. Fish and Wildlife Service. National Wetlands Inventory. Available online: http://www.fws.gov/wetlands/ (accessed on 8 March 2016).
- Natural Resources Conservation Service. Soil Survey Geographic Database. Available online: http://www.nrcs.usda.gov/wps/portal/nrcs/site/soils/home/ (accessed on 11 March 2016).
- Wilen, B.O.; Bates, M. The U.S. Fish and Wildlife Service’s National Wetlands Inventory project. In Classification and Inventory of the World’s Wetlands; Springer Netherlands: Dordrect, The Netherlands, 1995; pp. 153–169. [Google Scholar]


| Land Cover Class | Description |
|---|---|
| Open water | Areas persistently covered with water, such as streams, canals, lakes, reservoirs, bays, and oceans. |
| Developed (urban or otherwise built-up) | Areas of intensive use where much of the land is covered with structures or anthropogenic impervious surfaces (residential, commercial, industrial, roads, etc.) or less-intensive use where the land cover matrix includes both vegetation and structures (low-density residential, recreational facilities, cemeteries, utility corridors, etc.), including any land functionally related to urban or built-up environments (parks, golf courses, etc.). |
| Agriculture (cropland and pasture) | Land in either a vegetated or an unvegetated state used for the production of food and fiber, including cultivated and uncultivated croplands, haylands, pasture, orchards, vineyards, and confined livestock operations. Note that forest plantations are considered forests regardless of their use for wood products. |
| Forest and woodland | Non-developed land where the tree cover density is >10%. Note that cleared forest land (i.e., clearcuts) is mapped according to current cover (e.g., mechanically disturbed or grassland/shrubland). |
| Grassland/shrubland | Non-developed land where cover by grasses, forbs, and/or shrubs predominates and tree-cover density is <10%. |
| Wetland | Land where water saturation is the determining factor in soil characteristics, vegetation types, and animal communities. Wetlands can contain both water and vegetated cover. |
| Mines and quarries | Areas with extractive mining activities that have a significant surface expression, including mining buildings, quarry pits, overburden, leach, evaporative features, tailings, or other related components. |
| Barren | Land composed of soils, sand, or rocks where <10% of the area is vegetated. Does not include land in transition recently cleared by disturbance. |
| Mechanically disturbed | Land in an altered, often unvegetated transitional state caused by disturbance from mechanical means, as by forest clearcutting, earthmoving, scraping, chaining, reservoir drawdown, and other similar human-induced changes. |
| Non-mechanically disturbed | Land in an altered, often unvegetated transitional state caused by disturbance from non-mechanical means, as by fire, wind, flood, animals, and other similar phenomena. |
| Snow and ice | Land where the accumulation of snow and ice does not completely melt during summer (e.g., alpine glaciers and snowfields). |
| Circa 2000 Land Cover Trends | |||||||||||||
|---|---|---|---|---|---|---|---|---|---|---|---|---|---|
| Water | Developed | Disturbed | Mining | Barren | Forest | Grass/Shrub | Agriculture | Wetlands | Ice & Snow | Total | Agreement | ||
| Circa 2000 CCDC | Water | 462,323 | 4832 | 1301 | 615 | 6992 | 11,638 | 8910 | 11,907 | 11,395 | 0 | 519,913 | 89% |
| Developed | 4652 | 705,417 | 22,002 | 4237 | 2245 | 113,665 | 35,972 | 128,682 | 5009 | 0 | 1,021,881 | 69% | |
| Disturbed | 3137 | 9223 | 17,088 | 1298 | 969 | 30,110 | 162,546 | 107,305 | 7734 | 52 | 339,462 | 5% | |
| Mining | 747 | 14,105 | 2829 | 26,515 | 1423 | 5251 | 4611 | 13,700 | 595 | 0 | 69,776 | 38% | |
| Barren | 4274 | 833 | 51 | 20 | 120,469 | 11,994 | 24,645 | 2495 | 2176 | 9701 | 176,658 | 68% | |
| Forest | 19,043 | 118,687 | 169,391 | 2278 | 14,835 | 5,781,165 | 273,434 | 161,377 | 133,544 | 227 | 6,673,981 | 87% | |
| Grass/Shrub | 7402 | 28,907 | 45,205 | 883 | 19,596 | 205,283 | 3,958,903 | 292,673 | 19,373 | 2451 | 4,580,676 | 86% | |
| Agriculture | 15,242 | 98,464 | 9168 | 1801 | 437 | 116,467 | 161,455 | 5,891,790 | 55,527 | 0 | 6,350,351 | 93% | |
| Wetlands | 13,611 | 2102 | 11,446 | 155 | 1522 | 112,575 | 25,212 | 28,568 | 554,469 | 0 | 749,660 | 74% | |
| Ice & Snow | 5 | 0 | 0 | 0 | 5863 | 106 | 136 | 0 | 0 | 60,573 | 66,683 | 91% | |
| 530,436 | 982,570 | 278,481 | 37,802 | 174,351 | 6,388,254 | 4,655,824 | 6,638,497 | 789,822 | 73,004 | 85.5% | overall agreement | ||
| 87% | 72% | 6% | 70% | 69% | 90% | 85% | 89% | 70% | 83% | ||||
| Location | 13/29 NH/VT | 16/40 FL | 22/33 IL/IN | 23/37 AR/MS | 27/27 MN | 28/33 KS | 31/27 ND | 33/29 SD | 34/33 CO | 35/32 CO | 36/38 AZ | 39/26 MT | 43/34 CA | 46/27 WA |
|---|---|---|---|---|---|---|---|---|---|---|---|---|---|---|
| Overall agreement 2000 | 93.5% | 75.1% | 87.8% | 86.4% | 79.4% | 86.2% | 89.0% | 93.9% | 89.9% | 89.8% | 82.1% | 91.7% | 84.8% | 80.4% |
| Overall agreement 1992 | 93.8% | 76.9% | 87.7% | 87.4% | 79.2% | 85.8% | 87.7% | 89.9% | 90.0% | 89.3% | 97.6% | 89.5% | 78.9% | 80.3% |
| Washington 46/27 Trends/CCDC Agreement | |||||||||||||
|---|---|---|---|---|---|---|---|---|---|---|---|---|---|
| Circa 2000 Land Cover Trends | |||||||||||||
| Water | Developed | Disturbed | Mining | Barren | Forest | Grass/Shrub | Agriculture | Wetlands | Ice & Snow | Total | Agreement | ||
| Circa 2000 CCDC | Water | 199,996 | 1947 | 3 | 127 | 6810 | 2565 | 7 | 1074 | 1838 | 0 | 214,367 | 93% |
| Developed | 2789 | 406,045 | 15,638 | 3503 | 2147 | 99,507 | 12,121 | 50,405 | 2971 | 0 | 595,126 | 68% | |
| Disturbed | 107 | 2758 | 5782 | 486 | 43 | 4047 | 522 | 1032 | 146 | 52 | 14,975 | 39% | |
| Mining | 335 | 8606 | 2189 | 7155 | 1293 | 1995 | 311 | 707 | 121 | 0 | 22,712 | 32% | |
| Barren | 775 | 504 | 0 | 17 | 51,056 | 6582 | 4616 | 12 | 105 | 9701 | 73,368 | 70% | |
| Forest | 7654 | 91,646 | 71,903 | 1154 | 12,690 | 2 × 10⁶ | 100,308 | 19,146 | 23,476 | 227 | 2 × 10⁶ | 86% | |
| Grass/Shrub | 26 | 2217 | 38,632 | 112 | 9728 | 49,568 | 95,688 | 355 | 213 | 2451 | 198,990 | 48% | |
| Agriculture | 1895 | 32,531 | 1355 | 155 | 414 | 8105 | 1394 | 200,775 | 3969 | 0 | 250,593 | 80% | |
| Wetlands | 3577 | 1068 | 177 | 21 | 1364 | 6695 | 741 | 3777 | 25,504 | 0 | 42,924 | 59% | |
| Ice & Snow | 5 | 0 | 0 | 0 | 5863 | 106 | 136 | 0 | 0 | 60,573 | 66,683 | 91% | |
| Total | 217,159 | 547,322 | 135,679 | 12,730 | 91,408 | 2 × 10⁶ | 215,844 | 277,283 | 58,343 | 73,004 | 80.4% | Overall Agreement | |
| Agreement | 92% | 74% | 4% | 56% | 56% | 92% | 44% | 72% | 44% | 83% | |||
| California 43/34 Trends/CCDC Agreement | ||||||||||||
|---|---|---|---|---|---|---|---|---|---|---|---|---|
| Circa 2000 Land Cover Trends | ||||||||||||
| Water | Developed | Disturbed | Mining | Barren | Forest | Grass/Shrub | Agriculture | Wetlands | Total | Agreement | ||
| Circa 2000 CCDC | Water | 13,606 | 1405 | 1247 | 430 | 0 | 180 | 1537 | 2519 | 302 | 21,226 | 64% |
| Developed | 459 | 170,339 | 675 | 286 | 0 | 340 | 9954 | 44,284 | 121 | 226,458 | 75% | |
| Disturbed | 156 | 4158 | 907 | 522 | 0 | 736 | 36,406 | 86,812 | 799 | 130,496 | 1% | |
| Mining | 64 | 40 | 29 | 4817 | 0 | 569 | 1039 | 1337 | 53 | 7948 | 61% | |
| Barren | 33 | 0 | 22 | 0 | 2643 | 1203 | 3536 | 0 | 0 | 7437 | 36% | |
| Forest | 186 | 362 | 13,228 | 52 | 60 | 275,941 | 27,007 | 218 | 12 | 317,066 | 87% | |
| Grass/Shrub | 620 | 15,837 | 1124 | 470 | 72 | 31,394 | 518,106 | 53,435 | 1555 | 622,613 | 83% | |
| Agriculture | 2099 | 31,677 | 1207 | 998 | 0 | 1775 | 28,236 | 1,379,735 | 1365 | 1,447,092 | 95% | |
| Wetlands | 696 | 213 | 3 | 37 | 0 | 237 | 5766 | 2503 | 5590 | 15,045 | 37% | |
| Total | 17,919 | 224,031 | 18,442 | 7612 | 2775 | 312,375 | 631,587 | 1,570,843 | 9797 | 84.8% | Overall Agreement | |
| Agreement | 76% | 76% | 5% | 63% | 95% | 88% | 82% | 88% | 57% | |||
| Kansas 28/33 Trends/CCDC Agreement | ||||||||||||
|---|---|---|---|---|---|---|---|---|---|---|---|---|
| Circa 2000 Land Cover Trends | ||||||||||||
| Water | Developed | Disturbed | Mining | Barren | Forest | Grass/Shrub | Agriculture | Wetlands | Total | Agreement | ||
| Circa 2000 CCDC | Water | 22,263 | 392 | 0 | 9 | 65 | 537 | 3190 | 1519 | 592 | 28,567 | 78% |
| Developed | 131 | 16,170 | 0 | 8 | 5 | 375 | 1552 | 5216 | 34 | 23,491 | 69% | |
| Disturbed | 947 | 55 | 0 | 103 | 488 | 53 | 379 | 3839 | 337 | 6201 | 0% | |
| Mining | 59 | 1024 | 0 | 1712 | 0 | 98 | 1902 | 6127 | 80 | 11,002 | 16% | |
| Barren | 2372 | 22 | 0 | 0 | 1564 | 52 | 157 | 1266 | 620 | 6053 | 26% | |
| Forest | 289 | 758 | 4 | 6 | 91,109 | 16,012 | 19,539 | 1085 | 128,802 | 71% | ||
| Grass/Shrub | 3756 | 2756 | 32 | 161 | 21 | 28,292 | 1,088,300 | 159,808 | 718 | 1,283,844 | 85% | |
| Agriculture | 1828 | 5994 | 15 | 93 | 3 | 25,175 | 82,423 | 1,215,580 | 1446 | 1,332,557 | 91% | |
| Wetlands | 755 | 47 | 0 | 0 | 20 | 4920 | 329 | 2178 | 5853 | 14,102 | 42% | |
| Total | 32,400 | 27,218 | 51 | 2092 | 2166 | 150,611 | 1,194,244 | 1,415,072 | 10,765 | 86.2% | Overall Agreement | |
| Agreement | 69% | 59% | 0% | 82% | 72% | 60% | 91% | 86% | 54% | |||
| Minnesota 27/27 Trends/CCDC Agreement | ||||||||||||
|---|---|---|---|---|---|---|---|---|---|---|---|---|
| Circa 2000 Land Cover Trends | ||||||||||||
| Water | Developed | Disturbed | Mining | Barren | Forest | Grass/Shrub | Agriculture | Wetlands | Total | Agreement | ||
| Circa 2000 CCDC | Water | 77,559 | 104 | 15 | 30 | 0 | 1831 | 34 | 6 | 1649 | 81,228 | 95% |
| Developed | 162 | 4021 | 553 | 294 | 0 | 2485 | 416 | 1368 | 106 | 9405 | 43% | |
| Disturbed | 59 | 391 | 1247 | 14 | 0 | 219 | 123 | 74 | 503 | 2630 | 47% | |
| Mining | 74 | 93 | 101 | 7310 | 0 | 517 | 254 | 126 | 11 | 8486 | 86% | |
| Barren | 7 | 4 | 0 | 2 | 65 | 6 | 1 | 1 | 3 | 89 | 73% | |
| Forest | 4105 | 1564 | 47,315 | 838 | 0 | 695,183 | 22,649 | 10,375 | 58,469 | 8 × 10⁵ | 83% | |
| Grass/Shrub | 3 | 3 | 2979 | 0 | 0 | 1957 | 6278 | 591 | 603 | 12,414 | 51% | |
| Agriculture | 58 | 276 | 1252 | 147 | 0 | 9491 | 10,553 | 63,340 | 5229 | 90,346 | 70% | |
| Wetlands | 3529 | 97 | 9217 | 97 | 0 | 78,168 | 8427 | 5115 | 283,024 | 4 × 10⁵ | 73% | |
| Total | 85,556 | 6553 | 62,679 | 8732 | 65 | 789,857 | 48,735 | 80,996 | 349,597 | 79.4% | Overall Agreement | |
| Agreement | 91% | 61% | 2% | 84% | 100% | 88% | 13% | 78% | 81% | |||
| FOREST | ||||||||||||||||
|---|---|---|---|---|---|---|---|---|---|---|---|---|---|---|---|---|
| (a) Trends Forest Pixels/CCDC Classes | ||||||||||||||||
| NH/VT | FL | IL/IN | AR/MS | MN | KS | ND | SD | CO | CO | AZ | MT | CA | WA | |||
| path/row | 13/29 | 16/40 | 22/33 | 23/37 | 27/27 | 28/33 | 31/27 | 33/29 | 34/33 | 35/32 | 36/38 | 39/26 | 43/34 | 46/27 | Total | Dist. |
| Water | 1508 | 26 | 3700 | 860 | 1831 | 537 | 28 | 0 | 232 | 169 | 2 | 0 | 180 | 2565 | 11,638 | 0.2% |
| Developed | 4118 | 2410 | 2216 | 741 | 2485 | 375 | 62 | 0 | 1058 | 86 | 267 | 0 | 340 | 99,507 | 113,665 | 1.8% |
| Disturbed | 106 | 632 | 74 | 2205 | 219 | 53 | 1 | 28 | 18 | 5 | 21,986 | 0 | 736 | 4047 | 30,110 | 0.5% |
| Mining | 1371 | 3 | 265 | 404 | 517 | 98 | 0 | 0 | 28 | 0 | 1 | 0 | 569 | 1995 | 5251 | 0.1% |
| Barren | 2154 | 0 | 258 | 774 | 6 | 52 | 0 | 0 | 838 | 37 | 90 | 0 | 1203 | 6582 | 11,994 | 0.2% |
| Forest | 940,857 | 34,988 | 268,587 | 352,455 | 695,183 | 91,109 | 5405 | 100,139 | 572,227 | 362,365 | 38,500 | 31 | 275,941 | 2,043,378 | 5,781,165 | 90.5% |
| Grass/Shrub | 4988 | 567 | 1207 | 201 | 1957 | 28,292 | 259 | 1024 | 36,342 | 39,980 | 9501 | 3 | 31,394 | 49,568 | 205,283 | 3.2% |
| Agriculture | 4843 | 1166 | 41,492 | 22,570 | 9491 | 25,175 | 1035 | 94 | 608 | 87 | 22 | 4 | 1,775 | 8,105 | 116,467 | 1.8% |
| Wetland | 5884 | 4506 | 6942 | 3833 | 78,168 | 4920 | 41 | 62 | 366 | 921 | 0 | 0 | 237 | 6,695 | 112,575 | 1.8% |
| Ice & Snow | 0 | 0 | 0 | 0 | 0 | 0 | 0 | 0 | 0 | 0 | 0 | 0 | 0 | 106 | 106 | 0.0% |
| Total | 965,829 | 44,298 | 324,741 | 384,043 | 789,857 | 150,611 | 6831 | 101,347 | 611,717 | 403,650 | 70,369 | 38 | 312,375 | 2,222,548 | 6,388,254 | |
| “Producer’s” | 97.4% | 79.0% | 82.7% | 91.8% | 88.0% | 60.5% | 79.1% | 98.8% | 93.5% | 89.8% | 54.7% | 81.6% | 88.3% | 91.9% | 90.5% | All p/r |
| (b) CCDC Forest Pixels/Trends Classes | |||||||||||||
|---|---|---|---|---|---|---|---|---|---|---|---|---|---|
| Path/Row | Water | Dev | Disturbed | Mining | Barren | Forest | Grass/Shrub | Ag | Wetland | Ice & Snow | Total | “User’s” | |
| NH/VT | 13/29 | 1619 | 8338 | 7185 | 1 | 570 | 940,857 | 4797 | 7269 | 7370 | 0 | 978,006 | 96.2% |
| FL | 16/40 | 290 | 1686 | 7996 | 13 | 0 | 34,988 | 6310 | 1218 | 7005 | 0 | 59,506 | 58.8% |
| IL/IN | 22/33 | 2868 | 9465 | 76 | 208 | 0 | 268,587 | 720 | 63,014 | 8875 | 0 | 353,813 | 75.9% |
| AR/MS | 23/37 | 1631 | 1077 | 20,914 | 3 | 5 | 352,455 | 482 | 35,609 | 24,344 | 0 | 436,520 | 80.7% |
| MN | 27/27 | 4105 | 1564 | 47,315 | 838 | 0 | 695,183 | 22,649 | 10,375 | 58,469 | 0 | 840,498 | 82.7% |
| KS | 28/33 | 289 | 758 | 4 | 6 | 91,109 | 16,012 | 19,539 | 1085 | 0 | 128,802 | 70.7% | |
| ND | 31/27 | 154 | 67 | 0 | 0 | 0 | 5405 | 806 | 4541 | 674 | 0 | 11,647 | 46.4% |
| SD | 33/29 | 0 | 0 | 694 | 0 | 0 | 100,139 | 6530 | 1 | 1 | 0 | 107,365 | 93.3% |
| CO | 34/33 | 211 | 3720 | 8 | 3 | 1432 | 572,227 | 33,929 | 388 | 1395 | 0 | 613,313 | 93.3% |
| CO | 35/32 | 36 | 0 | 68 | 0 | 78 | 362,365 | 41,215 | 53 | 838 | 0 | 404,653 | 89.5% |
| AZ | 36/38 | 0 | 4 | 0 | 0 | 0 | 38,500 | 12,669 | 0 | 0 | 0 | 51,173 | 75.2% |
| MT | 39/26 | 0 | 0 | 0 | 0 | 0 | 31 | 6 | 0 | 0 | 37 | 83.8% | |
| CA | 43/34 | 186 | 362 | 13,228 | 52 | 60 | 275,941 | 27,007 | 218 | 12 | 0 | 317,066 | 87.0% |
| WA | 46/27 | 7654 | 91,646 | 71,903 | 1154 | 12,690 | 2,043,378 | 100,308 | 19,146 | 23,476 | 227 | 2,371,582 | 86.2% |
| Total | 19,043 | 118,687 | 169,391 | 2278 | 14,835 | 5,781,165 | 273,434 | 161,377 | 133,544 | 227 | 6,673,981 | 86.6% | |
| Dist. | 0.3% | 1.8% | 2.5% | 0.0% | 0.2% | 86.6% | 4.1% | 2.4% | 2.0% | 0.0% | All p/r | ||
| AGRICULTURE | ||||||||||||||||
|---|---|---|---|---|---|---|---|---|---|---|---|---|---|---|---|---|
| (a) Trends Agriculture Pixels/CCDC Classes | ||||||||||||||||
| NH/VT | FL | IL/IN | AR/MS | MN | KS | ND | SD | CO | CO | AZ | MT | CA | WA | |||
| path/row | 13/29 | 16/40 | 22/33 | 23/37 | 27/27 | 28/33 | 31/27 | 33/29 | 34/33 | 35/32 | 36/38 | 39/26 | 43/34 | 46/27 | Total | Dist. |
| Water | 2 | 111 | 3709 | 2055 | 6 | 1519 | 860 | 21 | 26 | 4 | 1 | 0 | 2519 | 1074 | 11,907 | 0.2% |
| Developed | 1342 | 2898 | 13,357 | 4391 | 1368 | 5216 | 3704 | 0 | 1096 | 232 | 208 | 181 | 44,284 | 50,405 | 128,682 | 1.9% |
| Disturbed | 8 | 164 | 2043 | 4742 | 74 | 3839 | 1583 | 13 | 557 | 187 | 1297 | 4954 | 86,812 | 1032 | 107,305 | 1.6% |
| Mining | 283 | 12 | 3831 | 464 | 126 | 6127 | 754 | 0 | 51 | 0 | 8 | 0 | 1337 | 707 | 13,700 | 0.2% |
| Barren | 16 | 0 | 197 | 946 | 1 | 1266 | 0 | 2 | 1 | 54 | 0 | 0 | 12 | 2495 | 0.0% | |
| Forest | 7269 | 1218 | 63,014 | 35,609 | 10,375 | 19,539 | 4541 | 1 | 388 | 53 | 0 | 6 | 218 | 19,146 | 161,377 | 2.4% |
| Grass/Shrub | 173 | 401 | 4925 | 1869 | 591 | 159,808 | 34,003 | 4732 | 3073 | 4153 | 1077 | 24,078 | 53,435 | 355 | 292,673 | 4.4% |
| Agriculture | 17,042 | 16,428 | 1,173,954 | 657,549 | 63,340 | 1,215,580 | 719,378 | 8906 | 47,227 | 10,349 | 2,891 | 378,636 | 1,379,735 | 200,775 | 5,891,790 | 88.8% |
| Wetland | 59 | 238 | 4442 | 2841 | 5115 | 2178 | 6576 | 0 | 11 | 201 | 0 | 627 | 2503 | 3777 | 28,568 | 0.4% |
| Ice & Snow | 0 | 0 | 0 | 0 | 0 | 0 | 0 | 0 | 0 | 0 | 0 | 0 | 0 | 0 | 0 | 0.0% |
| Total | 26,194 | 21,470 | 1,269,472 | 710,466 | 80,996 | 1,415,072 | 771,399 | 13,675 | 52,429 | 15,180 | 5536 | 408,482 | 1,570,843 | 277,283 | 6,638,497 | |
| “Producer’s” | 65.1% | 76.5% | 92.5% | 92.6% | 78.2% | 85.9% | 93.3% | 65.1% | 90.1% | 68.2% | 52.2% | 92.7% | 87.8% | 72.4% | 88.8% | All p/r |
| (b) CCDC Agriculture Pixels/Trends Classes | |||||||||||||
|---|---|---|---|---|---|---|---|---|---|---|---|---|---|
| Path/Row | Water | Dev | Disturbed | Mining | Barren | Forest | Grass/Shrub | Ag | Wetland | Ice & Snow | Total | “User’s” | |
| NH/VT | 13/29 | 35 | 1316 | 172 | 0 | 0 | 4843 | 65 | 17,042 | 113 | 0 | 23,586 | 72.3% |
| FL | 16/40 | 122 | 1936 | 622 | 6 | 0 | 1166 | 1181 | 16,428 | 550 | 0 | 22,011 | 74.6% |
| IL/IN | 22/33 | 3405 | 18,420 | 173 | 376 | 0 | 41,492 | 1380 | 1,173,954 | 8405 | 0 | 1,247,605 | 94.1% |
| AR/MS | 23/37 | 4617 | 5411 | 4372 | 7 | 7 | 22,570 | 1446 | 657,549 | 17,762 | 0 | 713,741 | 92.1% |
| MN | 27/27 | 58 | 276 | 1252 | 147 | 0 | 9491 | 10,553 | 63,340 | 5229 | 0 | 90,346 | 70.1% |
| KS | 28/33 | 1828 | 5994 | 15 | 93 | 3 | 25,175 | 82,423 | 1,215,580 | 1446 | 0 | 1,332,557 | 91.2% |
| ND | 31/27 | 1162 | 499 | 0 | 16 | 0 | 1035 | 19,354 | 719,378 | 15,383 | 0 | 756,827 | 95.1% |
| SD | 33/29 | 0 | 0 | 0 | 0 | 1 | 94 | 2061 | 8906 | 0 | 0 | 11,062 | 80.5% |
| CO | 34/33 | 14 | 320 | 0 | 3 | 5 | 608 | 1180 | 47,227 | 678 | 0 | 50,035 | 94.4% |
| CO | 35/32 | 5 | 1 | 0 | 0 | 1 | 87 | 1823 | 10,349 | 289 | 0 | 12,555 | 82.4% |
| AZ | 36/38 | 1 | 70 | 0 | 0 | 6 | 22 | 405 | 2891 | 0 | 0 | 3395 | 85.2% |
| MT | 39/26 | 1 | 13 | 0 | 0 | 0 | 4 | 9954 | 378,636 | 338 | 0 | 388,946 | 97.3% |
| CA | 43/34 | 2099 | 31,677 | 1207 | 998 | 0 | 1775 | 28,236 | 1,379,735 | 1365 | 0 | 1,447,092 | 95.3% |
| WA | 46/27 | 1895 | 32,531 | 1355 | 155 | 414 | 8105 | 1394 | 200,775 | 3969 | 0 | 250,593 | 80.1% |
| Total | 15,242 | 98,464 | 9168 | 1801 | 437 | 116,467 | 161,455 | 5,891,790 | 55,527 | 0 | 6,350,351 | 92.8% | |
| Dist. | 0.2% | 1.6% | 0.1% | 0.0% | 0.0% | 1.8% | 2.5% | 92.8% | 0.9% | 0.0% | All p/r | ||
| GRASS/SHRUB | ||||||||||||||||
|---|---|---|---|---|---|---|---|---|---|---|---|---|---|---|---|---|
| (a) Trends Grass/Shrub Pixels/CCDC Classes | ||||||||||||||||
| NH/VT | FL | IL/IN | AR/MS | MN | KS | ND | SD | CO | CO | AZ | MT | CA | WA | |||
| path/row | 13/29 | 16/40 | 22/33 | 23/37 | 27/27 | 28/33 | 31/27 | 33/29 | 34/33 | 35/32 | 36/38 | 39/26 | 43/34 | 46/27 | Total | Dist. |
| Water | 3 | 25 | 63 | 19 | 34 | 3190 | 2191 | 1572 | 51 | 205 | 11 | 2 | 1537 | 7 | 8910 | 0.2% |
| Developed | 75 | 716 | 293 | 14 | 416 | 1552 | 509 | 0 | 1148 | 604 | 8249 | 321 | 9954 | 12,121 | 35,972 | 0.8% |
| Disturbed | 15 | 974 | 6 | 31 | 123 | 379 | 92 | 2979 | 1534 | 446 | 117,790 | 1249 | 36,406 | 522 | 162,546 | 3.5% |
| Mining | 50 | 6 | 114 | 4 | 254 | 1902 | 283 | 0 | 628 | 18 | 2 | 0 | 1039 | 311 | 4611 | 0.1% |
| Barren | 98 | 0 | 0 | 0 | 1 | 157 | 0 | 7420 | 3849 | 2779 | 2189 | 0 | 3536 | 4616 | 24,645 | 0.5% |
| Forest | 4797 | 6310 | 720 | 482 | 22,649 | 16,012 | 806 | 6530 | 33,929 | 41,215 | 12,669 | 0 | 27,007 | 100,308 | 273,434 | 5.9% |
| Grass/Shrub | 4033 | 5173 | 2438 | 6480 | 6278 | 1,088,300 | 122,322 | 363,773 | 354,855 | 513,857 | 776,649 | 100,951 | 518,106 | 95,688 | 3,958,903 | 85.0% |
| Agriculture | 65 | 1181 | 1380 | 1446 | 10,553 | 82,423 | 19,354 | 2061 | 1180 | 1823 | 405 | 9954 | 28,236 | 1394 | 161,455 | 3.5% |
| Wetland | 117 | 495 | 42 | 87 | 8,427 | 329 | 2221 | 443 | 3076 | 2600 | 0 | 868 | 5766 | 741 | 25,212 | 0.5% |
| Ice & Snow | 0 | 0 | 0 | 0 | 0 | 0 | 0 | 0 | 0 | 0 | 0 | 0 | 0 | 136 | 136 | 0.0% |
| Total | 9253 | 14,880 | 5056 | 8563 | 48,735 | 1,194,244 | 147,778 | 384,778 | 400,250 | 563,547 | 917,964 | 113,345 | 631,587 | 215,844 | 4,655,824 | |
| “Producer’s” | 43.6% | 34.8% | 48.2% | 75.7% | 12.9% | 91.1% | 82.8% | 94.5% | 88.7% | 91.2% | 84.6% | 89.1% | 82.0% | 44.3% | 85.0% | All p/r |
| (b) CCDC Grass/Shrub Pixels/Trends Classes | |||||||||||||
|---|---|---|---|---|---|---|---|---|---|---|---|---|---|
| path/row | Water | Dev | Disturbed | Mining | Barren | Forest | Grass/Shrub | Ag | Wetland | Ice & Snow | Total | “User’s” | |
| NH/VT | 13/29 | 2 | 334 | 1178 | 6 | 4988 | 4033 | 173 | 46 | 0 | 10,760 | 37.5% | |
| FL | 16/40 | 41 | 133 | 748 | 0 | 0 | 567 | 5173 | 401 | 677 | 0 | 7740 | 66.8% |
| IL/IN | 22/33 | 175 | 424 | 12 | 26 | 0 | 1207 | 2438 | 4925 | 362 | 0 | 9569 | 25.5% |
| AR/MS | 23/37 | 15 | 4 | 394 | 201 | 6480 | 1869 | 655 | 0 | 9618 | 67.4% | ||
| MN | 27/27 | 3 | 3 | 2979 | 0 | 0 | 1957 | 6278 | 591 | 603 | 0 | 12,414 | 50.6% |
| KS | 28/33 | 3756 | 2756 | 32 | 161 | 21 | 28,292 | 1,088,300 | 159,808 | 718 | 0 | 1,283,844 | 84.8% |
| ND | 31/27 | 2382 | 327 | 5 | 4 | 0 | 259 | 122,322 | 34,003 | 5395 | 0 | 164,697 | 74.3% |
| SD | 33/29 | 119 | 0 | 67 | 0 | 5838 | 1024 | 363,773 | 4732 | 2 | 0 | 375,555 | 96.9% |
| CO | 34/33 | 182 | 5248 | 1 | 81 | 3149 | 36,342 | 354,855 | 3073 | 5931 | 0 | 408,862 | 86.8% |
| CO | 35/32 | 10 | 15 | 33 | 0 | 712 | 39,980 | 513,857 | 4153 | 2355 | 0 | 561,115 | 91.6% |
| AZ | 36/38 | 47 | 1581 | 0 | 29 | 70 | 9501 | 776,649 | 1077 | 0 | 0 | 788,954 | 98.4% |
| MT | 39/26 | 24 | 28 | 0 | 0 | 0 | 3 | 100,951 | 24,078 | 861 | 0 | 125,945 | 80.2% |
| CA | 43/34 | 620 | 15,837 | 1124 | 470 | 72 | 31,394 | 518,106 | 53,435 | 1555 | 0 | 622,613 | 83.2% |
| WA | 46/27 | 26 | 2217 | 38,632 | 112 | 9728 | 49,568 | 95,688 | 355 | 213 | 0 | 196,539 | 48.7% |
| Total | 7402 | 28,907 | 45,205 | 883 | 19,596 | 205,283 | 3,958,903 | 292,673 | 19,373 | 0 | 4,578,225 | 86.5% | |
| Dist. | 0.2% | 0.6% | 1.0% | 0.0% | 0.4% | 4.5% | 86.5% | 6.4% | 0.4% | 0.0% | All p/r | ||
| DEVELOPED | ||||||||||||||||
|---|---|---|---|---|---|---|---|---|---|---|---|---|---|---|---|---|
| (a) Trends Developed Pixels/CCDC Classes | ||||||||||||||||
| NH/VT | FL | IL/IN | AR/MS | MN | KS | ND | SD | CO | CO | AZ | MT | CA | WA | |||
| path/row | 13/29 | 16/40 | 22/33 | 23/37 | 27/27 | 28/33 | 31/27 | 33/29 | 34/33 | 35/32 | 36/38 | 39/26 | 43/34 | 46/27 | Total | Dist. |
| Water | 15 | 227 | 605 | 71 | 104 | 392 | 37 | 0 | 23 | 0 | 6 | 0 | 1405 | 1947 | 4832 | 0.5% |
| Developed | 6795 | 32,393 | 44,060 | 5214 | 4021 | 16,170 | 3294 | 0 | 12,553 | 234 | 3471 | 828 | 170,339 | 406,045 | 705,417 | 71.8% |
| Disturbed | 23 | 283 | 205 | 97 | 391 | 55 | 10 | 0 | 24 | 0 | 1218 | 1 | 4158 | 2758 | 9223 | 0.9% |
| Mining | 1140 | 72 | 2553 | 117 | 93 | 1024 | 16 | 0 | 439 | 0 | 5 | 0 | 40 | 8606 | 14,105 | 1.4% |
| Barren | 68 | 0 | 10 | 20 | 4 | 22 | 0 | 0 | 1 | 0 | 204 | 0 | 0 | 504 | 833 | 0.1% |
| Forest | 8338 | 1686 | 9465 | 1077 | 1564 | 758 | 67 | 0 | 3720 | 0 | 4 | 0 | 362 | 91,646 | 118,687 | 12.1% |
| Grass/Shrub | 334 | 133 | 424 | 4 | 3 | 2756 | 327 | 0 | 5248 | 15 | 1581 | 28 | 15,837 | 2217 | 28,907 | 2.9% |
| Agriculture | 1316 | 1936 | 18,420 | 5411 | 276 | 5994 | 499 | 0 | 320 | 1 | 70 | 13 | 31,677 | 32,531 | 98,464 | 10.0% |
| Wetland | 81 | 466 | 78 | 18 | 97 | 47 | 31 | 0 | 2 | 1 | 0 | 0 | 213 | 1068 | 2102 | 0.2% |
| Ice & Snow | 0 | 0 | 0 | 0 | 0 | 0 | 0 | 0 | 0 | 0 | 0 | 0 | 0 | 0 | 0 | 0.0% |
| Total | 18,110 | 37,196 | 75,820 | 12,029 | 6553 | 27,218 | 4281 | 0 | 22,330 | 251 | 6559 | 870 | 224,031 | 547,322 | 982,570 | |
| “Producer’s” | 37.5% | 87.1% | 58.1% | 43.3% | 61.4% | 59.4% | 76.9% | na | 56.2% | 93.2% | 52.9% | 95.2% | 76.0% | 74.2% | 71.8% | All p/r |
| (b) CCDC Developed Pixels/Trends Classes | |||||||||||||
|---|---|---|---|---|---|---|---|---|---|---|---|---|---|
| Path/Row | Water | Dev | Disturbed | Mining | Barren | Forest | Grass/Shrub | Ag | Wetland | Ice & Snow | Total | “User’s” | |
| NH/VT | 13/29 | 41 | 6795 | 176 | 3 | 7 | 4118 | 75 | 1342 | 160 | 0 | 12,717 | 53.4% |
| FL | 16/40 | 559 | 32,393 | 1151 | 25 | 0 | 2410 | 716 | 2898 | 893 | 0 | 41,045 | 78.9% |
| IL/IN | 22/33 | 229 | 44,060 | 76 | 55 | 0 | 2216 | 293 | 13,357 | 301 | 0 | 60,587 | 72.7% |
| AR/MS | 23/37 | 162 | 5214 | 3729 | 1 | 1 | 741 | 14 | 4391 | 111 | 0 | 14,364 | 36.3% |
| MN | 27/27 | 162 | 4021 | 553 | 294 | 0 | 2485 | 416 | 1368 | 106 | 0 | 9405 | 42.8% |
| KS | 28/33 | 131 | 16,170 | 0 | 8 | 5 | 375 | 1552 | 5216 | 34 | 0 | 23,491 | 68.8% |
| ND | 31/27 | 23 | 3294 | 4 | 55 | 0 | 62 | 509 | 3704 | 130 | 0 | 7781 | 42.3% |
| SD | 33/29 | 0 | 0 | 0 | 0 | 0 | 0 | 0 | 0 | 0 | 0 | 0 | na |
| CO | 34/33 | 11 | 12,553 | 0 | 2 | 2 | 1058 | 1148 | 1096 | 12 | 0 | 15,882 | 79.0% |
| CO | 35/32 | 0 | 234 | 0 | 0 | 0 | 86 | 604 | 232 | 113 | 0 | 1269 | 18.4% |
| AZ | 36/38 | 26 | 3471 | 0 | 5 | 83 | 267 | 8249 | 208 | 0 | 0 | 12,309 | 28.2% |
| MT | 39/26 | 60 | 828 | 0 | 0 | 0 | 0 | 321 | 181 | 57 | 0 | 1447 | 57.2% |
| CA | 43/34 | 459 | 170,339 | 675 | 286 | 0 | 340 | 9954 | 44,284 | 121 | 0 | 226,458 | 75.2% |
| WA | 46/27 | 2789 | 406,045 | 15,638 | 3503 | 2147 | 99,507 | 12,121 | 50,405 | 2971 | 0 | 595,126 | 68.2% |
| Total | 4652 | 705,417 | 22,002 | 4237 | 2245 | 113,665 | 35,972 | 128,682 | 5009 | 0 | 1,021,881 | 69.0% | |
| Dist. | 0.5% | 69.0% | 2.2% | 0.4% | 0.2% | 11.1% | 3.5% | 12.6% | 0.5% | 0.0% | All p/r | ||
| WETLAND | ||||||||||||||||
|---|---|---|---|---|---|---|---|---|---|---|---|---|---|---|---|---|
| (a) Trends Wetland Pixels across CCDC Classes | ||||||||||||||||
| NH/VT | FL | IL/IN | AR/MS | MN | KS | ND | SD | CO | CO | AZ | MT | CA | WA | |||
| path/row | 13/29 | 16/40 | 22/33 | 23/37 | 27/27 | 28/33 | 31/27 | 33/29 | 34/33 | 35/32 | 36/38 | 39/26 | 43/34 | 46/27 | Total | Dist. |
| Water | 804 | 276 | 1521 | 1132 | 1649 | 592 | 2710 | 0 | 85 | 486 | 0 | 0 | 302 | 1838 | 11,395 | 1.4% |
| Developed | 160 | 893 | 301 | 111 | 106 | 34 | 130 | 0 | 12 | 113 | 0 | 57 | 121 | 2971 | 5009 | 0.6% |
| Disturbed | 17 | 3056 | 49 | 469 | 503 | 337 | 186 | 0 | 2,105 | 9 | 0 | 58 | 799 | 146 | 7734 | 1.0% |
| Mining | 209 | 1 | 7 | 56 | 11 | 80 | 4 | 0 | 52 | 1 | 0 | 0 | 53 | 121 | 595 | 0.1% |
| Barren | 156 | 0 | 165 | 792 | 3 | 620 | 0 | 0 | 0 | 335 | 0 | 0 | 0 | 105 | 2176 | 0.3% |
| Forest | 7370 | 7005 | 8875 | 24,344 | 58,469 | 1085 | 674 | 1 | 1395 | 838 | 0 | 0 | 12 | 23,476 | 133,544 | 16.9% |
| Grass/Shrub | 46 | 677 | 362 | 655 | 603 | 718 | 5395 | 2 | 5931 | 2355 | 0 | 861 | 1555 | 213 | 19,373 | 2.5% |
| Agriculture | 113 | 550 | 8405 | 17,762 | 5229 | 1446 | 15,383 | 0 | 678 | 289 | 0 | 338 | 1365 | 3969 | 55,527 | 7.0% |
| Wetland | 18,188 | 33,424 | 47,659 | 84,884 | 283,024 | 5853 | 17,425 | 160 | 25,948 | 5463 | 0 | 1347 | 5590 | 25,504 | 554,469 | 70.2% |
| Ice & Snow | 0 | 0 | 0 | 0 | 0 | 0 | 0 | 0 | 0 | 0 | 0 | 0 | 0 | 0 | 0 | 0.0% |
| Total | 27,063 | 45,882 | 67,344 | 130,205 | 349,597 | 10,765 | 41,907 | 163 | 36,206 | 9889 | 0 | 2661 | 9797 | 58,343 | 789,822 | |
| “Producer’s” | 67.2% | 72.8% | 70.8% | 65.2% | 81.0% | 54.4% | 41.6% | 98.2% | 71.7% | 55.2% | na | 50.6% | 57.1% | 43.7% | 70.2% | All p/r |
| (b) CCDC Wetland Pixels/Trends Classes | |||||||||||||
|---|---|---|---|---|---|---|---|---|---|---|---|---|---|
| Path/Row | Water | Dev | Disturbed | Mining | Barren | Forest | Grass/Shrub | Ag | Wetland | Ice & Snow | Total | “User’s” | |
| NH/VT | 13/29 | 881 | 81 | 271 | 9 | 5884 | 117 | 59 | 18,188 | 0 | 25,490 | 71.4% | |
| FL | 16/40 | 499 | 466 | 1,571 | 0 | 0 | 4506 | 495 | 238 | 33,424 | 0 | 41,199 | 81.1% |
| IL/IN | 22/33 | 775 | 78 | 0 | 0 | 1 | 6942 | 42 | 4442 | 47,659 | 0 | 59,939 | 79.5% |
| AR/MS | 23/37 | 876 | 18 | 205 | 3833 | 87 | 2841 | 84,884 | 0 | 92,744 | 91.5% | ||
| MN | 27/27 | 3529 | 97 | 9,217 | 97 | 0 | 78,168 | 8427 | 5115 | 283,024 | 0 | 387,674 | 73.0% |
| KS | 28/33 | 755 | 47 | 0 | 0 | 20 | 4920 | 329 | 2178 | 5853 | 0 | 14,102 | 41.5% |
| ND | 31/27 | 1943 | 31 | 0 | 0 | 0 | 41 | 2221 | 6576 | 17,425 | 0 | 28,237 | 61.7% |
| SD | 33/29 | 0 | 0 | 0 | 0 | 0 | 62 | 443 | 0 | 160 | 0 | 665 | 24.1% |
| CO | 34/33 | 27 | 2 | 2 | 0 | 0 | 366 | 3076 | 11 | 25,948 | 0 | 29,432 | 88.2% |
| CO | 35/32 | 47 | 1 | 0 | 0 | 128 | 921 | 2600 | 201 | 5463 | 0 | 9361 | 58.4% |
| AZ | 36/38 | 0 | 0 | 0 | 0 | 0 | 0 | 0 | 0 | 0 | 0 | 0 | na |
| MT | 39/26 | 6 | 0 | 0 | 0 | 0 | 0 | 868 | 627 | 1347 | 0 | 2848 | 47.3% |
| CA | 43/34 | 696 | 213 | 3 | 37 | 0 | 237 | 5766 | 2503 | 5590 | 0 | 15,045 | 37.2% |
| WA | 46/27 | 3577 | 1068 | 177 | 21 | 1364 | 6695 | 741 | 3777 | 25,504 | 0 | 42,924 | 59.4% |
| Total | 13,611 | 2102 | 11,446 | 155 | 1522 | 112,575 | 25,212 | 28,568 | 554,469 | 0 | 749,660 | 74.0% | |
| Dist. | 1.8% | 0.3% | 1.5% | 0.0% | 0.2% | 15.0% | 3.4% | 3.8% | 74.0% | 0.0% | All p/r | ||
| WATER | ||||||||||||||||
|---|---|---|---|---|---|---|---|---|---|---|---|---|---|---|---|---|
| (a) Trends Water/CCDC Classes | ||||||||||||||||
| NH/VT | FL | IL/IN | AR/MS | MN | KS | ND | SD | CO | CO | AZ | MT | CA | WA | |||
| path/row | 13/29 | 16/40 | 22/33 | 23/37 | 27/27 | 28/33 | 31/27 | 33/29 | 34/33 | 35/32 | 36/38 | 39/26 | 43/34 | 46/27 | Total | Dist. |
| Water | 47,892 | 41,807 | 16,232 | 18,176 | 77,559 | 22,263 | 18,915 | 1188 | 3374 | 1248 | 57 | 10 | 13,606 | 199,996 | 462,323 | 87.2% |
| Developed | 41 | 559 | 229 | 162 | 162 | 131 | 23 | 0 | 11 | 0 | 26 | 60 | 459 | 2789 | 4652 | 0.9% |
| Disturbed | 2 | 131 | 291 | 1,194 | 59 | 947 | 39 | 168 | 0 | 8 | 35 | 0 | 156 | 107 | 3,137 | 0.6% |
| Mining | 16 | 0 | 148 | 44 | 74 | 59 | 1 | 0 | 6 | 0 | 0 | 0 | 64 | 335 | 747 | 0.1% |
| Barren | 56 | 0 | 529 | 459 | 7 | 2372 | 0 | 2 | 0 | 22 | 19 | 0 | 33 | 775 | 4274 | 0.8% |
| Forest | 1619 | 290 | 2868 | 1631 | 4105 | 289 | 154 | 0 | 211 | 36 | 0 | 0 | 186 | 7654 | 19,043 | 3.6% |
| Grass/Shrub | 2 | 41 | 175 | 15 | 3 | 3756 | 2382 | 119 | 182 | 10 | 47 | 24 | 620 | 26 | 7402 | 1.4% |
| Agriculture | 35 | 122 | 3405 | 4617 | 58 | 1828 | 1162 | 0 | 14 | 5 | 1 | 1 | 2099 | 1895 | 15,242 | 2.9% |
| Wetland | 881 | 499 | 775 | 876 | 3529 | 755 | 1943 | 0 | 27 | 47 | 0 | 6 | 696 | 3577 | 13,611 | 2.6% |
| Ice & Snow | 0 | 0 | 0 | 0 | 0 | 0 | 0 | 0 | 0 | 0 | 0 | 0 | 0 | 5 | 5 | 0.0% |
| Total | 50,544 | 43,449 | 24,652 | 27,174 | 85,556 | 32,400 | 24,619 | 1477 | 3825 | 1376 | 185 | 101 | 17,919 | 217,159 | 530,436 | |
| “Producer’s” | 94.8% | 96.2% | 65.8% | 66.9% | 90.7% | 68.7% | 76.8% | 80.4% | 88.2% | 90.7% | 30.8% | 9.9% | 75.9% | 92.1% | 87.2% | All p/r |
| (b) CCDC Water Pixels/Trends Classes | |||||||||||||
|---|---|---|---|---|---|---|---|---|---|---|---|---|---|
| Path/Row | Water | Dev | Disturbed | Mining | Barren | Forest | Grass/Shrub | Ag | Wetland | Ice & Snow | Total | “User’s” | |
| NH/VT | 13/29 | 47,892 | 15 | 6 | 0 | 0 | 1508 | 3 | 2 | 804 | 0 | 50,230 | 95.3% |
| FL | 16/40 | 41,807 | 227 | 5 | 0 | 0 | 26 | 25 | 111 | 276 | 0 | 42,477 | 98.4% |
| IL/IN | 22/33 | 16,232 | 605 | 4 | 9 | 11 | 3700 | 63 | 3709 | 1521 | 0 | 25,854 | 62.8% |
| AR/MS | 23/37 | 18,176 | 71 | 21 | 10 | 0 | 860 | 19 | 2055 | 1132 | 0 | 22,344 | 81.3% |
| MN | 27/27 | 77,559 | 104 | 15 | 30 | 0 | 1831 | 34 | 6 | 1649 | 0 | 81,228 | 95.5% |
| KS | 28/33 | 22,263 | 392 | 0 | 9 | 65 | 537 | 3190 | 1519 | 592 | 0 | 28,567 | 77.9% |
| ND | 31/27 | 18,915 | 37 | 0 | 0 | 0 | 28 | 2191 | 860 | 2710 | 0 | 24,741 | 76.5% |
| SD | 33/29 | 1188 | 0 | 0 | 0 | 92 | 0 | 1572 | 21 | 0 | 0 | 2873 | 41.4% |
| CO | 34/33 | 3374 | 23 | 0 | 0 | 1 | 232 | 51 | 26 | 85 | 0 | 3792 | 89.0% |
| CO | 35/32 | 1248 | 0 | 0 | 0 | 13 | 169 | 205 | 4 | 486 | 0 | 2125 | 58.7% |
| AZ | 36/38 | 57 | 6 | 0 | 0 | 0 | 2 | 11 | 1 | 0 | 0 | 77 | 74.0% |
| MT | 39/26 | 10 | 0 | 0 | 0 | 0 | 2 | 0 | 0 | 0 | 12 | 83.3% | |
| CA | 43/34 | 13,606 | 1405 | 1247 | 430 | 0 | 180 | 1537 | 2519 | 302 | 0 | 21,226 | 64.1% |
| WA | 46/27 | 199,996 | 1947 | 3 | 127 | 6810 | 2565 | 7 | 1074 | 1838 | 0 | 214,367 | 93.3% |
| Total | 462,323 | 4832 | 1301 | 615 | 6992 | 11,638 | 8910 | 11,907 | 11,395 | 0 | 519,913 | 88.9% | |
| Dist. | 88.9% | 0.9% | 0.3% | 0.1% | 1.3% | 2.2% | 1.7% | 2.3% | 2.2% | 0.0% | All p/r | ||
| BARREN | ||||||||||||||||
|---|---|---|---|---|---|---|---|---|---|---|---|---|---|---|---|---|
| (a) Trends Barren Pixels/Trends Classes | ||||||||||||||||
| NH/VT | FL | IL/IN | AR/MS | MN | KS | ND | SD | CO | CO | AZ | MT | CA | WA | |||
| path/row | 13/29 | 16/40 | 22/33 | 23/37 | 27/27 | 28/33 | 31/27 | 33/29 | 34/33 | 35/32 | 36/38 | 39/26 | 43/34 | 46/27 | Total | Dist. |
| Water | 0 | 0 | 11 | 0 | 0 | 65 | 0 | 92 | 1 | 13 | 0 | 0 | 0 | 6810 | 6992 | 4.0% |
| Developed | 7 | 0 | 0 | 1 | 0 | 5 | 0 | 0 | 2 | 0 | 83 | 0 | 0 | 2147 | 2245 | 1.3% |
| Disturbed | 0 | 0 | 1 | 1 | 0 | 488 | 0 | 39 | 1 | 8 | 388 | 0 | 0 | 43 | 969 | 0.6% |
| Mining | 59 | 0 | 1 | 2 | 0 | 0 | 0 | 0 | 68 | 0 | 0 | 0 | 0 | 1293 | 1423 | 0.8% |
| Barren | 1826 | 0 | 159 | 562 | 65 | 1564 | 0 | 46,169 | 12,185 | 3275 | 965 | 0 | 2643 | 51,056 | 120,469 | 69.1% |
| Forest | 570 | 0 | 0 | 5 | 0 | 0 | 0 | 1432 | 78 | 0 | 0 | 60 | 12,690 | 14,835 | 8.5% | |
| Grass/Shrub | 6 | 0 | 0 | 0 | 0 | 21 | 0 | 5838 | 3149 | 712 | 70 | 0 | 72 | 9728 | 19,596 | 11.2% |
| Agriculture | 0 | 0 | 0 | 7 | 0 | 3 | 0 | 1 | 5 | 1 | 6 | 0 | 0 | 414 | 437 | 0.3% |
| Wetland | 9 | 0 | 1 | 0 | 0 | 20 | 0 | 0 | 0 | 128 | 0 | 0 | 0 | 1364 | 1522 | 0.9% |
| Ice & Snow | 0 | 0 | 0 | 0 | 0 | 0 | 0 | 0 | 0 | 0 | 0 | 0 | 0 | 5863 | 5863 | 3.4% |
| Total | 2477 | 0 | 173 | 578 | 65 | 2166 | 0 | 52,139 | 16,843 | 4215 | 1512 | 0 | 2,775 | 91,408 | 174,351 | |
| “Producer’s” | 9.0% | na | 91.9% | 97.2% | 100.0% | 72.2% | na | 88.5% | 72.3% | 77.7% | 63.8% | na | 95.2% | 55.9% | 69.1% | All p/r |
| (b) CCDC Barren Pixels/Trends Classes | |||||||||||||
|---|---|---|---|---|---|---|---|---|---|---|---|---|---|
| Path/Row | Water | Dev | Disturbed | Mining | Barren | Forest | Grass/Shrub | Ag | Wetland | Ice & Snow | Total | “User’s” | |
| NH/VT | 13/29 | 56 | 68 | 18 | 1826 | 2154 | 98 | 16 | 156 | 0 | 4392 | 41.6% | |
| FL | 16/40 | 0 | 0 | 0 | 0 | 0 | 0 | 0 | 0 | 0 | 0 | 0 | na |
| IL/IN | 22/33 | 529 | 10 | 0 | 0 | 159 | 258 | 0 | 197 | 165 | 0 | 1318 | 12.1% |
| AR/MS | 23/37 | 459 | 20 | 11 | 1 | 562 | 774 | 0 | 946 | 792 | 0 | 3565 | 15.8% |
| MN | 27/27 | 7 | 4 | 0 | 2 | 65 | 6 | 1 | 1 | 3 | 0 | 89 | 73.0% |
| KS | 28/33 | 2372 | 22 | 0 | 0 | 1564 | 52 | 157 | 1266 | 620 | 0 | 6053 | 25.8% |
| ND | 31/27 | 0 | 0 | 0 | 0 | 0 | 0 | 0 | 0 | 0 | 0 | 0 | na |
| SD | 33/29 | 2 | 0 | 0 | 0 | 46,169 | 0 | 7420 | 2 | 0 | 0 | 53,593 | 86.1% |
| CO | 34/33 | 0 | 1 | 0 | 0 | 12,185 | 838 | 3849 | 0 | 0 | 0 | 16,873 | 72.2% |
| CO | 35/32 | 22 | 0 | 0 | 0 | 3275 | 37 | 2779 | 1 | 335 | 0 | 6449 | 50.8% |
| AZ | 36/38 | 19 | 204 | 0 | 0 | 965 | 90 | 2189 | 54 | 0 | 0 | 3521 | 27.4% |
| MT | 39/26 | 0 | 0 | 0 | 0 | 0 | 0 | 0 | 0 | 0 | 0 | 0 | na |
| CA | 43/34 | 33 | 0 | 22 | 0 | 2643 | 1203 | 3536 | 0 | 0 | 0 | 7437 | 35.5% |
| WA | 46/27 | 775 | 504 | 0 | 17 | 51,056 | 6582 | 4616 | 12 | 105 | 9701 | 73,368 | 69.6% |
| Total | 4274 | 833 | 51 | 20 | 120,469 | 11,994 | 24,645 | 2495 | 2176 | 9701 | 176,658 | 68.2% | |
| Dist. | 2.4% | 0.5% | 0.0% | 0.0% | 68.2% | 6.8% | 14.0% | 1.4% | 1.2% | 5.5% | All p/r | ||
| MINING | ||||||||||||||||
|---|---|---|---|---|---|---|---|---|---|---|---|---|---|---|---|---|
| (a) Trends Mining Pixels/CCDC Classes | ||||||||||||||||
| NH/VT | FL | IL/IN | AR/MS | MN | KS | ND | SD | CO | CO | AZ | MT | CA | WA | |||
| path/row | 13/29 | 16/40 | 22/33 | 23/37 | 27/27 | 28/33 | 31/27 | 33/29 | 34/33 | 35/32 | 36/38 | 39/26 | 43/34 | 46/27 | Total | Dist. |
| Water | 0 | 0 | 9 | 10 | 30 | 9 | 0 | 0 | 0 | 0 | 0 | 0 | 430 | 127 | 615 | 1.6% |
| Developed | 3 | 25 | 55 | 1 | 294 | 8 | 55 | 0 | 2 | 0 | 5 | 0 | 286 | 3503 | 4237 | 11.2% |
| Disturbed | 0 | 3 | 135 | 1 | 14 | 103 | 29 | 0 | 5 | 0 | 0 | 0 | 522 | 486 | 1298 | 3.4% |
| Mining | 595 | 215 | 2822 | 379 | 7310 | 1712 | 364 | 0 | 981 | 57 | 108 | 0 | 4817 | 7155 | 26,515 | 70.1% |
| Barren | 0 | 0 | 0 | 1 | 2 | 0 | 0 | 0 | 0 | 0 | 0 | 0 | 0 | 17 | 20 | 0.1% |
| Forest | 1 | 13 | 208 | 3 | 838 | 6 | 0 | 0 | 3 | 0 | 0 | 0 | 52 | 1154 | 2278 | 6.0% |
| Grass/Shrub | 0 | 0 | 26 | 0 | 0 | 161 | 4 | 0 | 81 | 0 | 29 | 0 | 470 | 112 | 883 | 2.3% |
| Agriculture | 0 | 6 | 376 | 7 | 147 | 93 | 16 | 0 | 3 | 0 | 0 | 0 | 998 | 155 | 1801 | 4.8% |
| Wetland | 0 | 0 | 0 | 0 | 97 | 0 | 0 | 0 | 0 | 0 | 0 | 0 | 37 | 21 | 155 | 0.4% |
| Ice & Snow | 0 | 0 | 0 | 0 | 0 | 0 | 0 | 0 | 0 | 0 | 0 | 0 | 0 | 0 | 0 | 0.0% |
| Total | 599 | 262 | 3631 | 402 | 8732 | 2092 | 468 | 0 | 1075 | 57 | 142 | 0 | 7612 | 12,730 | 37,802 | |
| “Producer’s” | 99.3% | 82.1% | 77.7% | 94.3% | 83.7% | 81.8% | 77.8% | NA | 91.3% | 100.0% | 76.1% | NA | 63.3% | 56.2% | 70.1% | All p/r |
| (b) CCDC Mining Pixels/Trends Classes | |||||||||||||
|---|---|---|---|---|---|---|---|---|---|---|---|---|---|
| Path/Row | Water | Dev | Disturbed | Mining | Barren | Forest | Grass/Shrub | Ag | Wetland | Ice & Snow | Total | “User’s” | |
| NH/VT | 13/29 | 16 | 1140 | 46 | 595 | 59 | 1371 | 50 | 283 | 209 | 0 | 3769 | 15.8% |
| FL | 16/40 | 0 | 72 | 129 | 215 | 0 | 3 | 6 | 12 | 1 | 0 | 438 | 49.1% |
| IL/IN | 22/33 | 148 | 2553 | 76 | 2822 | 1 | 265 | 114 | 3831 | 7 | 0 | 9817 | 28.7% |
| AR/MS | 23/37 | 44 | 117 | 259 | 379 | 2 | 404 | 4 | 464 | 56 | 0 | 1729 | 21.9% |
| MN | 27/27 | 74 | 93 | 101 | 7310 | 0 | 517 | 254 | 126 | 11 | 0 | 8486 | 86.1% |
| KS | 28/33 | 59 | 1024 | 0 | 1712 | 0 | 98 | 1902 | 6127 | 80 | 0 | 11,002 | 15.6% |
| ND | 31/27 | 1 | 16 | 0 | 364 | 0 | 0 | 283 | 754 | 4 | 0 | 1422 | 25.6% |
| SD | 33/29 | 0 | 0 | 0 | 0 | 0 | 0 | 0 | 0 | 0 | 0 | 0 | na |
| CO | 34/33 | 6 | 439 | 0 | 981 | 68 | 28 | 628 | 51 | 52 | 0 | 2253 | 43.5% |
| CO | 35/32 | 0 | 0 | 0 | 57 | 0 | 0 | 18 | 0 | 1 | 0 | 76 | 75.0% |
| AZ | 36/38 | 0 | 5 | 0 | 108 | 0 | 1 | 2 | 8 | 0 | 0 | 124 | 87.1% |
| MT | 39/26 | 0 | 0 | 0 | 0 | 0 | 0 | 0 | 0 | 0 | 0 | 0 | na |
| CA | 43/34 | 64 | 40 | 29 | 4817 | 0 | 569 | 1039 | 1337 | 53 | 0 | 7948 | 60.6% |
| WA | 46/27 | 335 | 8606 | 2189 | 7155 | 1293 | 1995 | 311 | 707 | 121 | 0 | 22,712 | 31.5% |
| Total | 747 | 14,105 | 2829 | 26,515 | 1423 | 5251 | 4611 | 13,700 | 595 | 0 | 69,776 | 38.0% | |
| Dist. | 1.1% | 20.2% | 4.1% | 38.0% | 2.0% | 7.5% | 6.6% | 19.6% | 0.9% | na | All p/r | ||
| DISTURBED | ||||||||||||||||
|---|---|---|---|---|---|---|---|---|---|---|---|---|---|---|---|---|
| (a) Trends Disturbed Pixels/CCDC Classes | ||||||||||||||||
| NH/VT | FL | IL/IN | AR/MS | MN | KS | ND | SD | CO | CO | AZ | MT | CA | WA | |||
| path/row | 13/29 | 16/40 | 22/33 | 23/37 | 27/27 | 28/33 | 31/27 | 33/29 | 34/33 | 35/32 | 36/38 | 39/26 | 43/34 | 46/27 | Total | Dist. |
| Water | 6 | 5 | 4 | 21 | 15 | 0 | 0 | 0 | 0 | 0 | 0 | 0 | 1247 | 3 | 1301 | 0.5% |
| Developed | 176 | 1151 | 76 | 3729 | 553 | 0 | 4 | 0 | 0 | 0 | 0 | 0 | 675 | 15,638 | 22,002 | 7.9% |
| Disturbed | 125 | 1828 | 70 | 7124 | 1247 | 0 | 1 | 4 | 0 | 0 | 0 | 0 | 907 | 5782 | 17,088 | 6.1% |
| Mining | 46 | 129 | 76 | 259 | 101 | 0 | 0 | 0 | 0 | 0 | 0 | 0 | 29 | 2189 | 2829 | 1.0% |
| Barren | 18 | 0 | 0 | 11 | 0 | 0 | 0 | 0 | 0 | 0 | 0 | 0 | 22 | 0 | 51 | 0.0% |
| Forest | 7185 | 7996 | 76 | 20,914 | 47,315 | 4 | 0 | 694 | 8 | 68 | 0 | 0 | 13,228 | 71,903 | 169,391 | 60.8% |
| Grass/Shrub | 1178 | 748 | 12 | 394 | 2979 | 32 | 5 | 67 | 1 | 33 | 0 | 0 | 1124 | 38,632 | 45,205 | 16.2% |
| Agriculture | 172 | 622 | 173 | 4372 | 1252 | 15 | 0 | 0 | 0 | 0 | 0 | 0 | 1207 | 1355 | 9168 | 3.3% |
| Wetland | 271 | 1,571 | 0 | 205 | 9217 | 0 | 0 | 0 | 2 | 0 | 0 | 0 | 3 | 177 | 11,446 | 4.1% |
| Ice & Snow | 0 | 0 | 0 | 0 | 0 | 0 | 0 | 0 | 0 | 0 | 0 | 0 | 0 | 0 | 0 | 0.0% |
| Total | 9177 | 14,050 | 487 | 37,029 | 62,679 | 51 | 10 | 765 | 11 | 101 | 0 | 0 | 18,442 | 135,679 | 278,481 | |
| “Producer’s” | 1.4% | 13.0% | 14.4% | 19.2% | 2.0% | 0.0% | 10.0% | 0.5% | 0.0% | 0.0% | na | na | 4.9% | 4.3% | 6.1% | All p/r |
| (b) CCDC Disturbed Pixels/Trends Classes | |||||||||||||
|---|---|---|---|---|---|---|---|---|---|---|---|---|---|
| path/row | Water | Dev | Disturbed | Mining | Barren | Forest | Grass/Shrub | Ag | Wetland | Ice & Snow | Total | “User’s” | |
| NH/VT | 13/29 | 2 | 23 | 125 | 106 | 15 | 8 | 17 | 0 | 296 | 42.2% | ||
| FL | 16/40 | 131 | 283 | 1,828 | 3 | 0 | 632 | 974 | 164 | 3056 | 0 | 7,071 | 25.9% |
| IL/IN | 22/33 | 291 | 205 | 70 | 135 | 1 | 74 | 6 | 2043 | 49 | 0 | 2,874 | 2.4% |
| AR/MS | 23/37 | 1194 | 97 | 7124 | 1 | 1 | 2,205 | 31 | 4742 | 469 | 0 | 15,864 | 44.9% |
| MN | 27/27 | 59 | 391 | 1247 | 14 | 0 | 219 | 123 | 74 | 503 | 0 | 2,630 | 47.4% |
| KS | 28/33 | 947 | 55 | 0 | 103 | 488 | 53 | 379 | 3839 | 337 | 0 | 6,201 | 0.0% |
| ND | 31/27 | 39 | 10 | 1 | 29 | 0 | 1 | 92 | 1583 | 186 | 0 | 1,941 | 0.1% |
| SD | 33/29 | 168 | 0 | 4 | 0 | 39 | 28 | 2979 | 13 | 0 | 0 | 3,231 | 0.1% |
| CO | 34/33 | 0 | 24 | 0 | 5 | 1 | 18 | 1534 | 557 | 2105 | 0 | 4,244 | 0.0% |
| CO | 35/32 | 8 | 0 | 0 | 0 | 8 | 5 | 446 | 187 | 9 | 0 | 663 | 0.0% |
| AZ | 36/38 | 35 | 1218 | 0 | 0 | 388 | 21,986 | 117,790 | 1297 | 0 | 0 | 142,714 | 0.0% |
| MT | 39/26 | 0 | 1 | 0 | 0 | 0 | 0 | 1249 | 4954 | 58 | 0 | 6,262 | 0.0% |
| CA | 43/34 | 156 | 4158 | 907 | 522 | 0 | 736 | 36,406 | 86,812 | 799 | 0 | 130,496 | 0.7% |
| WA | 46/27 | 107 | 2758 | 5782 | 486 | 43 | 4047 | 522 | 1032 | 146 | 52 | 14,975 | 38.6% |
| Total | 3137 | 9223 | 17,088 | 1298 | 969 | 30,110 | 162,546 | 107,305 | 7734 | 52 | 339,462 | 5.0% | |
| Dist. | 0.9% | 2.7% | 5.0% | 0.4% | 0.3% | 8.9% | 47.9% | 31.6% | 2.3% | 0.0% | All p/r | ||
© 2016 by the authors; licensee MDPI, Basel, Switzerland. This article is an open access article distributed under the terms and conditions of the Creative Commons Attribution (CC-BY) license (http://creativecommons.org/licenses/by/4.0/).
Share and Cite
Pengra, B.; Gallant, A.L.; Zhu, Z.; Dahal, D. Evaluation of the Initial Thematic Output from a Continuous Change-Detection Algorithm for Use in Automated Operational Land-Change Mapping by the U.S. Geological Survey. Remote Sens. 2016, 8, 811. https://doi.org/10.3390/rs8100811
Pengra B, Gallant AL, Zhu Z, Dahal D. Evaluation of the Initial Thematic Output from a Continuous Change-Detection Algorithm for Use in Automated Operational Land-Change Mapping by the U.S. Geological Survey. Remote Sensing. 2016; 8(10):811. https://doi.org/10.3390/rs8100811
Chicago/Turabian StylePengra, Bruce, Alisa L. Gallant, Zhe Zhu, and Devendra Dahal. 2016. "Evaluation of the Initial Thematic Output from a Continuous Change-Detection Algorithm for Use in Automated Operational Land-Change Mapping by the U.S. Geological Survey" Remote Sensing 8, no. 10: 811. https://doi.org/10.3390/rs8100811