Article

An Iterative Approach to Ground Penetrating Radar at the Maya Site of Pacbitun, Belize

1
Department of Chemistry and Chemical Technology, Bronx Community College, CUNY, 2155 University Ave., Bronx, NY 10453, USA
2
Department of Geography and Anthropology, Kennesaw State University, 402 Bartow Ave. NW, Kennesaw, GA 30144, USA
3
Department of Geology and Geography, Georgia Southern University, P.O. Box 8149, Statesboro, GA 30460, USA
4
Department of Anthropology, University of Central Florida, 4000 Central Florida Blvd, Orlando, FL 32816, USA
1
(Creator GPR-Slice, Woodland Hills, CA, USA)
*
Author to whom correspondence should be addressed.
Remote Sens. 2016, 8(10), 805; https://doi.org/10.3390/rs8100805
Submission received: 17 May 2016 / Revised: 15 September 2016 / Accepted: 20 September 2016 / Published: 29 September 2016
(This article belongs to the Special Issue Archaeological Prospecting and Remote Sensing)

Abstract

:
Ground penetrating radar (GPR) surveys provide distinct advantages for archaeological prospection in ancient, complex, urban Maya sites, particularly where dense foliage or modern debris may preclude other remote sensing or geophysical techniques. Unidirectional GPR surveys using a 500 MHz shielded antenna were performed at the Middle Preclassic Maya site of Pacbitun, Belize. The survey in 2012 identified numerous linear and circular anomalies between 1 m and 2 m deep. Based on these anomalies, one 1 m × 4 m unit and three smaller units were excavated in 2013. These test units revealed a curved plaster surface not previously found at Pacbitun. Post-excavation, GPR data were reprocessed to best match the true nature of excavated features. Additional GPR surveys oriented perpendicular to the original survey confirmed previously detected anomalies and identified new anomalies. The excavations provided information on the sediment layers in the survey area, which allowed better identification of weak radar reflections of the surfaces of a burnt, Middle Preclassic temple in the northern end of the survey area. Additional excavations of the area in 2014 and 2015 revealed it to be a large square structure, which was named El Quemado.

1. Introduction

In this study, we present the implementation of ground penetrating radar (GPR) surveys and magnetometer surveys at the Maya archaeological site of Pacbitun, Belize. Data acquisition was performed in two stages: in December 2012 and in May 2014. The goal of the December 2012 survey was to determine where excavations would be most likely to uncover buried structures in the following field season(s). The objective of May 2014 was to add more GPR data through new perpendicular profiles in the previously surveyed area and to correct the preliminary interpretation of the 2012 radar amplitude maps using the excavation results. The interpretation of the radar reflections changed due to excavation results, while at the same time the GPR survey also changed the direction of the project.
Archaeological geophysical prospection and remote sensing are becoming more common place as preliminary steps in site discovery and excavation pre-planning in many regions; yet only remote sensing with LiDAR and satellite imagery is being widely adopted in Maya archaeological surveys [1,2,3]. This is probably due to the ability of the LiDAR technology to see through dense tropical canopy and cover large regions at one time. While high resolution satellite survey has been able to detect subsurface archaeological features in some cases using changes in soil or plant colors [4,5,6,7,8,9], in tropical foliage conditions like those in Belize, these surveys have been less successful [2].
There are numerous commonly employed geophysical techniques for archaeological prospection in ancient, complex, urban sites, which describes the site core area of Pacbitun, including electric resistivity tomography or imaging (ERT/ERI) [10,11,12,13], geomagnetic mapping (GM), frequency domain electromagnetic methods (FDEM) [14,15,16,17,18,19], and GPR or georadar [17,20,21,22,23,24,25,26,27,28,29,30,31,32,33,34,35]. A GPR and GM survey was deemed most appropriate for exploring two plaza areas which needed to be completed in six days. Particularly important in this decision was the fast acquisition of the GM survey in walking mode, and the distinct advantages GPR survey offers, namely very fine resolution, rapid acquisition, flexibility to cover moderately rough terrain, and minimal interference from modern debris. Another advantage was that the authors had access to a Mala GPR system and a GEM-19 gradiometer from Georgia Southern University for only transportation and insurance costs, which made these surveys the least expensive options.
There have not been many other geophysical surveys of Maya sites in Belize, but other researchers have noted many of the same difficulties that the authors encountered, such as water saturation causing signal attenuation, gravel layers under plaster floors causing signal scattering, and numerous obstructions such as tree roots [36,37,38,39,40,41]. There have been some geophysical surveys of Maya sites outside of Belize, but generally the lack of GPR surveys limits the use of comparative examples for interpreting the Pacbitun anomalies based on geophysical anomalies in other Maya plaza areas [42,43,44]. Additionally, a number of these other successful geophysical surveys are at sites with a significant volcanic mineral component to the soil, which is not the case at Pacbitun, and this could make anthropogenic reflections at those other surveys more apparent than similar reflections in Belize.

2. Materials and Methods

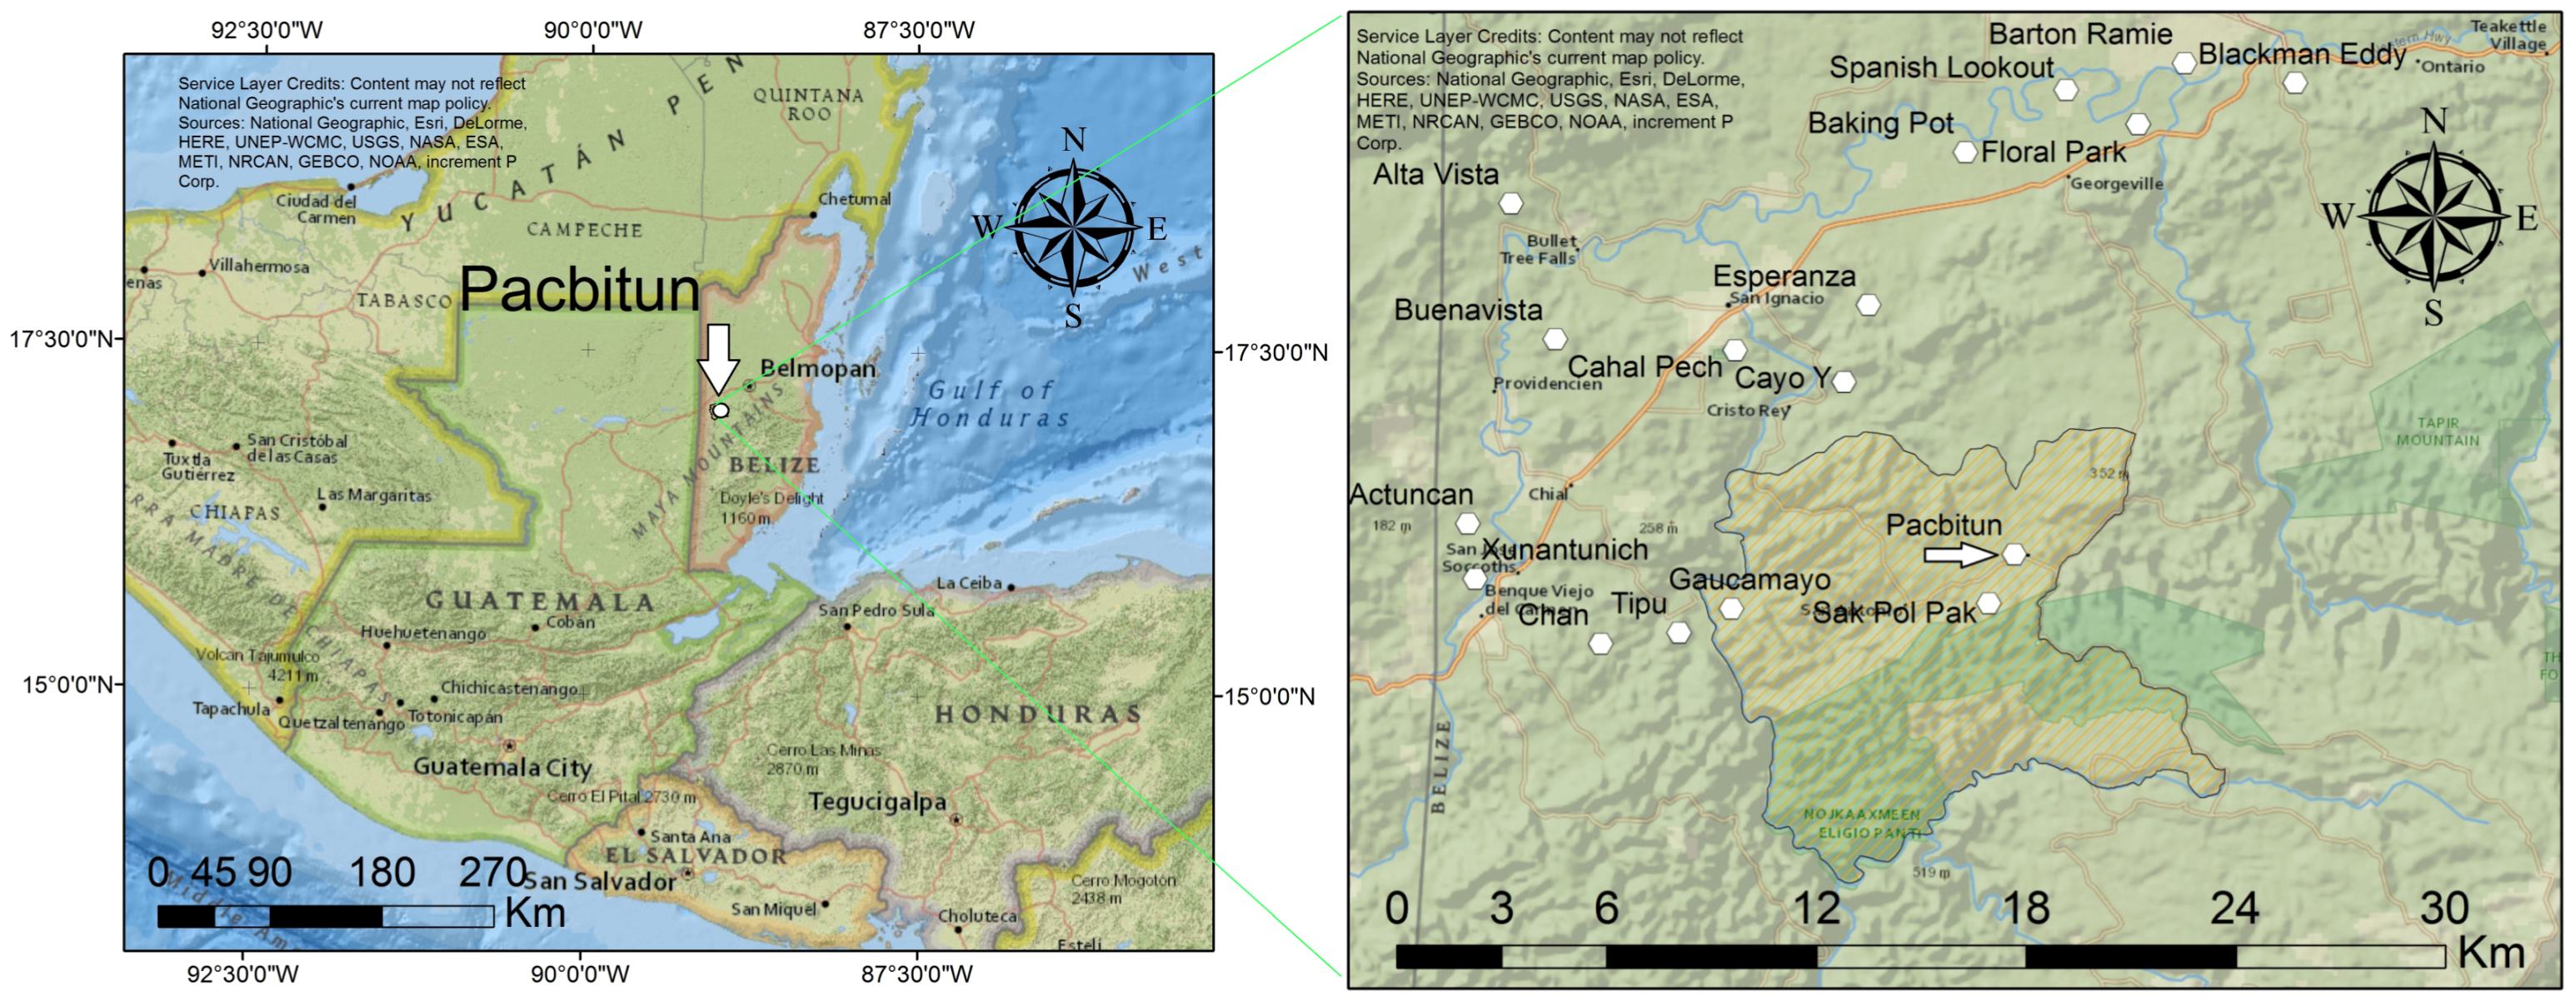
2.1. Archaeological Framework
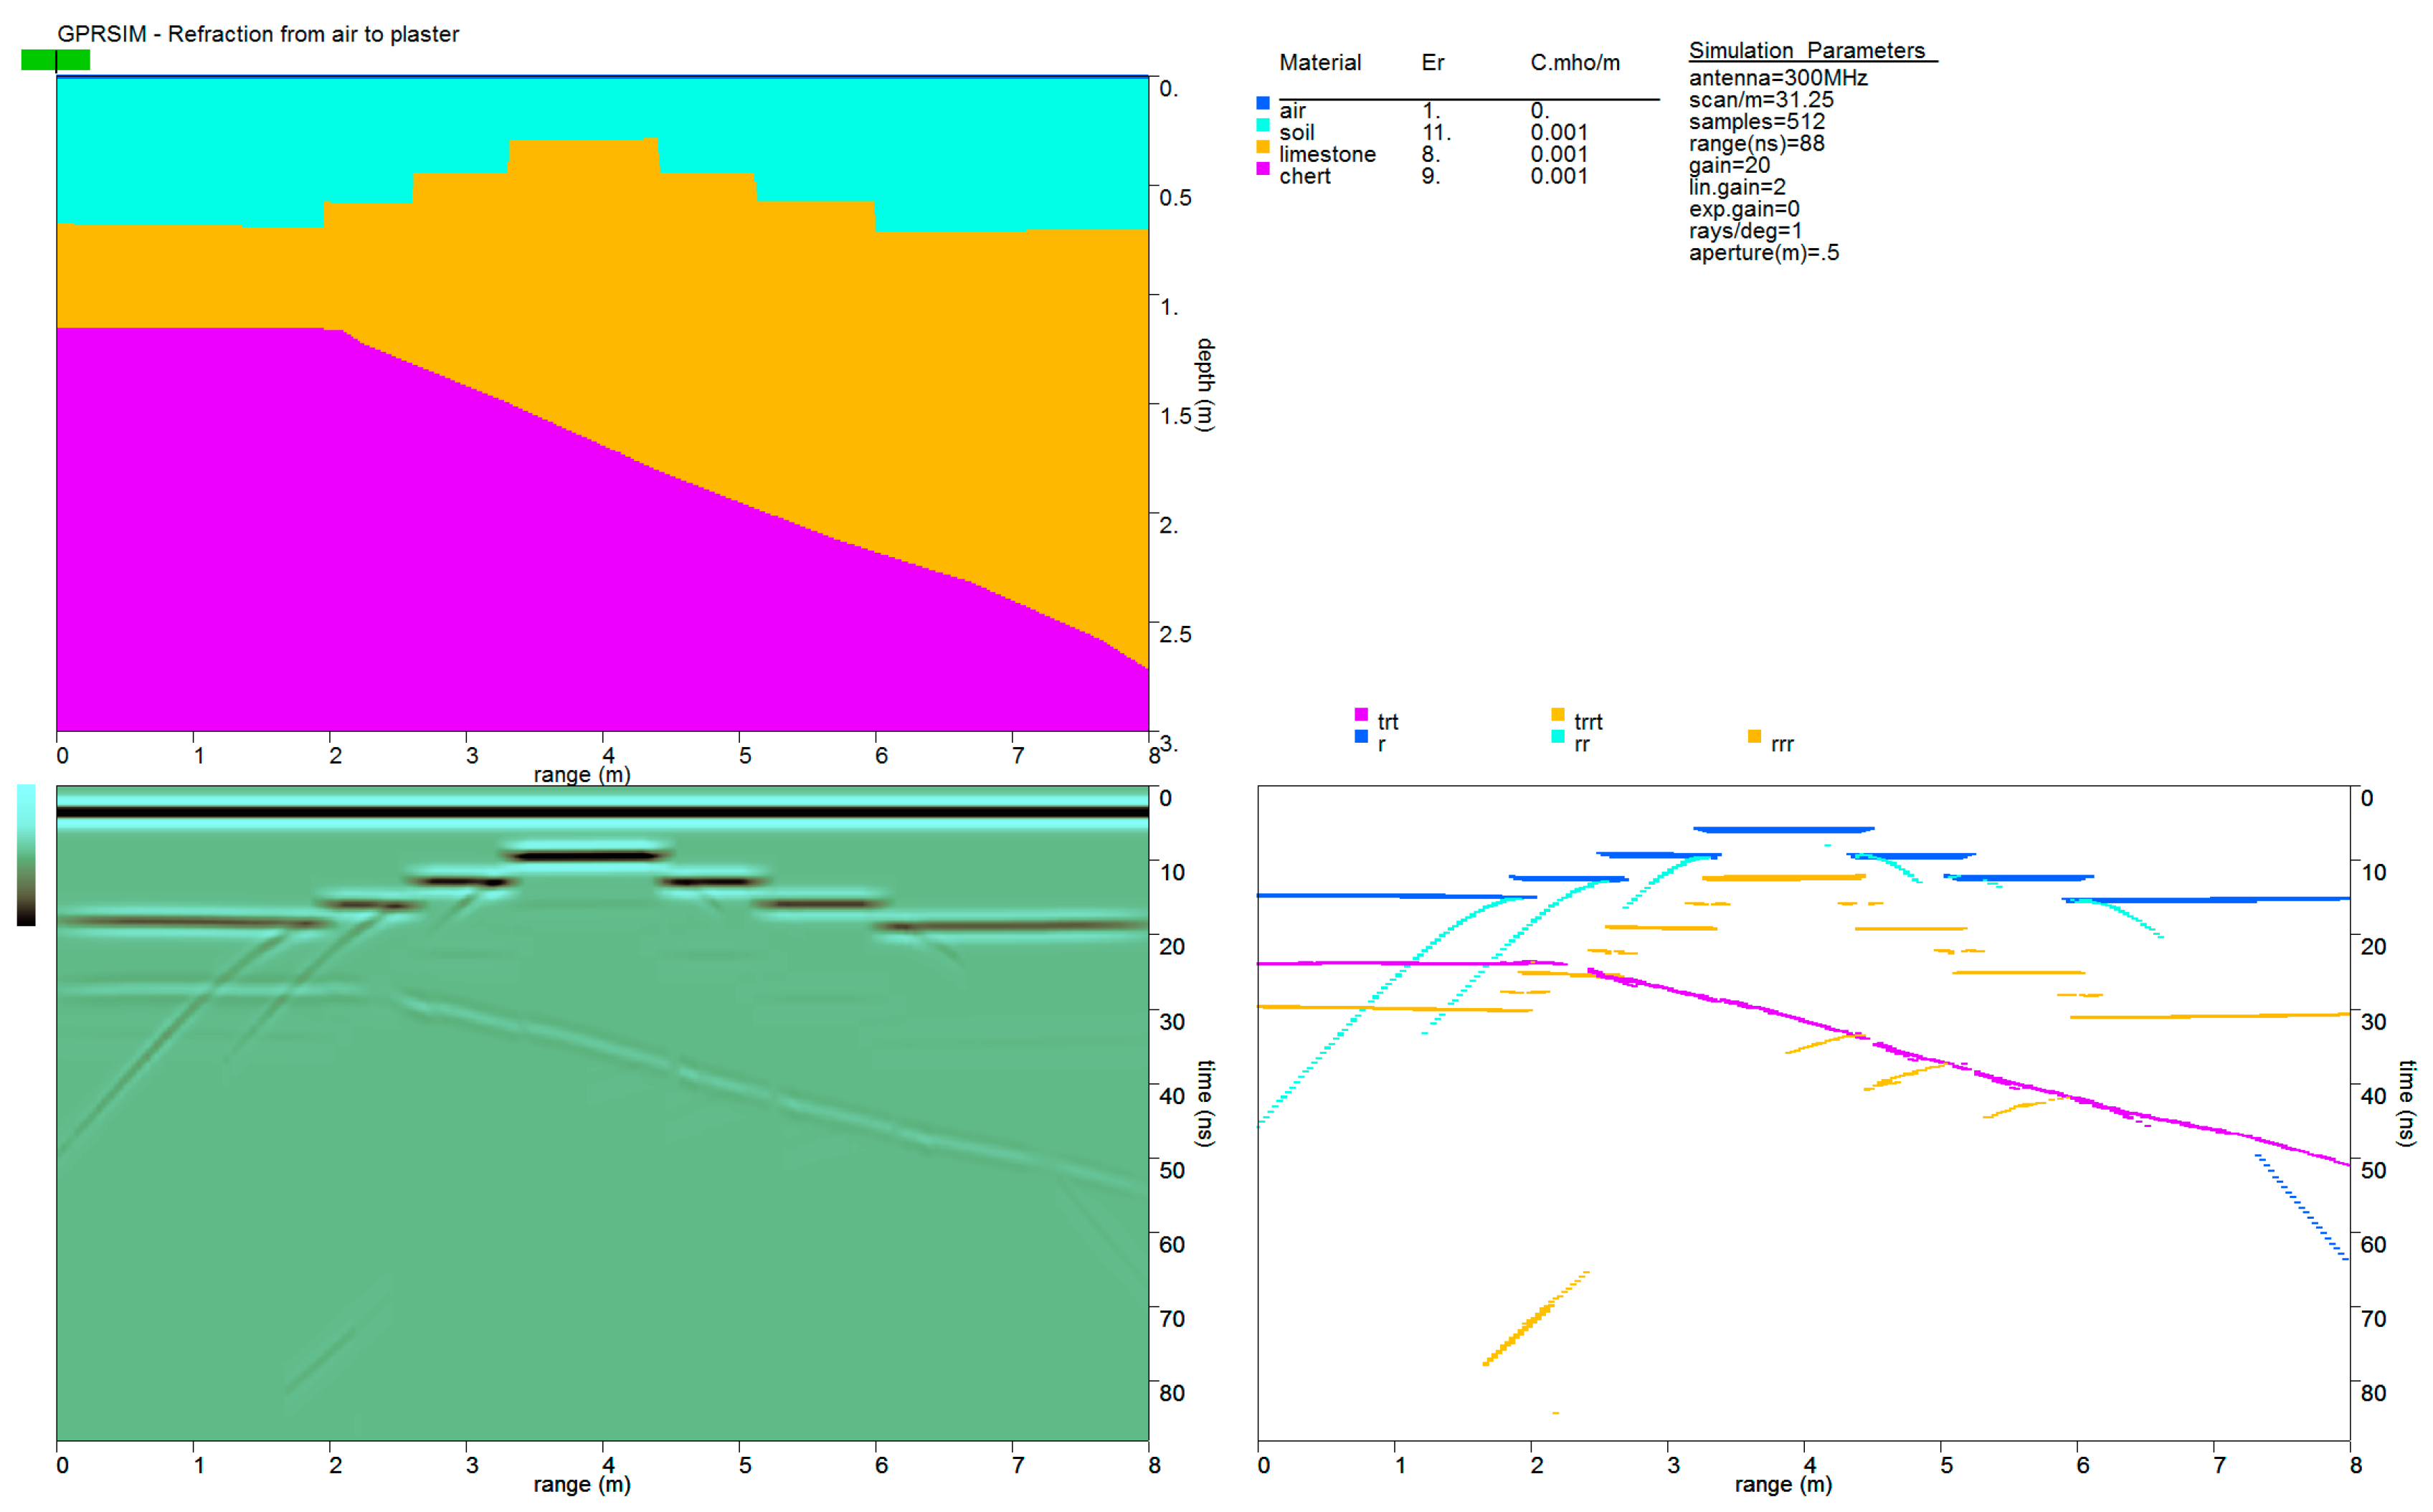
Pacbitun is a medium-sized Maya site located in west central Belize near the border with Guatemala as shown in Figure 1. The central precinct of Pacbitun consists of 41 Classic period (700–900 CE) masonry structures (numbers 1–41) covering an area of approximately 14.5 hectares (145,000 m2) [45,46,47]. These structures are arranged around five plazas (letters A–E). Twenty carved monuments, both stelae and altars, are situated in front of many of the major structures in each of the plazas. Two causeways, or raised roads, run from the site core into the periphery and are shown in Figure 2 [45].
Initial excavations were conducted at the site by Paul F. Healy of Trent University during the summers of 1984, 1986, and 1987 [45]. During these three seasons, many architectural and cultural features within the central precinct were mapped and tested, and a settlement survey and testing project were undertaken in the site’s periphery [48,49,50]. These excavations revealed a long, stratigraphic sequence of occupation extending from the Middle Preclassic (900 BCE) to the Late-Terminal Classic (900 CE) [45,51].
Excavations were again conducted at Pacbitun during the summers of 1995, 1996, and 1997 [45,51,52,53]. The purpose of this renewed research was to expose additional Middle Preclassic (900–300 BCE) deposits to gain a more comprehensive understanding of this early period at the site. During these recent efforts, large-scale horizontal excavations were undertaken in Plaza B which revealed significant Middle Preclassic architectural and artifactual materials located only one meter below the present ground surface. Middle Preclassic architecture included portions of five basal platforms (Sub-Structures B1–B5). Radiocarbon and ceramic cross-dating indicated that some of the Plaza B platforms dated to the early Middle Preclassic (900–600 BCE), while others date to the late Middle Preclassic (600–300 BCE) [54,55].
The Middle Preclassic structures exposed in Plaza B are raised earthen platforms with stone retaining walls that would have supported perishable, wattle-and-daub structures. These structures, measuring approximately 9 m by 6 m, run parallel to each other and are separated by a one-meter wide alleyway. The close proximity and common extramural areas suggest that the structures were organized as a small plazuela group with several structures situated around an open patio area, a pattern that continues to this day in most traditional Maya communities [56]. The earthen alleyways between these platforms provide additional evidence that these architectural features were associated and contemporaneous.
Perhaps most significant of the discoveries in Plaza B was the evidence of early and late Middle Preclassic shell ornament production, as interpreted from the co-occurrence of thousands of shell ornaments in various stages of production, and hundreds of marine shell detritus and chert microdrills embedded in the floors and alleyways both within and surrounding the early and late Middle Preclassic structures [53].
From 2008 until the present, archaeological excavations have continued at Pacbitun under the direction of Terry G. Powis of Kennesaw State University. This interdisciplinary research project, known as the Pacbitun Regional Archaeological Project (PRAP), has focused on investigations in both the site core and periphery. In the site core, particularly in Plaza A, work has primarily concentrated on the earliest inhabitants of the site, dating back to the Middle Preclassic (900–300 BCE) period. While excavations in Plaza B had centered on domestic architecture, the target in Plaza A had shifted towards understanding the nature and extent of the non-domestic architecture. Specifically, PRAP was interested in the earliest monumental buildings constructed in Plaza A, which could then be compared to the residential ones found in Plaza B.
The Pacbitun permit area encompasses two distinct geologic terranes in Belize: the Mountain Pine Ridge of the Maya Mountains to the south and the Belize lowlands to the north. The Maya Mountains are a fault-bounded synclinorium with exposures of Late Paleozoic metasedimentary and metavolcanic rocks and Paleozoic-Mesozoic igneous intrusives [57,58]. Soils in this area tend to be composed of coarse sands and are not conducive to agricultural production [45]. Just north of the Northern Boundary fault is the lowland tropical rainforest situated on karstified Cretaceous carbonates on which the site core of Pacbitun is located [59]. In the study area, soils tend to be calcareous and fertile [60]. Previous excavations in Plaza A have revealed that the entire plaza is made of anthropogenic layers above the limestone bedrock up to 3 m thick. Most of Plaza A has 5 cm to 20 cm of humus at the surface under which are 40 cm to 60 cm of layered plaster surfaces supported by ballast (stones 3–5 cm in diameter). Usually, there are three to five of these plaster floor/ballast layers, but up to six have been found. Below these are sediment layers alternating in composition between white-orange marl and dark brown clay. The mixed marl layers continue all the way down to a 20 cm layer of saprolite just above the bedrock [61].

2.2. GPR Survey

The GPR survey of Plaza A was conducted in parallel lines with 50 cm spacing using a Mala RAMAC X3M system with a collapsible rough terrain cart and a shielded antenna with a central frequency of 500 MHz during the months of December 2012 and May 2014 (Figure 3a,b). From previous surveys, this particular Mala antenna was known to have differential signal strength depending on the direction of survey, perhaps due to incomplete shielding. Therefore, the survey was conducted in a unidirectional manner, with the GPR returned to one fixed baseline for the start of every profile (green dots in Figure 3) and ending at another baseline (red dots in Figure 3) unless interrupted by an insurmountable barrier such as a large tree or root. If an obstacle was encountered, the survey file was ended and another file started on the opposite side. These files were later joined in the proper location in the processing software GPR-SLICE, commercial software authored by Dr. Dean Goodman. This accounts for the blank spaces in Figure 3. A total of approximately 2100 m of survey profile was recorded in each direction. Tape measure and compass were used to set up the baselines, and a calibrated survey wheel recorded the distance traveled and collected 21 traces per meter. The acquisition window was set to 71 ns and 512 samples per scan for the 2012 survey and 102 ns and 512 samples per scan for the 2014 survey. Excavations in 2013 revealed that some parts of the plaza were 2.8 m to bedrock, and even deeper bedrock depths could not be ruled out. A longer sampling time was used in 2014, with the idea of identifying possible features below 3 m, but the effective signal was much shallower than was realized. Limitations of parameter settings with the Mala unit means the same number of samples are spread over a longer time interval, thus decreasing the depth before aliasing occurs. The surveys were conducted at two separate time periods. The east–west profiles (Figure 3a) were performed in December 2012 as a pilot study of the effectiveness of GPR surveys at Pacbitun. Limited excavations of a 1 m by 4 m area circumscribing the most interesting anomalies and three smaller excavation areas around anomalies located on center lines of the plaza proceeded in June of 2013 (Figure 3b), and the results revealed archaeological features discussed in Section 3.2.1. The anomalies shown by the 2012 processed images did not fully coincide with the excavation results. Therefore, a GPR survey in the north–south direction of the northern half of Plaza A was performed in May of 2014 (Figure 3b) so that the removal of back dirt from excavated trenches could proceed while the north–south profiles of the southern portion of Plaza A were completed a few days later. Unfortunately rain between the two north–south surveys changed the ground conditions and complicated processing of the GPR data. The excavation units of the 2013 season, which were filled back in prior to the May 2014 GPR survey, are shown in Figure 3b.
The amplitude time slices were created by processing the data using GPR-SLICE followed these approximate steps:
  • Add a gain curve to compensate for geometrical signal loss and energy decay at deeper depths.
  • Dewow the signal by subtracting the running average signal of 52 scans (to remove DC-drift).
  • Adjust the start time of each track using detection of first deviation of the amplitude of the wave by more than 5% of the average, indicating the scan time needed to move the 0 s mark to the air/soil interface.
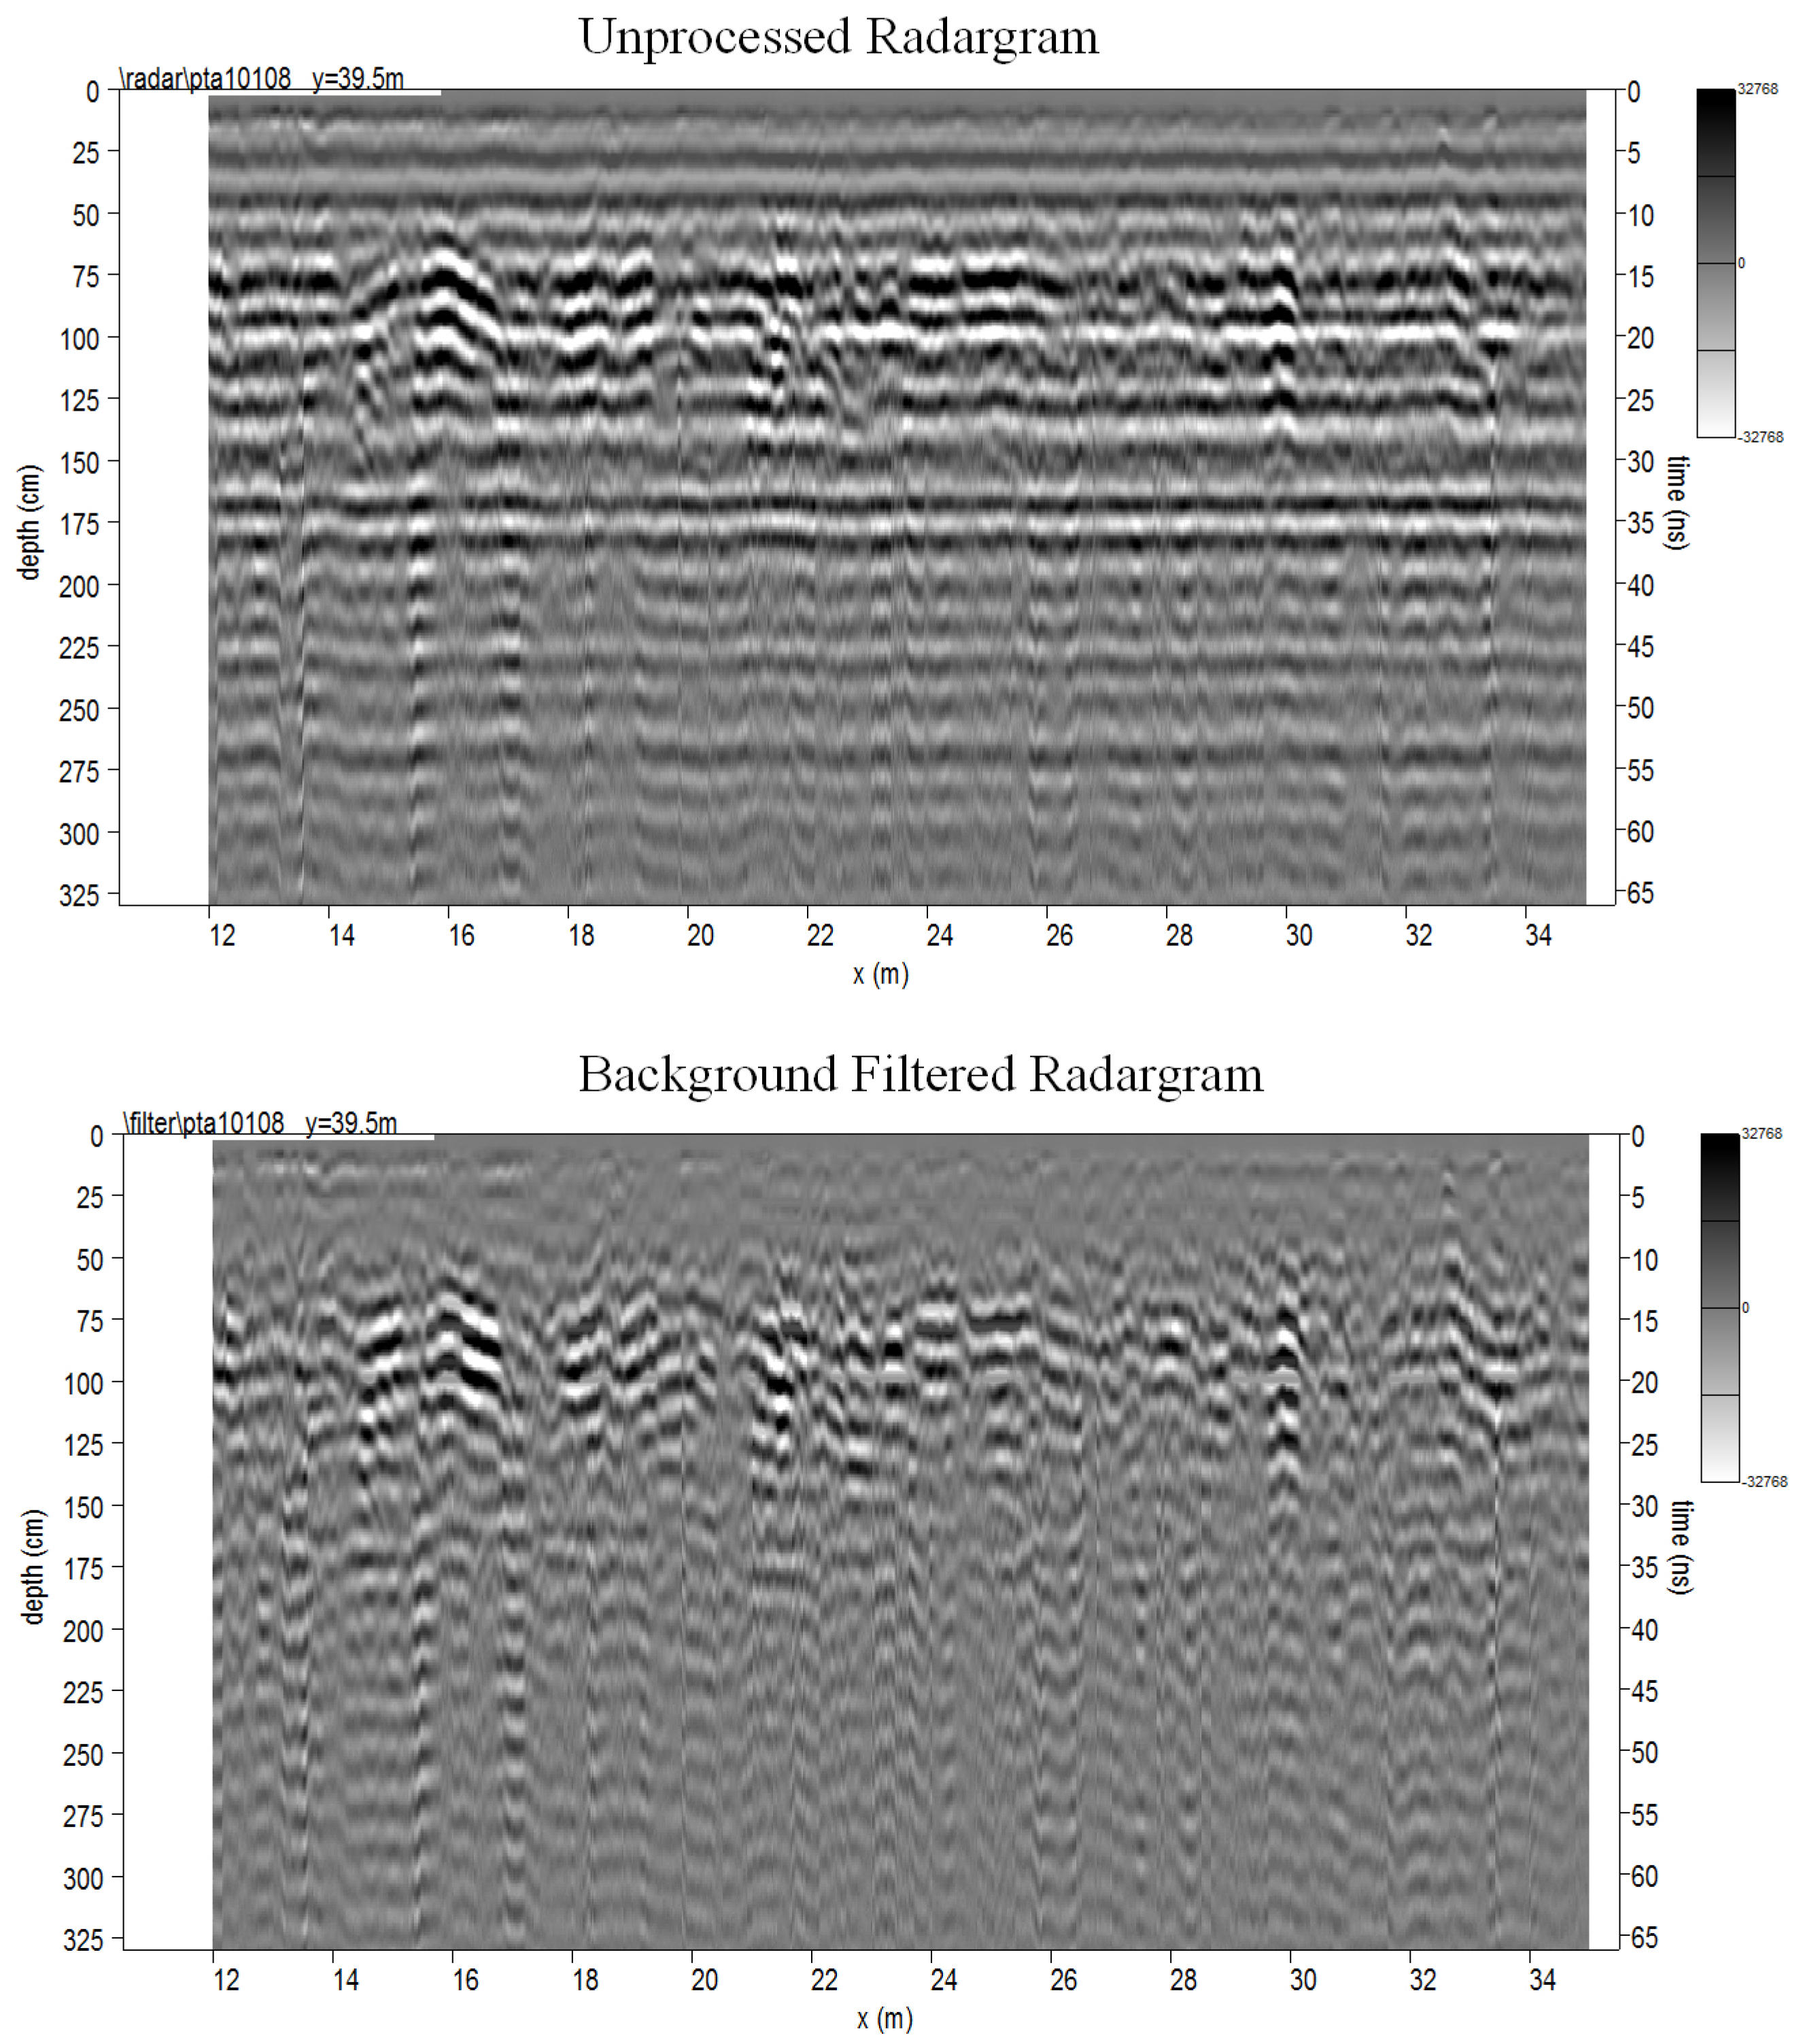
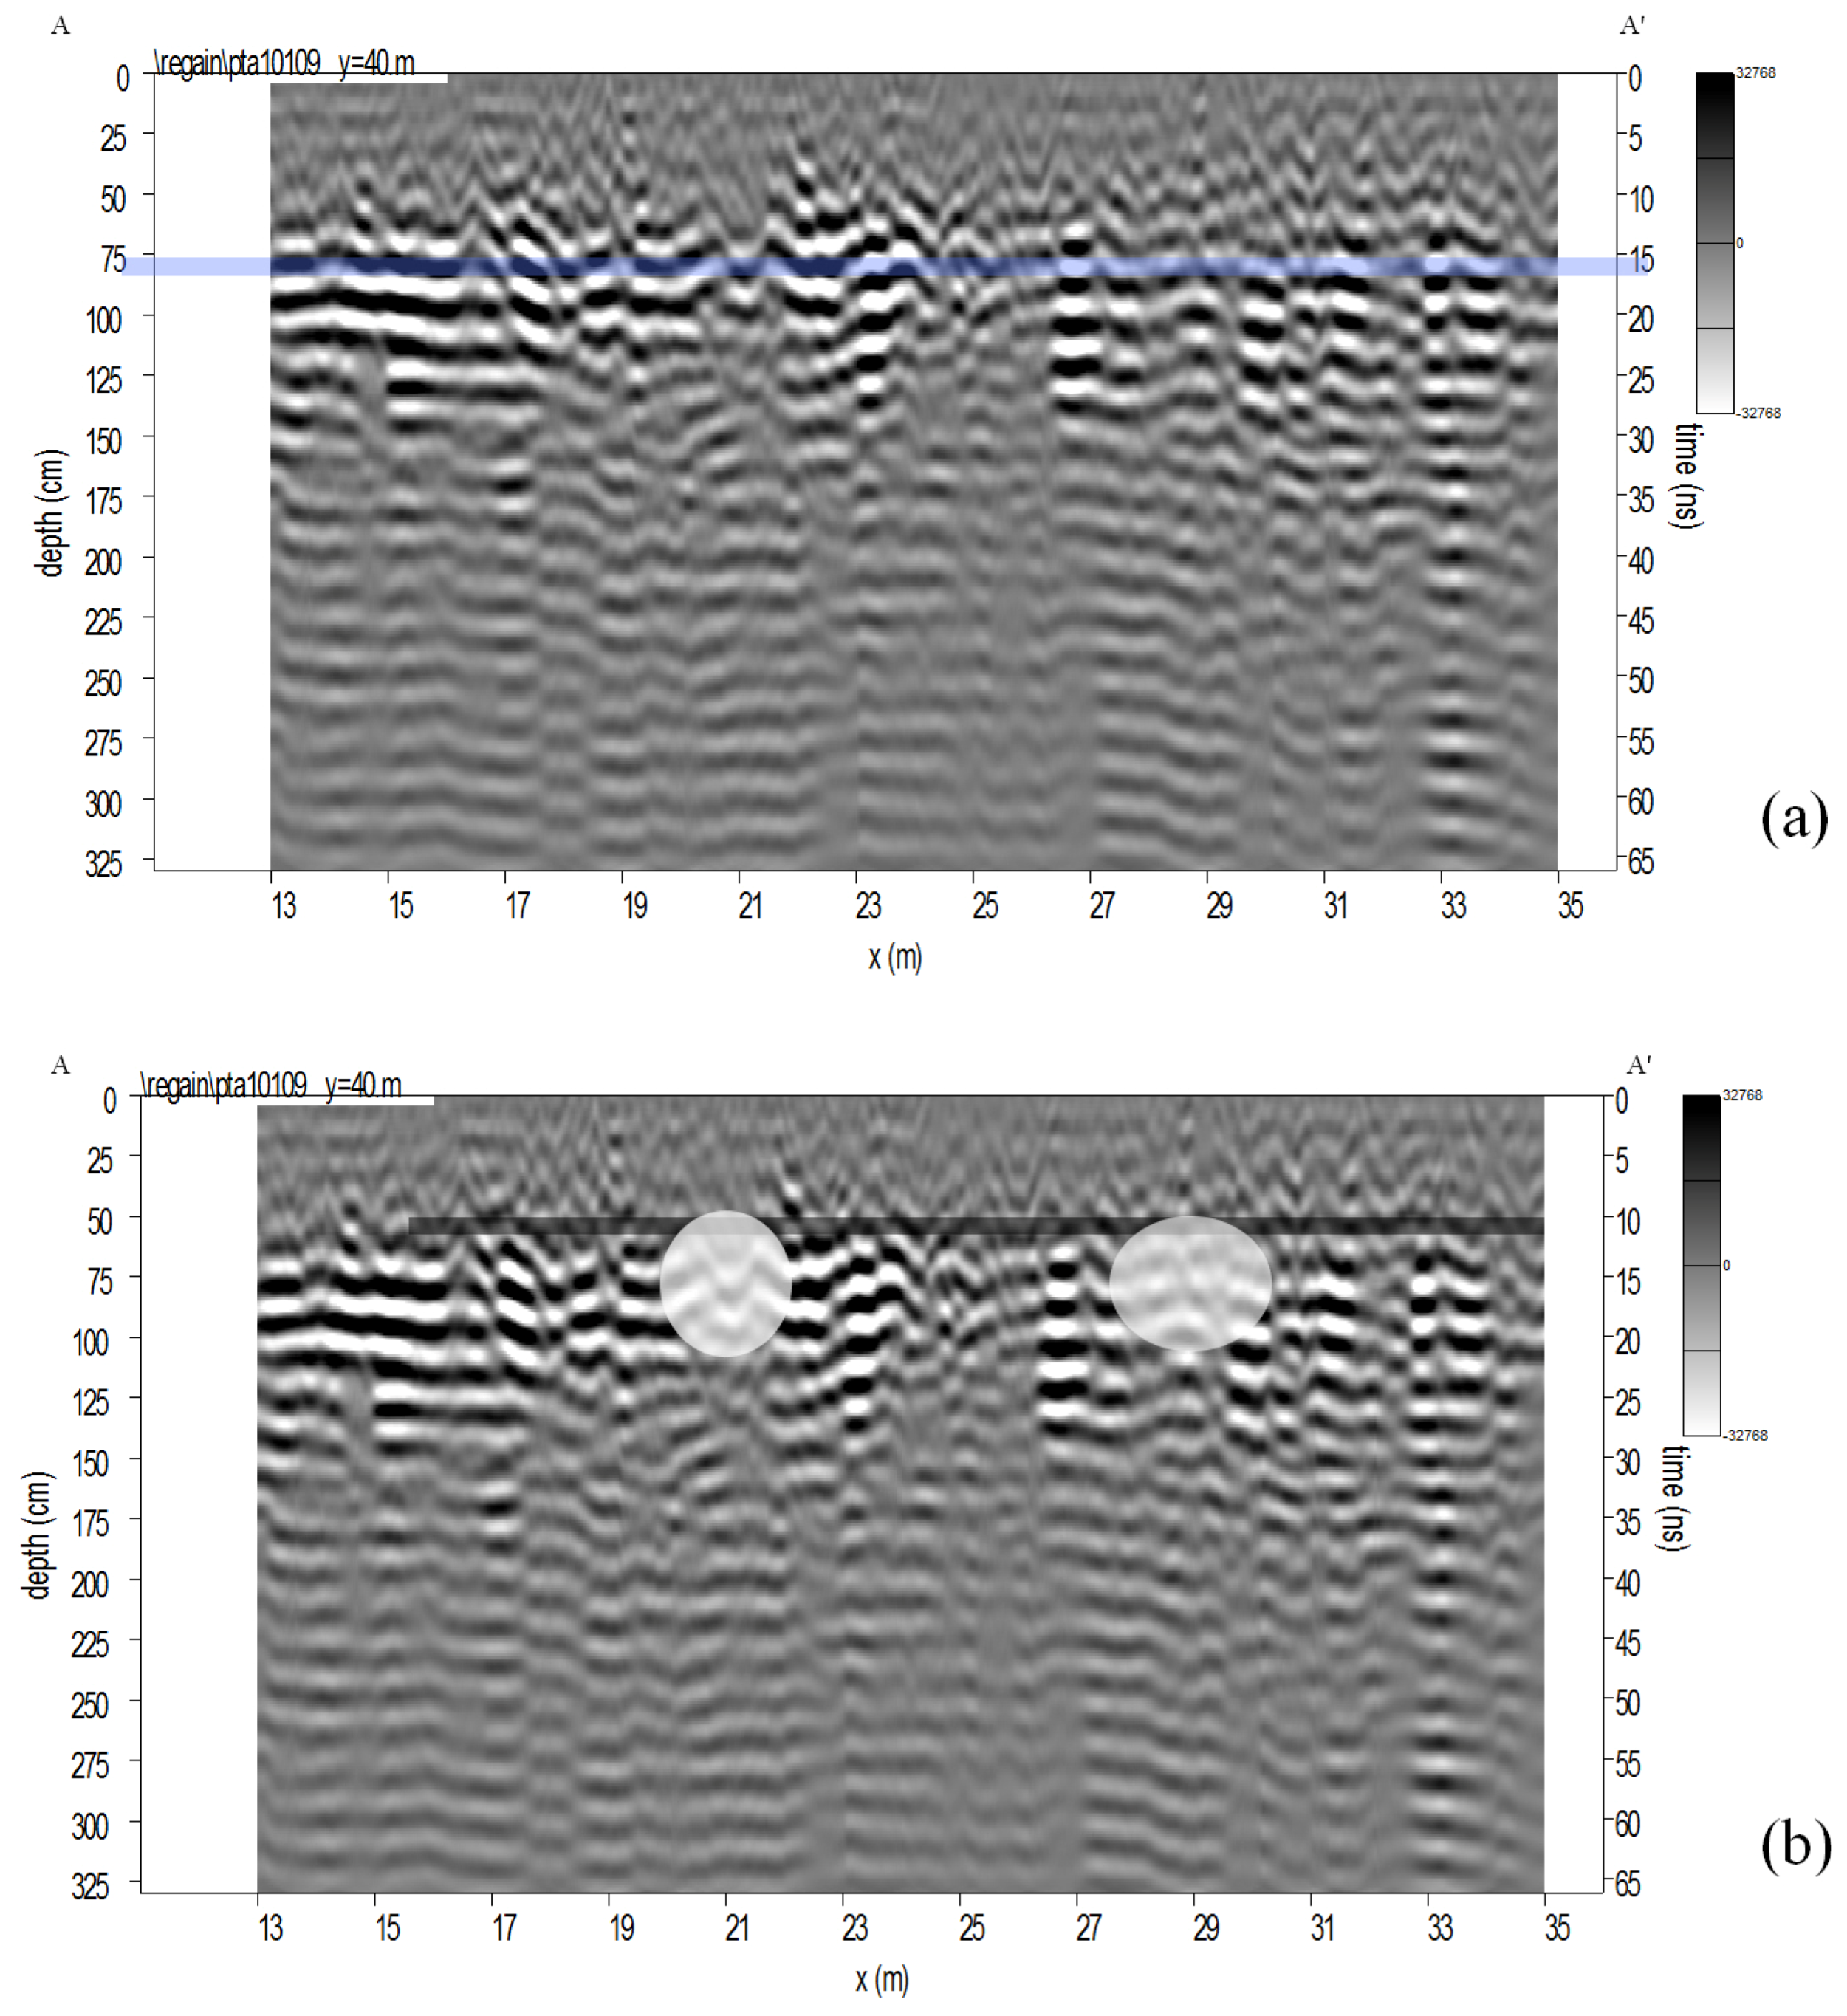
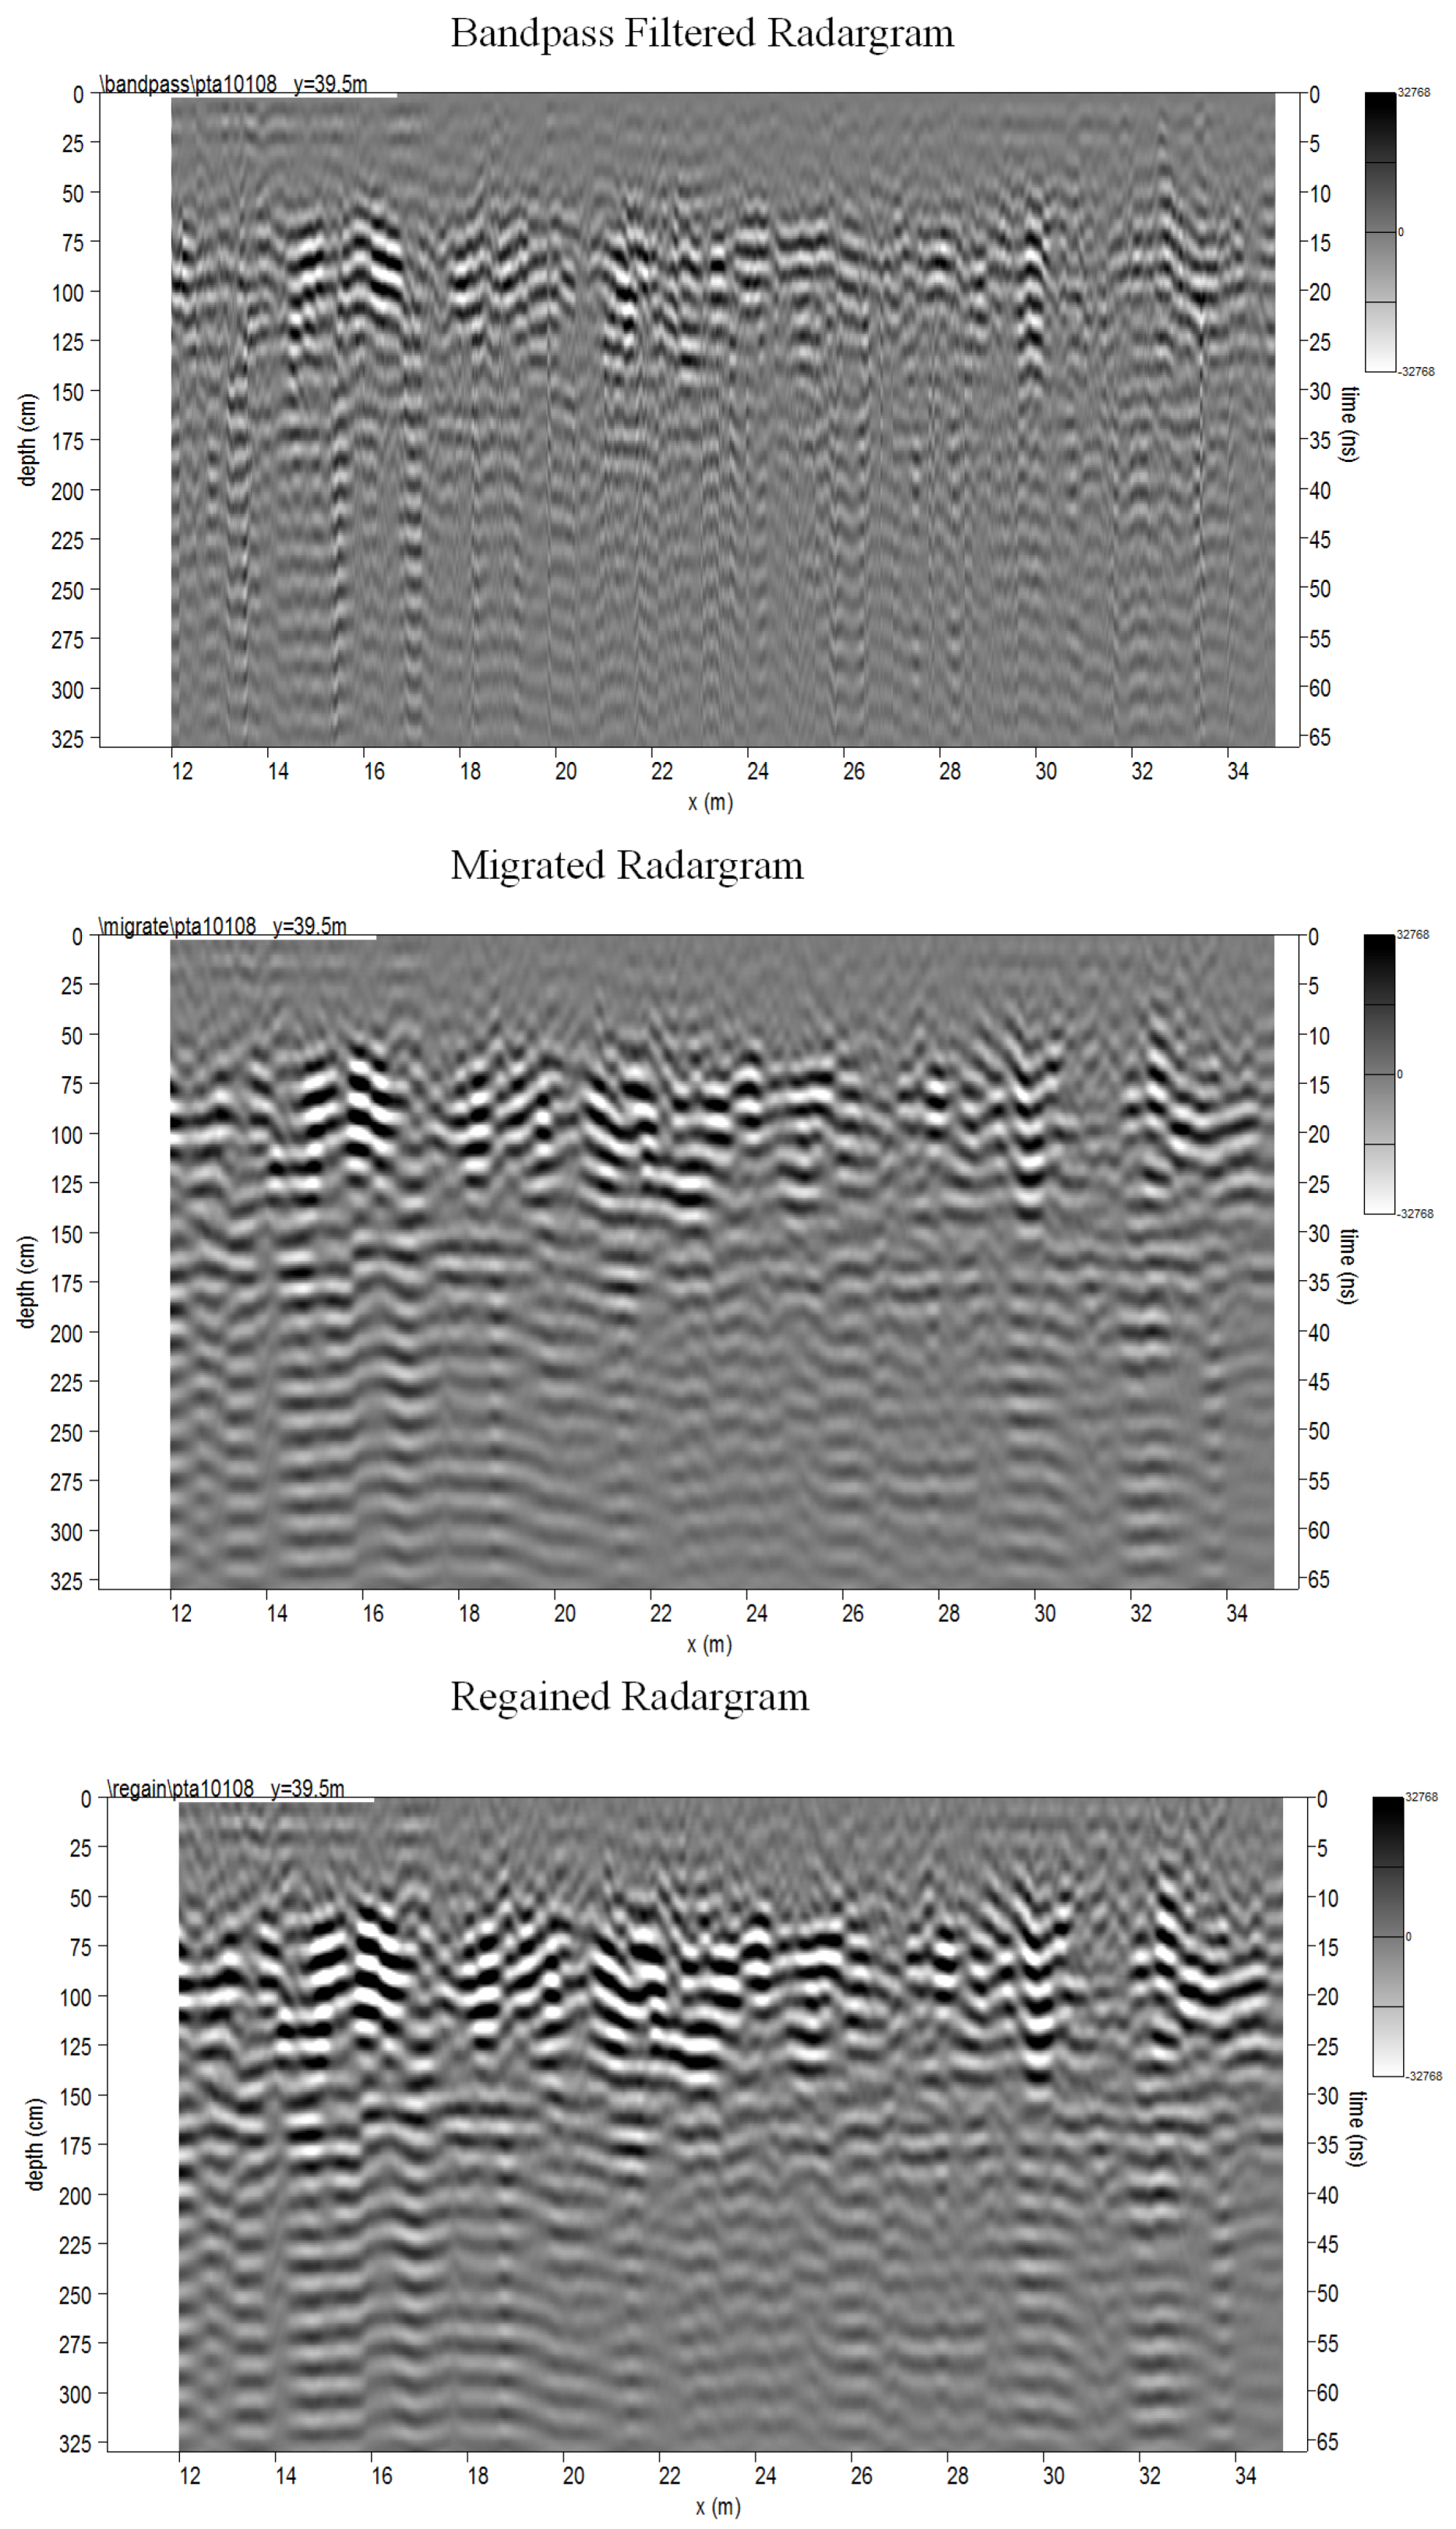
  • A median background signal for the entire survey area was subtracted from each survey line (Figure 4).
  • Survey line data were passed through bandpass filter which allowed on data from 250 mHz to 650 mHz to pass (Figure 4).
  • A Kirchhoff migration operation step was performed to collapse hyperbola tails, using a dielectric of 23.75 for the humus layer, a dielectric of 7.3 for the plaster/ballast layers, and a dielectric of 14.42 for the marl layer (Figure 4).
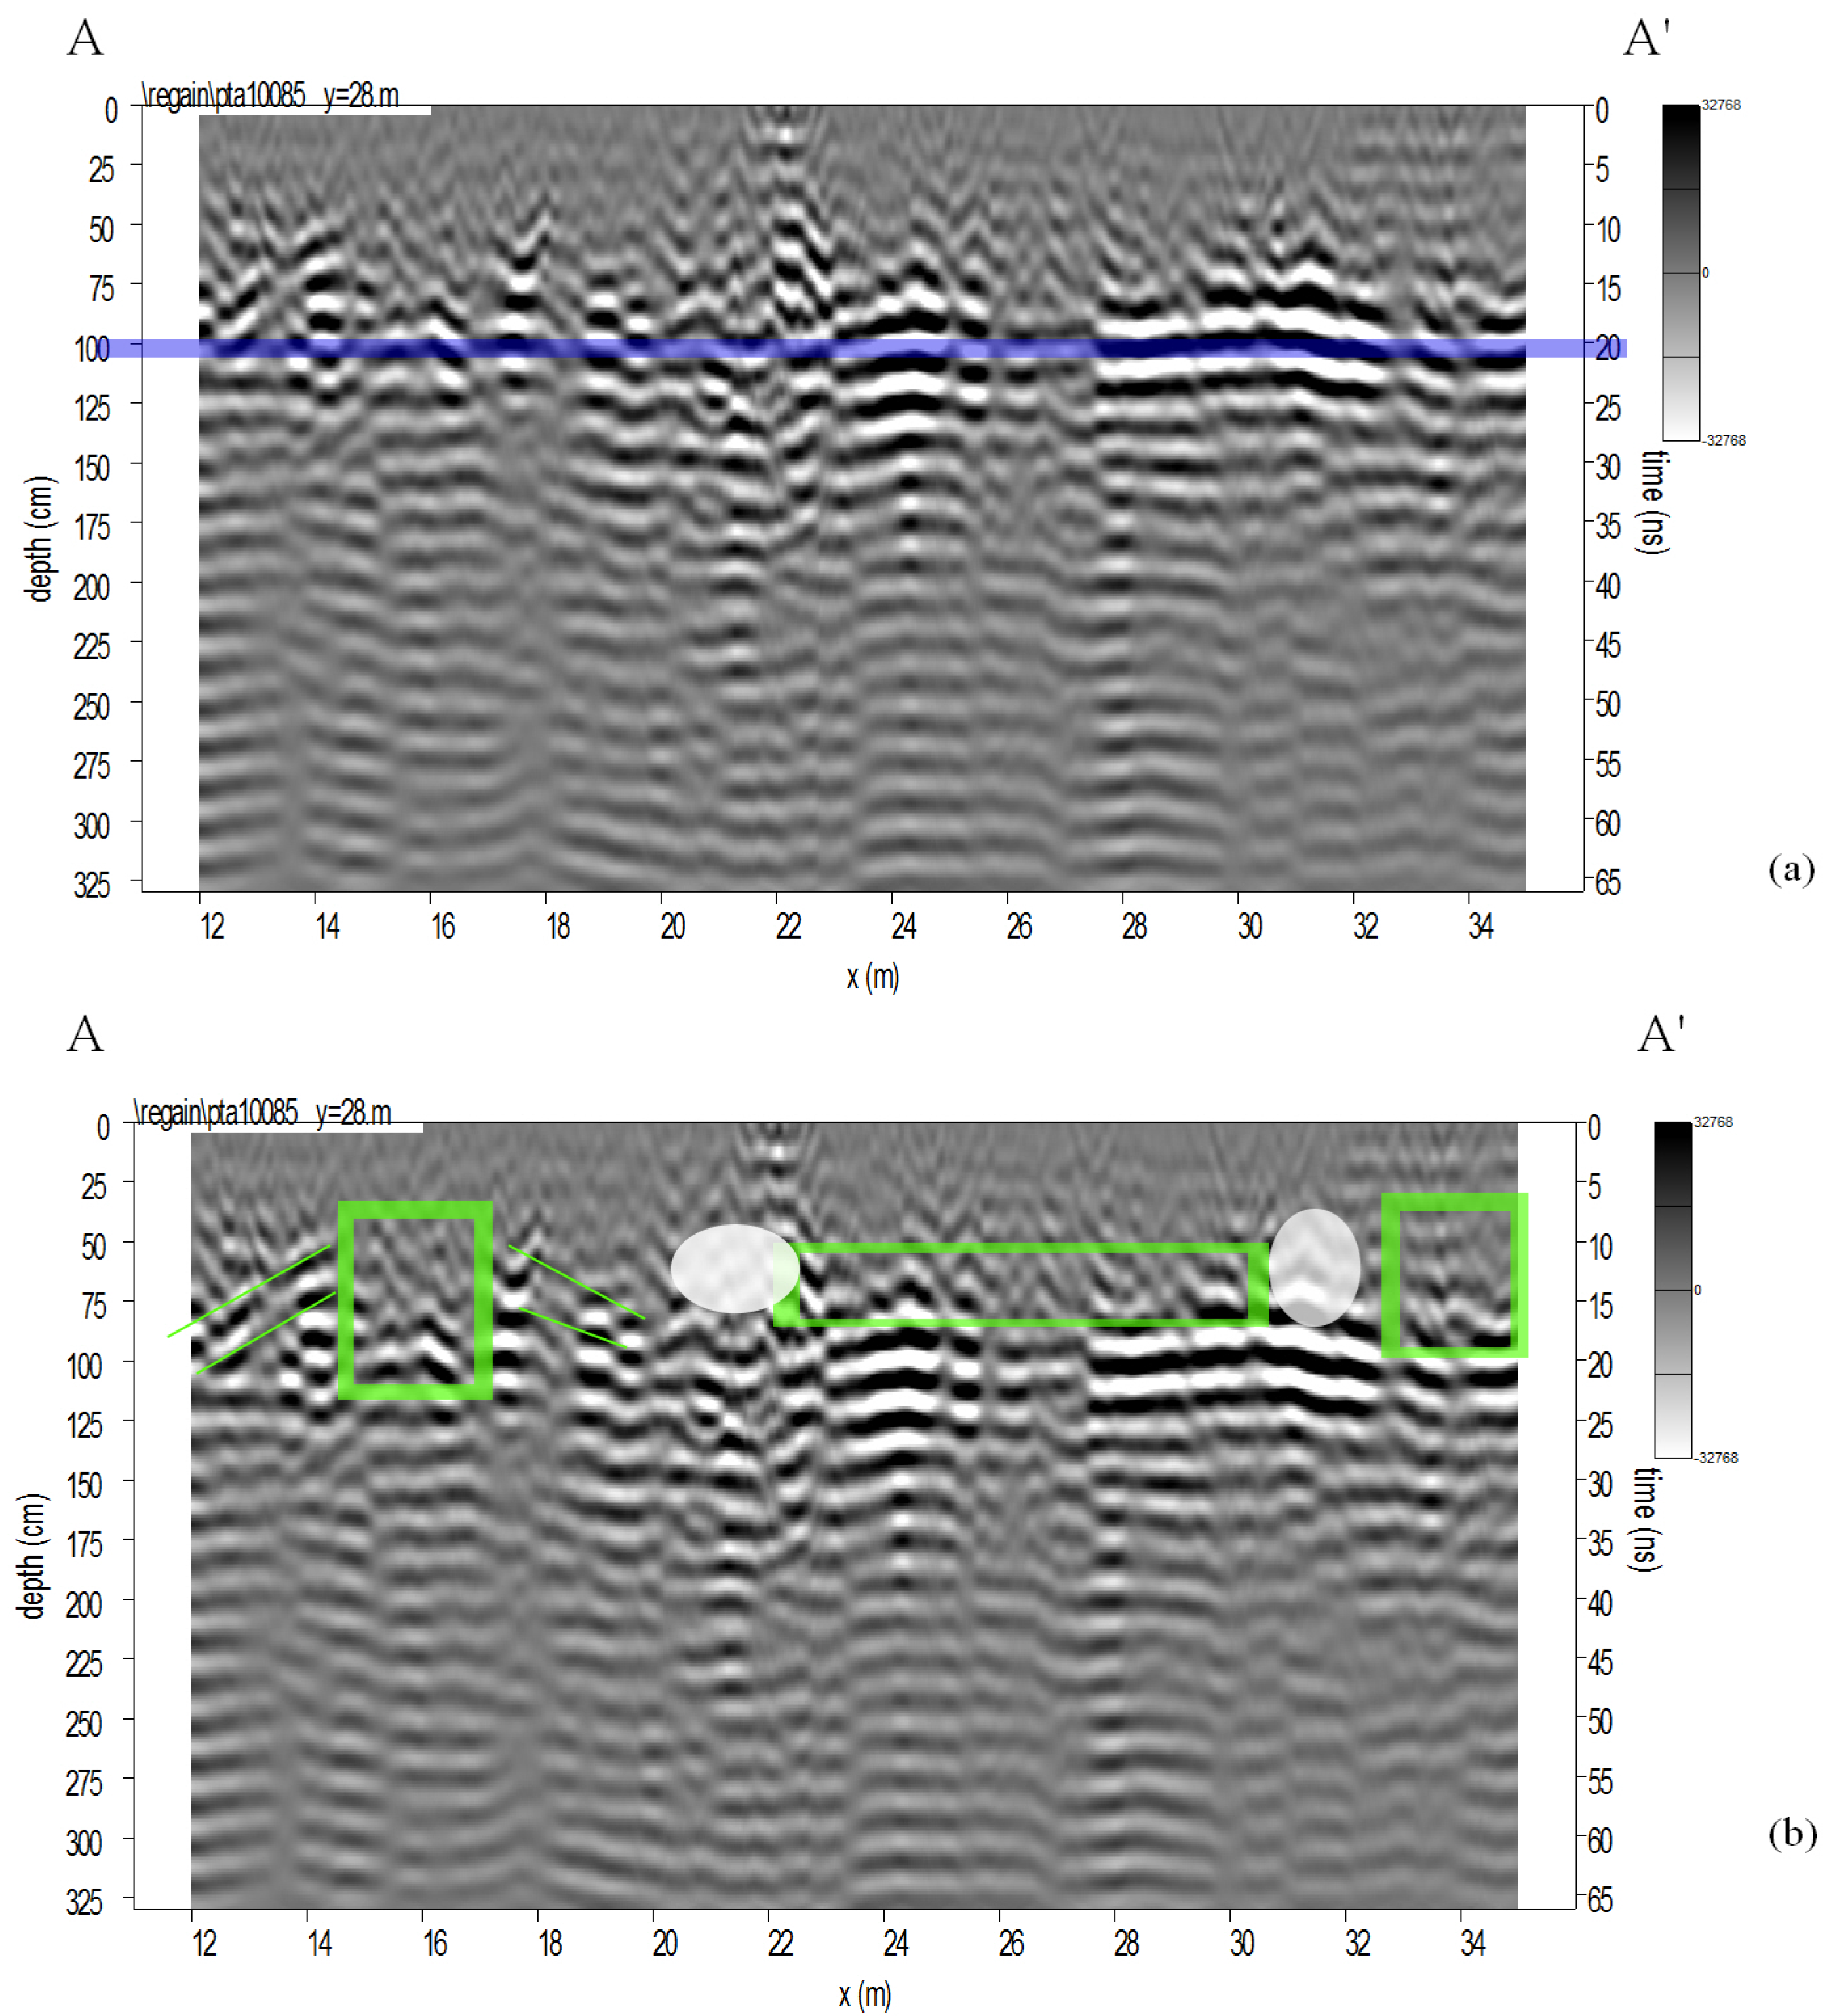
  • The amplitude was regained in order to highlight reflections and compensate for depth. (Figure 4).
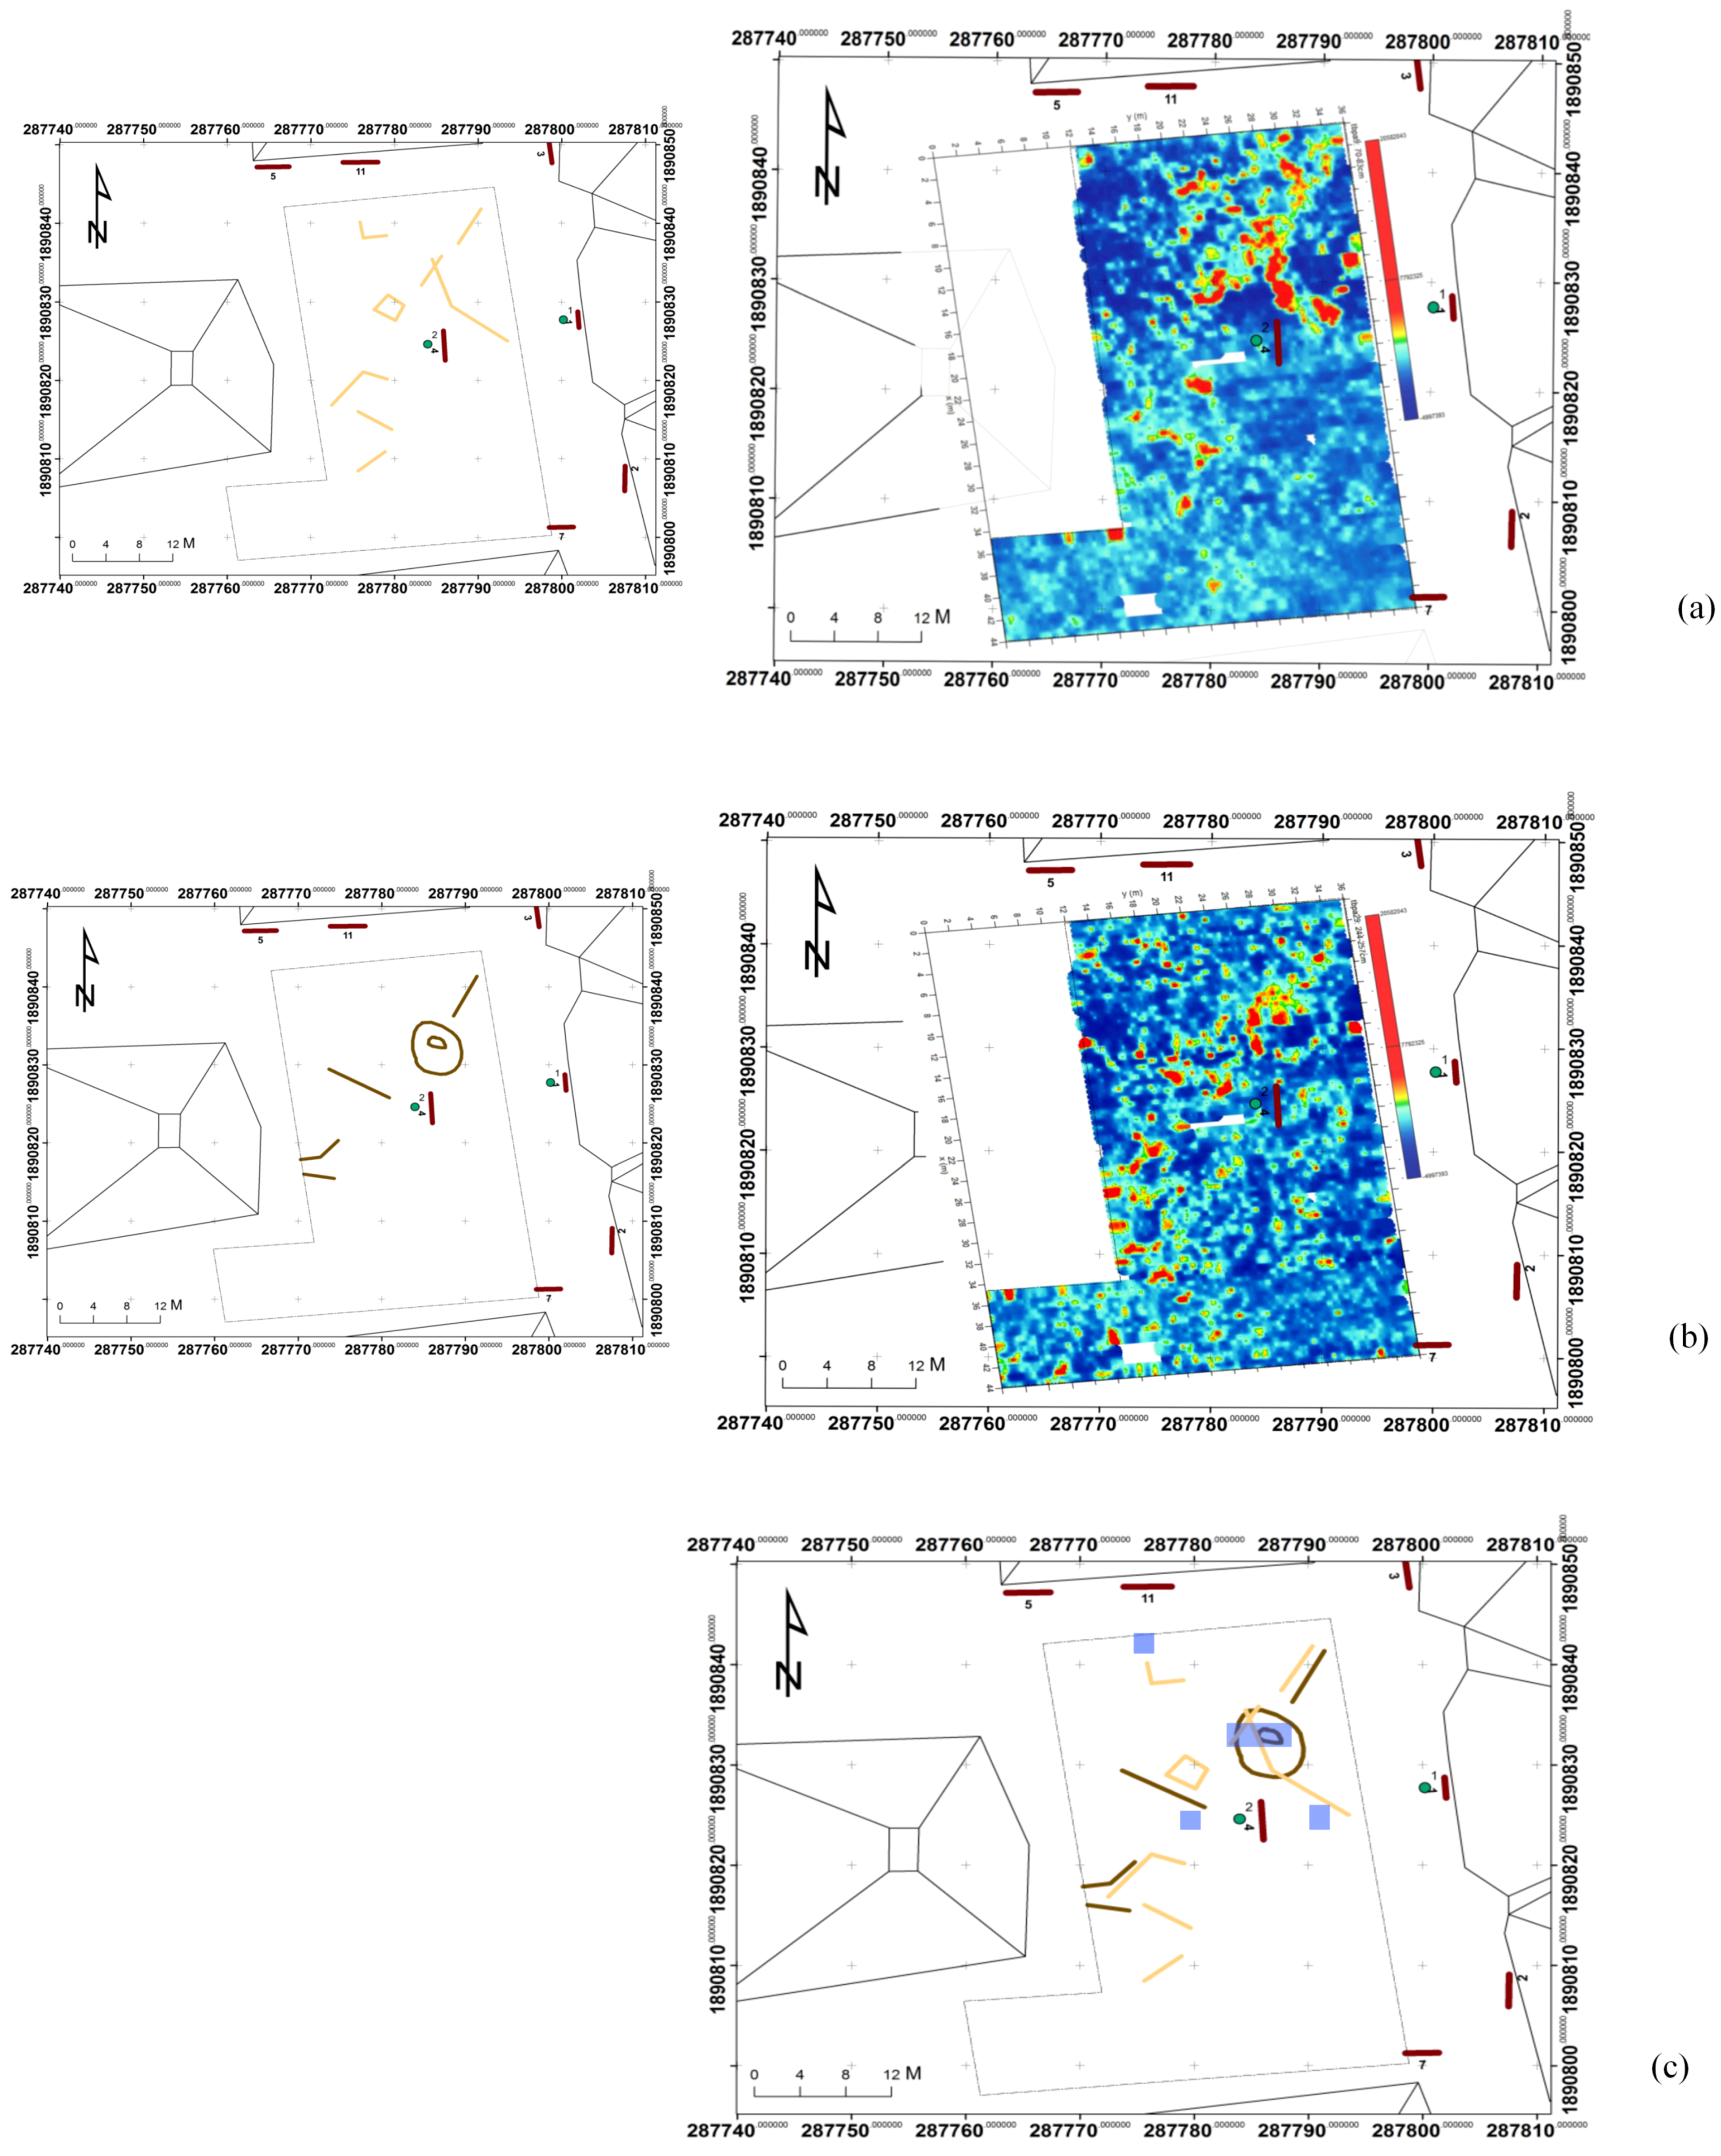
  • The scans were then grouped into time intervals to separate slices with a 5% overlap of each slice in the vertical direction and no overlap in the horizontal. The square amplitude of the wave in that cell is then applied and used as the new value. Multiple different time intervals were compiled to determine which yielded the best results.
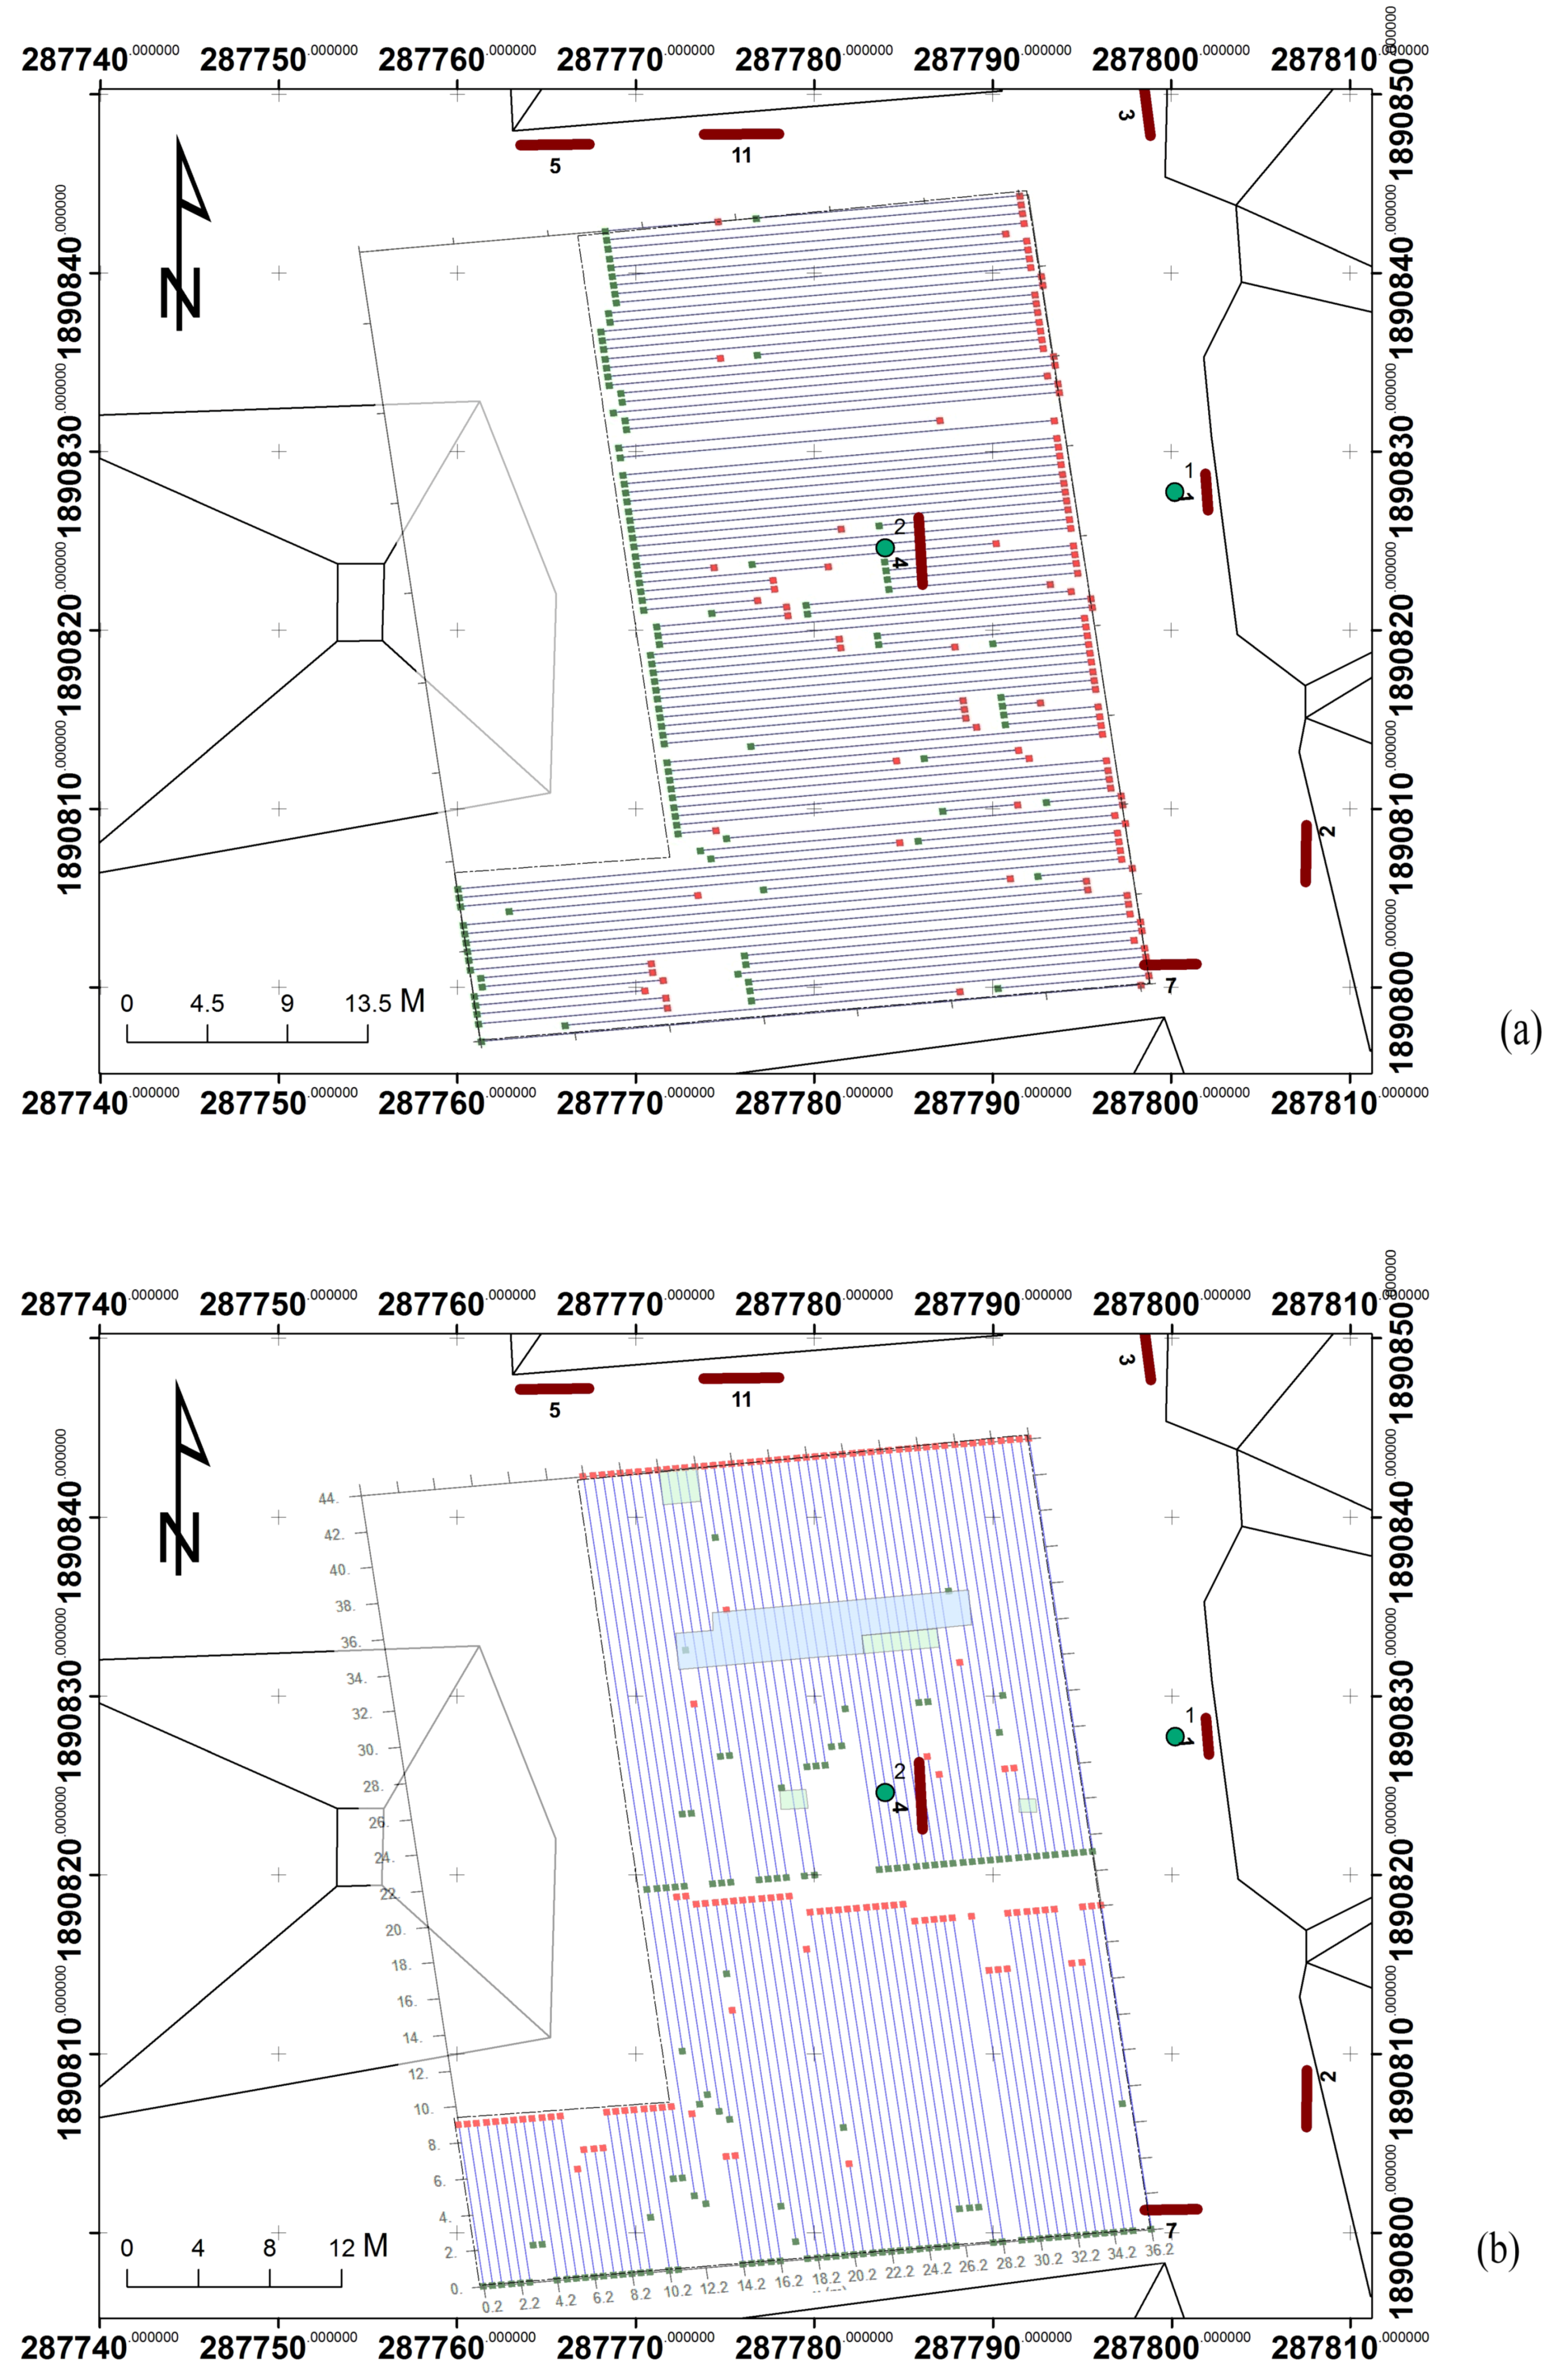
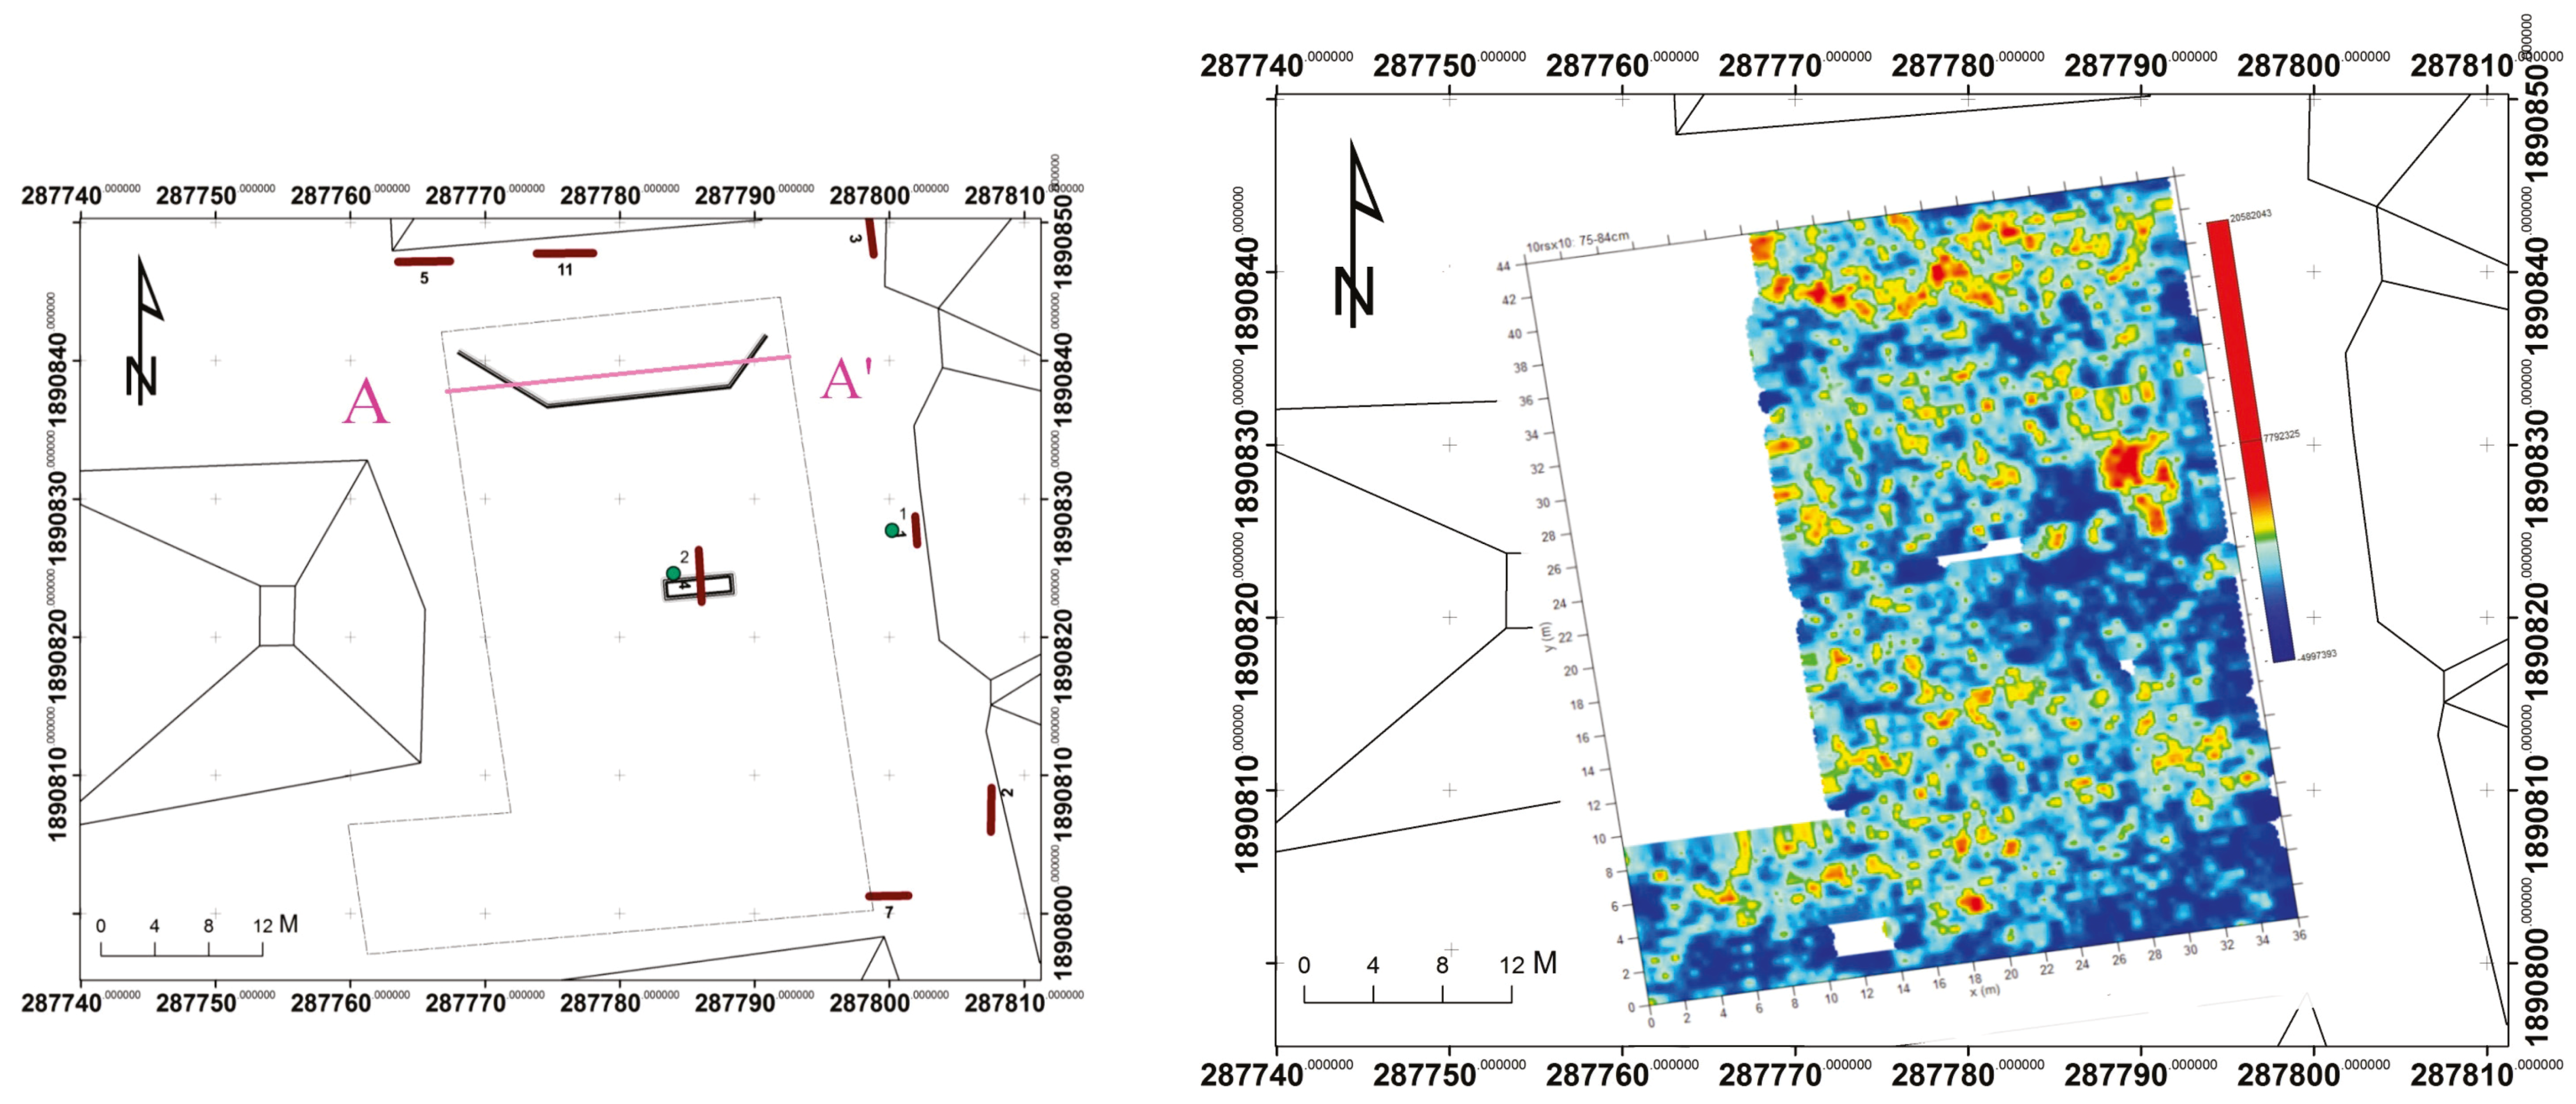
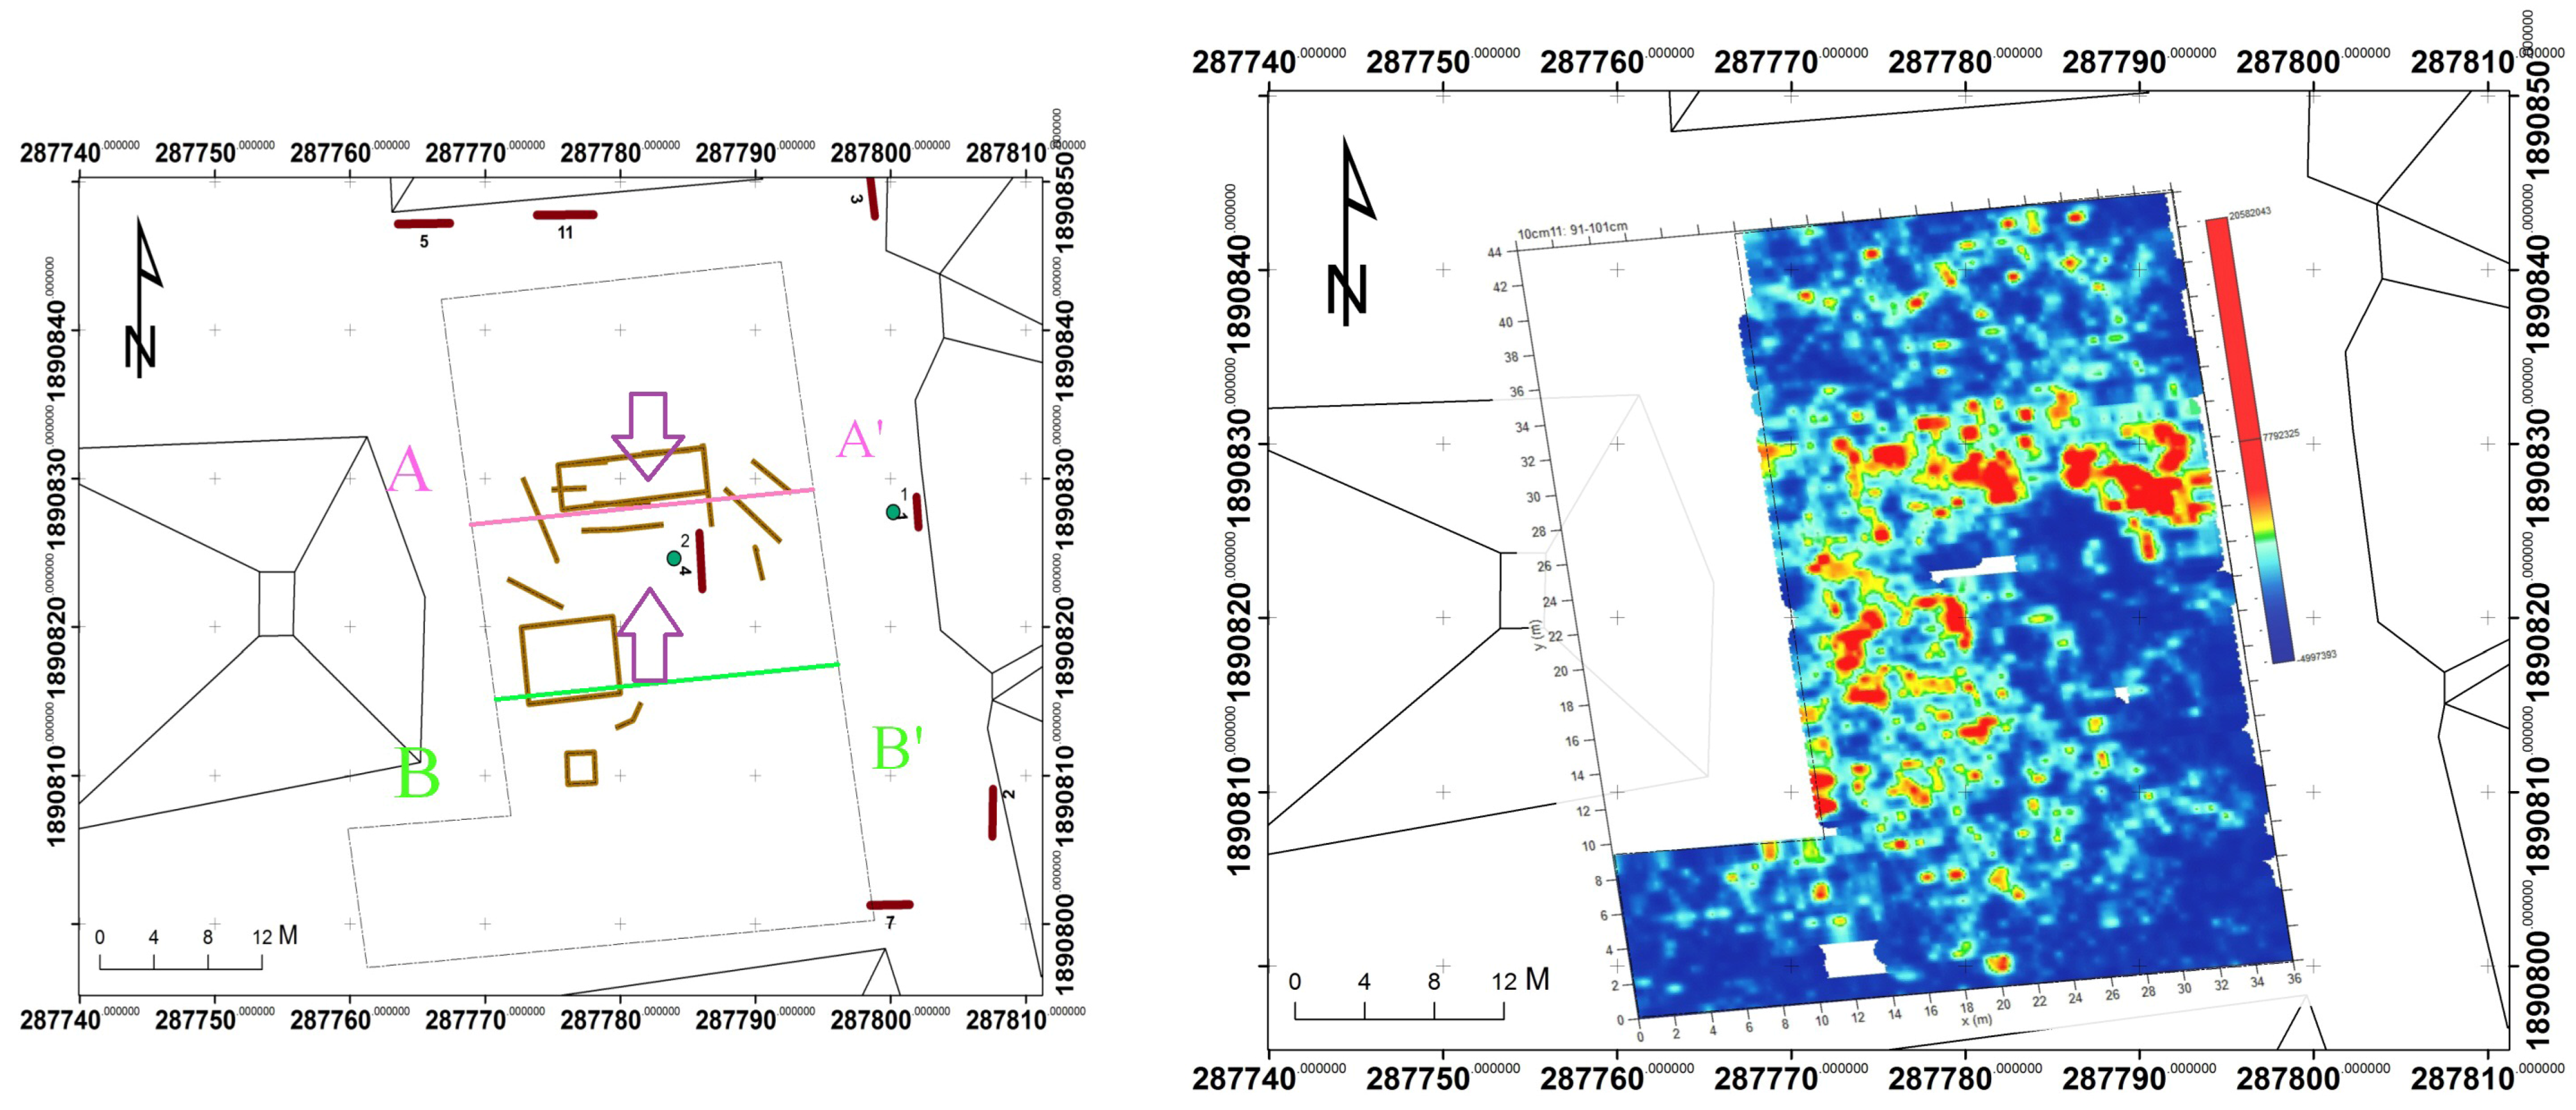
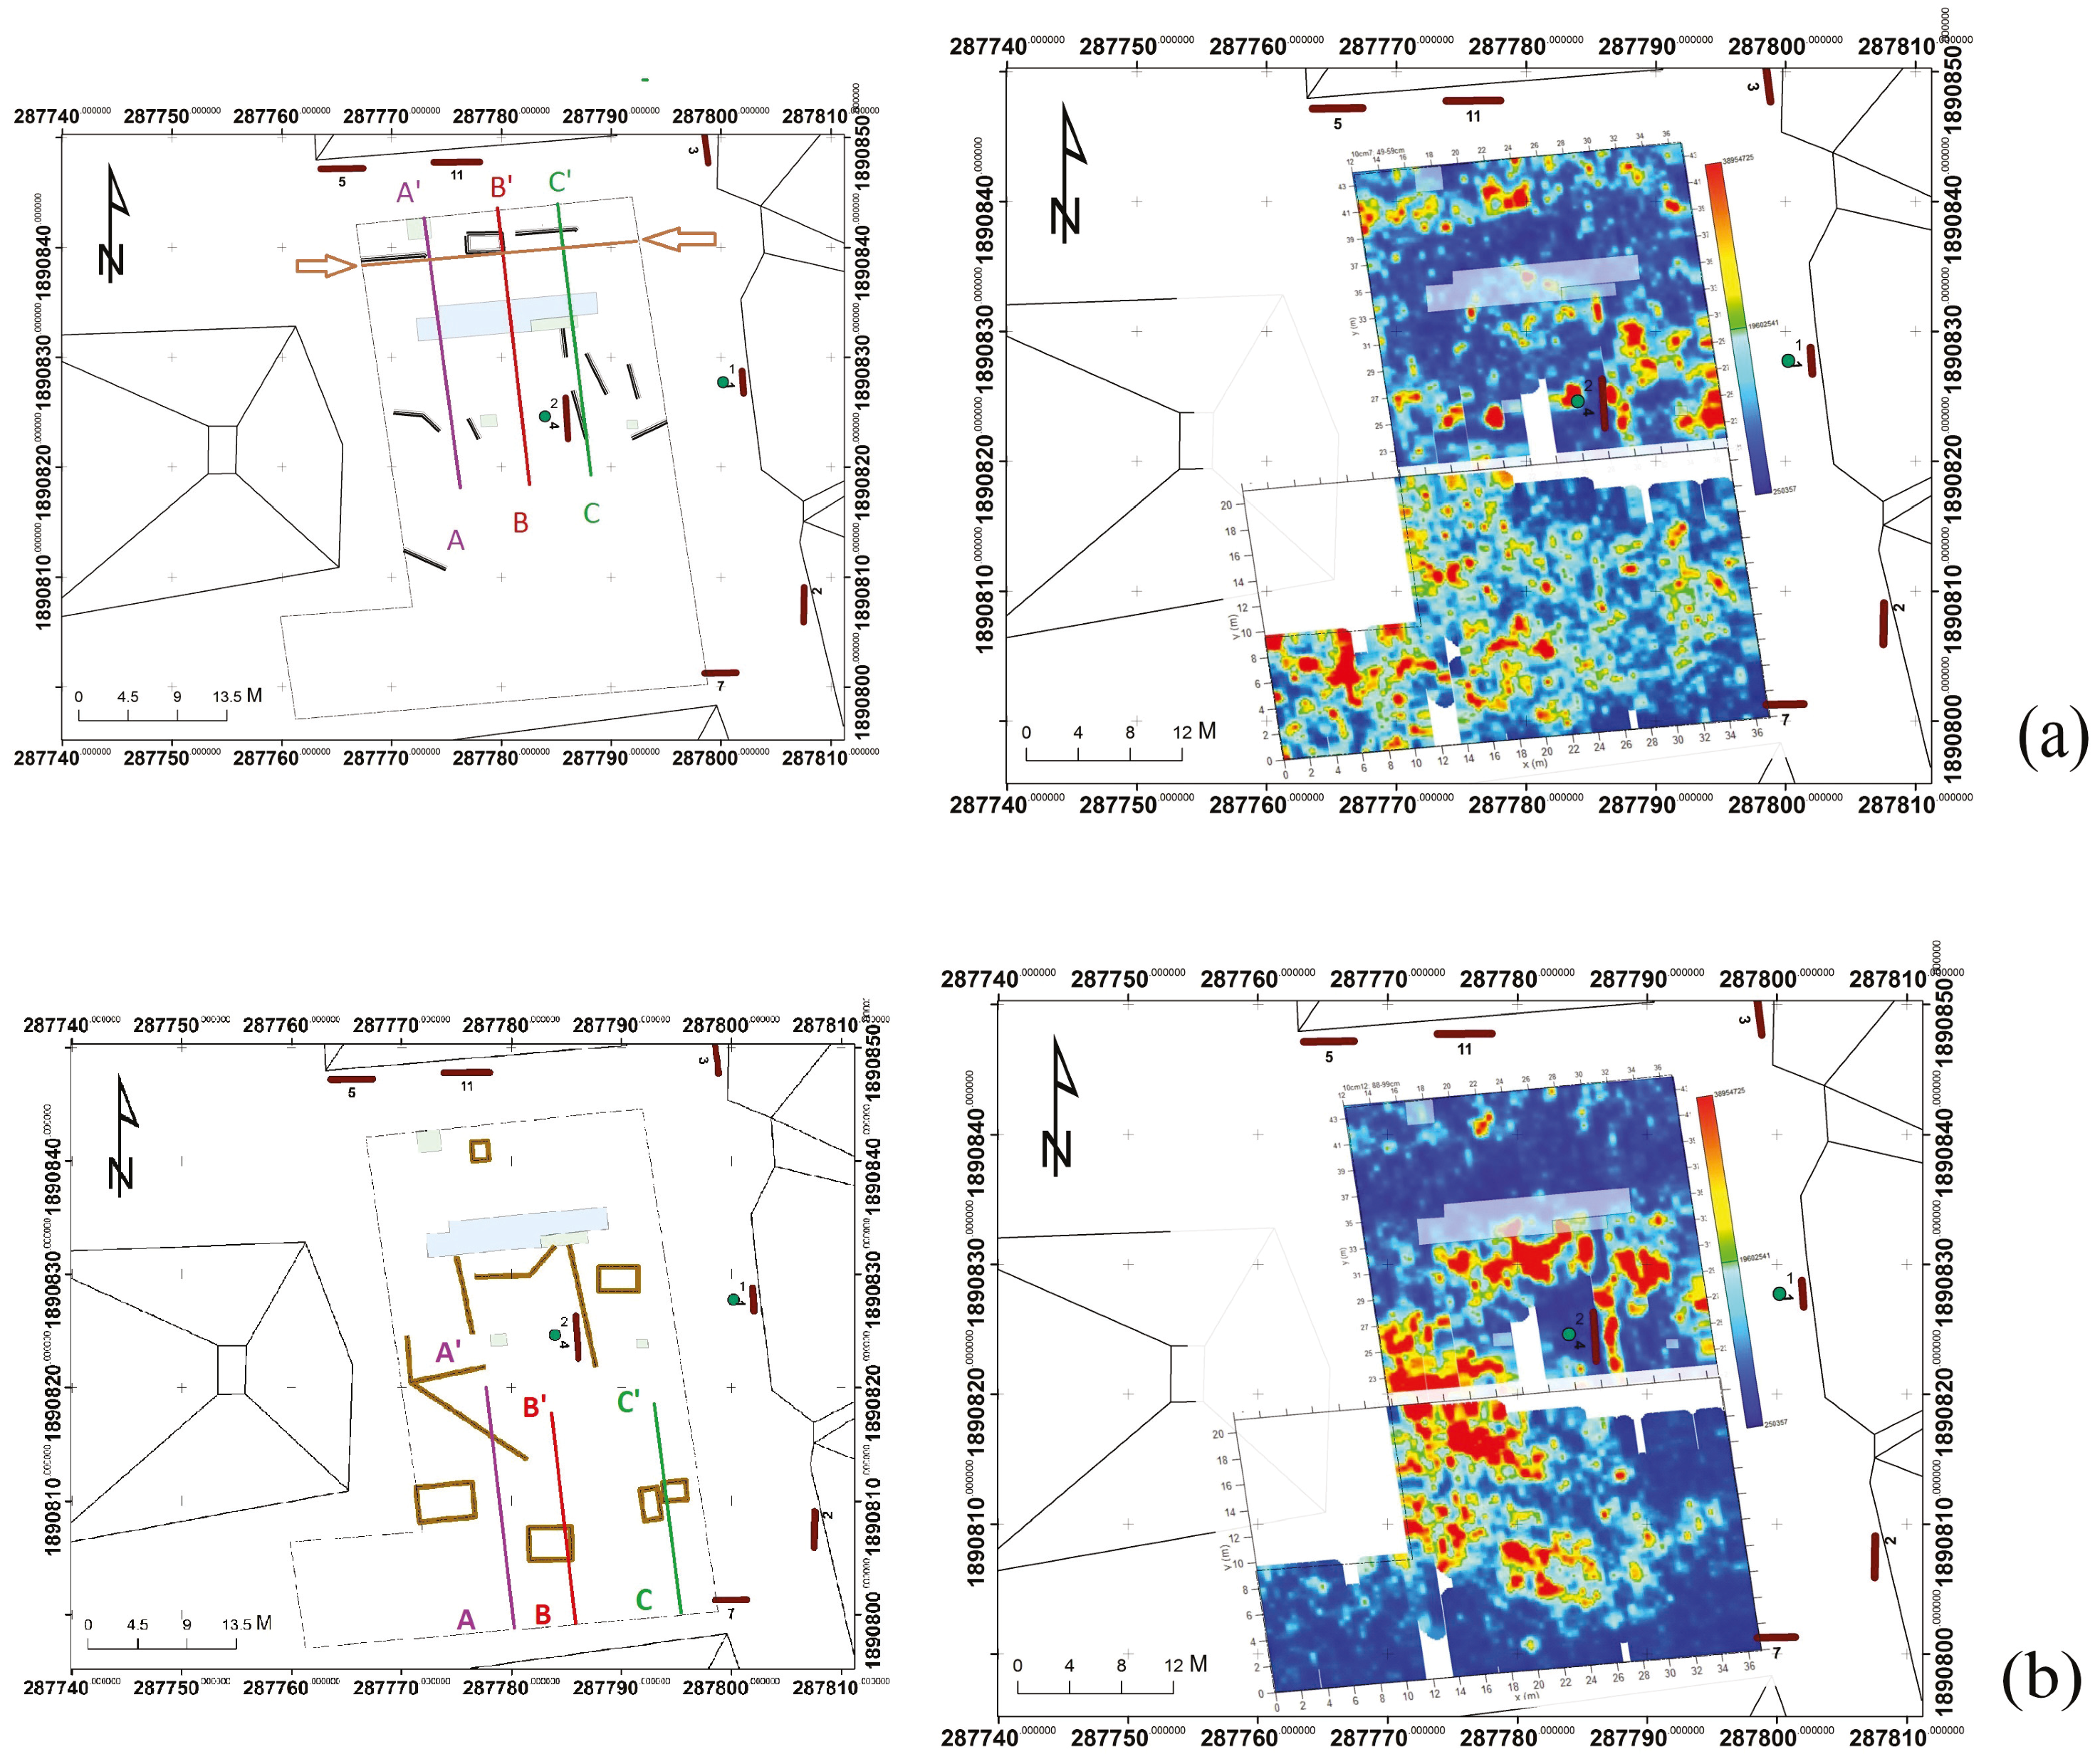
  • A grid was created from each of the time slices in order to fill in values between survey lines using an inverse distance interpolation with an exponential factor of 2, a 0.75 m search radius, and a resolution of 0.1 m cell size. The grids are presented as pixel maps that have the values normalized and assigned colors based on the minimum and maximum values for each grid.
Adopting an average velocity of 0.1 m/ns, determined by hyperbola fitting of selected areas, each time-slice was transformed into a depth-slice of a certain thickness. The depth-slices were then geospatially referenced into the project GIS using GPS readings from the corners of the grid and the survey wheel results. The most significant depth-slices and interpreted anomalies are shown in Section 3.
Initially, the 2012 survey data used a background filter determined from each profile line that was much too short, and surfaces of interest that were parallel to the ground surface were unfortunately removed from each profile. The velocity of the soil was also over estimated at 0.15 m/ns, which caused migration and depth estimate errors. The amplitude maps from this processing were used to target excavations. After the excavations of the 2013 season, the data were reprocessed with better identification of features. However, this does not allow for the removal from the generated grid of any noise caused by potential differences in soil conditions due to the time elapsed between the different surveys [62].

2.3. Magnetometer Survey

In both 2012 and 2014, the magnetometer survey followed the same survey lines as the GPR, with the GEM-19 set to record a reading every 0.5 s. The magnetometer sensor was suspended 30 cm above the ground surface. Due to the large number of 1500+ nT dipoles discovered in the 2012 survey, a metal detection survey using two Minelab CTX3030s was performed to eliminate modern metallic trash prior to the 2014 survey. Ten person hours of metal detecting collected 1.5 km of small metallic objects and numerous large objects. Unfortunately, even after the metal detection survey, the presence of large amounts of modern metallic trash caused numerous large dipoles that made the results useless.

3. Results

3.1. GPR

3.1.1. 2012 Survey

The GPR survey results allowed detection of an area within the survey area which satisfied the 2013 season goals of excavating unknown Middle Preclassic (900–300 BCE) features in Plaza A. After processing of the GPR data, which included background removal and migration filters, the amplitude maps in Figure 5 were generated. There are significant numbers of reflections in the shallower depth-slice (Figure 5a) trending to the northeast, a rectangular feature just north of the blank area in the center, and also a longer linear feature oriented more directly north. The latter was believed to be a stone wall based on its direction, shape in profile, and the presence of a similar feature in previous Plaza A excavations. In a deeper depth-slice (Figure 5b), the high amplitude reflections are fewer, but a circular pattern appears with a high amplitude reflection at the center. The most important excavation unit of that season was a 1 m by 4 m trench placed to ensure this area was sampled, as well as to expose the shallow linear features (Figure 5c). The other units in Figure 5c were placed based on alignments with the centerlines of the surrounding structures corresponding to small, but high amplitude reflections.
After the excavations of the 2013 season (detailed in Section 3.2.1), it was clear that the initial data processing procedures had failed to reveal the true nature of the feature under the northern end of Plaza A, so the data were reprocessed with a medial background filter and a migration filter that incorporated the layers encountered in the excavation. The most likely reason the initial processing failed was because the background filter was very narrow. Thus, layers of clay rich soils that abut the archaeological features of interest were filtered out.
Also filtered out by the background filter were the plaster surfaces parallel to the ground surface. Additionally, the assumed velocity of the radar waves through the soil was adjusted to 0.1 m/ns for estimation in the amplitude depth-slices. More emphasis was placed on profile analysis, only using the amplitude maps as supplements to the profiles. After reprocessing, the amplitude map in Figure 6 is a better match to the known excavations. The authors also decided to perform a north–south oriented survey at the beginning of the 2014 field season (Figure 3b) before excavations started to try to better characterize the features in Plaza A and to investigate whether archaeological features found in the excavations were more apparent in this direction. The depth-slice in Figure 6 is at about 80 cm depth, and has high amplitude reflections in a curved pattern disappearing off the north end of the survey. The plaster surface discovered by excavation is only 40 cm deep, and very poorly preserved. This surface is shown across the length of the north end of Plaza A in the profile 40 m north in marked A to A’ in Figure 6 and Figure 7. Profiles starting a meter south of profile 40 m show this same plaster surface, which slopes down towards the south, as confirmed by excavation. Holes into the plaster surface are noted by white circles in Figure 7b. Except for the rectangular area around the stela noted in Figure 6, which appears in profile to be a portion of the stela base platform that extends from 40 cm depth to 80 cm depth, all other high amplitude reflections (red and yellow areas) in the southern area of Figure 6 correspond to large trees and plants, and are most likely roots. The reflection off the plaster floor in the northern end of the survey is not associated with such obstructions, since that area is a generally open portion of the plaza.
The depth-slice comparable to the original data processing procedure at 250 cm depth-slice (Figure 5b) shows only random noise and is not presented here. At 250 cm depth the results are beyond the effective depth of the GPR signal. Instead of focusing on the deeper layers, a new amplitude depth-slice was generated from the 2012 survey data using the updated processes. This depth-slice, approximately 100 cm deep (Figure 8), shows numerous reflections between 26 and 30 m north (between the purple arrows). These correspond with the stairs and terraces discovered in the 2014 and 2015 excavations detailed in Section 3.2.2. Figure 9 shows the west to east profile at 28 m north which crosses the area from A to A’ in Figure 8. The vertical green rectangles show stone walls called task units found in excavation (See Section 3.2.1). The wall on the west side of the plaza has alternating layers of marl and clay that slope up from a base at 100 cm deep to the top of the wall at only 40 cm deep. An example of these can be seen in the excavation photo looking north at the layers next to a task unit still buried in the unexcavated soil on the left in Figure 10. An additional area of high amplitude reflections is just a little south and west of the stela and altar locations in the center of the survey. The west to east profile 17.5 m north which crosses the area (from B to B’ in Figure 8) is shown in Figure 11. The area in the red boxes in Figure 11b appear to be walls built on top of a horizontal surface 100 cm deep that cannot be explained by the north to south running task units known to cross the plaza. Further archaeological investigations to be conducted in the 2017 season should reveal if this is another buried structure measuring 5 m by 5 m in size, as it appears likely.

3.1.2. 2014 Survey

After the 2013 excavations revealed a large structure located in the north end of Plaza A, a new GPR survey was coordinated to run in a direction perpendicular to the 2012 survey. This survey took place in May 2014, just before the backfill was removed again from the 2013 excavation units. The GPR survey results allowed us to examine profiles which matched the results of the reprocessed data from the 2012 survey, but perpendicular to the edges of the structure. In Figure 12a, at 60 cm depth, high amplitude reflections from the clay layers abutting the structure on the north side of the plaza show up around 38 m north (shown by brown line and arrows). These are the edges of the highest plaster surface of the structure discussed in Section 3.2.2. Just as in the 2012 survey, this is the last step up to the highest platform, just not as clearly visible in the 2014 survey amplitude depth-slice. This step up of the plaster surface can be seen in all the profiles in Figure 13 at approximately 40 cm depth. The square area just north of these edges in Figure 12a at the north end of line B to B’ was of interest because it lies inside the shallowest area of the buried structure, and also on the centerline of that structure, but in profile it appears to be just a larger than average limestone block.
As shown in Figure 12b, the eastern task unit appears in profiles at 100 cm depth and trends approximately north–south across the plaza, just east of the central stela location. This task unit continues to the southern end of the northern portion of the survey. Stairs and armatures also show up at 100 cm depth with the sloping clay/marl layers causing high amplitude reflections in the depth-slice just south of the excavation unit. In addition, in Figure 12b, the western task unit shows up as an area of high reflectors running approximately north–south just to the west of the stairs, which are shown by the green lines in Figure 13a.
The three profile lines across the southern plaza survey area of the 2014 survey (Figure 12b) are shown in Figure 14. The high reflectors on the east side of the amplitude depth-slice likely show the sloping marl/clay layers circled in white in profiles A to A’ and B to B’ in Figure 14a,b, between 5 m and 15 m north. At the edges of these layers are areas of scattering, most likely caused by stones. These areas are marked with white vertical circles in Figure 14a,b.
The two rectangular areas outlined on the depth-slice in the southeast corner of Figure 12b, at about 100 cm deep, are located where a known fragment of carved stone monument lies flat and is buried about 60 cm. This area is circled in white in the profile from C to C’ in Figure 14c. The base for this stela has never been located [45,63].

3.2. Excavations

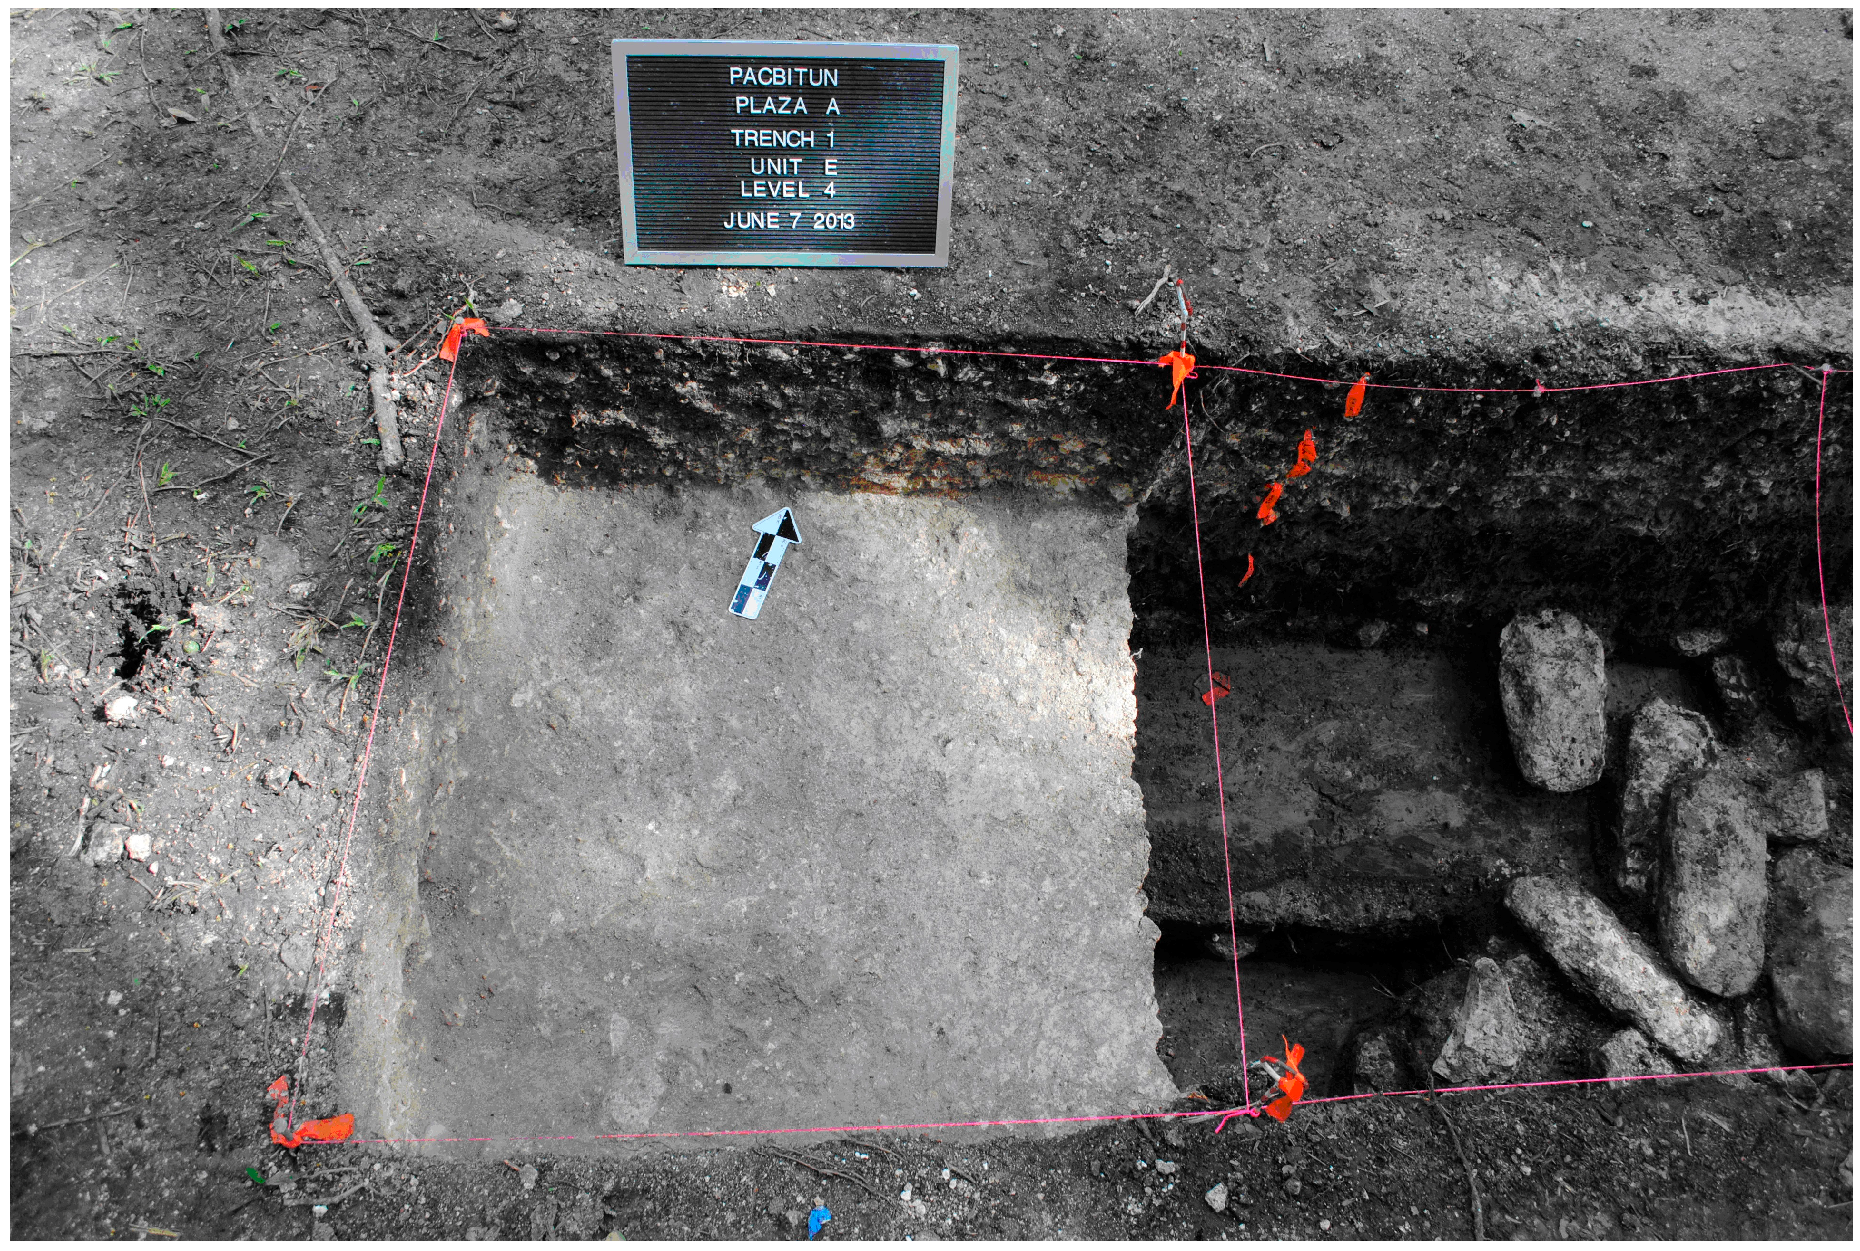
3.2.1. 2013 Excavations

As stated earlier, a high amplitude reflection which formed a circular pattern in Figure 5b (a false signal) was targeted in the northern portion of Plaza A. In an attempt to locate sub-plaza Middle Preclassic monumental architecture, we decided to test this area in 2013 [64]. Circular structures in Maya archaeology are typically associated with ceremonial activities [65,66]. An excavation trench, measuring 1 m by 4 m, was positioned to bisect its center [67]. At less than one meter deep our investigations revealed a stone wall, which was identified as a task unit. Task units are similar to construction pens in that they are walls that are laid down, and the space between walls filled with earth and rocks, prior to enlarging a plaza area for the construction of temples and palaces [68]. Task units prevent the construction fill from moving once the weights of these monumental constructions are built over top. What was interesting about the stone wall found in the 1 m by 4 m unit was that it sat atop a burned plaster floor surface. What originally was thought to be a plaza floor surface, upon further excavation, was revealed to be a step (Figure 15). This step did not belong to a small three meter circular structure as indicated by the amplitude map, but instead to a large square structure which we continue to excavate to the present. After exposing eleven meters east–west by seven meters north–south, it was obvious by the end of the 2013 field season that we had discovered a massive sub-plaza temple. In 2014 and 2015, PRAP continued to uncover the temple, now dubbed El Quemado, or “Q” for short, meaning “the burned one” due to extensive burning on much of its plaster surface.

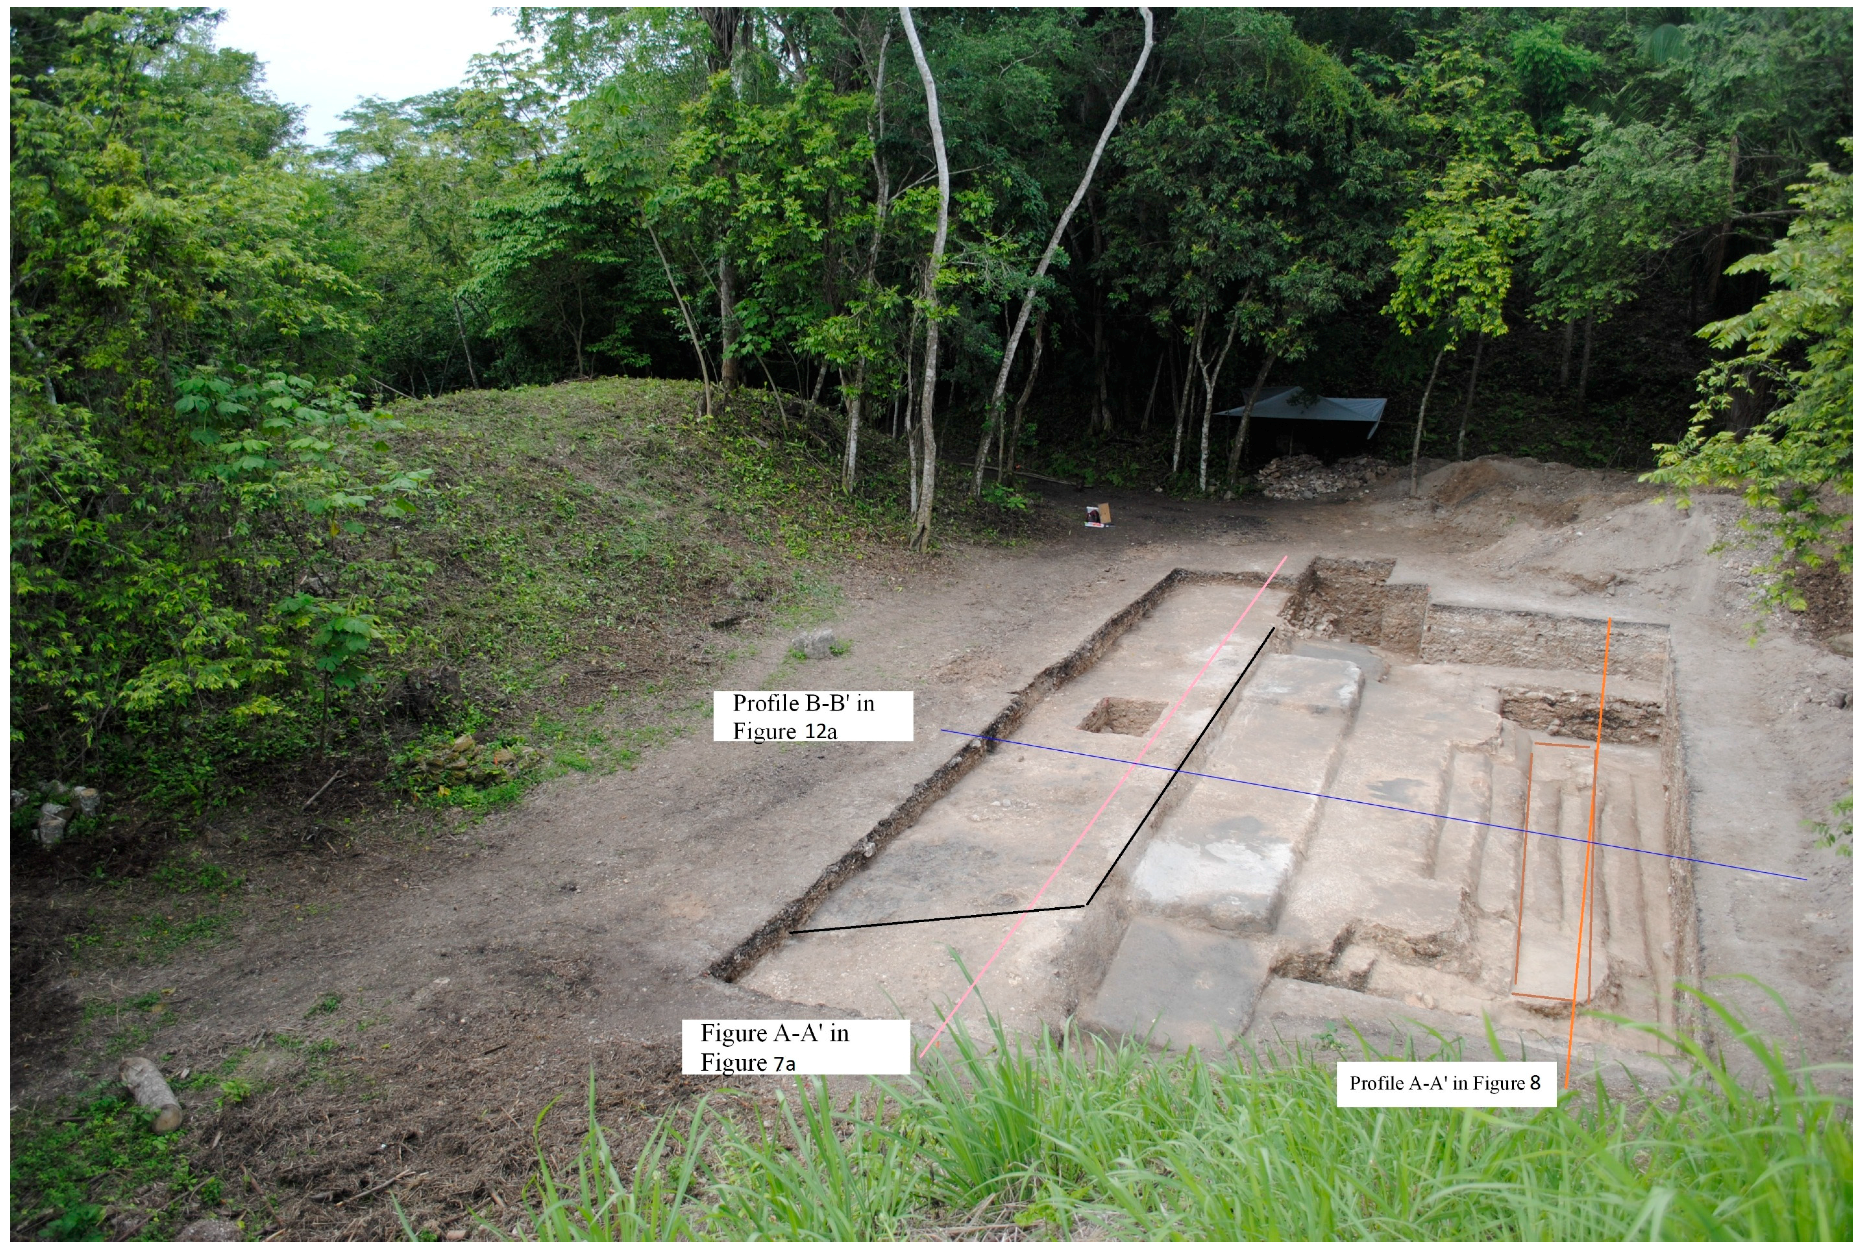
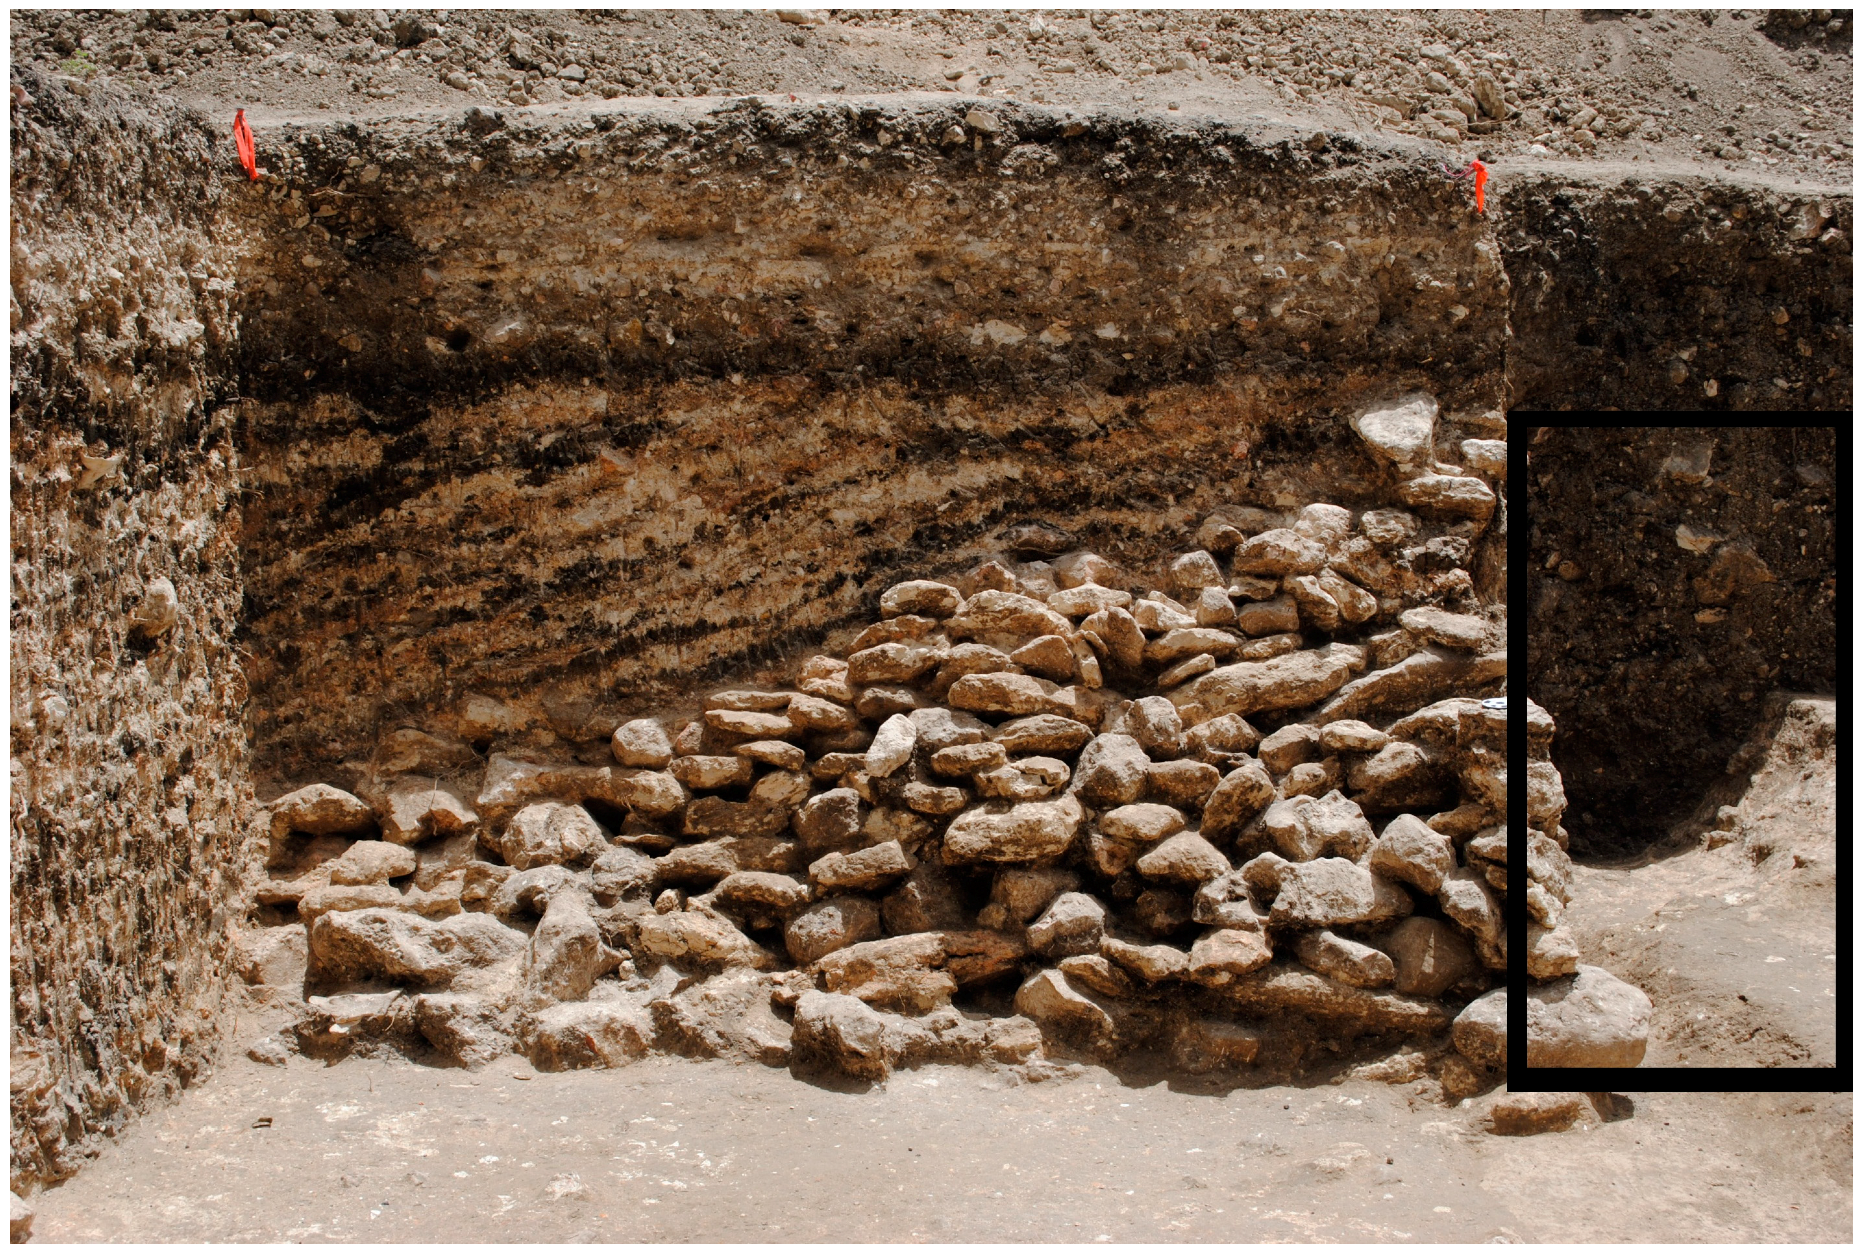
3.2.2. 2014–2015 Excavations

During the 2014 and 2015 field seasons, we continued to investigate Q with large-scale horizontal exposure and units that penetrated the structure to bedrock. Radiocarbon samples taken from a test unit exploring the structure’s presumed midpoint correspond with the ceramic evidence and confirm a Middle Preclassic date (ca. 550–400 BCE). This test unit into Q also found no earlier architecture, suggesting that the platform may have been built as a single construction effort. The excavation of Q, currently measuring at least 25 m east–west, almost spans the width of Plaza A. Twelve meters have been uncovered north–south, almost completely exposing the southern face of the building. Lining the southern central axis of the platform, eight stairs run from its presumed base to its summit. Flanking the southern central stairs are four armatures, two on each side encasing the ascending stairs (Figure 16). Excavations of the summit to this point have yet to produce any evidence of postholes, which would indicate that no perishable superstructure existed. Based on our excavations of three sides to date, it appears that Q is rectangular in form. Additionally, two red-slipped jars resembling teapots were deposited on separate sides of the temple directly on the plaster surface—Maya archaeologists have referred to these jars as chocolate pots [69]. These are most likely ritual offerings.
Although the preservation of Q is quite good, there are several areas that appear to be purposefully destroyed. The summit of Q, which stands approximately 3 m tall, is the least well preserved and also exhibits the most extensive burning. The armatures that line the southern stairs also appear to have been purposefully destroyed. In this case, however, the stucco debris was not discarded but was left piled in front of each armature where it had been broken off or chopped. Although heavily eroded, we propose that the stucco piles are likely remnants of masks that adorned each armature. The poor condition of the stairs is likely a consequence of the destruction of the southeast and southwest corners of the building. This may have occurred during its abandonment.
Evidence suggests that Q was abandoned around 400 BCE. Rather than razing and incorporating elements of Q as a core within a later building construction, a common practice throughout Mesoamerica, the inhabitants of Pacbitun decided to bury this monumental building virtually intact to start anew. Evidence such as chopped corners, extensive burning, ceramic offerings, and the possible destruction of masks suggest that the platform may have been ritually terminated [70,71,72,73,74,75]. The platform was then covered in a thick layer of muck, aiding in its preservation. Task units, as discussed above, were set to build up and enlarge the plaza to its maximum extent, ultimately covering the massive early platform with a floor just above its summit, thereby sealing Q below what became the main plaza during Pacbitun’s subsequent Late-Terminal Preclassic (BCE 300–250 CE) site regeneration and Classic (250–900 CE) period apogee.
Now, with the building exposed once again, our goal has been to determine the architectural shape, style, and orientation. Understanding Q’s architecture may help to identify its form and function and possibly reveal an early plaza scheme that may involve other Plaza A structures [76]. In sum, no comparable architecture to Q has been found in the Belize River Valley. At present, Q is the largest and most elaborate Middle Preclassic structure found in the region.

4. Discussion

GPR

It is always important to examine the original GPR profiles used to generate amplitude depth-slice maps of anomalies. This was particularly the case at Pacbitun, since the task unit walls cover significant portions of Q and have much stronger reflections in the amplitude depth-slices. Additionally, the uniqueness of Q means that the authors had no previous mental model of that size and probable dimensions to compare to the radar reflections.
This is where the archaeological excavations really allowed the authors to separate the much more subtle signature of Q to be determined in both the reprocessed 2012 survey data and also the 2014 survey. It is unfortunate that less cluttered magnetic data could not be obtained in order to have two geophysical methods to compare against each other. In Figure 13a,c, the green markings show the reflections created by the task units. The task unit stones create multiple overlapping hyperbolas even after some of the tails were removed in the migration data processing step. This masks the true profile of Q (yellow line under the task units which was unclear until excavations in 2015). The task unit in Figure 13a appears to end by sloping down towards the south to 150 cm deep while the one in Figure 13c maintains the same height across the profile survey and ends at the stone wall or stone edge of Q at 26 m north along the profile. Both of these observations are supported by the archaeological excavations shown in Figure 17 and Figure 18. In Figure 17, the south sloping marl/clay layers appear as weak reflections in the profile, but are much stronger reflections in profiles where the slope of these types of layers is perpendicular to the survey direction. The archaeological interpretation of these layers is that basket loads of sediment used to fill between the task units were deposited by tossing it into the space from the top of the task units themselves.
In Figure 18, the task unit height remains constant and abuts with the stone edge of Q. This is seen in the radar reflections of Figure 13c, and the authors have marked the steep slope of Q in this profile with a yellow line. The task unit was interpreted as a stone wall and marked with a green circle and lines.
The weakness of the reflections from most of the horizontal surfaces of Q compared to the strong reflections from the sloping marl/clay layers and large number of randomly scattered stones up to 0.5 m in diameter that are part of the plaza fill complicated efforts to create isosurfaces in the 3D model created from the amplitude slices. No clear representations of Q were achieved. A representation of Q was created using the reflections (shown by the yellow lines in Figure 13) from the 2014 northern plaza survey radar profiles as markers for a slicing horizon following the surface of Q instead of a horizon parallel to the ground surface. This process was also complicated by the task units and sloping layers, but a moderately accurate model which basically shows elevation of the top surface of the structure was created (Figure 19). A final option would be to simply add arbitrary blocks to represent known and probable surfaces of Q into the 3D model of the survey grid, but this felt too arbitrary to the authors, and so was avoided. Creation of the horizon slice model was useful, since during the process it was noted that on the northern end of the profiles the reflections of Q slope down towards the north. Excavations of the same areas covered by these profiles show the highest surface actually does not slope down, but continues beyond this apparent edge of the structure. This, along with the shallowest hyperbola circled in white in Figure 13b, suggests that there may be a second structure underneath the version of Q uncovered in the excavations.
One final question lingered from the radar profile analysis, namely the cause of the deep reflections circled in white in Figure 13. A model was created in the commercial software program GPR-SIM, authored by Dean Goodman, to try to determine if the hyperbolas were RR reflections off of corners of El Quemado’s stairs or platforms [77]. The simulation (Figure 20) uses three stairs or platform edges rising up on the left side and descending down on the right. The right side edges and horizontal surfaces are intentionally uneven to reflect the chopped nature of Q, which greatly reduced the strength of the RR reflection. The entire “pyramid” is buried under soil with dielectric of 11 and the structure has a dielectric of 8. Comparing the simulation RR reflections with the reflections circled in white shows that the circled reflections slope the wrong direction compared to the corners of Q, and additionally there is too much separation of the corners and the circled reflections. Thus the reflections are not from Q, but most likely independent reflections caused either by sharp drops in the bedrock surface or sloping surfaces of a different material (like chert) with different dielectric properties.
An amplitude depth-slice of the circled reflections does create a deep, circular pattern under the southwest side of Q. Given the parameters of the original processing of the data, this deep circular pattern did answer a final question for the authors; would we have excavated El Quemado if we had conducted the north–south GPR survey first, instead of the east–west survey? The goal initially was deep, circular patterns which could have represented Middle Preclassic structures. Since test unit placement focused on maximizing the number of anomaly types represented in a single 1 m by 4 m trench, it is certain that the area would have been excavated, and as a result would have uncovered parts of the western armature and stairs of El Quemado.

5. Conclusions

Through the use of GPR, the subsurface survey of Plaza A, Pacbitun was a success. The 1 m by 4 m trench determined most likely to contain Middle Preclassic features started the excavation of the buried structure El Quemado. The same events over 2400 years ago that preserved Q, namely the building of task units and also filling the plaza with sloping layers of marl/clay, also made it much more difficult to identify it in the radar profiles. The information gained through archaeological excavation allowed for better interpretation of reflections of the surfaces of Q that otherwise may have been discounted as unimportant layers of sediment. By reprocessing the 2012 survey data, and applying both a GPR-SIM simulation and horizon slicing, we were not only able to better identify the reflections related to Q, but also provide evidence that the buried structure may have more structures below the current excavations. In addition to better characterizing the nature of El Quemado, the reprocessing of the data and the GPR survey conducted perpendicular to the 2012 survey allowed us to identify additional areas in Plaza A worthy of exploration. There may be additional structures in the west and south areas of the plaza center. This shows the potential of geophysical prospection, since the most commonly used remote sensing technique typically employed in Belize, namely LiDAR, would not have located a buried structure. Clearly, further iterations of survey, process, excavate, and refine, are still necessary before we will have completely characterized all the reflecting layers and structures buried in Plaza A of Pacbitun.

Acknowledgments

We would like to thank the Geology Department of Georgia Southern University for providing both the geophysical equipment and the advanced software licenses required to adequately survey Pacbitun. We would also like to thank the Belize Institute of Archaeology for granting permits to explore Pacbitun in non-traditional ways. We thank both Jeff Powis and Jonathan Lohr for their photography skills and allowing use of the photographs. We would like to thank all the site workers and fellow staff members Norbert Stanchly, and Megan Parker, for assisting in carrying the heavy, yet delicate, geophysical equipment everyday. We thank Dean Goodman for processing a GPR-SIM model to help us understand some of the deeper reflections. We are grateful that the Bronx Community College Geospatial Center trained several students, particularly Nicaela Cartagena, in the use of Arc-GIS, which allowed her to help create the site maps. We are very grateful to Jon Spenard for his additional background research. Finally, we would like to thank the Alphawood Foundation for the financial support which allows undertaking such surveys.

Author Contributions

Sheldon Skaggs and Terry Powis are credited with planning the geophysical survey and writing the article. Clara Rucker is credited with editing the article and helping Sheldon Skaggs conduct the geophysical survey and process the data. Terry Powis and George Micheletti are credited with planning and conducting the archaeological excavations.

Conflicts of Interest

The authors declare no conflict of interest. The funding sponsors had no role in the design of the study; in the collection, analyses, or interpretation of data; in the writing of the manuscript, and in the decision to publish the results.

Abbreviations

The following abbreviations are used in this manuscript:
MDPIMultidisciplinary Digital Publishing Institute
ERT/ERIElectric Resistivity Tomography or Imaging
GMGeomagnetic Mapping
FDEMFrequency Domain Electromagnetic Methods
GPRGround Penetrating Radar; Georadar
BCEBefore Current Era
CECurrent Era
PRAPPacbitun Regional Archaeological Project
QEl Quemado, name of structure

References

  1. Pope, K.O.; Dahlin, B.H. Ancient Maya wetland agriculture: New insights from ecological and remote sensing research. J. Field Archaeol. 1989, 16, 87–106. [Google Scholar] [CrossRef]
  2. Garrison, T.G.; Houston, S.D.; Golden, C.; Inomata, T.; Nelson, Z.; Munson, J. Evaluating the use of IKONOS satellite imagery in lowland Maya settlement archaeology. J. Archaeol. Sci. 2008, 35, 2770–2777. [Google Scholar] [CrossRef]
  3. Chase, A.F.; Chase, D.Z.; Weishampel, J.F.; Drake, J.B.; Shrestha, R.L.; Slatton, K.C.; Awe, J.J.; Carter, W.E. Airborne LiDAR, archaeology, and the ancient Maya landscape at Caracol, Belize. J. Archaeol. Sci. 2011, 38, 387–398. [Google Scholar] [CrossRef]
  4. Masini, N.; Lasaponara, R. Satellite-based recognition of landscape archaeological features related to ancient human transformation. J. Geophys. Eng. 2006, 3, 230–235. [Google Scholar] [CrossRef]
  5. Lasaponara, R.; Masini, N. Detection of archaeological crop marks by using satellite QuickBird multispectral imagery. J. Archaeol. Sci. 2007, 34, 214–221. [Google Scholar] [CrossRef]
  6. Rowlands, A.; Sarris, A. Detection of exposed and subsurface archaeological remains using multi-sensor remote sensing. J. Archaeol. Sci. 2007, 34, 795–803. [Google Scholar] [CrossRef]
  7. Parcak, S.H. Satellite Remote Sensing for Archaeology; Routledge: Abingdon, UK, 2009. [Google Scholar]
  8. Pascucci, S.; Cavalli, R.M.; Palombo, A.; Pignatti, S. Suitability of CASI and ATM airborne remote sensing data for archaeological subsurface structure detection under different land cover: The Arpi case study (Italy). J. Geophys. Eng. 2010, 7, 183–189. [Google Scholar] [CrossRef]
  9. Agapiou, A.; Alexakis, D.D.; Hadjimitsis, D.G. Spectral sensitivity of ALOS, ASTER, IKONOS, LANDSAT and SPOT satellite imagery intended for the detection of archaeological crop marks. Int. J. Digit. Earth 2014, 7, 351–372. [Google Scholar] [CrossRef]
  10. Mauriello, P.; Monna, D.; Patella, D. 3D geoelectric tomography and archaeological applications. Geophys. Prospect. 1998, 46, 543–570. [Google Scholar] [CrossRef]
  11. Cardarelli, E.; Fischanger, F.; Piro, S. Integrated geophysical survey to detect buried structures for archaeological prospecting. A case-history at Sabine Necropolis (Rome, Italy). Near Surf. Geophys. 2008, 6, 15–20. [Google Scholar] [CrossRef]
  12. Trogu, A.; Ranieri, G.; Calcina, S.; Piroddi, L. The ancient Roman aqueduct of Karales (Cagliari, Sardinia, Italy): Applicability of geophysics methods to finding the underground remains. Archaeol. Prospect. 2014. [Google Scholar] [CrossRef]
  13. Capozzoli, L.; Delle Rose, M.; Lasaponara, R.; Masini, N.; Rizzo, E.; Romano, G. Satellite remote sensing and multiscale geophysical investigations for geoarcheology: Case studies from Perù. In Proceedings of the EGU General Assembly, Vienna, Austria, 7–12 April 2013.
  14. Dabas, M. Theory and practice of the new fast electrical imaging system ARP. In Seeing the Unseen; Campana, S., Piro, S., Eds.; Taylor and Francis Group: London, UK, 2009; pp. 105–126. [Google Scholar]
  15. Tabbagh, A. Applications and advantages of the Slingram electromagnetic method for archaeological prospecting. Geophysics 1986, 51, 576–584. [Google Scholar] [CrossRef]
  16. Ciminale, M.A.; Loddo, M. Aspects of magnetic data processing. Archaeol. Prospect. 2001, 8, 239–246. [Google Scholar] [CrossRef]
  17. Chianese, D.; D’Emilio, M.; di Salvia, S.; Lapenna, V.; Ragosta, M.; Rizzo, E. Magnetic mapping, ground penetrating radar surveys and magnetic susceptibility measurements for the study of the archaeological site of Serra di Vaglio (Southern Italy). J. Archaeol. Sci. 2004, 31, 633–643. [Google Scholar] [CrossRef]
  18. Welham, K.; Fleisher, J.; Cheetham, P.; Manley, H.; Steele, C.; Wynne-Jones, S. Geophysical survey in Sub-Saharan Africa: Magnetic and electromagnetic investigation of the UNESCO world heritage site of Songo Mnara, Tanzania. Archaeol. Prospect. 2014. [Google Scholar] [CrossRef]
  19. Kvamme, K.L. Magnetometry: Nature’s gift to archaeology. In Remote Sensing in Archaeology: An Explicitly North American Perspective; University Alabama Press: Tuscaloosa, AL, USA, 2006; pp. 205–233. [Google Scholar]
  20. Campana, S.; Piro, S. Seeing the Unseen. Geophysics and Landscape Archaeology; CRC Press: Boca Raton, FL, USA, 2008. [Google Scholar]
  21. Jol, H.M. Ground Penetrating Radar Theory and Applications; Elsevier: Amsterdam, The Netherlands, 2008. [Google Scholar]
  22. Conyers, L.B. Ground-Penetrating Radar for Archaeology; AltaMira Press: Lanham, MD, USA, 2013. [Google Scholar]
  23. Goodman, D. Ground-penetrating radar simulation in engineering and archaeology. Geophysics 1994, 59, 224–232. [Google Scholar] [CrossRef]
  24. Sternberg, B.K.; McGill, J.W. Archaeology studies in southern Arizona using ground penetrating radar. J. Appl. Geophys. 1995, 33, 209–225. [Google Scholar] [CrossRef]
  25. Leckebusch, J. Two-and three-dimensional ground-penetrating radar surveys across a medieval choir: A case study in archaeology. Archaeol. Prospect. 2000, 7, 189–200. [Google Scholar] [CrossRef]
  26. Whiting, B.M.; McFarland, D.P.; Hackenberger, S. Three-dimensional GPR study of a prehistoric site in Barbados, West Indies. J. Appl. Geophys. 2001, 47, 217–226. [Google Scholar] [CrossRef]
  27. Da Silva Cezar, G.; Ferrucio da Rocha, P.L.; Buarque, A.; da Costa, A. Two Brazilian archaeological sites investigated by GPR: Serrano and Morro Grande. J. Appl. Geophys. 2001, 47, 227–240. [Google Scholar] [CrossRef]
  28. Piro, S.; Goodman, D.; Nishimura, Y. The study and characterization of Emperor Traiano’s Villa (Altopiani di Arcinazzo, Roma) using high-resolution integrated geophysical surveys. Archaeol. Prospect. 2003, 10, 1–25. [Google Scholar] [CrossRef]
  29. Leucci, G.; Negri, S. Use of ground penetrating radar to map subsurface archaeological features in an urban area. J. Archaeol. Sci. 2006, 33, 502–512. [Google Scholar] [CrossRef]
  30. Gaffney, C. Detecting trends in the prediction of the buried past: A review of geophysical techniques in archaeology. Archaeometry 2008, 50, 313–336. [Google Scholar] [CrossRef]
  31. Piro, S.; Goodman, D. Integrated GPR and archaeological investigations to characterise the Palatino’s area and Coliseum Valley (Forum, Roma, Italy). ArchéoSciences 2009, 1, 233–235. [Google Scholar] [CrossRef]
  32. Piroddi, L.; Calcina, S.; Trogu, A.; Bakinowska, W.; Casnedi, M.L.; Cocco, O.; Faedda, R.; Nettekoven, T. Ground Probing Radar prospecting and urban cultural heritage: The case study of San Pietro dei Pescatori church in Cagliari, Italy. Environ. Semeiot. 2013, 6, 18–27. [Google Scholar] [CrossRef]
  33. Trinks, I.; Neubauer, W.; Hinterleitner, A. First high-resolution GPR and magnetic archaeological prospection at the Viking Age settlement of Birka in Sweden. Archaeol. Prospect. 2014, 21, 185–199. [Google Scholar] [CrossRef]
  34. Urban, T.M.; Rowan, Y.M.; Kersel, M.M. Ground-penetrating radar investigations at Marj Rabba, a Chalcolithic site in the lower Galilee of Israel. J. Archaeol. Sci. 2014, 46, 96–106. [Google Scholar] [CrossRef]
  35. Zhao, W.; Forte, E.; Levi, S.T.; Pipan, M.; Tian, G. Improved high-resolution GPR imaging and characterization of prehistoric archaeological features by means of attribute analysis. J. Arch. Sci. 2015, 54, 77–85. [Google Scholar] [CrossRef] [Green Version]
  36. Sweely, T.L. Detecting “invisible” Dwellings in the Maya Area Using Electromagnetic induction: Significant findings of a pilot study at Chau Hiix, Belize. Lat. Am. Antiq. 2005, 16, 193–208. [Google Scholar] [CrossRef]
  37. Aitken, J.A.; Stewart, R.R. GPR surveying at a Maya Ruin Site, Belize, Central America. In Proceedings of the 19th EEGS Symposium on the Application of Geophysics to Engineering and Environmental Problems, Seattle, WA, USA, 2–6 April 2006; Curran Associates, Inc.: Red Hook, NY, USA, 2006. [Google Scholar]
  38. Haley, B.S. An Assessment of Geophysical Techniques at Three Sites in Central Belize. In The Belize Valley Archaeological Reconnaissance Project: A Report of the 2005 Field Season; Institute of Archaeology: Belmopan, Belize, 2006; pp. 11–38. [Google Scholar]
  39. Aitken, J.A. Exploring Maya Ruins in Belize, Central America Using Ground-Penetrating Radar (GPR). Ph.D. Thesis, University of Calgary, Calgary, AB, Canada, 2008. [Google Scholar]
  40. Houk, B.A.; Walker, C.P.; Willis, M.; Herndon, K.E. The Chan Chich Structure A-5 Mapping Project: A New Approach to Mapping and Remote Sensing a Maya Mound; Final Grant Report Submitted to the National Geographic Society/Waitt Grants Program (Grant Number W261-12); Texas Tech University: Lubbock, TX, USA, 2013. [Google Scholar]
  41. Daniels, J.T., Jr. Nondestructive Geophysical and Archaeometric Investigations at the Southern Belize Sites of Lubaantun and Nim li Punit. Ph.D. Thesis, University of California, San Diego, CA, USA, 2014. [Google Scholar]
  42. Conyers, L.B. The use of ground-penetrating radar to map the buried structures and landscape of the Ceren site, El Salvador. Geoarchaeology 1995, 10, 275–299. [Google Scholar] [CrossRef]
  43. Valdés, J.A.; Kaplan, J. Ground-penetrating radar at the Maya site of Kaminaljuyu, Guatemala. J. Field Archaeol. 2000, 27, 329–342. [Google Scholar]
  44. Safi, K.N.; Mazariegos, O.C.; Lipo, C.P.; Neff, H. Using Ground-Penetrating Radar to Examine Spatial Organization at the Late Classic Maya Site of El Baúl, Cotzumalhuapa, Guatemala. Geoarchaeology 2012, 27, 410–425. [Google Scholar] [CrossRef]
  45. Healy, P.F. Excavations at Pacbitun, Belize: Preliminary report on the 1986 and 1987 investigations. J. Field Archaeol. 1990, 17, 247–262. [Google Scholar] [CrossRef]
  46. Healy, P.F.; Hohmann, B.M.; Powis, T.G. The Ancient Maya Center of Pacbitun. In The Ancient Maya of the Belize Valley: Half a Century of Archaeological Research; Garber, J.B., Ed.; University Press of Florida: Gainesville, FL, USA, 2004; pp. 207–227. [Google Scholar]
  47. Healy, P.F.; Helmke, C.G.B.; Awe, J.J.; Sunahara, K.S. Survey, settlement, and population history at the Ancient Maya Site of Pacbitun, Belize. J. Field Archaeol. 2007, 32, 17–39. [Google Scholar] [CrossRef]
  48. Campbell-Trithart, M.J. Ancient Maya Settlement at Pacbitun, Belize. Master’s Thesis, Trent University, Peterborough, ON, Canada, 1990. [Google Scholar]
  49. Richie, C.F. Ancient Maya Settlement and Environment of the Eastern Zone of Pacbitun, Belize. Master’s Thesis, Trent University, Peterborough, ON, Canada, 1990. [Google Scholar]
  50. Sunahara, K.S. Ancient Maya Settlement: The Western Zone of Pacbitun, Belize. Master’s Thesis, Trent University, Petersborough, ON, Canada, 1995. [Google Scholar]
  51. Hohmann, B.; Powis, T.G. The 1996 Excavations of Plaza B at Pacbitun, Belize. In Belize Valley Preclassic Maya Project: Progress Report on the 1996 and 1997 Field Seasons; Healy, P., Awe, J., Eds.; Occasional Papers in Anthropology No. 13; Trent University: Peterborough, ON, Canada, 1999; pp. 1–18. [Google Scholar]
  52. Hohmann, B.; Powis, T.G.; Arendt, C. The 1997 Investigations at Pacbitun, Belize. In Belize Valley Preclassic Maya Project: Progress Report on the 1996 and 1997 Field Seasons; Healy, P., Awe, J., Eds.; Occasional Papers in Anthropology No. 13; Trent University: Peterborough, ON, Canada, 1999; pp. 19–30. [Google Scholar]
  53. Hohmann, B. Preclassic Maya Shell Ornament Production in the Belize Valley, Belize. Ph.D. Thesis, University of New Mexico, Albuquerque, NM, USA, 2002. [Google Scholar]
  54. Healy, P. Radiocarbon Date from Pacbitun, Belize: Results from the 1995 Season. In Belize Valley Preclassic Maya Project: Progress Report on the 1996 and 1997 Field Seasons; Healy, P., Awe, J., Eds.; Occasional Papers in Anthropology No. 13; Trent University: Peterborough, ON, Canada, 1999; pp. 69–82. [Google Scholar]
  55. Powis, T.G.; Healy, P.F.; Hohmann, B. An Investigation of Middle Preclassic Structures at Pacbitun. Res. Rep. Belizean Archaeol. 2009, 6, 179–190. [Google Scholar]
  56. Vogt, E.Z. Some Implications of Zinacantan Social Structure for the Study of the Ancient Maya. In XXXV Congreso Internacional de Americanistas; Universidad Nacional Autónoma de México: Mexico City, Mexico, 1964; Volume 1, pp. 307–319. [Google Scholar]
  57. Bateson, J.H. New interpretation of geology of Maya Mountains, British Honduras: Geological notes. AAPG Bull. 1972, 56, 956–963. [Google Scholar]
  58. Jackson, T.A.; Duke, M.J.M.; Scott, P.W.; Smith, F.; Wilkinson, F.C.F. Petrology and inferred tectonic setting of the Mountain Pine Ridge granitoids, Maya Mountains, Belize. Int. Geol. Rev. 1995, 37, 26–38. [Google Scholar] [CrossRef]
  59. Miller, T.E. Geologic and hydrologic controls on karst and cave development in Belize. J. Cave Karst Stud. 1996, 58, 100–120. [Google Scholar]
  60. Spenard, J. Underground Identity, Memory, and Political Spaces: Archaeological Investigations of the Classic Period Maya Ceremonial Karstscape in the Pacbitun Region, Cayo District, Belize. Ph.D. Thesis, University of California, Riverside, CA, USA, 2014. [Google Scholar]
  61. Powis, T.G. Preliminary investigations into sub-plaza deposits in Plaza A at Pacbitun, Belize. In Pacbitun Regional Archaeological Project Report on the 2010 Field Season; Institute of Archaeology: Belmopan, Belize, 2011; pp. 142–150. [Google Scholar]
  62. Ernenwein, E.G.; Kvamme, K.L. Data processing issues in large-area GPR surveys: Correcting trace misalignments, edge discontinuities and striping. Archaeol. Prospect. 2008, 15, 133–149. [Google Scholar] [CrossRef]
  63. Helmke, C.G.B.; Grube, N.; Awe, J.J.; Healy, P.F. A Reinterpretation of Stela 6, Pacbitun, Belize. Mexicon 2006, 28, 70–75. [Google Scholar]
  64. Skaggs, S.; Powis, T.G.; Weber, J. You see but you do not observe: Applying spatial technologies at Pacbitun, Belize. Res. Rep. Belizean Archaeol. 2014, 11, 223–232. [Google Scholar]
  65. Powis, T.G. Excavations of Middle Formative Period Round Structures at the Tolok Group, Cahal Pech, Belize. Master’s Thesis, Trent University, Peterborough, ON, Canada, 1996. [Google Scholar]
  66. Aimers, J.; Powis, T.G.; Awe, J. Preclassic period round structures of the Upper Belize River Valley. Lat. Am. Antiq. 2000, 11, 71–86. [Google Scholar] [CrossRef]
  67. Skaggs, S.; Powis, T.G. Geophysical and geological explorations at Pacbitun, Belize. In Pacbitun Regional Archaeological Project (PRAP): Report on the 2013 Field Season; Powis, T.G., Ed.; Institute of Archaeology, National Institute of History and Culture: Belmopan City, Belize, 2014; pp. 62–78. [Google Scholar]
  68. Loten, H.S.; Pendergast, D.M. A Lexicon for Maya Architecture; Royal Ontario Museum: Toronto, ON, Canada, 1984; Volume 8. [Google Scholar]
  69. Powis, T.G.; Valdez, F., Jr.; Hester, T.; Hurst, W.H. Spouted vessels and cacao use among the Preclassic Maya. Lat. Am. Antiq. 2002, 13, 85–106. [Google Scholar] [CrossRef]
  70. Taube, K.A. The Jade Hearth: Centrality, Rulership, and the Classic Maya Temple. In Function and Meaning in Classic Maya Architecture: A Symposium at Dumbarton Oak, 7th and 8th October 1994; Houston, S.D., Ed.; Dumbarton Oaks Research Library and Collection: Washington, DC, USA, 1998; pp. 427–478. [Google Scholar]
  71. Taube, K.A. Structure 10L-16 and Its Early Classic Antecedents: Fire and the Evocation and Resurrection of K’inich Yax K’uk’ Mo’. In Understanding Early Classic Copan; Bell, E.E., Canuto, M.A., Sharer, R.J., Eds.; University of Pennsylvania Museum of Archaeology and Anthropology: Philadelphia, PA, USA, 2004; pp. 265–295. [Google Scholar]
  72. Taube, K.A. The Classic Maya Temple: Centrality, Cosmology, and Sacred Geography in Ancient Mesoamerica. In Heaven on Earth: Temples, Ritual, and Cosmic Symbolism in the Ancient World; Ragavan, D., Ed.; The Oriental Institute of the University of Chicago: Chicago, IL, USA, 2013; pp. 89–125. [Google Scholar]
  73. Harrison-Buck, E. Rituals of death and disempowerment among the Maya. In Power and Identity in Archaeological Theory and Practice: Case Studies from Ancient Mesoamerica; Harrison-Buck, E., Ed.; The University of Utah Press: Salt Lake City, UT, USA, 2012; pp. 103–115. [Google Scholar]
  74. Mock, S.B. (Ed.) The Sowing and the Dawning: Termination, Dedication, and Transformation, in the Archaeological and Ethnographic Record of Mesoamerica; University of New Mexico Press: Albuquerque, NM, USA, 1998.
  75. Wagner, E. White Earth Bundles: The Symbolic Sealing and Burial of Buildings among the Ancient Maya. In Jaws of the Underworld: Life, Death, and Rebirth among the Ancient May; Colas, P.R., LeFort, G., Perssons, B.L., Eds.; Verlag Anton Saurwien: Markt Schwaben, Germany, 2006; pp. 5–70. [Google Scholar]
  76. Micheletti, G.; Powis, T.G.; Skaggs, S.; Stanchly, N. Early Maya monumental architecture in the Belize River Valley: Recent archaeological investigations of El Quemado at Pacbitun. Res. Rep. Belizean Archaeol. 2016, 13, 43–50. [Google Scholar]
  77. Goodman, D.; (Creator GPR-Slice, Woodland Hills, CA, USA). Personal communication, 2016.
Figure 1. Location of the approximately 9 km2 permit area of Dr. Terry Powis in the country of Belize. The Pacbitun Regional Archaeological Project (PRAP) is conducted in this permit area, shown in orange diagonal shading with the location of Pacbitun and other Maya sites in the area marked by white dots.
Remotesensing 08 00805 g001
Figure 2. Pacbitun site core map with the 41 major structures and five plazas. Stelae are marked as red lines, altars as green dots, causeways as parallel double lines, and waterholes as gray circles. The square outlined in grey indicates the excavated structures B1 to B5 [45,54,55].
Remotesensing 08 00805 g002
Figure 3. (a) GPR survey profiles traveling from west to east in Plaza A performed during December 2012; and (b) GPR survey profiles traveling from south to north in two separate surveys in May 2014. Green dots indicate the beginning of a survey line and red dots indicate the end of a survey line. Lines were stopped and started to avoid obstacles in the field. Green polygons show test excavations based on GPR results and the blue polygon shows the additional excavated area to uncover archaeological features. All excavation units were backfilled prior to the 2014 surveys.
Remotesensing 08 00805 g003
Figure 4. Example of the GPR data processing steps from background filtering to bandpass filtering and then amplitude regained.
Remotesensing 08 00805 g004aRemotesensing 08 00805 g004b
Figure 5. (a) Approximately 80 cm depth-slice using 0.1 m/ns generated from GPR profiles of the survey conducted in December 2012. Plaza A structures (black) and original stela (red lines) and altars (green dots) also shown. Reflections with linear patterns are drawn on left in orange; (b) Approximately 250 cm depth-slice generated from GPR profiles of survey conducted in December 2012. Reflections with linear and circular patterns drawn on the left in brown; (c) Overlap of shallow and deep reflections of interest, and placement of test excavation units based on GPR results indicated with blue rectangles. The 1 m by 4 m trench is over the most important anomalies.
Remotesensing 08 00805 g005
Figure 6. Approximately 80 cm depth-slice reprocessed using the new processing steps from GPR profiles of survey conducted in December 2012. Plaza A structures (black) are shown. Original stela (red lines) and altar (green dots) locations are shown in left maps only so they do not interfere with features in the amplitude map depth-slices. The pink line represents profile 40 m north discussed in the text and shown in Figure 7. Areas around interesting reflections to be investigated in profiles are drawn on the left in black.
Remotesensing 08 00805 g006
Figure 7. (a) Profile west to east at 40 m north between A and A’ in Figure 6. The blue box shows the approximate area shown in the 80 cm deep amplitude depth-slice. (b) Interpretation of profile 40 m north. Black box represents plaster surface found in excavation. White circles show areas of possible holes in that surface.
Remotesensing 08 00805 g007
Figure 8. Approximately 100 cm depth-slice reprocessed using the new processing steps from GPR profiles of survey conducted in December 2012. Plaza A structures (black) are shown. Original stela (red lines) and altar (green dots) locations are shown in left maps only so they do not interfere with features in the amplitude map depth-slices. Purple arrows on the left show areas with multiple high amplitude reflections. The pink line represents profile 28 m north and the green line profile 17.5 m north, both discussed in the text and shown in Figure 9 and Figure 11. Areas around interesting reflections to be investigated in profiles are drawn on the left in brown.
Remotesensing 08 00805 g008
Figure 9. (a) Profile west to east at 28 m north between A and A’ in Figure 8. The blue box shows the approximate area shown in the amplitude depth-slice. (b) Interpretation of profile 28 m north. Vertical green boxes show task units, and green lines the alternating marl/clay layers. The horizontal green box shows the top of a stair between the armatures circled in white.
Remotesensing 08 00805 g009
Figure 10. Example of sloping marl/clay layers, outlined in red, in excavation photo. Picture is looking north and the layers slope down 50 cm over a 2 m length towards the west, away from the task unit still buried in the east excavation wall (left side). Photo courtesy of Jeff Powis.
Remotesensing 08 00805 g010
Figure 11. (a) Profile west to east at 17.5 m north between B and B’ in Figure 9. The blue box shows the approximate area shown in the amplitude depth-slice. (b) Interpretation of profile 17.5 m north. Vertical green box shows the western task unit identified in Figure 10. The red boxes show the other potential walls on either side of a surface parallel to the ground surface. White box with sloping white lines is the eastern task unit known from excavation to be in this part of the plaza.
Remotesensing 08 00805 g011
Figure 12. (a) Approximately 60 cm depth-slice processed from GPR profiles from May 2014 survey after 2013 excavations. Plaza A structures (black) and original stela (red lines) and altars (green dots) also shown. Linear and square areas drawn on the left in black are high amplitude reflections. Filled blue rectangles are locations of excavated and refilled units. Purple, red and green lines represent profiles discussed in the text and shown in Figure 13. The brown arrows and line show where 38 m north falls on the profiles; (b) Approximately 100 cm depth-slice processed from GPR profiles from May 2014 survey. Linear and rectangular areas of high amplitude reflections are drawn on the left in brown. Filled blue rectangles are locations of excavated and refilled units. Purple, red and green lines represent profiles discussed in the text and shown in Figure 14.
Remotesensing 08 00805 g012
Figure 13. (a) Profile truncated at 66 ns from A to A’ in Figure 12a at 15.75 m east in northern plaza survey. Blue and red boxes on the left show approximate locations of 60 cm and 100 cm depth-slices. Purple vertical lines in the right profile represent the edges of the 2013 excavations. The yellow line represents the surface of the buried structure. The green triangle is an area of scattering caused by stones and the green lines layers of marl/clay associated with a wall. White circles highlight area of interest below structure or bedrock; (b) Profile truncated at 66 ns from B to B’ in Figure 12a at 25.75 m east in northern plaza survey. All other markings the same as in (a) except the orange box represents layers of marl/clay built up on the stairs; (c) Profile truncated at 66 ns from C to C’ in Figure 12a at 30.75 m east in northern plaza survey. All other markings the same as in (b) except the green outline and lines represent stones and marl/clay layers which appears to be a stone wall perpendicular to the survey direction.
Remotesensing 08 00805 g013
Figure 14. (a) Profile truncated at 66 ns from A to A’ in Figure 12b at 18.25 m east in southern plaza survey. Blue and red boxes on the left show approximate locations of 60 cm and 100 cm depth-slices. The horizontal white circles show the likely sloping marl/clay layers which show up in amplitude depth slices. Vertical white circles show areas of low contrast rock; (b) Profile truncated at 66 ns from B to B’ in Figure 12b at 25.25 m east in southern plaza survey. Blue and red boxes on the left show approximate locations of 60 cm and 100 cm depth-slices. The white circle shows the same as in (a); (c) Profile truncated at 66 ns from C to C’ in Figure 12b at 34.75 m east in southern plaza survey. Blue and red boxes on the left show approximate locations of 60 cm and 100 cm depth-slices. The white circle shows the likely buried stela fragment noted in amplitude depth slices.
Remotesensing 08 00805 g014
Figure 15. View from the south of the western end of the first 1 m by 4 m trench unit of a unit placed to excavate GPR anomalies at north end of Plaza A. The unit shows the buried curved plaster step of the structure (on right) and the stones from the wall believed to be a task unit. Photo courtesy of Jeff Powis.
Remotesensing 08 00805 g015
Figure 16. View from the west of El Quemado after the 2015 excavations. The pink line shows the profile A to A’ in Figure 6 and Figure 7a. The black line shows the edge of reflectors along the step and broken plaster on the western side in Figure 6. The orange line shows the profile A to A’ in Figure 9a and the brown box the rectangular area of high amplitude reflections in Figure 8. Task units have been removed already. The blue line is the profile from B to B’ in Figure 12a and Figure 13b, and the brown box is the area of high amplitude reflections in the northern survey area of Figure 12a. Photo courtesy of Jeff Powis.
Remotesensing 08 00805 g016
Figure 17. South sloping task unit with south sloping marl/clay layers on top as seen in radar reflections between 21 and 30 m north along profile in Figure 13a. Black box shows where task unit was removed between 27 and 30 m north by previous excavations. Photo courtesy of Jeff Powis.
Remotesensing 08 00805 g017
Figure 18. Overhead photo facing west of the task unit and stone edge of Q as seen in radar reflections between 26 m and 32 m north along the profile shown in Figure 13c. Photo courtesy of Jonathan Lohr.
Remotesensing 08 00805 g018
Figure 19. Looking northeast at the horizon slice created from radar profile analysis used as a model for the surfaces of Q. The elevation of the top surface of Q is shown in blue wireframe. The southern stairs and armatures can be seen on either side of the large notch missing from center of the model (area not sampled). The accuracy of the model is only moderate due to the many task units and sloping marl/clay layers. It does show the armatures and stairs leading up to the highest platform towards the back of the model.
Remotesensing 08 00805 g019
Figure 20. Simulation of buried steps or terrace edges up and down created in GPR-SIM. Of particular interest was the direction and amount of depth separation of the RR (light blue) reflections in order to relate them to the reflections in Figure 13.
Remotesensing 08 00805 g020

