1. Introduction
A major component in the overall strategy for the Imagery calibration and validation (Cal/Val) effort for the Visible Infrared Imaging Radiometer Suite (VIIRS) is to ensure that the Imagery is of suitable quality for effective operational use. Imagery of sufficient quality is often determined by the ability of human users to easily locate and discriminate atmospheric and ground features of interest. Such features include clouds and their type, especially convection and low clouds/fog, sea/lake ice edges, snow cover, volcanic eruptions, tropical cyclone structure, and dust storms [
1,
2,
3]. In many of these cases, multi-spectral algorithms presented as false-color imagery are required to best identify land and atmospheric features over a given location. Pursuant to the Cal/Val strategy, VIIRS Imagery are analyzed to determine if it can be used to interpret the features noted above, considering both single and multi-spectral applications as appropriate.
The primary measurement obtained by VIIRS is digital counts (also known as digital numbers, or DN), designed to respond proportionally to the photons received by the detectors in the 22 bands that comprise the instrument. These DN values are converted into calibrated radiance, reflectance, and/or brightness temperatures based on the methodology of Cao
et al. [
4]. These calibrated data are distributed to the scientific community as Sensor Data Records (SDRs). A subset of the 22 bands is remapped to a satellite-relative Mercator projection and is distributed to the user community as Environmental Data Records (EDRs). Imagery produced from these data (both SDR and EDR) have been examined by the VIIRS EDR Imagery Team and collaboratively with the general user community to gauge performance and identify artifacts that characterize the overall quality of the imagery.
During the post-launch checkout, both single and multi-spectral images are analyzed to look for artifacts such as striping, banding, noise, geolocation errors, and collocation differences between bands that may plague multi-spectral imagery. In many cases, the root cause for such issues lies with the sensor and, as such, repairing or mitigating these artifacts are primarily the responsibility of the VIIRS SDR Cal/Val Team. The benefits of these ad-hoc software corrections are then inherited by the imagery EDRs produced from the SDRs. Much of this activity occurs before Imagery is declared to be an officially “validated” EDR by the Imagery Team. After this commissioning, VIIRS Imagery is made available to a wide audience of users who continue the Imagery validation process via assessments of operational utility, some examples of which are detailed herein.
Although S-NPP VIIRS visible and infrared capabilities are found to be clearly superior to heritage operational instrumentation (the Advanced Very High Resolution Radiometer, AVHRR), user validation is also tied to the unique features of VIIRS. These include the Day/Night Band (DNB) [
5] that is not available from any current or near-future geostationary platform. The DNB, and the Near Constant Contrast (NCC) [
6], a more user-friendly product derived from DNB, have found widespread use across NOAA, National Weather Service (NWS) and the U.S. Navy. NCC is capable of providing visual images at night, even under no moon conditions. While the quality varies with the amount of moonlight, day-night images have proven useful to numerous users [
5,
7,
8].
2. VIIRS EDR Imagery
The Suomi National Polar-orbiting Partnership (S-NPP) satellite, which includes VIIRS as its principal imaging radiometer, was launched into a sun-synchronous, 1330 local time ascending node polar orbit on 28 October 2011. The VIIRS Imagery EDR is in fact comprised of three different sets of Imagery products. These are five Imaging-resolution or I-band products, six Moderate-resolution or M-band products, and Near Constant Contrast (NCC) Imagery derived from the DNB sensor. Each of these is remapped to a Ground Track Mercator (GTM) projection, the I-band with 400 m resolution and the others at 800 m resolution [
9]. Details on the GTM mapping may be found in the VIIRS Imagery Products Algorithm Theoretical Basis Document (ATBD) [
10] and are not discussed here.
The VIIRS Imagery EDR benefits from the many programs which preceded it, and many of the bands chosen to be created as Imagery products are based on heritage from such sensors as the Moderate Resolution Imaging Spectroradiometer (MODIS), AVHRR, and the Operational Line Scanner (OLS). Details on the VIIRS bands transformed into Imagery products by the JPSS ground system are provided in
Table 1 and
Table 2. The Imagery EDR products in
Table 1 include both the VIIRS bands explicitly spelled out in the Level 1 Requirements Documents (L1RD) [
11] as well as VIIRS I3 band (1.61 µm, excellent in identifying snow/ice locations and ice-topped clouds) and the DNB, both of which became new Key Performance Parameter (KPP) bands in mid-2015. The products in
Table 2 are the remaining EDR Imagery products created at present but not classified as KPPs at this time.
Table 1.
Required Imagery Environmental Data Records (EDRs).
Table 1.
Required Imagery Environmental Data Records (EDRs).
| Imagery EDR Product | VIIRS Band | Wavelength (µm) | SDR Spatial Resolution Nadir/Edge-of-Scan (km) |
|---|
| Daytime Visible | I1 | 0.60–0.68 | 0.4/0.8 |
| Short Wave IR (SWIR) | I3 | 1.58–1.64 | 0.4/0.8 |
| Mid-Wave IR (MWIR) | I4 | 3.55–3.93 | 0.4/0.8 |
| Long-Wave IR (LWIR) | I5 | 10.5–12.4 | 0.4/0.8 |
| LWIR | M14 | 8.4–8.7 | 0.8/1.6 |
| LWIR | M15 | 10.263–11.263 | 0.8/1.6 |
| LWIR | M16 | 11.538–12.488 | 0.8/1.6 |
| NCC | DNB | 0.5–0.9 | 0.8/1.6 |
Table 2.
Other Imagery EDRs.
Table 2.
Other Imagery EDRs.
| Imagery EDR Product | VIIRS Band | Wavelength (µm) | Spatial Resolution Nadir/Edge-of-Scan (km) |
|---|
| Near Infrared (NIR) | I2 | 0.846–0.885 | 0.4/0.8 |
| Visual | M1 | 0.402–0.422 | 0.8/1.6 |
| Visual | M4 | 0.545–0.565 | 0.8/1.6 |
| SWIR | M9 | 1.371–1.386 | 0.8/1.6 |
The required Imagery products shown in
Table 1 primarily reflect user needs in the Alaskan weather theatre. Since no geostationary satellite properly covers the entire Alaskan region, user dependency on polar-orbiting products is much greater than any other US forecasting region. Of the explicit EDRs, bands I1 (0.64 µm), I4 (3.74 µm), and I5 (11.45 µm) comprise the basic building blocks for standard Imagery applications in the visible, MWIR, and LWIR portions of the radiative spectrum. The other three Moderate-resolution band images are LWIR bands that assist in locating clouds and in determining their composition (water or ice).
Use of the remaining bands in
Table 2 varies according to the specific atmospheric and surface features of interest at a particular location. The I2 (0.86 µm) band complements the I1 (0.64 µm) band in the visible spectrum. Bands M1 (0.41 µm) and M4 (0.55 µm) assist in the creation of “true-color” and “natural-color” Imagery, while band M9 (1.378 µm) is superior to any other band at identifying thin cirrus during the day. These Imagery products are of practical use to various subsets of the user community.
The final EDR, the NCC as derived from the DNB, has found widespread use across NOAA, the NWS, and the U.S. Navy. NCC is capable of providing visible-wavelength images at night, even under no moon conditions [
6]. While the quality varies with the amount of moonlight, NCC has proven useful at night in locating clouds, ice edge, snow cover, tropical cyclone centers (eyes), fires and gas flares, lightning, dust storms, and volcanic eruptions [
5,
12,
13].
While
Table 1 and
Table 2 encompass all of the EDR Imagery products created by the Ground System, they include only 6 of the 16 available M bands, implying that some of the VIIRS SDRs are not currently made available as Imagery EDRs. Some users work with the VIIRS SDRs from the 10 non-EDR rendered bands for their particular imagery needs. The Imagery Cal/Val Team is aware of these needs, and works with users to ensure that all spectral bands derived from VIIRS are of operational quality. DNB radiances, in particular, are used heavily in quantitative applications at the National Environmental Information Center (NEIC), Boulder CO [
14] and at the National/Navy Ice Center (NIC).
3. VIIRS Imagery as a Key Performance Parameter (KPP)
Officially, only a subset of the global VIIRS Imagery products is designated as KPP. The specific verbiage of the VIIRS KPP reads as follows (updated to include the two new KPP bands): “VIIRS Imagery EDR at 0.64 µm (I1), 1.61 µm (I3), 3.74 µm (I4), 11.45 µm (I5), 8.55 µm (M14), 10.763 µm (M15), 12.03 µm (M16), and Near Constant Contrast EDR for latitudes greater than 60°N in the Alaskan region.”
The Cal/Val efforts place emphasis on high latitudes, as articulated by this verbiage. The overarching position taken by the Imagery Cal/Val Team is that the imagery requirements must be met first and foremost by the bands in
Table 1 in the Alaskan region. Furthermore, the application of VIIRS Imagery must meet the user’s expectations. This assessment relies heavily on user engagement and identification of representative use-cases.
Because Imagery is a KPP for VIIRS, it also is required to meet “Minimum Mission Success” in the Post Launch Test (PLT) time frame. How this will be accomplished for JPSS-1 is now spelled out in the newly-revised JPSS Cal/Val Plan [
15] for the VIIRS Imagery Product. For JPSS-1 the PLT time frame ends at launch +85 days (L + 85). The objective of the Imagery Cal/Val Team is to show Imagery indeed meets the KPP criteria at L + 85, with the caveat understood that the time frame and season may limit the completeness of the Alaskan data set used for this assessment. For example, if the L + 85 period for JPSS-1 occurs primarily during the Northern Hemisphere winter, little visual data (Imagery) would be available to analyze north of 60° latitude. In contrast, if the period occurs primarily during the Northern Hemisphere summer season, when areas north of 60° latitude are bathed in sunlight, there will be few opportunities to assess the nocturnal component of the DNB’s NCC product. Furthermore, certain key atmospheric events that drove the KPP for Alaska, such as volcanic ash, may not occur in the PLT time frame over Alaska. In these cases, the Imagery Cal/Val Team will use appropriate Imagery from other locations to show VIIRS Imagery products is sufficient or better than heritage imagery. Such use of alternative non-high-latitude locations complements the assessment over Alaska, and in most cases is adequate to show by proxy that VIIRS Imagery will achieve Minimum Mission Success.
The requirements for Imagery, as stated in the L1RD-Supplement, are simply spatial resolution requirements, as opposed to requirements that quantitatively address the quality of the EDR Imagery radiances and reflectances. Because of the lack of such specifications, Imagery validation rides heavily upon user feedback, such that the Cal/Val Team’s work is complemented by users who are well versed in the use of Imagery applications.
4. Imagery Validation
During the early orbit instrument checkout phase, Imagery products were created as soon as the SDRs became available. In these early stages, VIIRS data are retrieved and evaluated from several sources: the Government Resource for Algorithm Verification Independent Testing and Evaluation (GRAVITE), the Comprehensive Large Array-data Stewardship System (CLASS), the Product and Evaluation and Test Element (PEATE), or from direct-broadcast line-of-sight reception sites. Post-checkout operational users have access to VIIRS data and derived products via NOAA’s NPP Data Exploitation (NDE), as well as the NWS Advanced Weather Interactive Processing System (AWIPS) satellite data distribution system.
4.1. Validation Tools
There are many tools available designed to exploit the VIIRS Imagery. These tools, employed by the Cal/Val Team, are the Man-computer Interactive Data Access System (McIDAS-V in particular) [
16], TeraScan processing software from SeaSpace Corporation [
17], and various data processing and display tools using the Interactive Data Language (IDL) [
18]. These tools are made available to various users during the Cal/Val process for Imagery. The primary operational user, the NWS, has its own display tools that are integrated into AWIPS [
19]. Direct broadcast reception sites may display Imagery using the Community Satellite Processing Package (CSPP) [
20] or the International Polar Orbiting Processing Package (IPOPP) [
21]. Feedback from users of these systems is considered part of the extended validation process.
4.2. Intensive Calibration/Validation Phase
Among the basic qualities of Imagery are its spectral, spatial, temporal, and radiometric resolution. Spectral resolution is determined by the bands and bandwidths of VIIRS, as well as optical effects of the reflecting mirrors that direct light into the focal plane array. The spatial and radiometric resolutions of VIIRS are determined at the SDR level. The SDR and EDR radiances are unchanged, except for the special processing that goes into the DNB/NCC pair [
6].
Table 3 compares the VIIRS SDRs and Imagery EDRs.
Table 3.
Similarities and Differences between Visible/Infrared Imaging Radiometer Suite (VIIRS) Sensor Data Records (SDRs) vs. Imagery EDRs.
Table 3.
Similarities and Differences between Visible/Infrared Imaging Radiometer Suite (VIIRS) Sensor Data Records (SDRs) vs. Imagery EDRs.
| Characteristic | SDR | EDR |
|---|
| Solar reflective (visible) bands | Radiances and reflectances | Radiances and reflectances (same as SDR) |
| Infrared (thermal) bands | Radiances and brightness temperatures | Radiances and brightness temperatures (same as SDR) |
| Geo-spatial mapping | Satellite projection (with bowtie deletions and overlapping pixels) | Ground Track Mercator (GTM) projection (rectangular grid, no pixel deletions or pixel overlap) |
| Day/Night Band (DNB) imagery | DNB radiances (may vary by up to 7 orders of magnitude, depending on lunar and/or solar illumination) | NCC pseudo-albedos [6] (may vary by up to 3 orders of magnitude, to display features under conditions ranging from no moon to full solar illumination, as well as artificial lights) |
The primary objective of the intensive Cal/Val phase is establishing in official sequence beta, provisional, and validated status for the Imagery products. The Imagery Cal/Val Team works with the VIIRS SDR Cal/Val Team to verify those requirements for Imagery that are tied to the SDR quality (e.g. radiance calibration accuracy, detector noise and striping, geolocation accuracy, etc.). The spatial resolution requirements are tied to the GTM projection, and are straightforward to verify. However, Imagery only passes through these validation stages as it is determined to be of quality for operational users.
The second component of Cal/Val user-oriented validation is operational user analysis of the Imagery. Band combinations targeting the characterization of clouds and cloud types, clouds phase, snow/ice on the surface, and dust storms are emphasized. Given the KPP emphasis on the Alaska region, this user base has a direct say in determining when validation has been reached. This determination is made via evaluation of VIIRS Imagery applications in the day-to-day operational environment.
The evaluation of NCC Imagery is a special case, due to its unique nature and its growing use for multiple purposes. DNB/NCC is used for such features ranging from ice edge at night to tropical cyclone center fixing. Some of the capabilities demonstrated at lower latitudes have analogous applications at the high latitudes. For example, the ability to peer through thin cirrus and reveal low-level circulation in tropical cyclones via moonlight also holds utility for peering through frontal cirrus and detecting the distribution of clouds or sea ice below (e.g., [
5]). The Imagery Cal/Val Team helps users evaluate DNB/NCC for specialized applications such as gas flares, fishing boats, and auroras, while the operational applications of this nighttime imagery are the ultimate validation of its usefulness.
Mitigation of Non-Linearity for DNB on JPSS-1
The only significant difference with the input SDRs between S-NPP and JPSS-1 is with the DNB. It was discovered during routine laboratory testing that the DNB for JPSS-1 contains an anomalous non-linear response at high scan angles. The anomalies necessitated the design of DNB SDR post-processing software to mitigate the associated imagery artifacts. The method chosen impacts the spacing between DNB pixels towards the edge of the scan, as well as the location of nadir within the DNB SDR itself. The mitigation procedure is asymmetric, such that the DNB will actually extend in one direction (referred to as an “extended scene”). Furthermore, instead of preserving constant pixel size, the resolution of the DNB on JPSS-1 will degrade to approximately 1.2 km at the edge of the scan, and the spacing between pixels will not be as constant across the scan line as it is with S-NPP. The degradation in spatial resolution with the JPSS-1 DNB does not occur until a 49° viewing angle is reached.
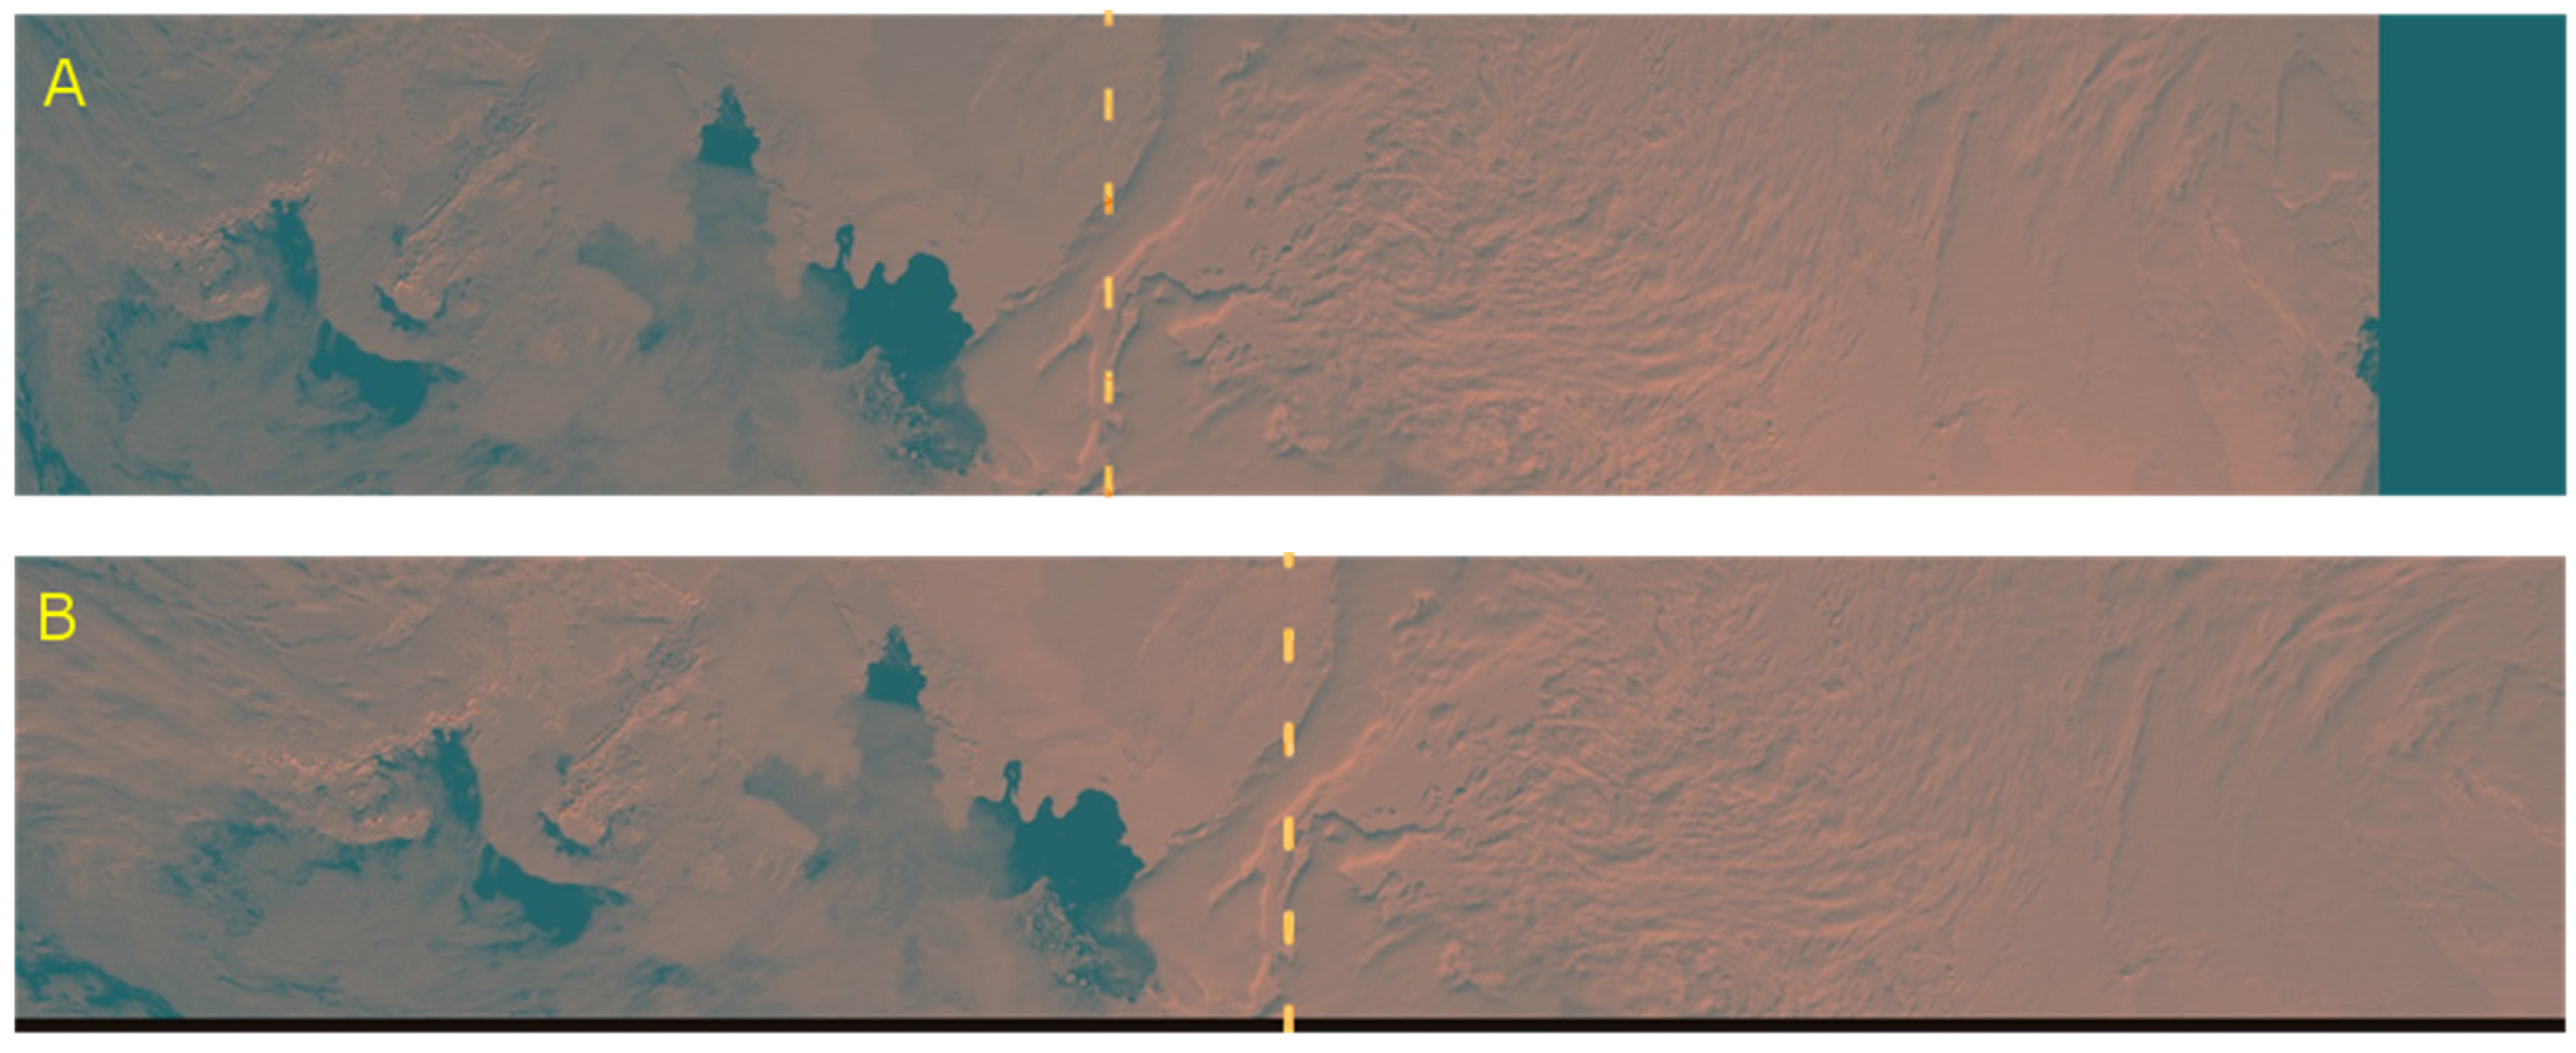
Figure 1 shows the impact of these mitigation steps. These figures were produced using S-NPP DNB SDRs and executing the mitigation intended for JPSS-1.
Figure 1A shows how the DNB SDR would look for JPSS-1. The blank space (blue) on the right side is the extended scene component. Nadir actually lies on the left side of the SDR image, as noted by the dashed line. In
Figure 1B, which is the resulting NCC image, the NCC process shifts nadir (dashed line) to the center of the image, and truncates the extended scene portion of the DNB. This is intended, so NCC imagery from JPSS-1 will be similar to that from S-NPP, as well as match the GTM mapping for the VIIRS M-bands.
Figure 1.
(A) DNB from Suomi National Polar-orbiting Partnership (S-NPP) used to display how DNB will look from JPSS-1, with the blue area on the right filled with extended scene imagery (currently missing in this simulation); (B) The DNB remapped into the GTM mapping used for Near Constant Contrast (NCC), showing that the NCC shifts the DNB imagery to the right, placing nadir at the center and ignoring the extended scene data on the right. In each image, the dashed line shows the approximate location of nadir.
4.3. Long-Term Monitoring Phase
Long-term monitoring of VIIRS Imagery is the responsibility of the VIIRS SDR and Imagery EDR Teams collectively. The task extends to the Imagery user base as well, who at any time may help the Teams to identify an imagery anomaly that may be either transient or recurring. Hence, long-term monitoring focuses on the ongoing value of the Imagery product quality as it applies to users.
With those Cal/Val basics as background, the rest of this article presents key examples of the uses of VIIRS Imagery that show its quality as being highly useful (even exceeding expectations) for many analysis and forecasting applications. In the cases presented, the Imagery or image products proved beneficial to the users.
5. Applications of VIIRS Imagery in Meteorological Operations
5.1. Alaska Examples
As noted in previous sections, Alaska users of VIIRS are specifically spelled out as primary users of VIIRS imagery since they are located on the northern edge of most geostationary satellite views and polar-orbiting data is best utilized in Polar Regions where there is a high frequency of satellite overpasses. The KPP explicitly spells out the Alaskan region as the most critical area for Imagery coverage and quality.
5.1.1. Visible and Longwave Imagery
VIIRS Imagery bands are displayable on NWS Alaska Region AWIPS as single-band products.
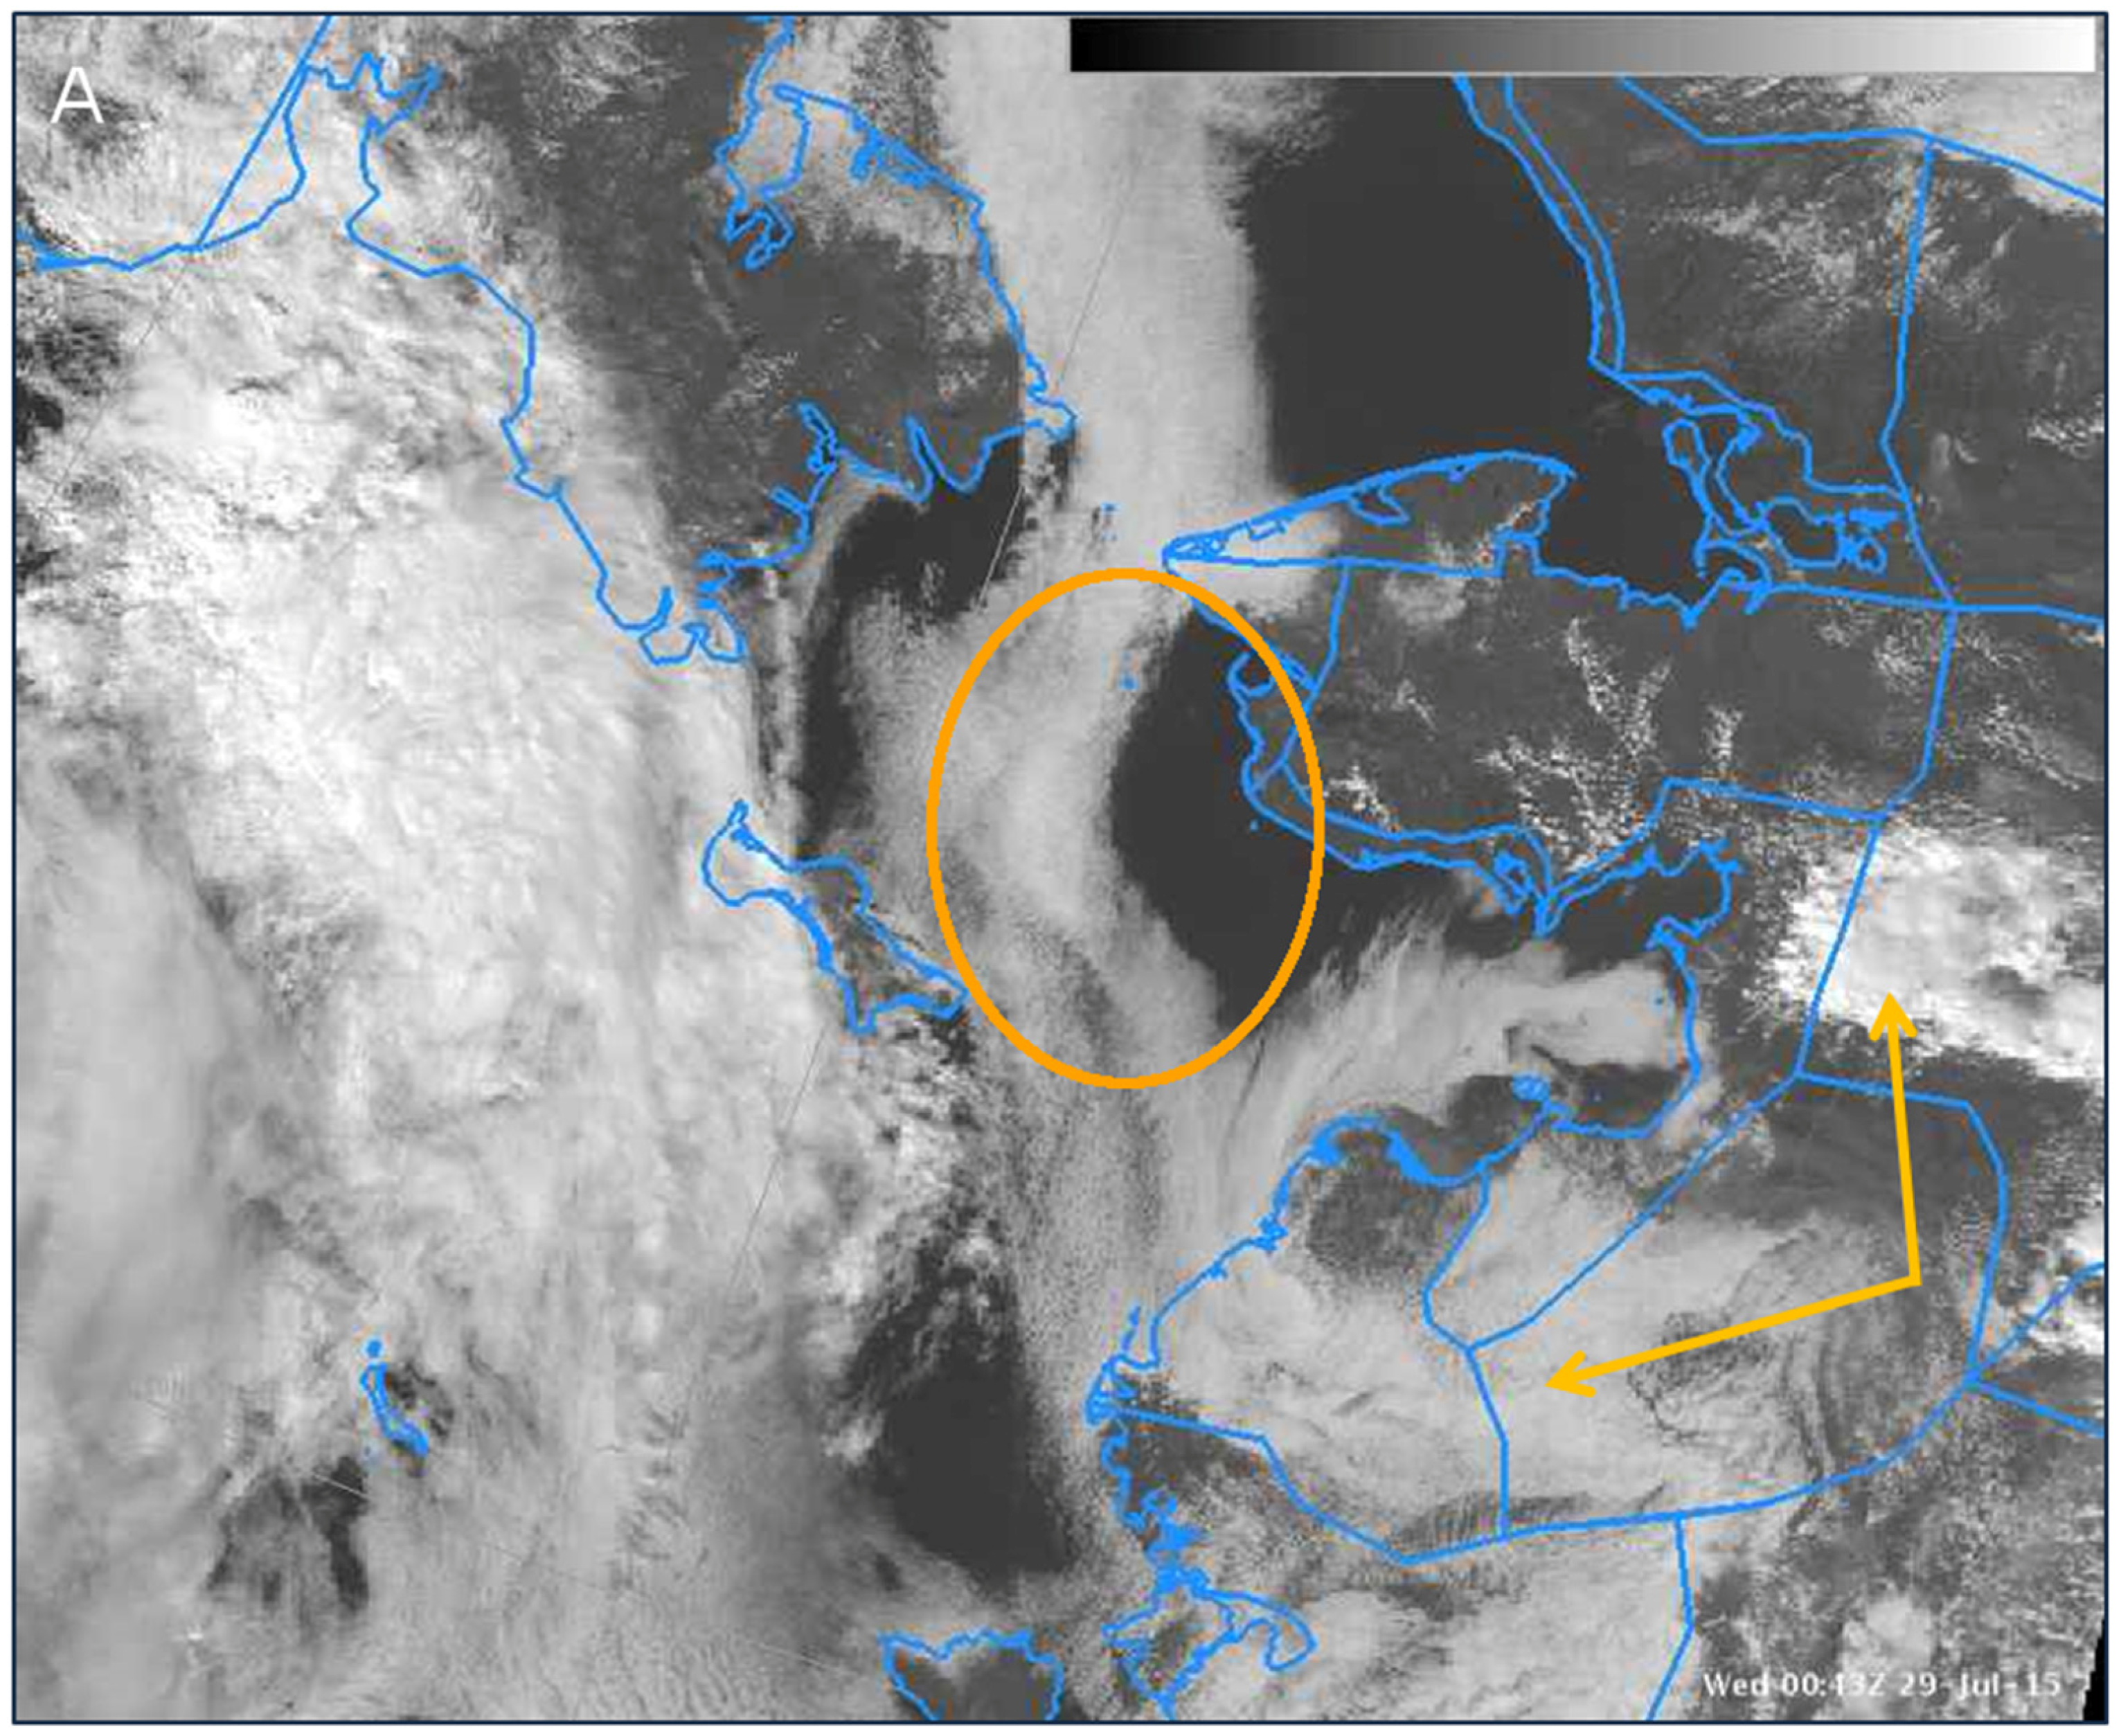
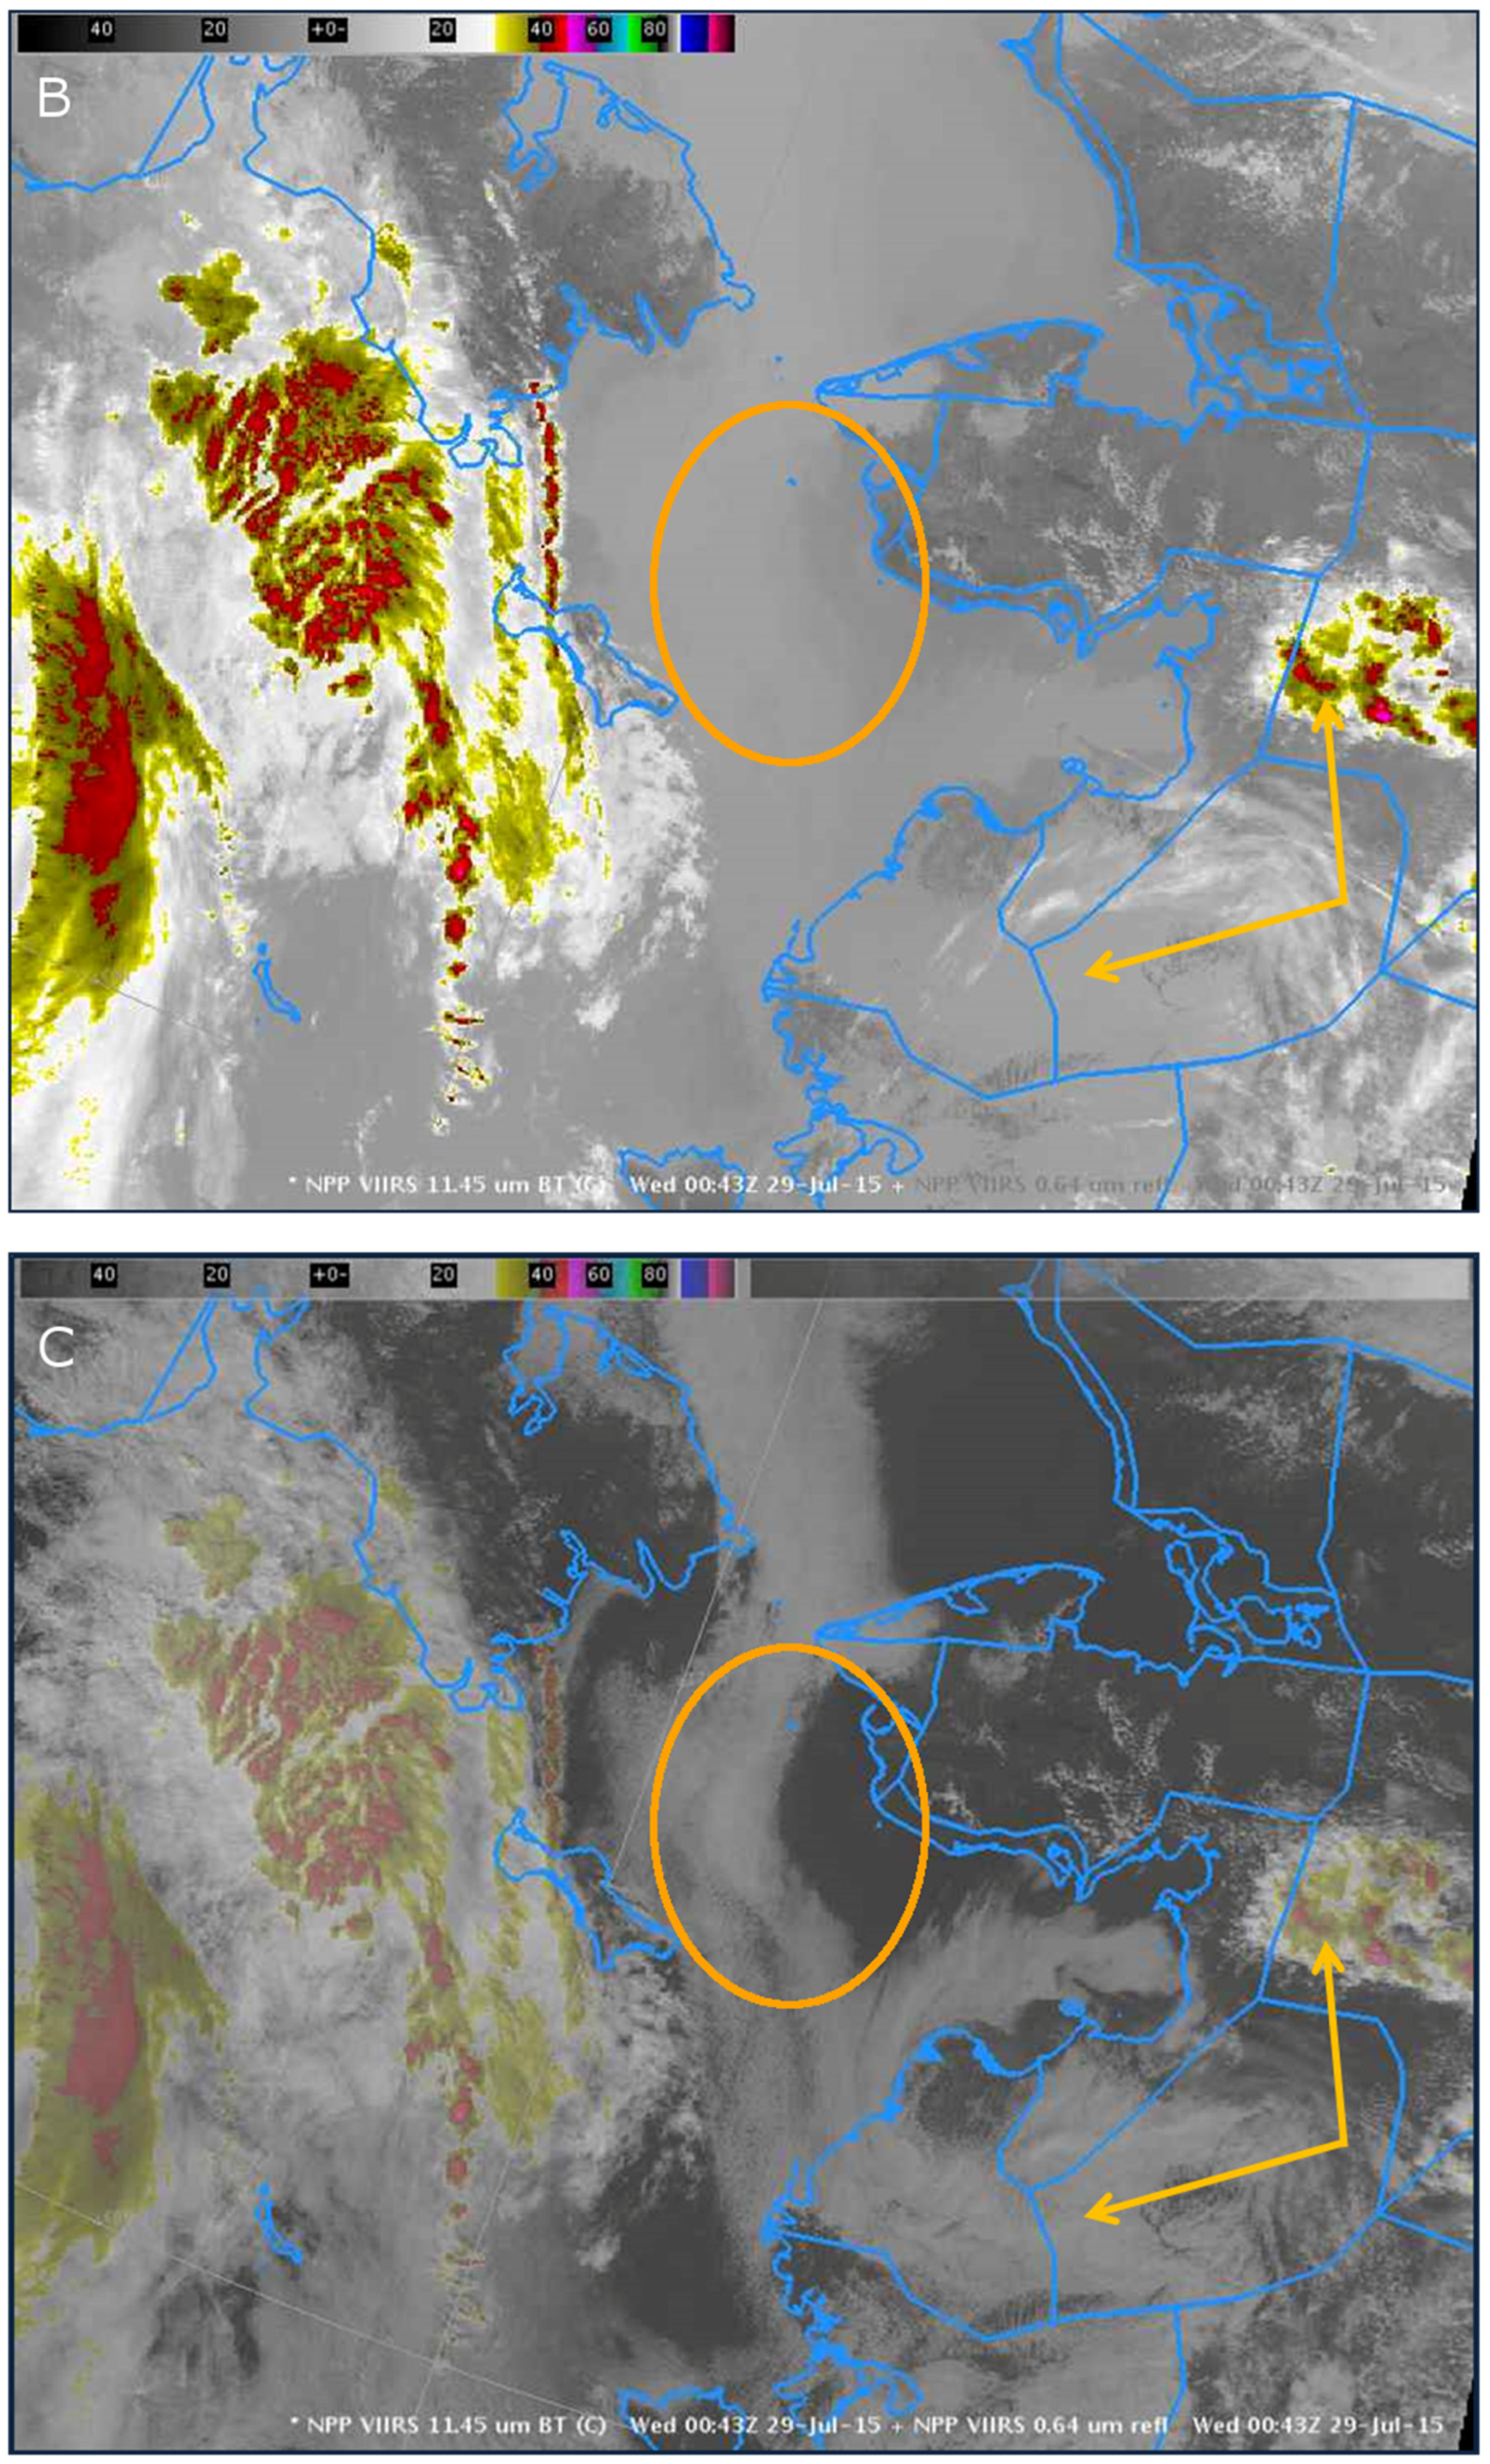
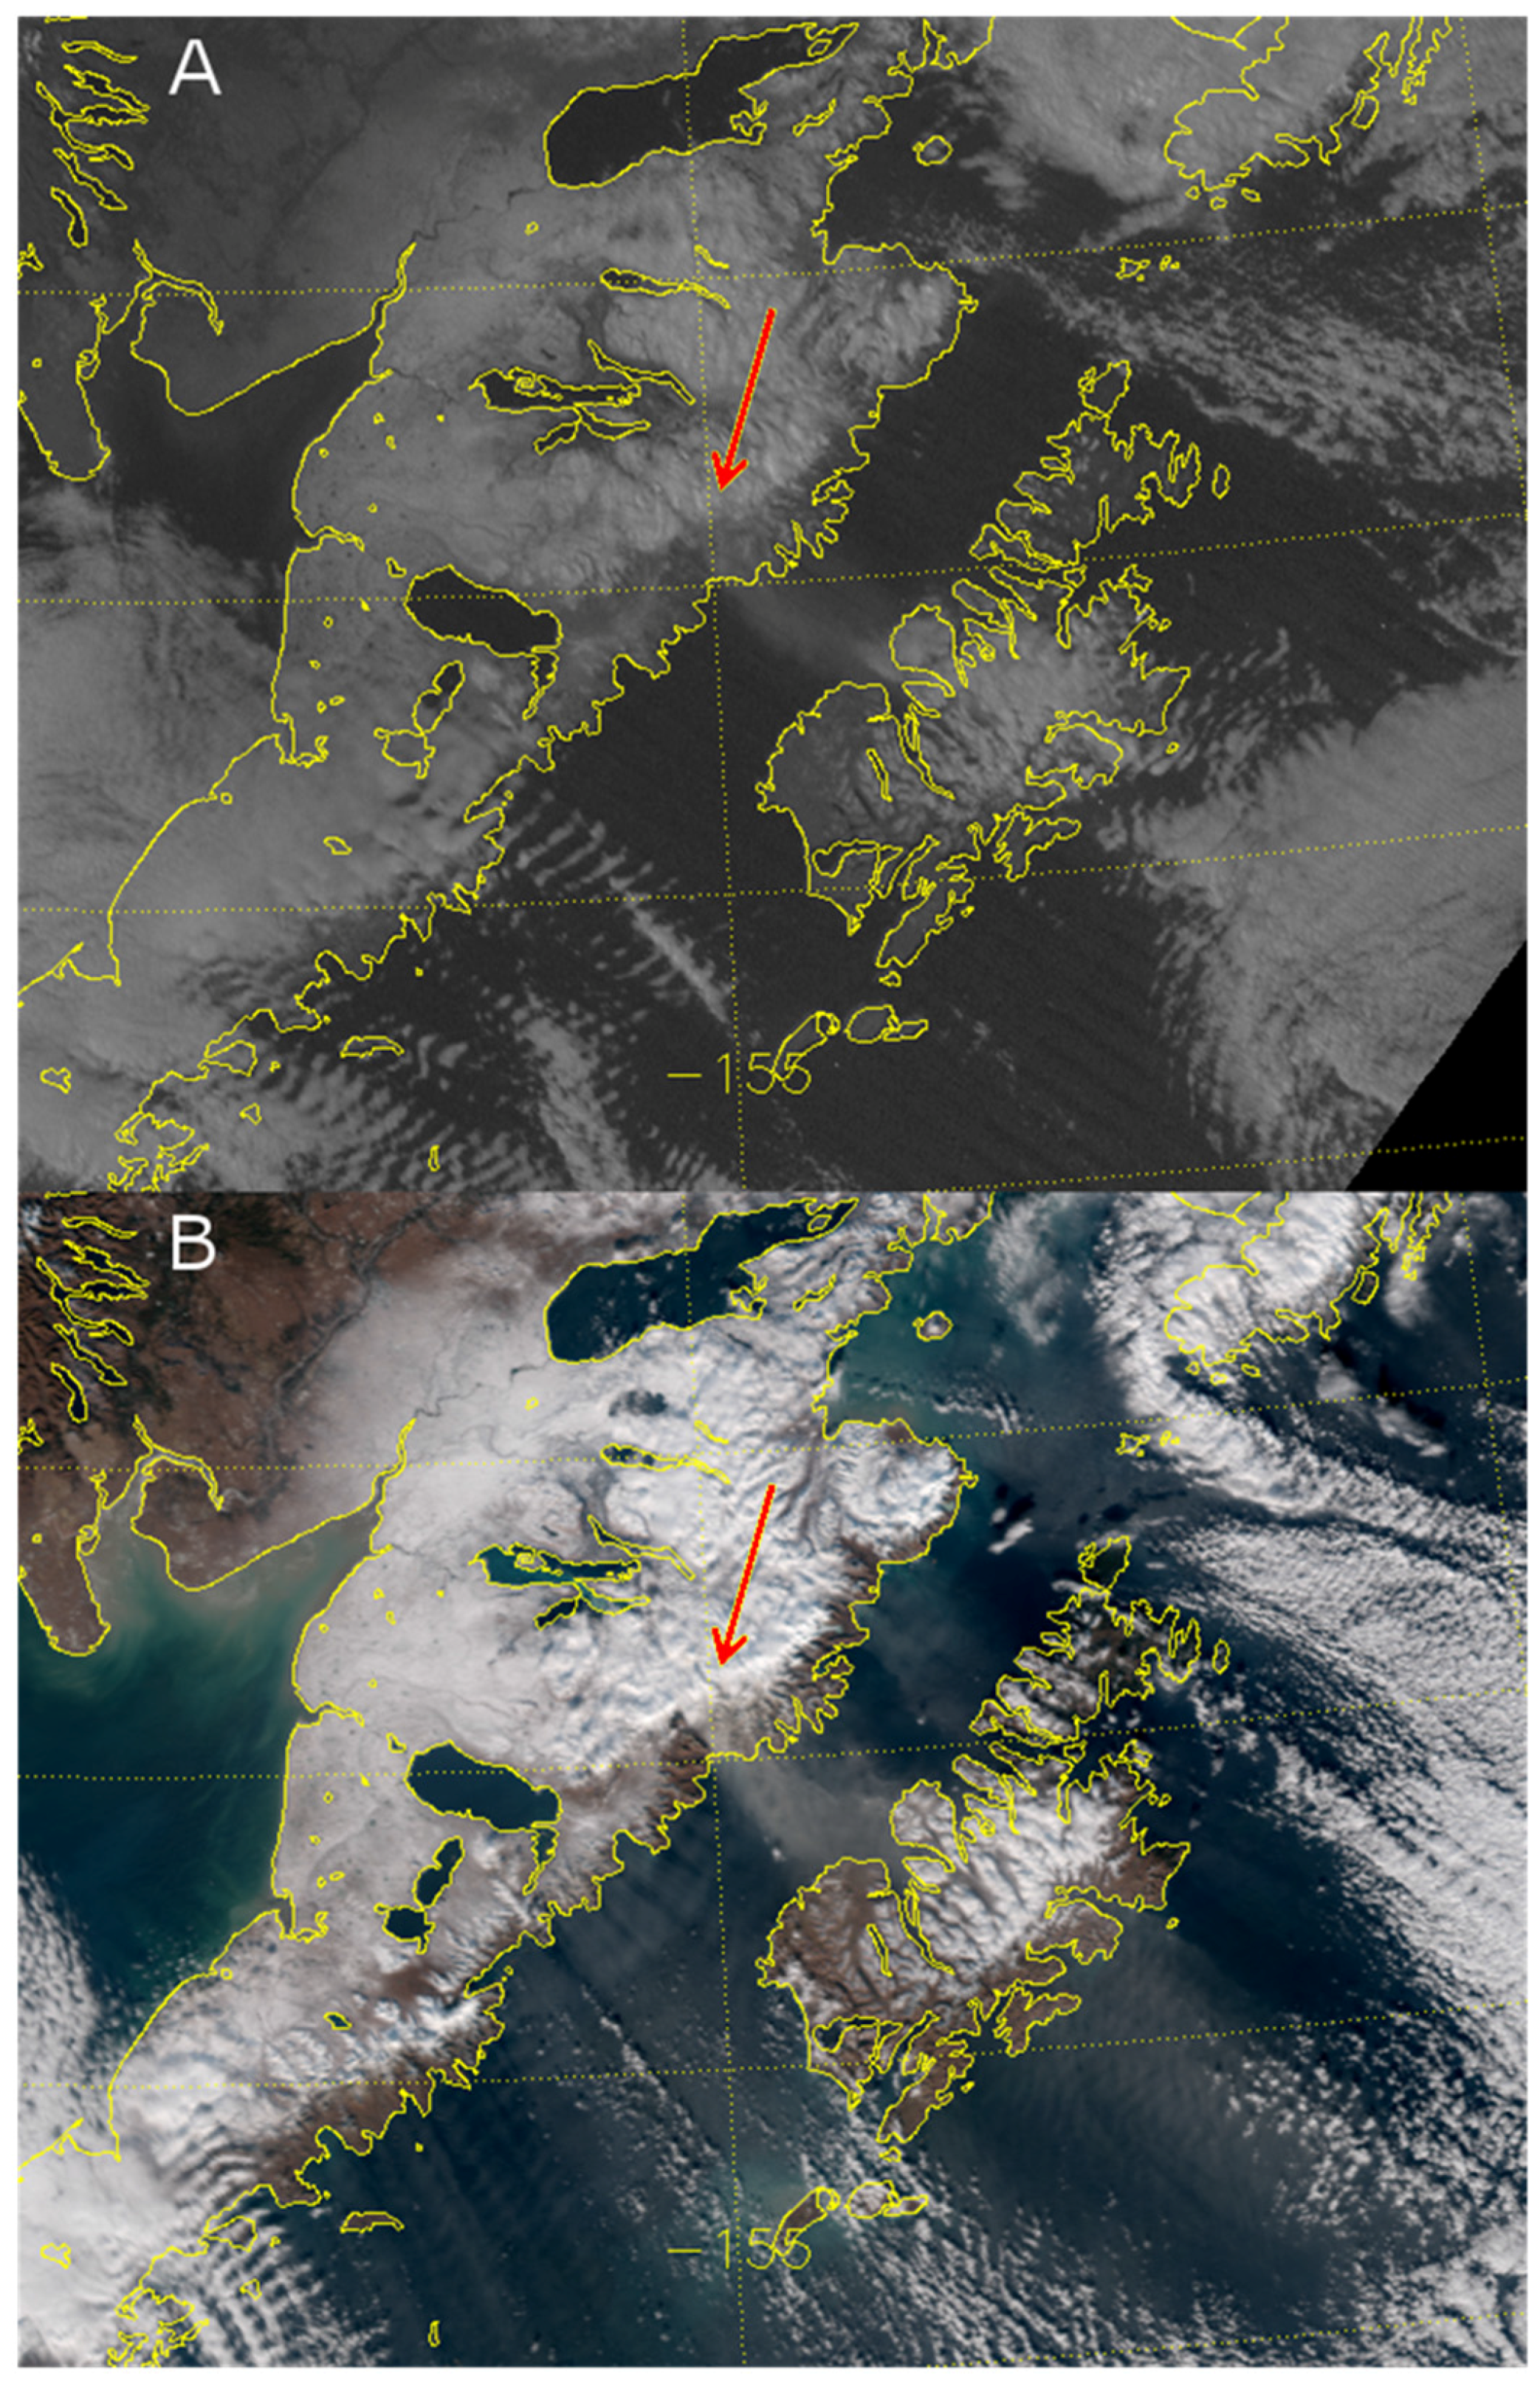
Figure 2A shows an AWIPS screen capture of I1 (0.64 µm) visible imagery from 29 July 2015 at 0043 UTC (4:43 pm Alaska Daylight Time), 28 July 2015.
Figure 2B shows the I5 (11.45 µm) longwave IR imagery. Each of these single-band products has its strengths and weaknesses. For example, consider the deck of low stratus over the ocean near the Bering Strait. This stratus is obvious in the VIIRS I1 visible imagery. But clouds like these typically develop in the lower troposphere and have temperatures similar to nearby sea surface temperatures, with the result that the distinction between the stratus deck and clear skies over the ocean (in the yellow circle) cannot be made using the VIIRS I5 (11.45 µm) longwave IR imagery alone. The I5 imagery helps forecasters identify colder convective clouds more easily than can be done in the I1 visible imagery. The colder clouds inland on the right side of these figures (noted by yellow arrows) represent typical summertime afternoon convection over the rough terrain of the Nulato Hills. These convective clouds are easy to identify in the I5 imagery because of their colder temperatures, but these clouds might not be immediately identified as convective in the I1 visible imagery alone, since they have the same white color as the low stratus over the nearby marine areas.
Figure 2C is the result of combining the different advantages of the VIIRS I1 visible and I5 longwave IR imagery into a single product, thereby allowing the forecaster to gain the meteorological insights contained in two different bands by looking at just one product. In this case, the two Imagery bands are simply overlaid and blended together. This approach is simplistic, but effective. A more sophisticated and much more helpful approach is not to overlay different products but to combine two or more single bands into a multi-spectral product as described in the following section.
Figure 2.
Annotated Advanced Weather Interactive Processing System (AWIPS) screen capture on 29 July 2015 at 0043 UTC centered over the Bering Strait of (A) VIIRS I1 (0.64 µm) band visible imagery; (B) VIIRS I5 (11.45 µm) band longwave infrared imagery; and (C) the two bands overlaid in AWIPS into a VIIRS Imagery product.
5.1.2. Fog/Low Cloud
Beginning with the GOES-8 imager, when the 3.9 µm band first became available, the 11 µm–3.9 µm brightness temperature difference (BTD) has traditionally been used for fog/low cloud detection [
22]. At night, the 3.9 µm and I5 (11.45 µm) bands detect differences in radiometric temperature (due to spectral emissivity differences between the two bands) rather than thermodynamic temperature. These emissivity differences are related to the size of the particles, meaning that small droplets (such as fog) can be distinguished from larger droplets as well as cloud free surfaces. While these emissivity effects are present during the day, they are overwhelmed by the solar signal in the 3.9 µm band. Thus, this product is more useful during the night time. Fog is of critical importance in the Alaska region due to the large amount of private and commercial aviation and maritime traffic. During the northern hemisphere winter months, much of the Alaska region is in “night” or near-terminator illumination conditions, allowing for the application of the 11 µm–3.9 μm BTD for fog detection. Owing to the availability of timely direct broadcast S-NPP data, provided by the Geographic Information Network of Alaska (GINA, located at the University of Alaska, Fairbanks), there have been several instances where the NWS Weather Forecasting Office (WFO) in Fairbanks, Alaska, has been able to gain information on fog/stratus along the North Slope of Alaska in near real-time.
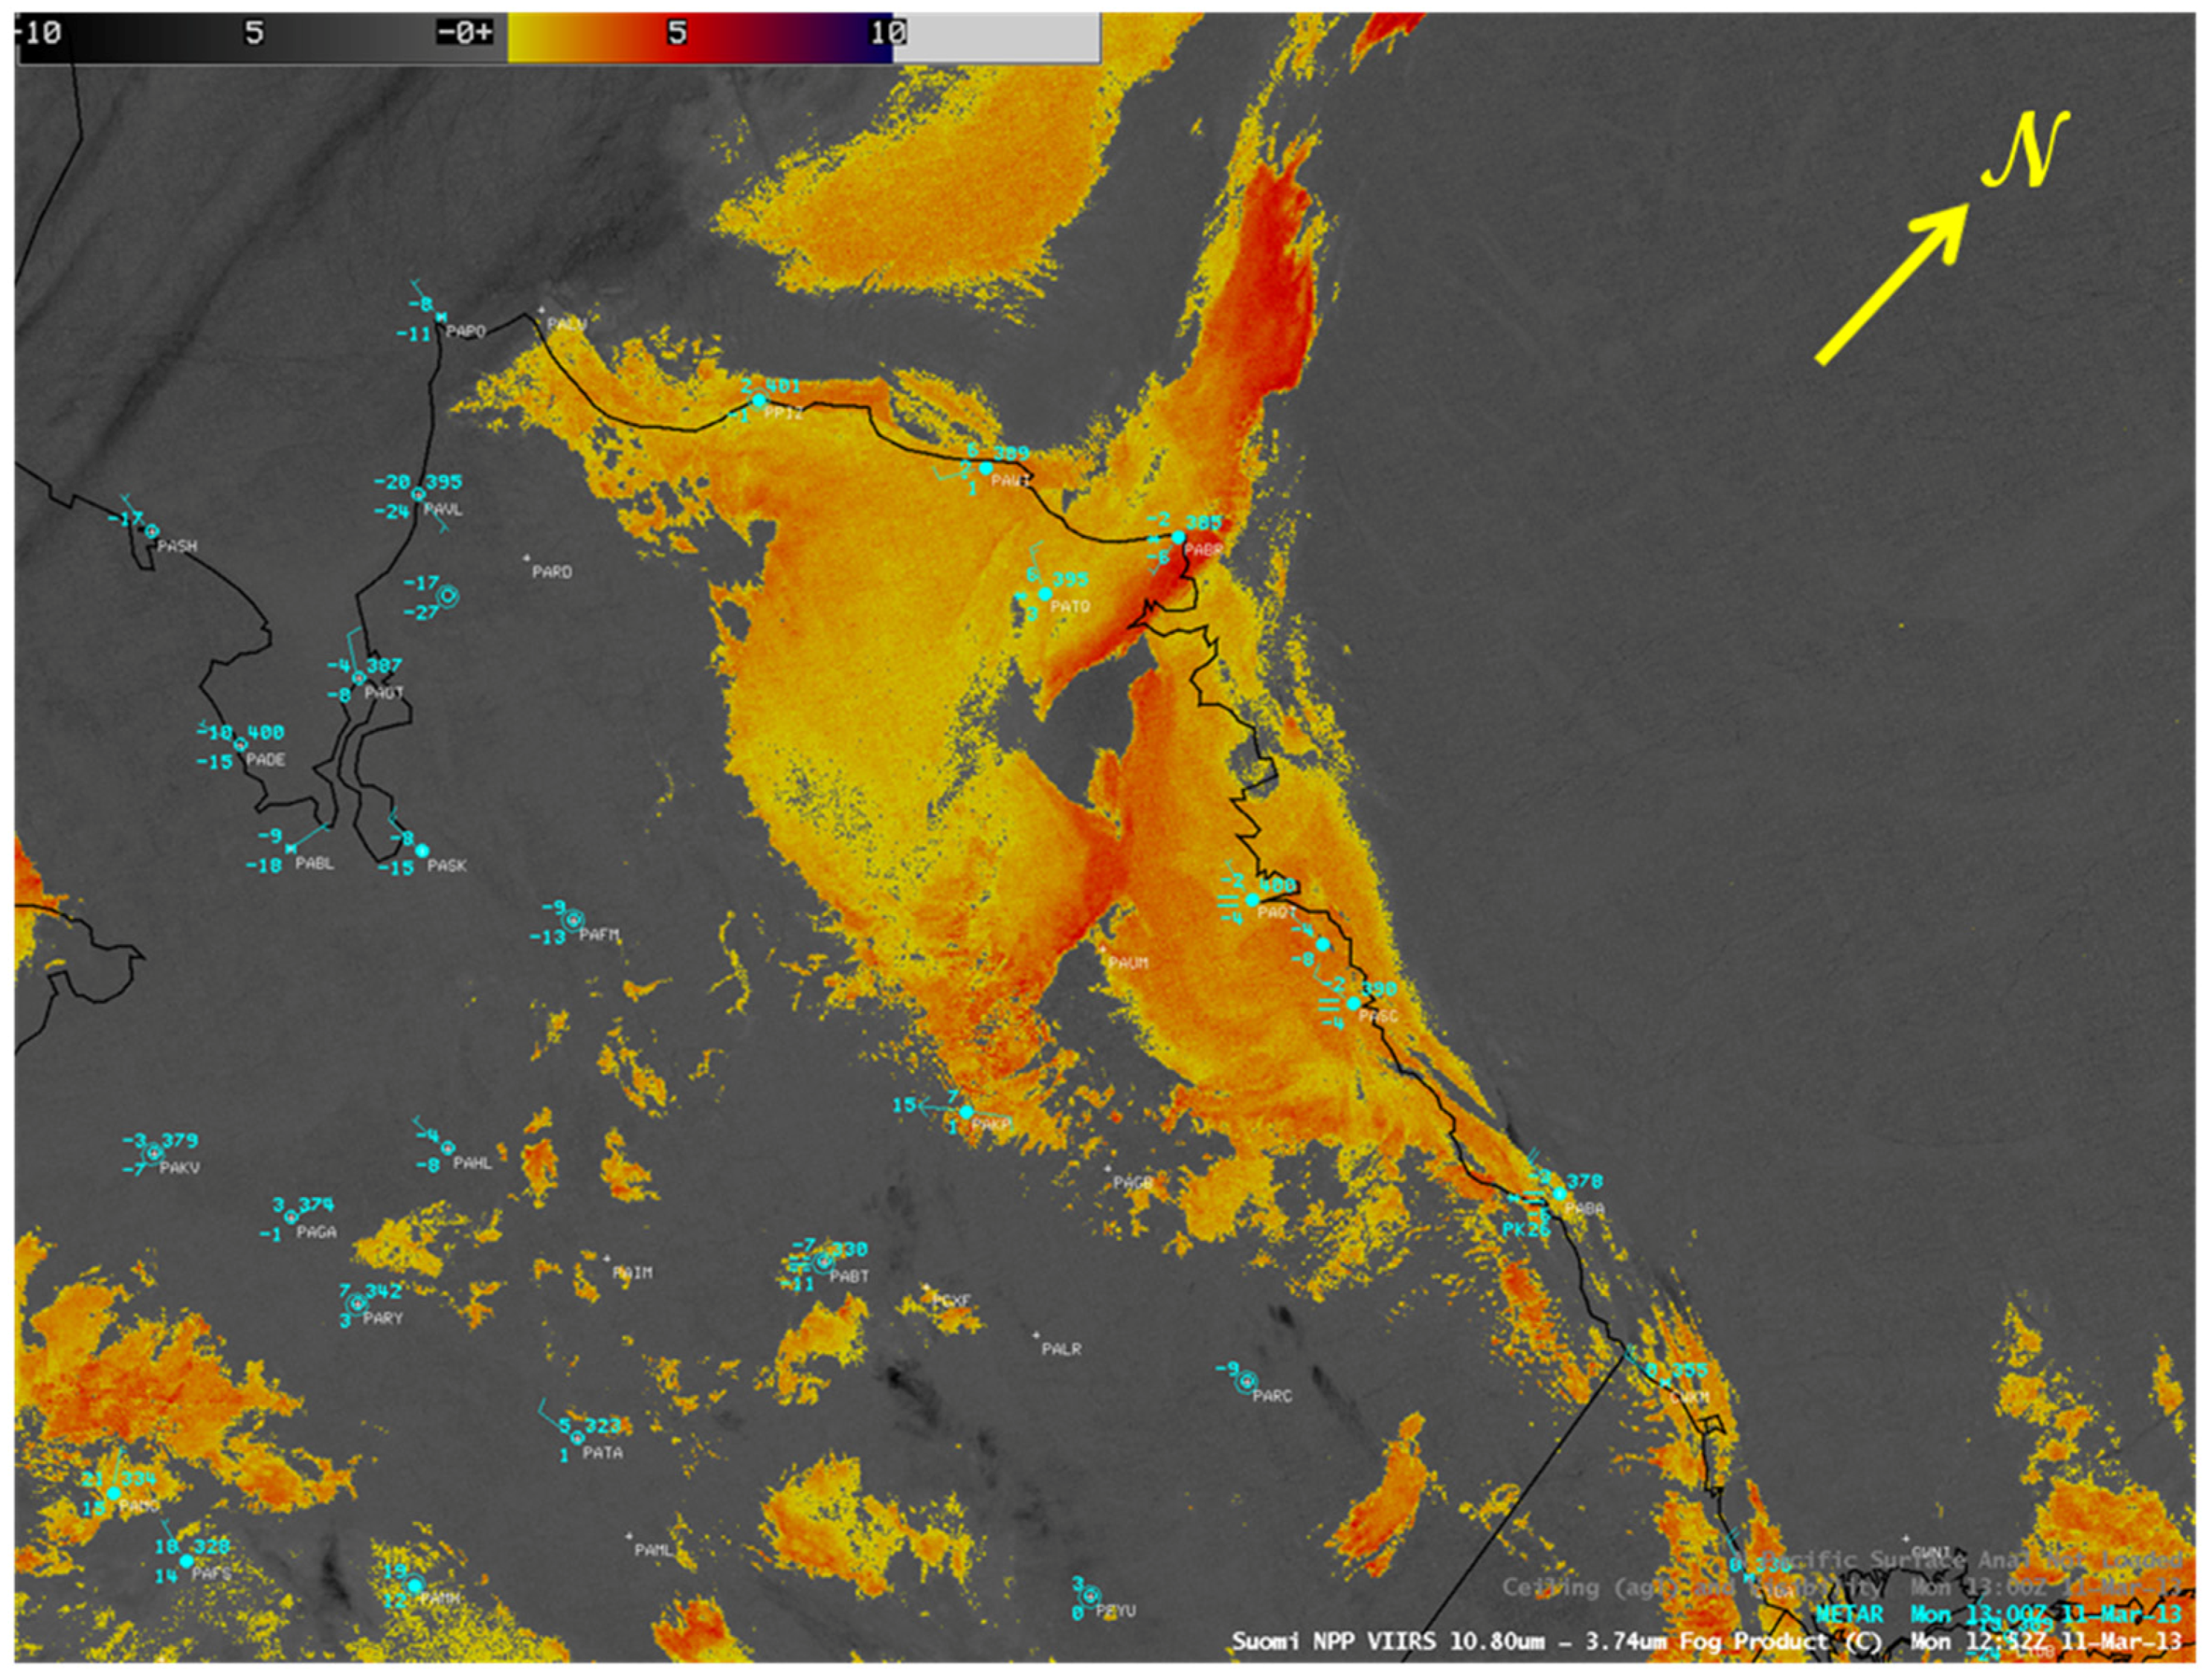
Figure 3 shows a color-enhanced 11 µm–3.9 µm BTD for the northern Alaska forecast area including the North Slope. The orange colors indicate areas of low cloud/fog, the light grays indicate higher clouds, and the black areas indicate thin cirrus. To accompany this figure, portions of the NWS Northern Alaska Forecast Discussion (AFD) for 11 March 2013 issued at 1258 pm (which follows) mention the use of VIIRS imagery (with yellow highlighting emphasizing the S-NPP VIIRS Imagery fog product). The AFD points out that the fog was evident in the VIIRS Imagery, surface observations, and MODIS products; but the higher spatial resolution of the VIIRS Imagery captured the fog in more detail than MODIS, and certainly more detail than surface observation; as well as VIIRS providing additional imagery at times other than MODIS overpasses.
Figure 3.
Color-enhanced 11 µm–3.9 µm BTD for 11 March 2013 at 1252 UTC, along with METAR observations at 1300 UTC. The oranges indicate areas of low cloud/fog, where the light grays indicate higher clouds and the black indicates thin cirrus.
Figure 3.
Color-enhanced 11 µm–3.9 µm BTD for 11 March 2013 at 1252 UTC, along with METAR observations at 1300 UTC. The oranges indicate areas of low cloud/fog, where the light grays indicate higher clouds and the black indicates thin cirrus.
“The Suomi NPP VIIRS satellite fog product was indicating a decent layer of stratus along the North Slope. Observations across the area generally indicated 1 to 2 miles (1.5 to 3 km) in visibility with flurries and fog. The IFR conditions align very well with the higher probabilities of MODIS IFR product. There are some very isolated pockets of higher probabilities of the MODIS LIFR conditions. These conditions should remain through Tuesday evening or Wednesday morning as the surface high pressure remains within the area. By Wednesday morning the surface pressure gradient begins to tighten providing an increase in winds and perhaps a break in some of the fog.”
Fog and stratus have large impacts year round along the North Slope, particularly to the aviation community. The fog/stratus example in
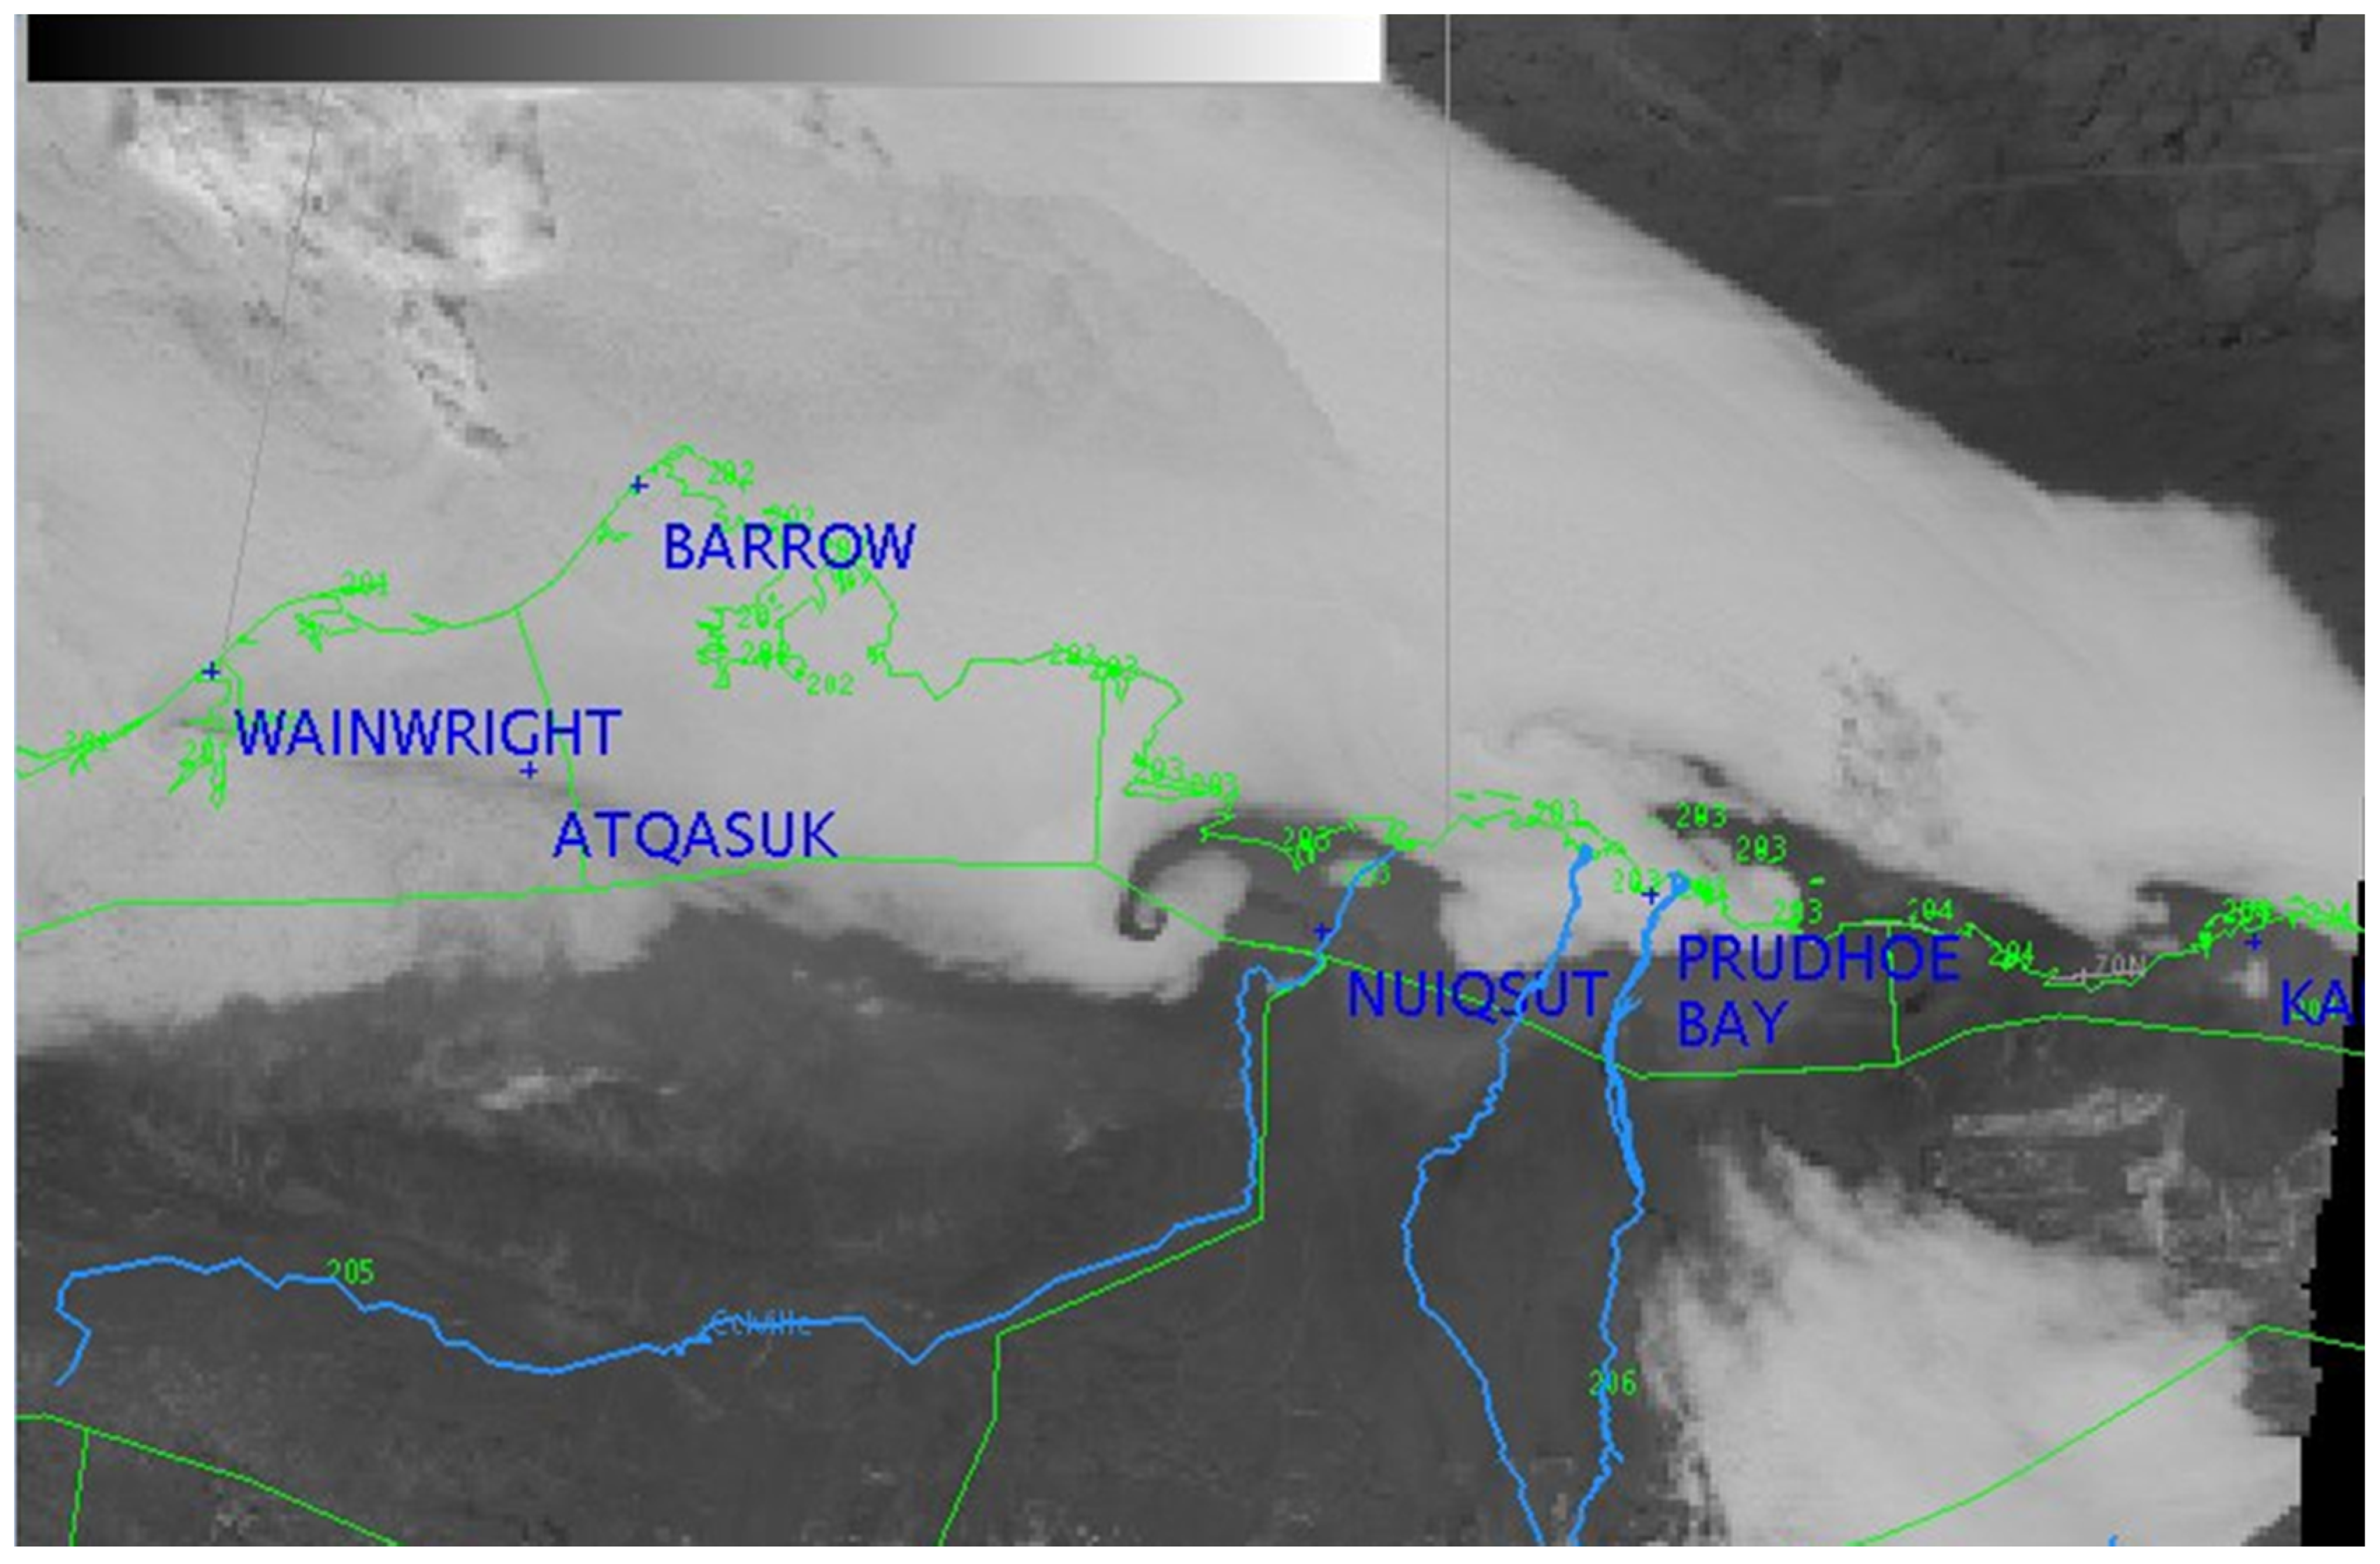
Figure 4 highlights the critical utilization the VIIRS imagery of the I3 (1.61 µm) band at the NWS Fairbanks WFO in the preparation of the Terminal Aerodrome Forecast (TAFs) issuance. The timely high-resolution imagery at 0004 UTC on 26 April 2015 allowed forecasters to identify and forecast the mesoscale circulation feature moving to the northwest of the Nuiqsut AK and showed improving visibility conditions for air flights. Meanwhile it was apparent that the visibility at the Prudhoe Bay airport was still ¼ mile (400 m) in freezing fog and would remain IFR conditions as well as along the Arctic Coast.
Figure 4.
The Suomi National Polar-orbiting Partnership (S-NPP) VIIRS I3 (1.61 µm) band along the North Slope on 26 April 2015 at 0004 UTC. The white colors indicate areas of low clouds and fog, where the darker gray indicates the clear conditions. The light blue lines are the rivers with the green lings indicating the boundaries for the zone forecast areas.
5.1.3. Multi-Spectral Imagery
The large number of VIIRS I-bands and M-bands (5 and 16 bands, respectively) offers a wide variety of possible combinations into multi-spectral, or Red, Green, Blue (RGB) composite, image products.
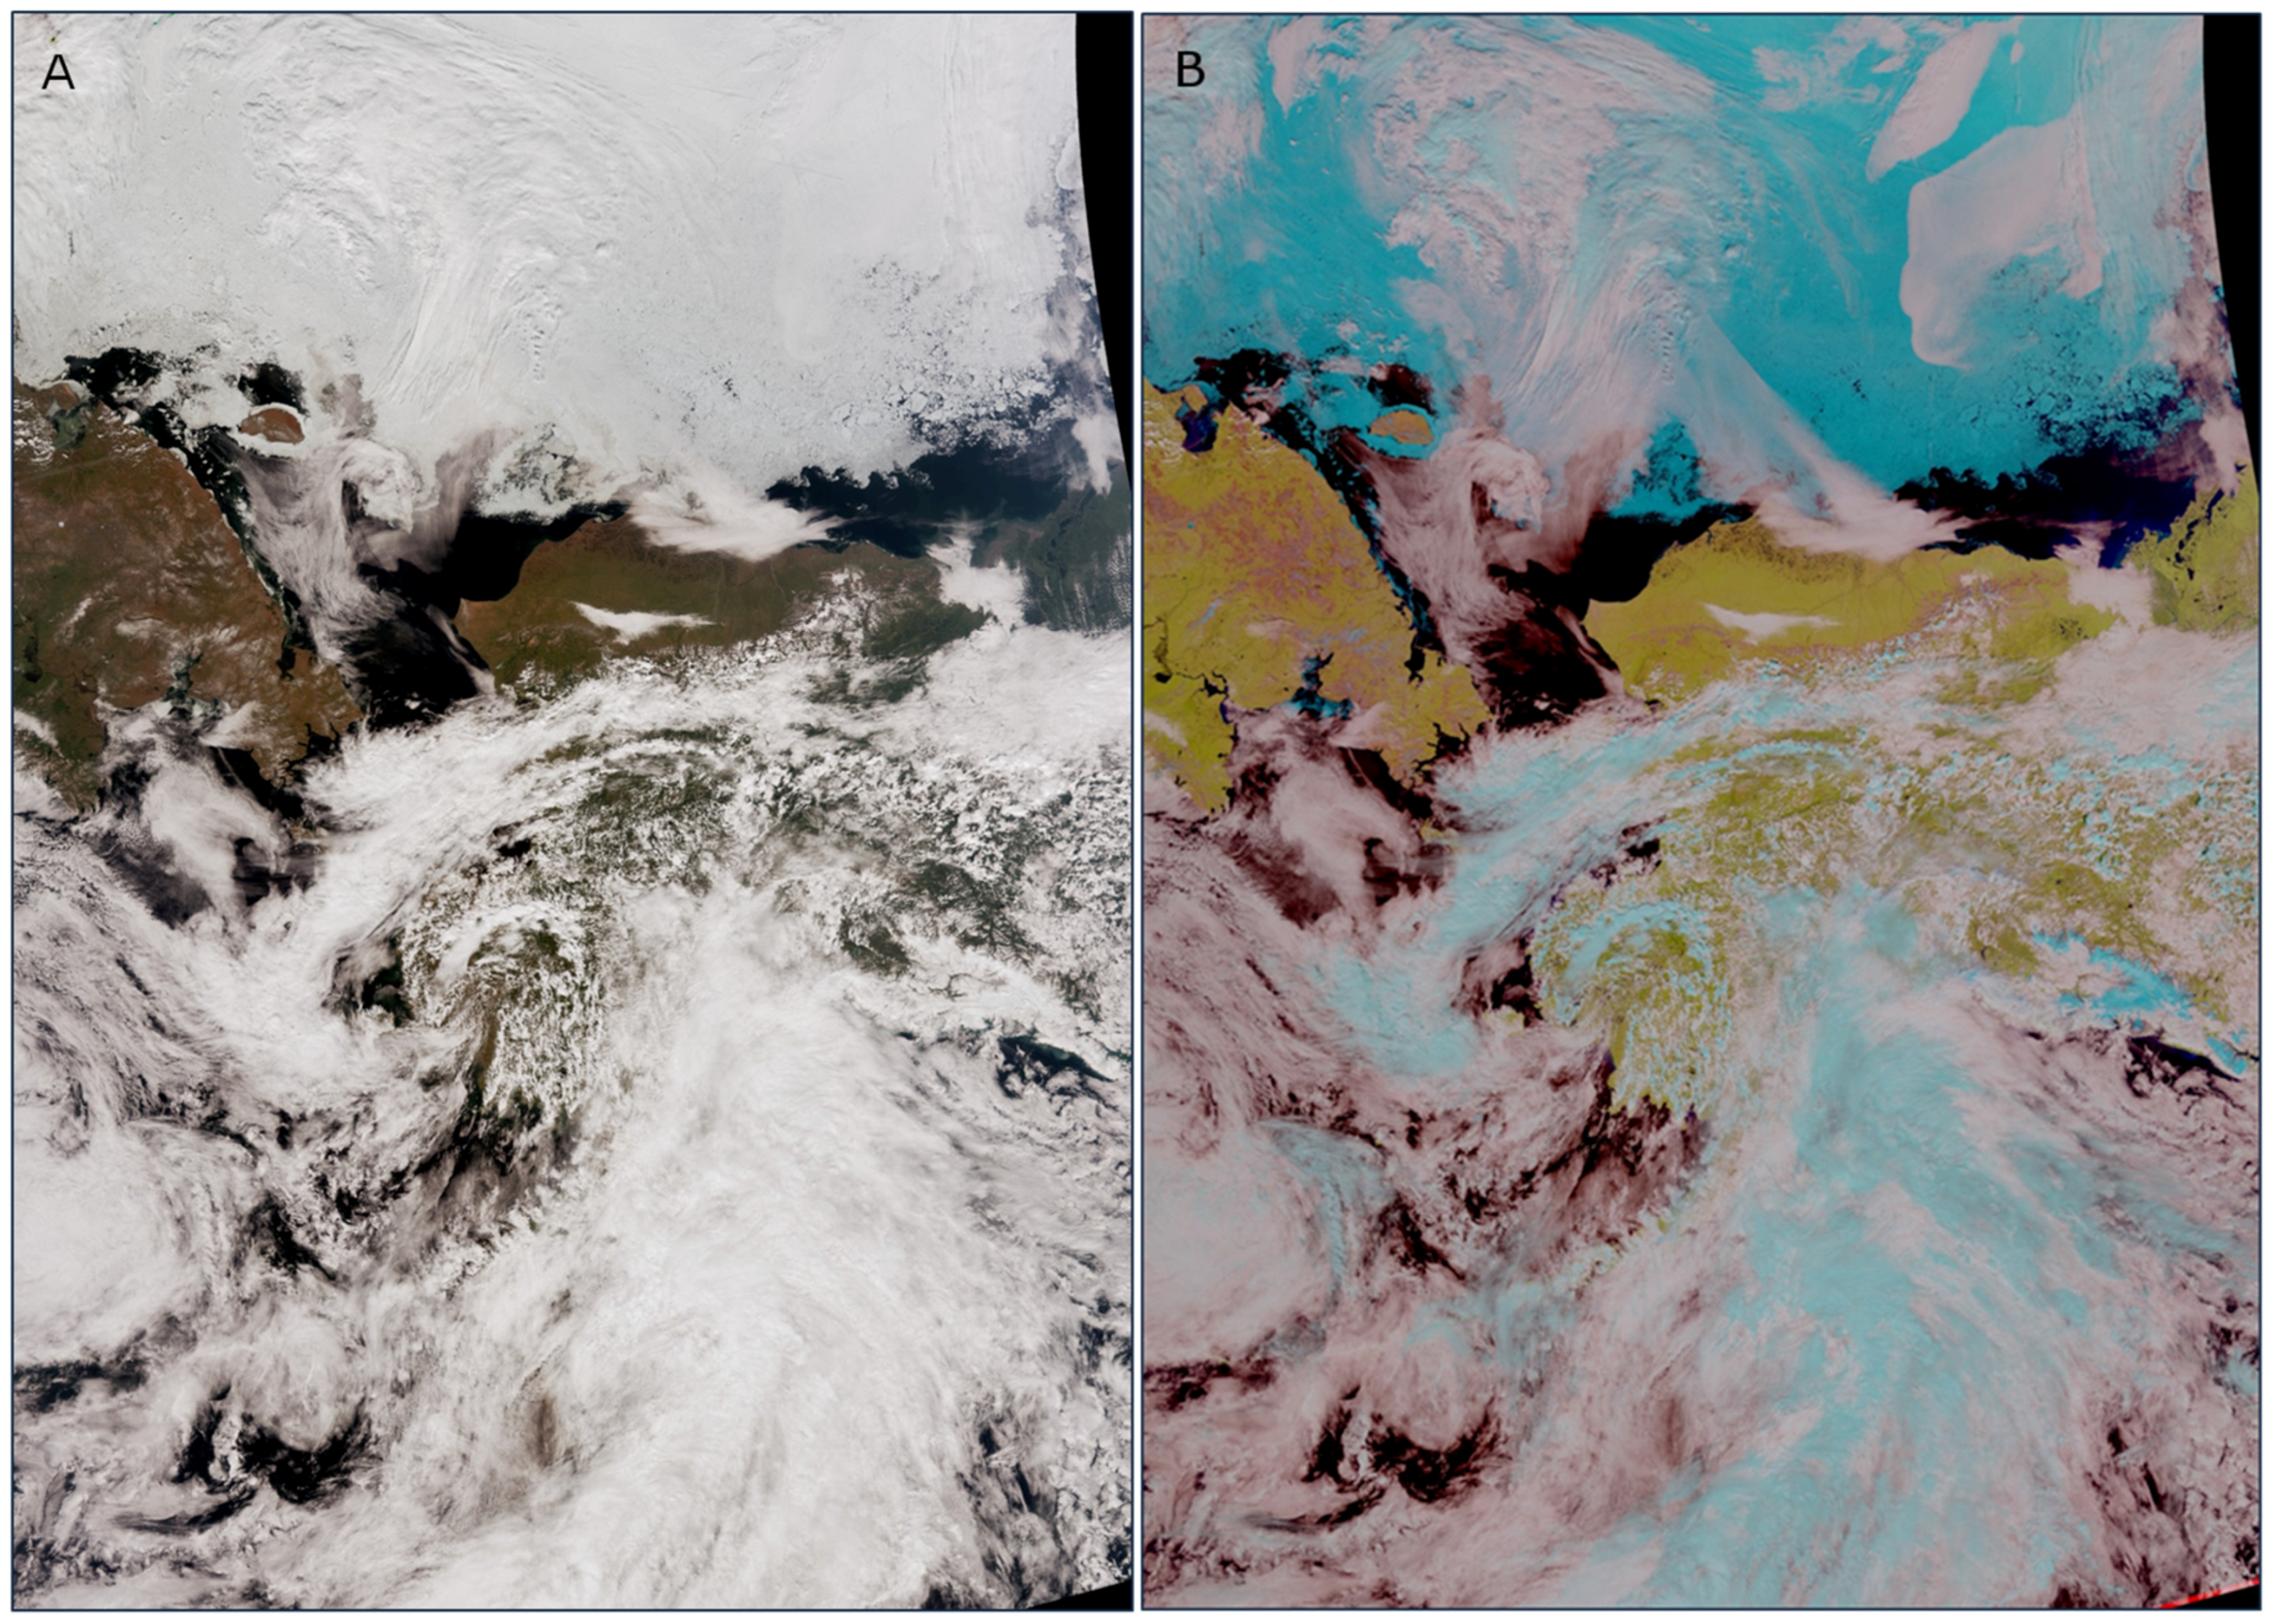
Figure 5A shows a true-color RGB from 9 July 2015 at 2302 UTC (3:02 pm Alaska Daylight Time), that combines the M5 (0.67 µm), M4 (0.55 µm), and M3 (0.49 µm) bands into a true-color image that represents what the human eye would see if we could ride along on the S-NPP satellite. A true-color image has great advantages for meteorological surveillance, in part because it is comparatively intuitive to interpret. Every multi-spectral Imagery product has its strengths and weaknesses, and while a strength of the true-color RGB is its ease of interpretation, a particular weakness (from the Alaskan perspective) is its inability to offer a distinction between clouds and sea ice over the Arctic Ocean because both clouds and ice appear white in true-color imagery.
Figure 5B is a natural-color RGB composite image that assigns the VIIRS I3 (1.61 µm) band to the red component, the I2 (0.86 µm) band to the green component, and the I1 (0.64 µm) band to the blue component. This product takes advantage of the fact that incoming sunlight is absorbed or reflected to various degrees by different surfaces at these three wavelengths. Most helpfully, the resulting multi-spectral product depicts sea ice and ice clouds as cyan and liquid-based clouds as pink, making the separation of low clouds from ice comparatively straightforward. (Sea ice and ice clouds can normally be easily discriminated by texture and context.) The number of multi-spectral products available to NWS meteorologists in Alaska on their AWIPS workstations has increased substantially over recent years, with RGB composite images now being built routinely from VIIRS and MODIS data received locally in Alaska via direct broadcast antennas.
Figure 5.
(A) VIIRS True-color Red, Green, Blue (RGB) combining the I1 (0.64 µm) band with the M3 (0.49 µm) and M4 (0.55 µm) bands; and (B) VIIRS natural-color RGB composite image combining the VIIRS I3 (1.61 µm), I2 (0.86 µm), and I1 bands, both from 9 July 2015 at 2302 UTC.
Figure 5.
(A) VIIRS True-color Red, Green, Blue (RGB) combining the I1 (0.64 µm) band with the M3 (0.49 µm) and M4 (0.55 µm) bands; and (B) VIIRS natural-color RGB composite image combining the VIIRS I3 (1.61 µm), I2 (0.86 µm), and I1 bands, both from 9 July 2015 at 2302 UTC.
5.1.4. The Day/Night Band at Night
The VIIRS DNB has proven particularly useful to NWS forecasters during the extended periods of darkness during the Alaskan winter, because the DNB offers forecasters the ability to analyze meteorological and terrain features in the visible portion of the spectrum when ambient light levels are too low for conventional visible satellite imagery to be helpful.
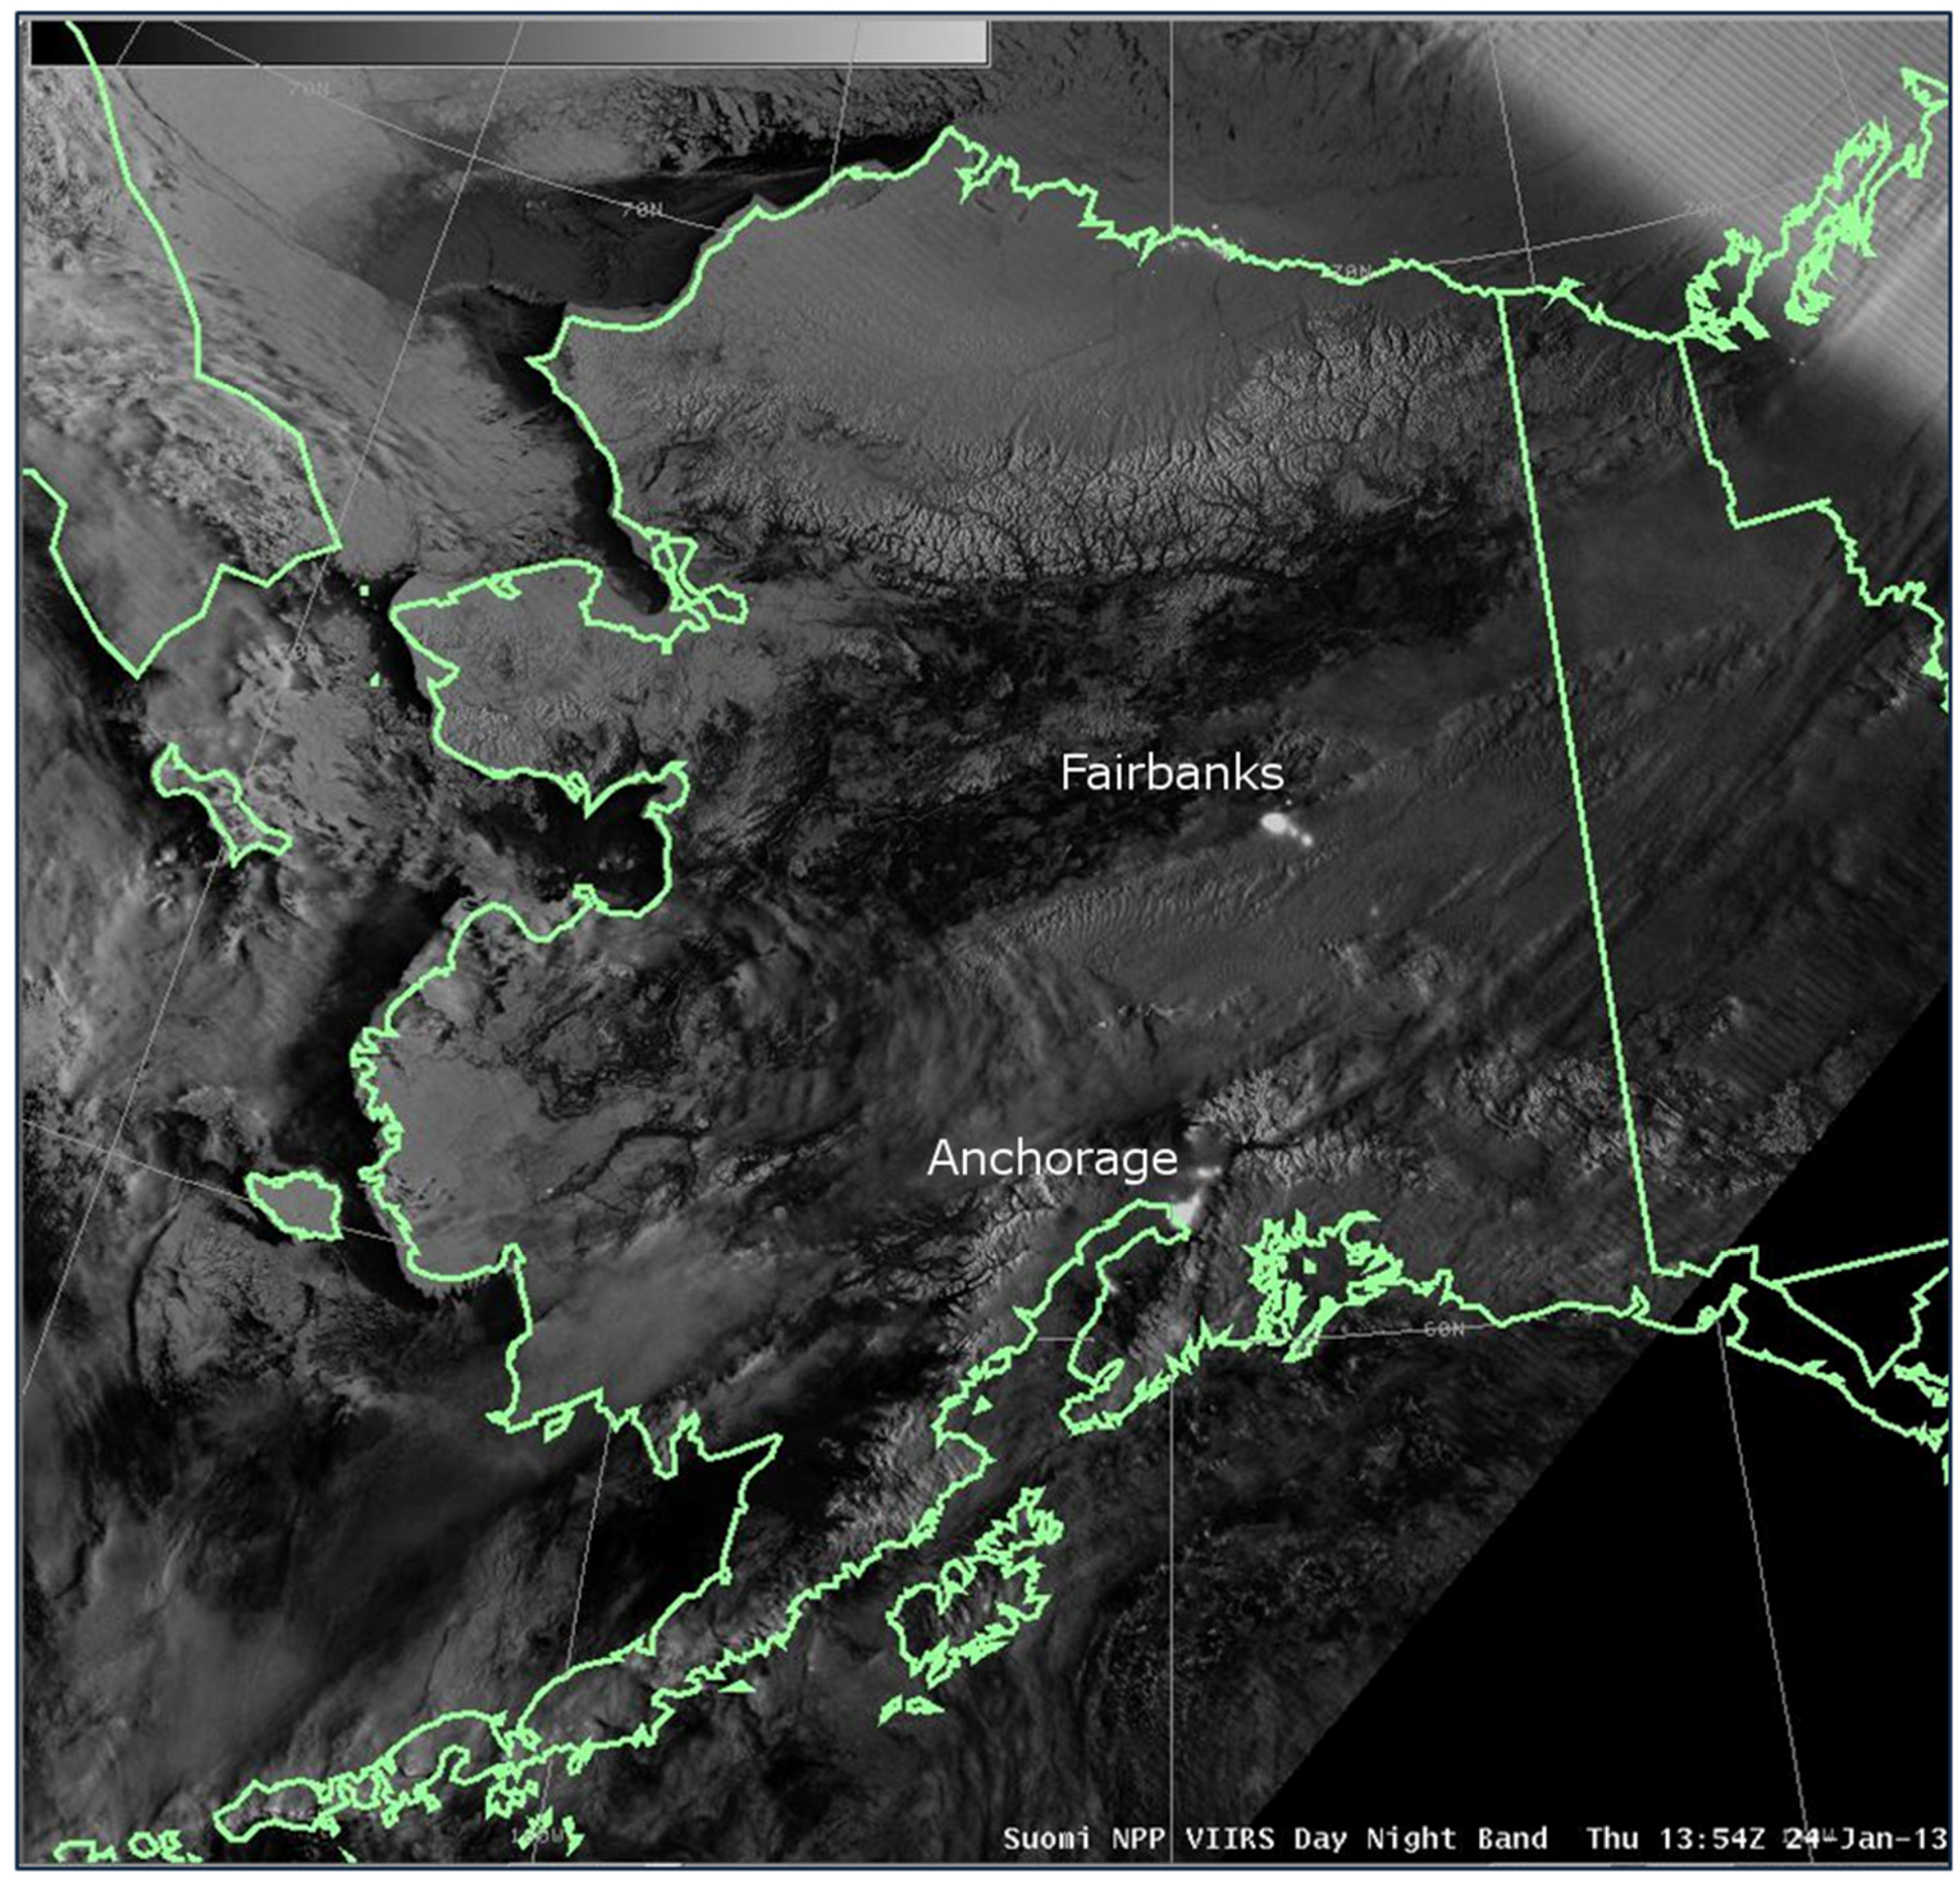
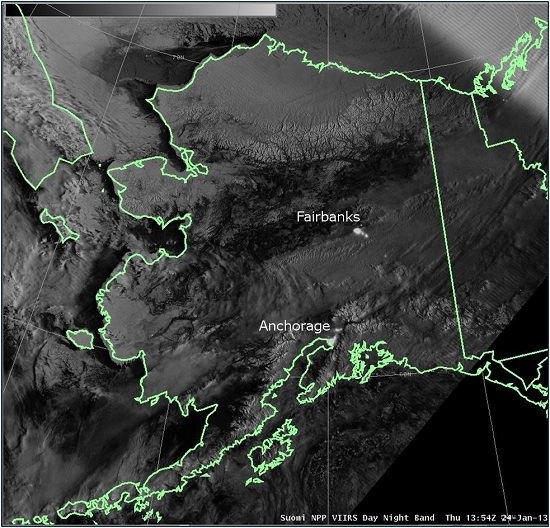
Figure 6 is an AWIPS screen capture of DNB imagery from 24 January 2013 at 1354 UTC (4:54 am Alaska Standard Time), a period of total darkness over all of Alaska. The scaling of DNB imagery needs to be appropriate to the lunar illumination at the time of the image, as the DNB radiances can vary by 7 orders of magnitude, from full daylight to nearly total darkness under new-moon conditions. Terrain and cloud features are very evident, as are the lights from the cities of Anchorage and Fairbanks. The raw S-NPP data used to produce this image were received via a direct broadcast antenna at GINA on the campus of the University of Alaska Fairbanks, then processed at GINA with CSPP software, and finally delivered to the NWS in Alaska for display in AWIPS via the Local Data Manager (LDM).
Figure 6.
Example of VIIRS DNB imagery for 24 January 2013 as displayed on a National Weather Service (NWS) AWIPS workstation. An adjustable gray-scale appropriate to the lunar (or solar) illumination at the time is used to enhance the DNB radiances to best reveal cloud and surface features.
Figure 6.
Example of VIIRS DNB imagery for 24 January 2013 as displayed on a National Weather Service (NWS) AWIPS workstation. An adjustable gray-scale appropriate to the lunar (or solar) illumination at the time is used to enhance the DNB radiances to best reveal cloud and surface features.
5.1.5. Volcanic Ash
Volcanic ash is also a common hazard in Alaska, not only from current eruptions, but even for ash from long-dormant eruptions as in the following example.
The 6–8 June 1912 eruption of Novarupta, one of the largest volcanic eruptions in recorded history, expelled ash with an estimated column height exceeding 23 km and deposited a layer of ash exceeding 100 m thick in the nearby Valley of Ten Thousand Smokes on the Alaska Peninsula [
23]. During periods of high winds, this volcanic ash may become re-suspended in the atmosphere, posing a hazard to aviation [
24] and human health [
25]. VIIRS imagery was able to capture one such incident that occurred on 30–31 October 2012. According to local media reports [
26], ash was lofted up to 1.2 km in altitude and resulted in the diversion and cancellation of flights in the vicinity of Kodiak Island during the high wind event. The NWS Alaska Aviation Weather Unit (AAWU) issued a Significant Meteorological event warning (SIGMET) for the re-suspended volcanic ash. Portions of the initial SIGMET [
27] issued at 2216 UTC on 30 October 2012 is included below.
“Volcano: Novarupta 1102-18
Eruption details: NO Eruption. Resuspended ASH.
RMK: Resuspended ash due to high winds in area. Not from eruption.”
Figure 7 shows the VIIRS DNB image (collected at night) along with the true-color RGB (Red/Green/Blue) composite image (collected during the following afternoon) from 30 October 2012. The plume of volcanic ash is visible in both the DNB and true-color images. In each image, the location of Novarupta is indicated by the yellow arrows. The ash plume extends from Novarupta to the southeast, across the Shelikof Strait and Kodiak Island. While the initial SIGMET was based on analysis of MODIS imagery, this case highlights the importance of satellite imagery for volcanic ash detection and demonstrates the utility of VIIRS imagery for this purpose.
Figure 7.
(A) VIIRS DNB image showing re-suspended ash from the 1912 Novarupta eruption (1411 UTC 30 October 2012) (B) VIIRS true-color image of the ash plume (2223 UTC 30 October 2012). In each image, the location of Novarupta is indicated by a red arrow. The ash plume extends from the volcano to the southeast across the Shelikof Strait and Kodiak Island.
5.1.6. Fire Weather
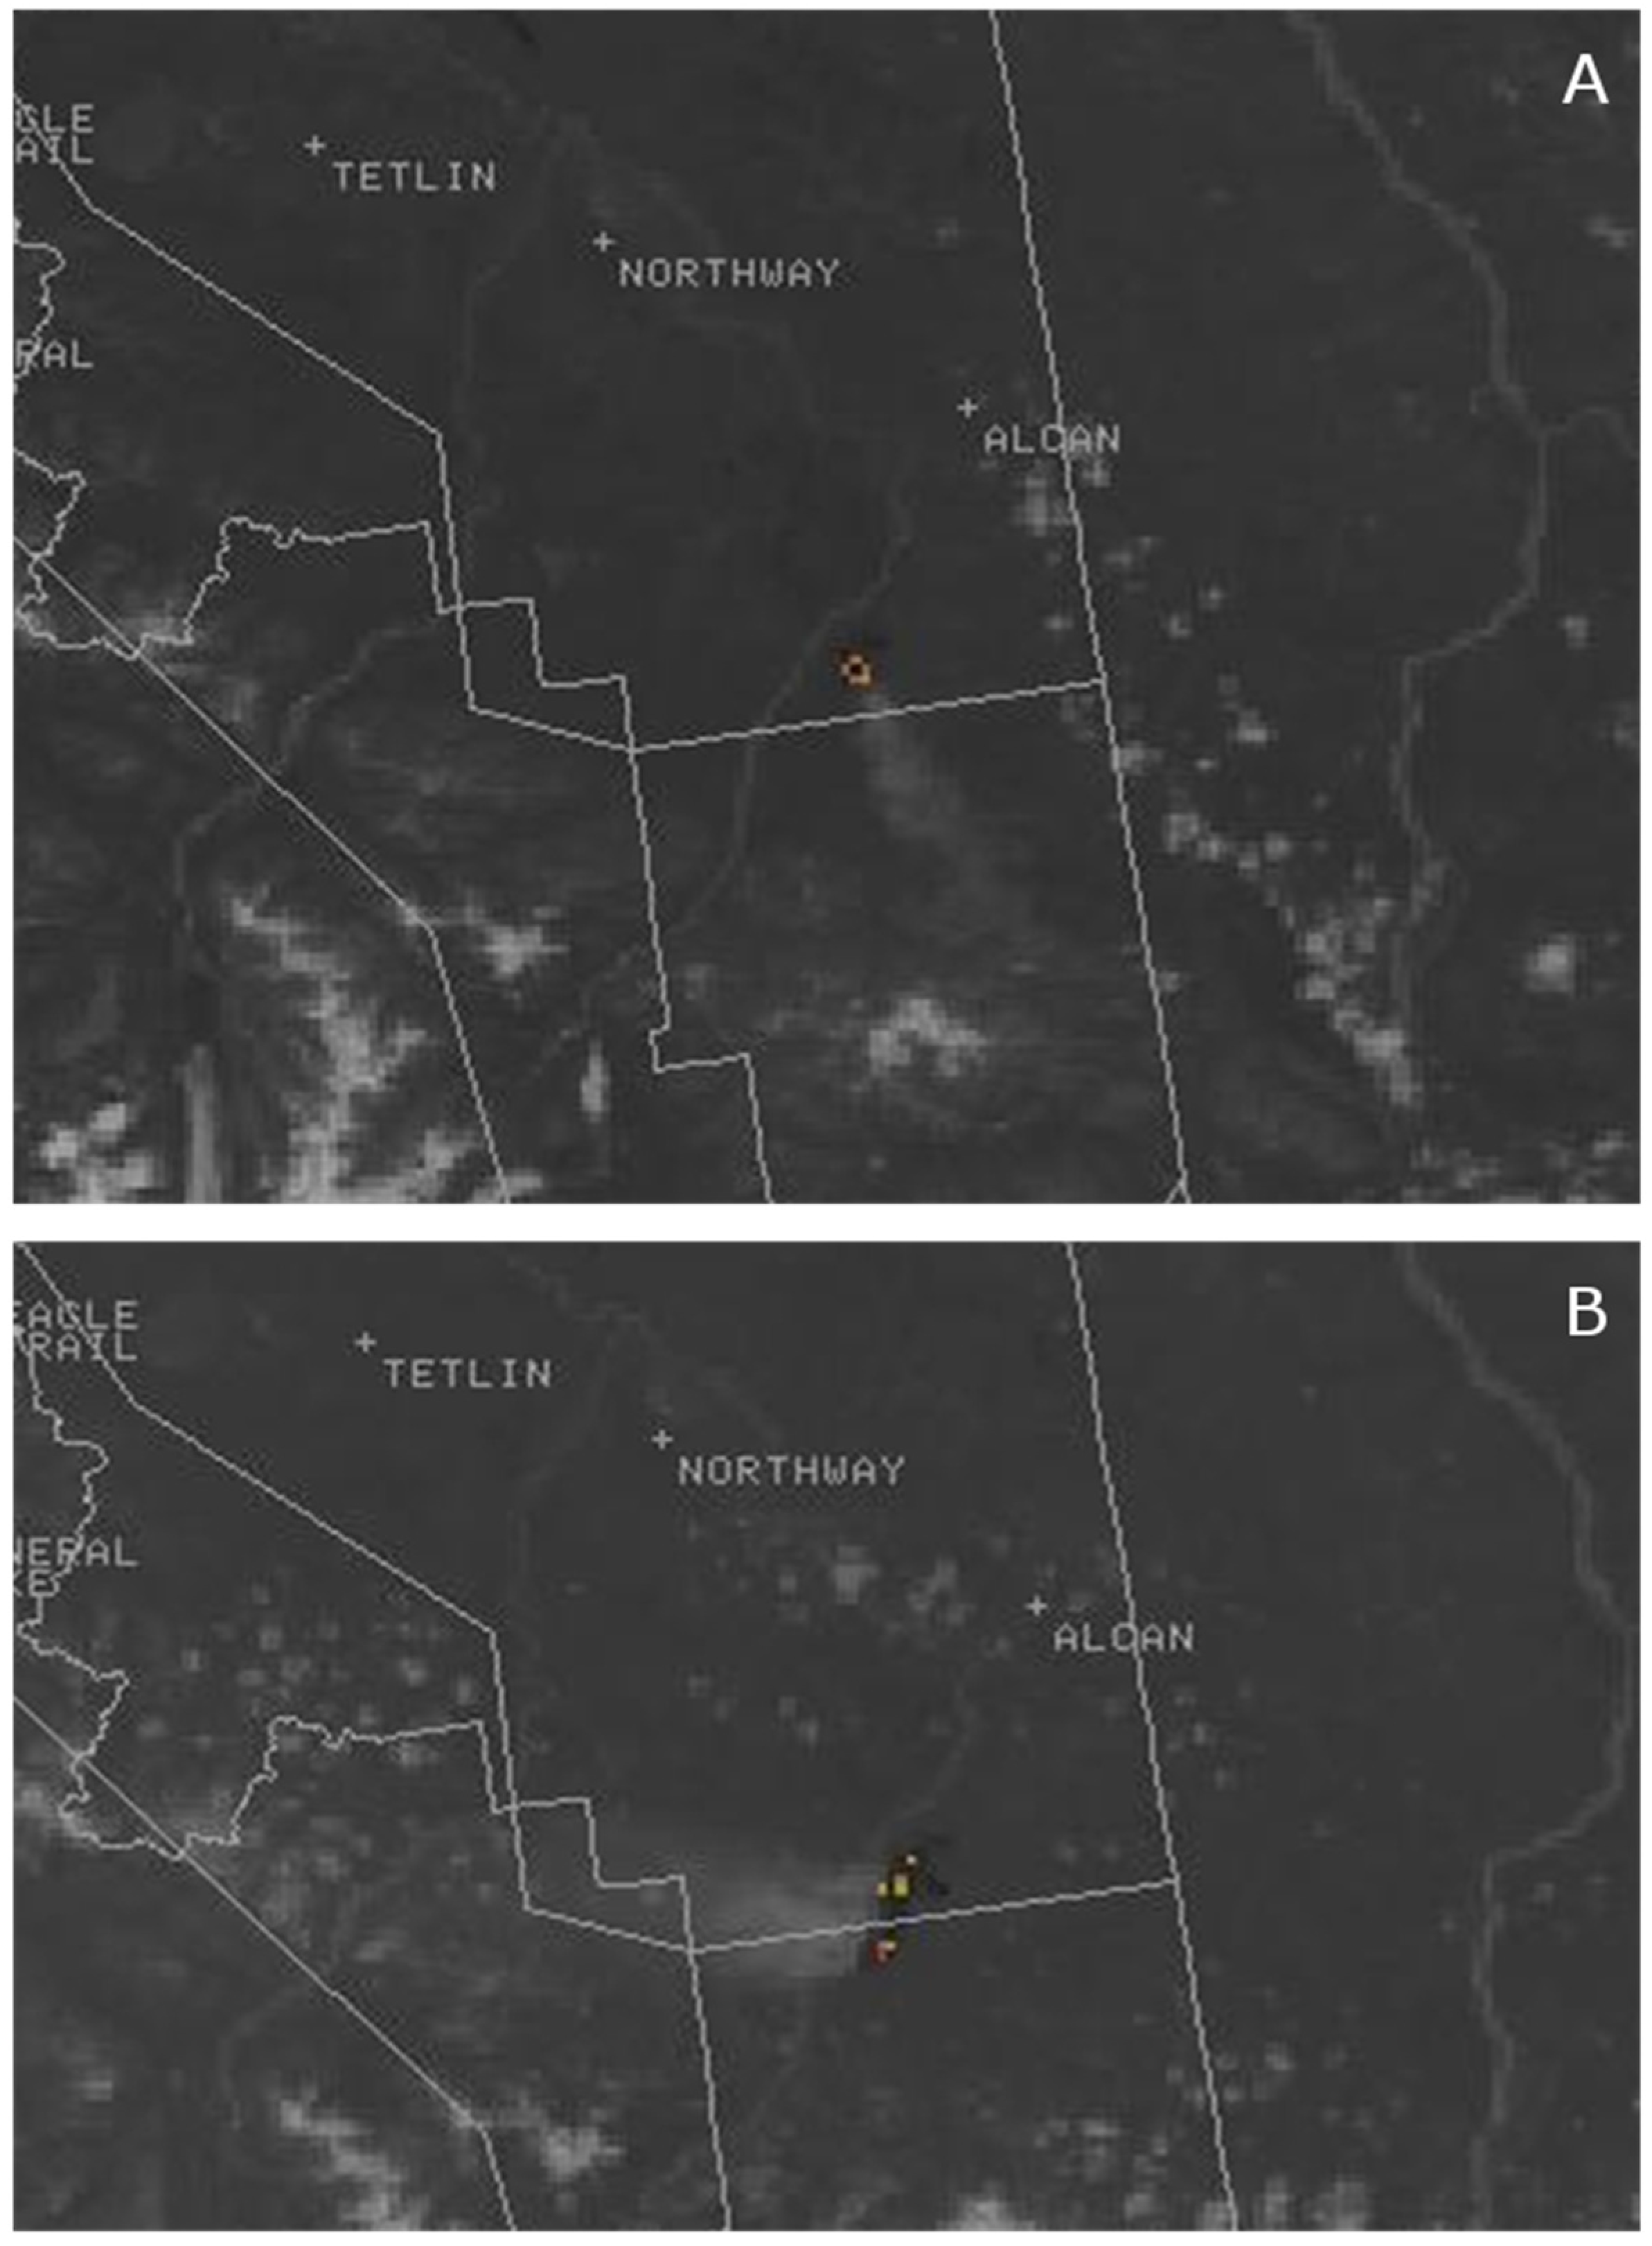
The VIIRS imagery with the I4 (3.74 µm) and I1 (0.64 µm) band is extremely beneficial to NWS forecasters for identifying hotspots and areas of smoke. The I4 brightness temperatures allow for the identification of the fire “hotspots”, with the I1 visible band overlaid identifying the smoke plumes. The combination of these two products as in
Figure 8 is heavily utilized during the Alaska fire weather season from late June through August. The 2015 fire season was extreme, and a record number of acres were burned. The area burned, 5.148 million acres (20.8 km
2), puts the season in second place (out of 66 years) behind the extreme 2004 season. During the active fire season three Incident meteorologists were dispatched to the wildfire complexes in the Fairbanks warning area [
28] and one IMET was dispatched to the office to help with the number of wildfire spot forecasts (909 Fire Weather Spot forecasts were issued for the 2015 Fire weather season).
Figure 8.
(A) The VIIRS I4 (3.74 µm) band brightness temperature and I1 (0.64 µm) band visible satellite imagery overlaid at 2211 UTC on 17 June 2013 in which you can see the smoke plume moving towards the southeast and a fire “hotspot” from the Chisana River, Eagle Creek, and Bruin Creek wildfires; (B) Image from 18 June at 2013 UTC after the winds shifted from the northwest to the southeast and moved the smoke plume.
With the active fire weather period, it was also important not only to identify these hot spots but also to inform the public on smoke hazards. The NWS Fairbanks WFO typically informs the public via social media, as in
Figure 9 for 6 July 2015 regarding the Aggie Creek wildfire located northwest of Fairbanks. The reports show (top) the pyrocumulus images from the Aggie Creek fire, and (bottom) a side-by-side comparison of the VIIRS false-color imagery at 2312 UTC with the radar reflectivity image from the Pedro Dome (PAPD) radar on 6 July 2015. In this case the VIIRS Imagery supports the radar, webcam, and other fire-related information, adding to the validity of the information presented to the public, which benefits from analyses such as this one compiled from multiple sources by NWS forecasters.
Figure 9.
Two social media reports from 6 July 2015 about the Aggie Creek fire located northwest of Fairbanks: (a) as seen from the NWS Fairbanks office on the University of Fairbanks campus; (b) the VIIRS False-Color satellite imagery at 2312 UTC and the radar reflectivity image from the Pedro Dome radar are shown side by side.
5.1.7. Sea Ice
The determination of the sea ice state is important in Alaska in all seasons. VIIRS Imagery, when cloud-free, can provide a good view of sea ice, which is valuable input for a sea ice analysis. These ice analyses are particularly valuable when lives and properly are at stake, such as in the following example when VIIRS imagery allowed the NWS to help the US Coast Guard (USCG) rescue a mariner in need.
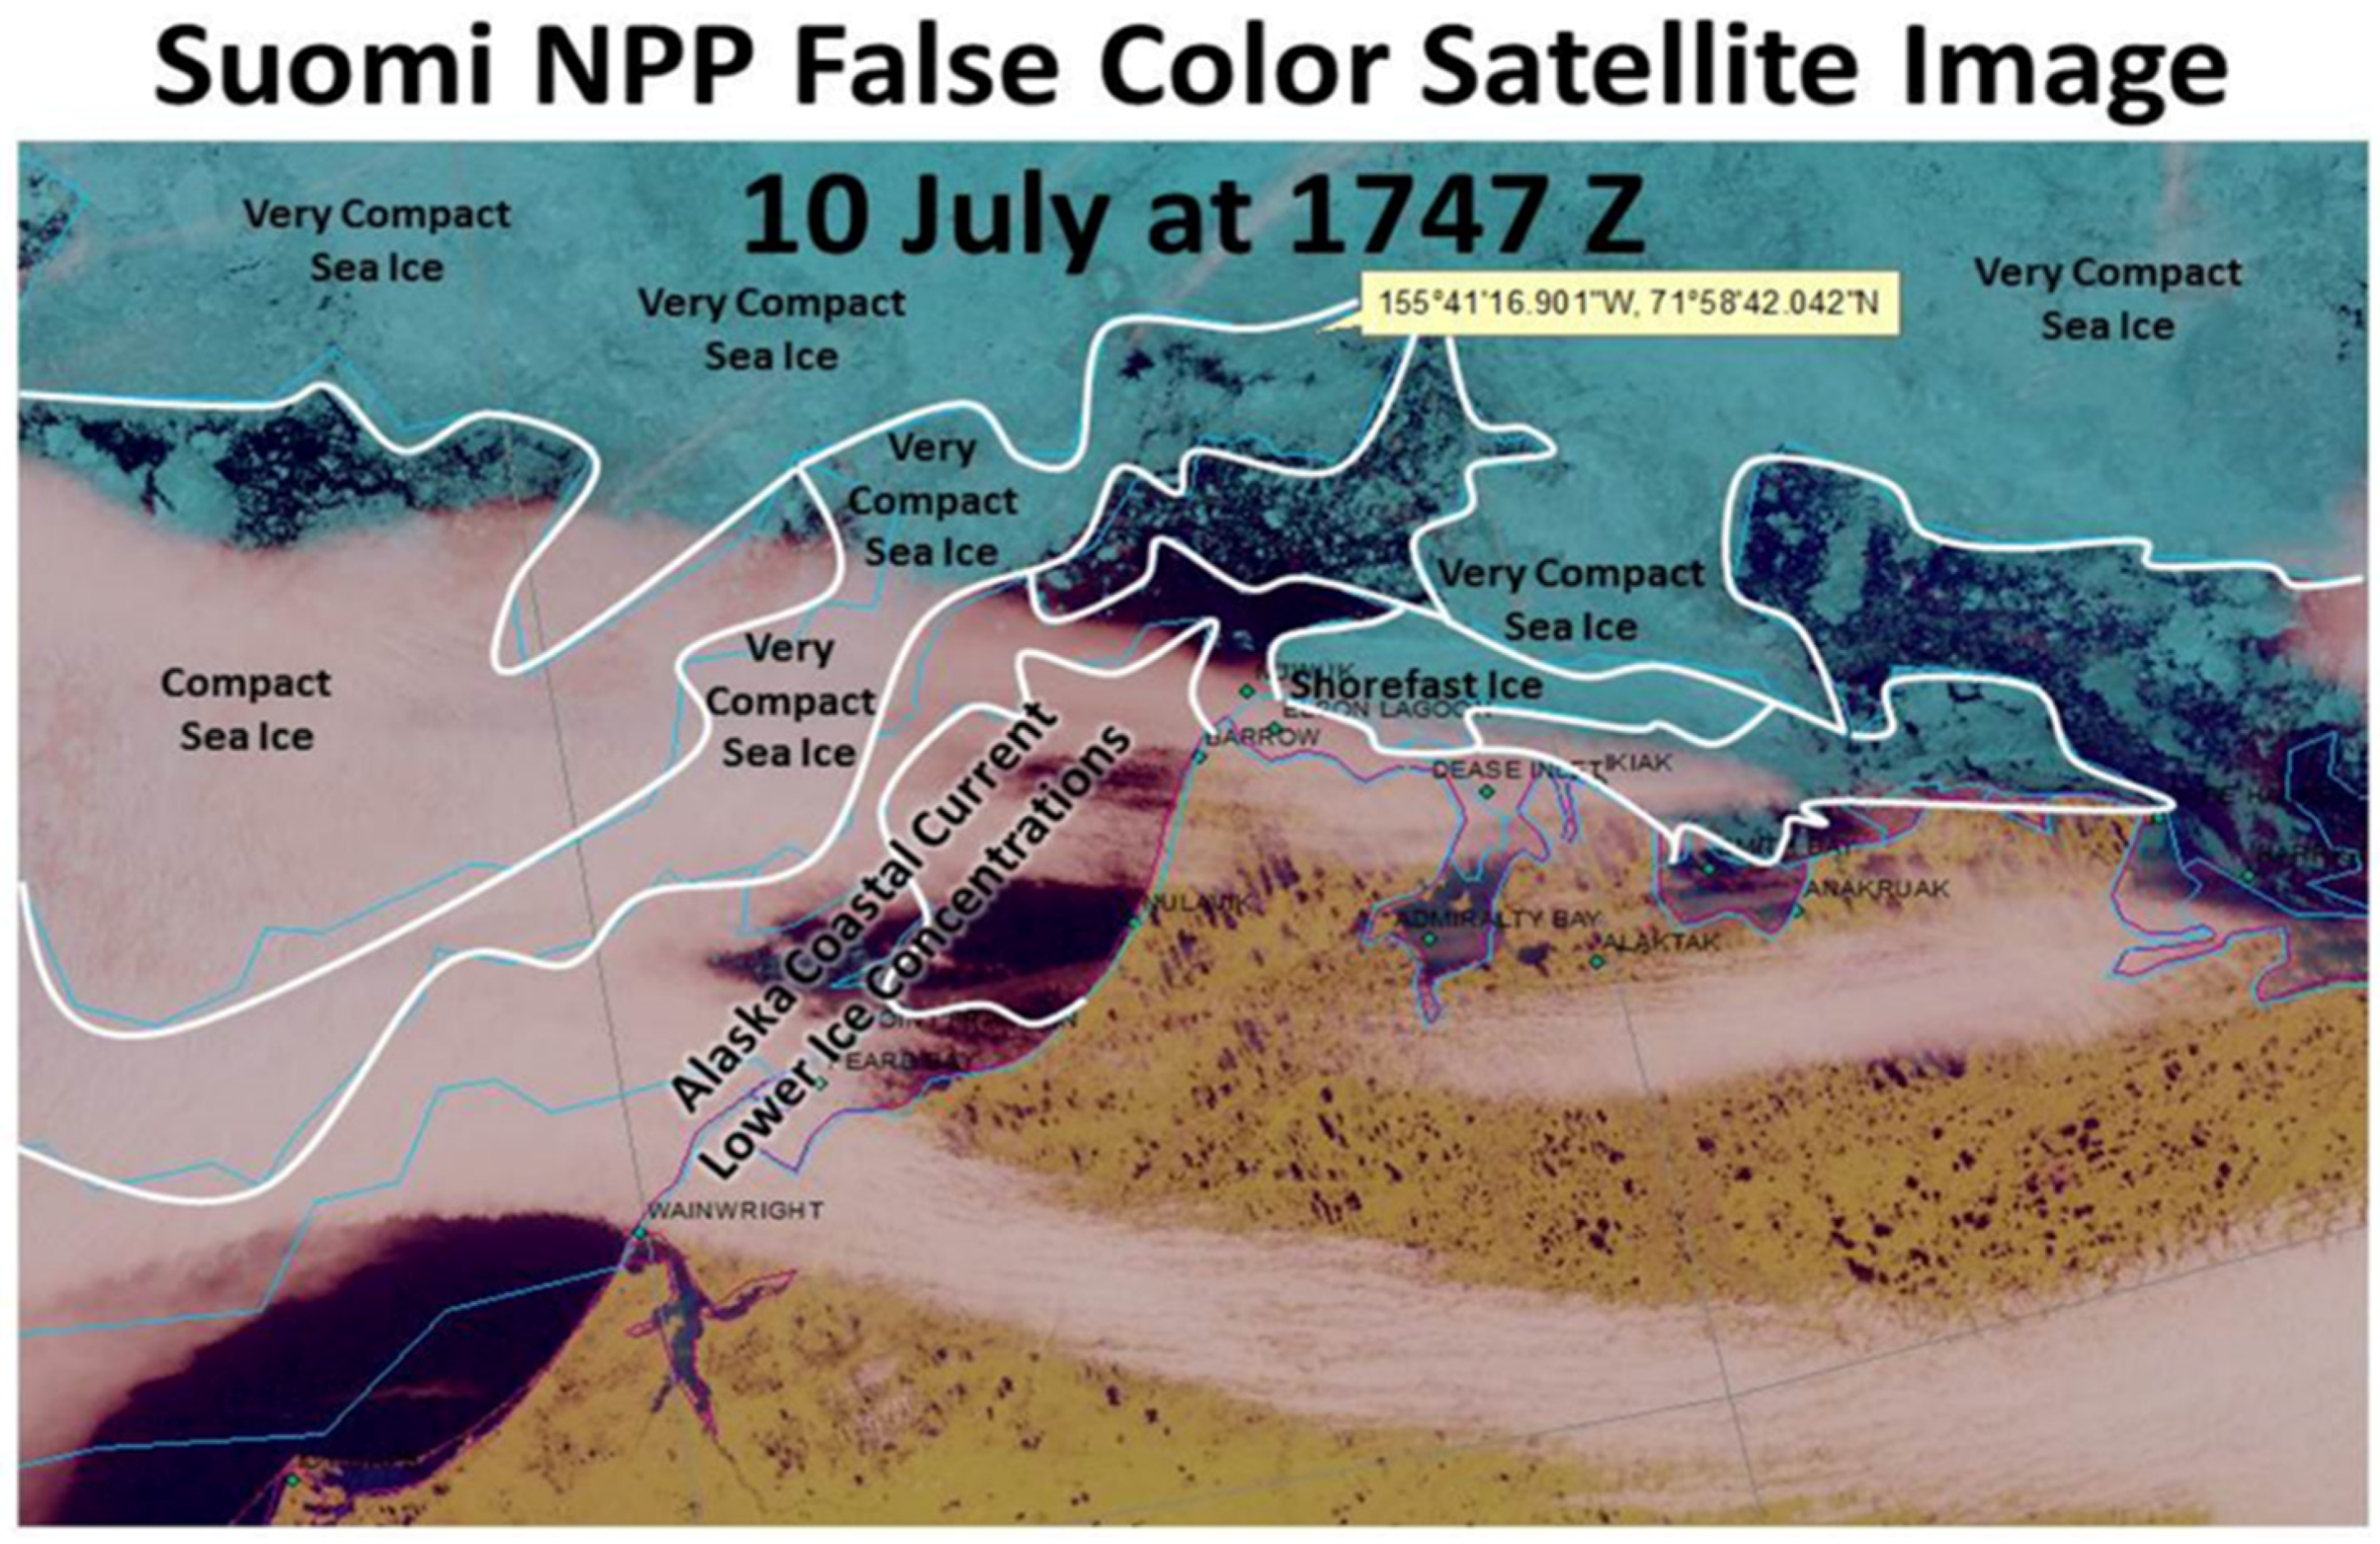
On 10 July 2014 the USCG was called upon to rescue a solo mariner in a small boat attempting to sail the Northwest Passage. The mariner had become stuck in the pack ice north of Barrow, Alaska, and the USCG coordinated with the NWS Ice Program based in Anchorage, Alaska. The NWS used multi-spectral VIIRS imagery, to analyze the sea ice in the area of concern and provide the USGC guidance regarding the best path to approach the mariner. The annotated VIIRS-based sea ice analysis for this case is shown in
Figure 10. As a result, the Coast Guard successfully rescued the stranded sailor [
29].
Figure 10.
Annotated VIIRS RGB composite image from the NWS Ice Program in Anchorage AK, including the position of the boat stranded in the ice. (Image courtesy of Mary-Beth Schreck.)
Figure 10.
Annotated VIIRS RGB composite image from the NWS Ice Program in Anchorage AK, including the position of the boat stranded in the ice. (Image courtesy of Mary-Beth Schreck.)
5.2. Examples Outside of Alaska
Because S-NPP is a polar-orbiting satellite with worldwide coverage every 12 h, there are many opportunities for the use of VIIRS Imagery around the world, not just in the polar regions that specifically define VIIRS as a KPP.
5.2.1. Tropical Storm Centering at Night
It has become common practice at the Joint Typhoon Warning Center to consult an RGB composite image product that combines the VIIRS DNB with the I5 (11.45 µm) band during analysis of tropical cyclones. This imagery, made available by Naval Research Laboratory in Monterey CA (NRL-MRY) via the Automated Tropical Cyclone Forecasting System (ATCF) and the NRL Tropical Cyclone Webpage [
30], has proven useful for distinguishing between high and low clouds in subjective analysis. Additionally, this band combination can allow analysts to discern situations where low cloud can be seen through optically-thin high cloud. RGB composite images have aided analysts in improving their estimates of storm center on multiple occasions.
To create the RGB composite image, the DNB lunar reflectance (following the model of Miller and Turner [
31], or via NCC pseudo-albedo following Liang
et al. [
6]) is assigned to the red and green components, and inverted I5 band brightness temperatures are assigned to the blue component. This results in a false-color image product where: open ocean and optically-thin low cloud appear black; optically-thick low cloud appears yellow; optically-thin high cloud appears blue; optically-thick high cloud appears white; and optically-thin high cloud overlaying optically-thick low cloud also appears white, but can often be discerned from optically-thick high cloud by context.
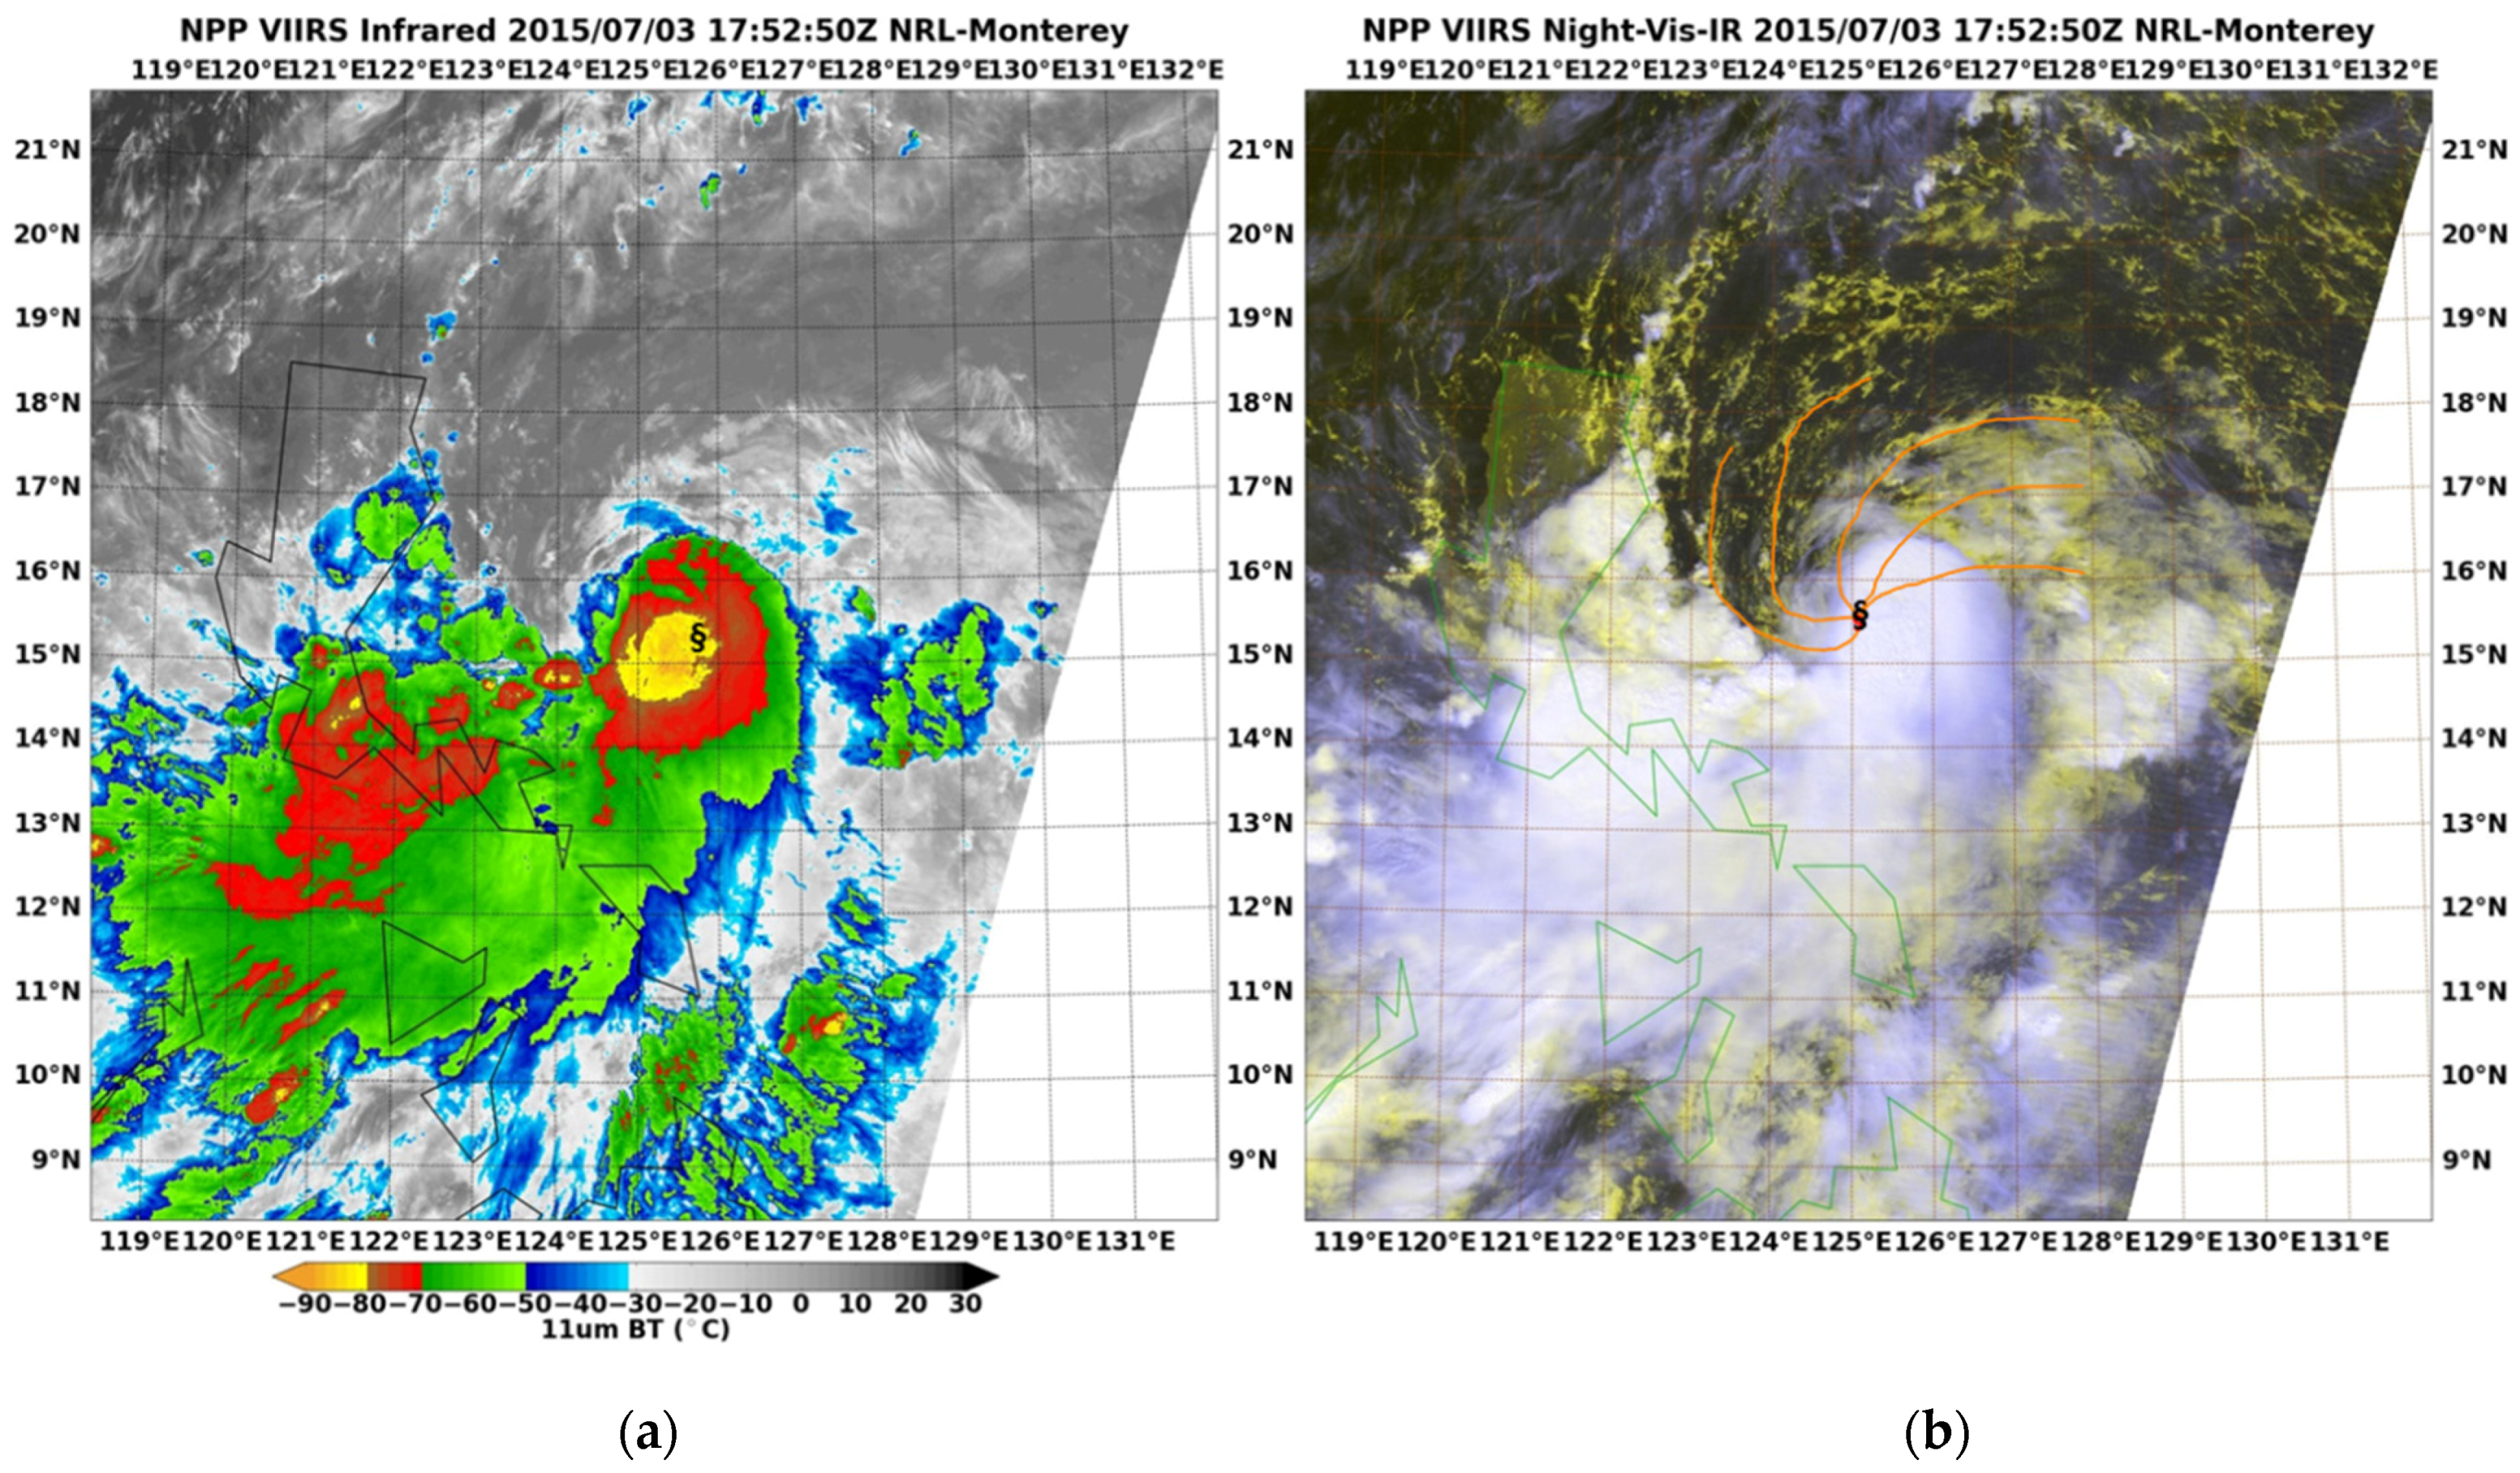
In cases of extremely sheared storms, the RGB composite image can enable an analyst to observe the exposed low-altitude circulation center; however, even in less sheared cases, the imagery can provide useful information about the low-level circulation. An example of this is shown in
Figure 11 where the left-hand panel shows I5 band brightness temperatures and the right-hand panel shows an RGB composed of the DNB and I5 band brightness temperatures. Both images depict Typhoon Linfa on 3 June 2015 at 1752 UTC. The I5 band image provides information about the storm’s convective tops, but provides little information about the low-altitude circulations. Based solely on this I5 band image, analysts at the Joint Typhoon Warning Center (JTWC) would likely have determined that the storm center was at the center of the convective region (marked with a §).
Figure 11.
VIIRS (a) I5 (11.45 µm) band brightness temperature and (b) RGB composite imagery of Typhoon Linfa from 3 July 2015 at 1752 UTC. The RGB composite is composed of the DNB in the red and green bands and inverted I5 brightness temperatures in the blue. The RGB composite was used by Joint Typhoon Warning Center (JTWC) analysts to correctly determine the center of the typhoon by tracing the low-altitude cloud lines (orange) to the center of circulation.
The RGB composite image product provides a significant amount of additional information. The imagery allows analysts to readily discriminate low altitude patterns from high altitude patterns. JTWC stated that “without the VIIRS DNB image, the TC position would have been derived from IR only, which would have placed the center further southeast about 20 miles (30 km) with the assistance of the VIIRS DNB image, the forecaster correctly placed the best track position, which in turn improved model initialization and subsequent forecast accuracy.”
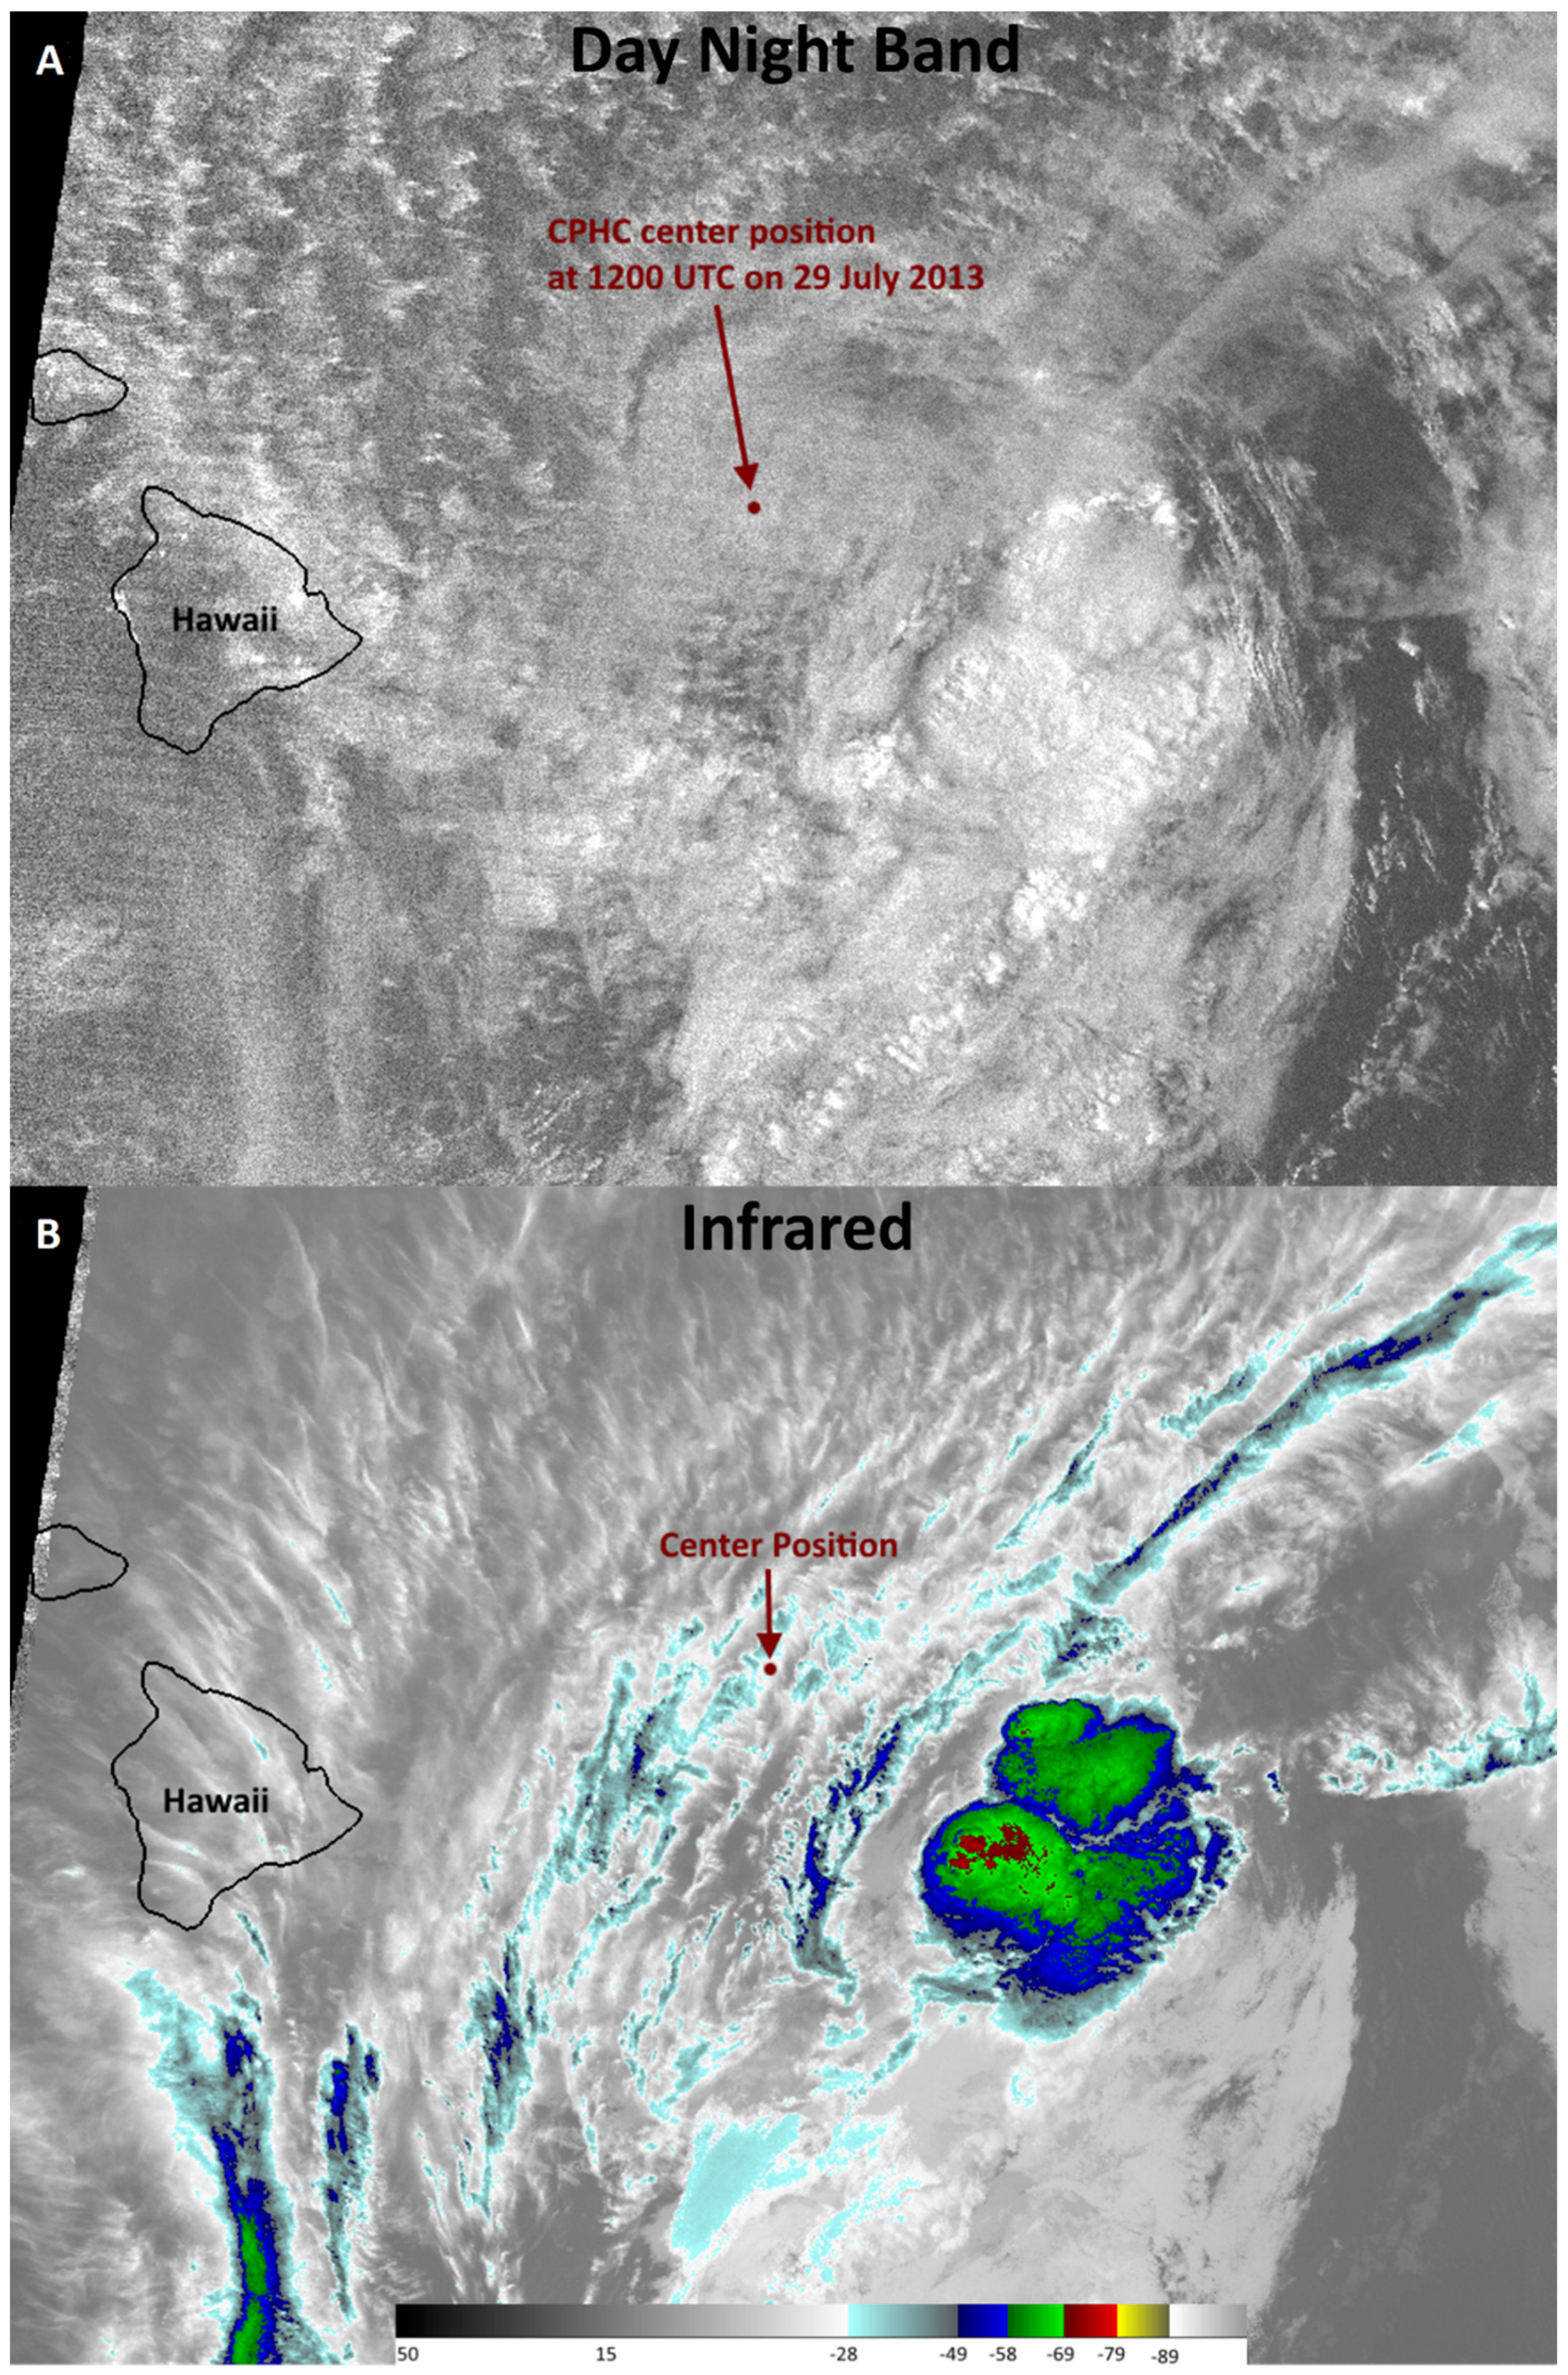
In another example, the VIIRS DNB proved useful for identifying low cloud features in the presence of higher overriding cirrus clouds. The event occurred east of Hawaii on 29 July 2013. Tropical Storm Flossie was east of the Big Island of Hawaii, moving generally to the west-northwest. The Central Pacific Hurricane Center (CPHC) faced the challenge of issuing guidance on possible landfall over the nighttime hours when infrared data gave misleading information on the circulation center. After appealing to DNB imagery, the CPHC issued the following statement (with yellow highlighting noting the use of VIIRS nighttime visible imagery): “The center of Flossie was hidden by high clouds most of the night before VIIRS nighttime visual satellite imagery revealed an exposed low level circulation center farther north than expected. We re-bested the 0600 UTC position based on the visible data” [
32].
Figure 12A shows the VIIRS DNB image at 1103 UTC that was being referred to, and
Figure 12B shows the corresponding I5 (11.45 μm) infrared image. High cirrus clouds with brightness temperatures around −30 °C can be seen in the infrared image to the northwest of the deepest convection, but in the DNB some low clouds can be seen underneath. CPHC inferred the center of circulation based on the spiral structure of these low level clouds, and their 1200 UTC analysis of the center location is denoted in the figure with a maroon dot. First-light daytime visible imagery from GOES-W confirmed the DNB moonlight-based guidance. The infrared imagery alone would not have been useful in locating the center.
Figure 12.
VIIRS (A) DNB and (B) I5 (11.45 µm) image showing Tropical Storm Flossie east of Hawaii on 29 July 2013 at 1103 UTC. The analyzed position by the Central Pacific Hurricane Center of the center of the storm at 1200 UTC is denoted by a maroon dot in both images. The units of brightness temperature in (b) are degrees C. Striping in the DNB becomes more apparent as the signal level decreases under lowlight illumination.
5.2.2. Puerto Rico Dust from Saharan Air Layer
During the spring through autumn months, the greater Caribbean region is susceptible to major dust outbreaks due to passages of dust-laden Saharan Air Layer (SAL) that can significantly degrade air quality and suppress local convection. SAL occurrence increases the potential for massive wildfire outbreaks throughout Puerto Rico and the surrounding West Indies. Additionally, the public in the greater Caribbean region suffers some of the world’s highest rates of asthma, which has been postulated by health officials to be attributable to long-term exposure to high dust concentrations and the bio-chemical content of this dust [
33,
34,
35]. The NWS in San Juan, Puerto Rico (NWS-PR) is responsible for issuing hazardous warning alerts to other agencies and the public. The resources available to the NWS-PR are limited with respect to making accurate and effective assessment and predictions of SAL events.
S-NPP VIIRS products are actively being used by the NWS-PR in monitoring the SAL via the NexSat website [
36] from NRL-MRY. Through a wealth of remote sensing datasets and image products, in-situ observations, and an operational global dust model, NRL-MRY provides NWS-PR with enhanced capabilities to detect, assess, and predict SAL events as they propagate across the forecast area of responsibility (AOR). Included among the suite of products provided to NWS-PR through NRL-MRY’s NexSat website are products derived from the S-NPP VIIRS sensor. These products include visible, infrared, true-color, dust, Aerosol Optical Depth (AOD), and DNB imagery.
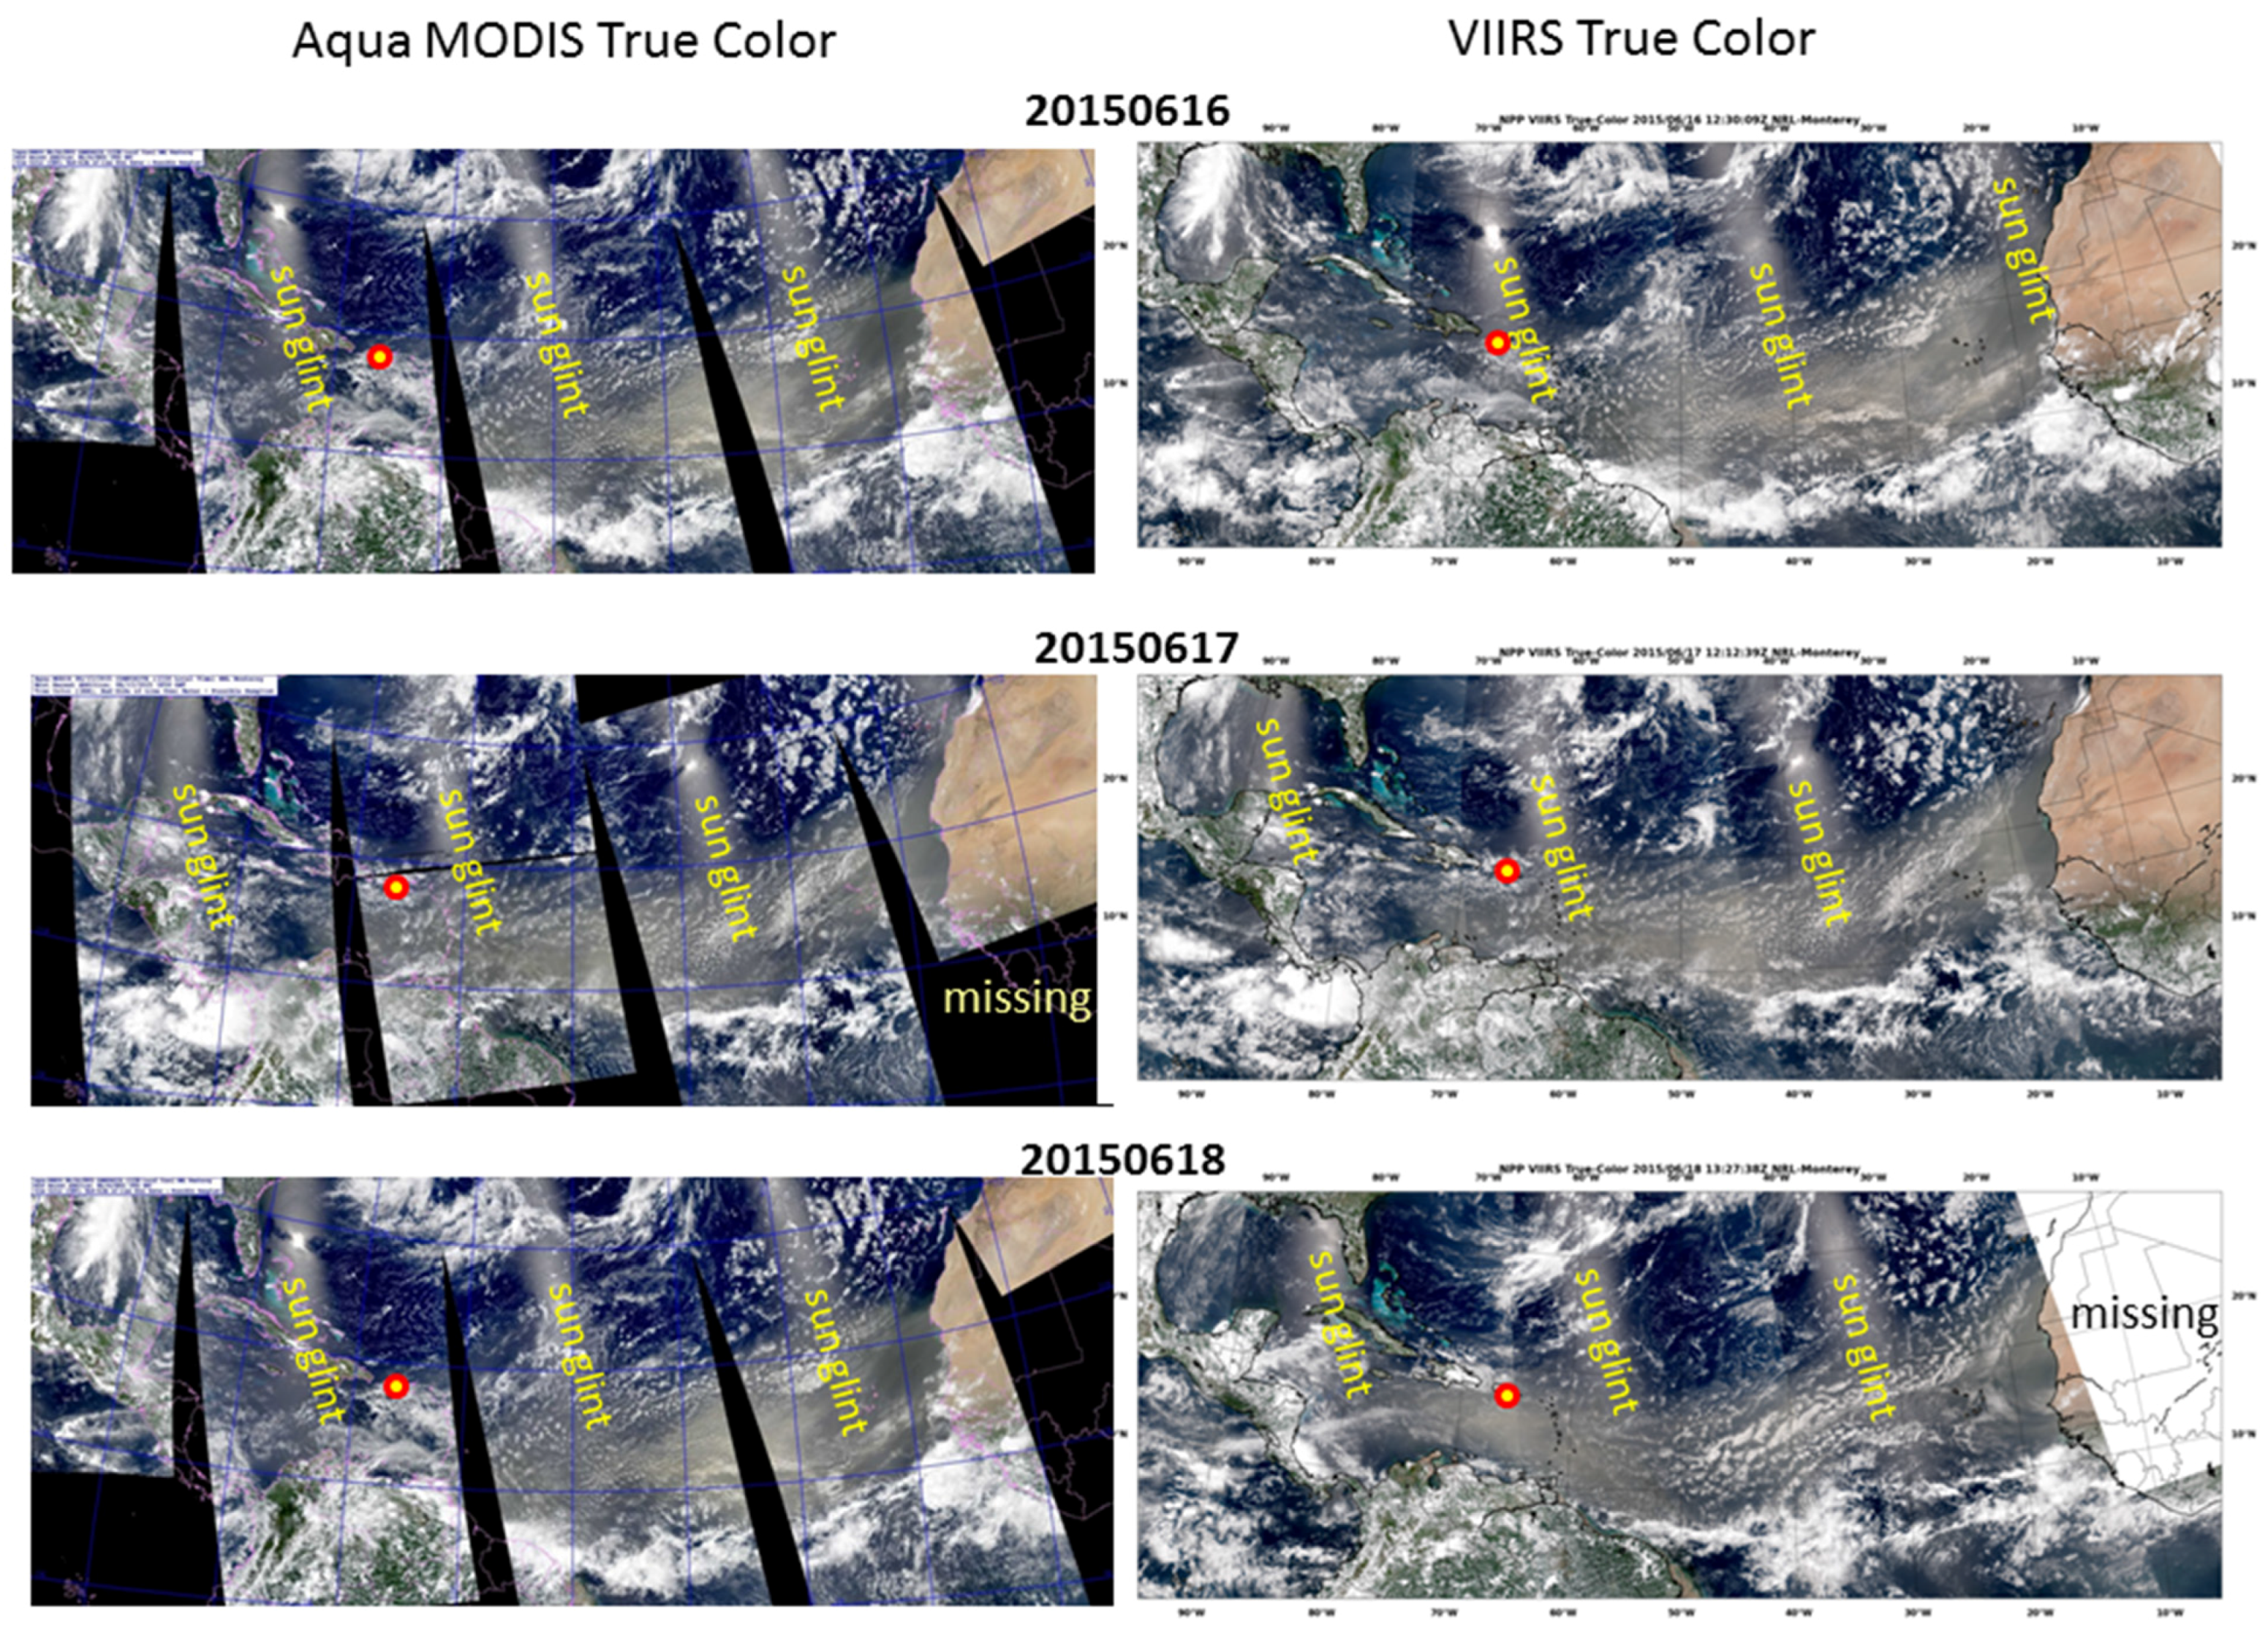
Figure 13.
Comparison of Aqua MODIS (left panels) vs. S-NPP VIIRS (right panels) true-color image products while monitoring a SAL event across the north tropical Atlantic basin during 16–18 June 2015. The increased swath within VIIRS reduces the “guesswork” in tracking dust. Sun glint regions indicate enhanced levels of reflection from the ocean surface.
During the May–July 2015 timeframe, an almost continuous stream of strong African dust events propagated across the north tropical Atlantic basin, eventually impacting the greater Caribbean region. These events produced high counts of particulate matter (PM
2.5 and PM
10), high AOD values, and a rash of wildfires due to dry subsiding air, particularly within the forested regions of Puerto Rico.
Figure 13 compares true-color imagery from Aqua MODIS and S-NPP VIIRS at the height of a SAL event that occurred during the period of 16–18 June 2015. The wider swath width and increased resolution at scan edge allows VIIRS (right-hand column) to provide a more continuous and more easily-analyzed product than MODIS (left-hand column), reducing the “guesswork” in tracking dust across the Atlantic basin.
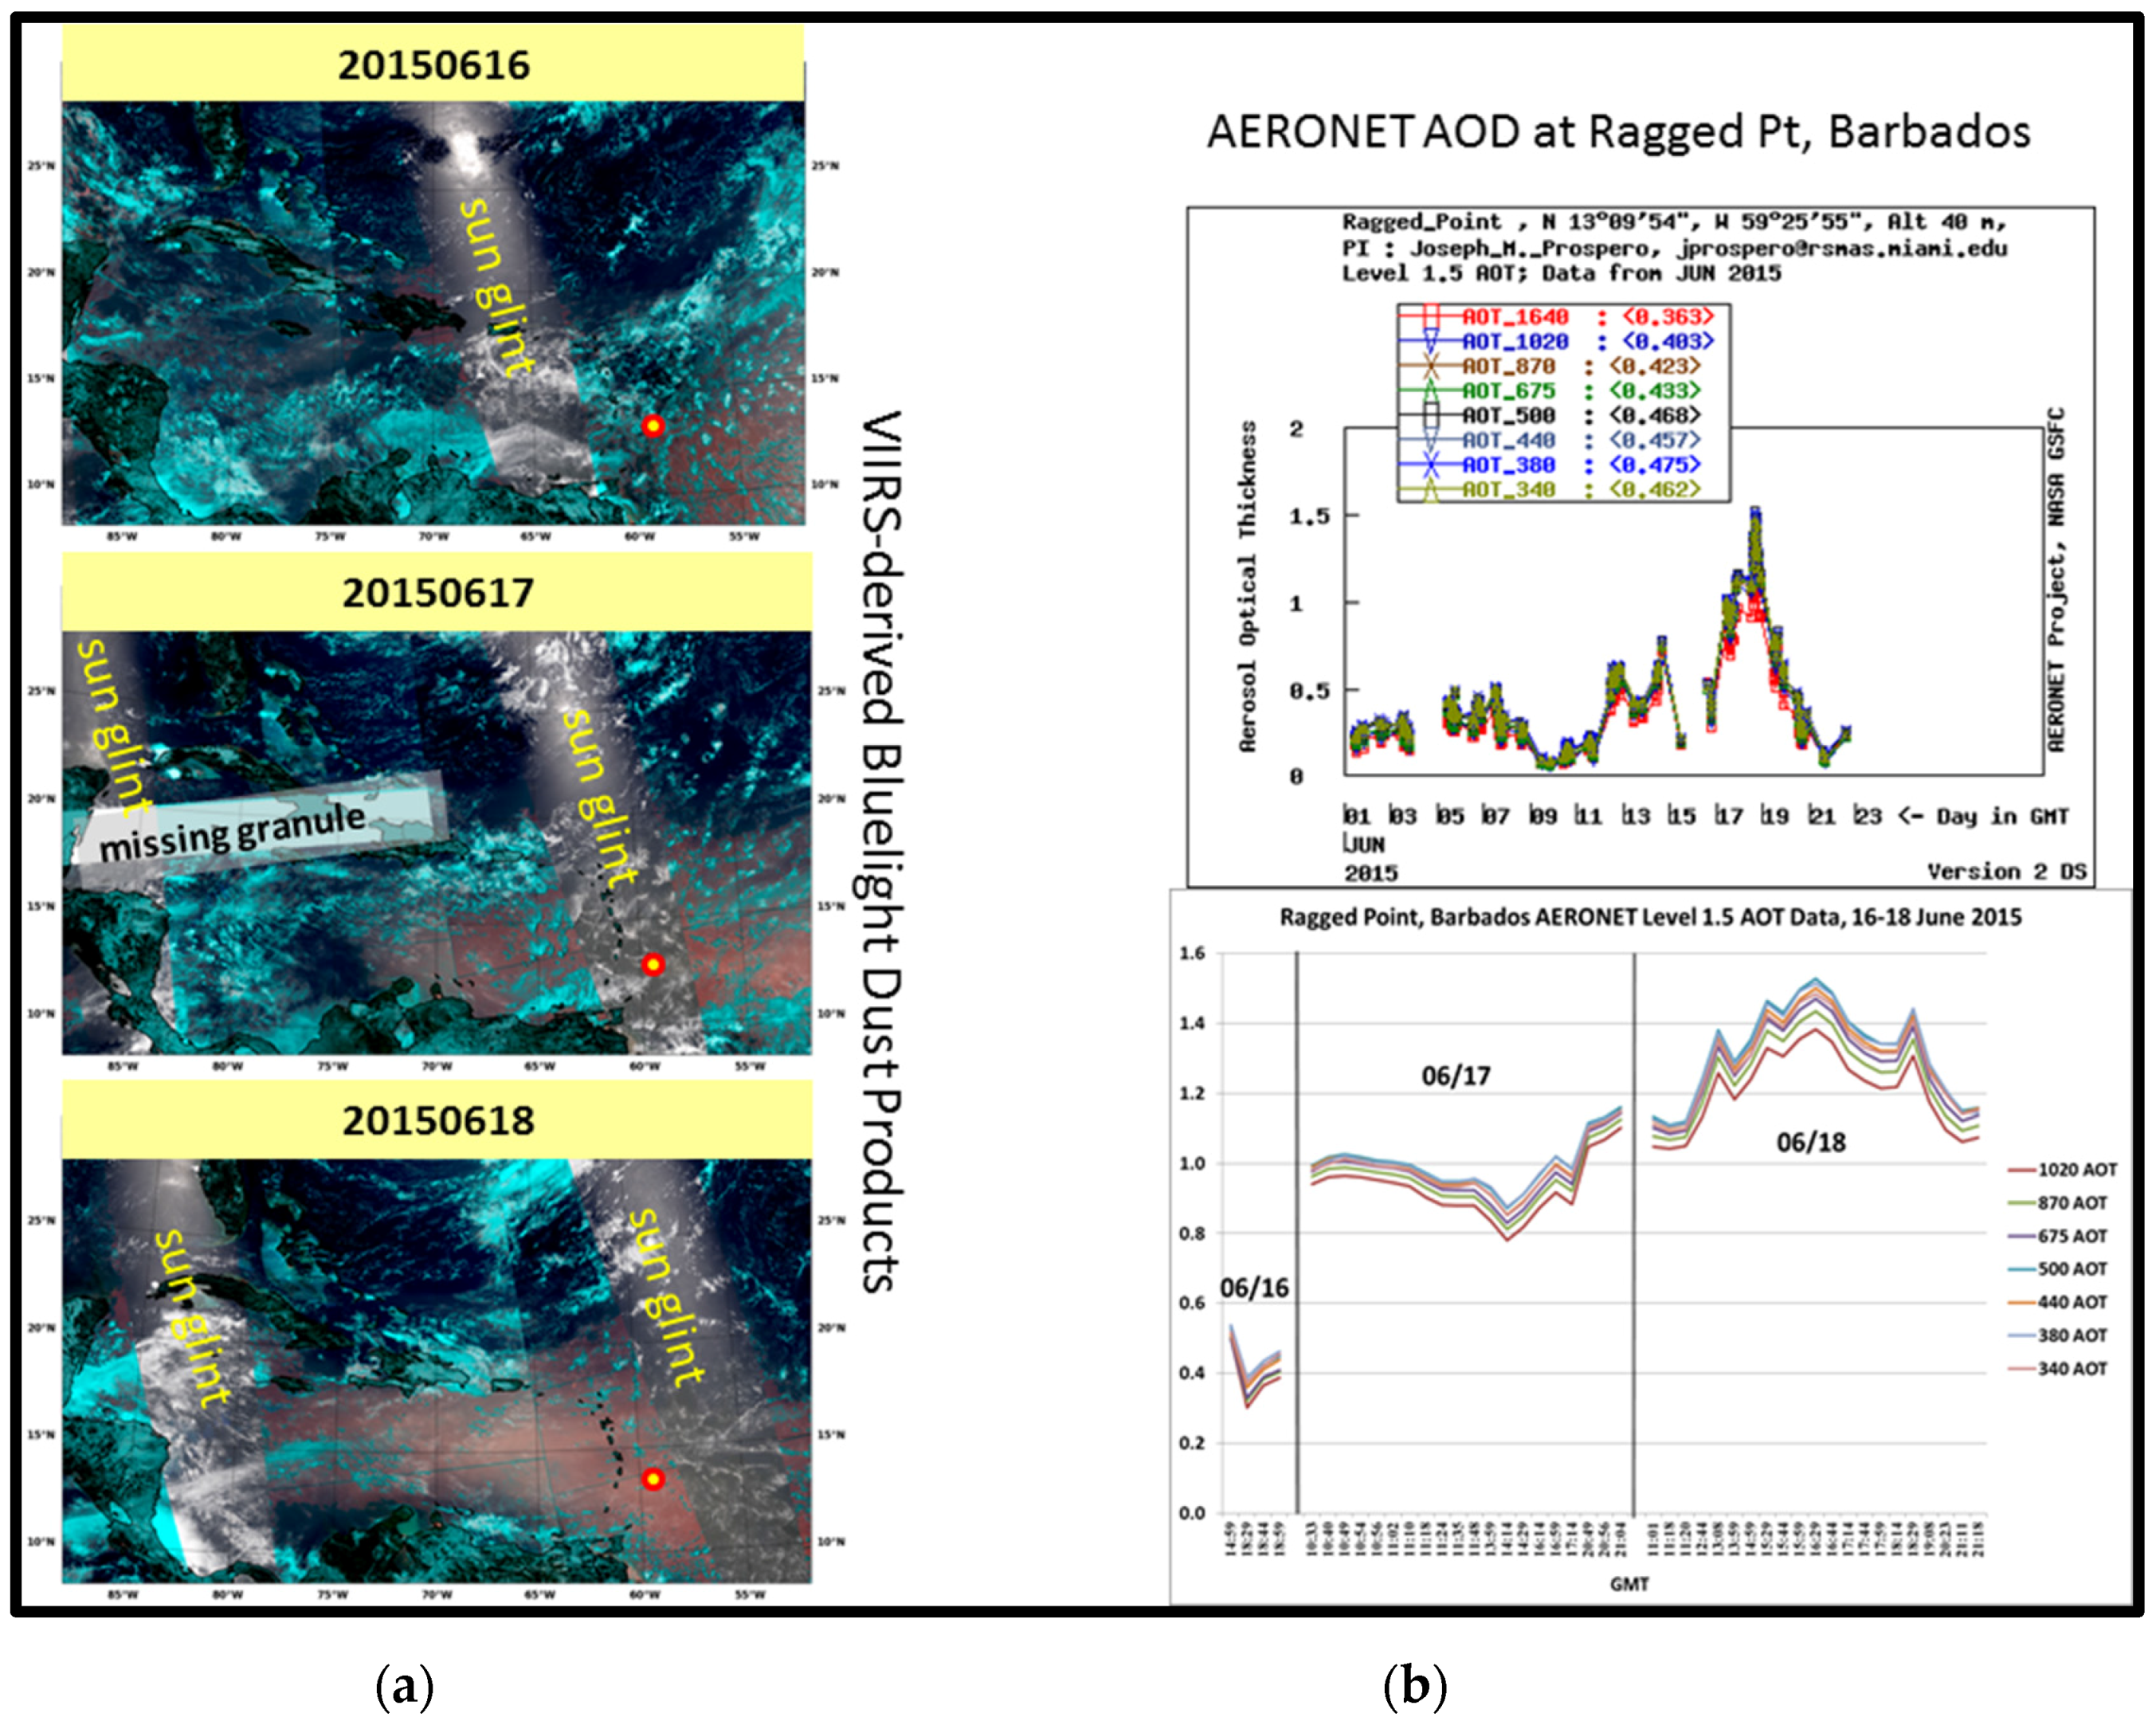
Figure 14 presents VIIRS-derived blue-light dust products [
37] (left-hand column) during the approach of the same SAL-borne dust plume towards Barbados (marked with a red/yellow dot) for the period of 16–18 June. In this imagery, dust appears in shades of pink, while clouds are shown in cyan.
Figure 14.
(a) A series of VIIRS-derived bluelight dust products during 16–18 June 2015 showing the approach and eventual impact of the SAL plume covering the greater Caribbean region. Dust appears in shades of pink, whereas clouds are in shades of cyan. The island of Barbados is annotated in red/yellow circles; (b) AERONET AOD measurements taken at Ragged Point, Barbados. The top-right panel indicates the monthly profile, with a spike during the SAL event (17–19 June). The bottom-right panel highlights the SAL event peaking during 14–17 UTC on 18 June.
Surface-based measurements of AOD indicate that the VIIRS imagery correctly identifies dust for subjective analysis. The plot in the top right of
Figure 14 shows AOD measurements from the Aerosol Robotic Network (AERONET) site at Ragged Point, Barbados over the period from 1–23 June 2015. AOD values spike between the 17th and 19th, indicating the impact of the SAL-borne dust on the region. The figure in the lower right shows the same AOD data, but focusing on the period of 16–18 June, showing that the event peaks between 14 and 17 UTC on 18 June. These observations of elevated AOD values coincide with the approach of the dust plume as observed by VIIRS. In this case, VIIRS was able to provide forecasters with advanced warning of the SAL event and allowed forecasters to disseminate that information to the public.
5.2.3. Blowing Dust in the Great Plains
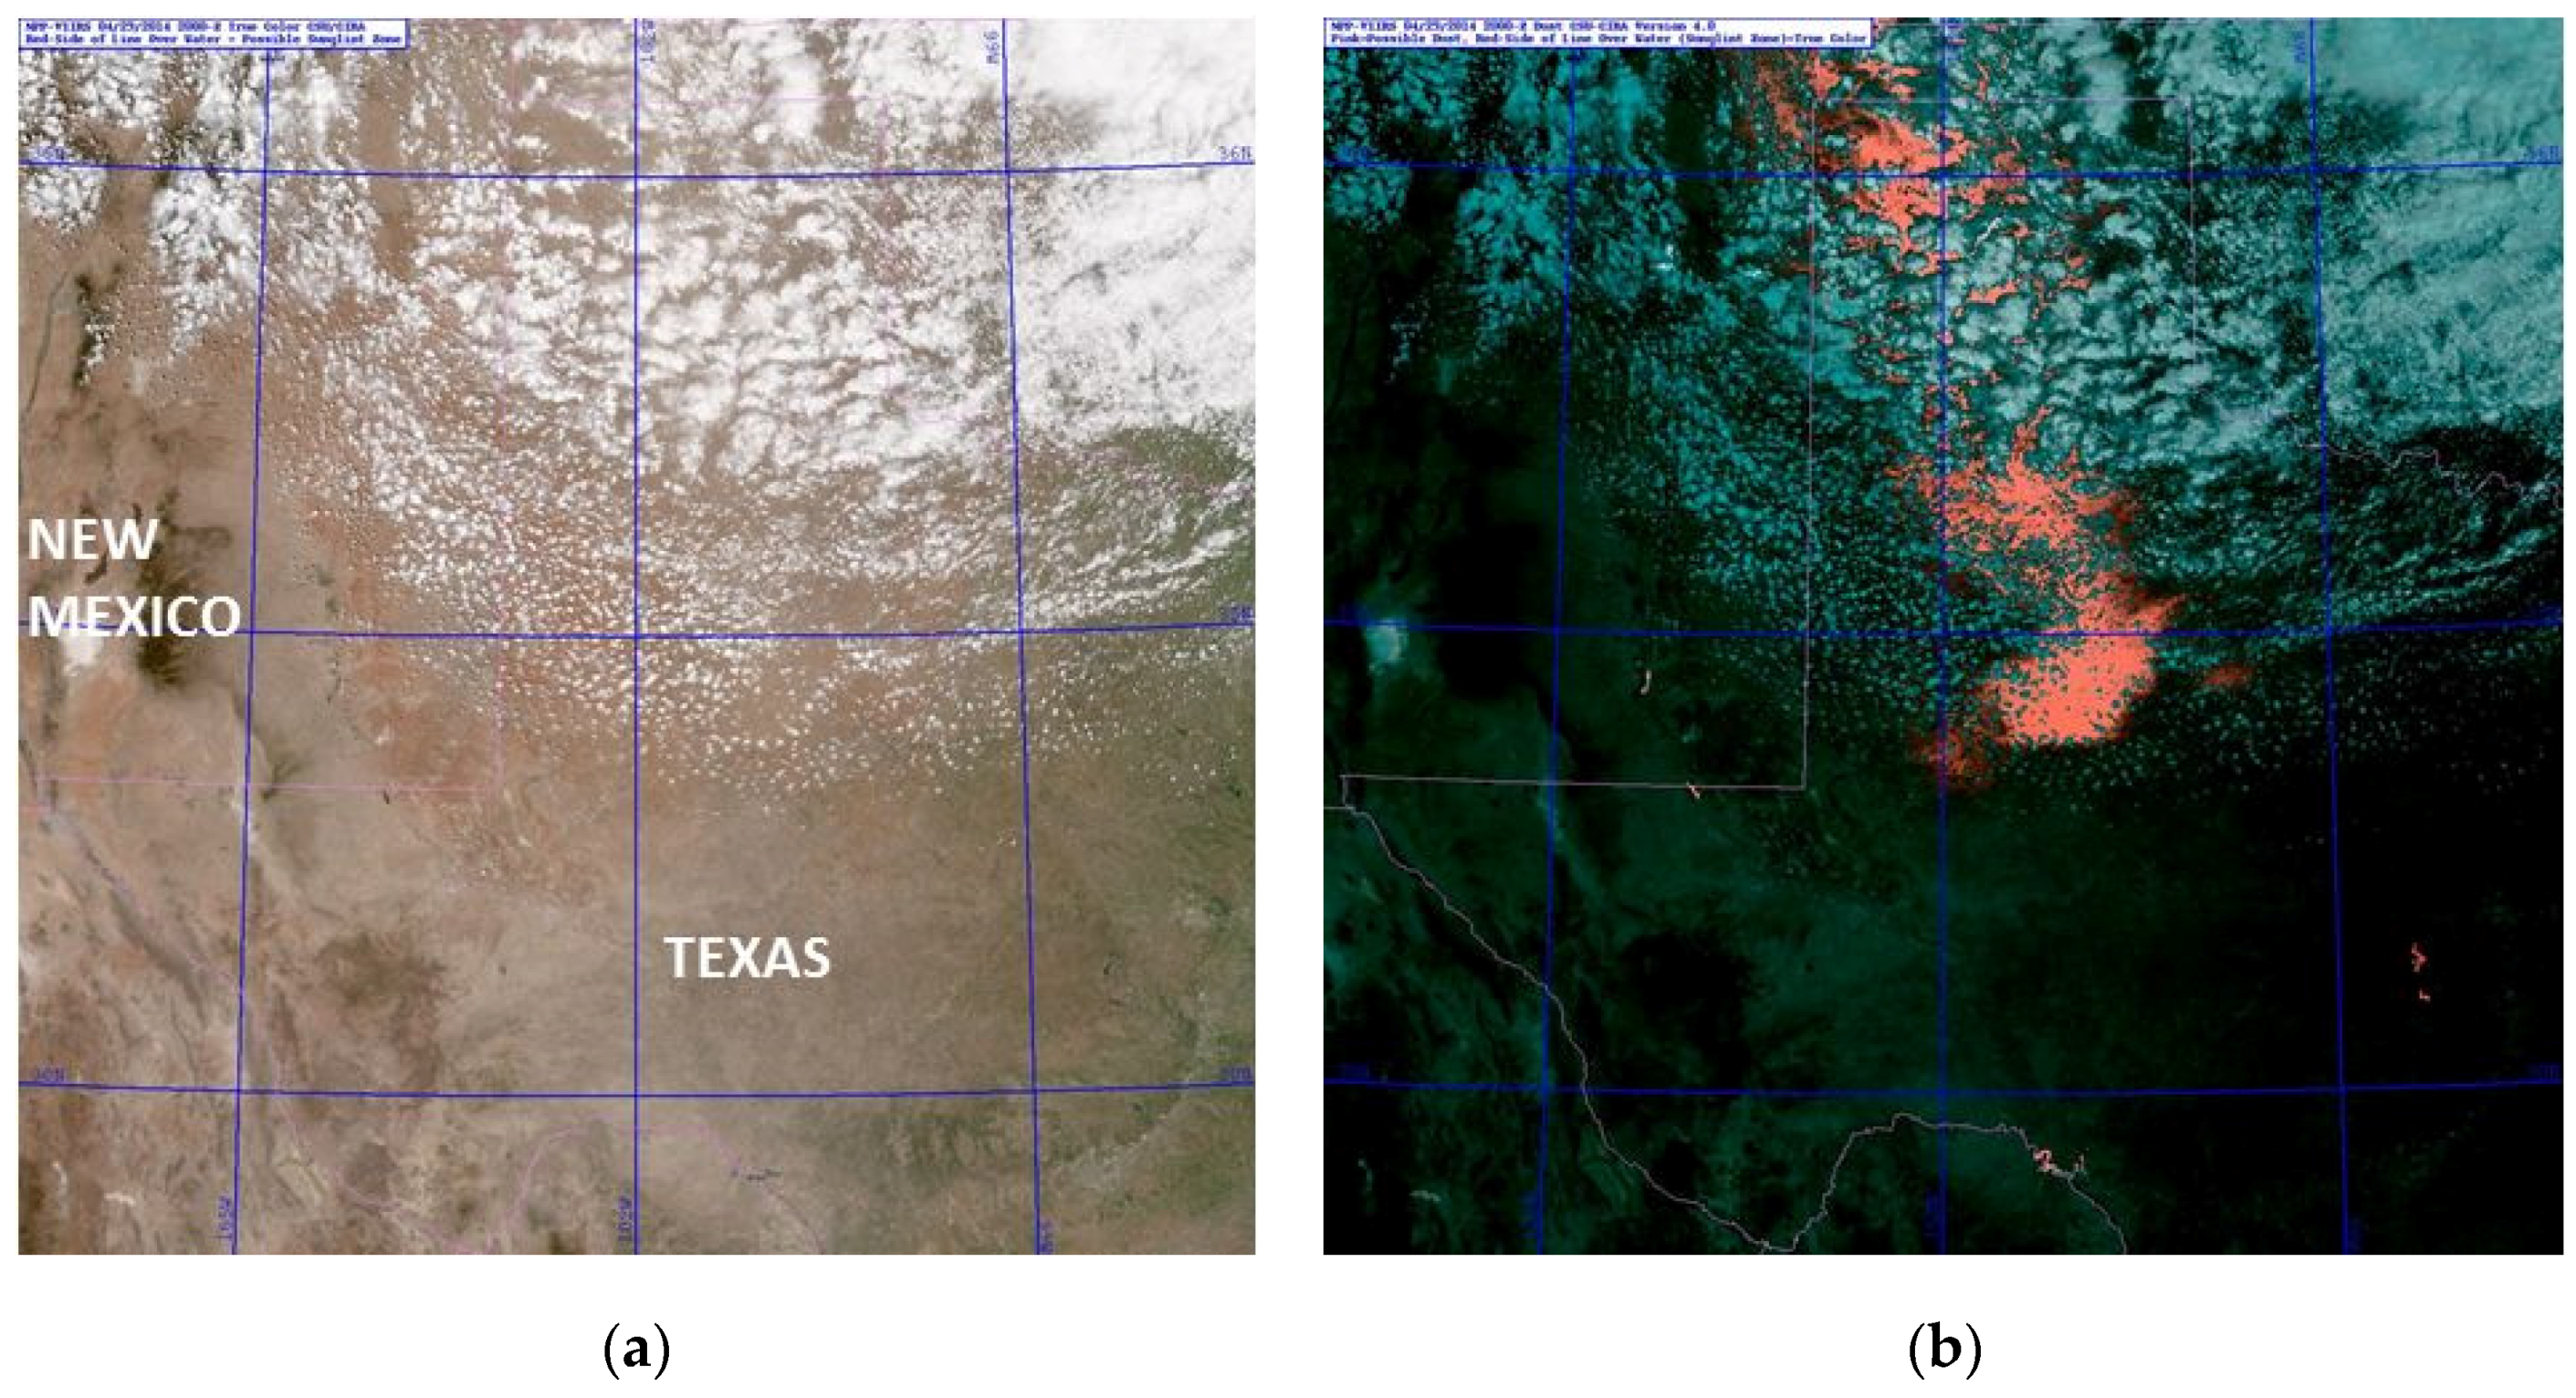
Another use of VIIRS multi-spectral Imagery is exemplified by the 29 April 2014 dust case over the Texas Panhandle. That day ended a three-day-long dust event associated with an intense upper-level system that lumbered across the western and central U.S. The placement and movement of the system kept a very strong jet over western Colorado and the Texas Panhandle, resulting in widespread severe winds gusting from 55 mph (90 km/h) to even greater than 65 mph (105 km/h) at times. Sustained drought over the region provided an ample supply of dust, which was immediately lofted by strong surface winds. Smaller regional airports in the Texas Panhandle reported visibilities at or near zero for the duration of this event. These conditions occurred on three consecutive afternoons from the 27 to the 29 April, and necessitated the issuance of multiple blowing dust SIGMET advisories.
On the afternoon of the 29 April, Aviation Weather Center (AWC) forecasters examined the VIIRS and MODIS dust enhancements as they issued several SIGMETs related to this event.
Figure 15a is a VIIRS true-color image from 2000 UTC. There were no obvious signs of dust in the scene. However, the corresponding dust enhancement (
Figure 15b), based on the multi-spectral algorithm [
37], highlights in pink a large swath of blowing dust crossing into the Texas Panhandle from southwestern Colorado.
Figure 15.
(a) VIIRS true-color imagery for the Texas Panhandle at 2000 UTC on 29 April 2014 with no obvious signs of dust in the scene; (b) VIIRS dust-enhancement imagery at the same time, highlighting the blowing dust in pink below the overlying clouds in cyan.
Figure 15.
(a) VIIRS true-color imagery for the Texas Panhandle at 2000 UTC on 29 April 2014 with no obvious signs of dust in the scene; (b) VIIRS dust-enhancement imagery at the same time, highlighting the blowing dust in pink below the overlying clouds in cyan.
A blowing dust SIGMET was issued at 1700 UTC, valid until 2100 UTC. Because of the limited temporal resolution of polar imagery, this SIGMET was issued without the use of the dust enhancement. However, an extension of this SIGMET was issued just after 2100 UTC after forecasters examined the VIIRS dust enhancement imagery, and it was extended further south and east into central Texas. In this case the dust enhancement proved a very useful situational awareness tool for amending the SIGMET, which will only improve when geostationary assets begin carrying the bands required for implementing this algorithm.
6. Discussion
Although the initial post-launch Cal/Val checkout of VIIRS Imagery is shared between the EDR Imagery Team and the VIIRS SDR Team, many Imagery applications are validated during the intensive Cal/Val period ending with an ‘official’ validation status, signifying that Imagery is ready for use by a wide range of users worldwide. Each step involves users, but not to the extent that users become involved in the post-checkout timeframe. The post-launch checkout is followed by the long-term monitoring phase that continues for the life of VIIRS on each satellite. It is during this stage that users become heavily involved in VIIRS validation. Users are sought who benefit from the advantages that VIIRS has over heritage satellite instrumentation, particularly the DNB/NCC imagery not available from geostationary orbit.
The validation examples presented, most with direct and specific feedback from operational users, are the crux of the post-launch validation of VIIRS Imagery. Emphasis has been on the Alaska operations, since the Alaska region is specifically mentioned in the KPP statement for VIIRS. Alaska examples include identification of fog, convection, and the ability to distinguish between sea ice and clouds over the Arctic Ocean and Bering Sea. However, not all VIIRS validation necessarily takes place in the Polar Regions. Examples of tropical cyclone re-centering and Saharan dust in the Caribbean and dust on the Great Plains were presented as applications of VIIRS DNB imagery that has potential for worldwide application.
7. Conclusions
These cases present an overall picture of wide use and multiple-user benefits gained from VIIRS Imagery, both as individual bands and as band combinations and RGB composite image products suitable to specific atmospheric and land phenomena. The fact that numerous users are pleased with VIIRS is the “user” validation that goes beyond the “official” validation accomplished by the Imagery Team alone.
Future plans for VIIRS Imagery validation include continuing/routine checkout as operational ground systems (hardware and software) change, to make sure Imagery remains at consistent high quality. Then, the validation process begins over with follow-on satellites, JPSS-1 to be launched in 2016 or 2017, and similarly for JPSS-2 and beyond.


