Article

NDVI-Based Analysis on the Influence of Climate Change and Human Activities on Vegetation Restoration in the Shaanxi-Gansu-Ningxia Region, Central China

1
State Key Laboratory of Earth Surface Processes and Resource Ecology, Beijing Normal University, Beijing 100875, China
2
Academy of Disaster Reduction and Emergency Management, Beijing Normal University, Beijing 100875, China
3
College of Resources Science & Technology, Beijing Normal University, Beijing 100875, China
4
Laboratory for Earth Surface Processes, College of Urban and Environmental Sciences, Peking University, Beijing 100871, China
*
Author to whom correspondence should be addressed.
Remote Sens. 2015, 7(9), 11163-11182; https://doi.org/10.3390/rs70911163
Submission received: 16 May 2015 / Revised: 9 August 2015 / Accepted: 25 August 2015 / Published: 31 August 2015
(This article belongs to the Special Issue Earth Observations for the Sustainable Development)

Abstract

:
In recent decades, climate change has affected vegetation growth in terrestrial ecosystems. We investigated spatial and temporal patterns of vegetation cover on the Loess Plateau’s Shaanxi-Gansu-Ningxia region in central China using MODIS-NDVI data for 2000–2014. We examined the roles of regional climate change and human activities in vegetation restoration, particularly from 1999 when conversion of sloping farmland to forestland or grassland began under the national Grain-for-Green program. Our results indicated a general upward trend in average NDVI values in the study area. The region’s annual growth rate greatly exceeded those of the Three-North Shelter Forest, the upper reaches of the Yellow River, the Qinling–Daba Mountains, and the Three-River Headwater region. The green vegetation zone has been annually extending from the southeast toward the northwest, with about 97.4% of the region evidencing an upward trend in vegetation cover. The NDVI trend and fluctuation characteristics indicate the occurrence of vegetation restoration in the study region, with gradual vegetation stabilization associated with 15 years of ecological engineering projects. Under favorable climatic conditions, increasing local vegetation cover is primarily attributable to ecosystem reconstruction projects. However, our findings indicate a growing risk of vegetation degradation in the northern part of Shaanxi Province as a result of energy production facilities and chemical industry infrastructure, and increasing exploitation of mineral resources.

Graphical Abstract

1. Introduction

In recent decades, climate change has affected vegetation changes worldwide [1,2,3,4]. The role of ecological restoration in sustainable development, especially the influence of interactions between climate change and human activities on vegetation growth processes has attracted increasing attention [5,6,7,8,9,10,11,12,13,14]. The Shaanxi-Gansu-Ningxia region is located in the middle of the Loess Plateau in central China. It not only represents a fragile ecosystem and a typical agro-pastoral transitional zone, but is also a region that is sensitive to climate change. Consequently, it was listed as one of the priority areas for launching the Grain-for-Green (GFG) and natural forest conservation programs [15]. Previous studies have concluded that with increasing levels of agricultural production, the transfer of a surplus rural labor force, lifestyle changes, and continued implementation of the GFG program, the positive impacts of human activities on vegetation restoration will accelerate over the next few years on the Loess Plateau [7,16,17,18,19,20,21,22].
However, the findings of recent studies have challenged these conclusions. For example, although warming in the Northern Hemisphere is projected to increase in the future, the rate of global warming has slowed down over the past 15 years [23,24,25]. However, the response of vegetation to these trends remains uncertain, as the relationship between temperature and vegetation may change over time [26,27,28]. Additionally, in the specific context of the Loess Plateau, which is ecologically fragile and rich in energy resources, the local impacts of trends in the county’s economic development may change [29,30]. The central government’s withdrawal, in 2013, of subsidies previously provided under the GFG program, may also change the region’s trajectory of increasing vegetation cover. These issues highlight the need to better understand how the impact of climate change and human activities on vegetation has changed in the Shaanxi-Gansu-Ningxia region over the past 15 years.
The PRECIS regional climate modeling system projects a trend of increasing temperatures and a decline in precipitation on the Loess Plateau over the next 40 years (2011–2050) [31]. However, the climate data shows parallel trends of increasing precipitation and stable temperatures from 2000 to 2012, suggesting a trend of decreasing aridity in this region [32,33]. Generally, the body of knowledge relating to increasing aridity deems that an arid climate impedes vegetation growth. Further, the increase in vegetation greening in the study area has been attributed to the GFG program launched by the central Chinese government in 1999. The inference drawn from these two conclusions exaggerates the effect of human activities, while neglecting favorable climatic conditions. Such a perspective lacks a comprehensive understanding of climatic variability in recent decades. Xiao [20] has also argued that the increase in forest productivity on the Loess Plateau was not driven by elevated air temperatures, changing precipitation, or rising atmospheric carbon dioxide concentrations. Rather, a substantial increase in average tree cover in this region has been attributed to human activities (ecological engineering). In light of new knowledge regarding climatic conditions, studies should investigate the response of vegetation restoration projects in the Shaanxi-Gansu-Ningxia region.
In addition, Myneni, et al. [34] and Tucker, et al. [35] have respectively analyzed NDVI values during the periods 1981–1991 and 1981–1999. These studies revealed vigorous vegetation growth, thought to be driven by warming, at mid-latitudes of the Northern Hemisphere. However, with the gradual extension of the NDVI time series, a number of studies have proved that from 2000, vegetation growth in many regions in the Northern Hemisphere has slowed down, as has vegetation greening at mid-northern latitudes [36,37,38,39,40]. Piao, et al. [41] further found that a weak relationship existed between inter-annual temperature variability and northern vegetation activity, indicating the need for caution when using results obtained from inter-annual time scales to predict the decadal response of plants to ongoing warming.
In term of regional human activities, ecological restoration projects in the Shaanxi-Gansu-Ningxia region have achieved remarkable targets in terms of human activities. However, new land uses have also emerged. For example, in 2006, the construction of six industrial concentration districts, focusing on coal, gas, and electricity resources, was initiated in the city of Yulin in Shaanxi Province [42]. Compared with the landscape during the early stages of the GFG program, the current landscape of this region shows increased levels of vegetation fragmentation, with a steep rise in the number of patches of habitat, water bodies, and mining areas [43]. Economic development within the county has also intensified [29]. Further research examining all of these factors is, therefore, required to understand the role of human activities and the driving mechanisms of climatic factors in vegetation restoration.
We suggest that previous studies have not paid sufficient attention to climate change and human activities that have positively influenced vegetation growth. While exaggerating the effects of human activities, they have neglected favorable climatic conditions. Moreover, they have exaggerated the positive effects of human activities (ecological engineering) while neglecting the ecological risks of industrialization. These two areas of exaggeration can potentially lead to misinterpretations of the outcomes of appropriate policies that support restoration projects, as well as of the influence of climate change and human activities on vegetation restoration.
This study, which targeted the Shaanxi-Gansu-Ningxia region on the Loess Plateau, used MODIS-NDVI remote sensing data for the period extending from 2000 to 2014 to analyze the spatiotemporal pattern of NDVI dynamics during the 15 years following the inception of the GFG program. We used statistical methods to redefine the roles of climate change and human activities in vegetation restoration. We provide some theoretical evidence that indicates the benefits of regional sustainable development and ecological restoration projects on vegetation growth in this region.

2. Materials and Methods
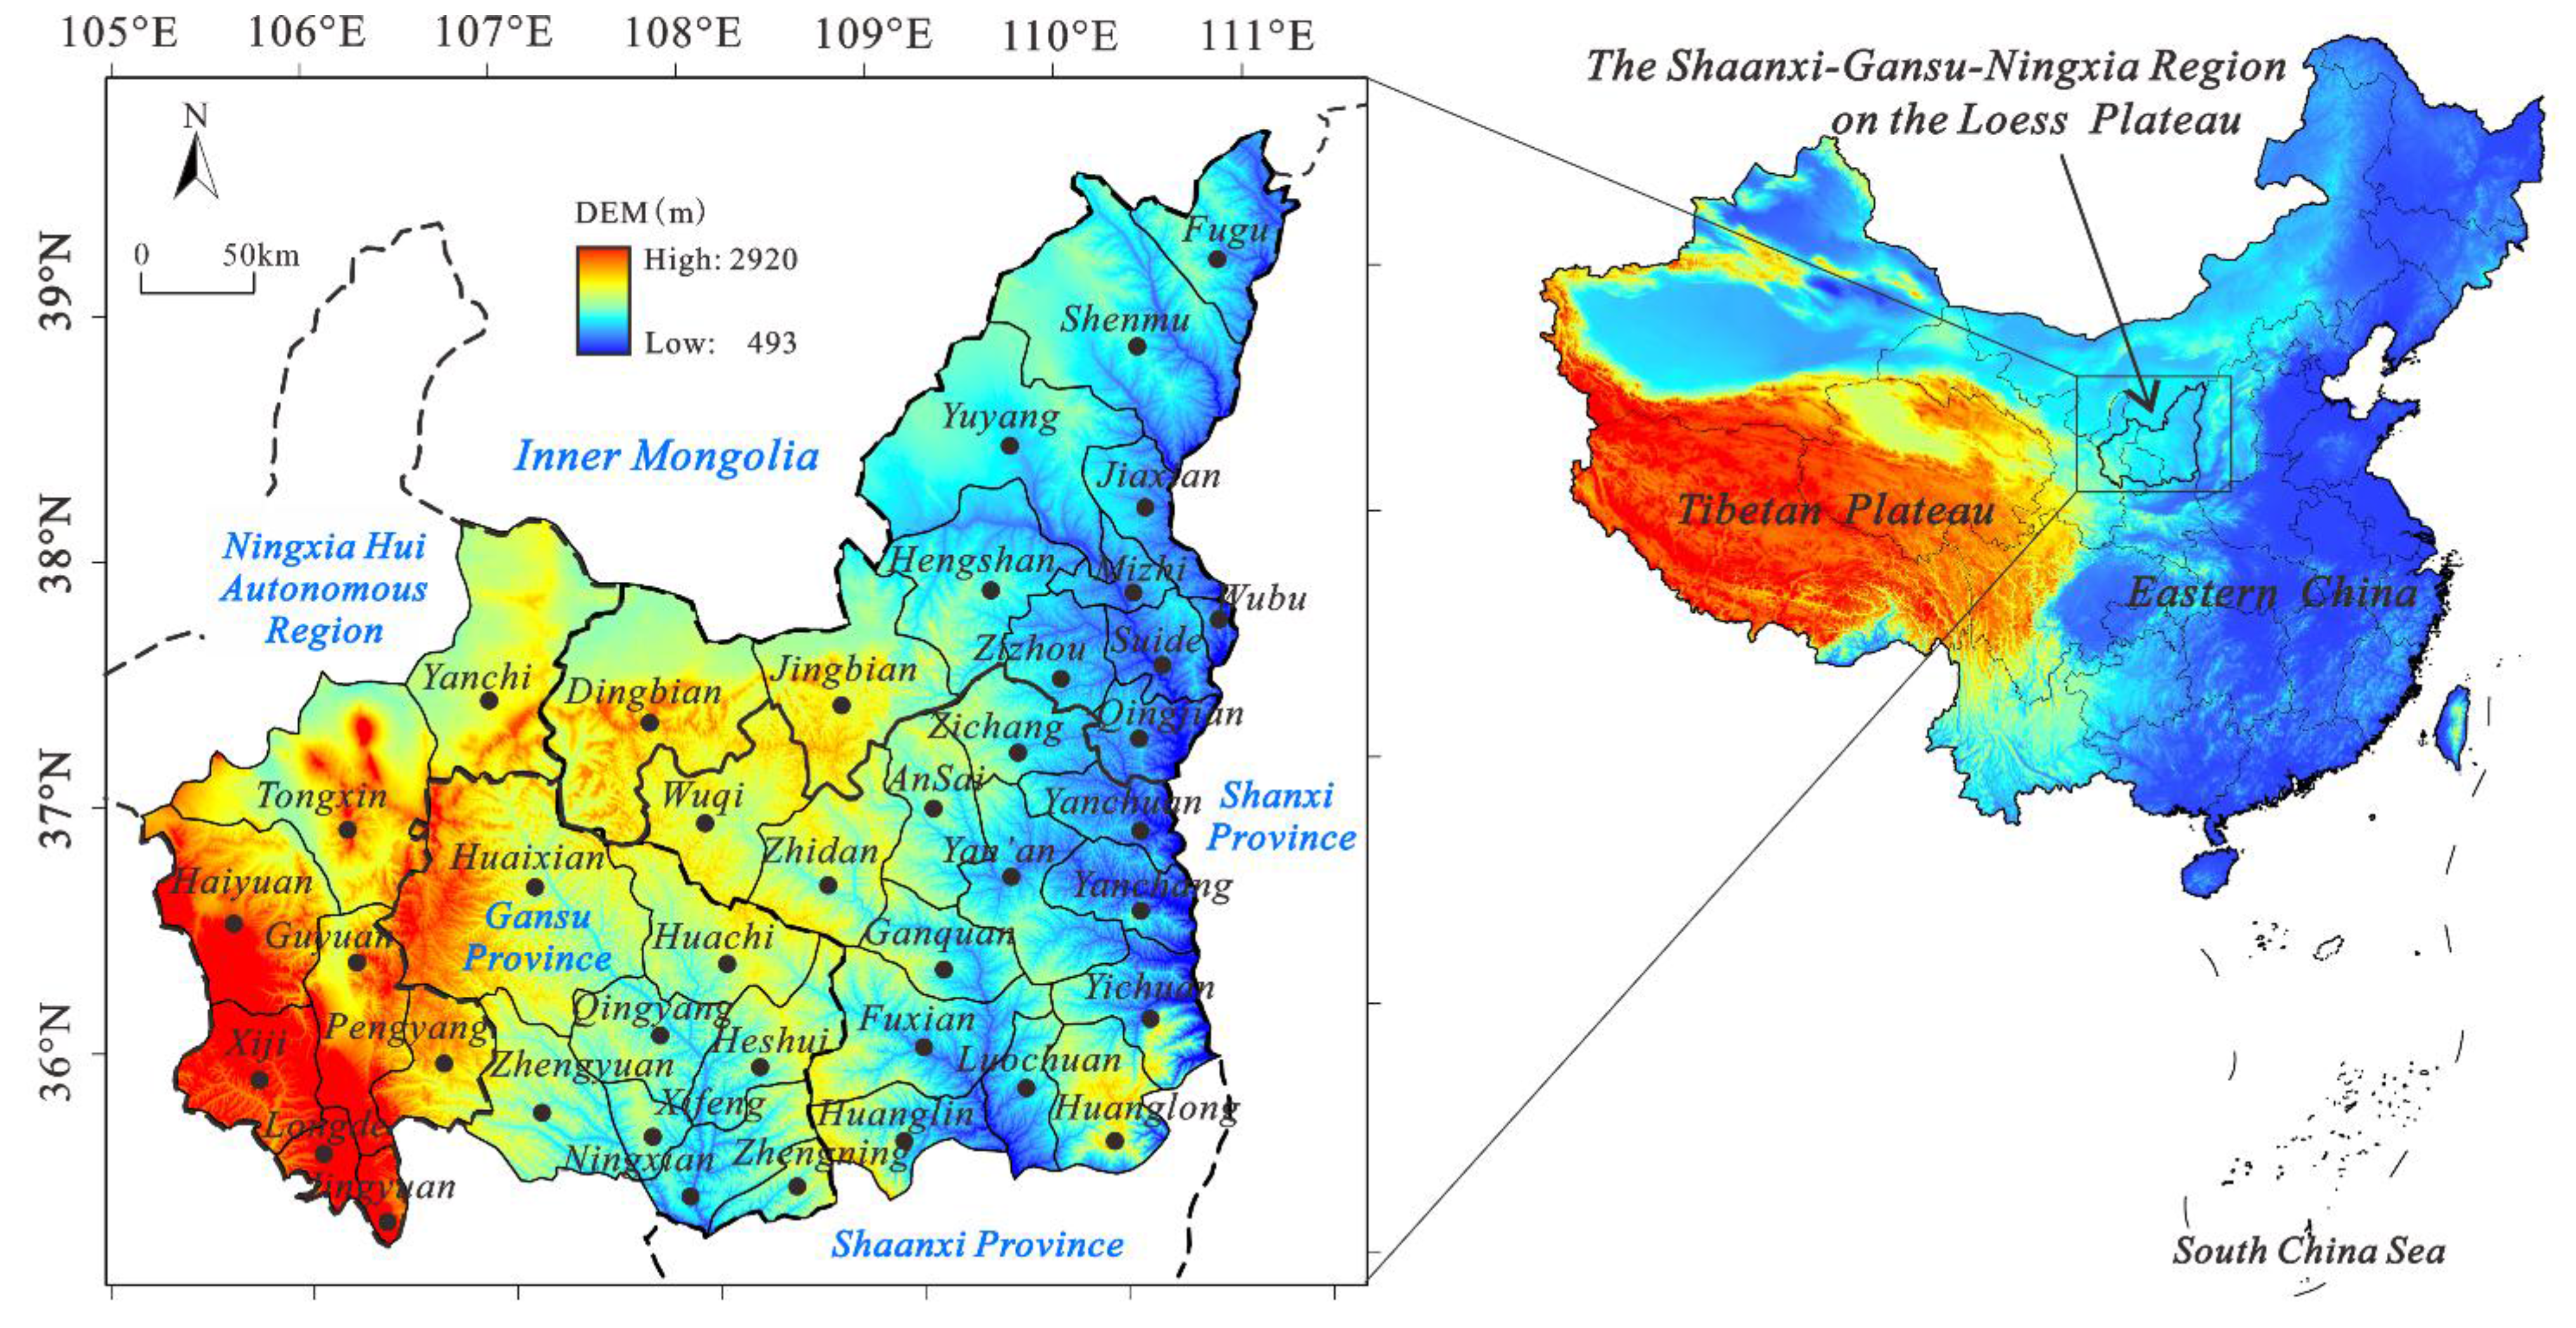
2.1. The Study Area

The Shaanxi-Gansu-Ningxia region is located in the central part of the Loess Plateau which is characterized by hills and gully areas (Figure 1). The region straddles three climatic zones: semi-humid, semi-arid, and arid climatic zones, making it very sensitive to climate variability. The average annual precipitation of the region exceeds 600 mm in the south, gradually decreasing, northward, to 250 mm. Rainfall mainly occurs between June and September, with significant inter-annual variability. The hilly topography, heavy precipitation, and, especially, long-term and extensive human activity (i.e., removal of natural vegetation and farming-accelerated deterioration), have resulted in serious soil erosion [44,45]. Most of the area’s natural forest vegetation has been cleared and the current vegetation primarily comprises native and introduced grasses. The present land cover and vegetation types include cropland, shrubs, forests (mainly in southern mountainous areas), and rangeland [16]. Socioeconomic data pertaining to the study region are provided as Supplementary Materials (Section 1).
Figure 1. The study area.
Remotesensing 07 11163 g001

2.2. Data Sources

MODIS-NDVI data were obtained from NASA’s Earth Observing System for the period 2000–2014. The spatial resolution of the data was 250 m × 250 m and the temporal resolution was 16 days. Monthly NDVI value were calculated using the maximum value composite (MVC) method, which minimizes the following: atmospheric effects, scan angle effects, cloud contamination, and solar zenith angle effects [46]. Annual NDVI value comprised the maximum value of the monthly NDVI datasets. We used a digital elevation model (DEM) with a spatial resolution of 30 × 30 m obtained from the Shuttle Radar Topography Mission (SRTM).
The climatic datasets, consisting of monthly data on mean temperatures and precipitation, were obtained from the Chinese National Meteorological Center. They covered 14 meteorological stations in the Shaanxi-Gansu-Ningxia region for the period 1960–2014. Land use data were obtained using a GLC2000 dataset with a resolution of 1 km × 1 km, that included 15 land use types in China. The land use data were provided by the Environmental and Ecological Science Data Center for West China and the National Natural Science Foundation of China. We also extracted statistics on the conversion of farmland to forest in Yan’an and Yulin, located in the northern part of Shaanxi Province, for the period 2000–2014. These were compiled from the statistical yearbooks of the Shaanxi and National Economy and Society Developed Statistical Bulletin.

2.3. Methods

2.3.1. Theil–Sen Trend Estimate Combined with the Mann–Kendall Trend Test

The method of linear regression analysis has been widely used in vegetation dynamics detection with time series NDVI data [47]. However, this method is easily affected by burly outliers [48]. A combination of the Theil–Sen mean trend estimate and the Mann-Kendall test method has proven robust in exploring significant trends in vegetation changes, and is particularly effective for estimating trends within small series [49,50,51]. The computational formula used is:
β = Median ( N D V I j N D V I i j i ) , i < j
where β is the Theil–Sen median slope, Median is the median of a set of data values, and NDVIi and NDVIj are the NDVI values in years i and j.
To assess levels of ecological restoration, we categorized slope values into seven standard levels (see Table 1). These were: serious degradation, moderate degradation, light degradation, unchanged, mild improvement, moderate improvement, and strong improvement. These were obtained in relation to a frequency histogram of pixel numbers with different slope values [52].
Table 1. Classical standards of NDVI changes.
Classical StandardRangeClassical StandardRange
Serious degradationSlope < −0.0090Slight improvement0.0009 ≤ Slope < 0.0045
Moderate degradation−0.0090 ≤ Slope < −0.0045Moderate improvement0.0045 ≤ Slope < 0.0090
Slight degradation−0.0045 ≤ Slope < −0.0009Obvious improvement0.0090 ≤ Slope
Unchanged−0.0009 ≤ Slope < 0.0009

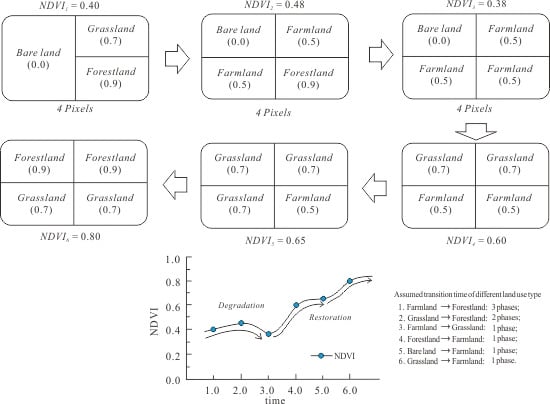
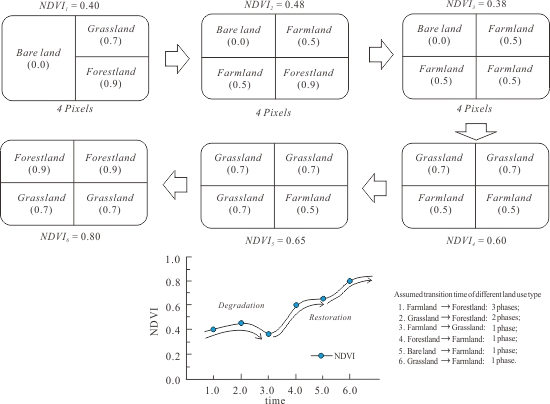
2.3.2. Fluctuation Tendency

Standard deviation is a widely used measure of variability or diversity. It shows the degree of variation or “dispersion” from the average. A low standard deviation indicates that the NDVI value of each pixel tends to be very close to the mean, whereas a high standard deviation indicates dispersion across a wide range of values in a time series [35]. The standard deviation is calculated as follows:
S = 1 n i = 1 n ( N D V I i N D V I ¯ ) 2
where S is the standard deviation, i is the serial number of a year within the period of study, and NDVIi is the NDVI value in year i. The higher the SD value, the greater the change in vegetation.
To assess fluctuation in relation to vegetation dynamics, five categories of standard deviation, with natural breaks, were identified. These were: the highest (S ≥ 0.11), higher (0.09 ≤ S ≤ 0.11), middle (0.07 ≤ S < 0.09), lower (0.05 ≤ S < 0.07), and lowest (0.00 ≤ S < 0.05).
The steps for calculating the fluctuation value were as follows. The least square method was first applied to calculate the linear regression trend and, consequently, the absolute residuals series zi. The fluctuation tendency of zi was then calculated using the Theil–Sen median slope, and its significance was tested by performing the Mann–Kendall test. The fluctuation tendency is calculated as follows:
{ z i = | y ^ i y i | y ^ = i a + b x i   i = 1 ,   2 ,   ,   n
where a is the regression constant and b is the regression coefficient, calculated using the least square method; y ^ i is the NDVI linear regression series; and zi denotes absolute residuals of the series.

3. Results and Analysis

3.1. Features of Variation of Average NDVI Values in the Shaanxi-Gansu-Ningxia Region

From 2000 to 2014, the average NDVI values in the Shaanxi-Gansu-Ningxia region increased at an annual rate of 0.0117 year−1, as shown in Figure 2. This rate was much more rapid than the average annual increase of 0.0007 year−1 observed for the Three-North Shelter Forest from 1982 to 2006 (a 25-year period) [53]. It also exceeds average annual increases in the upper reaches of the Yellow River (0.0023 year−1) [50], and in the Three-River Headwater Region (0.0001 year−1) recorded from 2000 to 2011 [54]. These results indicate that the GFG program may have had more significant impacts in the Shaanxi-Gansu-Ningxia region compared with its impacts in these other regions.
A downward trend of NDVI values, in conjunction with significantly decreased precipitation, has been observed in the Mongolian Plateau since the mid- or late 1990s [37]. Six out of eight of China’s climatic zones showed a significant increasing tendency (p-value < 0.05) from 1982 to 1997, whereas most regions evidenced a decreasing tendency from 1998 to 2013 [40]. Further, a significant increase in NDVI values was observed for the Qinling–Daba Mountains (0.0030 year−1) from 2000 to 2014. However, a stable increase was detected before 2010 (0.0043 year−1), followed by a sharp decline after this year (−0.0066 year−1) in the Qinling–Daba Mountains [51]. These findings suggest that it is necessary to study the interactions of climate change and human activities in the vegetation growth process in the Shaanxi-Gansu-Ningxia region.
The inter-annual variation of average NDVI values reveals three periods of acceleration in the Shaanxi-Gansu-Ningxia region from 2000 to 2014. These respective periods were: 2000–2002, 2008–2009, and 2012–2013. The growth rates of NDVI during the three acceleration phases were 13.0%, 9.8%, and 6.3%, respectively (Figure 2). However, NDVI values fell during the following periods: 2004–2005, 2007–2008, and 2013–2014. These results indicate that annual NDVI values changed in accordance with actual vegetation restoration.
More specifically, the Chinese government began implementing the GFG program entailing conversion of sloping farmland to forestland or grassland in 1999. Massive areas of farmland were converted for seabuckthorn cultivation, which led to a rapid increase of NDVI (13% in 2002). However, annual rainfall amounts of less than 400 mm in some areas result in the shriveling of cultivated seabuckthorn and a corresponding decrease in NDVI, which occurred during 2004 and 2005 [55]. Subsequent ecological engineering projects adjusted plant types, with Mongolian and Chinese pine varieties being planted because of their adaptability to semiarid areas. Consequently, NDVI values have shown a steady rise from 2006. The decreasing values of NDVI during 2007–2008 and 2013–2014 were the result of regional droughts and reduced precipitation (see Table 2).
Figure 2. Variations in annual NDVI values in the Shaanxi-Gansu-Ningxia region from 2000 to 2014.
Remotesensing 07 11163 g002
Table 2. The changes of NDVI and associated factors during six stages.
IDStageNDVITemperaturePrecipitation
12003–2005−1.0%2.2%−33.7%
22007–2008−3.4%−8.7%−14.8%
32013–2014−0.1%−5.2%−9.8%
42000–200216.2%3.8%22.8%
52008–201321.3%13.0%49.3%
62012–20136.3%16.4%24.9%

3.2. Spatial Patterns of NDVI in the Shaanxi-Gansu-Ningxia Region

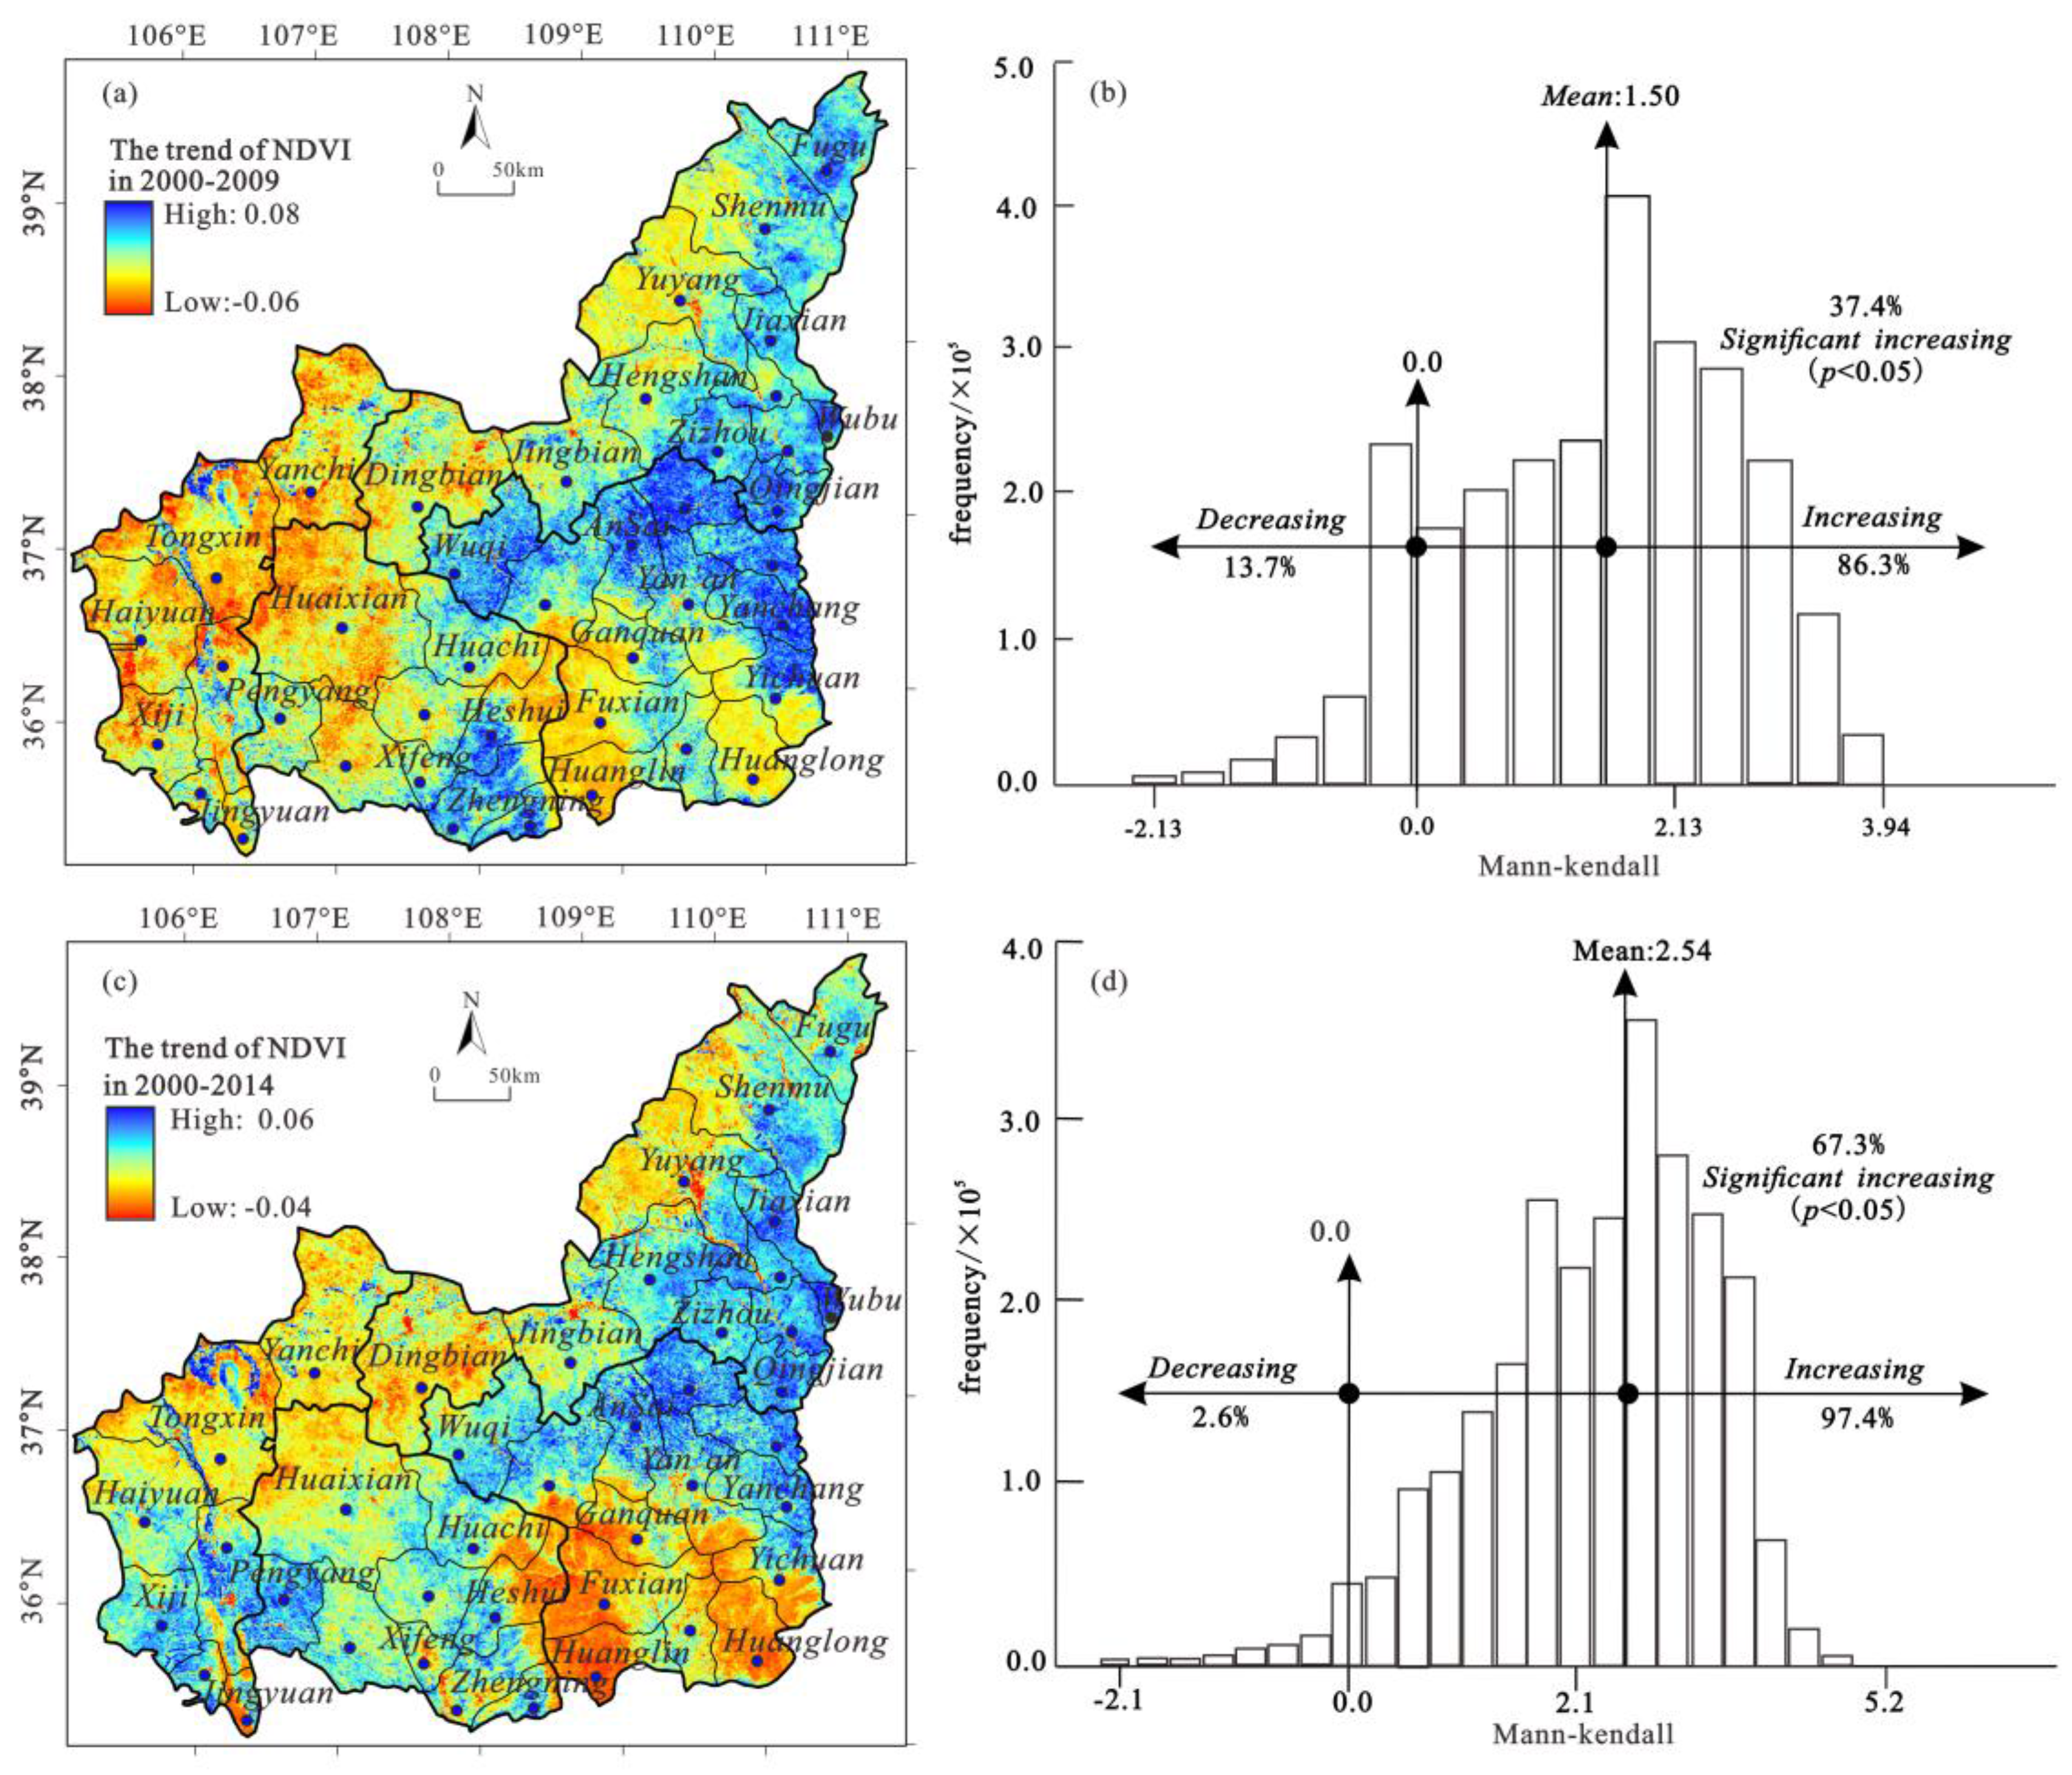
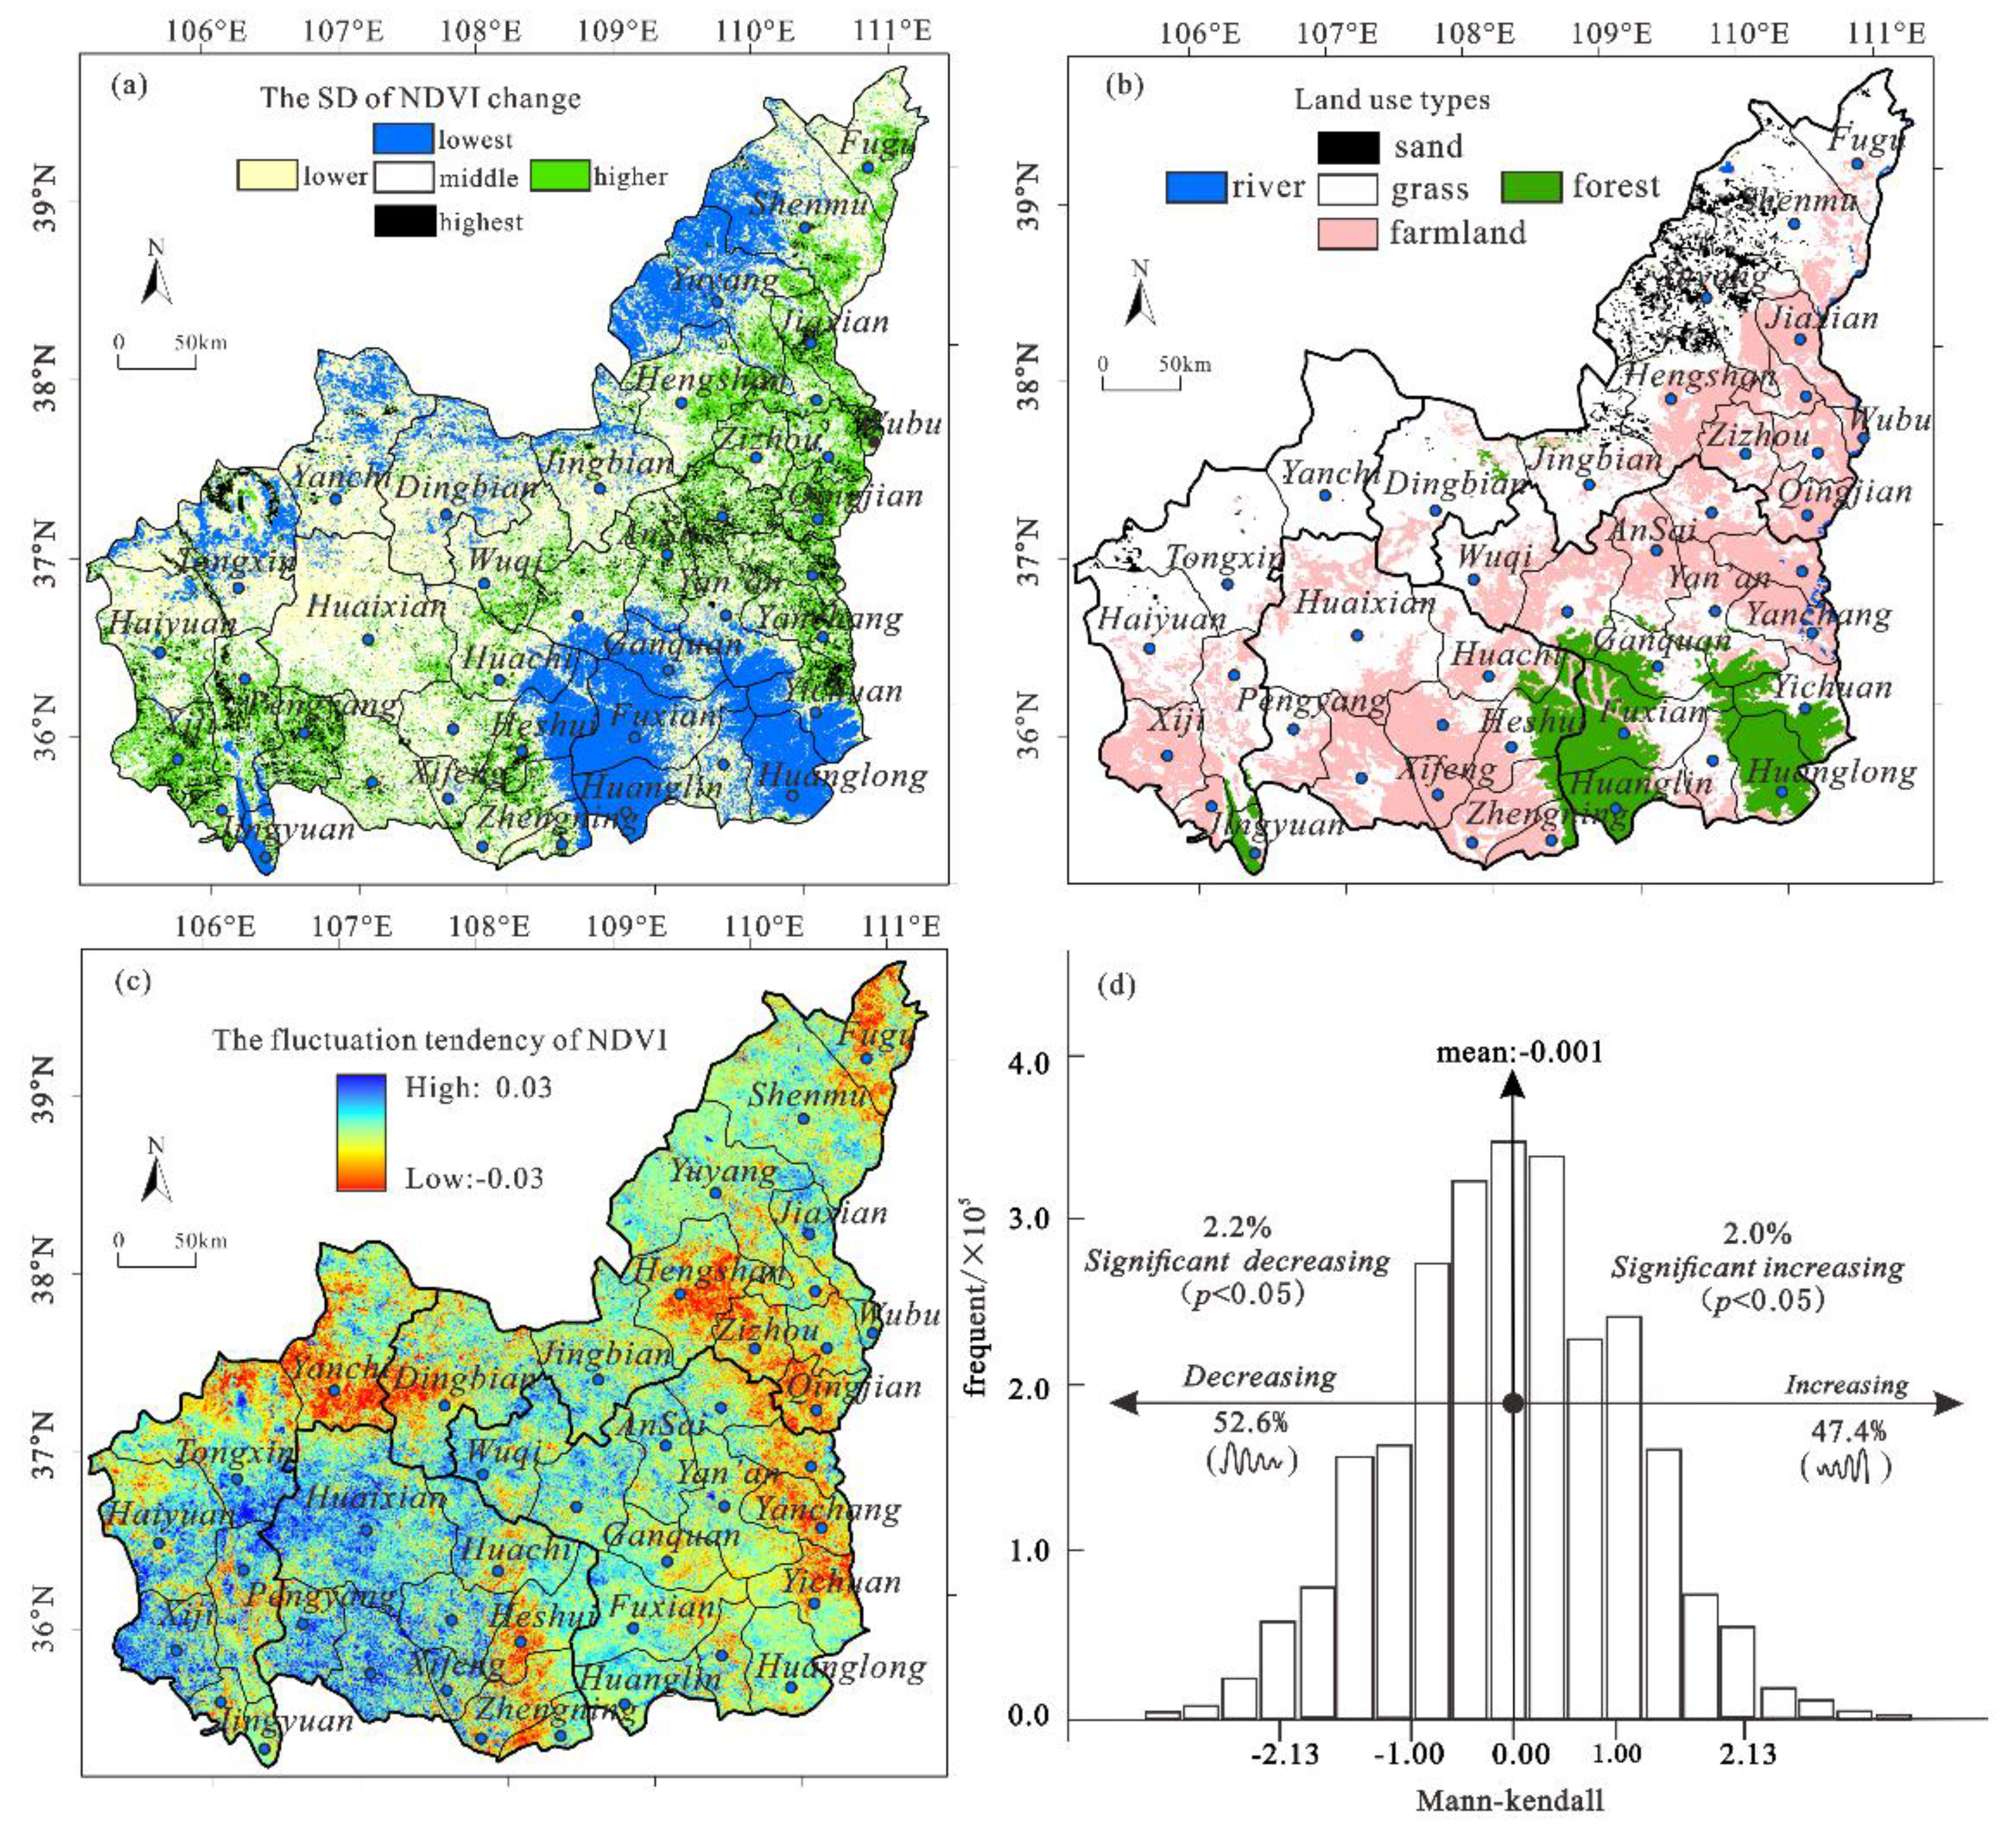
3.2.1. Trends in NDVI Change in the Shaanxi-Gansu-Ningxia Region

To explore changes from vegetation restoration, we compared the spatial patterns of vegetation change during two acceleration phases: 2000–2009 and 2000–2014 (see Table 3). Between 2000 and 2014, the NDVI value of the Shaanxi-Gansu-Ningxia region, as a whole, had increased, with 95.9% of the region showing an upward trend of improvement. From 2000 to 2009, 37.4% of the region’s vegetation significantly improved in terms of NDVI values (p-value < 0.05). When measured for the entire study period (2000–2014), this percentage rose to 67.3%, reflecting a nearly twofold increase in area in locations showing significant improvement (Figure 3). This measurement indicates that vegetation restoration in this region has been relatively widespread, as shown in the Supplementary Materials (Section 2).
Table 3. NDVI changes in the Shaanxi-Gansu-Ningxia region during 2000–2009 and 2000–2014.
PeriodTypeDegradationUnchangedImprovement
SeriousModerateLightLightModerateSerious
2000–2009Patches19,64758,267139,050128,048359,689451,3161,398,634
Area (%)0.8%2.3%5.4%5.0%14.1%17.7%54.7%
2000–2014Patches3487536824,08173,065329,926555,5931,563,131
Area (%)0.1%0.2%0.9%2.9%12.9%21.7%61.2%
Figure 3. NDVI trends and their distribution in the Shaanxi-Gansu-Ningxia region. (a) The trend of NDVI changes from 2000 to 2009; (b) The distribution of NDVI trends from 2000 to 2009; (c) The trend of NDVI changes from 2000 to 2014; (d) The distribution of NDVI trends from 2000 to 2014.
Remotesensing 07 11163 g003
Vegetation restoration trends varied in the Shaanxi-Gansu-Ningxia region as described below.
(1) Degraded areas. Between 2000 and 2009, a regressive trend was evident in 8.5% of the region, distributed across the southern portion of the Ningxia Hui Autonomous Region, eastern areas of Dingbian, and the counties of Huanxian and Zhenyuan in Gansu Province. Between 2000 and 2014, the percentage of areas showing a regressive trend was reduced to 1.2%, suggesting that there were no obvious spatial zones of regression.
(2) Unchanged areas. Between 2000 and 2009, the percentage of basically unchanged areas was 5.0%. These were primarily located in Huanxian, Ziwuling, Huanglongshan and Liupanshan. During the period from 2000 to 2014, the percentage of basically unchanged areas decreased to 2.9%. Forest cover remained stable in Ziwuling and Huanglongshan, while the unchanged area gradually shrank in Longdong and Ningnan.
(3) Improved areas. The proportions of slightly improved areas were similar during both periods: 2000–2009 and 2000–2014. These areas were spatially distributed around the edges of mountains and the sandy stretches of the Mu Us Desert. Areas where improvement levels were moderate and high accounted for 72.4% of all areas from 2000 to 2009, linking three zones of high vegetation cover: Fugu-Jiaxian-Wubao-Yanchang-Yichuan in a north-south direction and Wuqi-Ansai-Yanchang in an east-west direction, with the Qingshui, Jinghe, and Luohe Rivers forming the axis. Between 2000 and 2014, the percentage of areas where improvement levels were moderate and high rose to 82.9%, revealing almost the same spatial distribution pattern observed for 2000–2009, but with some new regions dispersed along the reaches of the Jinghe and Qingshuihe Rivers.

3.2.2. The Stability of NDVI Changes in the Shaanxi-Gansu-Ningxia Region

(1) Variability in spatial patterns of fluctuation. Between 2000 and 2014, the standard deviation of NDVI was 0.005–0.319, and stability was strongly linked to land-use type. Areas with the highest fluctuation (black color) were located northeast of Yan’an, in the Loess gully region in southern Yulin, and in the reaches of the Jinghe River, accounting for 5.9% of the total region. About 18.1% of the region (green color) evidenced higher levels of fluctuation, with these areas being found along the borders of areas with the highest fluctuation southeast of the Shaanxi-Gansu-Ningxia region. Areas with moderate variation (white color), and with low variation (light yellow color) accounted for over half of the total area (55.1%), dispersed around the transitional zones between temperate arid and semi-arid areas in the region. Areas with the lowest fluctuation levels (blue color) were distributed as patches in Ziwuling, Huanglongshan, Liupanshan and in sandy stretches of the Mu Us Desert (Figure 4a,b).
Because of the stability of forest and sand ecosystems, NDVI values did not vary significantly over a short timeframe either in mountainous areas with relatively high coverage or in sandy stretches of the Mu Us Desert with relatively low coverage. The nationwide GFG program for converting sloping farmland to forestland or grassland was initiated in 1999. In 2014, the program had been in existence for 15 years and had resulted in significant changes in land use and cover [56]. In the study region, farmland with slope gradients above 25° has been completely converted into land for ecological preservation, while there has been partial conversion of farmland with slopes ranging between 15° and 24° into preserved land or terraces. The application of restrictive policies has promoted vegetation restoration. Therefore, areas with the highest levels of fluctuation are mainly located in farmland.
(2) Trends in fluctuation variability. Between 2000 and 2014, fluctuation trends relating to NDVI values evidenced spatial variations. We found that about 52.6% of the region showed a decreasing trend, whereas 47.4% showed an increasing trend in fluctuation variation. In the eastern Shaanxi-Gansu-Ningxia region where vegetation has matured, strong fluctuations in NDVI values have gradually disappeared in the wake of 15 years of ecological engineering. Areas evidencing strong fluctuation trends are mainly located in northwestern Yan’an, the upper reaches of the Jinghe River, and the lower reaches of the Qingshui River, indicating that the western part of the Shaanxi-Gansu-Ningxia region has achieved significant results in vegetation restoration (Figure 4c). It is noteworthy that the fluctuation trend of NDVI values in this region reveals a normal pattern of distribution over the last 15 years, with only 6.7% of all areas passing the significance test (p value < 0.05), and stable conditions prevailing in most areas (Figure 4d).
Figure 4. The stability of NDVI changes in the Shaanxi-Gansu-Ningxia Region from 2000 to 2014. (a) Standard deviation of NDVI changes from 2000 to 2014; (b) Land use types in the Shaanxi-Gansu-Ningxia region; (c) The fluctuation tendency of NDVI from 2000 to 2014; (d) The distribution of trends in NDVI variation in the region from 2000 to 2014.
Remotesensing 07 11163 g004

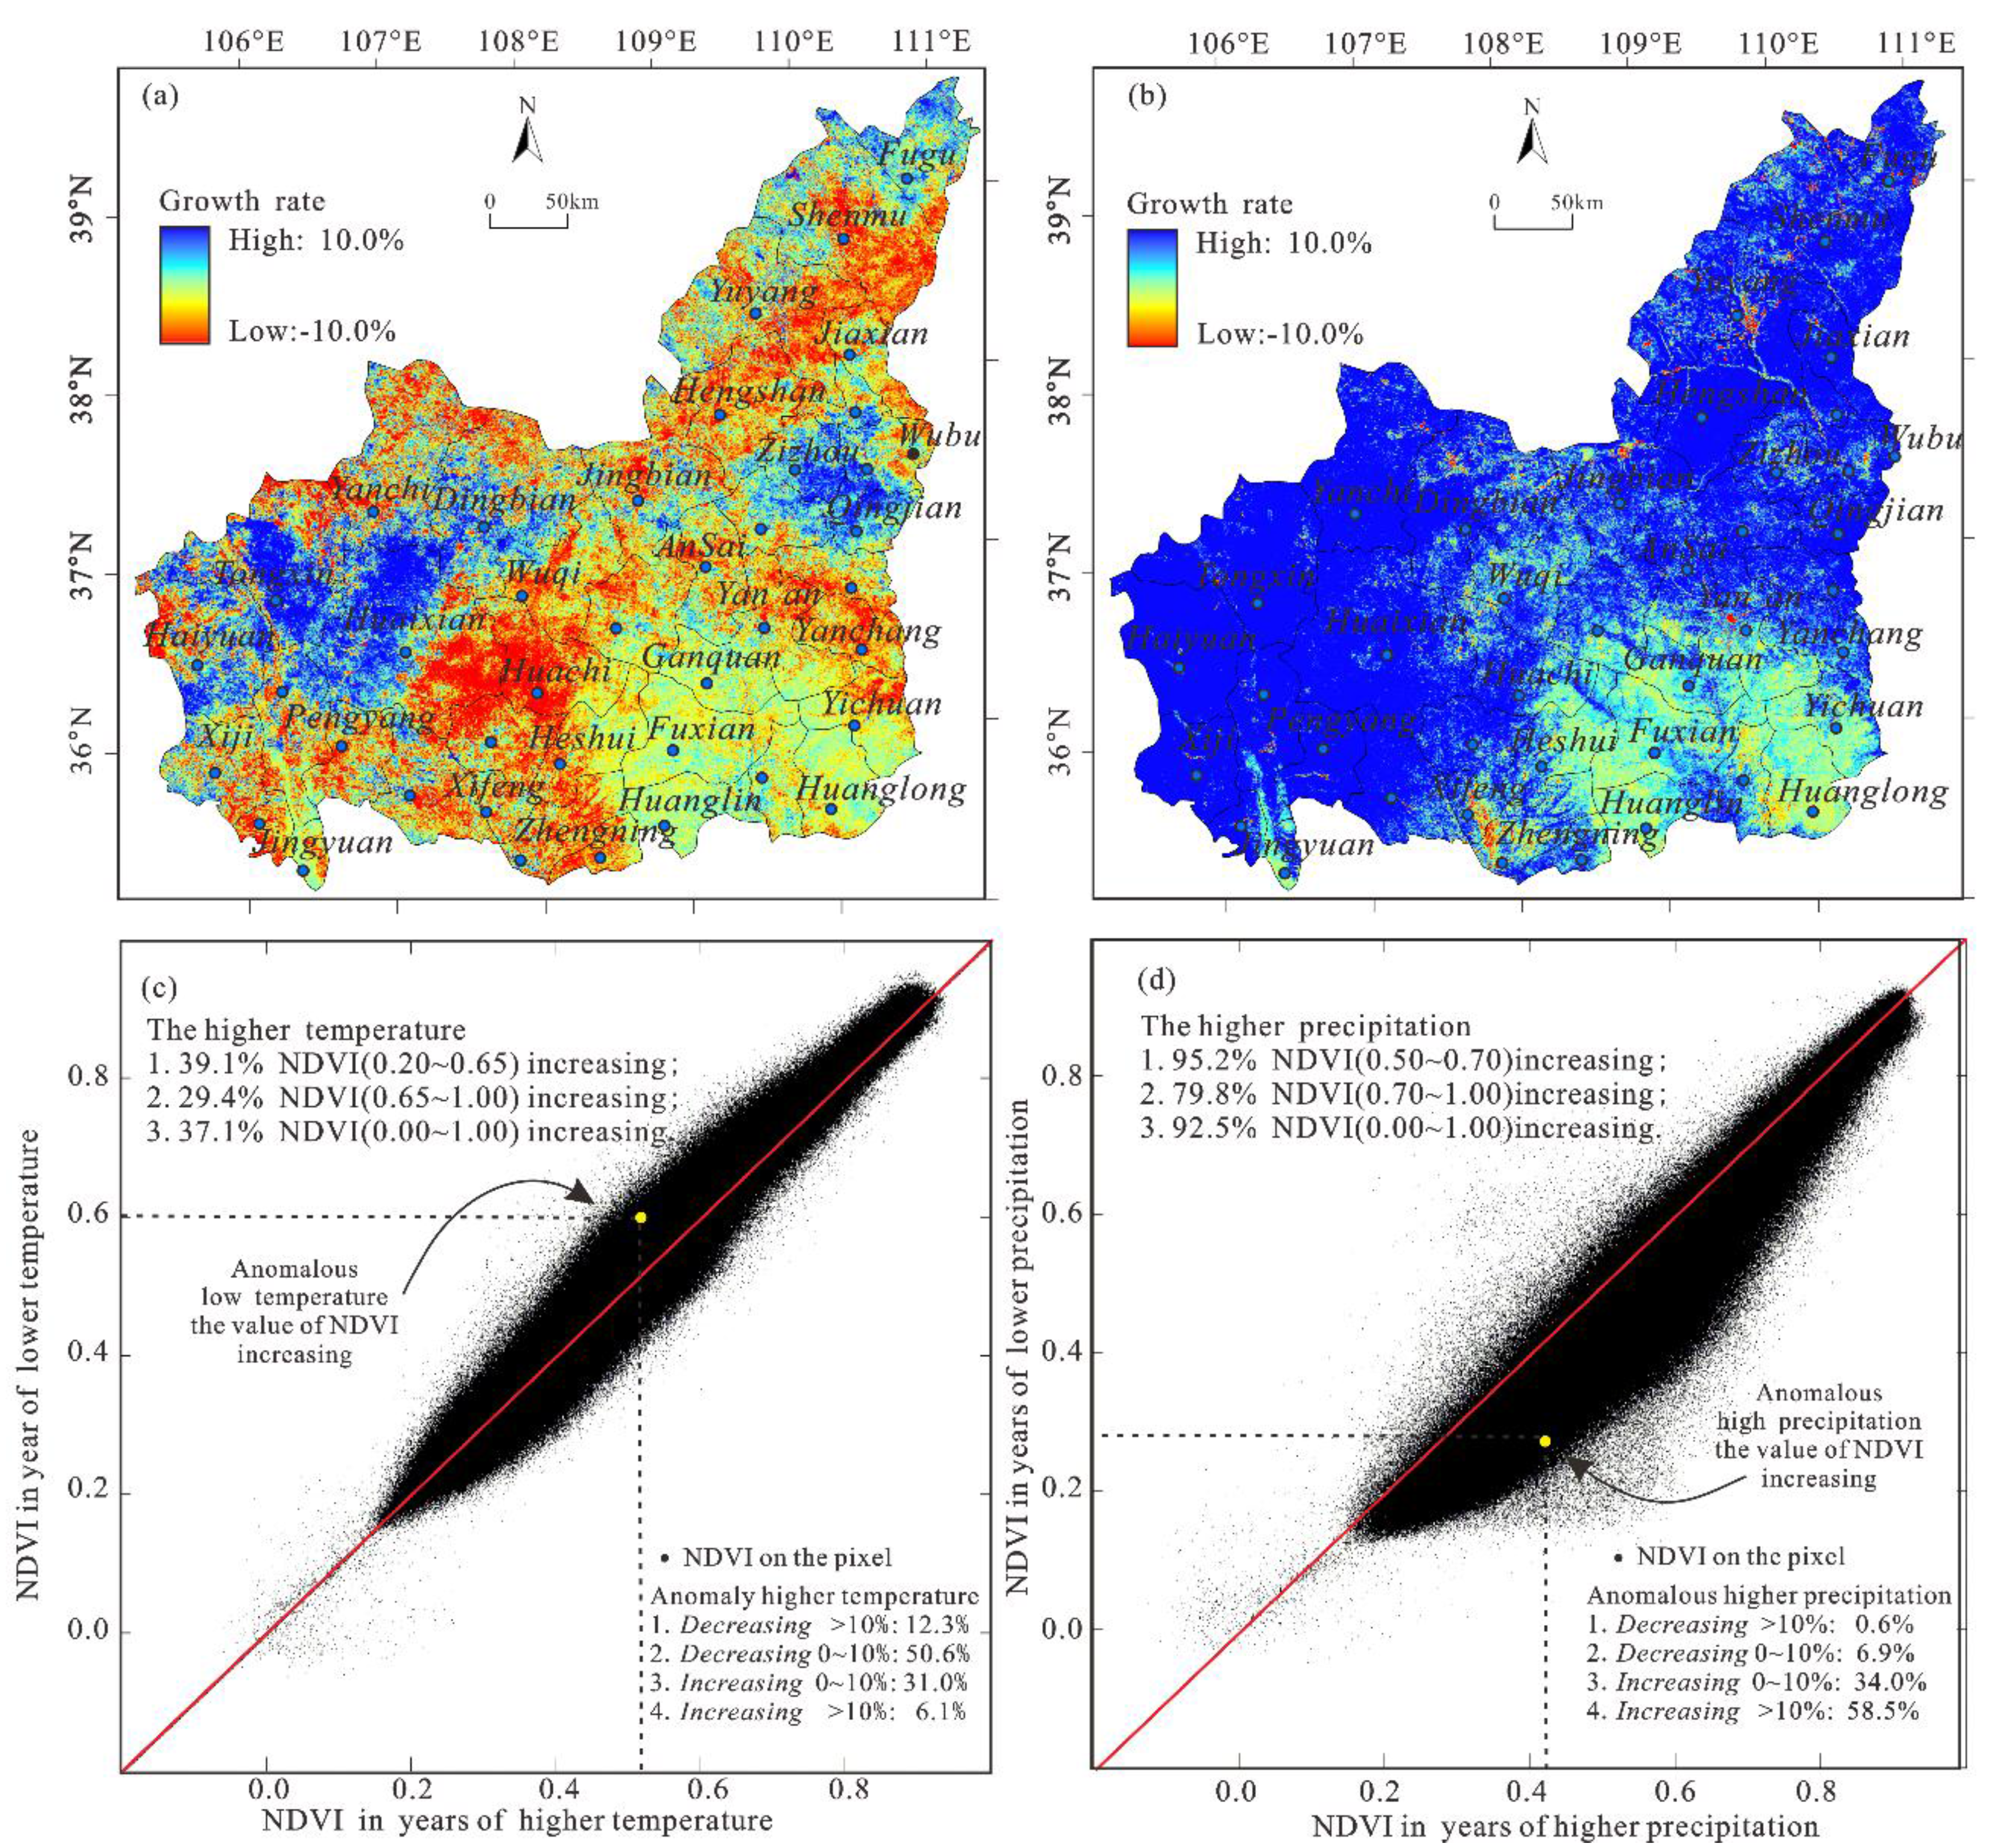
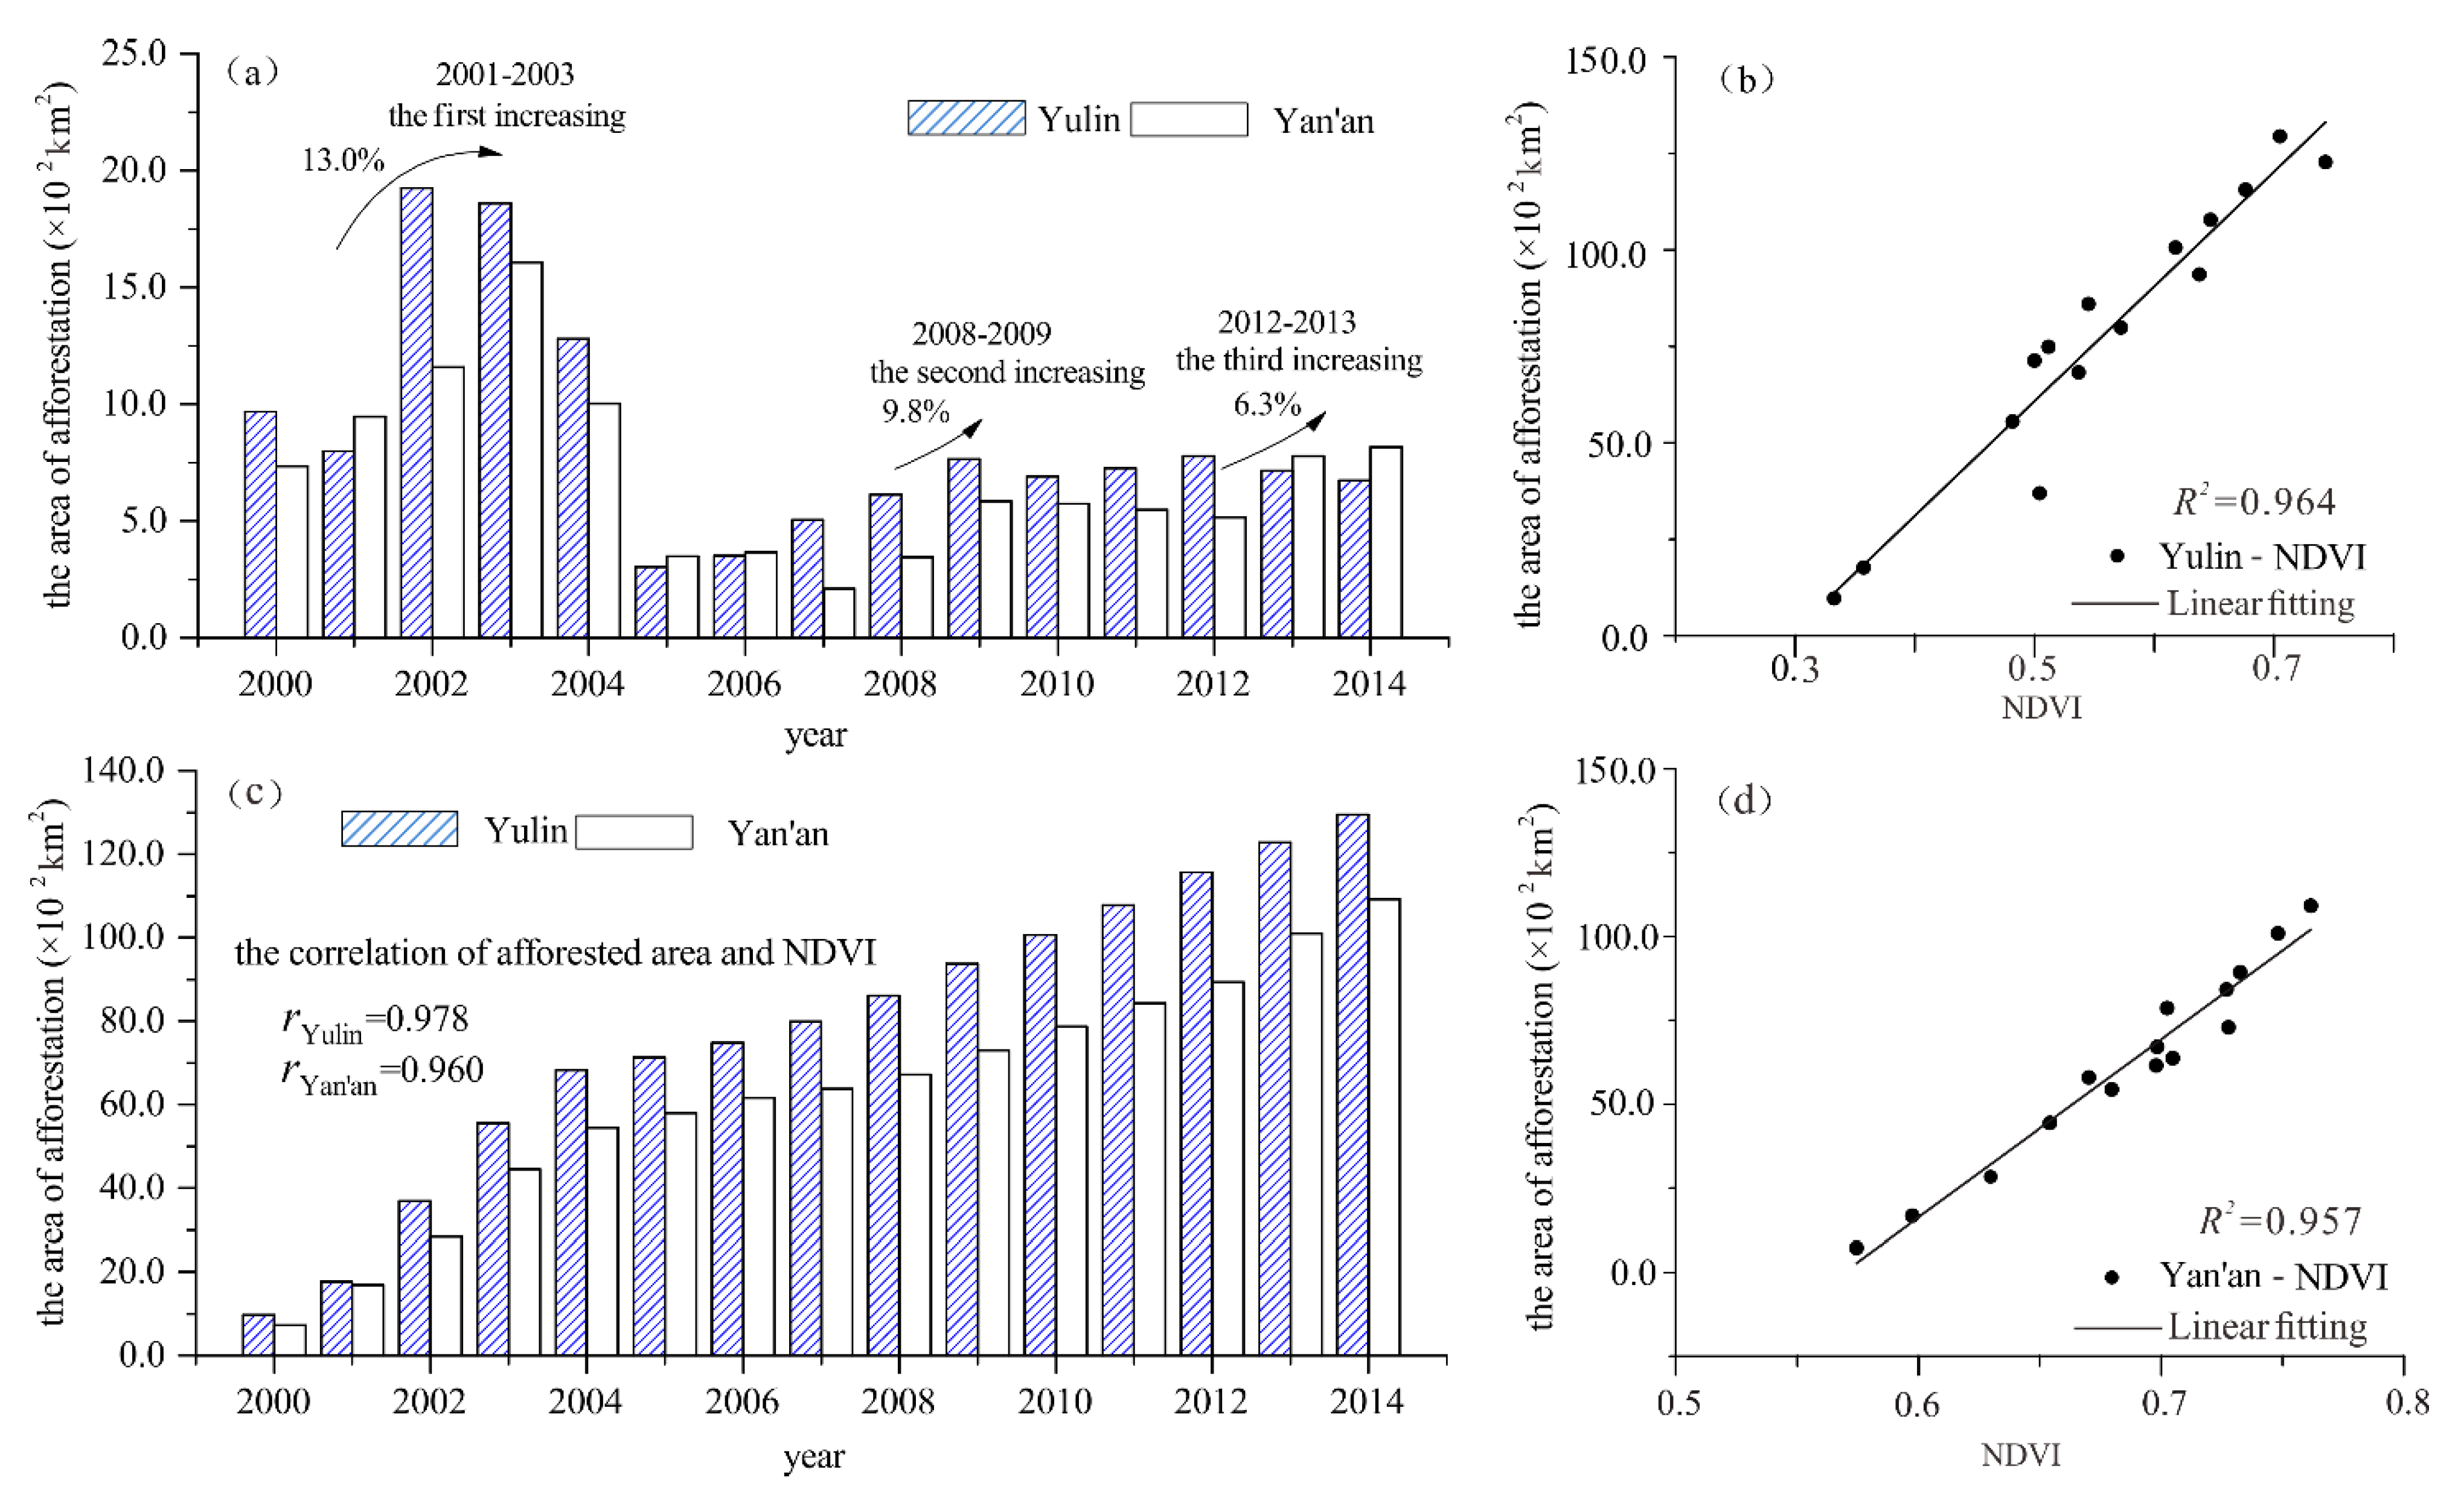
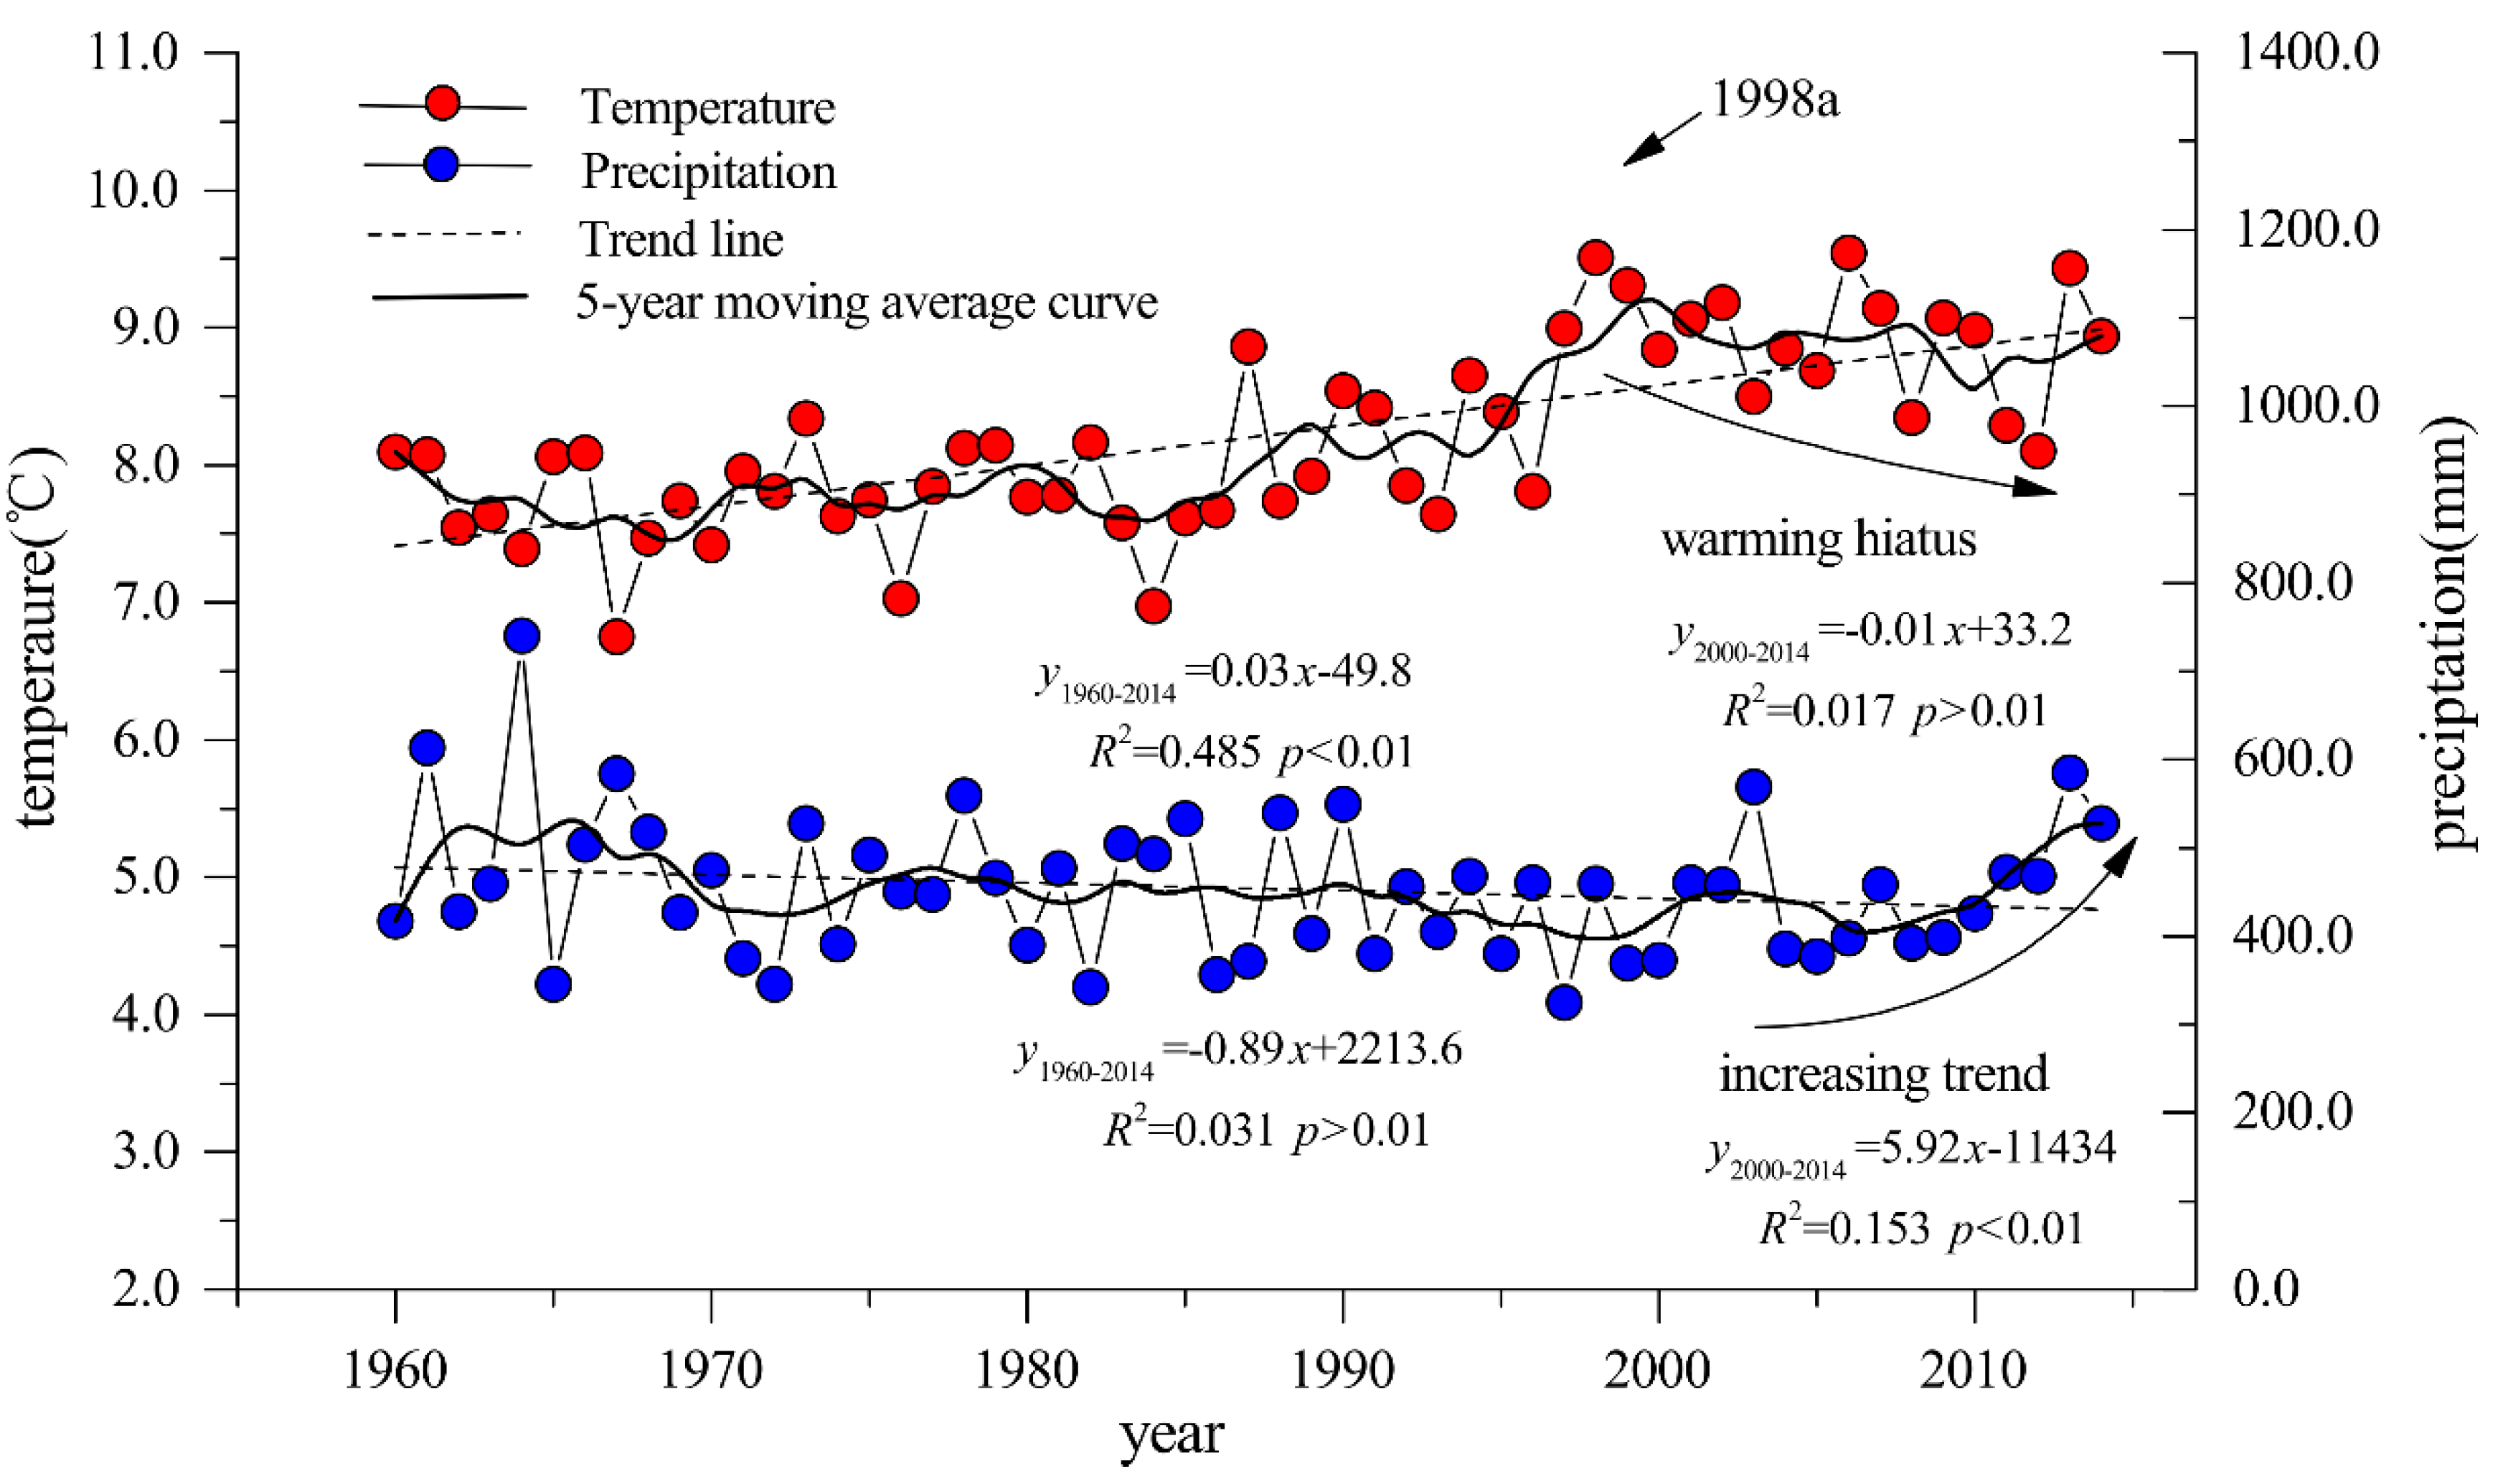
3.2.3. The Influence of Human Activities and Climate Change on Vegetation Restoration

(1) Climate trends of warming and wetting are beneficial for vegetation growth and restoration.
The regional climate (temperature and precipitation) showed warming and drying trends prior to the late 1990s and wetting and weak cooling trends after this time (Figure 5). Specifically, the average annual temperature decreased at a rate of −0.01 °C year−1, and the average annual precipitation exhibited an evident upward trend at 5.9 mm·year−1. Stable but warmer temperatures and increasing precipitation will positively influence vegetation growth in the Shaanxi-Gansu-Ningxia region.
Figure 5. Climate change in the Shaanxi-Gansu-Ningxia region from 1960 to 2014.
Remotesensing 07 11163 g005
We investigated whether climatic conditions of warming and wetting were beneficial for vegetation growth and restoration in the Shaanxi-Gansu-Ningxia region. The person relevance analysis method highlights the linear relationship between NDVI and climatic factors, but it frequently underestimates nonlinear information. We, therefore, performed a synthetic analysis to further explore the response characteristics of vegetation restoration to climate change.
Using the ±0.5 standard derivation of the 2000–2014 temperature and precipitation series, we filtered out the years with higher temperatures (2002, 2006, 2007, and 2013); years with lower temperatures (2003, 2008, 2011, and 2012); years with higher precipitation (2003, 2013, and 2014); and years with lower precipitation (2003, 2004, 2005, 2006, 2008, and 2009). This enabled us to calculate the spatial pattern of NDVI in the Shaanxi-Gansu-Ningxia region by comparing years evidencing anomalous higher temperatures or precipitation with years evidencing anomalous lower temperatures or precipitation (Figure 6).
During years with higher temperatures, the NDVI responses were mainly negative in the Shaanxi-Gansu-Ningxia region. Compared with years when temperatures were lower, during these years, areas with decreasing in NDVI values of over 10.0% accounted for 12.3%, and 62.9% of the region, revealing a downward trend in NDVI values. Areas with decreasing vegetation responses were mainly distributed in former farmland regions, and the vegetation types were farmland and wild grasslands.
During years of higher precipitation, the NDVI responses in the Shaanxi-Gansu-Ningxia region were positive. An upward trend was observed for NDVI values in 92.5% of the region, with 58.5% of the total region showing increases of over 10.0% in NDVI values. Areas with NDVI decreases that exceeded 10.0% occupied only 0.5% of the total region. These results demonstrate that available precipitation was a key factor in plant growth and development of vegetation in this region.
Figure 6. NDVI responses to anomalous higher temperatures and precipitation in the Shaanxi-Gansu-Ningxia region. (a) The NDVI response to higher temperature; (b) The NDVI response to higher precipitation; (c) A scatter diagram of the NDVI response to temperature; (d) A scatter diagram of the NDVI response to precipitation.
Remotesensing 07 11163 g006
It should be noted that greater precipitation occurred at a later stage of ecological engineering. This, together with the accumulated effect of previous ecological restoration, would have resulted in high NDVI values. In other words, both anthropogenic and climatic conditions were favorable for vegetation growth during years with higher precipitation (Figure 6b). These results indicate that the pattern of NDVI values during years of higher precipitation exhibited an overall upward trend. This confirmed our hypothesis that NDVI would increase in the study region.
Somewhat surprisingly, a decreasing vegetation response was observed in areas where local economic development had occurred in the river valley during years of greater precipitation compared with years of drought. This phenomenon may be related to local industrialization in the Loess Plateau, particularly in the northern part of Shaanxi Province (Figure 6b). Li et al. [30] have similarly emphasized the risks that industrialization poses for vegetation restoration. Detailed analyses are provided in the Supplementary Materials (Section 4).
In sum, a combination of the gradual warming of the Shaanxi-Gansu-Ningxia region and increasing precipitation has provided a beneficial climatic context for regional vegetation restoration. Previous studies found that regional aridity trends (natural factors) were unfavorable for vegetation restoration and that human activities were the main factors that could improve vegetation. However, these findings may exaggerate the benefits of human activities while neglecting favorable climatic conditions because of the use of short-term observational meteorological data for 2000–2009.
(2) In favorable climatic conditions, ecological restoration projects have resulted in evident benefits, and artificial impacts may have become more significant.
A comparison of the spatial patterns of areas with major vegetation improvement revealed that the differences of NDVI growth were mainly evident in the northern part of Shaanxi Province. Changes in the vegetation of this area were the underlying reason for growth differences in the Shaanxi-Gansu-Ningxia region (see supplementary Figure S2). The statistical data on the conversion of farmland to forests in the northern part of Shaanxi Province from 2000 to 2014 indicated a correlation between the process of vegetation restoration and human activities.
Between 2000 and 2014, afforested areas located in the wild mountains and sandy areas of the northern part of Shaanxi Province covered an area of 238.6 × 10² km2. The coverage of the GFG program peaked from 2002 to 2003, with afforested areas of 37.8 × 10² km2 in Yulin and 27.7 × 10² km2 in Yan’an, respectively. Large-scale ecological restoration programs like GFG and forest conservation laid the foundation for greening during the first acceleration stage.
In 2007, the focus of GFG shifted from expanding forest areas and gradually restoring the ecology to improving the program’s policies, consolidating established gains, effectively protecting long-term profits, and addressing the livelihood concerns of farmers involved in the program. In comparison with the improvements evident during the earlier phase, policy adjustments during this phase slowed down the pace of reforesting and restoring grasslands. Nonetheless, improved vegetation quality has been promoted via plots established for afforestation, replanting, and restoring vegetation, as well as through the continued cultivation of the existing vegetation, thus providing a basis for greening during the second acceleration stage in 2009. In 2013, afforested areas located in wild mountains and sandy areas covered 14.9 × 10² km2, evidencing an increase in area of 15.5% from 2012. The GFG program was emphatically promoted in the northern part of Shaanxi Province in 2013, laying the basis for greening during the third acceleration stage.
Human activities are highly correlated with regional vegetation changes. The correlation coefficients between the NDVI time series and cumulative afforestation areas were 0.978 and 0.960 in Yulin and Yan’an, respectively. These findings suggest that human activities have been the primary factor in vegetation improvement in the Shaanxi-Gansu-Ningxia region (Figure 7).
Figure 7. The relationship of NDVI and the annual afforested areas in the northern part of Shaanxi Province from 2000 to 2014; (a) Annual afforested areas in the northern part of Shaanxi Province from 2000 to 2014; (b) A scatter diagram of NDVI values and the cumulative afforested area in Yulin from 2000 to 2014; (c) The cumulative afforested area in the northern part of Shaanxi Province from 2000 to 2014; (d) A scatter diagram of NDVI values and the cumulative afforested area in Yan’an from 2000 to 2014.
Remotesensing 07 11163 g007

4. Conclusions

Building upon previous studies, this study investigated spatiotemporal changes in NDVI values in the Shaanxi-Gansu-Ningxia region over the past 15 years since the inception of the GFG program. We analyzed the impacts of climatic warming and human activities on vegetation growth. The main conclusions of our study are as follows:
From 2000 to 2014, NDVI values in the Shaanxi-Gansu-Ningxia region showed an evident increase at the rate of 0.0117 year−1. This rate exceeded the average rate of increase in the Three-North Shelter Forest (0.0007 year−1) observed over a 24-year period from 1982 to 2006. It also exceeded the average rate of increase of NDVI in the upper reaches of the Yellow River (0.0023 year−1), in the Qinling–Daba Mountains (0.0030 year−1) and in the Three-River Headwater region (0.0001 year−1).
There was a significant increase in vegetation greenness within the Shaanxi-Gansu-Ningxia region from 2000 to 2014. The green vegetation belt has evidently been expanding, annually, extending further toward the northwest, while areas with low levels of vegetation restoration have gradually shrunk. The NDVI trend and fluctuation characteristics of this region indicate positive outcomes for vegetation restoration and the gradual stabilization of vegetation improvement after 15 years of implementing ecological engineering projects.
From 2000 to 2014, the regional climate experienced steady temperatures and increasing precipitation that provided favorable climatic conditions for regional vegetation restoration in the Shaanxi-Gansu-Ningxia region. The ongoing implementation of ecological engineering projects like GFG has provided a sustainable basis for ecological restoration in the Shaanxi-Gansu-Ningxia region. However, with the construction of energy production facilities in the northern part of Shaanxi Province, and the exploitation of natural resources, potential challenges facing regional vegetation restoration projects are gradually rising in this region.

5. Future Studies

Several possible areas could be covered by future studies on vegetation cover changes in the Shaanxi-Gansu-Ningxia region. These are described below:
From 2013, the subsidies provided as part of the 15-year-old GFG program, implemented across 25 provinces, were gradually discontinued. Gansu, Inner Mongolia, Guizhou, Hunan, Hubei, Sichuan, Chongqing, and Yunnan Provinces have resubmitted applications to the State Council to recommence the GFG program. Evidently, over the past 15 years, the outcomes of vegetation restoration efforts in the Shaanxi-Gansu-Ningxia region have been remarkable. Moreover, there has been a fundamental reversal of the previous trend of expanding farmland areas through deforestation. During forthcoming phases of the GFG program, certain key questions will need to be considered. These include the following: How can ecological protection and regional economic development be coordinated? How can we ensure that the termination of subsidies does not lead to the possibility of deforestation? Further: how can vegetation restoration be sustained?
A re-examination of ecological services and ecological risks in the Shaanxi-Gansu-Ningxia region is required. As a frontier field and a magnet for geological and ecological research, ecosystem services are the bridge linking natural and human processes [57,58,59]. Vegetation restoration efforts in the Shaanxi-Gansu-Ningxia region over the past 15 years have highlighted some cases for exploring the relationship between ecosystem processes and ecological services in the context of different land-use change patterns, and for integrating and optimizing ecosystem services. Based on these studies, we need to re-examine ecological risks and services and risks entailed in the new features of regional development.
The time-lag response of NDVI to climate factors has attracted considerable attention and emerged as a hot topic in climate change studies [3,60,61,62]. However, few studies have focused on the time-lag response of NDVI to ecological engineering projects. Our study revealed a strong correlation between the area of afforestation and an increase in NDVI values. The change in NDVI depends on the area of planted vegetation, which continues to increase for several years after plantation. Thus, as previous studies have also recognized, there is a time-lag response of NDVI to afforestation activities. We developed a conceptual model to illustrate the response of NDVI to human activities, as shown in Figure 8. However, the response mechanisms of NDVI to vegetation restoration could be very complex and are still largely unknown. A consideration of the time-lag effects of vegetation restoration is important for improving predictions and evaluations of vegetation dynamics in the context of future climate change.
Figure 8. A conceptual model of NDVI responses to human activities.
Remotesensing 07 11163 g008

Supplementary Files

Supplementary File 1

Acknowledgments

This study was supported by the Fund for Creative Research Groups of the National Natural Science Foundation of China (No. 41321001), the 973 Program of the National Basic Research Program of China (2012CB955402) and the State Key Laboratory of Earth Surface Processes and Resource Ecology. The authors are grateful to the anonymous reviewers whose constructive suggestions have greatly improved the quality of this work.

Author Contributions

Shuangshuang Li and Saini Yang designed the research; Shuangshuang Li performed the research; Saini yang supervised the research; Xianfeng Liu, Yanxu Liu and Mimi Shi analyzed the data; Shuangshuang Li and Saini Yang wrote the paper.

Conflicts of Interest

The authors declare no conflict of interest.

References

  1. Root, T.L.; Price, J.T.; Hall, K.R.; Schneider, S.H.; Rosenzweig, C.; Pounds, J.A. Fingerprints of global warming on wild animals and plants. Nature 2003, 421, 57–60. [Google Scholar] [CrossRef] [PubMed]
  2. Krishnaswamy, J.; John, R.; Joseph, S. Consistent response of vegetation dynamics to recent climate change in tropical mountain regions. Global Chang. Biol. 2014, 20, 203–215. [Google Scholar] [CrossRef] [PubMed]
  3. Wu, D.H.; Zhao, X.; Liang, S.L.; Zhou, T.; Huang, K.C.; Tang, B.J.; Zhao, W.Q. Time-lag effects of global vegetation responses to climate change. Global Chang. Biol. 2015. [Google Scholar] [CrossRef] [PubMed]
  4. Hilker, T.; Lyapustin, A.I.; Tucker, C.J.; Hall, F.G.; Myneni, R.B.; Wang, Y.; Bi, J.; de Moura, Y.M.; Sellers, P.J. Vegetation dynamics and rainfall sensitivity of the Amazon. Proc. Natl. Acad. Sci. USA 2014, 111, 16041–16046. [Google Scholar] [CrossRef] [PubMed]
  5. Li, A.; Wu, J.G.; Huang, J.H. Distinguishing between human-induced and climate-driven vegetation changes: A critical application of RESTREND in Inner Mongolia. Landsc. Ecol. 2012, 27, 969–982. [Google Scholar] [CrossRef]
  6. Chen, B.X.; Zhang, X.Z.; Tao, J.; Wu, J.S.; Wang, J.S.; Shi, P.L.; Zhang, Y.J.; Yu, C.Q. The impact of climate change and anthropogenic activities on alpine grassland over the Qinghai–Tibet Plateau. Agric. Forest Meteorol. 2014, 189, 11–18. [Google Scholar] [CrossRef]
  7. Lü, Y.H.; Zhang, L.W.; Feng, X.M.; Zeng, Y.; Fu, B.J.; Yao, X.L.; Li, J.R.; Wu, B.F. Recent ecological transitions in China: Greening, browning, and influential factors. Sci. Rep. 2015. [Google Scholar] [CrossRef] [PubMed]
  8. Nowacki, G.J.; Abrams, M.D. Is climate an important driver of post-European vegetation change in the eastern United States? Global Chang. Biol. 2015, 21, 314–334. [Google Scholar] [CrossRef] [PubMed]
  9. Herrmann, S.M.; Anyamba, A.; Tucker, C.J. Recent trends in vegetation dynamics in the African Sahel and their relationship to climate. Global Environ. Chang. 2005, 15, 394–404. [Google Scholar] [CrossRef]
  10. Piao, S.L.; Mohammat, A.; Fang, J.Y.; Cai, Q.; Feng, J.M. NDVI-based increase in growth of temperate grasslands and its responses to climate changes in China. Global Environ. Chang. 2006, 16, 340–348. [Google Scholar] [CrossRef]
  11. Liu, Y.X.; Wang, Y.L.; Peng, J.; Du, Y.Y.; Liu, X.F.; Li, S.S.; Zhang, D.H. Correlations between urbanization and vegetation degradation across the world’s metropolises using DMSP/OLS nighttime light data. Remote Sens. 2015, 7, 2067–2088. [Google Scholar] [CrossRef]
  12. Miao, L.; Ye, P.; He, B.; Chen, L.; Cui, X. Future climate impact on the desertification in the dry land Asia using AVHRR GIMMS NDVI3g data. Remote Sens. 2015, 7, 3863–3877. [Google Scholar] [CrossRef]
  13. Cai, H.Y.; Yang, X.H.; Wang, K.J.; Xiao, L.L. Is forest restoration in the southwest china karst promoted mainly by climate change or human-induced factors? Remote Sens. 2014, 6, 9895–9910. [Google Scholar] [CrossRef]
  14. Xiao, J.F.; Moody, A. Trends in vegetation activity and their climatic correlates: China 1982 to 1998. Int. J. Remote Sens. 2004, 25, 5669–5689. [Google Scholar] [CrossRef]
  15. Yan, J.P.; Yan, Y. Design and operation channels of the ecological purchase in the Shaanxi-Gansu-Ningxia border area. J. Geogr. Sci. 2002, 57, 343–353. [Google Scholar]
  16. Li, S.S.; Yan, J.P.; Liu, X.Y.; Wan, J. Response of vegetation restoration to climate change and human activities in Shaanxi-Gansu-Ningxia region. J. Geogr. Sci. 2013, 23, 98–112. [Google Scholar] [CrossRef]
  17. Feng, X.M.; Fu, B.J.; Lu, N.; Zeng, Y.; Wu, B.F. How ecological restoration alters ecosystem services: An analysis of carbon sequestration in China’s Loess Plateau. Sci. Rep. 2013. [Google Scholar] [CrossRef] [PubMed]
  18. Yuan, W.P.; Li, X.L.; Liang, S.L.; Cui, X.F.; Dong, W.J.; Liu, S.G.; Xia, J.Z.; Chen, Y.; Liu, D.; Zhu, W.Q. Characterization of locations and extents of afforestation from the Grain for Green Project in China. Remote Sens. Lett. 2014, 5, 221–229. [Google Scholar] [CrossRef]
  19. Zhang, B.Q.; Wu, P.; Zhao, X.N.; Wang, Y.B.; Gao, X.D. Changes in vegetation condition in areas with different gradients (1980–2010) on the Loess Plateau, China. Environ. Earth Sci. 2013, 68, 2427–2438. [Google Scholar] [CrossRef]
  20. Xiao, J.F. Satellite evidence for significant biophysical consequences of the “Grain for Green” Program on the Loess Plateau in China. J. Geophys. Res.: Biogeosci. 2014, 119, 2261–2275. [Google Scholar] [CrossRef]
  21. Fan, X.G.; Ma, Z.G.; Yang, Q.; Han, Y.H.; Mahmood, R.; Zheng, Z.Y. Land use/land cover changes and regional climate over the Loess Plateau during 2001–2009. Part I: Observational evidence. Clim. Chang. 2015, 129, 427–440. [Google Scholar] [CrossRef]
  22. Sun, W.Y.; Song, X.Y.; Mu, X.M.; Gao, P.; Wang, F.; Zhao, G.J. Spatiotemporal vegetation cover variations associated with climate change and ecological restoration in the Loess Plateau. Agric. Forest Meteorol. 2015, 209–210, 87–99. [Google Scholar] [CrossRef]
  23. Roberts, C.; Palmer, M.; McNeall, D.; Collins, M. Quantifying the likelihood of a continued hiatus in global warming. Nat. Clim. Chang. 2015, 5, 337–342. [Google Scholar] [CrossRef]
  24. Li, Q.X.; Yang, S.; Xu, W.H.; Wang, X.L.; Jones, P.; Parker, D.; Zhou, L.M.; Feng, Y.; Gao, Y. China experiences the recent warming hiatus. Geophys. Res. Lett. 2015, 5, 889–898. [Google Scholar] [CrossRef]
  25. Dai, A.G.; Fyfe, J.C.; Xie, S.P.; Dai, X.G. Decadal modulation of global surface temperature by internal climate variability. Nat. Clim. Chang. 2015, 5, 555–559. [Google Scholar] [CrossRef]
  26. Beck, P.S.; Goetz, S.J. Satellite observations of high northern latitude vegetation productivity changes between 1982 and 2008: Ecological variability and regional differences. Environ. Res. Lett. 2011, 6, 045501. [Google Scholar] [CrossRef]
  27. De Jong, R.; Verbesselt, J.; Zeileis, A.; Schaepman, M.E. Shifts in global vegetation activity trends. Remote Sens. 2013, 5, 1117–1133. [Google Scholar] [CrossRef] [Green Version]
  28. Jiang, N.; Zhu, W.Q.; Zheng, Z.T.; Chen, G.S.; Fan, D.Q. A comparative analysis between GIMSS NDVIg and NDVI3g for monitoring vegetation activity change in the Northern Hemisphere during 1982–2008. Remote Sens. 2013, 5, 4031–4044. [Google Scholar] [CrossRef]
  29. Liu, Y.X.; Wu, W.H.; Wen, X.J.; Zhang, D.H. Urban process and its eco-environmental impact in Shanxi-Shaanxi-Inner Mongolia energy area. Geogr. Res. 2012, 32, 2009–2020. [Google Scholar]
  30. Li, N.; Yan, C.Z.; Xie, J.L. Remote sensing monitoring recent rapid increase of coal mining activity of an important energy base in northern China, a case study of Mu Us Sandy Land. Resour. Conserv. Recycl. 2015, 94, 129–135. [Google Scholar] [CrossRef]
  31. E, Y.H.; Shi, Q.; Ma, Y.P.; Guo, J.P.; Xiao, Z.L. The impacts of future climate change on agricultures and eco-environment of Loess Plateau in next decade. Acta Ecol. Sin. 2011, 31, 5542–5552. [Google Scholar]
  32. Gao, Y.; Feng, Q.; Liu, W.; Lu, A.G.; Wang, Y.; Yang, J.; Cheng, A.F.; Wang, Y.M.; Su, Y.B.; Liu, L.; et al. Changes of daily climate extremes in Loess Plateau during 1960–2013. Quat. Int. 2015, 371, 5–21. [Google Scholar]
  33. Li, W.J.; Lu, C.H. Aridity trend and response to vegetation restoration in the loess hilly region of northern Shaanxi province. J. Geogr. Sci. 2015, 25, 289–300. [Google Scholar] [CrossRef]
  34. Myneni, R.B.; Keeling, C.D.; Tucker, C.J.; Asrar, G.; Nemani, R.R. Increased plant growth in the Northern High Latitudes from 1981 to 1991. Nature 1997, 386, 698–702. [Google Scholar] [CrossRef]
  35. Tucker, C.J.; Slayback, D.A.; Pinzon, J.E.; Los, S.O.; Myneni, R.B.; Taylor, M.G. Higher northern latitude normalized difference vegetation index and growing season trends from 1982 to 1999. Int. J. Biometeorol. 2001, 45, 184–190. [Google Scholar] [CrossRef] [PubMed]
  36. Peng, S.S.; Chen, A.P.; Xu, L.; Cao, C.X.; Fang, J.Y.; Myneni, R.B.; Pinzon, J.E.; Tucker, C.J.; Piao, S.L. Recent change of vegetation growth trend in China. Environ. Res. Lett. 2011, 6, 044027. [Google Scholar] [CrossRef]
  37. Bao, G.; Qin, Z.H.; Bao, Y.H.; Zhou, Y.; Li, W.H.; Sanjjav, A. NDVI-based long-term vegetation dynamics and its response to climatic change in the Mongolian Plateau. Remote Sens. 2014, 6, 8337–8358. [Google Scholar] [CrossRef]
  38. Zhang, X.Z. Main models of variations of autumn vegetation greenness in the Mid-Latitude of North Hemisphere in 1982–2011. Sci. Geogr. Sin. 2014, 34, 1226–1232. [Google Scholar]
  39. Chen, B.; Xu, G.; Coops, N.C.; Ciais, P.; Innes, J.L.; Wang, G.Y.; Myneni, R.B.; Wang, T.L.; Krzyzanowski, J.; Li, Q.L. Changes in vegetation photosynthetic activity trends across the Asia-Pacific region over the last three decades. Remote Sens. Environ. 2014, 144, 28–41. [Google Scholar] [CrossRef]
  40. Li, B.; Chen, F.; Qin, Y.; Shirazi, Z. Shifting trends and probability distribution of vegetation conditions over China. Remote Sens. Lett. 2014, 5, 619–626. [Google Scholar] [CrossRef]
  41. Piao, S.L.; Nan, H.J.; Huntingford, C.; Ciais, P.; Friedlingstein, P.; Sitch, S.; Peng, S.S.; Ahlström, A.; Canadell, J.G.; Cong, N. Evidence for a weakening relationship between interannual temperature variability and northern vegetation activity. Nat. Commun. 2014, 5. [Google Scholar] [CrossRef] [PubMed] [Green Version]
  42. Yulin, Government. The Urban Master Plan of Yulin (2006–2020a). Available online: http://www.yl.gov.cn/site/1/html/zwgk/0/1/20/6784.htm (accessed on 1 December 2014).
  43. Kang, H.H. Analysis of Spatial and Temporal Dynamics of Landscape Fragmentation in Yulin. Master’s Thesis, Chang’an University, Xi’an, China, May 2013. [Google Scholar]
  44. Fu, B.J.; Liu, Y.; Lü, Y.H.; He, C.S.; Zeng, Y.; Wu, B.F. Assessing the soil erosion control service of ecosystems change in the Loess Plateau of China. Ecol. Complex 2011, 8, 284–293. [Google Scholar] [CrossRef]
  45. Wang, Q.X.; Fan, X.H.; Qin, Z.D.; Wang, M.B. Change trends of temperature and precipitation in the Loess Plateau region of China, 1961–2010. Global Planet. Chang. 2012, 92, 138–147. [Google Scholar] [CrossRef]
  46. Holben, B.N. Characteristics of maximum-value composite images from temporal AVHRR data. Int. J. Remote Sens. 1986, 7, 1417–1434. [Google Scholar] [CrossRef]
  47. Stow, D.; Daeschner, S.; Hope, A.; Douglas, D.; Petersen, A.; Myneni, R.; Zhou, L.; Oechel, W. Variability of the seasonally integrated normalized difference vegetation index across the north slope of Alaska in the 1990s. Int. J. Remote Sens. 2003, 24, 1111–1117. [Google Scholar] [CrossRef]
  48. Neeti, N.; Eastman, J.R. A contextual Mann-Kendall approach for the assessment of trend significance in image time series. Trans. Gis 2011, 15, 599–611. [Google Scholar] [CrossRef]
  49. Fuller, D.O.; Wang, Y. Recent trends in satellite vegetation index observations indicate decreasing vegetation biomass in the southeastern saline everglades wetlands. Wetlands 2014, 34, 67–77. [Google Scholar] [CrossRef]
  50. Cao, R.; Jiang, W.G.; Yuan, L.H.; Wang, W.J.; Lü, Z.L.; Chen, Z. Inter-annual variations in vegetation and their response to climatic factors in the upper catchments of the Yellow River from 2000 to 2010. J. Geogr. Sci. 2014, 24, 963–979. [Google Scholar] [CrossRef]
  51. Liu, X.F.; Pan, Y.Z.; Zhu, X.F.; Li, S.S. Spatiotemporal variation of vegetation coverage in Qinling-Daba mountains in relation to environmental factors. Acta Geofraphica Sin. 2015, 70, 705–716. [Google Scholar]
  52. Song, Y.; Ma, M.G. Study on vegetation cover change in northwest China based on spot vegetation data. J. Desert Res. 2007, 27, 89–93. [Google Scholar]
  53. Wang, Q.; Zhang, B.; Dai, S.P.; Zou, Y.; Ma, Z.H. Dynamic changes in vegetation coverage in the Three-North Shelter Forest program based on GIMMS AVHRR NDVI. Resour. Sci. 2011, 33, 1613–1620. [Google Scholar]
  54. Liu, X.F.; Zhang, J.S.; Zhu, X.F.; Pan, Y.Z.; Liu, Y.X.; Zhang, D.H.; Lin, Z.H. Spatiotemporal changes in vegetation coverage and its driving factors in the Three-River Headwaters region during 2000–2011. J. Geogr. Sci. 2014, 24, 288–302. [Google Scholar] [CrossRef]
  55. Bai, J.J.; Bai, J.T.; Wang, L. Spatio-temporal change of vegetation NDVI and its relations with regional climate in northern Shaanxi province in 2000–2010. Sci. Geogr. Sin. 2014, 34, 882–888. [Google Scholar]
  56. Li, W.J.; Lu, C.H. Effects of ecological building on the vegetation change in northern Shaanxi province. Arid Land Geogr. 2014, 37, 318–324. [Google Scholar]
  57. Dallimer, M.; Davies, Z.G.; Diaz-Porras, D.F.; Irvine, K.N.; Maltby, L.; Warren, P.H.; Armsworth, P.R.; Gaston, K.J. Historical influences on the current provision of multiple ecosystem services. Global Environ. Chang. 2015, 31, 307–317. [Google Scholar] [CrossRef]
  58. Petz, K.; Alkemade, R.; Bakkenes, M.; Schulp, C.J.; van der Velde, M.; Leemans, R. Mapping and modelling trade-offs and synergies between grazing intensity and ecosystem services in rangelands using global-scale datasets and models. Global Environ. Chang. 2014, 29, 223–234. [Google Scholar] [CrossRef]
  59. Fu, B.J.; Zhang, L.W. Land-use change and ecosystem services: Concepts, methods and progress. Prog. Geogr. 2014, 33, 441–446. [Google Scholar]
  60. Zhou, Y.; Zhang, L.; Fensholt, R.; Wang, K.; Vitkovskaya, I.; Tian, F. Climate contributions to vegetation variations in central Asian drylands: Pre- and post-USSR collapse. Remote Sens. 2015, 7, 2449–2470. [Google Scholar] [CrossRef]
  61. Zhong, L.; Ma, Y.M.; Salama, M.S.; Su, Z.B. Assessment of vegetation dynamics and their response to variations in precipitation and temperature in the Tibetan Plateau. Clim. Chang. 2010, 103, 519–535. [Google Scholar] [CrossRef]
  62. Liang, W.; Yang, Y.T.; Fan, D.M.; Guan, H.D.; Zhang, T.; Long, D.; Zhou, Y.; Bai, D. Analysis of spatial and temporal patterns of net primary production and their climate controls in China from 1982 to 2010. Agric. Forest Meteorol. 2015, 204, 22–36. [Google Scholar] [CrossRef]

