
Dynamic Response of Satellite-Derived Vegetation Growth to Climate Change in the Three North Shelter Forest Region in China

Abstract
:
1. Introduction
2. Data and Methods
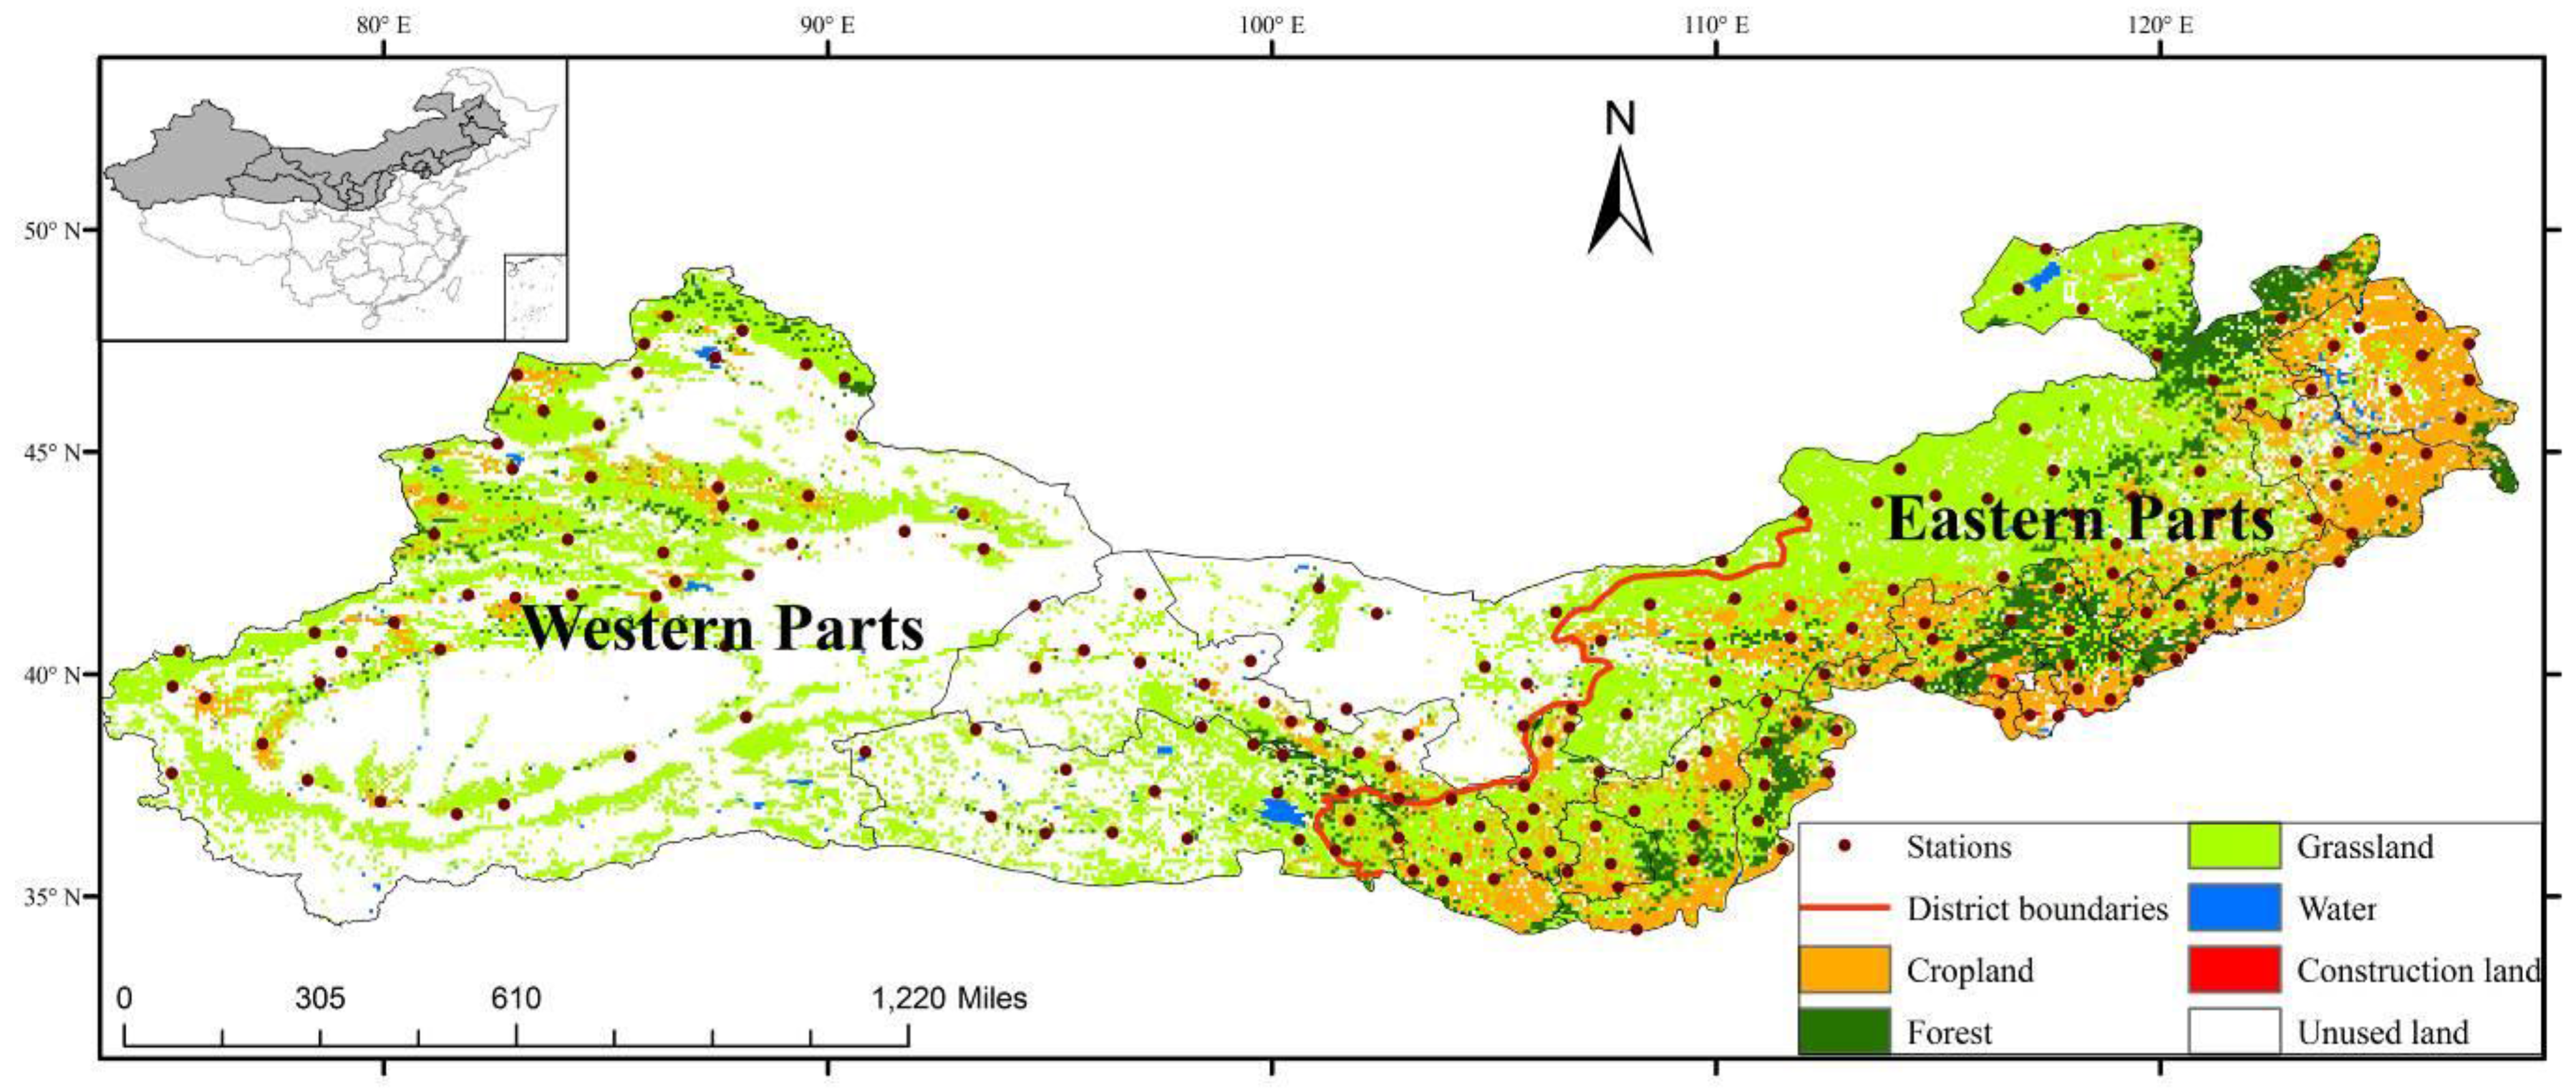
2.1. Study Area
2.2. Datasets
2.3. Methods
3. Results
3.1. Vegetation Change from 1982 to 2011
3.1.1. Spatial Patterns of Growing-Season NDVI
3.1.2. Vegetation Change by Land-Cover Type

3.1.3. Variations in Bare and Sparsely Vegetated Areas
3.2. Climate Change and its Relationship with Vegetation Growth
3.2.1. Climate Change

3.2.2. Influence of Climate Change on Vegetation

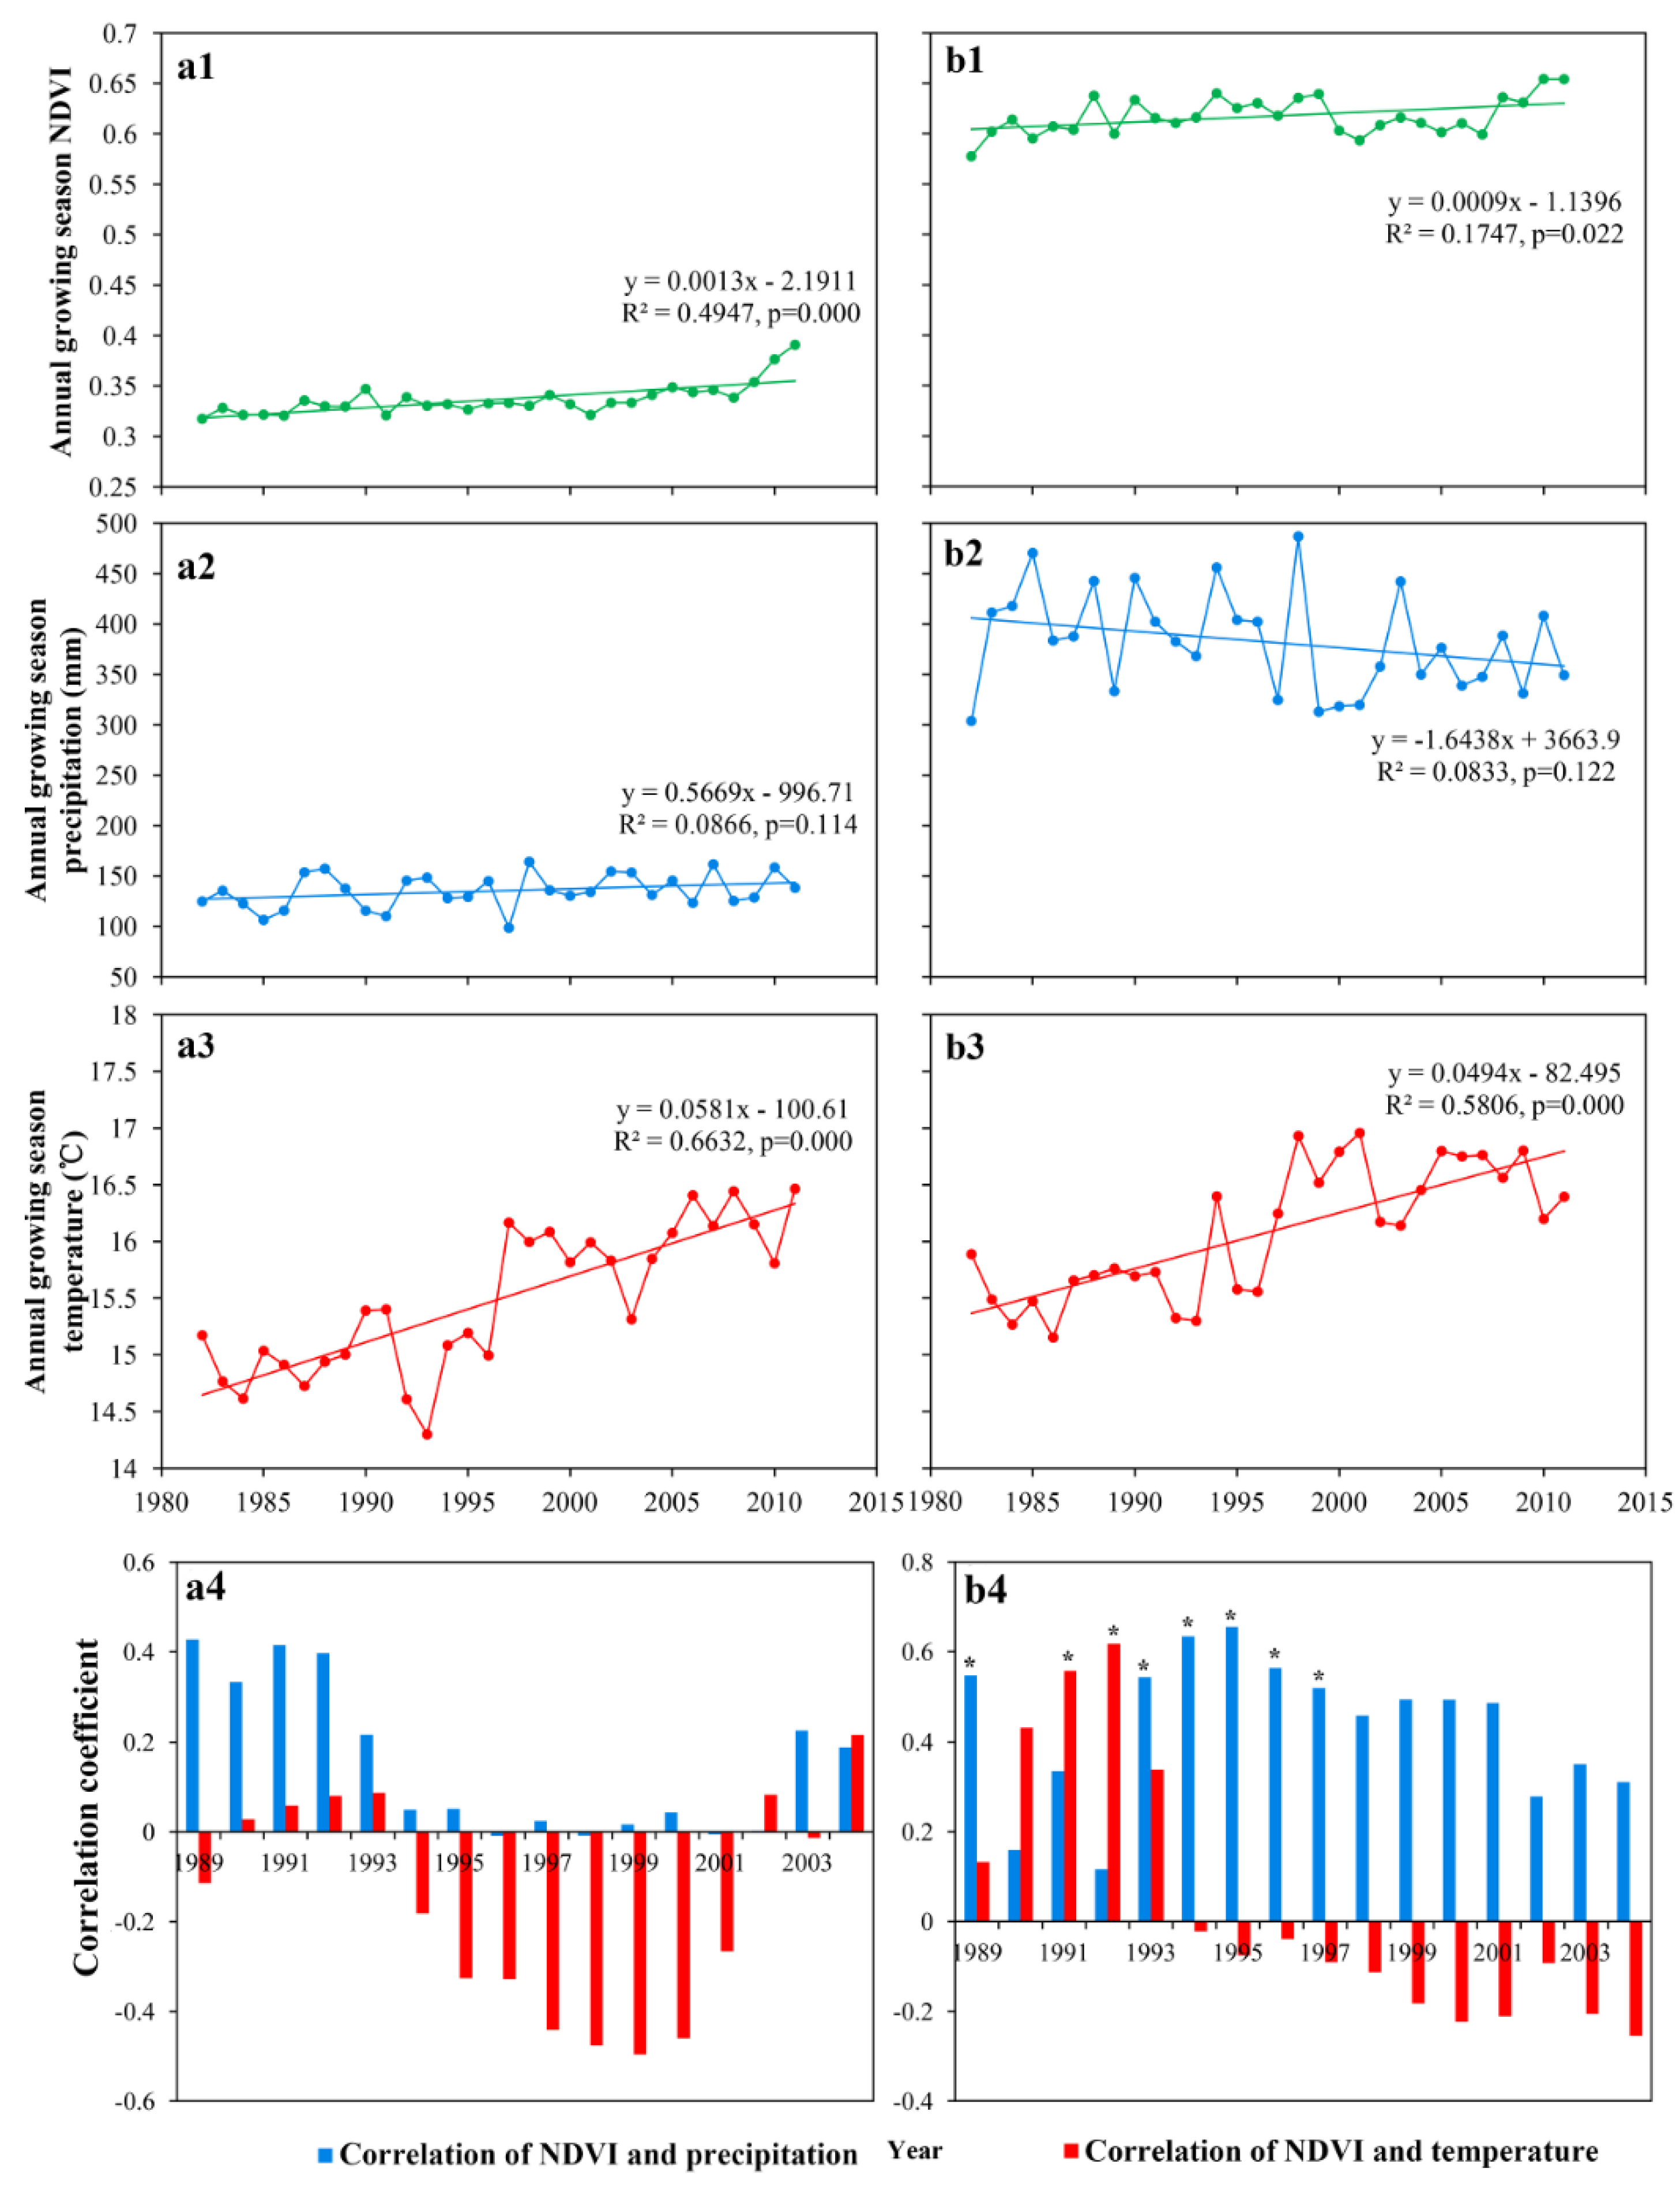
3.2.3. Vegetation Growth and Its Relationship with Climate Change in Sub-Regions
4. Discussion
5. Conclusions
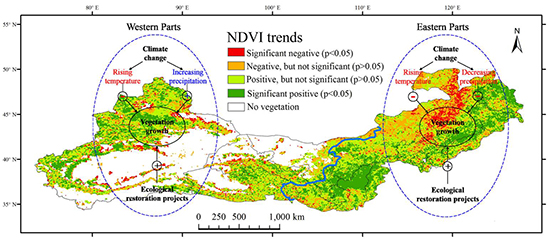
- From 1982 to 2011, 23.1% of the vegetated area in the study region had a significant decrease in vegetation cover, which was higher than that having a significant increase (21.8%).
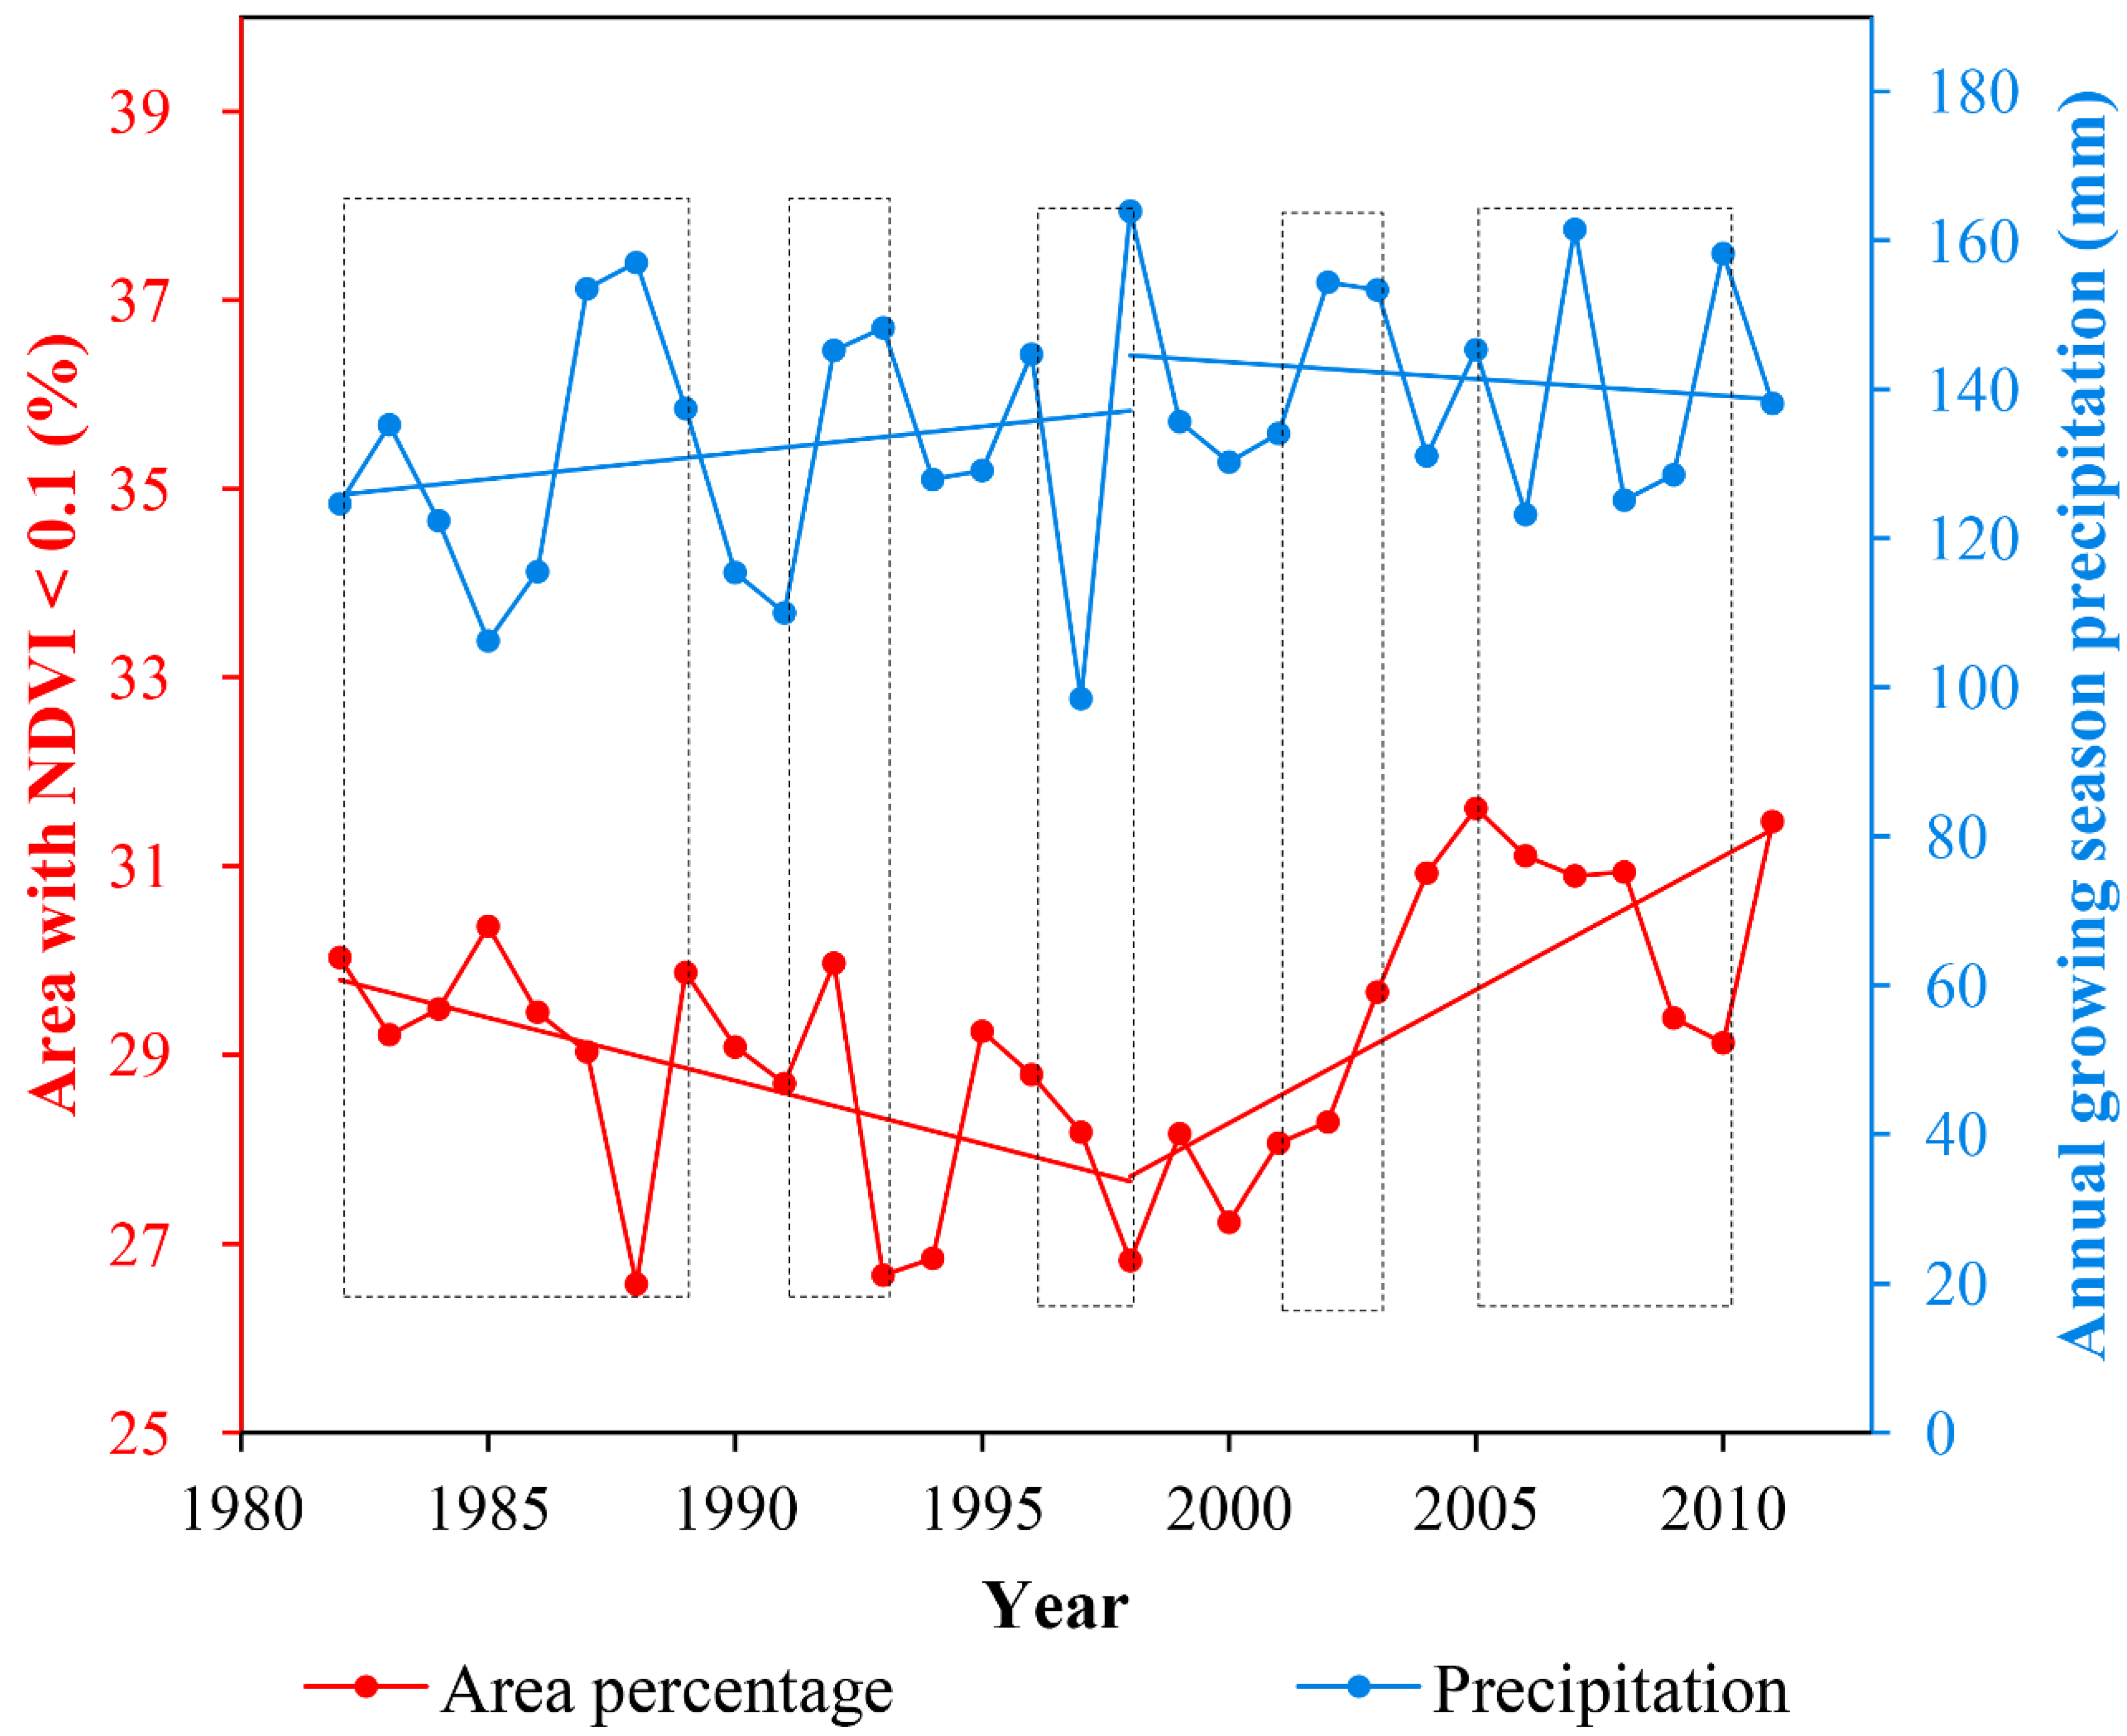
- The bare and sparsely vegetated areas increased from 30% of the total study area in 1982 to 31.5% in 2011.
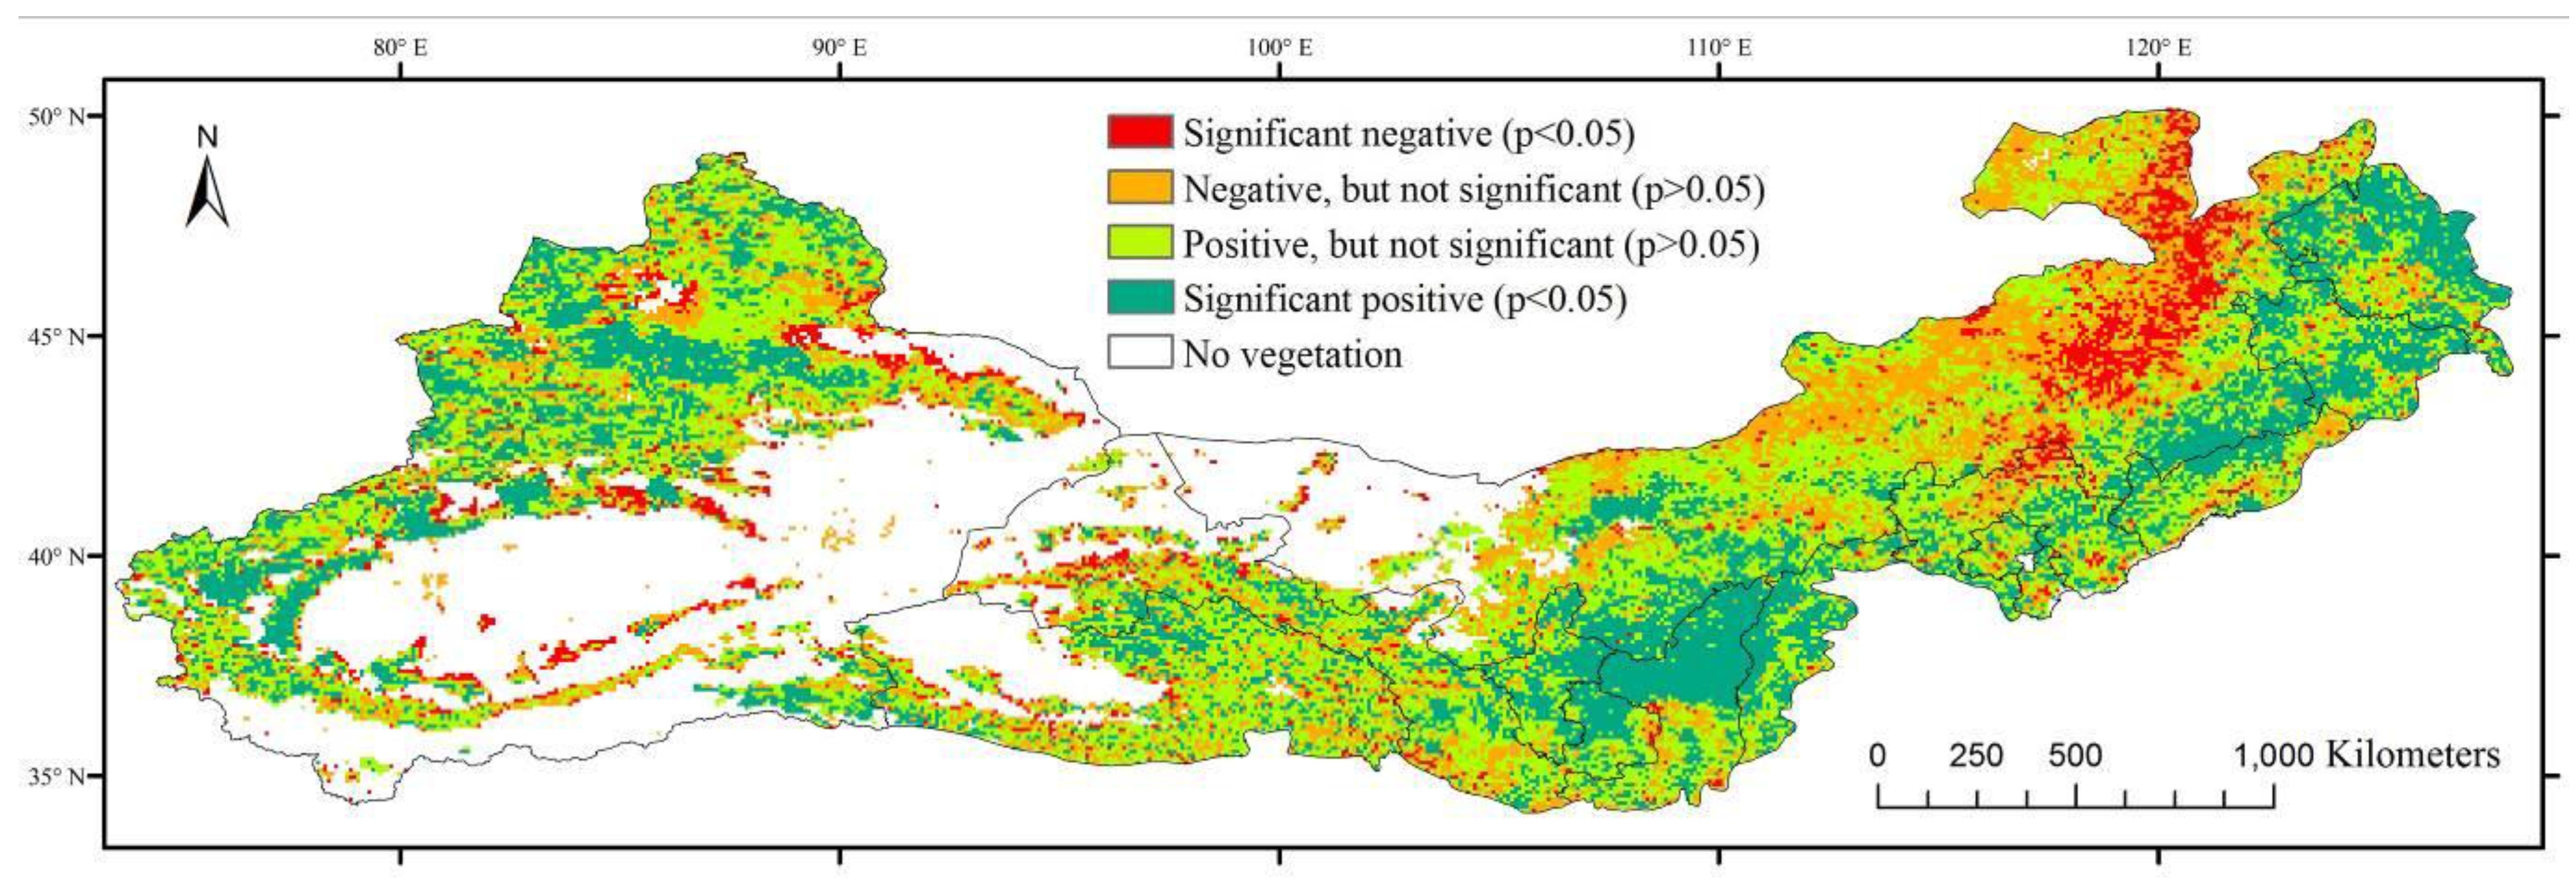
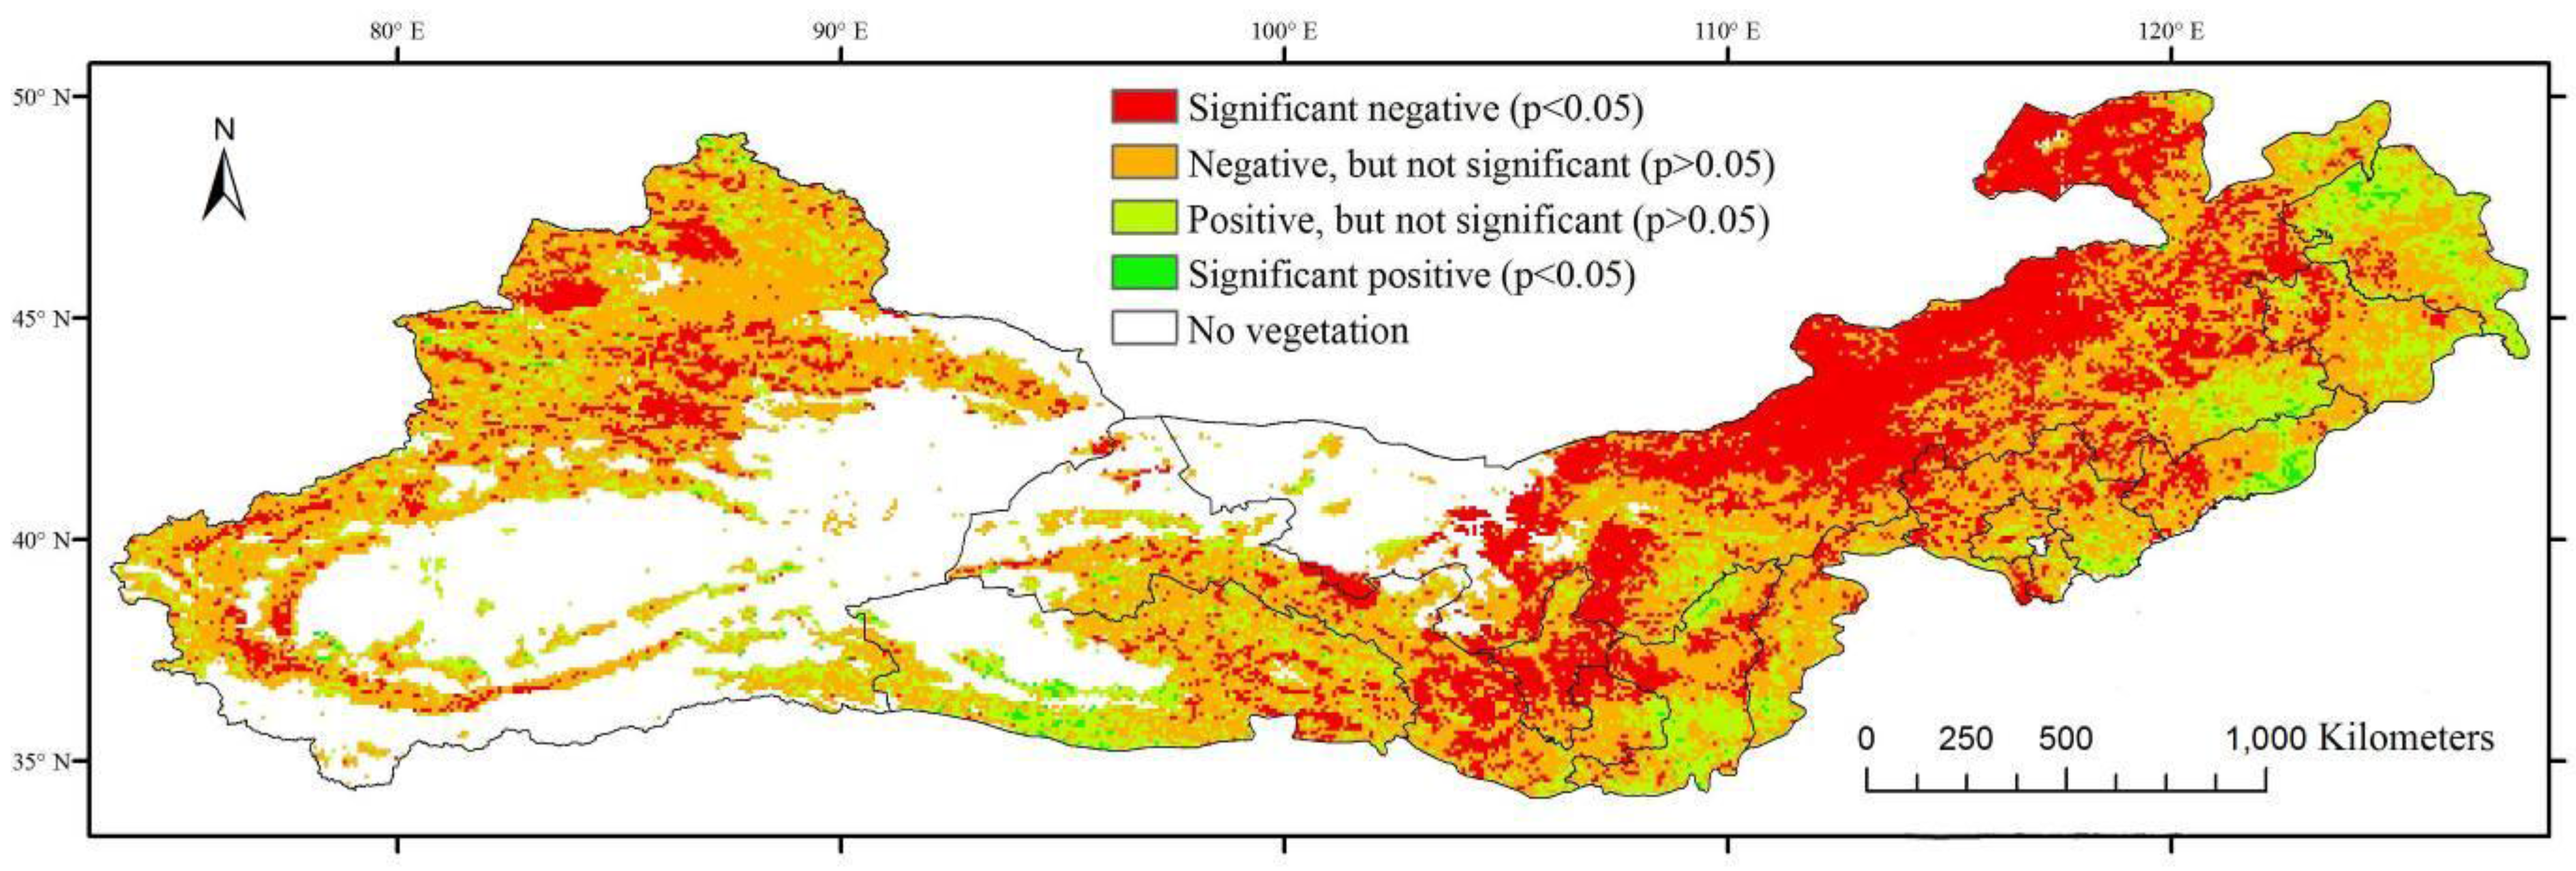
- Generally, growing-season NDVI responded positively to precipitation but negatively to temperature. Climate change ultimately influences vegetation growth by controlling the availability of soil moisture.
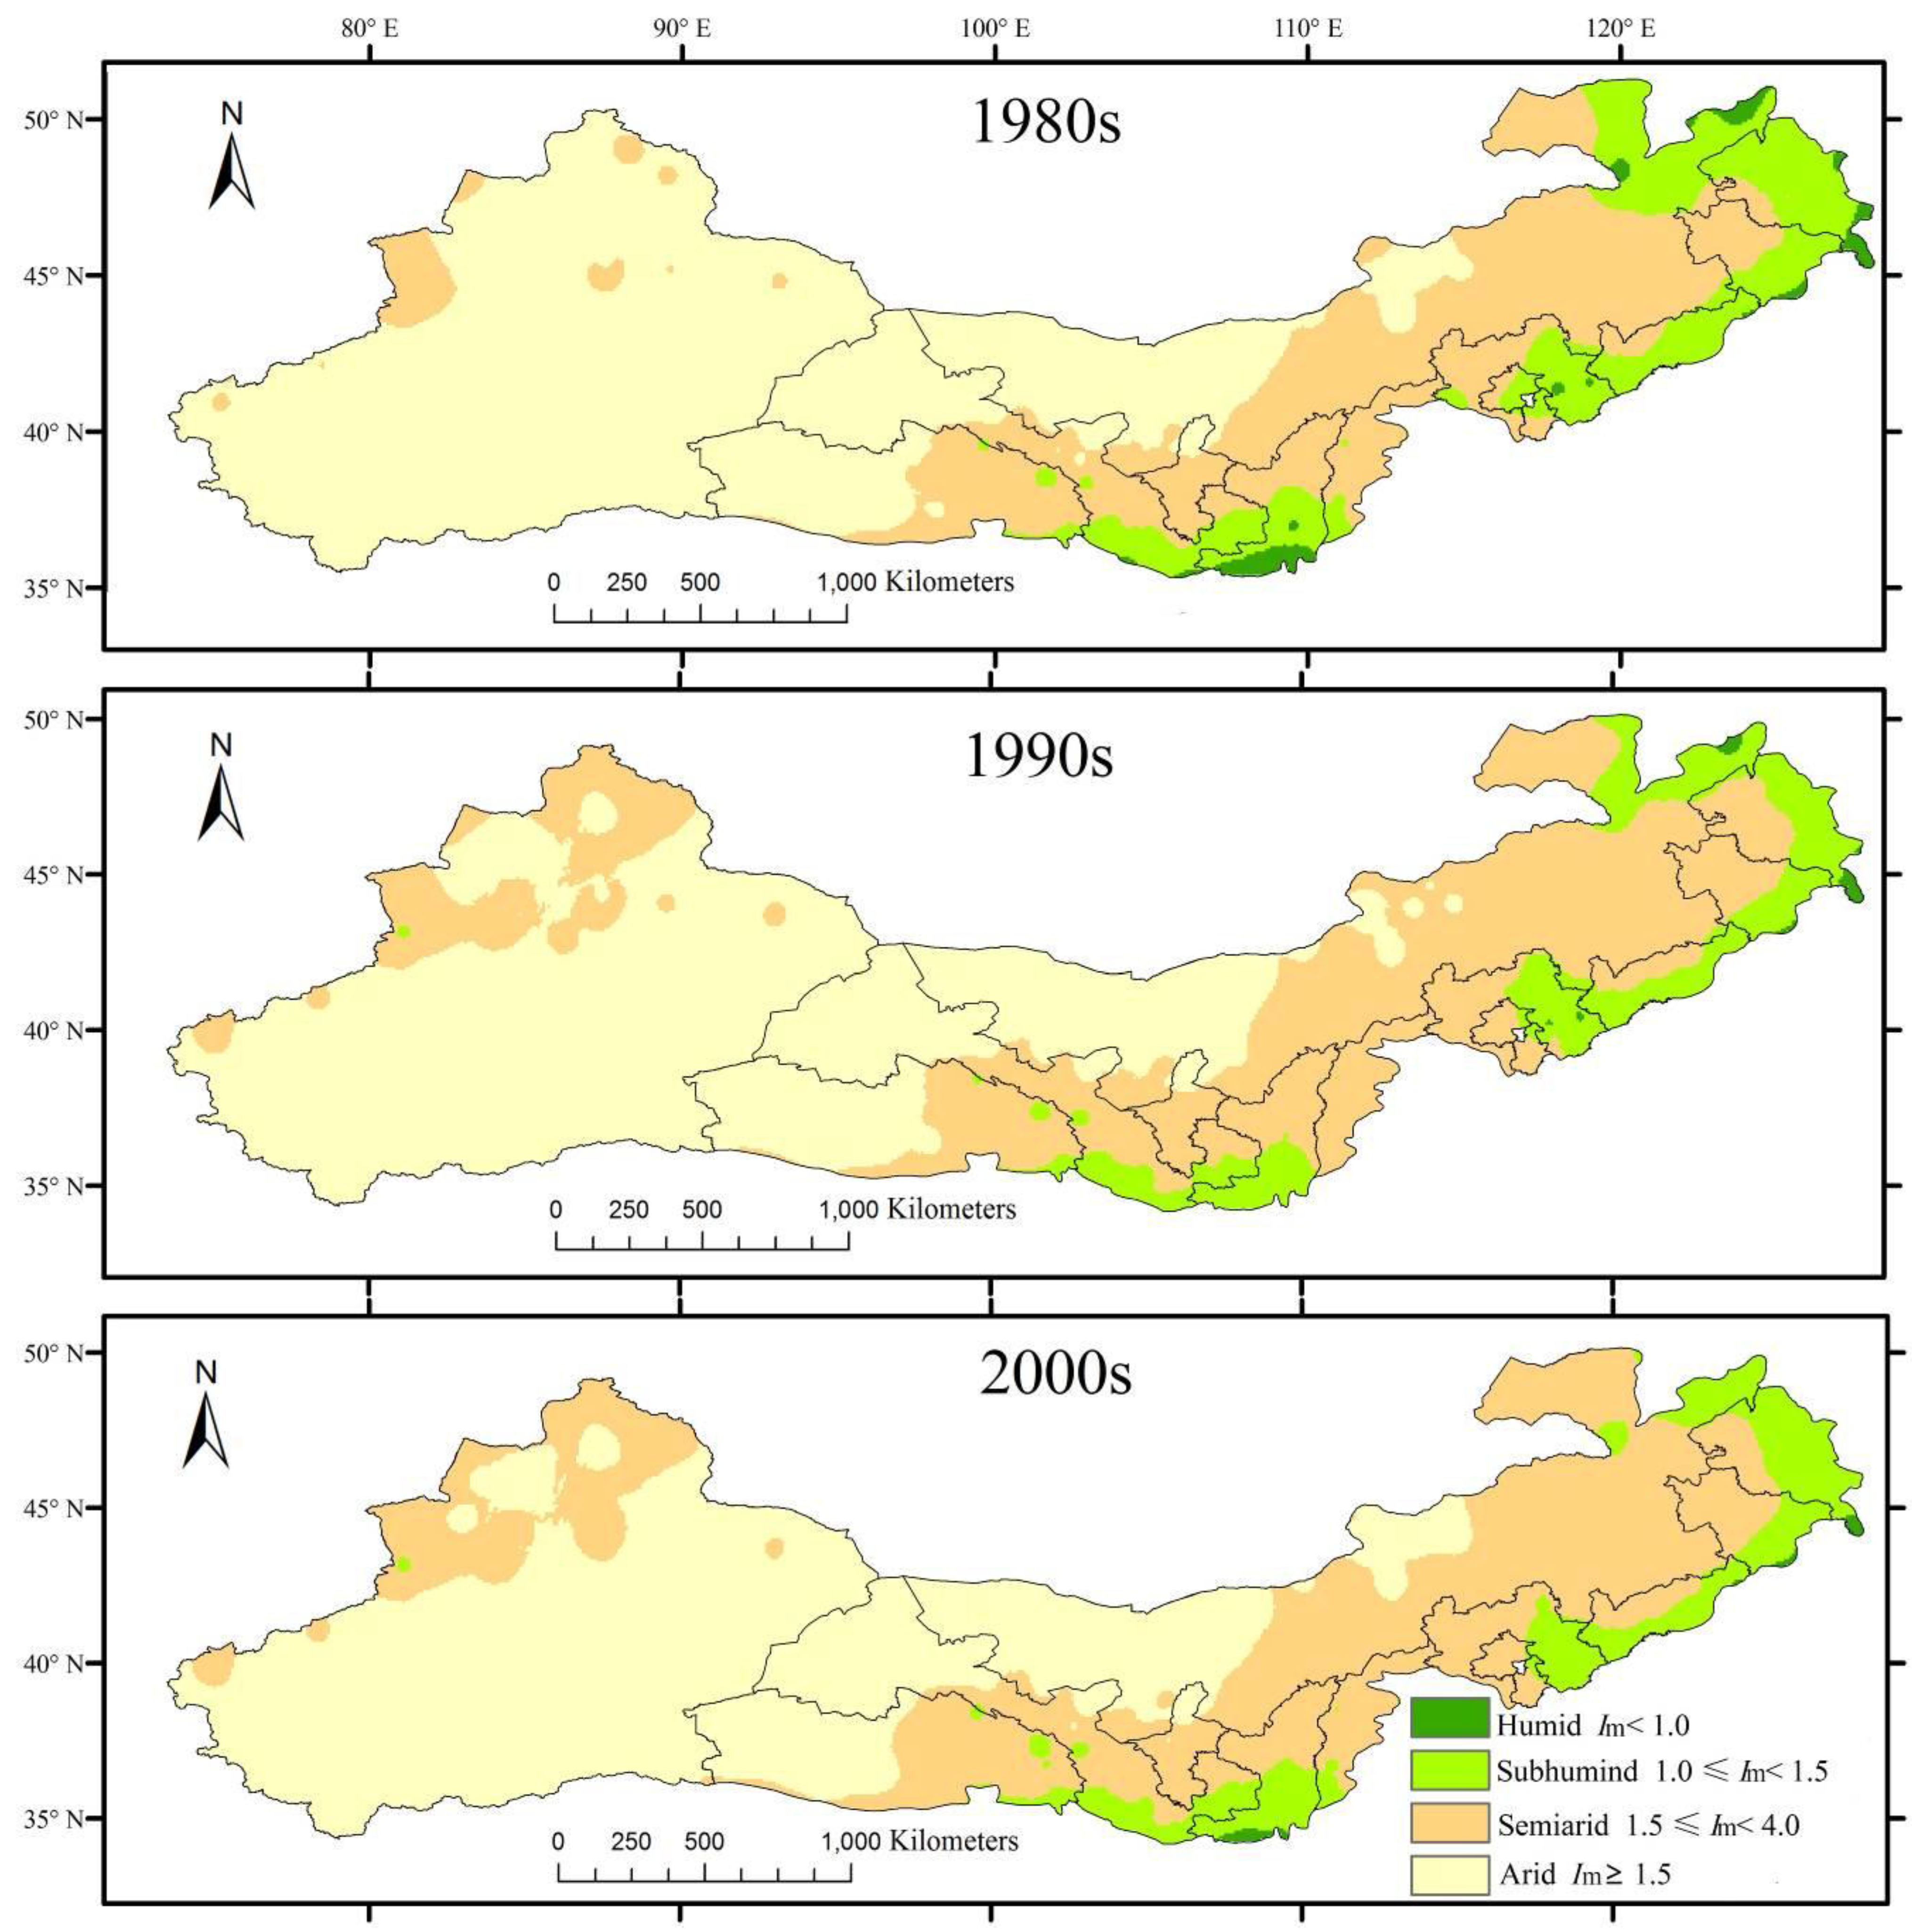
- The arid region reduced from 57.4% of the total study area in 1980s to 51.82% in the 2000s, mainly caused by a warm–wet climate trend in the western study region; and the humid region shrunk from 1.2% in 1980s to 0.26% in 2000s, mainly due to a warm–dry climate trend in the eastern study region.
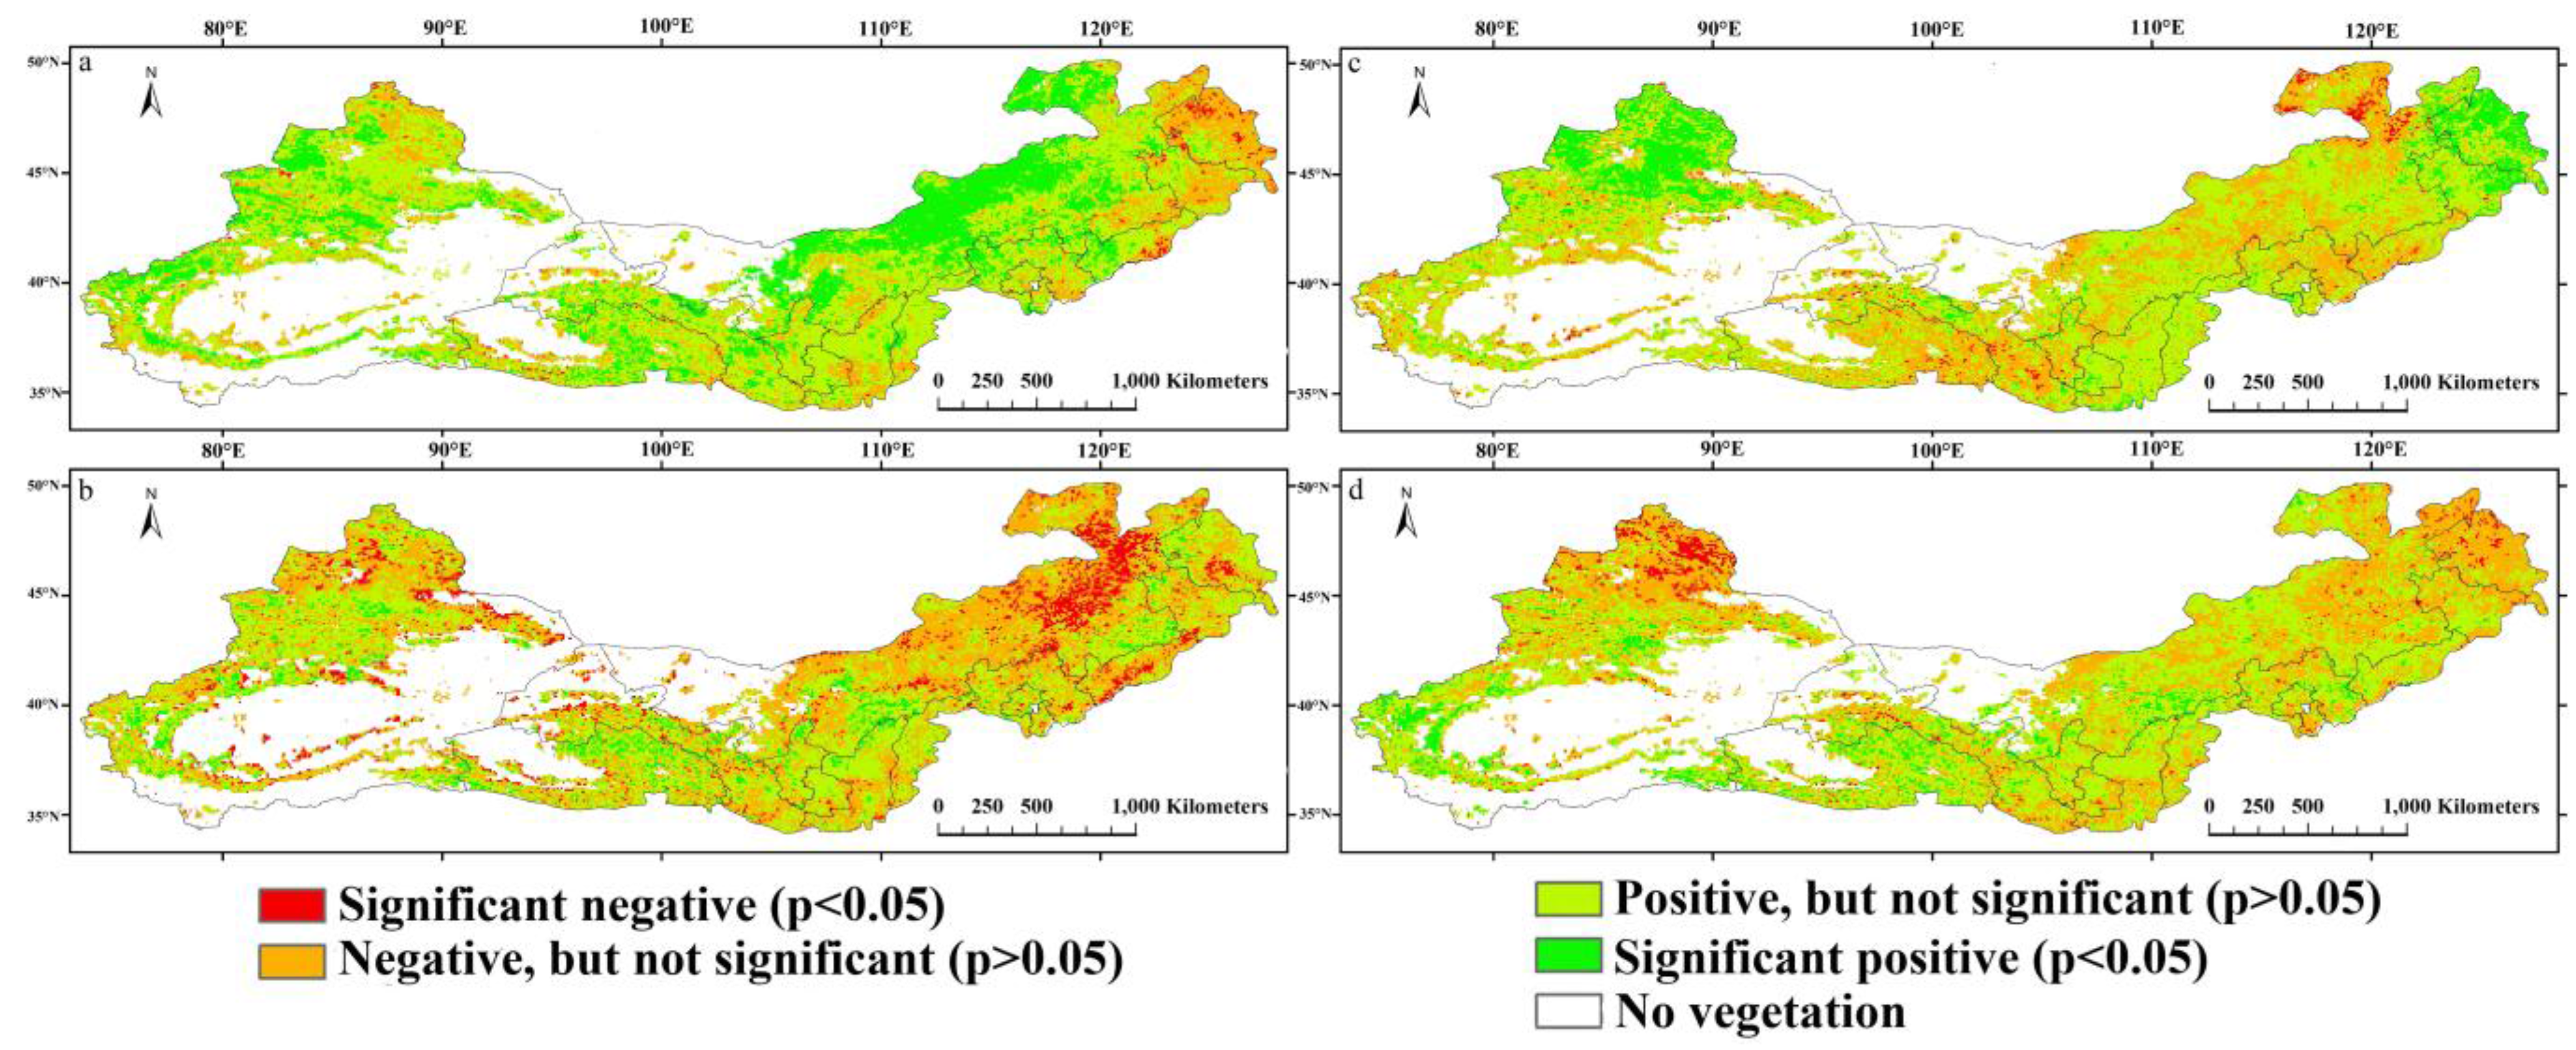
- A reduced positive relationship between precipitation and NDVI was observed in both the western and eastern regions over different time intervals; a change from a positive to negative relationship between temperature and NDVI was found in the eastern region, whereas the reverse trend occurred in the western region.
Supplementary Files
Supplementary File 1Acknowledgements
Author Contributions
Conflicts of Interest
References
- Cao, S. Why large-scale afforestation efforts in China have failed to solve the desertification problem. Environ. Sci. Technol. 2008, 42, 1826–1831. [Google Scholar] [CrossRef] [PubMed]
- Wu, Z.; Wu, J.; Liu, J.; He, B.; Lei, T.; Wang, Q. Increasing terrestrial vegetation activity of ecological restoration program in the Beijing–Tianjin sand source region of China. Ecol. Eng. 2013, 52, 37–50. [Google Scholar] [CrossRef]
- Liu, J.; Li, S.; Ouyang, Z.; Tam, C.; Chen, X. Ecological and socioeconomic effects of China’s policies for ecosystem services. Proc. Natl. Acad. Sci. USA 2008, 105, 9477–9482. [Google Scholar] [CrossRef] [PubMed]
- Wang, Y.; Cao, S. Carbon sequestration may have negative impacts on ecosystem health. Environ. Sci. Technol. 2011, 45, 1759–1760. [Google Scholar] [CrossRef] [PubMed]
- Cao, S.; Sun, G.; Zhang, Z.; Chen, L.; Feng, Q.; Fu, B.; McNulty, S.; Shankman, D.; Tang, J.; Wang, Y. Greening China naturally. AMBIO 2011, 40, 828–831. [Google Scholar] [CrossRef] [PubMed]
- Qu, J.; Cao, S.; Li, G.; Niu, Q.; Feng, Q. Conservation of natural and cultural heritage in Dunhuang, China. Gondwana Res. 2014, 26, 1216–1221. [Google Scholar] [CrossRef]
- Piao, S.; Fang, J.; Liu, H.; Zhu, B. NDVI-indicated decline in desertification in China in the past two decades. Geophys. Res. Lett. 2005, 32. [Google Scholar] [CrossRef]
- Zhang, G.; Dong, J.; Xiao, X.; Hu, Z.; Sheldon, S. Effectiveness of ecological restoration projects in Horqin sandy land, China based on SPOT-VGT NDVI data. Ecol. Eng. 2012, 38, 20–29. [Google Scholar] [CrossRef]
- Cao, S.; Wang, G.; Chen, L. Questionable value of planting thirsty trees in dry regions. Nature 2010, 465, 31. [Google Scholar] [CrossRef] [PubMed]
- Wang, X.; Zhang, C.; Hasi, E.; Dong, Z. Has the three norths forest shelterbelt program solved the desertification and dust storm problems in arid and semiarid China? J. Arid Environ. 2010, 74, 13–22. [Google Scholar] [CrossRef]
- Zhu, L.; Zhu, X.; Yan, Q. Review on the shelter forest decline. Chin. J. Ecol. 2009, 28, 1684r1690. [Google Scholar]
- Amri, R.; Zribi, M.; Lili-Chabaane, Z.; Duchemin, B.; Gruhier, C.; Chehbouni, A. Analysis of vegetation behavior in a North African semi-arid region, using spot-vegetation NDVI data. Remote Sens. 2011, 3, 2568–2590. [Google Scholar] [CrossRef] [Green Version]
- Wan, Z. NDVI anomaly patterns over Africa during the 1997/98 ENSO warm event. Int. J. Remote Sens. 2001, 22, 1847–1859. [Google Scholar]
- Menzel, A.; Sparks, T.H.; Estrella, N.; Koch, E.; Aasa, A.; Ahas, R.; ALM-KÜBLER, K.; Bissolli, P.; Braslavská, O.G.; Briede, A. European phenological response to climate change matches the warming pattern. Glob. Chang. Biol. 2006, 12, 1969–1976. [Google Scholar] [CrossRef]
- Asner, G.P.; Nepstad, D.; Cardinot, G.; Ray, D. Drought stress and carbon uptake in an Amazon forest measured with spaceborne imaging spectroscopy. Proc. Natl. Acad. Sci. USA 2004, 101, 6039–6044. [Google Scholar] [CrossRef] [PubMed]
- Ali, A.; de Bie, C.; Skidmore, A.K.; Scarrott, R.; Hamad, A.; Venus, V.; Lymberakis, P. Mapping land cover gradients through analysis of hyper-temporal NDVI imagery. Int. J. Appl. Earth Obs. Geoinf. 2013, 23, 301–312. [Google Scholar] [CrossRef]
- Fang, J.; Piao, S.; He, J.; Ma, W. Increasing terrestrial vegetation activity in China, 1982–1999. Sci. China Ser. C Life Sci. 2004, 47, 229–240. [Google Scholar]
- Duan, H.; Yan, C.; Tsunekawa, A.; Song, X.; Li, S.; Xie, J. Assessing vegetation dynamics in the Three-North Shelter Forest Region of China using AVHRR NDVI data. Environ. Earth Sci. 2011, 64, 1011–1020. [Google Scholar] [CrossRef]
- Peng, S.; Chen, A.; Xu, L.; Cao, C.; Fang, J.; Myneni, R.B.; Pinzon, J.E.; Tucker, C.J.; Piao, S. Recent change of vegetation growth trend in China. Environ. Res. Lett. 2011, 6, 044027. [Google Scholar] [CrossRef]
- Chuai, X.; Huang, X.; Wang, W.; Bao, G. NDVI, temperature and precipitation changes and their relationships with different vegetation types during 1998–2007 in Inner Mongolia, China. Int. J. Climatol. 2013, 33, 1696–1706. [Google Scholar] [CrossRef]
- Guo, L.; Wu, S.; Zhao, D.; Yin, Y.; Leng, G.; Zhang, Q. NDVI-based vegetation change in Inner Mongolia from 1982 to 2006 and its relationship to climate at the biome scale. Adv. Meteorol. 2014, 2014. [Google Scholar] [CrossRef]
- Tucker, C.J.; Pinzon, J.E.; Brown, M.E.; Slayback, D.A.; Pak, E.W.; Mahoney, R.; Vermote, E.F.; El Saleous, N. An extended AVHRR 8-km NDVI dataset compatible with MODIS and SPOT vegetation NDVI data. Int. J. Remote Sens. 2005, 26, 4485–4498. [Google Scholar] [CrossRef]
- Jiang, N.; Zhu, W.; Zheng, Z.; Chen, G.; Fan, D. A comparative analysis between gimss NDVIg and NDVI3g for monitoring vegetation activity change in the Northern Hemisphere during 1982–2008. Remote Sens. 2013, 5, 4031–4044. [Google Scholar] [CrossRef]
- Wang, J.; Dong, J.; Liu, J.; Huang, M.; Li, G.; Running, S.W.; Smith, W.K.; Harris, W.; Saigusa, N.; Kondo, H. Comparison of gross primary productivity derived from GIMMS NDVI3g, GIMMS, and MODIS in Southeast Asia. Remote Sens. 2014, 6, 2108–2133. [Google Scholar] [CrossRef]
- Miao, L.; Ye, P.; He, B.; Chen, L.; Cui, X. Future climate impact on the desertification in the dry land asia using AVHRR GIMMS NDVI3g data. Remote Sens. 2015, 7, 3863–3877. [Google Scholar] [CrossRef]
- Holben, B.N. Characteristics of maximum-value composite images from temporal AVHRR data. Int. J. Remote Sens. 1986, 7, 1417–1434. [Google Scholar] [CrossRef]
- Cressie, N. Statistics for Spatial Data; John Wiley & Sons: Hoboken, NJ, USA, 1991. [Google Scholar]
- Oliver, M.A.; Webster, R. Kriging: A method of interpolation for geographical information systems. Int. J. Geogr. Inf. Syst. 1990, 4, 313–332. [Google Scholar] [CrossRef]
- Hou, X. Vegetation atlas of China. In Chinese Academy of Science, The Editorial Board of Vegetation Map of China; Scientific Press: Beijing, China, 2001. [Google Scholar]
- Sen, P.K. Estimates of the regression coefficient based on kendall's tau. J. Am. Stat. Assoc. 1968, 63, 1379–1389. [Google Scholar] [CrossRef]
- Helsel, D.R.; Hirsch, R.M. Statistical Methods in Water Resources; Elsevier: Amsterdam, The Netherlands, 1992; Volume 49. [Google Scholar]
- Kundzewicz, Z.W.; Robson, A.J. Change detection in hydrological records—A review of the methodology. Hydrol. Sci. J. 2004, 49, 7–19. [Google Scholar] [CrossRef]
- Krishnaswamy, J.; John, R.; Joseph, S. Consistent response of vegetation dynamics to recent climate change in tropical mountain regions. Glob. Chang. Biol. 2014, 20, 203–215. [Google Scholar] [CrossRef] [PubMed]
- Gocic, M.; Trajkovic, S. Analysis of changes in meteorological variables using Mann-Kendall and Sen’s slope estimator statistical tests in Serbia. Glob. Planet. Chang. 2013, 100, 172–182. [Google Scholar] [CrossRef]
- Penman, H.L. Natural evaporation from open water, bare soil and grass. Proc. R. Soc. Lon. Ser. A. Math. Phys. Sci. 1948, 193, 120–145. [Google Scholar] [CrossRef]
- Meng, M.; Ni, J.; Zhang, Z. Aridity index and its applications in geo-ecological study. Acta Phytoecol. Sin. 2004, 28, 853–861. [Google Scholar]
- Wu, S.; Yin, Y.; Zheng, D.; Yang, Q. Moisture conditions and climate trends in China during the period 1971–2000. Int. J. Climatol. 2006, 26, 193–206. [Google Scholar] [CrossRef]
- Shi, Y.; Shen, Y.; Kang, E.; Li, D.; Ding, Y.; Zhang, G.; Hu, R. Recent and future climate change in Northwest China. Clim. Chang. 2007, 80, 379–393. [Google Scholar] [CrossRef]
- Qian, W.; Lin, X. Regional trends in recent precipitation indices in China. Meteorol. Atmos. Phys. 2005, 90, 193–207. [Google Scholar] [CrossRef]
- Tabari, H.; Hosseinzadeh Talaee, P. Moisture index for Iran: Spatial and temporal analyses. Glob. Planet. Chang. 2013, 100, 11–19. [Google Scholar] [CrossRef]
- Piao, S.; Mohammat, A.; Fang, J.; Cai, Q.; Feng, J. NDVI-based increase in growth of temperate grasslands and its responses to climate changes in China. Glob. Environ. Chang. 2006, 16, 340–348. [Google Scholar] [CrossRef]
- Peng, S.; Piao, S.; Ciais, P.; Myneni, R.B.; Chen, A.; Chevallier, F.; Dolman, A.J.; Janssens, I.A.; Penuelas, J.; Zhang, G. Asymmetric effects of daytime and night-time warming on Northern Hemisphere vegetation. Nature 2013, 501, 88–92. [Google Scholar] [CrossRef] [PubMed]
- Nemani, R.R.; Keeling, C.D.; Hashimoto, H.; Jolly, W.M.; Piper, S.C.; Tucker, C.J.; Myneni, R.B.; Running, S.W. Climate-driven increases in global terrestrial net primary production from 1982 to 1999. Science 2003, 300, 1560–1563. [Google Scholar] [CrossRef] [PubMed]
- Zhao, X.; Tan, K.; Zhao, S.; Fang, J. Changing climate affects vegetation growth in the arid region of the Northwestern China. J. Arid Environ. 2011, 75, 946–952. [Google Scholar] [CrossRef]
- Cao, S.; Chen, L.; Shankman, D.; Wang, C.; Wang, X.; Zhang, H. Excessive reliance on afforestation in China’s arid and semi-arid regions: Lessons in ecological restoration. Earth Sci. Rev. 2011, 104, 240–245. [Google Scholar] [CrossRef]
- Wu, Y.; Zeng, Y.; Wu, B.; Li, X.; Wu, W. Retrieval and analysis of vegetation cover in the Three-North Regions of China based on MODIS data. Chin. J. Ecol. 2009, 28, 1712–1718. [Google Scholar]
- Chen, T.; de Jeu, R.; Liu, Y.; van der Werf, G.; Dolman, A. Using satellite based soil moisture to quantify the water driven variability in NDVI: A case study over mainland Australia. Remote Sens. Environ. 2014, 140, 330–338. [Google Scholar] [CrossRef]
- Ibrahim, Y.Z.; Balzter, H.; Kaduk, J.; Tucker, C.J. Land degradation assessment using residual trend analysis of GIMMS NDVI3g, soil moisture and rainfall in Sub-Saharan west Africa from 1982 to 2012. Remote Sens. 2015, 7, 5471–5494. [Google Scholar] [CrossRef]
- Cao, S.; Ma, H.; Yuan, W.; Wang, X. Interaction of ecological and social factors affects vegetation recovery in China. Biol. Conserv. 2014, 180, 270–277. [Google Scholar] [CrossRef]
- Wang, Y.; Zhang, Q.; He, K.; Zhang, Q.; Chai, L. Sulfate-nitrate-ammonium aerosols over China: Response to 2000–2015 emission changes of sulfur dioxide, nitrogen oxides, and ammonia. Atmos. Chem. Phys. 2013, 13, 2635–2652. [Google Scholar] [CrossRef]
- Barriopedro, D.; Gouveia, C.M.; Trigo, R.M.; Wang, L. The 2009/10 drought in China: Possible causes and impacts on vegetation. J. Hydrometeorol. 2012, 13, 1251–1267. [Google Scholar] [CrossRef]
- Xu, X.; Piao, S.; Wang, X.; Chen, A.; Ciais, P.; Myneni, R.B. Spatio-temporal patterns of the area experiencing negative vegetation growth anomalies in China over the last three decades. Environ. Res. Lett. 2012, 7, 035701. [Google Scholar] [CrossRef]
- Ke, L.; Da-Bang, J.; Jian-Yong, M. Drought over China in the 21st century: Results of REGCM3. Atmos. Ocean. Sci. Lett. 2012, 5, 509–513. [Google Scholar]
- Wang, L.; Chen, W. A CMIP5 multimodel projection of future temperature, precipitation, and climatological drought in China. Int. J. Climatol. 2014, 34, 2059–2078. [Google Scholar] [CrossRef]
- Peng, S.-S.; Piao, S.; Zeng, Z.; Ciais, P.; Zhou, L.; Li, L.Z.; Myneni, R.B.; Yin, Y.; Zeng, H. Afforestation in China cools local land surface temperature. Proc. Natl. Acad. Sci. USA 2014, 111, 2915–2919. [Google Scholar] [CrossRef] [PubMed] [Green Version]
- Govaerts, Y.; Lattanzio, A. Estimation of surface albedo increase during the eighties Sahel drought from Meteosat observations. Glob. Planet. Chang. 2008, 64, 139–145. [Google Scholar] [CrossRef]
- Hijmans, R.J.; Cameron, S.E.; Parra, J.L.; Jones, P.G.; Jarvis, A. Very high resolution interpolated climate surfaces for global land areas. Int. J. Climatol. 2005, 25, 1965–1978. [Google Scholar] [CrossRef]
- Wu, Z.; Dijkstra, P.; Koch, G.W.; Hungate, B.A. Biogeochemical and ecological feedbacks in grassland responses to warming. Nat. Clim. Chang. 2012, 2, 458–461. [Google Scholar] [CrossRef]
© 2015 by the authors; licensee MDPI, Basel, Switzerland. This article is an open access article distributed under the terms and conditions of the Creative Commons Attribution license (http://creativecommons.org/licenses/by/4.0/).
Share and Cite
He, B.; Chen, A.; Wang, H.; Wang, Q. Dynamic Response of Satellite-Derived Vegetation Growth to Climate Change in the Three North Shelter Forest Region in China. Remote Sens. 2015, 7, 9998-10016. https://doi.org/10.3390/rs70809998
He B, Chen A, Wang H, Wang Q. Dynamic Response of Satellite-Derived Vegetation Growth to Climate Change in the Three North Shelter Forest Region in China. Remote Sensing. 2015; 7(8):9998-10016. https://doi.org/10.3390/rs70809998
Chicago/Turabian StyleHe, Bin, Aifang Chen, Honglin Wang, and Qianfeng Wang. 2015. "Dynamic Response of Satellite-Derived Vegetation Growth to Climate Change in the Three North Shelter Forest Region in China" Remote Sensing 7, no. 8: 9998-10016. https://doi.org/10.3390/rs70809998