
Temporal Dependency of Yield and Quality Estimation through Spectral Vegetation Indices in Pear Orchards

 and
and
Abstract
:
1. Introduction
2. Materials and Methods
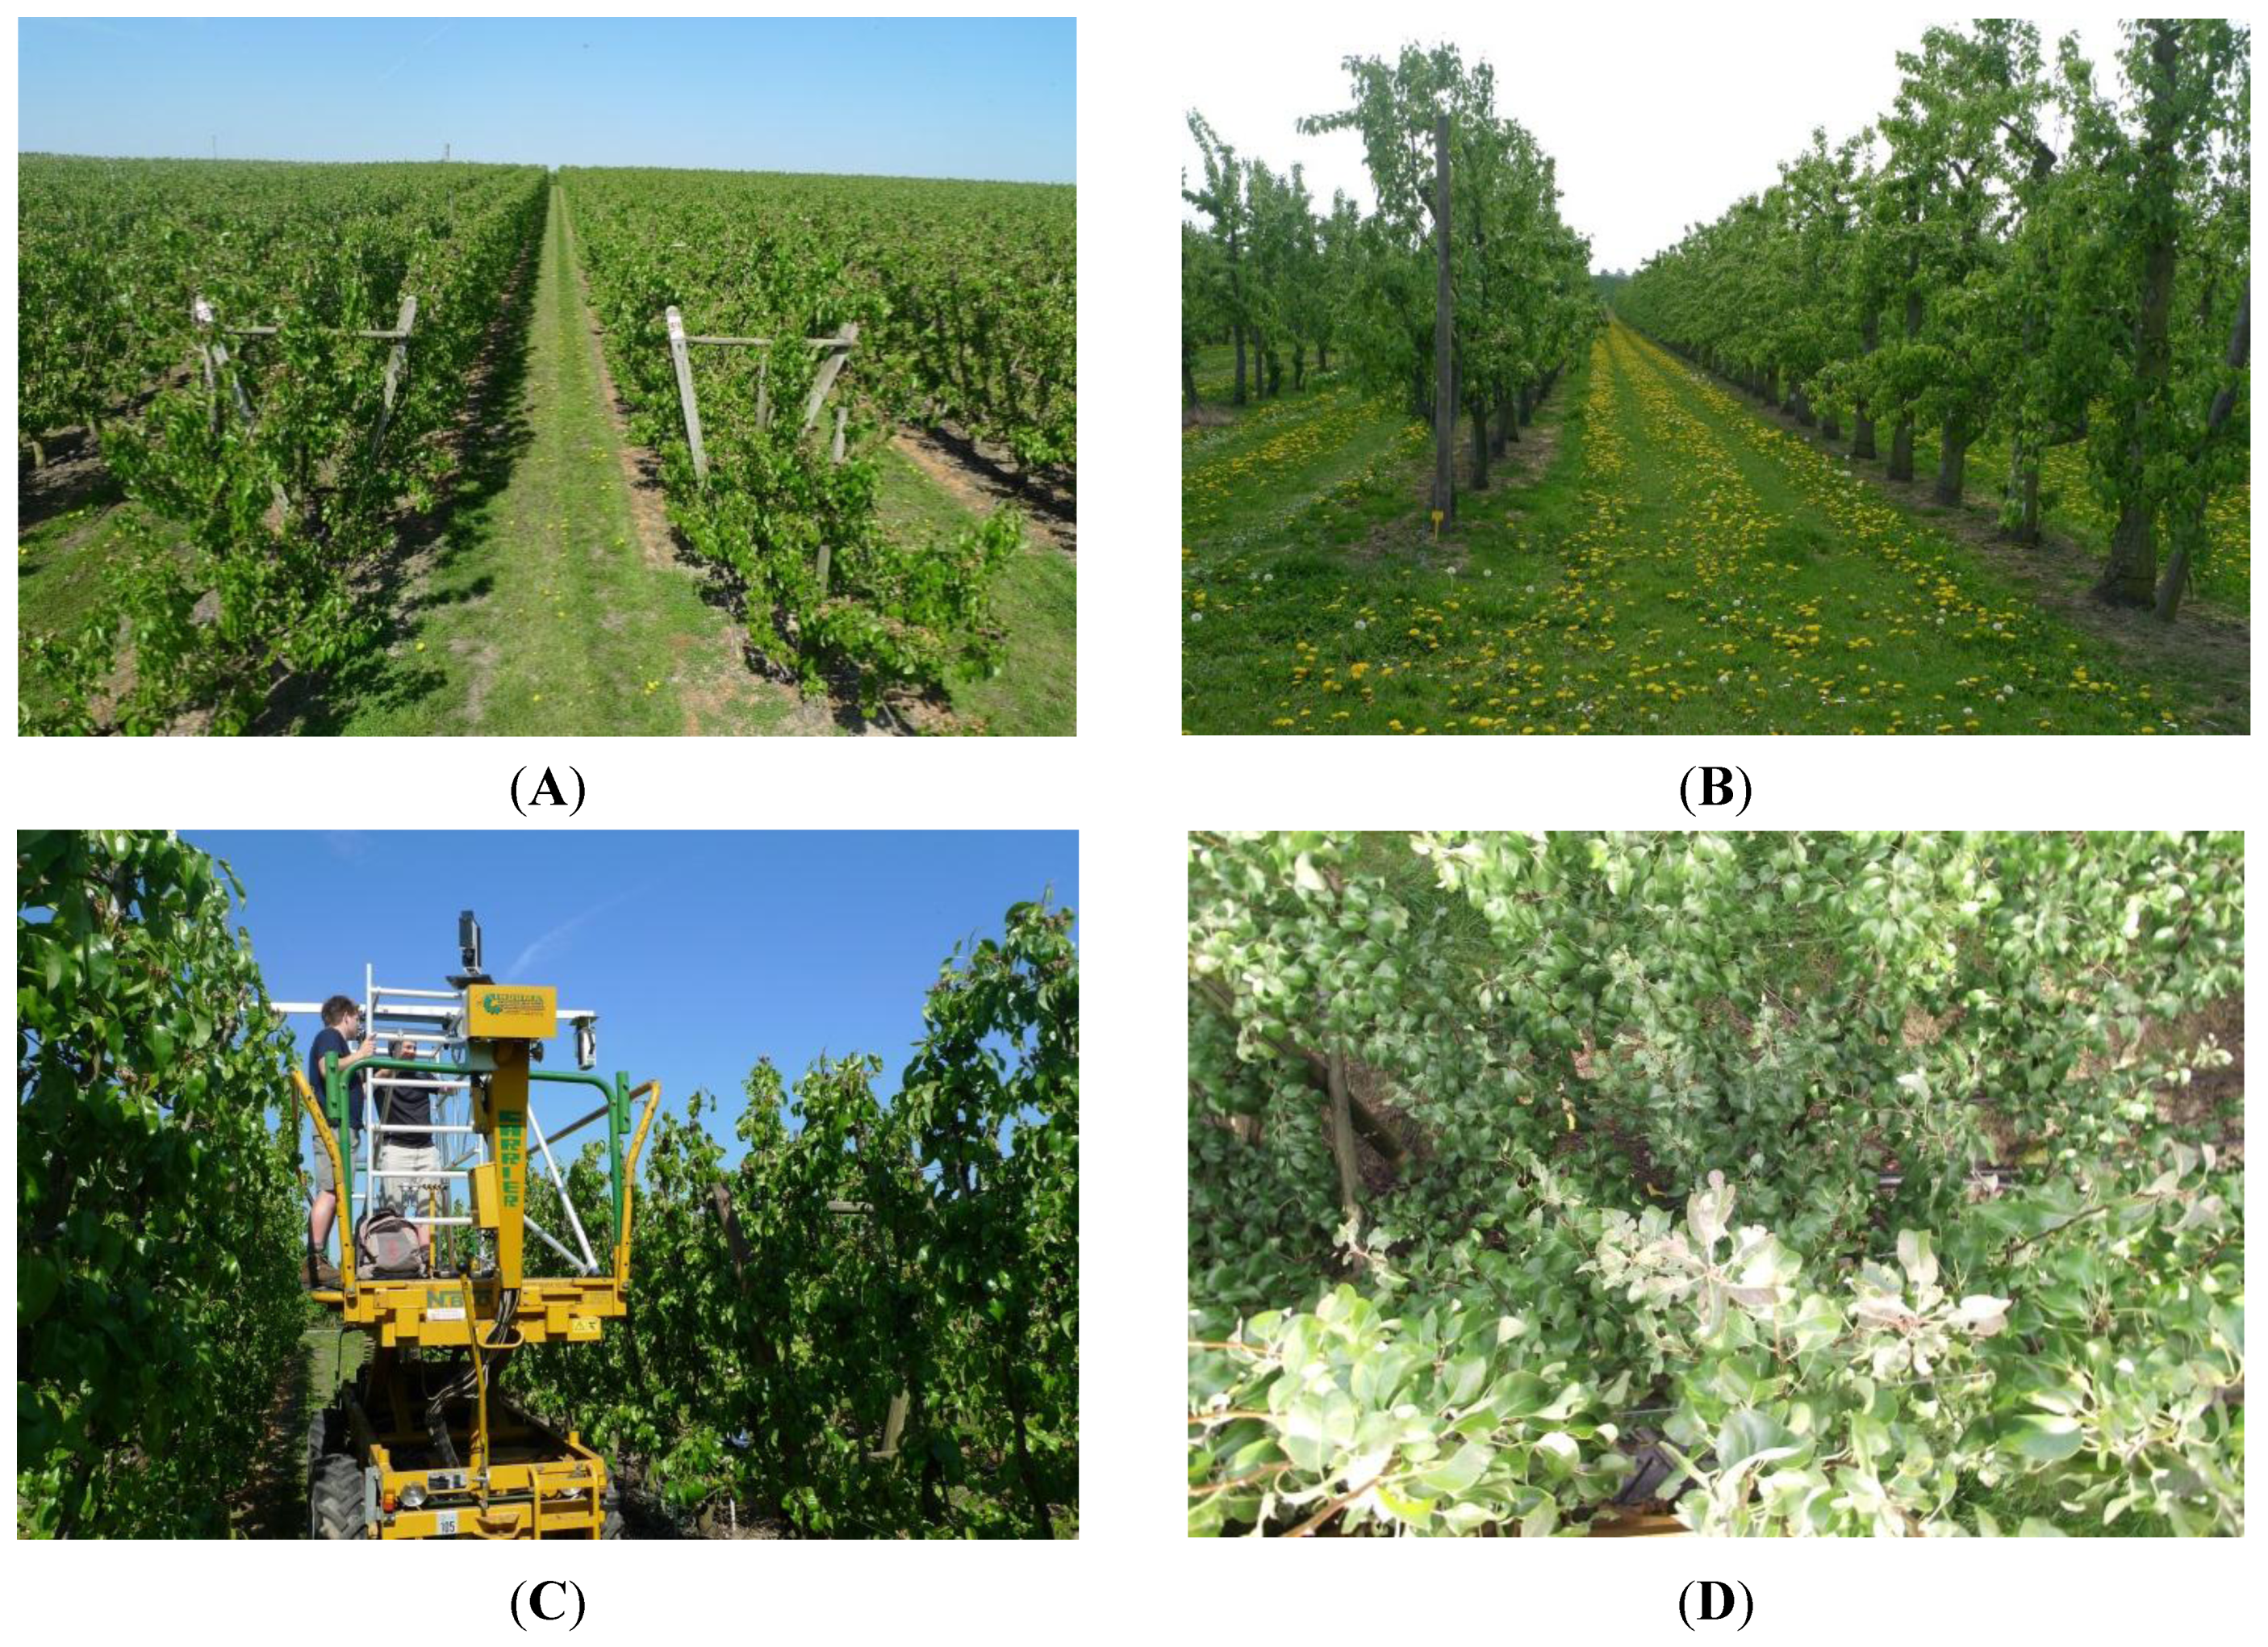
2.1. Study Area

2.2. Ground Measurements
2.2.1. Fruit Yield and Quality
2.2.2. Spectral Measurements
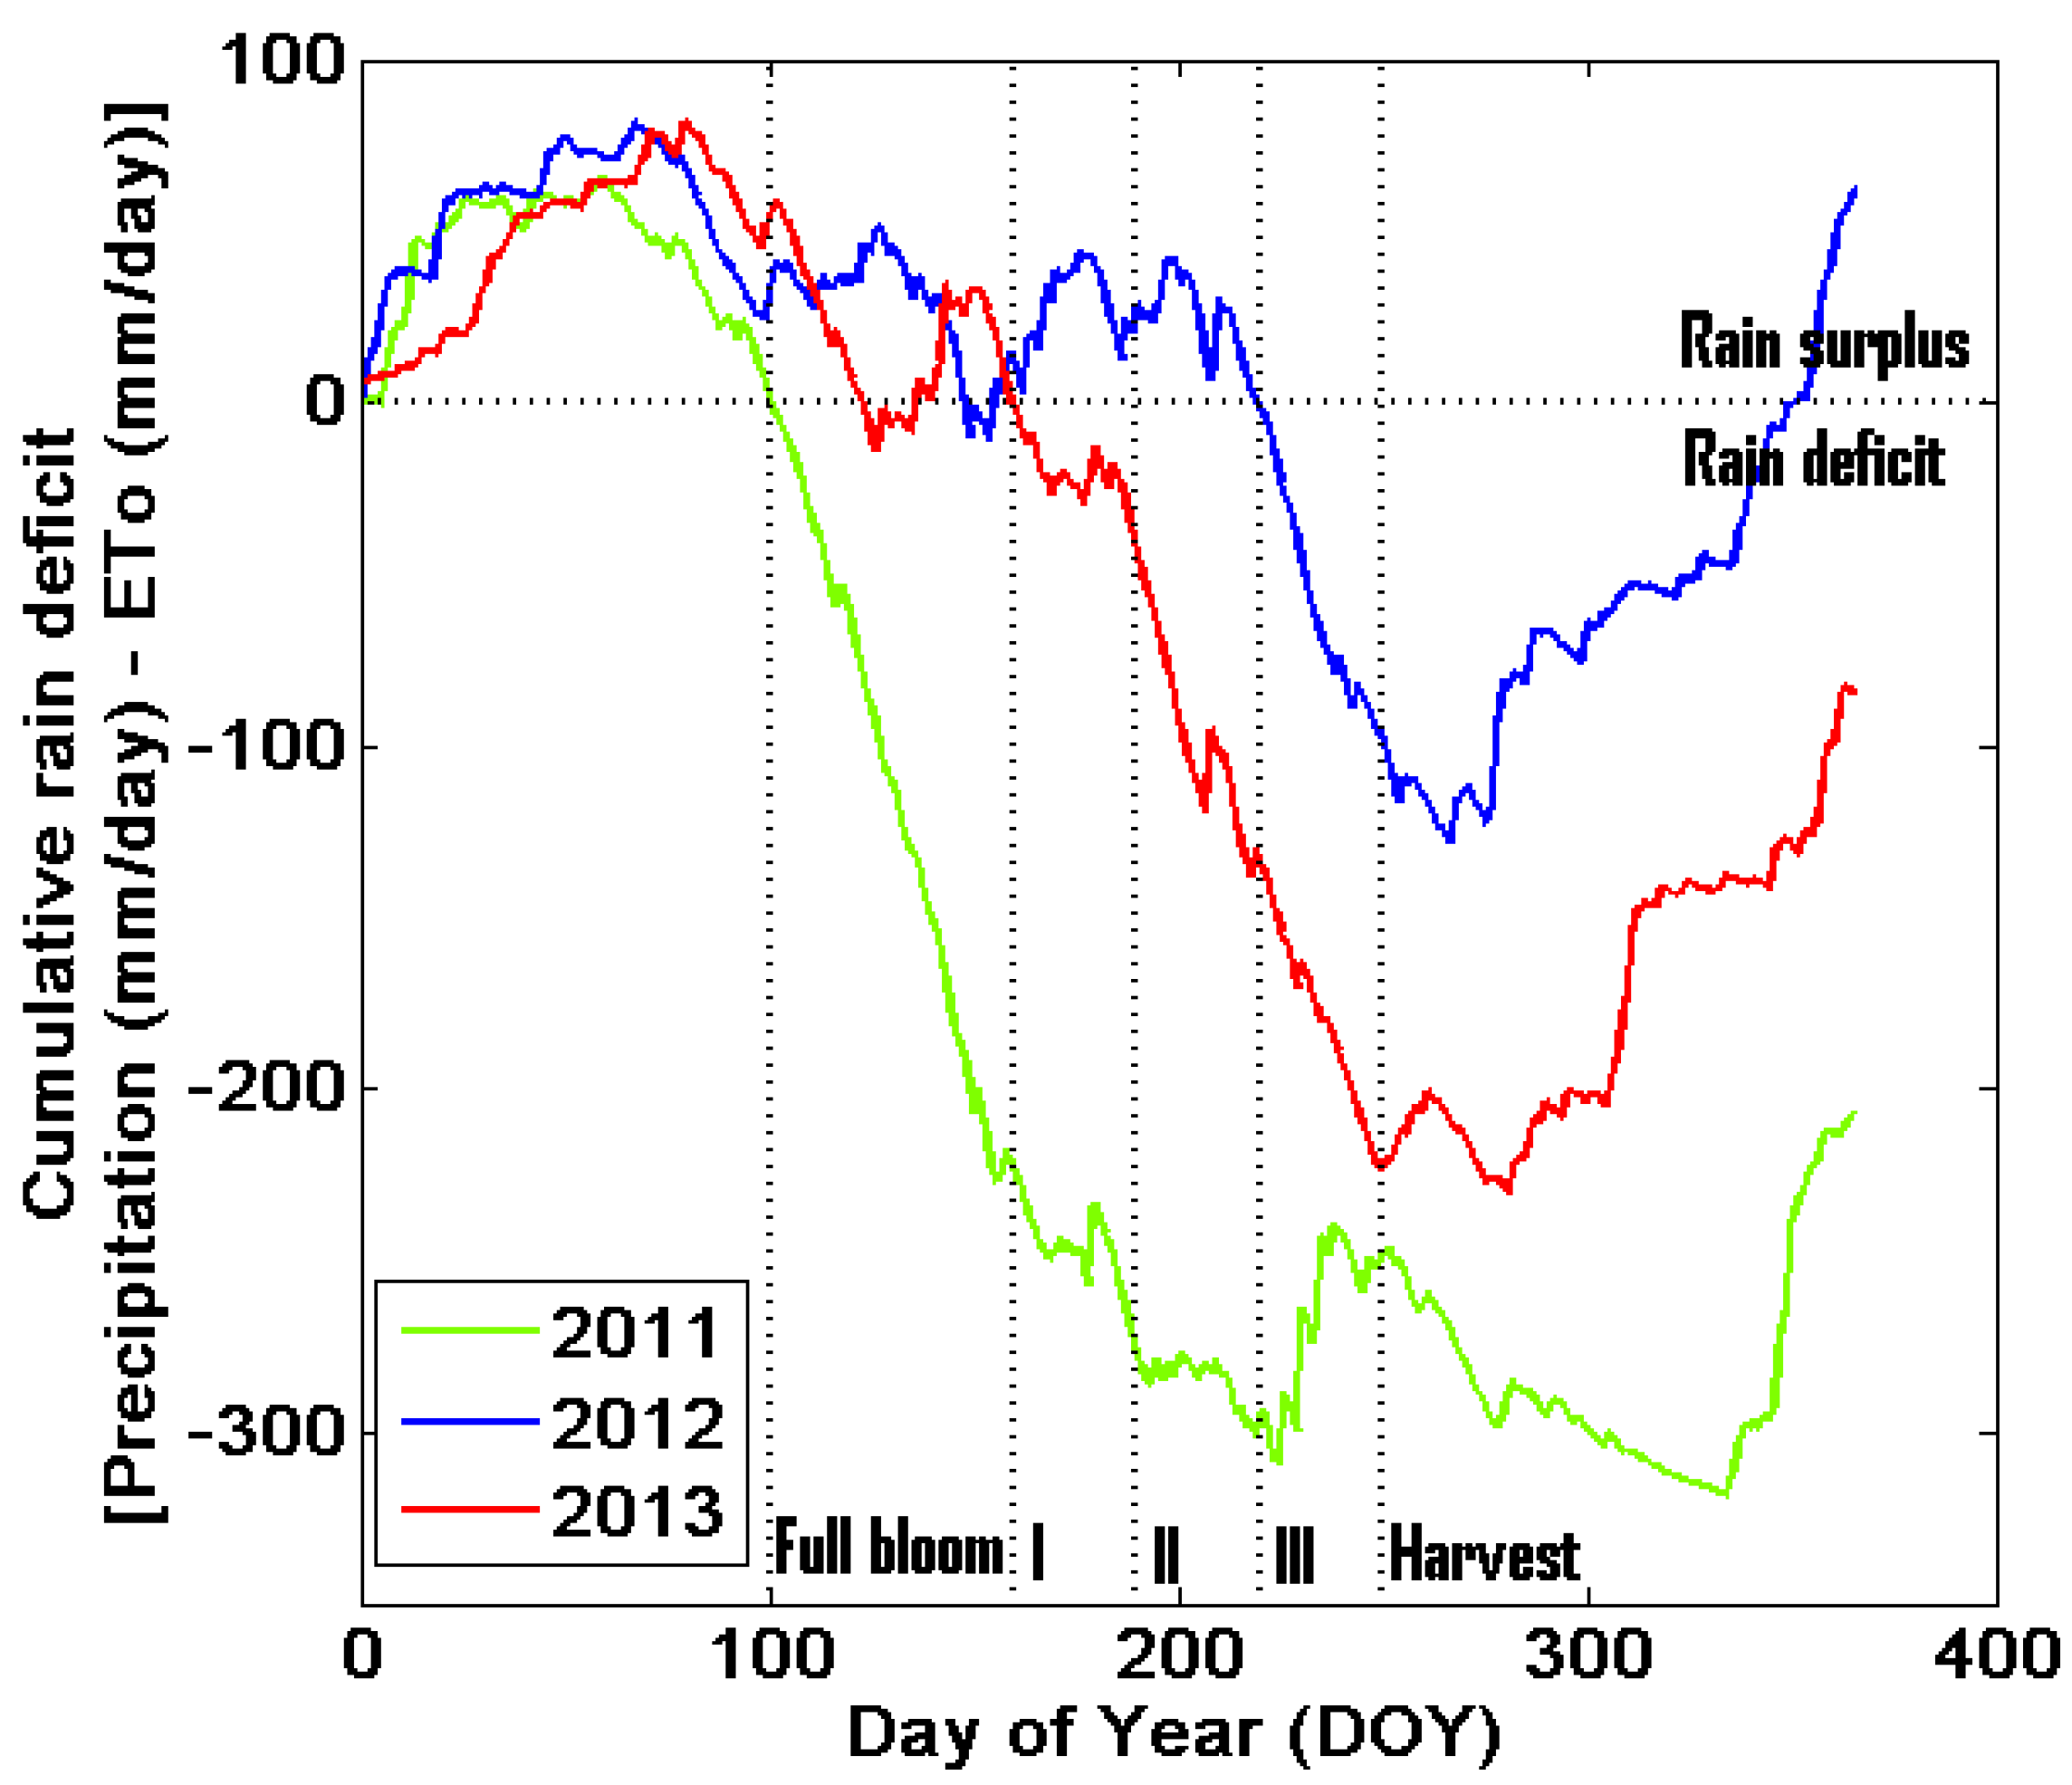
2.2.3. Environmental Data
2.3. Data Analysis
3. Results
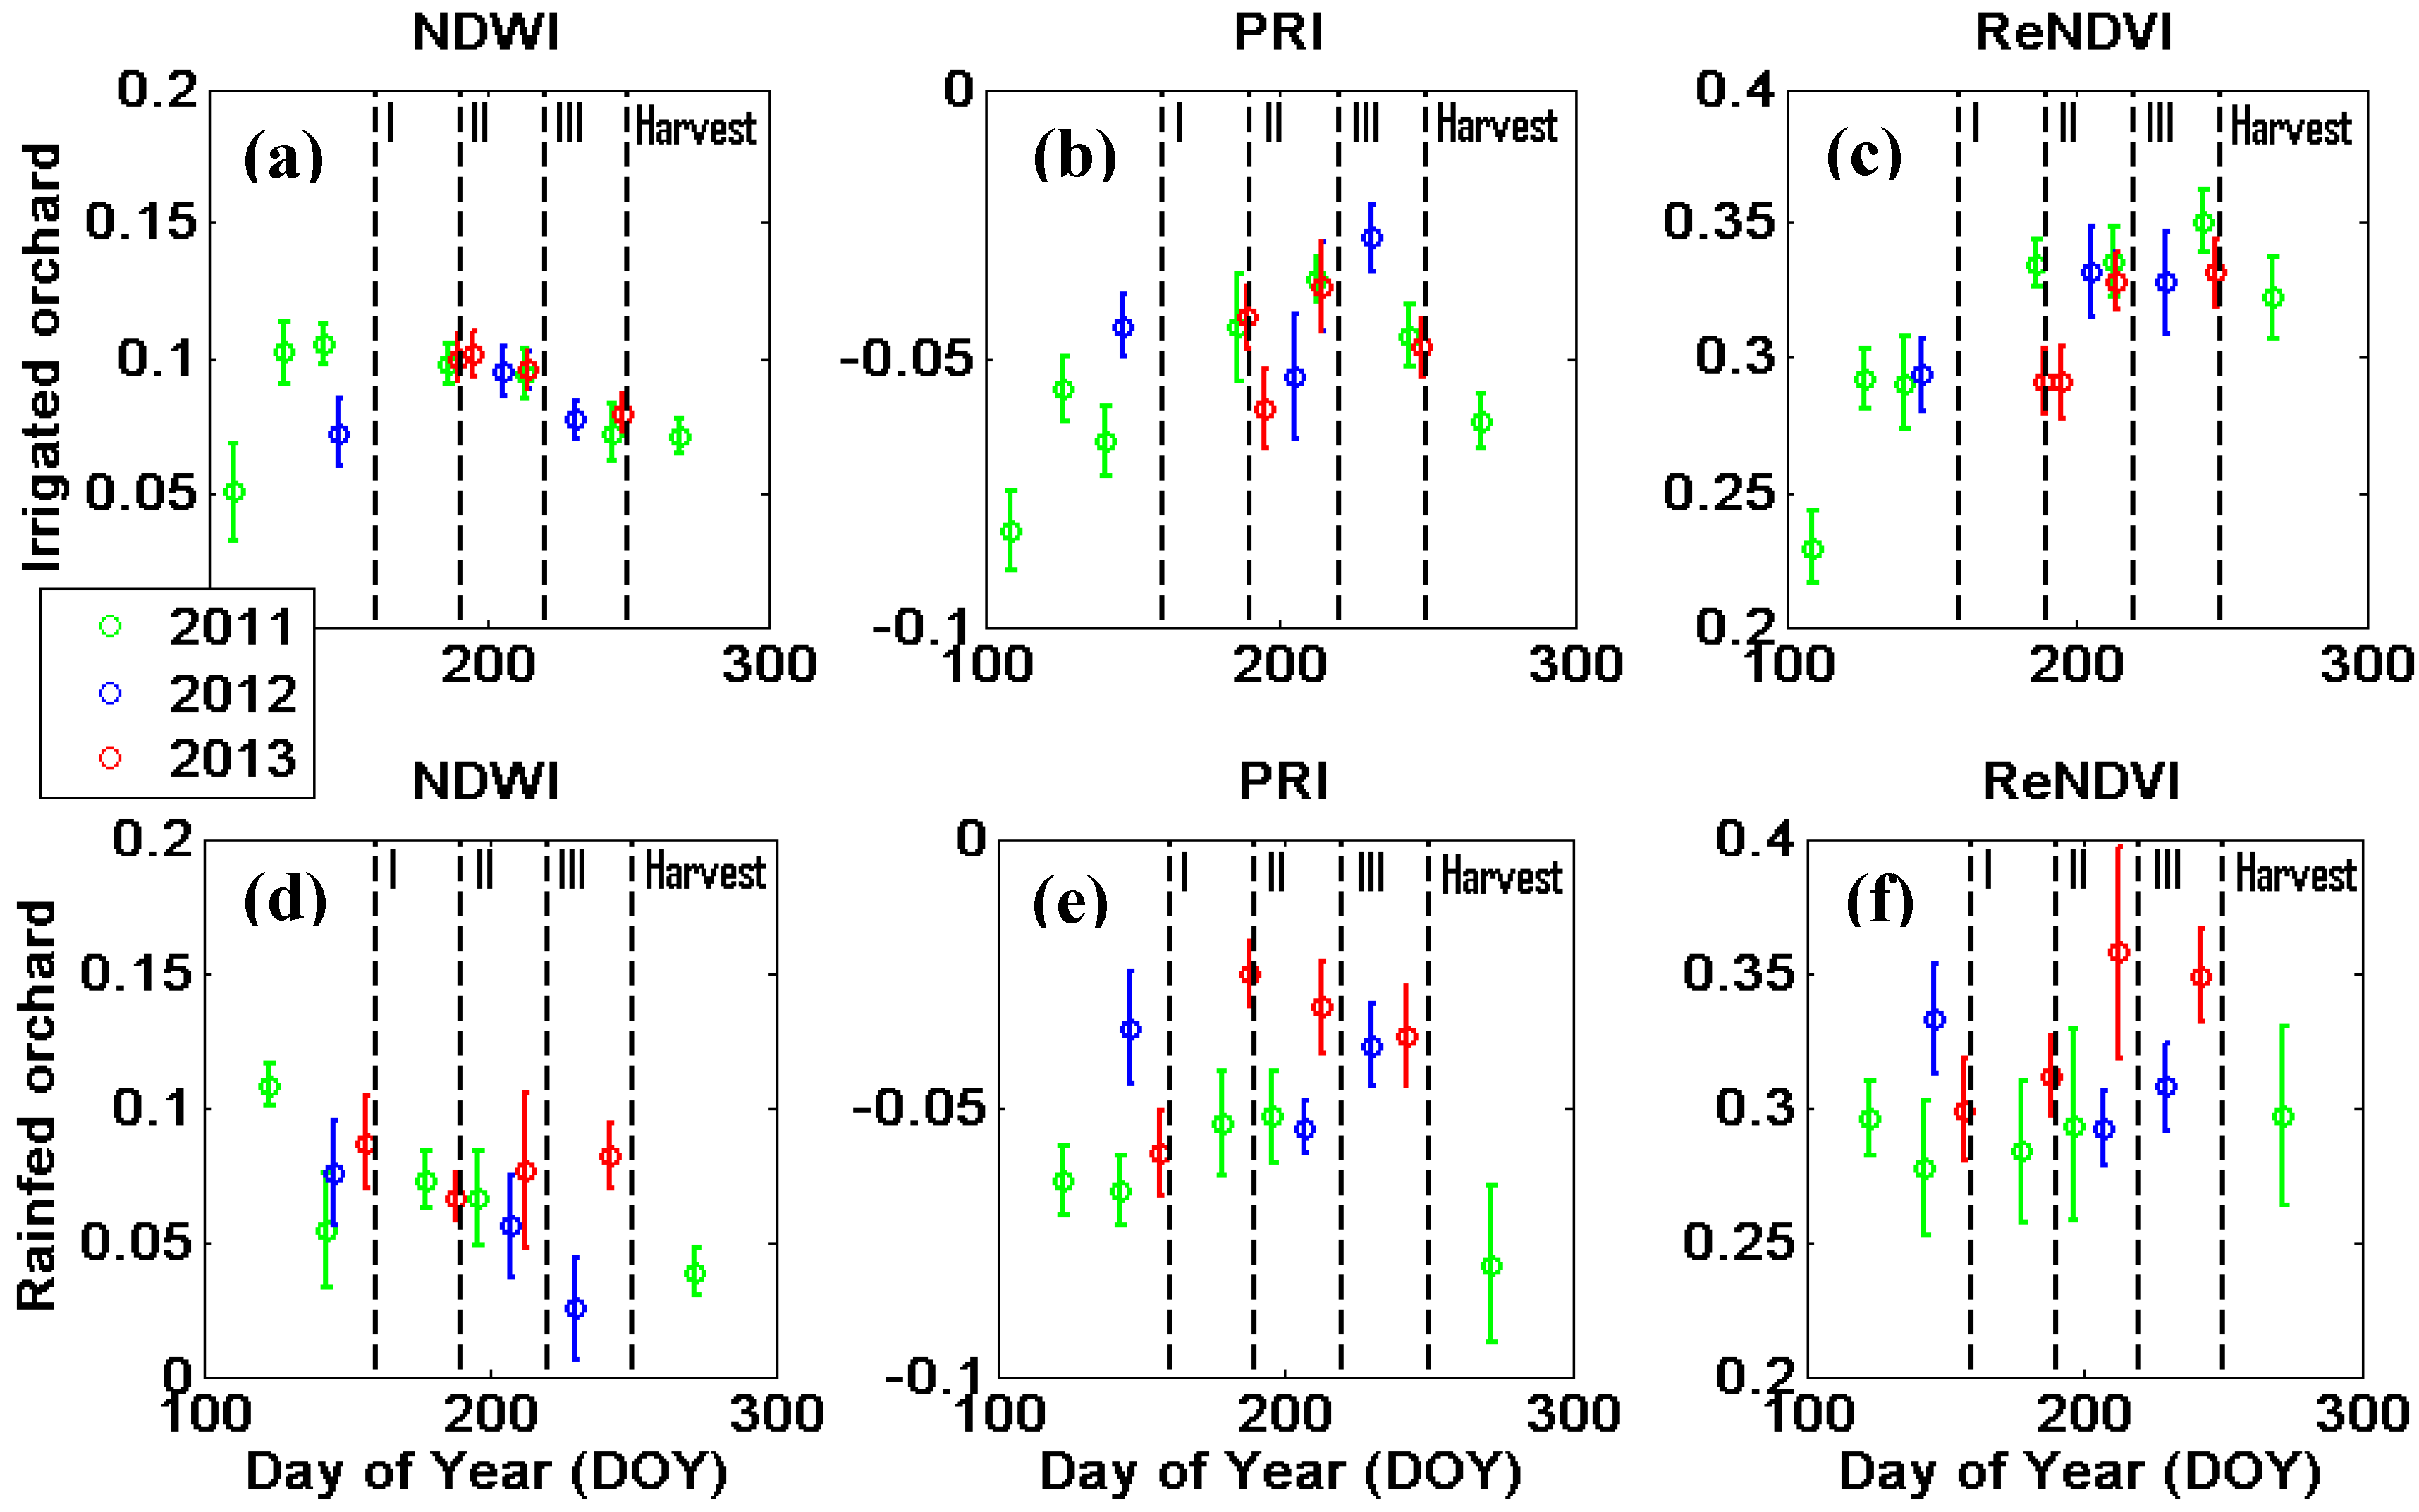
3.1. Environmental Conditions

3.2. Fruit Yield and Fruit Quality

| Location | Year | Total Yield (kg/Tree) | Number of Fruits per Tree | Firmness (kg/0.5 cm²) | TSS (°Brix) | Chroma (°) | Hue (°) |
|---|---|---|---|---|---|---|---|
| Irrigated Orchard | 2011 | 28.4 (±3.1) | 159 (±16) | 5.7 (±0.4) | 11.7 (±0.6) | 41.5 (±1.5) | 111.0 (±0.8) |
| 2012 | 17.5 (±3.0) | 108 (±27) | 7.0 (±0.2) | 12.5 (±0.4) | 41.2 (±0.6) | 109.9 (±0.4) | |
| 2013 | 19.1 (±2.9) | 140 (±33) | 7.3 (±0.3) | 13.1 (±0.6) | 38.3 (±0.9) | 109.1 (±0.8) | |
| Rainfed Orchard | 2011 | 15.1 (±5.3) | 90 (±32) | 5.8 (±0.1) | 13.2 (±0.2) | 40.6 (±1.3) | 108.1 (±1.7) |
| 2012 | 16.1 (±2.9) | 88 (±18) | 6.8 (±0.3) | 12.3 (±0.3) | 41.1 (±0.7) | 109.7 (±0.4) | |
| 2013 | 24.6 (±3.3) | 170 (±36) | 6.7 (±0.3) | 12.9 (±0.5) | 38.1 (±0.9) | 107.7 (±1.5) |
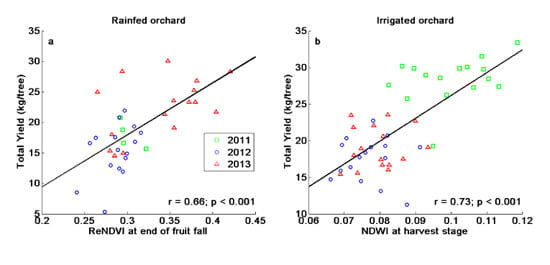
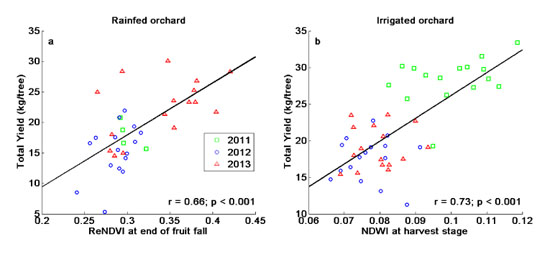
3.3. Production versus Spectral Measurements

| Total Yield (kg/tree) | Number of Fruits per Tree | ||||||||
|---|---|---|---|---|---|---|---|---|---|
| Phenological stage | Fruitlet | End of fruit fall | Fruit ripening | Harvest | Fruitlet | End of fruit fall | Fruit ripening | Harvest | |
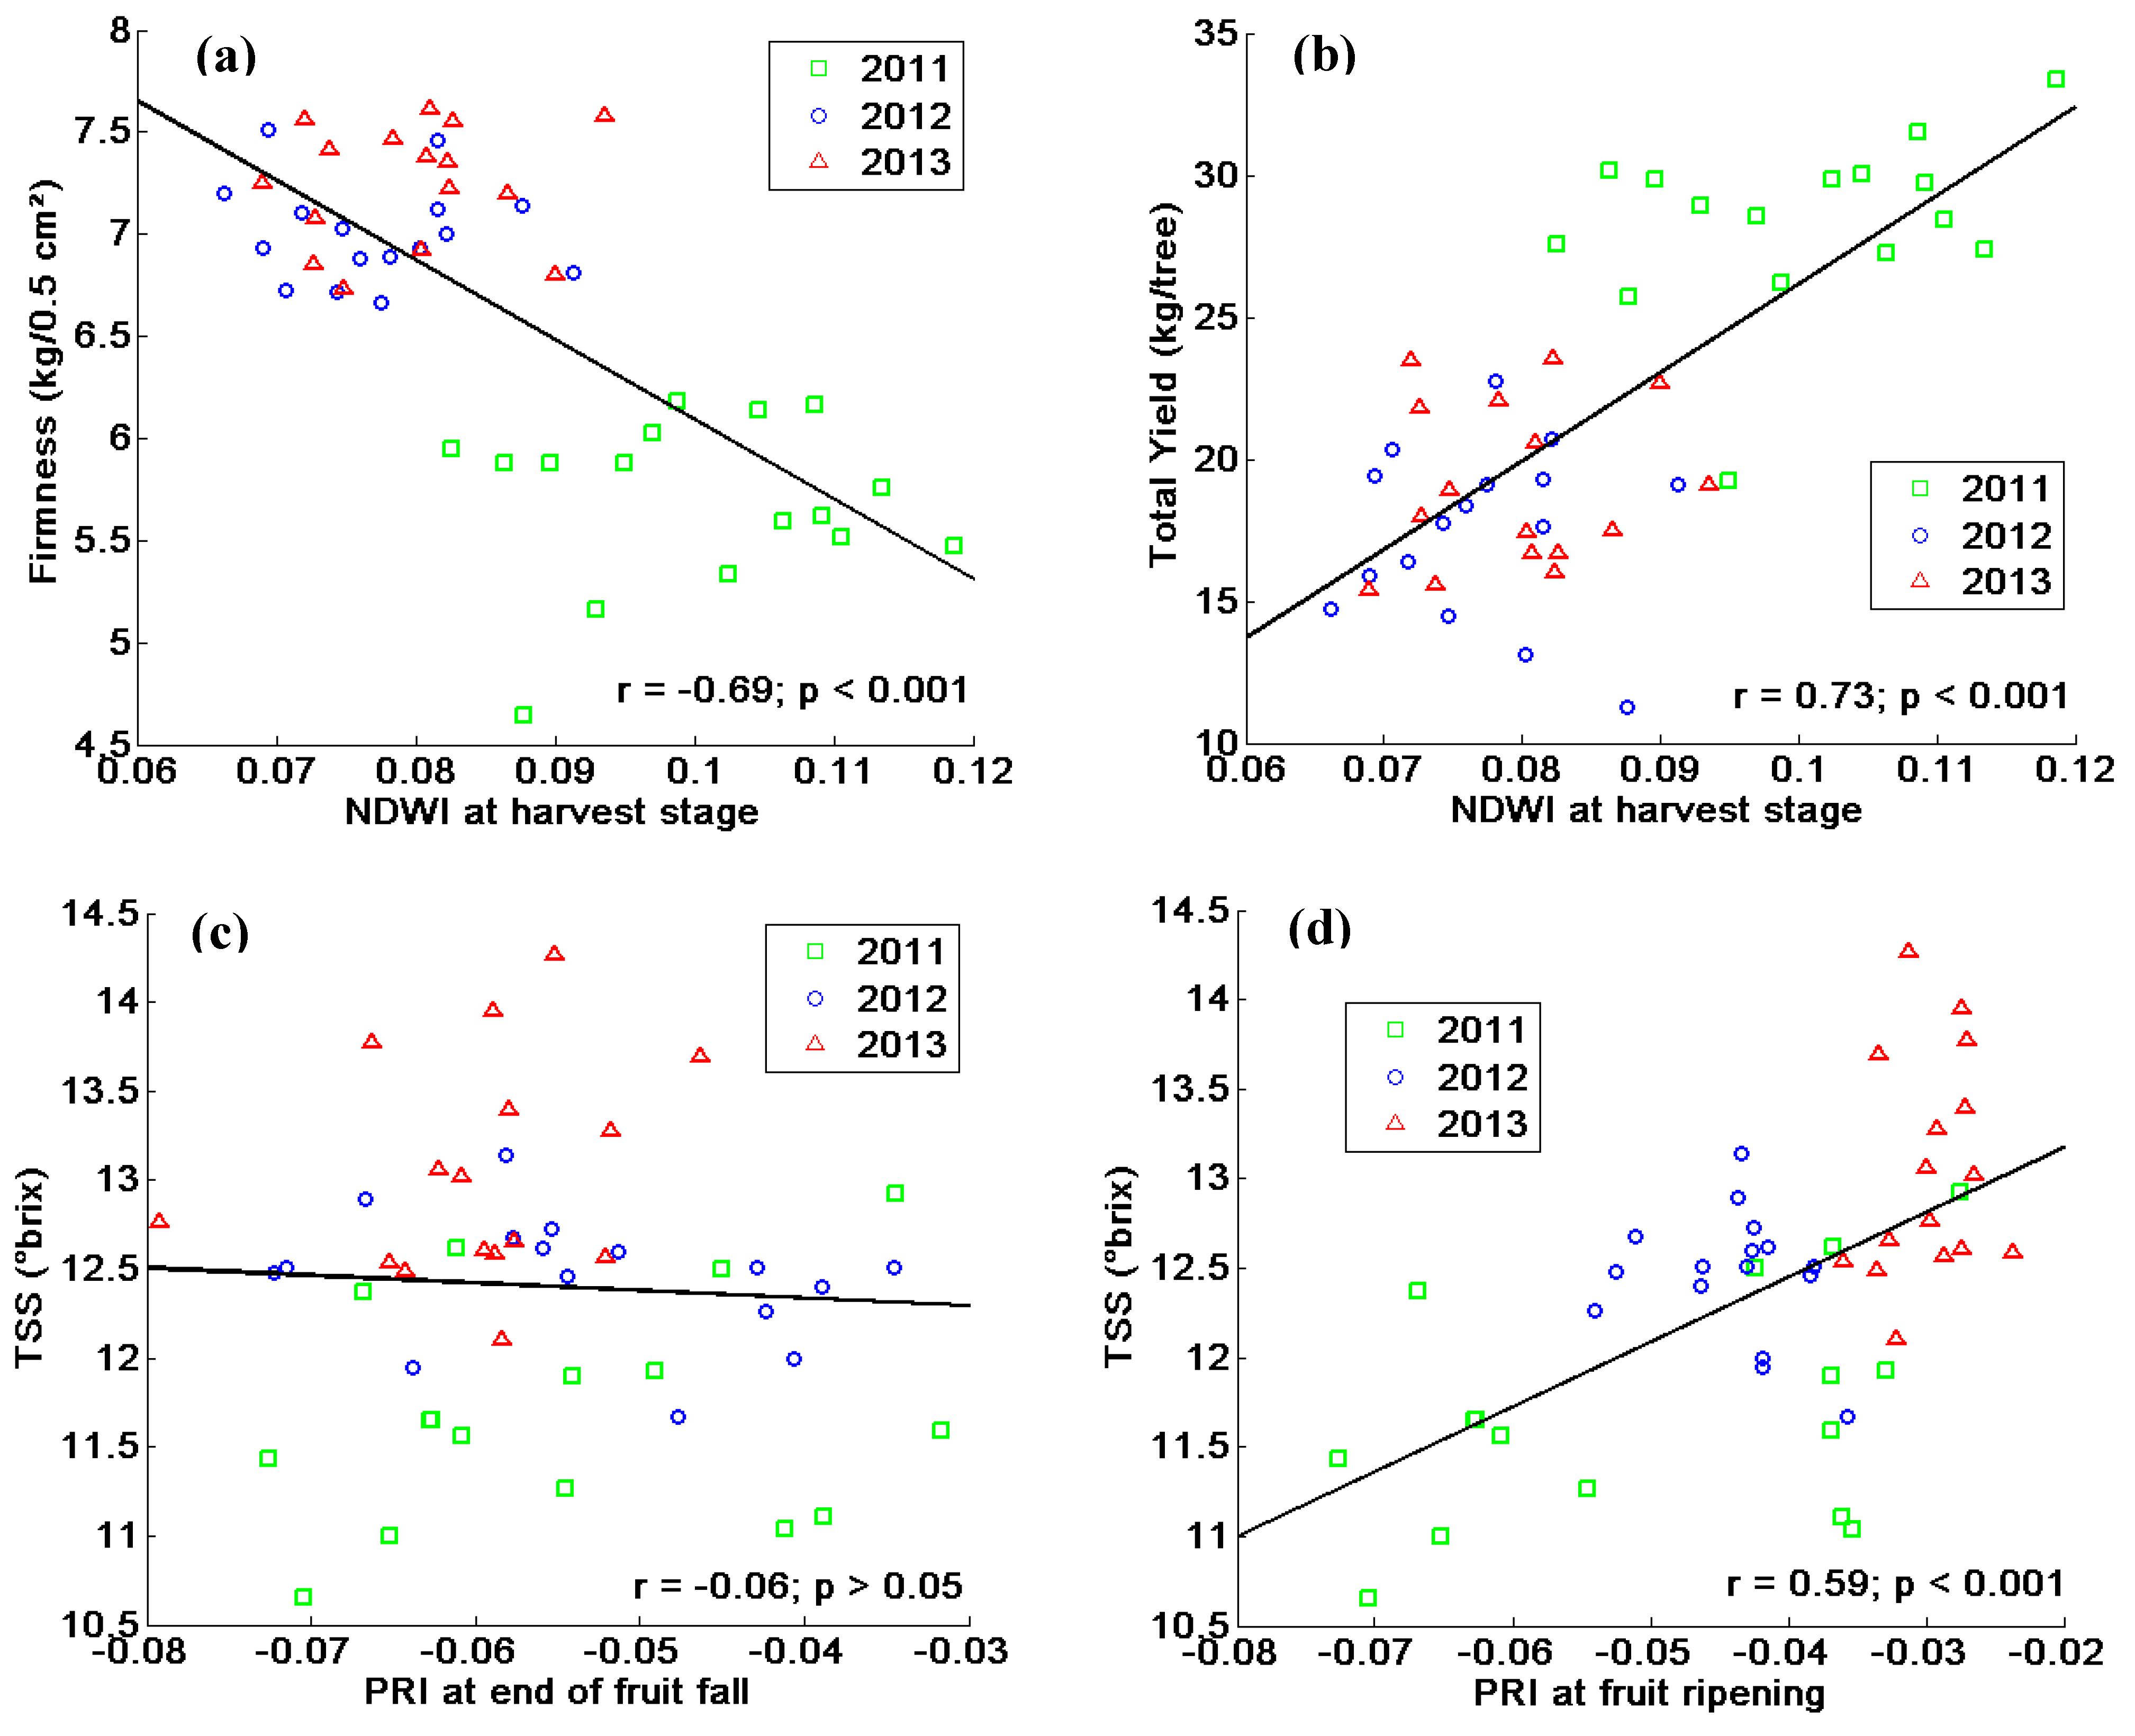
| Irrigated Orchard | NDWI | 0.56 ٭٭ | 0.19 | 0.22 | 0.73٭٭ | 0.53 ٭٭ | 0.11 | 0.06 | 0.47 ٭٭ |
| PRI | −0.70٭٭ | −0.02 | −0.41 ٭٭ | −0.50 ٭٭ | −0.33 ٭ | 0.01 | −0.05 | −0.49٭٭ | |
| ReNDVI | 0.12 | −0.09 | −0.30 ٭ | −0.37 ٭٭ | 0.21 | −0.26 | −0.13 | −0.31٭ | |
| Rainfed Orchard | NDWI | 0.48٭٭ | 0.12 | 0.59 ٭٭ | 0.59٭٭ | 0.43 ٭٭ | 0.04 | 0.64٭٭ | 0.64 ٭٭ |
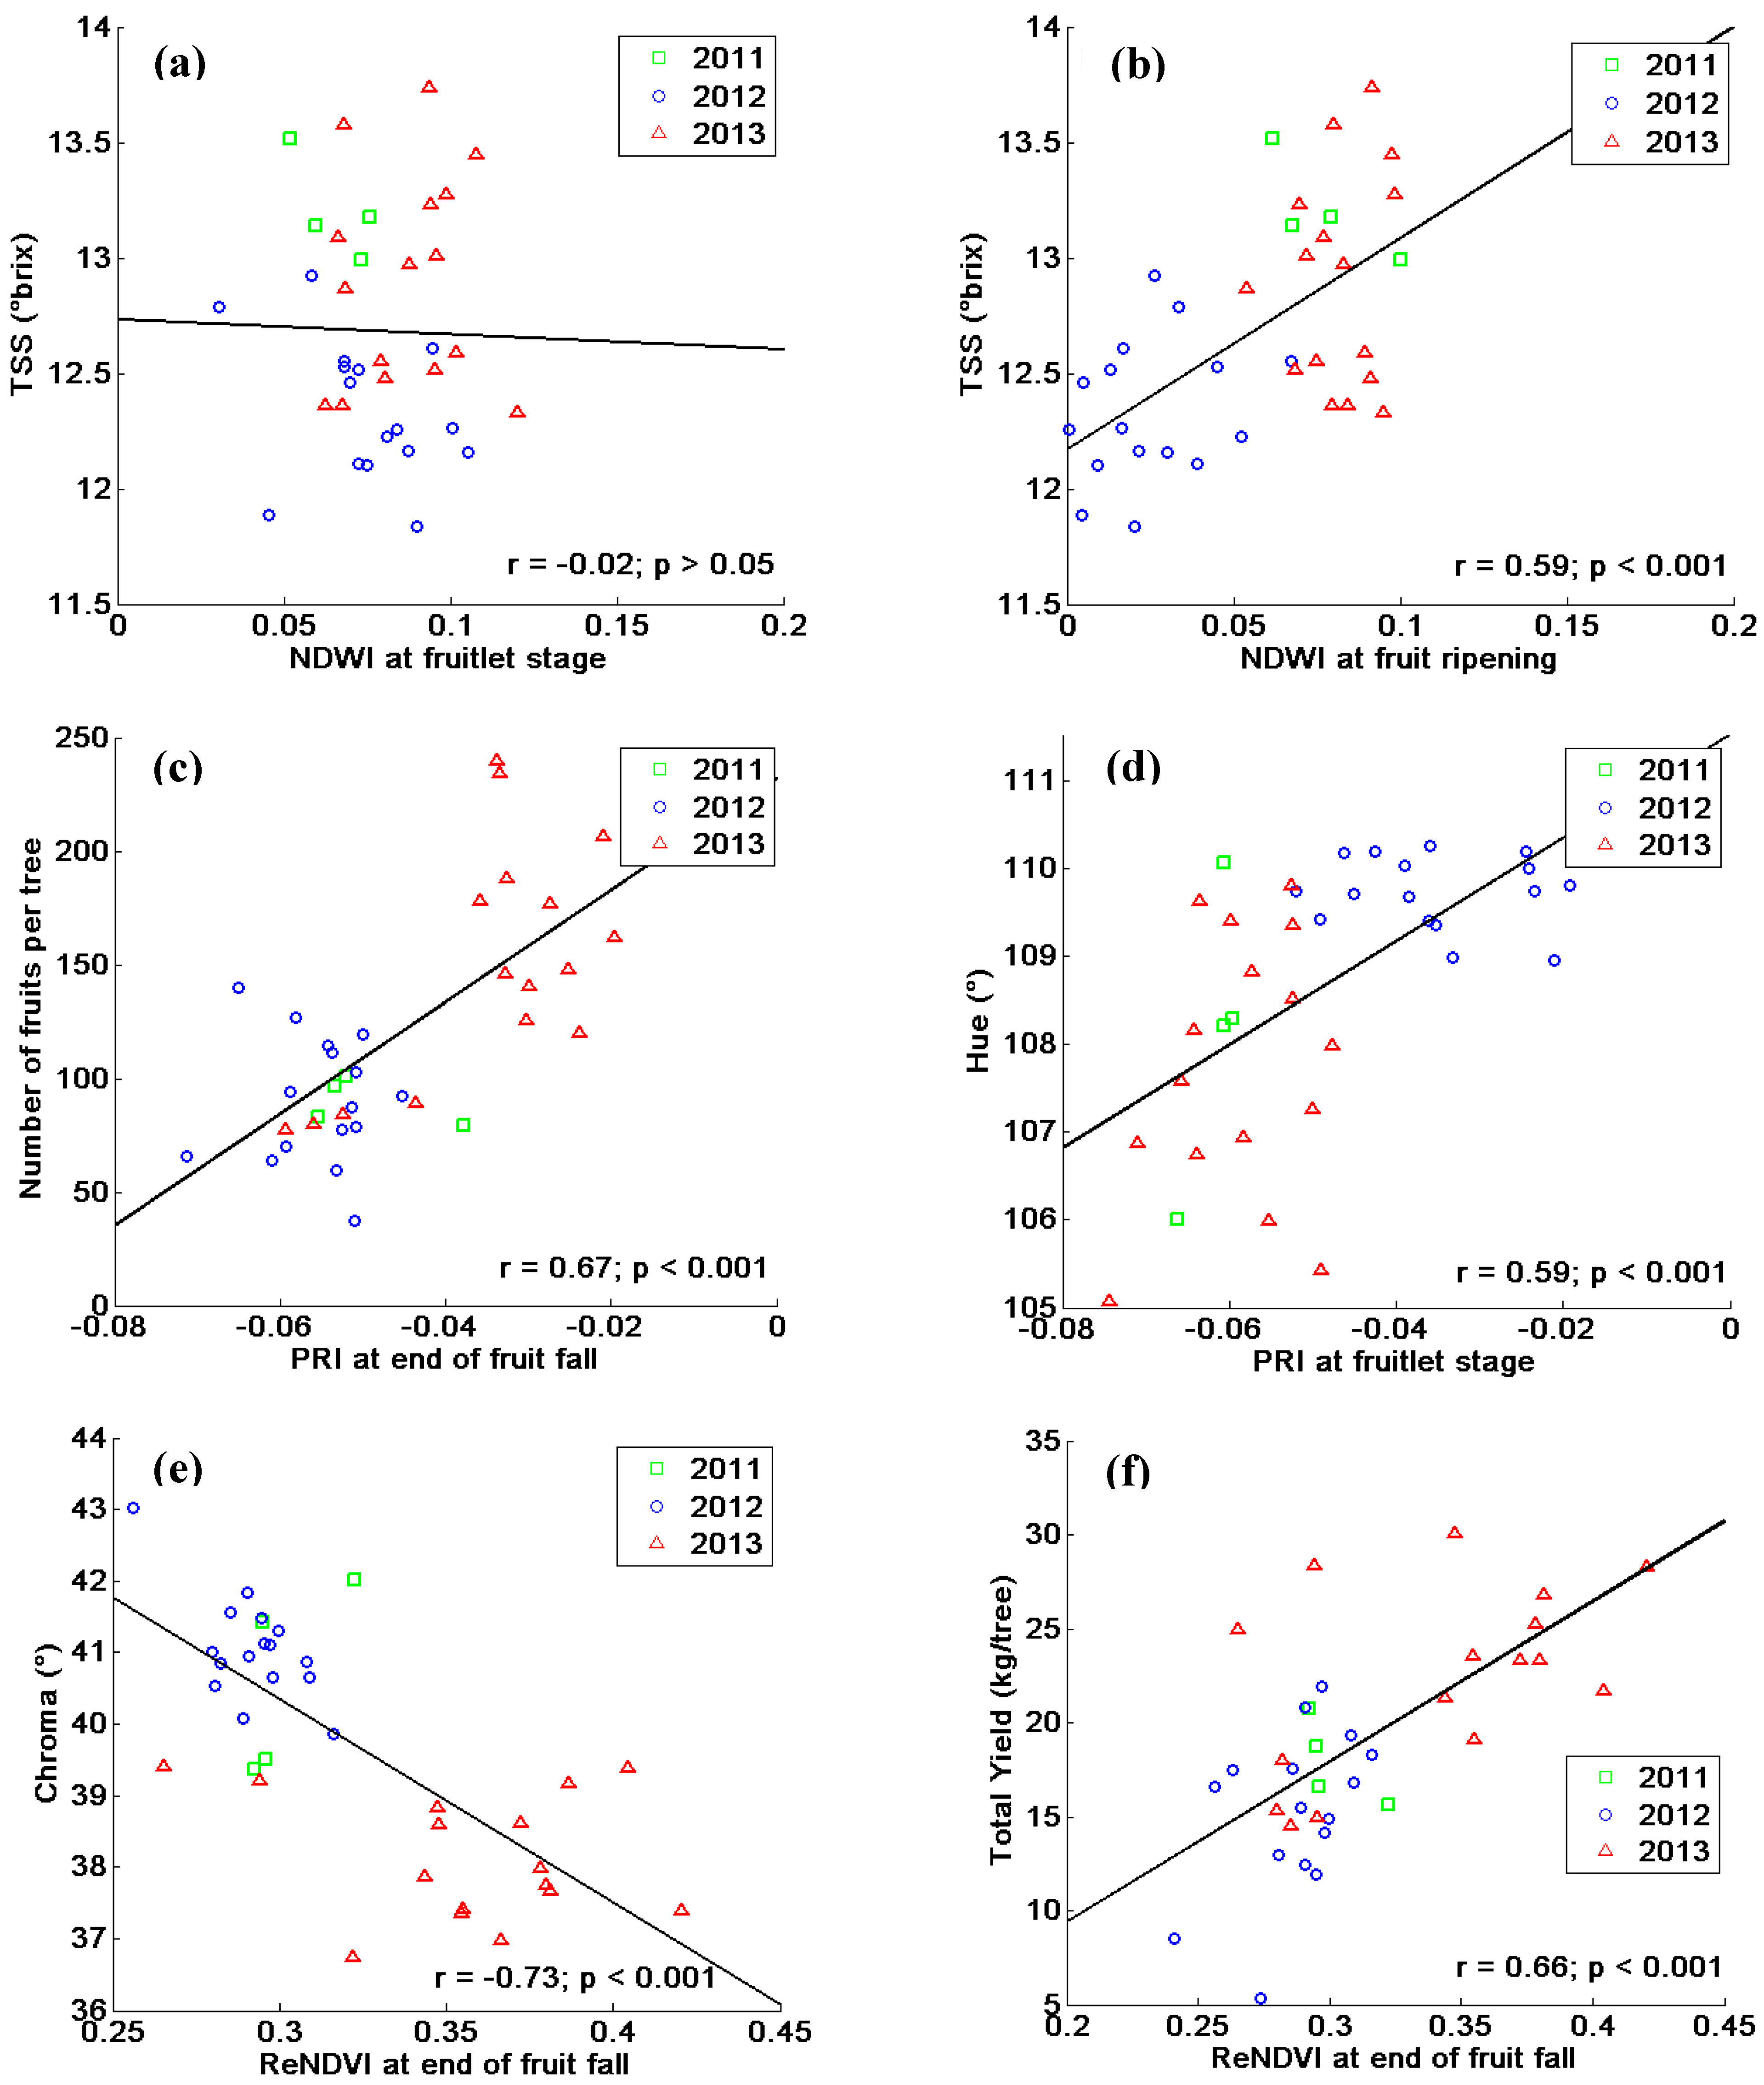
| PRI | −0.18 | 0.70 ٭٭ | 0.28 | 0.28 | −0.31٭ | 0.67٭٭ | 0.18 | 0.18 | |
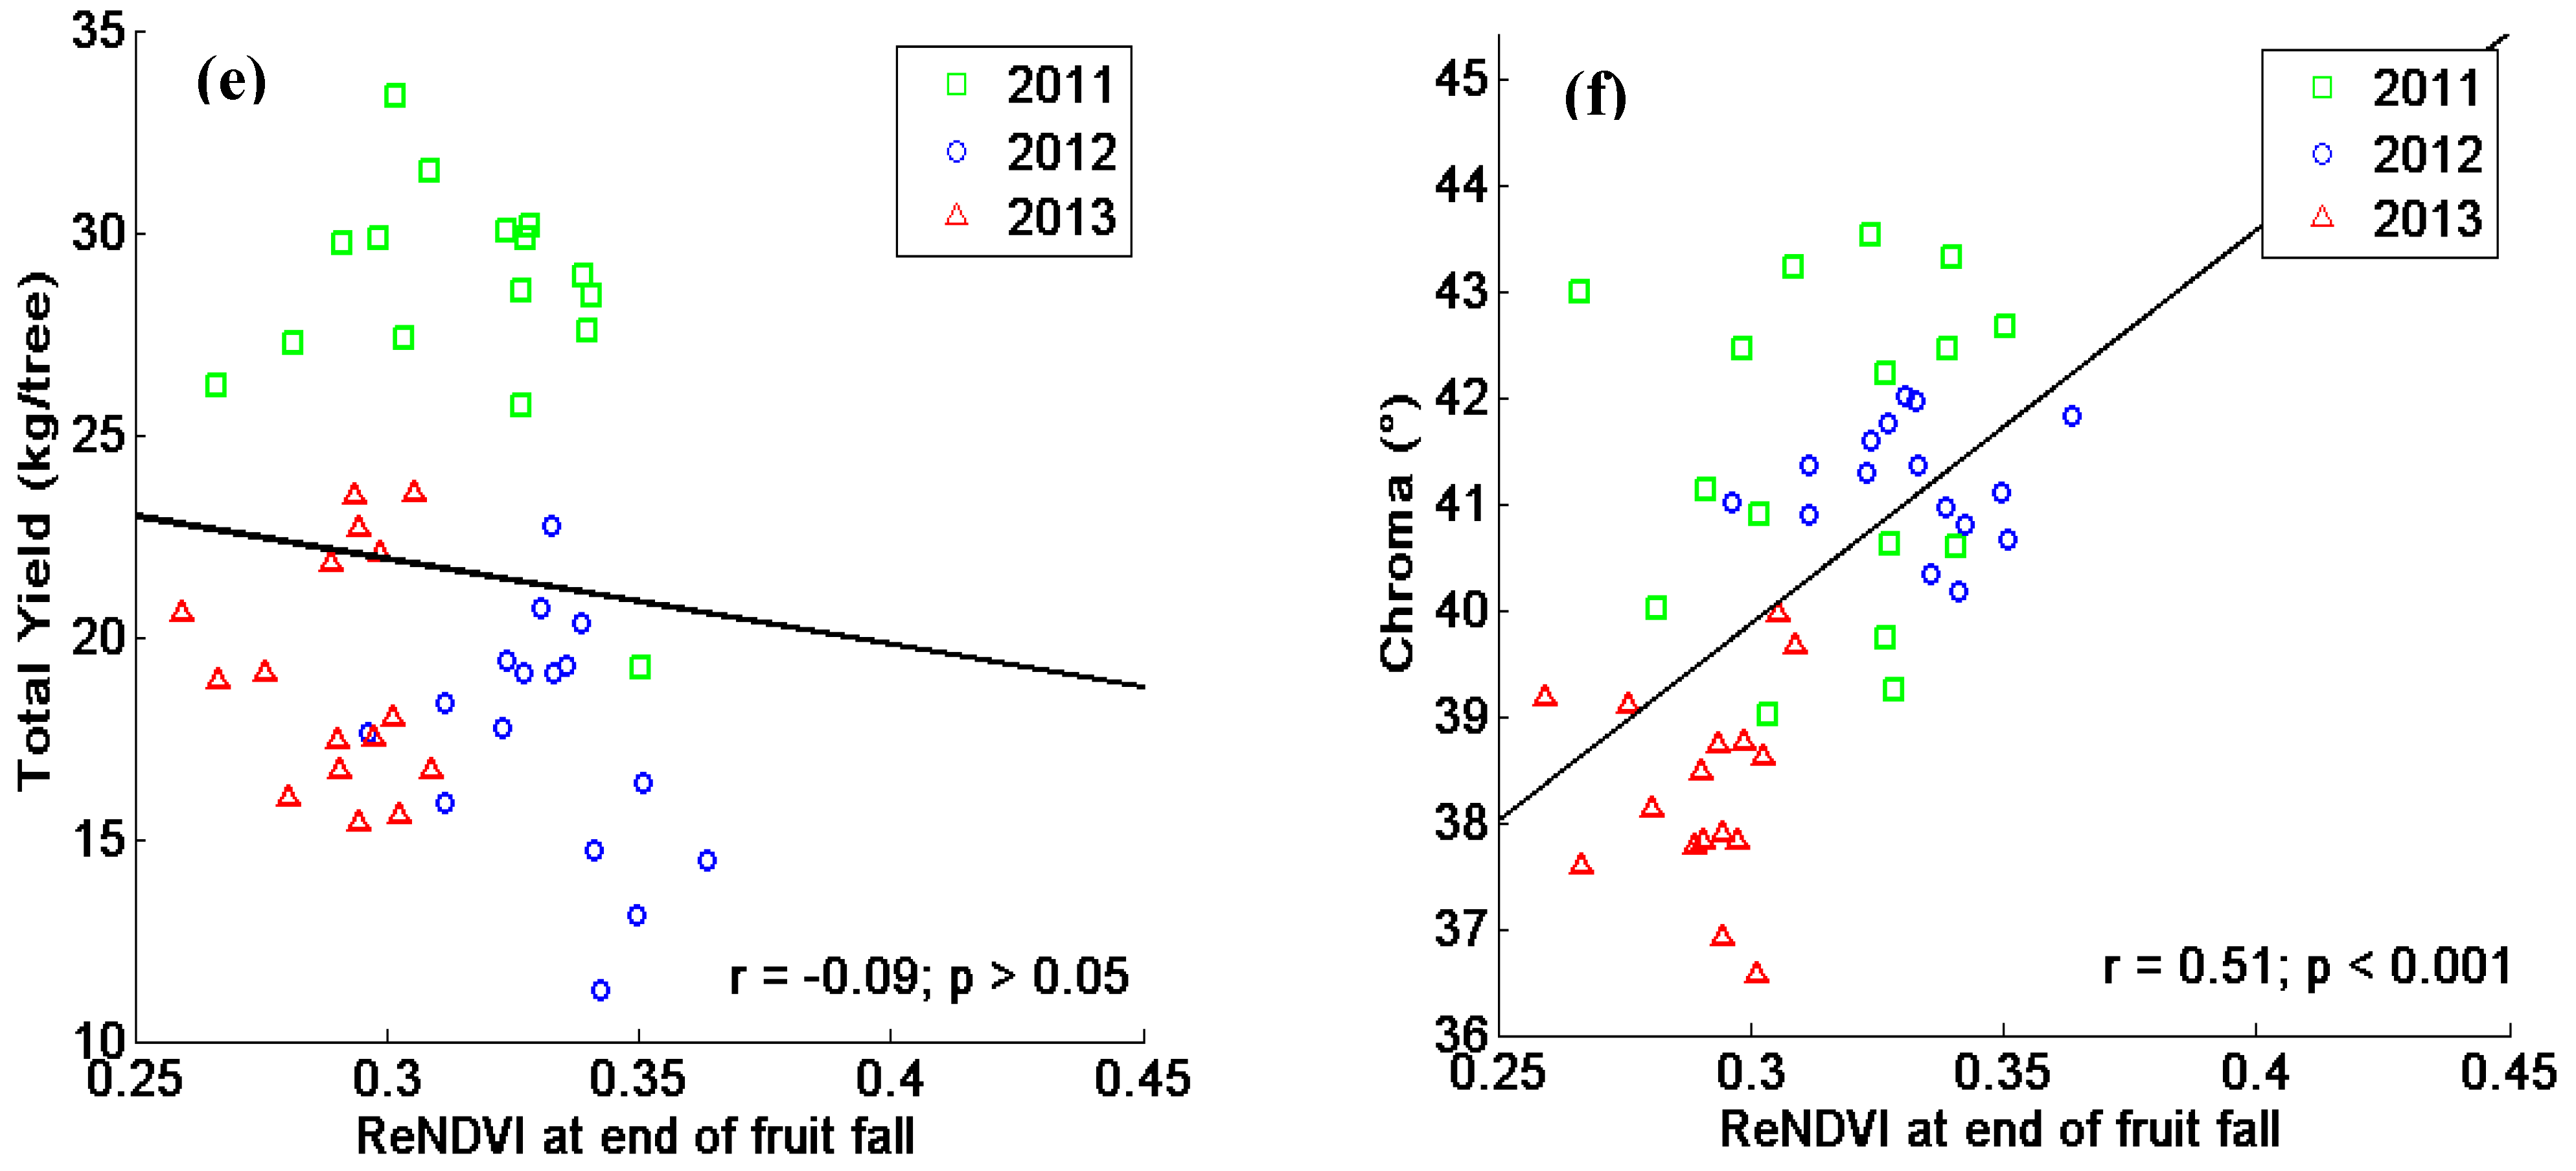
| ReNDVI | −0.02 | 0.66 ٭٭ | 0.65 ٭٭ | 0.65٭٭ | −0.18 | 0.60٭٭ | 0.56 ٭٭ | 0.56٭٭ | |
| ٭ Significance at p < 0.05 | ٭٭ Significance at p < 0.001 | ||||||||
| Firmness (kg/0.5 cm²) | TSS (°brix) | ||||||||
| Phenological stage | Fruitlet | End of fruit fall | Fruit ripening | Harvest | Fruitlet | End of fruit fall | Fruit ripening | Harvest | |
| Irrigated Orchard | NDWI | −0.37 ٭٭ | −0.12 | −0.18 | −0.69٭٭ | −0.22 | −0.11 | −0.24 | −0.62 ٭٭ |
| PRI | 0.79 ٭٭ | −0.13 | 0.45٭٭ | 0.25 | 0.53٭٭ | −0.06 | 0.59٭٭ | 0.16 | |
| ReNDVI | 0.06 | −0.21 | 0.21 | 0.24 | −0.22 | −0.21 | 0.26 | 0.24 | |
| Rainfed Orchard | NDWI | 0.23 | 0.07 | −0.25 | −0.25 | −0.02 | 0.04 | 0.59 ٭٭ | 0.59٭٭ |
| PRI | 0.34٭ | −0.01 | 0.21 | 0.21 | −0.63 ٭٭ | 0.37٭ | −0.13 | −0.13 | |
| ReNDVI | 0.35٭ | 0.15 | 0.07 | 0.07 | −0.58 ٭٭ | 0.23 | 0.31 | 0.31 | |
| ٭ Significance at p < 0.05 | ٭٭ Significance at p < 0.001 | ||||||||
| Chroma (°) | Hue (°) | ||||||||
| Phenological stage | Fruitlet | End of fruit fall | Fruit ripening | Harvest | Fruitlet | End of fruit fall | Fruit ripening | Harvest | |
| Irrigated Orchard | NDWI | −0.25 | −0.07 | 0.03 | 0.29 ٭ | 0.23 | 0.12 | 0.35 ٭ | 0.60 ٭٭ |
| PRI | −0.47٭٭ | 0.18 | −0.55 ٭٭ | 0.19 | −0.62٭٭ | 0.14 | −0.55 ٭٭ | −0.15 | |
| ReNDVI | 0.11 | 0.51 ٭٭ | −0.21 | −0.20 | −0.03 | 0.25 | −0.38٭٭ | −0.30 ٭ | |
| Rainfed Orchard | NDWI | −0.44 ٭٭ | −0.44٭٭ | −0.66٭٭ | −0.66٭٭ | −0.19 | −0.09 | −0.53 ٭٭ | −0.53٭٭ |
| PRI | 0.53 ٭٭ | −0.71 ٭٭ | −0.26 | −0.26 | 0.59 ٭٭ | −0.53٭٭ | 0.06 | 0.06 | |
| ReNDVI | 0.40٭ | −0.73٭٭ | −0.79٭٭ | −0.79٭٭ | 0.58 ٭٭ | −0.45٭٭ | −0.35 ٭٭ | −0.35 ٭ | |
| ٭ Significance at p < 0.05 | ٭٭ Significance at p < 0.001 | ||||||||


4. Discussion
4.1. Production versus Spectral Measurements
4.2. Potential and Limitations
5. Conclusions
Acknowledgments
Author Contributions
Conflicts of Interest
References
- Webster, A.D. Factors influencing the flowering, fruit set and fruit growth of European pears. In Acta Horticultura 569; ISHS: Leuven, Belgium, 2002; pp. 699–709. [Google Scholar]
- Goodwin, I.; Boland, A.-M. Scheduling deficit irrigation of fruit trees for optimizing water use efficiency. In Deficit Irrigation Practices. Water Reports Publication n. 22; Food and Agriculture Organization (FAO): Rome, Italy, 2002; pp. 67–78. [Google Scholar]
- Mitchell, P.D.; Chalmers, D.J.; Jerie, P.H.; Burge, G. The use of initial withholding of irrigation and tree spacing to enhance the effect of regulated deficit irrigation on pear trees. J. Am. Soc. Hortic. Sci. 1986, 111, 858–861. [Google Scholar]
- Perry, E.M.; Dezzani, R.J.; Seavert, C.F.; Pierce, F.J. Spatial variation in tree characteristics and yield in a pear orchard. Precis. Agric. 2009, 11, 42–60. [Google Scholar] [CrossRef]
- Aggelopoulou, K.D.; Wulfsohn, D.; Fountas, S.; Gemtos, T.A.; Nanos, G.D.; Blackmore, S. Spatial variation in yield and quality in a small apple orchard. Precis. Agric. 2009, 11, 538–556. [Google Scholar] [CrossRef]
- Dorigo, W.A.; Zurita-Milla, R.; de Wit, A.J.W.; Brazile, J.; Singh, R.; Schaepman, M.E. A review on reflective remote sensing and data assimilation techniques for enhanced agroecosystem modeling. Int. J. Appl. Earth Obs. Geoinf. 2007, 9, 165–193. [Google Scholar] [CrossRef]
- Usha, K.; Singh, B. Potential applications of remote sensing in horticulture—A review. Sci. Hortic. 2013, 153, 71–83. [Google Scholar] [CrossRef]
- Van Beek, J.; Tits, L.; Somers, B.; Deckers, T.; Janssens, P.; Coppin, P. Reducing background effects in orchards through spectral vegetation index correction. Int. J. Appl. Earth Obs. Geoinf. 2014, 34, 167–177. [Google Scholar] [CrossRef]
- Zarco-Tejada, P.J.; Ustin, S.L.; Whiting, M.L. Temporal and spatial relationships between within-field yield variability in cotton and high-spatial hyperspectral remote sensing imagery. Agron. J. 2005, 97, 641–653. [Google Scholar] [CrossRef]
- Thenkabail, P.S.; Ward, A.D.; Lyon, J.G. Landsat-5 thematic mapper models of soybean and corn crop characteristics. Int. J. Remote Sens. 1994, 15, 49–61. [Google Scholar] [CrossRef]
- Thenkabail, P.S.; Ward, A.D.; Lyon, J.G.; Merry, C.J. Thematic mapper vegetation indices for determining soybean and corn growth parameters. Photogramm. Eng. Remote Sens. 1994, 60, 437–442. [Google Scholar]
- Somers, B.; Delalieux, S.; Verstraeten, W.W.; van den Eynde, A.; Barry, G.H.; Coppin, P. The contribution of the fruit component to the hyperspectral citrus canopy signal. Photogramm. Eng. Remote Sens. 2010, 76, 37–47. [Google Scholar] [CrossRef]
- Ye, X.; Sakai, K.; Manago, M.; Asada, S.; Sasao, A. Prediction of citrus yield from airborne hyperspectral imagery. Precis. Agric. 2007, 8, 111–125. [Google Scholar] [CrossRef]
- Best, S.; Salazar, F.; Bastías, R.; Leon, L. Crop load estimation model to optimize yield-quality ratio in Apple Orchards, Malus Domestica Borkh, Var. Royal Gala. J. Inf. Technol. Agric. 2008, 3, 11–18. [Google Scholar]
- Sepulcre-Canto, G.; Zarco-Tejada, P.; Jimenez-Munoz, J.; Sobrino, J.; Soriano, M.; Fereres, E.; Vega, V.; Pastor, M. Monitoring yield and fruit quality parameters in open-canopy tree crops under water stress. Implications for ASTER. Remote Sens. Environ. 2007, 107, 455–470. [Google Scholar] [CrossRef]
- Serrano, L.; González-Flor, C.; Gorchs, G. Assessment of grape yield and composition using the reflectance based Water Index in Mediterranean rainfed vineyards. Remote Sens. Environ. 2012, 118, 249–258. [Google Scholar] [CrossRef] [Green Version]
- Gallardo, R.K.; Kupferman, E.; Colonna, A. Willingness to pay for optimal “Anjou” pear quality. Hortic. Sci. 2011, 46, 452–456. [Google Scholar]
- Nicolaï, B.M.; Beullens, K.; Bobelyn, E.; Peirs, A.; Saeys, W.; Theron, K.I.; Lammertyn, J. Nondestructive measurement of fruit and vegetable quality by means of NIR spectroscopy: A review. Postharvest Biol. Technol. 2007, 46, 99–118. [Google Scholar] [CrossRef]
- Suárez, L.; Zarco-Tejada, P.J.; González-Dugo, V.; Berni, J.A.J.; Sagardoy, R.; Morales, F.; Fereres, E. Detecting water stress effects on fruit quality in orchards with time-series PRI airborne imagery. Remote Sens. Environ. 2010, 114, 286–298. [Google Scholar] [CrossRef]
- Hatfield, J.L.; Prueger, J.H. Value of using different vegetative indices to quantify agricultural crop characteristics at different growth stages under varying management practices. Remote Sens. 2010, 2, 562–578. [Google Scholar] [CrossRef]
- Sansavini, S.; Musacchi, S. Canopy architecture, training and pruning in the modern European pear orchards: An overview. Acta Hortic. 1994, 367, 152–172. [Google Scholar]
- Allen, R.G.; Pereira, L.S.; Raes, D.; Smith, M. Crop Evapotranspiration-Guidelines for Computing Crop Water Requirements-FAO Irrigation and Drainage Paper 56; FAO: Quebec City, QC, Canada, 1998. [Google Scholar]
- Mitchell, P.D.; Jerie, P.H.; Chalmers, D.J. Effects of regulated water deficits on pear tree growth, flowering, fruit growth, and yield. J. Am. Soc. Hortic. Sci. 1984, 109, 604–606. [Google Scholar]
- Van Beek, J.; Tits, L.; Somers, B.; Coppin, P. Stem water potential monitoring in pear orchards through WorldView-2 multispectral imagery. Remote Sens. 2013, 5, 6647–6666. [Google Scholar] [CrossRef]
- McGuire, R.G. Reporting of objective colour measurements. Hortic. Sci. 1992, 27, 1254–1255. [Google Scholar]
- Savitsky, A.; Golay, M.J.E. Smoothing and differentiation of data by simplified least squares procedures. Anal. Chem. 1964, 36, 1627–1639. [Google Scholar] [CrossRef]
- Janssens, P.; Deckers, T.; Elsen, F.; Elsen, A.; Schoofs, H.; Verjans, W.; Vandendriessche, H. Sensitivity of root pruned “Conference” pear to water deficit in a temperate climate. Agric. Water Manag. 2011, 99, 58–66. [Google Scholar] [CrossRef]
- Alcobendas, R.; Mirás-Avalos, J.M.; Alarcón, J.J.; Pedrero, F.; Nicolás, E. Combined effects of irrigation, crop load and fruit position on size, color and firmness of fruits in an extra-early cultivar of peach. Sci. Hortic. 2012, 142, 128–135. [Google Scholar] [CrossRef]
- Gao, B. NDWI a normalized difference water index for remote sensing of vegetation liquid water from space. Remote Sens. Environ. 1996, 58, 257–266. [Google Scholar] [CrossRef]
- Updike, T.; Comp, C. Radiometric Use of WorldView-2 Imagery Technical Note; DigitalGlobe: Longmont, CO, USA, 2010. [Google Scholar]
- Van Leeuwen, W.J.D.; Orr, B.J.; Marsh, S.E.; Herrmann, S.M. Multi-sensor NDVI data continuity: Uncertainties and implications for vegetation monitoring applications. Remote Sens. Environ. 2006, 100, 67–81. [Google Scholar] [CrossRef]
- Gamon, A.; Serrano, L.; Surfus, S. The photochemical reflectance index : An optical indicator of photosynthetic radiation use efficiency across species, functional types, and nutrient levels. Oecologia 1997, 112, 492–501. [Google Scholar] [CrossRef]
- Stagakis, S.; González-Dugo, V.; Cid, P.; Guillén-Climent, M.L.; Zarco-Tejada, P.J. Monitoring water stress and fruit quality in an orange orchard under regulated deficit irrigation using narrow-band structural and physiological remote sensing indices. ISPRS J. Photogramm. Remote Sens. 2012, 71, 47–61. [Google Scholar] [CrossRef]
- Meier, U.; Graf, H.; Hack, H.; Hess, M.; Kennel, W.; Klose, R.; Mappes, D.; Seipp, D.; Stauss, R.; Streif, J.; et al. Phaenologische entwicklungsstadien des Kernobstes (Malus domestica Borkh. und Pyrus communis L.), des Steinobstes (Prunus-Arten), der Johannisbeere (Ribes-Arten) und der Erdbeere (Fragaria x ananassa Duch.). Nachrichtenblatt Dtsch. Pflanzenschutzdienstes 1994, 46, 141–153. [Google Scholar]
- Massai, R.; Loreti, F.; Fei, C.; Legnose, S. Growth and yield of “Conference” pears grafted on quince and pear rootstocks. Acta Hortic. 2008, 617–624. [Google Scholar]
- Mpelasoka, B.S.; Behboudian, M.H.; Green, S.R. Water use, yield and fruit quality of lysimeter-grown apple trees: Responses to deficit irrigation and to crop load. Irrig. Sci. 2001, 20, 107–113. [Google Scholar]
- Barrit, B.H.; Konishi, B.S.; Drake, S.R.; Rom, C.R. Influence of sunlight level and rootstock on apple fruit quality. Acta Hortic. 1997, 451, 569–577. [Google Scholar]
- Oke, A.M.C.C.; Tapper, N.J.; Barlow, E.W.R. Within-vineyard variability in grape quality and yield and its relationship to the vineyard environment. Acta Hortic. 2007, 754, 507–514. [Google Scholar]
- Asın, L.; Alegre, S.; Montserrat, R. Effect deficit irrigation, sumer pruning and root pruning on shoot growth, yield, and return bloom, in a “Blanquilla” pear orchard. Sci. Hortic. 2007, 113, 142–148. [Google Scholar] [CrossRef]
- Suárez, L.; Zarco-Tejada, P.J.; Sepulcre-Cantó, G.; Pérez-Priego, O.; Miller, J.R.; Jiménez-Muñoz, J.C.; Sobrino, J. Assessing canopy PRI for water stress detection with diurnal airborne imagery. Remote Sens. Environ. 2008, 112, 560–575. [Google Scholar] [CrossRef]
- Treder, W. Crop loading studies with “Jonagold” Apple tree. J. Fruit Ornam. Plant Res. 2010, 18, 59–69. [Google Scholar]
- Hudina, M.; Štampar, F. The correlation of the pear (Pyrus communis L.) cv. “Williams” yield quality to the foliar nutrition and water regime. Acta Agric. Slov. 2005, 85, 179–185. [Google Scholar]
- Chan, B.G.; Cain, J.C. The effect of seed formation on subsequent flowering in apple. Proc. Am. Soc. Hortic. Sci. 1967, 91, 63–68. [Google Scholar]
- Thenkabail, P.S.; Smith, R.B.; de Pauw, E. Evaluation of narrowband and broadband vegetation indices for determining optimal hyperspectral wavebands for agricultural crop characterization. Photogramm. Eng. Remote Sens. 2002, 68, 607–621. [Google Scholar]
- Webster, A.D.; Spencer, J.E. New strategies for the chemical thinning of apple And, (Malus domestica Borkh.) cultivars Queen Cox and Royal Gala. J. Hortic. Sci. Biotechnol. 1999, 74, 337–346. [Google Scholar]
- Marsal, J.; Arbone, A.; Rufat, J.; Girona, J. Regulated deficit irrigation and rectification of irrigation scheduling in young pear trees: An evaluation based on vegetative and productive response. Eur. J. Agronomy 2002, 17, 111–122. [Google Scholar] [CrossRef]
- Wu, Y.; Zhao, Z.; Wang, W.; Ma, Y.; Huang, X. Yield and growth of mature pear trees under water deficit during slow fruit growth stages in sparse planting orchard. Sci. Hortic. 2013, 164, 189–195. [Google Scholar] [CrossRef]
- Jung, S.-K.; Choi, H.-S. Light penetration, growth, and fruit productivity in “Fuji” apple trees trained to four growing systems. Sci. Hortic. 2010, 125, 672–678. [Google Scholar] [CrossRef]
- Naor, A. Irrigation and crop load influence fruit size and water relations in field-grown “Spadona” pear. J. Am. Soc. Hortic. Sci. 2001, 126, 252–255. [Google Scholar]
- Sepulcre-Cantó, G.; Zarco-Tejada, P.J.; Sobrino, J.A.; Berni, J.A.J.; Jiménez-Muñoz, J.C.; Gastellu-Etchegorry, J.P. Discriminating irrigated and rainfed olive orchards with thermal ASTER imagery and DART 3D simulation. Agric. For. Meteorol. 2009, 149, 962–975. [Google Scholar] [CrossRef]
© 2015 by the authors; licensee MDPI, Basel, Switzerland. This article is an open access article distributed under the terms and conditions of the Creative Commons Attribution license (http://creativecommons.org/licenses/by/4.0/).
Share and Cite
Van Beek, J.; Tits, L.; Somers, B.; Deckers, T.; Verjans, W.; Bylemans, D.; Janssens, P.; Coppin, P. Temporal Dependency of Yield and Quality Estimation through Spectral Vegetation Indices in Pear Orchards. Remote Sens. 2015, 7, 9886-9903. https://doi.org/10.3390/rs70809886
Van Beek J, Tits L, Somers B, Deckers T, Verjans W, Bylemans D, Janssens P, Coppin P. Temporal Dependency of Yield and Quality Estimation through Spectral Vegetation Indices in Pear Orchards. Remote Sensing. 2015; 7(8):9886-9903. https://doi.org/10.3390/rs70809886
Chicago/Turabian StyleVan Beek, Jonathan, Laurent Tits, Ben Somers, Tom Deckers, Wim Verjans, Dany Bylemans, Pieter Janssens, and Pol Coppin. 2015. "Temporal Dependency of Yield and Quality Estimation through Spectral Vegetation Indices in Pear Orchards" Remote Sensing 7, no. 8: 9886-9903. https://doi.org/10.3390/rs70809886