
Effects of Precipitation Intensity and Temperature on NDVI-Based Grass Change over Northern China during the Period from 1982 to 2011

Abstract
:
1. Introduction
2. Data and Methods
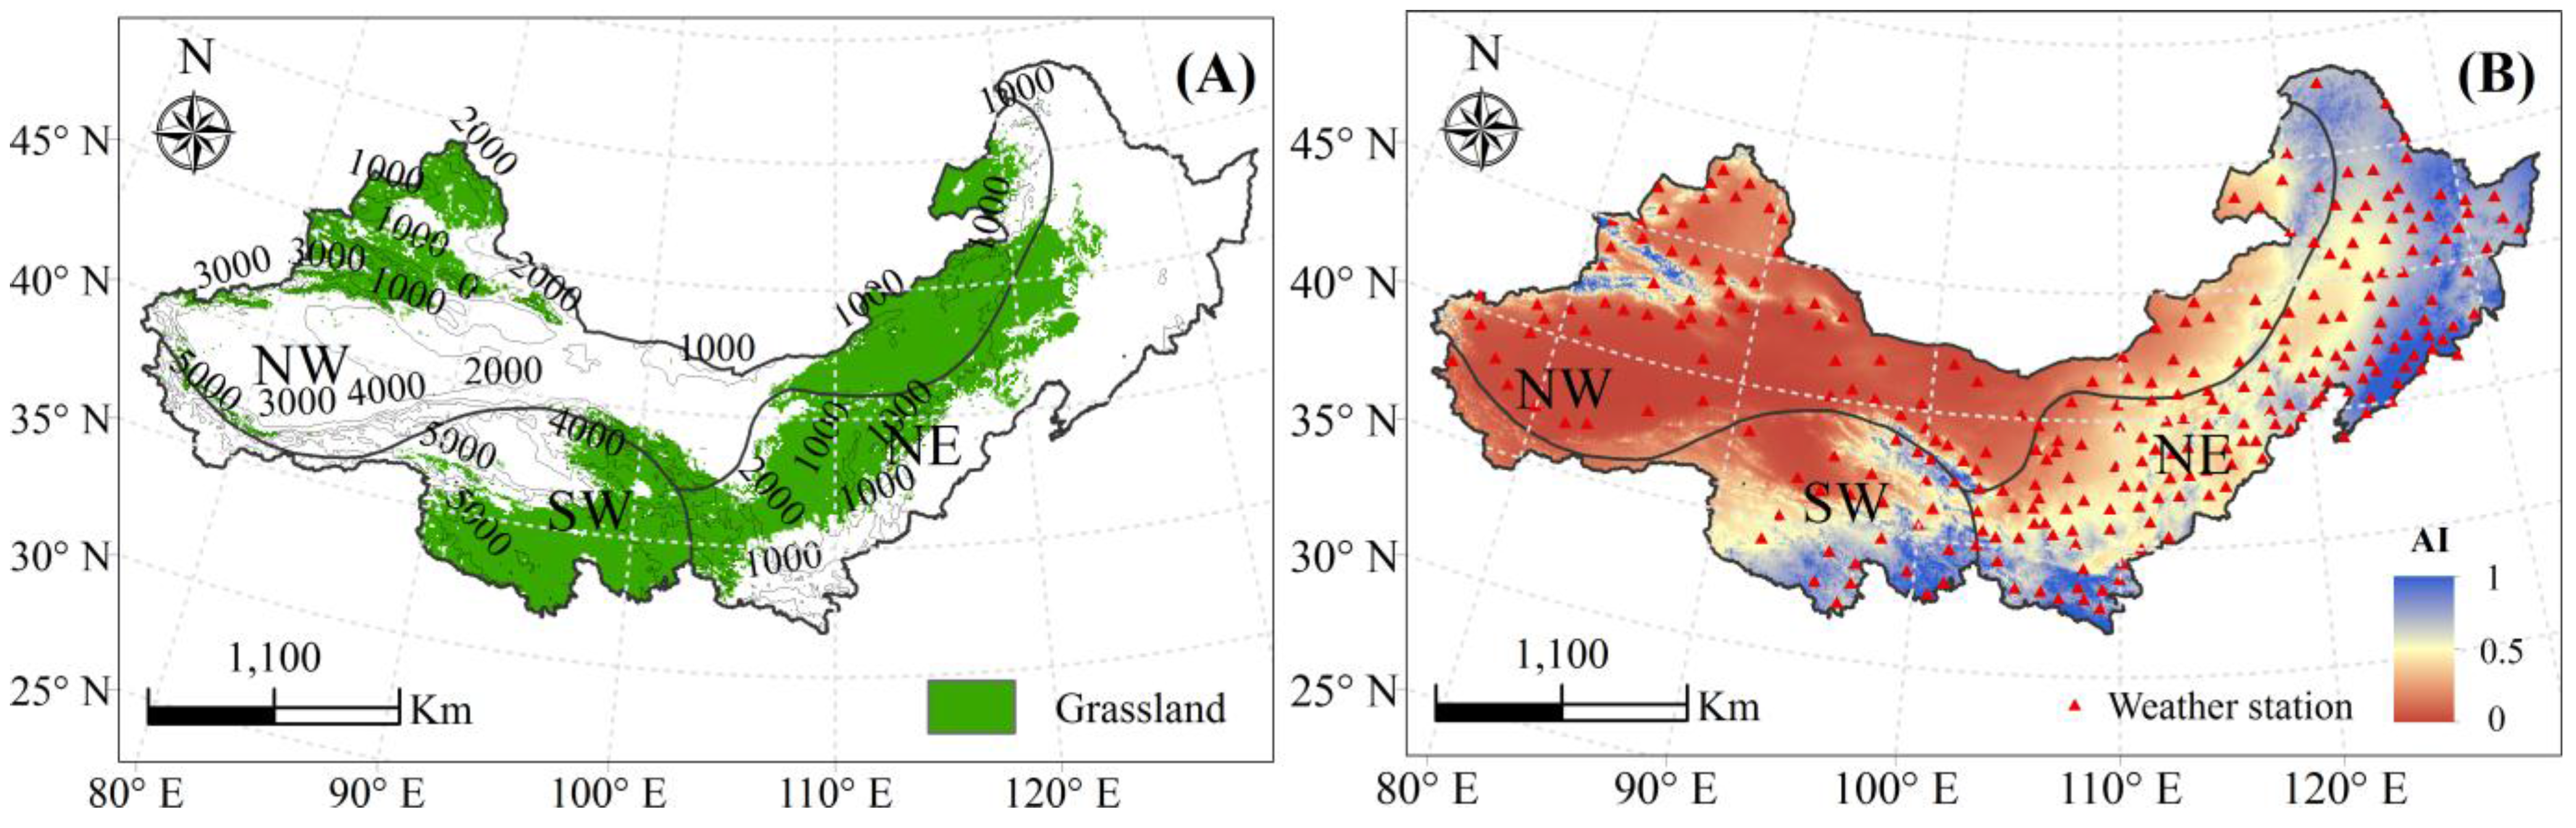
2.1. Study Area
2.2. GIMMS Data and Processing

2.3. Meteorological Data and Processing
2.4. Definition of Precipitation Intensity
2.5. Statistical Indicators
3. Results
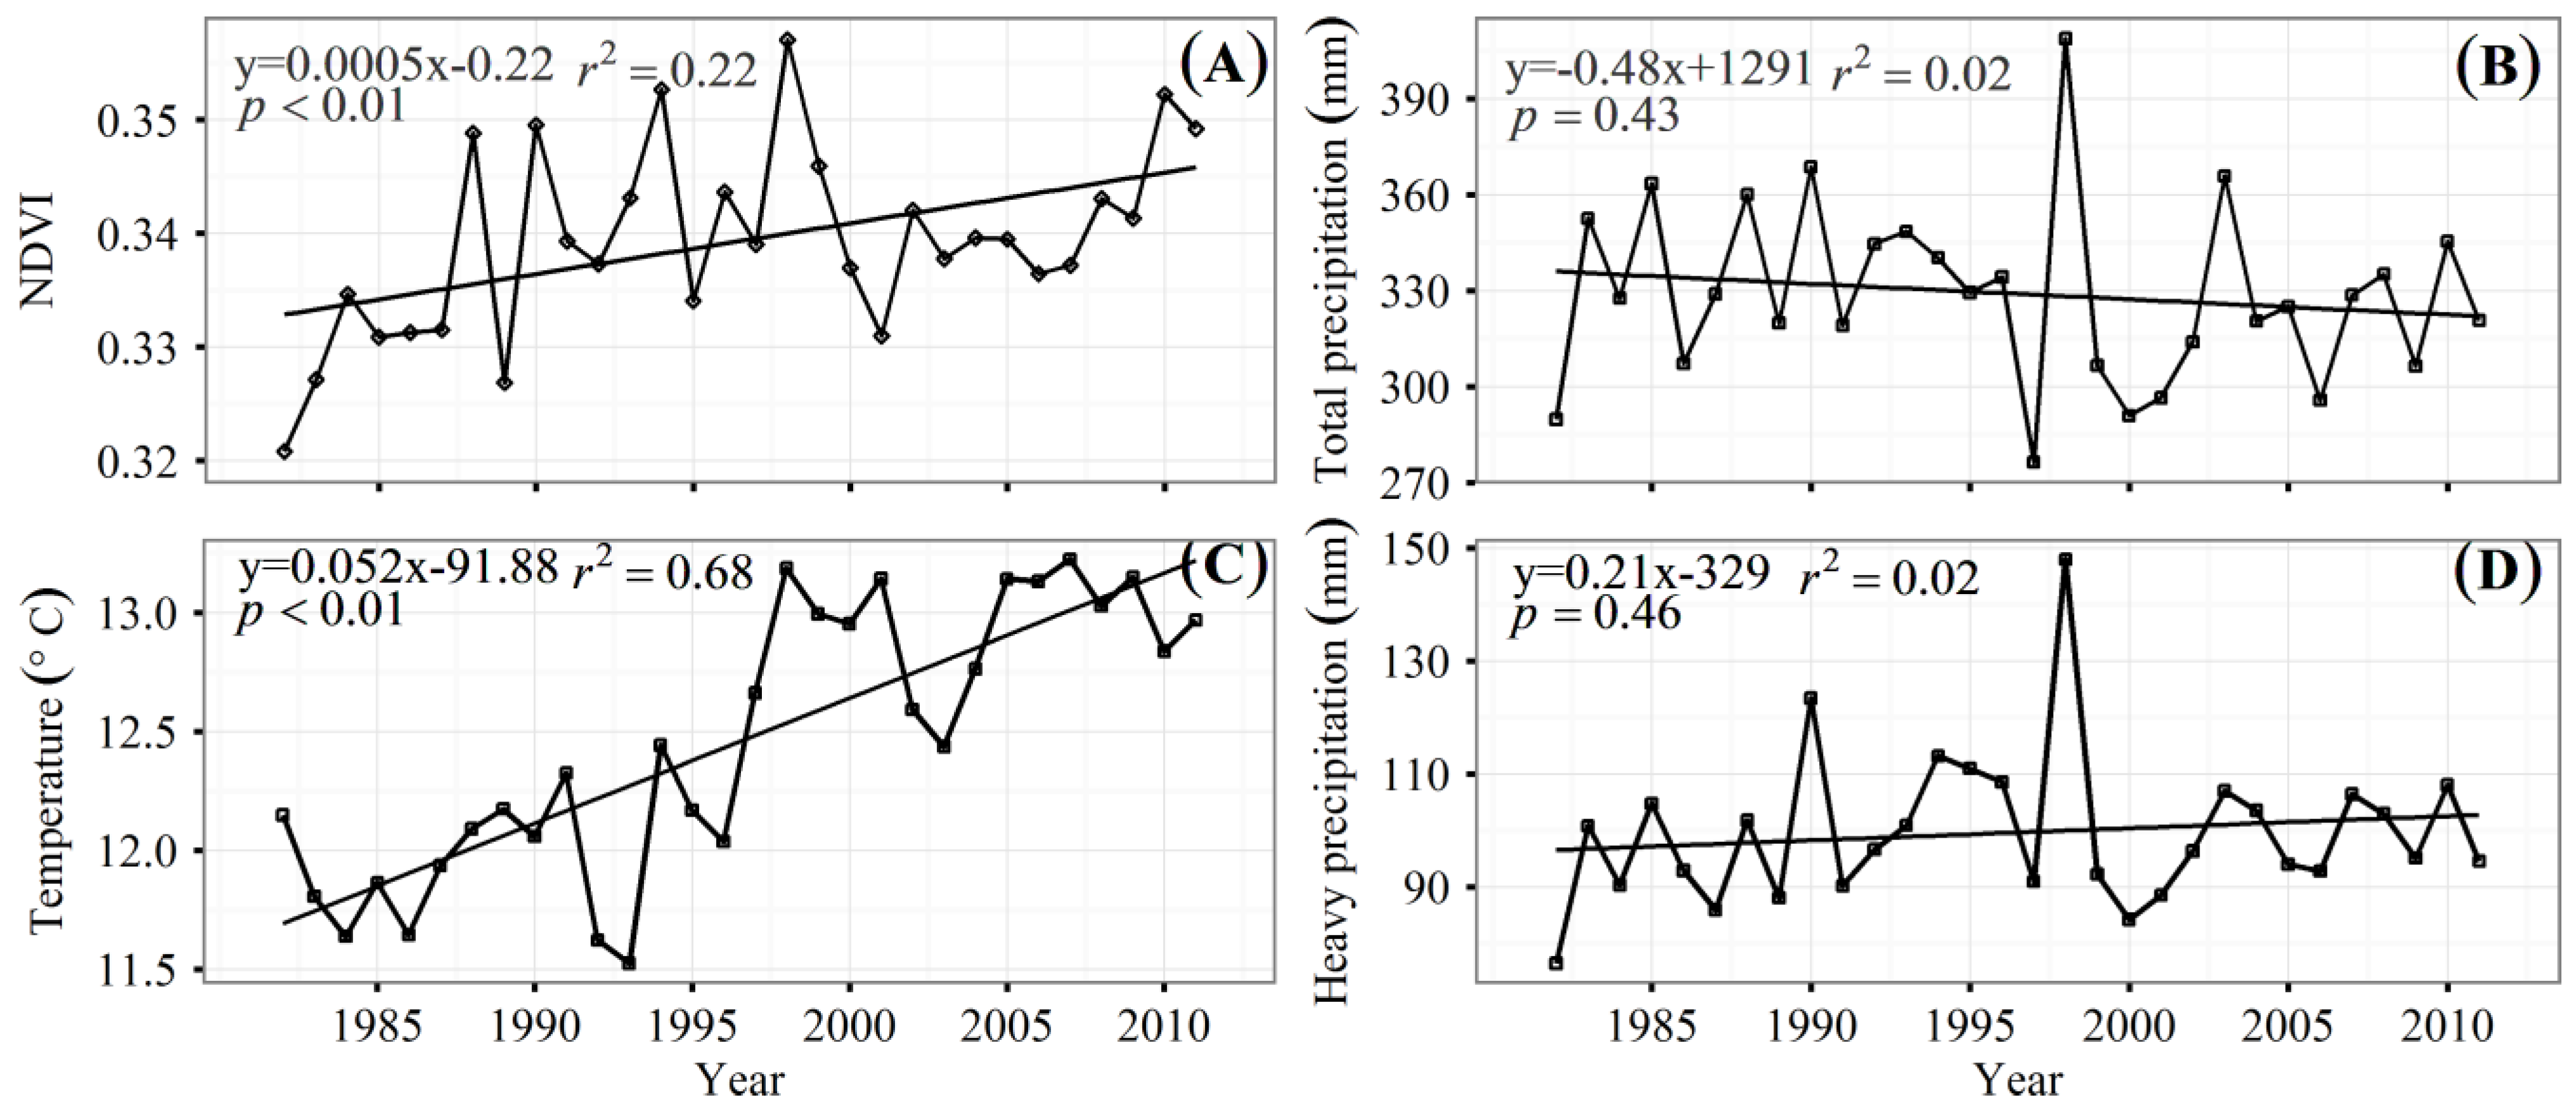
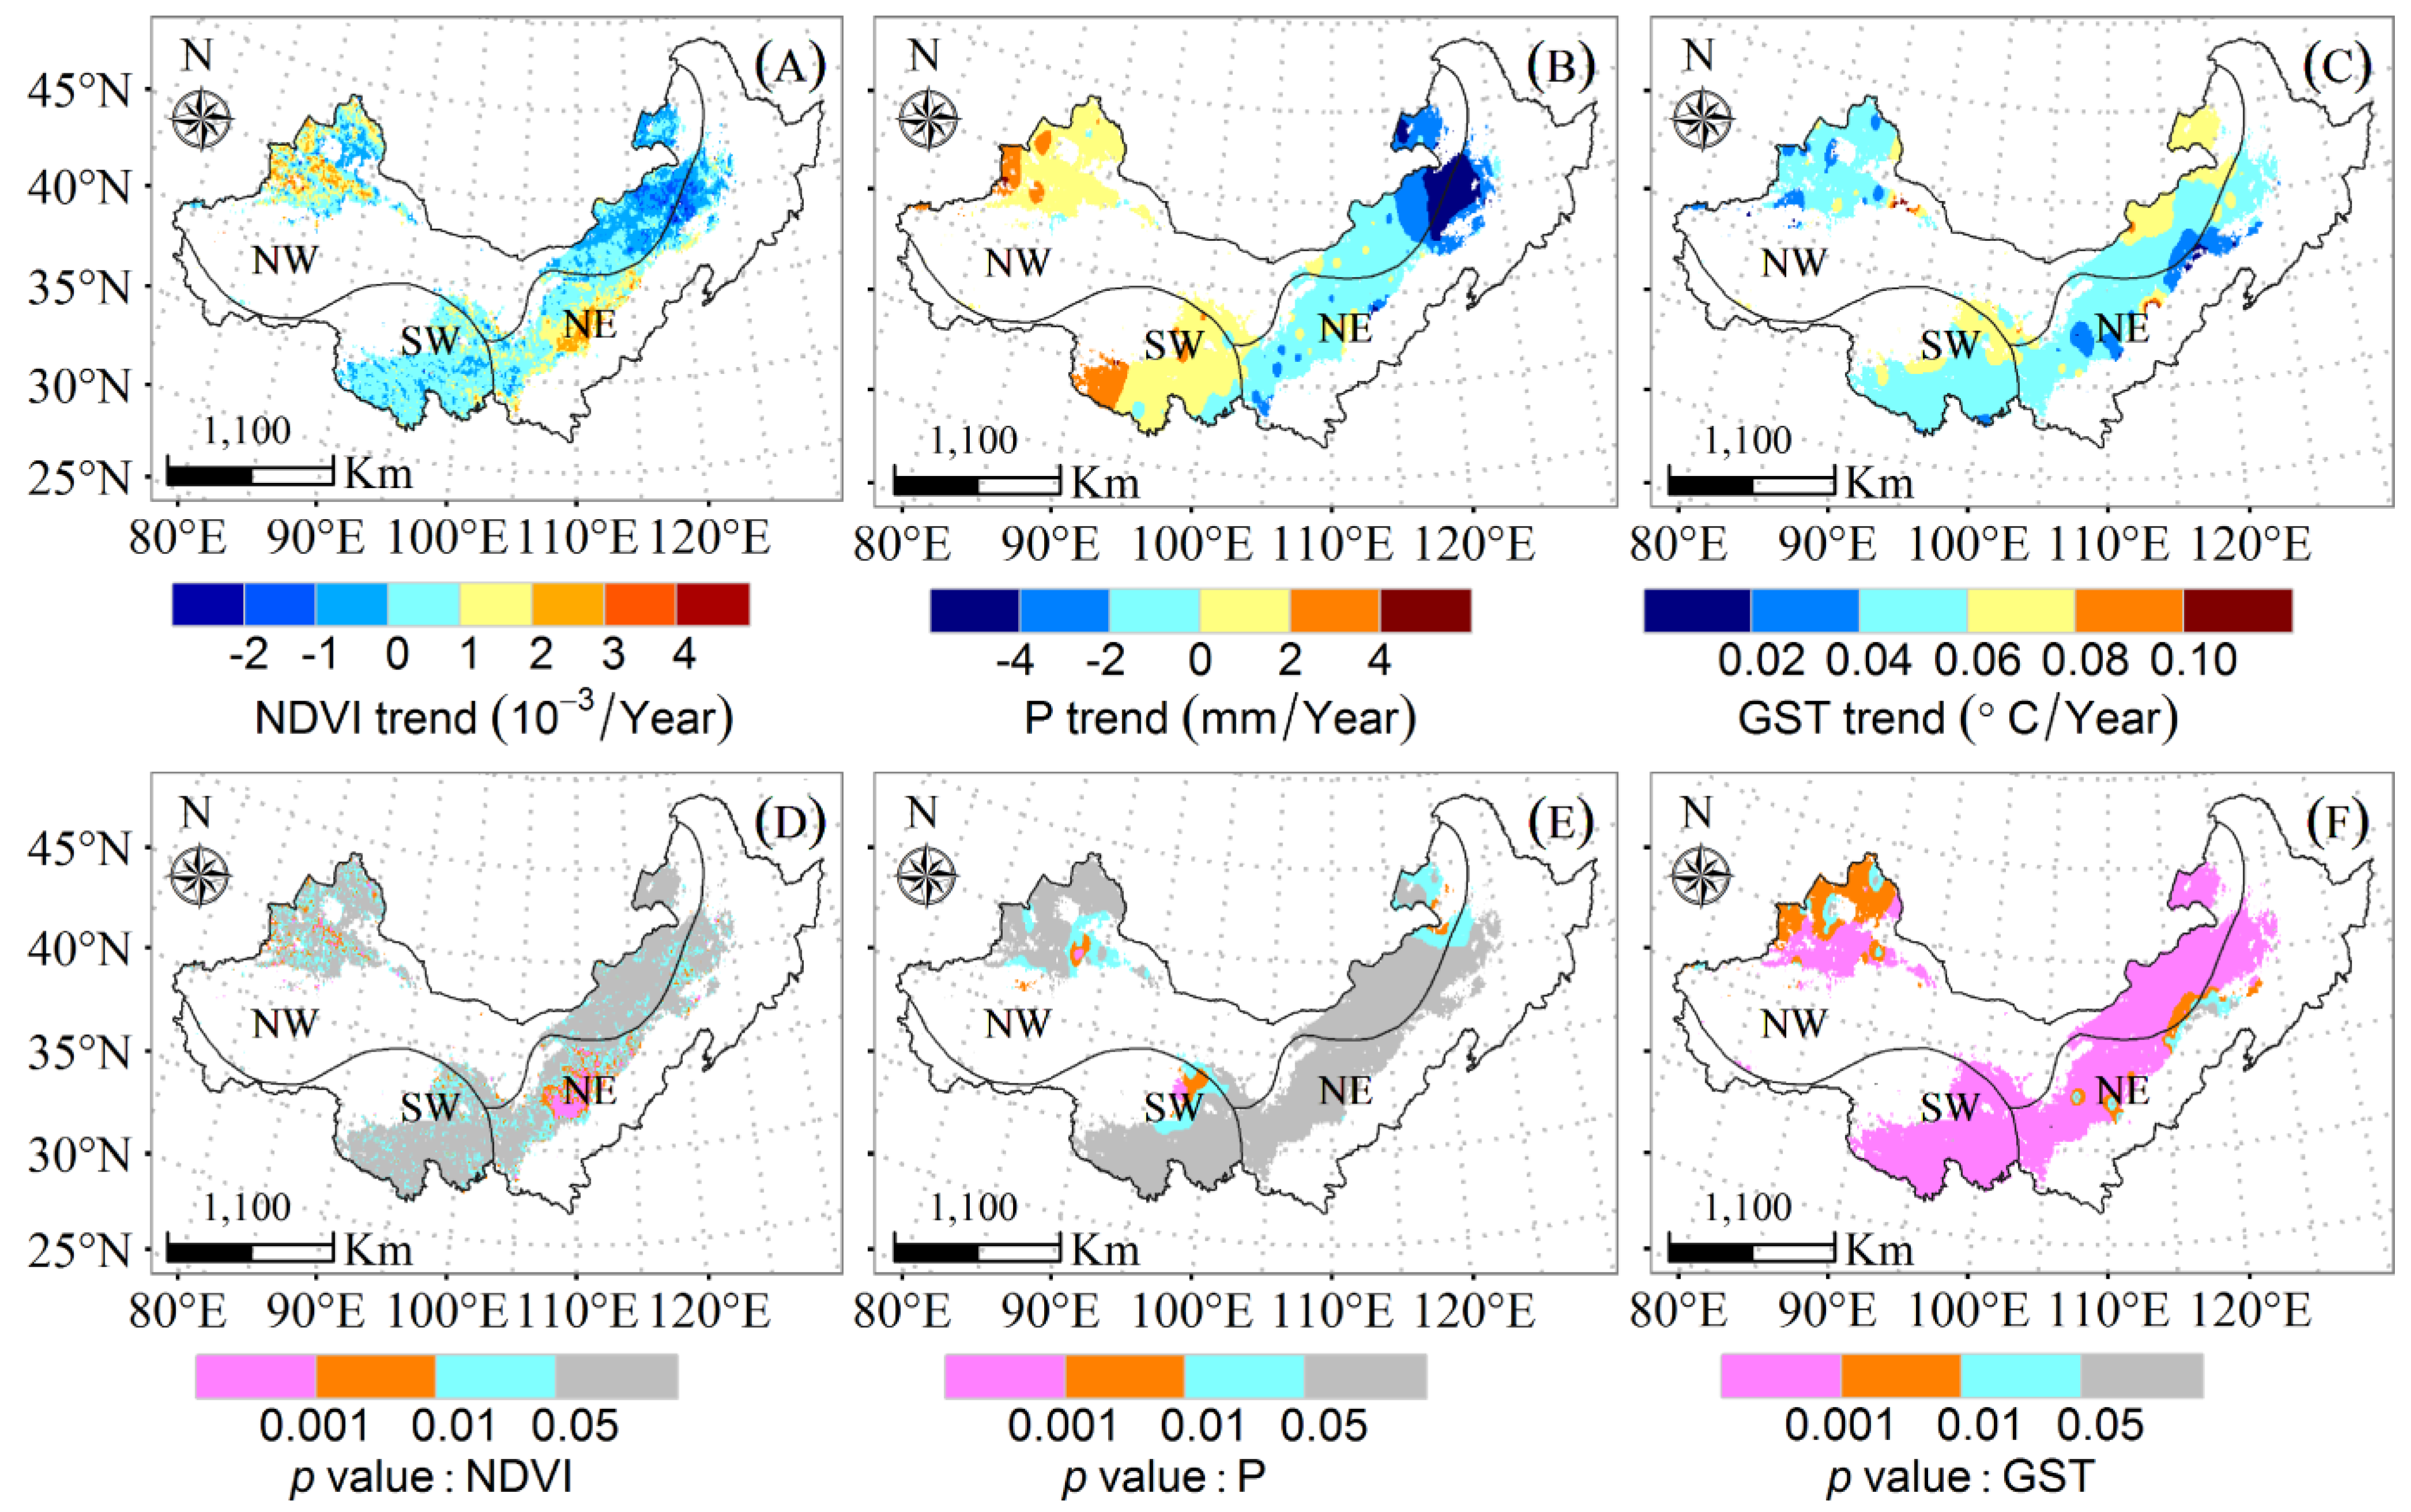
3.1. Temporal and Spatial Trends of NDVI, Precipitation and GST


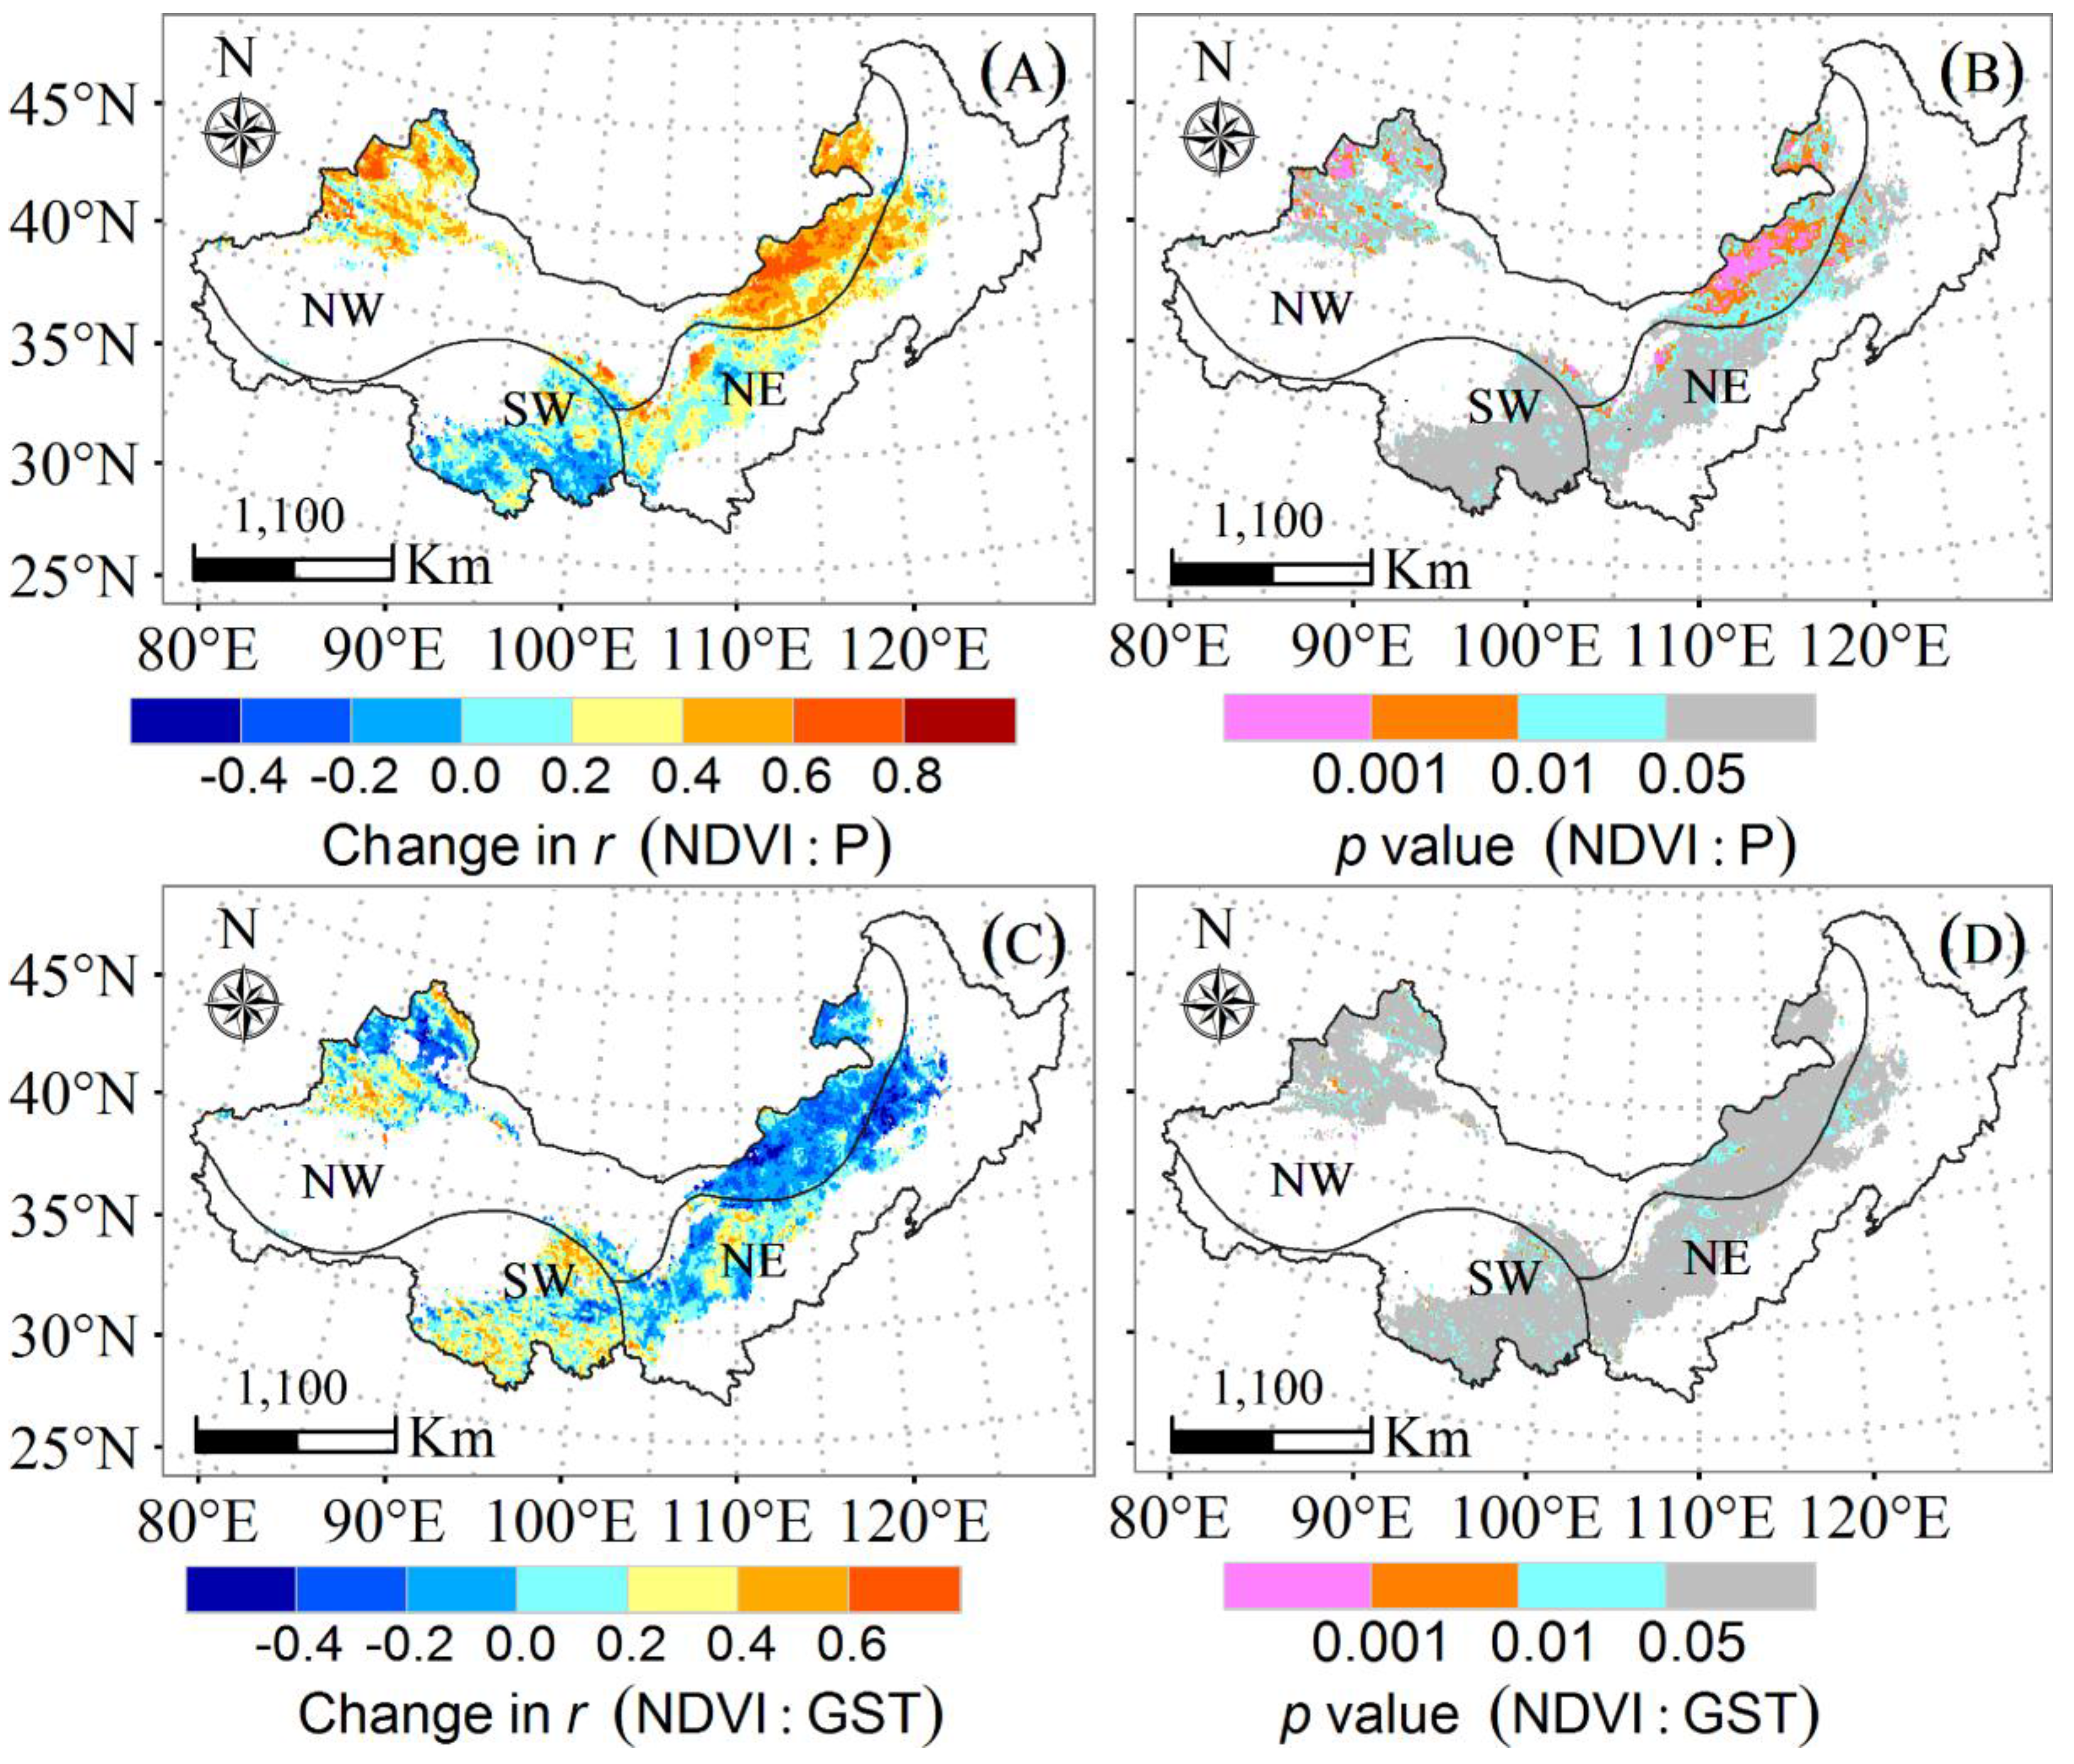
3.2. Response of NDVI to Precipitation and GST

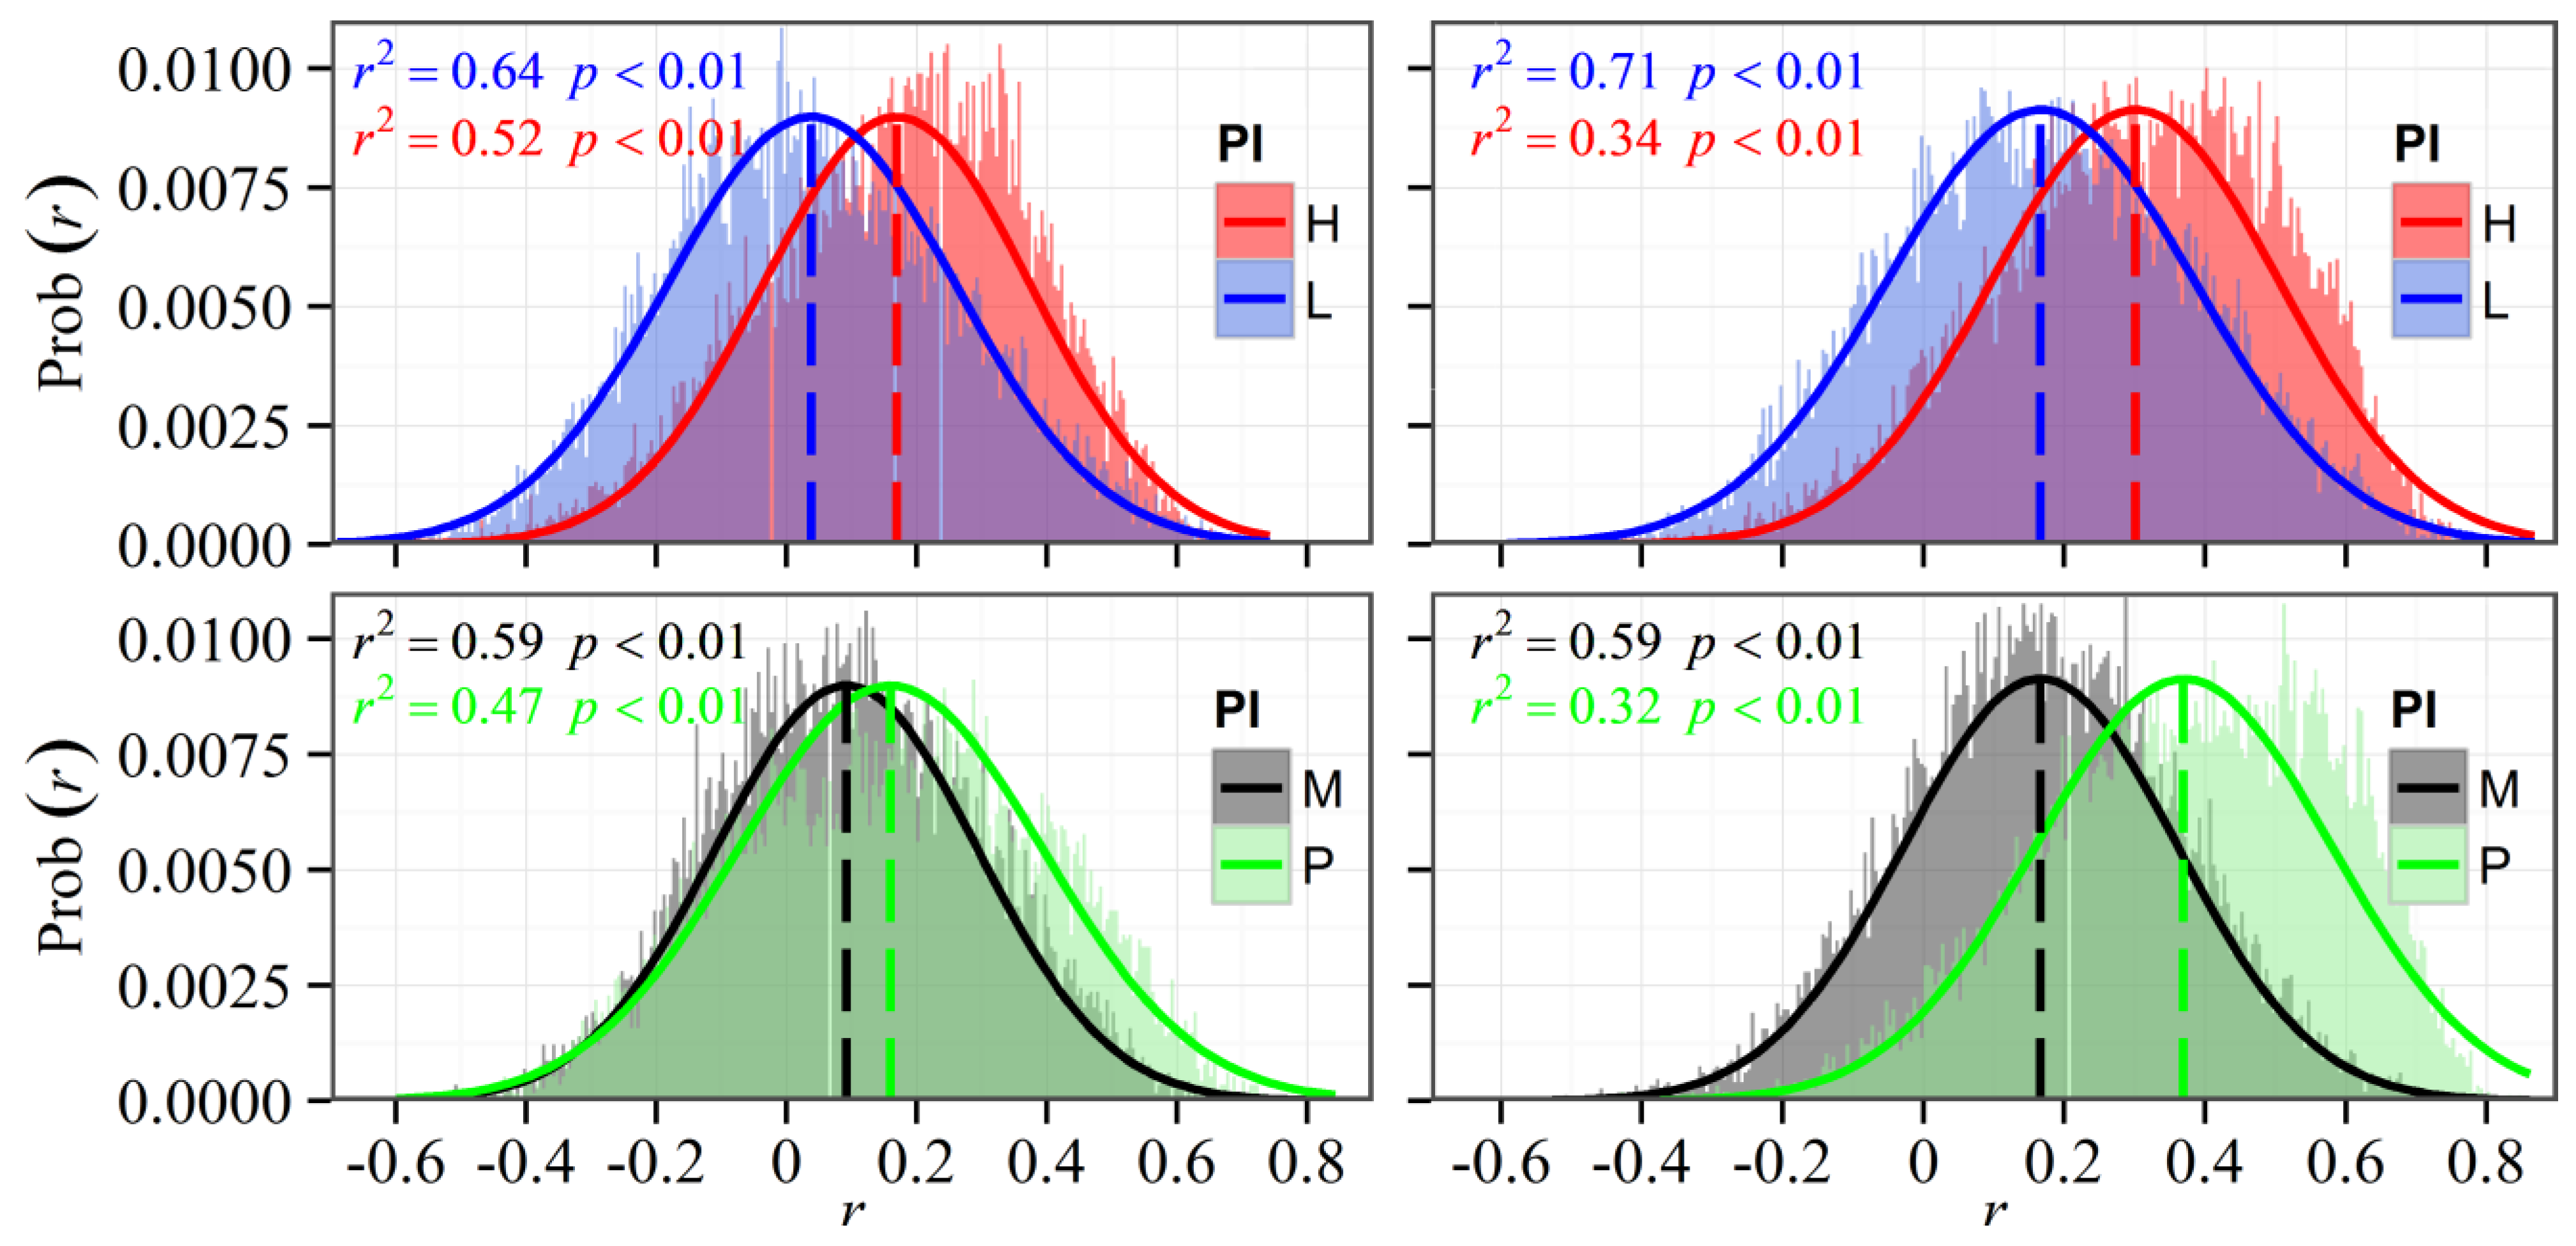
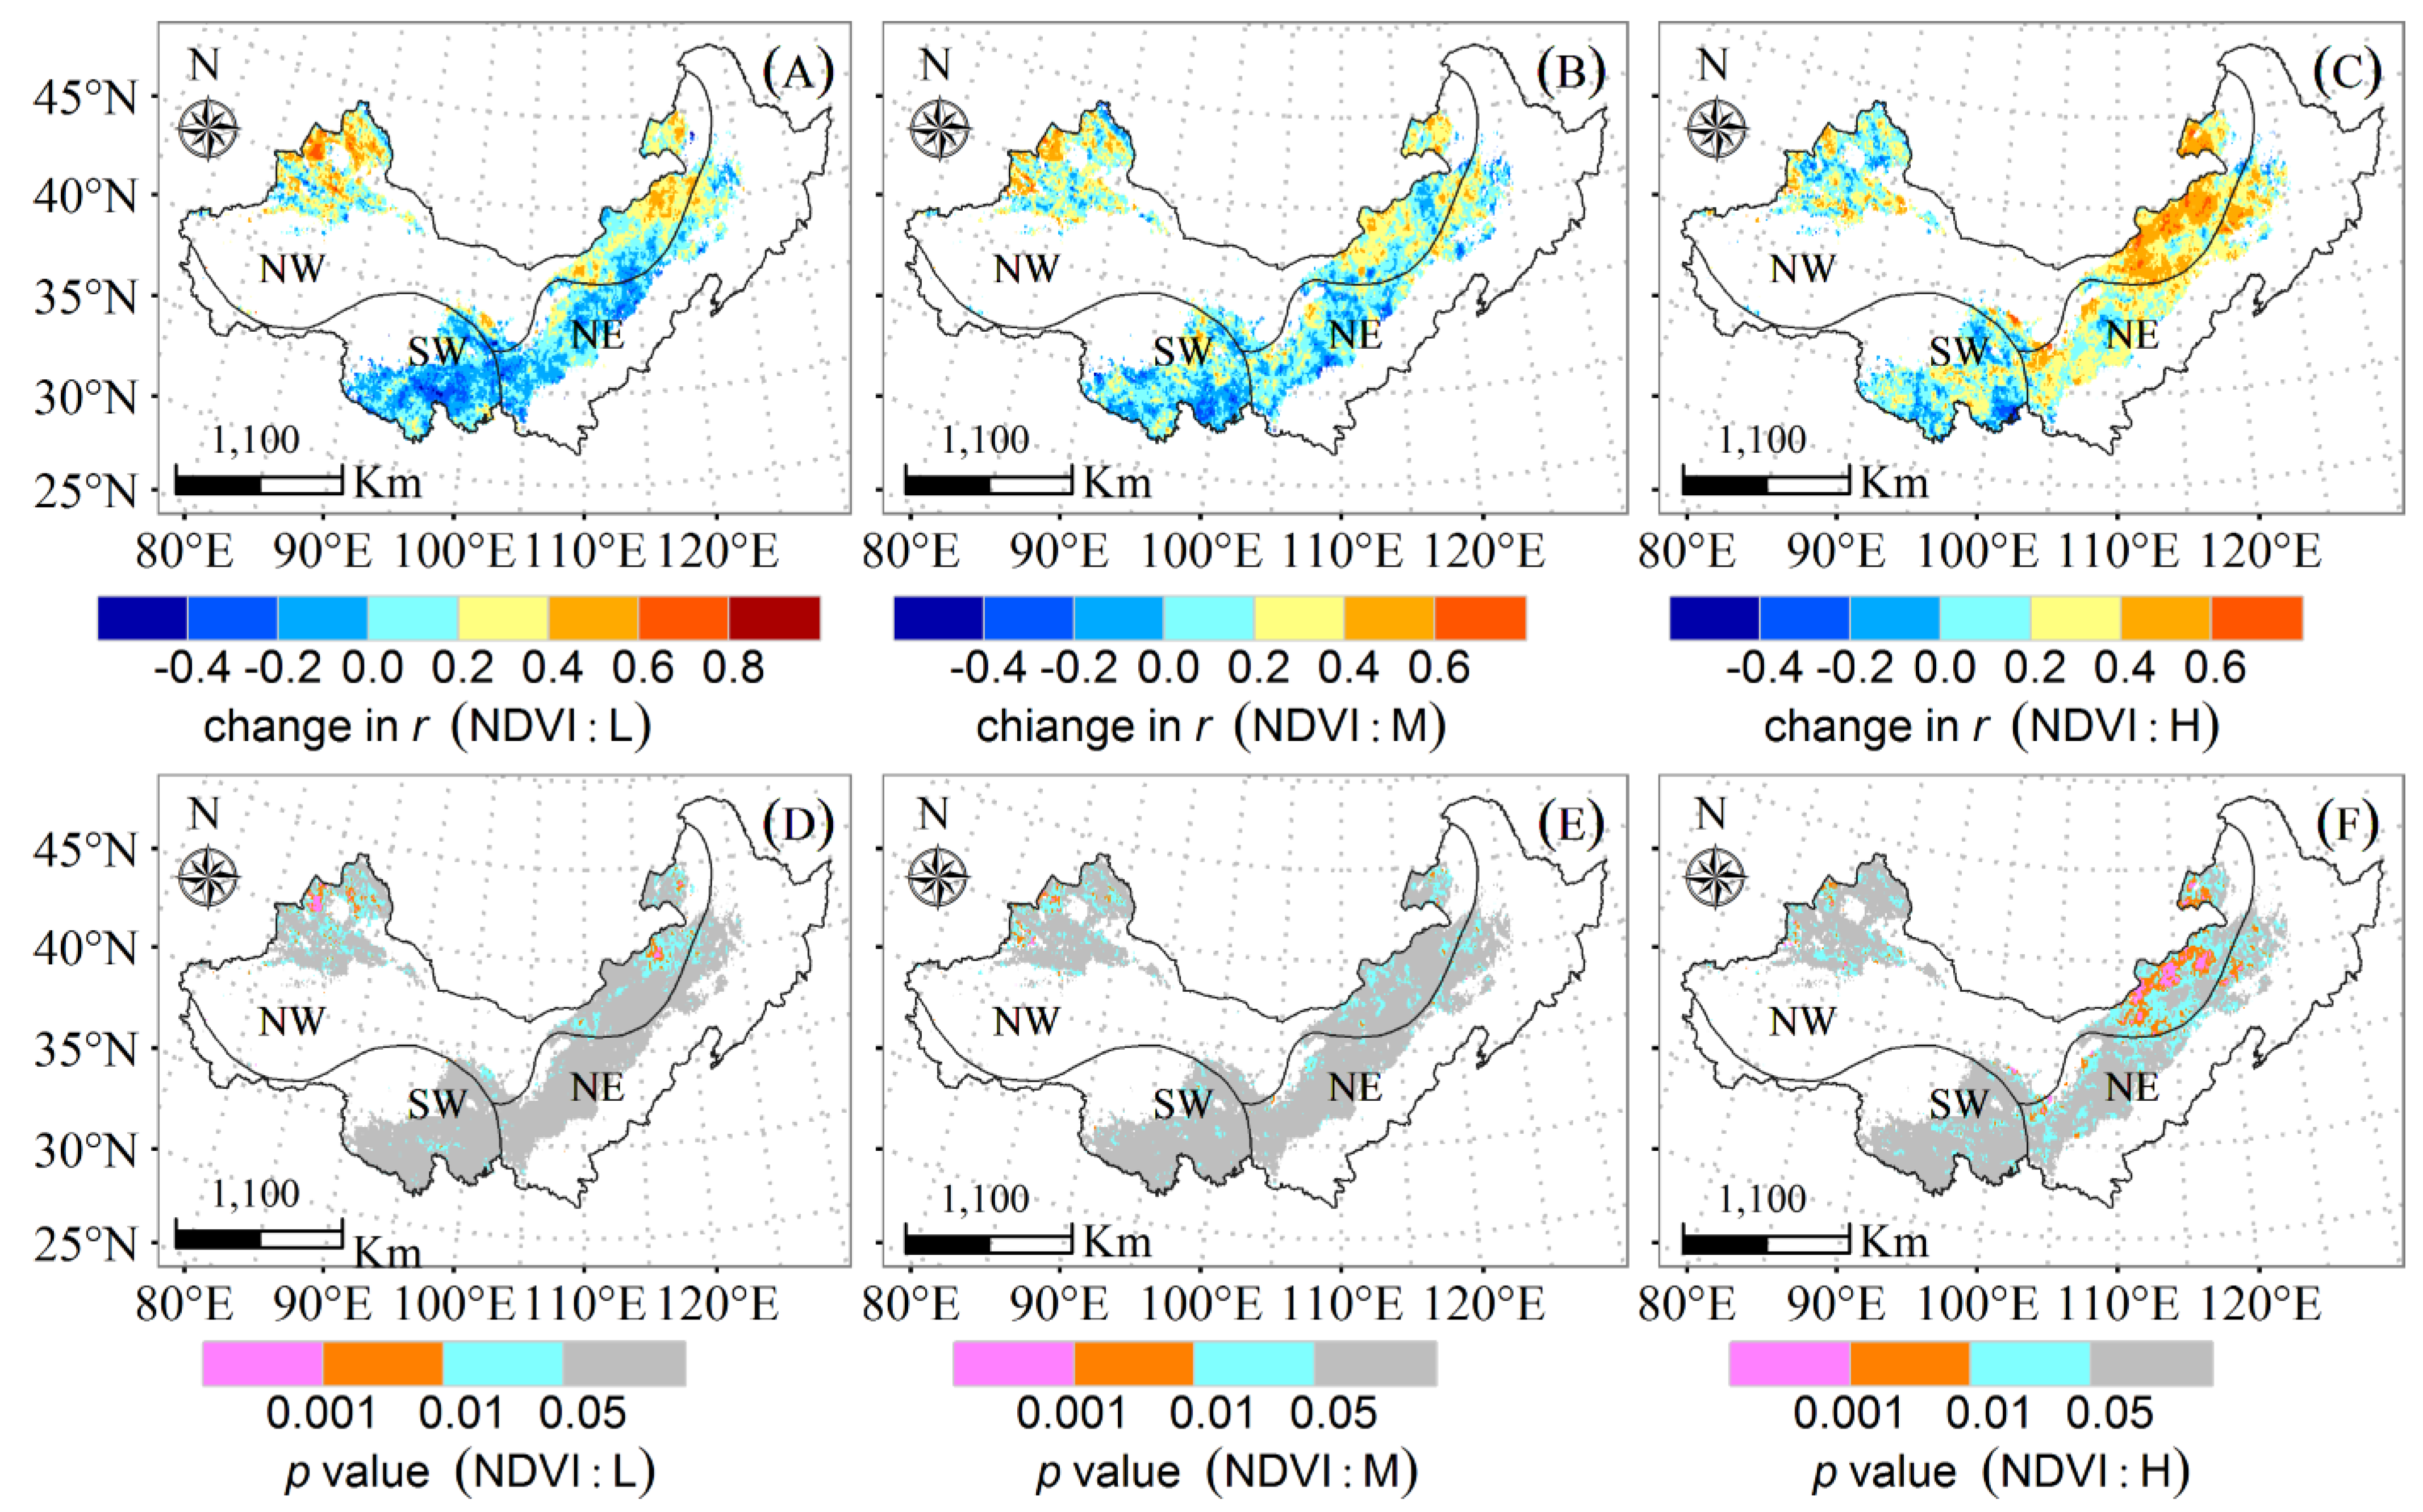
3.3. Sensitivities of NDVI to GST and Precipitation Intensity

| Region | Precipitation Intensities and GST | Total Precipitation and GST | ||||||
|---|---|---|---|---|---|---|---|---|
| a1 | a2 | a3 | a4 | Perc | b1 | b2 | Perc | |
| RAA | 0.37± 0.23 | 0.2 ± 0.21 | 0.23 ± 0.25 | 0.13 ± 0.26 | 57% | 0.39 ± 0.22 | 0.13 ± 0.25 | 64% |
| RHA | 0.19 ± 0.23 | 0.11 ± 0.24 | 0.06 ± 0.29 | 0.21 ± 0.3 | 47% | 0.24 ± 0.29 | 0.21 ± 0.3 | 56% |


4. Discussion
4.1. Response of Grass NDVI to Precipitation and GST
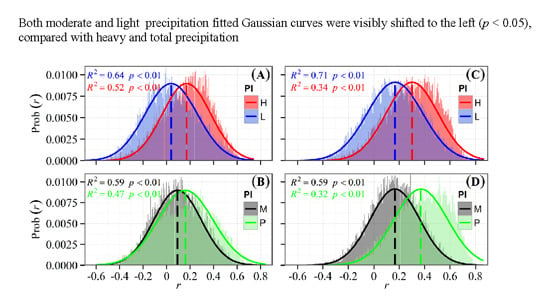
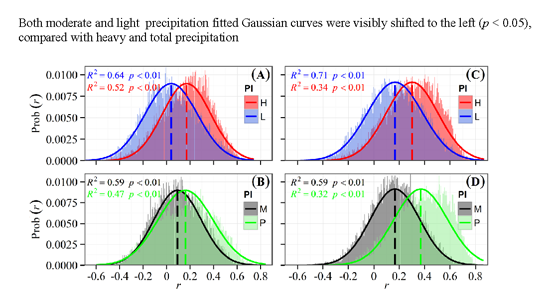
4.2. Response of Grass NDVI to Precipitation Intensity
| Intensity | RHA | RAA | ||||||
|---|---|---|---|---|---|---|---|---|
| Composition | Frequency | Composition | Frequency | |||||
| Quantity | Percentage | Number | Percentage | Quantity | Percentage | Number | Percentage | |
| Light | 187.7 | 46.3% | 139.3 | 87% | 107.9 | 39.9% | 102.8 | 86.2% |
| Moderate | 112.4 | 27.8% | 14.8 | 9% | 62.5 | 23.1% | 10 | 8.4% |
| Heavy | 104.8 | 25.9% | 6 | 3.7% | 100 | 37% | 6.4 | 5.4% |
4.3. Outlook and Uncertainties in the Study
5. Conclusions
Acknowledgments
Author Contributions
Conflicts of Interest
References
- Braswell, B.H.; Schimel, D.S.; Linder, E.; Moore, B. The response of global terrestrial ecosystems to interannual temperature variability. Science 1997, 278, 870–872. [Google Scholar]
- Fay, P.A.; Kaufman, D.M.; Nippert, J.B.; Carlisle, J.D.; Harper, C.W. Changes in grassland ecosystem function due to extreme rainfall events: Implications for responses to climate change. Global Chang. Biol. 2008, 14, 1600–1608. [Google Scholar] [CrossRef]
- Piao, S.L.; Wang, X.H.; Ciais, P.; Zhu, B.; Wang, T.; Liu, J. Changes in satellite-derived vegetation growth trend in temperate and boreal Eurasia from 1982 to 2006. Global Chang. Biol. 2011, 17, 3228–3239. [Google Scholar] [CrossRef]
- Ichii, K.; Kawabata, A.; Yamaguchi, Y. Global correlation analysis for NDVI and climatic variables and NDVI trends: 1982–1990. Int. J. Remote Sens. 2010, 23, 3873–3878. [Google Scholar] [CrossRef]
- Pettorelli, N.; Vik, J.O.; Mysterud, A.; Gaillard, J.M.; Tucker, C.J.; Stenseth, N.C. Using the satellite-derived NDVI to assess ecological responses to environmental change. Trends Ecol. Evol. 2005, 20, 503–510. [Google Scholar] [CrossRef] [PubMed]
- Lee, R.; Yu, F.; Price, K.P.; Ellis, J.; Shi, P. Evaluating vegetation phenological patterns in Inner Mongolia using NDVI time-series analysis. Int. J. Remote Sens. 2002, 23, 2505–2512. [Google Scholar] [CrossRef]
- Myneni, R.B.; Keeling, C.D.; Tucker, C.J.; Asrar, G.; Nemani, R.R. Increased plant growth in the northern high latitudes from 1981 to 1991. Nature 1997, 386, 698–702. [Google Scholar] [CrossRef]
- Zhou, L.M.; Tucker, C.J.; Kaufmann, R.K.; Slayback, D.; Shabanov, N.V.; Myneni, R.B. Variations in northern vegetation activity inferred from satellite data of vegetation index during 1981 to 1999. J. Geophys. Res.-Atmos. 2001, 106, 20069–20083. [Google Scholar] [CrossRef]
- Xiao, X.; Ojima, D.S.; Parton, W.J.; Chen, Z.; Chen, D. Sensitivity of Inner Mongolia grasslands to climate change. J. Biogeogr. 1995, 22, 643–648. [Google Scholar] [CrossRef]
- Yang, L.M.; Wylie, B.K.; Tieszen, L.L.; Reed, B.C. An analysis of relationships among climate forcing and time-integrated NDVI of grasslands over the US northern and central Great Plains. Remote Sens. Environ. 1998, 65, 25–37. [Google Scholar] [CrossRef]
- Huete, A.; Didan, K.; Miura, T.; Rodriguez, E.P.; Gao, X.; Ferreira, L.G. Overview of the radiometric and biophysical performance of the MODIS vegetation indices. Remote Sens. Environ. 2002, 83, 195–213. [Google Scholar] [CrossRef]
- Fang, J.Y.; Piao, S.L.; Zhou, L.M.; He, J.S.; Wei, F.Y.; Myneni, R.B.; Tucker, C.J.; Tan, K. Precipitation patterns alter growth of temperate vegetation. Geophys. Res. Lett. 2005, 32, L21411. [Google Scholar] [CrossRef]
- Chamaille-Jammes, S.; Fritz, H.; Murindagomo, F. Spatial patterns of the NDVI-rainfall relationship at the seasonal and interannual time scales in an African savanna. Int. J. Remote Sens. 2006, 27, 5185–5200. [Google Scholar] [CrossRef]
- Zhang, G.L.; Xu, X.L.; Zhou, C.P.; Zhang, H.B.; Ouyang, H. Responses of grassland vegetation to climatic variations on different temporal scales in Hulun Buir Grassland in the past 30 years. J. Geogr. Sci. 2011, 21, 634–650. [Google Scholar] [CrossRef]
- Yang, Y.H.; Fang, J.Y.; Ma, W.H.; Wang, W. Relationship between variability in aboveground net primary production and precipitation in global grasslands. Geophys. Res. Lett. 2008, 35, L23710. [Google Scholar] [CrossRef]
- Mohammat, A.; Wang, X.H.; Xu, X.T.; Peng, L.Q.; Yang, Y.; Zhang, X.P.; Myneni, R.B.; Piao, S.L. Drought and spring cooling induced recent decrease in vegetation growth in Inner Asia. Agric. For. Meteorol. 2013, 178, 21–30. [Google Scholar] [CrossRef]
- Wang, J.; Rich, P.M.; Price, K.P. Temporal responses of NDVI to precipitation and temperature in the central Great Plains, USA. Int. J. Remote Sens. 2003, 24, 2345–2364. [Google Scholar] [CrossRef]
- Dai, L.; Zhang, L.; Wang, K.; Wang, R.L. Response of vegetation to climate change in the drylands of East Asia. IOP Conf. Ser.: Earth Environ. Sci. 2014, 17. [Google Scholar] [CrossRef]
- Justice, C.O.; Holben, B.N.; Gwynne, M.D. Monitoring East-African vegetation using AVHRR data. Int. J. Remote Sens. 1986, 7, 1453–1474. [Google Scholar] [CrossRef]
- Onema, J.M.K.; Taigbenu, A. NDVI-rainfall relationship in the Semliki watershed of the equatorial Nile. Phys. Chem. Earth 2009, 34, 711–721. [Google Scholar] [CrossRef]
- Piao, S.L.; Fang, J.Y.; Zhou, L.M.; Guo, Q.H.; Henderson, M.; Ji, W.; Li, Y.; Tao, S. Interannual variations of monthly and seasonal normalized difference vegetation index (NDVI) in China from 1982 to 1999. J. Geophys. Res.-Atmos. 2003, 108, D144401. [Google Scholar] [CrossRef]
- Zhao, X.; Tan, K.; Zhao, S.; Fang, J. Changing climate affects vegetation growth in the arid region of the northwestern China. J. Arid Environ. 2011, 75, 946–952. [Google Scholar] [CrossRef]
- Piao, S.L.; Mohammat, A.; Fang, J.Y.; Cai, Q.; Feng, J.M. NDVI-based increase in growth of temperate grasslands and its responses to climate changes in China. Global Environ. Chang.-Hum. Policy Dimens. 2006, 16, 340–348. [Google Scholar] [CrossRef]
- Wang, X.H.; Piao, S.L.; Ciais, P.; Li, J.S.; Friedlingstein, P.; Koven, C.; Chen, A.P. Spring temperature change and its implication in the change of vegetation growth in North America from 1982 to 2006. Proc. Natl. Acad. Sci. USA 2011, 108, 1240–1245. [Google Scholar] [CrossRef] [PubMed]
- Park, H.S.; Sohn, B.J. Recent trends in changes of vegetation over East Asia coupled with temperature and rainfall variations. J. Geophys. Res.-Atmos. 2010, 115, D14101. [Google Scholar] [CrossRef]
- Peng, S.S.; Piao, S.L.; Ciais, P.; Fang, J.Y.; Wang, X.H. Change in winter snow depth and its impacts on vegetation in China. Global Chang. Biol. 2010, 16, 3004–3013. [Google Scholar] [CrossRef]
- Del Grosso, S.; Parton, W.; Stohlgren, T.; Zheng, D.L.; Bachelet, D.; Prince, S.; Hibbard, K.; Olson, R. Global potential net primary production predicted from vegetation class, precipitation, and temperature. Ecology 2008, 89, 2117–2126. [Google Scholar] [CrossRef] [PubMed]
- Peng, S.S.; Chen, A.P.; Xu, L.; Cao, C.X.; Fang, J.Y.; Myneni, R.B.; Pinzon, J.E.; Tucker, C.J.; Piao, S.L. Recent change of vegetation growth trend in China. Environ. Res. Lett. 2011, 6. [Google Scholar] [CrossRef]
- Ni, J. Estimating net primary productivity of grasslands from field biomass measurements in temperate northern China. Plant Ecol. 2004, 174, 217–234. [Google Scholar] [CrossRef]
- Zhai, P.M.; Zhang, X.B.; Wan, H.; Pan, X.H. Trends in total precipitation and frequency of daily precipitation extremes over China. J. Clim. 2005, 18, 1096–1108. [Google Scholar] [CrossRef]
- Qian, W.; Lin, X. Regional trends in recent precipitation indices in China. Meteorol. Atmos. Phys. 2005, 90, 193–207. [Google Scholar] [CrossRef]
- Wu, F.T.; Fu, C.B. Change of precipitation intensity spectra at different spatial scales under warming conditions. Chin. Sci. Bull. 2013, 58, 1385–1394. [Google Scholar] [CrossRef]
- Song, S.; Li, L.; Chen, X.; Bai, J. The dominant role of heavy precipitation in precipitation change despite opposite trends in west and east of northern China. Int. J. Climatol. 2015. [Google Scholar] [CrossRef]
- Zhang, L.; Guo, H.; Jia, G.; Wylie, B.; Gilmanov, T.; Howard, D.; Ji, L.; Xiao, J.; Li, J.; Yuan, W.; et al. Net ecosystem productivity of temperate grasslands in northern China: An upscaling study. Agric. For. Meteorol. 2014, 184, 71–81. [Google Scholar] [CrossRef]
- Yang, Y.H.; Fang, J.Y.; Fay, P.A.; Bell, J.E.; Ji, C.J. Rain use efficiency across a precipitation gradient on the Tibetan Plateau. Geophys. Res. Lett. 2010, 37. [Google Scholar] [CrossRef]
- Dataset of Global Inventory Modeling and Mapping Studies NDVI3g. Available online: http://ecocast.arc.nasa.gov/data/pub/gimms/3g/ (accessed on 25 Septemper 2014).
- Hogda, K.A.; Tommervik, H.; Karlsen, S.R. Trends in the start of the growing season in Fennoscandia 1982–2011. Remote Sens. 2013, 5, 4304–4318. [Google Scholar] [CrossRef]
- Wang, J.B.; Dong, J.W.; Liu, J.Y.; Huang, M.; Li, G.C.; Running, S.W.; Smith, W.K.; Harris, W.; Saigusa, N.; Kondo, H.; et al. Comparison of gross primary productivity derived from GIMMS NDVI3g, GIMMS, and MODIS in Southeast Asia. Remote Sens. 2014, 6, 2108–2133. [Google Scholar] [CrossRef]
- Holben, B.N. Characteristics of maximum-value composite images from temporal Avhrr data. Int. J. Remote Sens. 1986, 7, 1417–1434. [Google Scholar] [CrossRef]
- Dataset of Daily Precipitation and Temperature from China Meteorological Data Sharing Service System. Available online: http://cdc.cma.gov.cn (accessed on 5 Septemper 2012).
- Liston, G.E.; Elder, K. A meteorological distribution system for high-resolution terrestrial modeling (MicroMet). J. Hydrometeorol. 2006, 7, 217–234. [Google Scholar] [CrossRef]
- Ly, S.; Charles, C.; Degre, A. Different methods for spatial interpolation of rainfall data for operational hydrology and hydrological modeling at watershed scale. A review. Biotechnol. Agron. Soc. Environ. 2013, 17, 392–406. [Google Scholar]
- Masih, I.; Maskey, S.; Uhlenbrook, S.; Smakhtin, V. Assessing the impact of areal precipitation input on streamflow simulations using the SWAT model. J. Am. Water Resour. Assoc. 2011, 47, 179–195. [Google Scholar] [CrossRef]
- Qian, W.H.; Fu, J.K.; Yan, Z.W. Decrease of light rain events in summer associated with a warming environment in China during 1961–2005. Geophys. Res. Lett. 2007, 34, L11705. [Google Scholar] [CrossRef]
- Zhai, P.M.; Sun, A.J.; Ren, F.M.; Liu, X.N.; Gao, B.; Zhang, Q. Chances of climate extremes in China. Clim. Chang. 1999, 42, 203–218. [Google Scholar] [CrossRef]
- Peng, S.S.; Piao, S.L.; Shen, Z.H.; Ciais, P.; Sun, Z.Z.; Chen, S.P.; Bacour, C.; Peylin, P.; Chen, A.P. Precipitation amount, seasonality and frequency regulate carbon cycling of a semi-arid grassland ecosystem in Inner Mongolia, China: A modeling analysis. Agric. For. Meteorol. 2013, 178, 46–55. [Google Scholar] [CrossRef]
- Karl, T.R.; Knight, R.W. Secular trends of precipitation amount, frequency, and intensity in the United States. Bull. Am. Meteorol. Soc. 1998, 79, 231–241. [Google Scholar] [CrossRef]
- Liu, B.; Xu, M.; Henderson, M. Where have all the showers gone? Regional declines in light precipitation events in China, 1960–2000. Int. J. Climatol. 2011, 31, 1177–1191. [Google Scholar] [CrossRef]
- Alpert, P.; Ben-Gai, T.; Baharad, A.; Benjamini, Y.; Yekutieli, D.; Colacino, M.; Diodato, L.; Ramis, C.; Homar, V.; Romero, R.; et al. The paradoxical increase of Mediterranean extreme daily rainfall in spite of decrease in total values. Geophys. Res. Lett. 2002, 29, 101536. [Google Scholar] [CrossRef]
- Osborn, T.J.; Hulme, M.; Jones, P.D.; Basnett, T.A. Observed trends in the daily intensity of United Kingdom precipitation. Int. J. Climatol. 2000, 20, 347–364. [Google Scholar] [CrossRef]
- Dataset of Global Aridity and Potential Evapotranspiration. Avaiable online: http://www.cgiar-csi.org/data/global-aridity-and-pet-database (accessed on 5 April 2014).
- UNEP (United Nations Environment Programme). World Atlas of Desertification 2ED; UNEP: London, UK, 1997. [Google Scholar]
- Peng, J.; Dong, W.J.; Yuan, W.P.; Zhang, Y. Responses of grassland and forest to temperature and precipitation changes in Northeast China. Adv. Atmos. Sci. 2012, 29, 1063–1077. [Google Scholar] [CrossRef]
- Yuan, X.; Li, L.; Chen, X. Increased grass NDVI under contrasting trends of precipitation change over North China during 1982–2011. Remote Sens. Lett. 2015, 6, 69–77. [Google Scholar] [CrossRef]
- Bai, Y.F.; Wu, J.G.; Xing, Q.; Pan, Q.M.; Huang, J.H.; Yang, D.L.; Han, X.G. Primary production and rain use efficiency across a precipitation gradient on the Mongolia plateau. Ecology 2008, 89, 2140–2153. [Google Scholar] [CrossRef] [PubMed]
- Piao, S.L.; Fang, J.Y.; Zhou, L.M.; Ciais, P.; Zhu, B. Variations in satellite-derived phenology in China’s temperate vegetation. Global Chang. Biol. 2006, 12, 672–685. [Google Scholar] [CrossRef]
- Li, F.; Zhao, W.Z.; Liu, H. The response of aboveground net primary productivity of desert vegetation to rainfall pulse in the temperate desert region of Northwest China. PLoS ONE 2013, 8. [Google Scholar] [CrossRef] [PubMed]
- Nemani, R.R.; Keeling, C.D.; Hashimoto, H.; Jolly, W.M.; Piper, S.C.; Tucker, C.J.; Myneni, R.B.; Running, S.W. Climate-driven increases in global terrestrial net primary production from 1982 to 1999. Science 2003, 300, 1560–1563. [Google Scholar] [CrossRef] [PubMed]
- Piao, S.L.; Nan, H.J.; Huntingford, C.; Ciais, P.; Friedlingstein, P.; Sitch, S.; Peng, S.S.; Ahlstrom, A.; Canadell, J.G.; Cong, N.; et al. Evidence for a weakening relationship between interannual temperature variability and northern vegetation activity. Nat. Commun. 2014, 5. [Google Scholar] [CrossRef] [PubMed]
- He, Z.; Zhao, W.; Liu, H.; Chang, X. The response of soil moisture to rainfall event size in subalpine grassland and meadows in a semi-arid mountain range: A case study in northwestern China’s Qilian Mountains. J. Hydrol. 2012, 420–421, 183–190. [Google Scholar] [CrossRef]
- Li, Q.H.; Chen, Y.N.; Shen, Y.J.; Li, X.G.; Xu, J.H. Spatial and temporal trends of climate change in Xinjiang, China. J. Geogr. Sci. 2011, 21, 1007–1018. [Google Scholar] [CrossRef]
- Heisler-White, J.L.; Blair, J.M.; Kelly, E.F.; Harmoney, K.; Knapp, A.K. Contingent productivity responses to more extreme rainfall regimes across a grassland biome. Global Chang. Biol. 2009, 15, 2894–2904. [Google Scholar] [CrossRef]
- Easterling, D.R.; Meehl, G.A.; Parmesan, C.; Changnon, S.A.; Karl, T.R.; Mearns, L.O. Climate extremes: Observations, modeling, and impacts. Science 2000, 289, 2068–2074. [Google Scholar] [CrossRef] [PubMed]
- Karl, T.R.; Knight, R.W.; Plummer, N. Trends in high-frequency climate variability in the 20th-century. Nature 1995, 377, 217–220. [Google Scholar] [CrossRef]
- Shi, Y.F.; Shen, Y.P.; Kang, E.; Li, D.L.; Ding, Y.J.; Zhang, G.W.; Hu, R.J. Recent and future climate change in northwest China. Clim. Chang. 2007, 80, 379–393. [Google Scholar] [CrossRef]
- Stocker, T.; Qin, D.; Plattner, G.; Tignor, M.; Allen, S.; Boschung, J.; Nauels, A.; Xia, Y.; Bex, V.; Midgley, P. IPCC 2013: Climate change 2013: The physical science basis. In Proceedings of the Contribution of Working Group I to the Fifth Assessment Report of the Intergovernmental Panel on Climate Change, Stockholm, Sweden, 23–26 September 2013; Cambridge University Press: Cambridge, UK; New York, NY, USA, 2014; pp. 213–214. [Google Scholar]
- Wang, T.M.; Kou, X.J.; Xiong, Y.C.; Mou, P.; Wu, J.G.; Ge, J.P. Temporal and spatial patterns of NDVI and their relationship to precipitation in the Loess Plateau of China. Int. J. Remote Sens. 2010, 31, 1943–1958. [Google Scholar] [CrossRef]
- Ciais, P.; Reichstein, M.; Viovy, N.; Granier, A.; Ogee, J.; Allard, V.; Aubinet, M.; Buchmann, N.; Bernhofer, C.; Carrara, A.; et al. Europe-wide reduction in primary productivity caused by the heat and drought in 2003. Nature 2005, 437, 529–533. [Google Scholar] [CrossRef] [PubMed]
- Reichstein, M.; Ciais, P.; Papale, D.; Valentini, R.; Running, S.; Viovy, N.; Cramer, W.; Granier, A.; Ogee, J.; Allard, V.; et al. Reduction of ecosystem productivity and respiration during the European summer 2003 climate anomaly: A joint flux tower, remote sensing and modelling analysis. Global Chang. Biol. 2007, 13, 634–651. [Google Scholar] [CrossRef]
- Luo, G.P.; Han, Q.F.; Zhou, D.C.; Li, L.; Chen, X.; Li, Y.; Hu, Y.K.; Li, B.L. Moderate grazing can promote aboveground primary production of grassland under water stress. Ecol. Complex. 2012, 11, 126–136. [Google Scholar] [CrossRef]
- Kang, L.; Han, X.; Zhang, Z.; Sun, O.J. Grassland ecosystems in China: Review of current knowledge and research advancement. Philos. Trans. R. Soc. Lond. B Biol. Sci. 2007, 362, 997–1008. [Google Scholar] [CrossRef] [PubMed]
- Stellmes, M.; Udelhoven, T.; Röder, A.; Sonnenschein, R.; Hill, J. Dryland observation at local and regional scale—Comparison of Landsat TM/ETM+ and NOAA AVHRR time series. Remote Sens. Environ. 2010, 114, 2111–2125. [Google Scholar] [CrossRef]
- De Beurs, K.M.; Wright, C.K.; Henebry, G.M. Dual scale trend analysis for evaluating climatic and anthropogenic effects on the vegetated land surface in Russia and Kazakhstan. Environ. Res. Lett. 2009, 4. [Google Scholar] [CrossRef]
- Lu, D.S. The potential and challenge of remote sensing-based biomass estimation. Int. J. Remote Sens. 2006, 27, 1297–1328. [Google Scholar] [CrossRef]
- Mróz, M.; Sobieraj, A. Comparison of several vegetation indices calculated on the basis of a seasonal SPOT XS time series, and their suitability for land cover and agricultural crop identification. Tech. Sci. 2004, 7, 39–66. [Google Scholar]
- Asner, G.P.; Nepstad, D.; Cardinot, G.; Ray, D. Drought stress and carbon uptake in an Amazon forest measured with spaceborne imaging spectroscopy. Proc. Natl. Acad. Sci. USA 2004, 101, 6039–6044. [Google Scholar] [CrossRef] [PubMed]
- Huete, A.R. A soil-adjusted vegetation index (SAVI). Remote Sens. Environ. 1988, 25, 295–309. [Google Scholar] [CrossRef]
- Kaufman, Y.J.; Tanre, D. Atmospherically resistant vegetation index (ARVI) for EOS-MODIS. IEEE Trans. Geosci. Remote Sens. 1992, 30, 261–270. [Google Scholar] [CrossRef]
© 2015 by the authors; licensee MDPI, Basel, Switzerland. This article is an open access article distributed under the terms and conditions of the Creative Commons Attribution license (http://creativecommons.org/licenses/by/4.0/).
Share and Cite
Yuan, X.; Li, L.; Chen, X.; Shi, H. Effects of Precipitation Intensity and Temperature on NDVI-Based Grass Change over Northern China during the Period from 1982 to 2011. Remote Sens. 2015, 7, 10164-10183. https://doi.org/10.3390/rs70810164
Yuan X, Li L, Chen X, Shi H. Effects of Precipitation Intensity and Temperature on NDVI-Based Grass Change over Northern China during the Period from 1982 to 2011. Remote Sensing. 2015; 7(8):10164-10183. https://doi.org/10.3390/rs70810164
Chicago/Turabian StyleYuan, Xiuliang, Longhui Li, Xi Chen, and Hao Shi. 2015. "Effects of Precipitation Intensity and Temperature on NDVI-Based Grass Change over Northern China during the Period from 1982 to 2011" Remote Sensing 7, no. 8: 10164-10183. https://doi.org/10.3390/rs70810164