Review

A Remote-Sensing-Driven System for Mining Marine Spatiotemporal Association Patterns

1
Key Laboratory of Digital Earth Science, Institute of Remote Sensing and Digital Earth, Chinese Academy of Sciences, Beijing 100094, China
2
Key Laboratory of the Earth Observation, Sanya 572029, China
*
Authors to whom correspondence should be addressed.
Remote Sens. 2015, 7(7), 9149-9165; https://doi.org/10.3390/rs70709149
Submission received: 26 March 2015 / Revised: 27 June 2015 / Accepted: 4 July 2015 / Published: 17 July 2015

Abstract

:
Remote sensing is widely used to analyze marine environments. While many effective and advanced methods have been developed, they are generally used independently of each other, despite the potential advantages of combining different modules into an integrated system. We develop here an image-driven remote-sensing mining system, RSMapMining (Remote Sensing driven Marine spatiotemporal Association Pattern Mining system), which consists of three modules. The image preprocessing module integrates image processing techniques and marine extraction methods to build a mining database. The pattern mining module integrates popular algorithms to implement the mining process according to the mining strategies. The third module, knowledge visualization, designs a series of interactive interfaces to visualize the marine data at a variety of scales, from global to grid pixel. The effectiveness of the integrated system is tested in a case study of the northwestern Pacific Ocean. The main contribution of this study is the development of a mining system to deal with marine remote sensing images by integrating popular techniques and methods ranging from information extraction, through visualization, to knowledge discovery.

1. Introduction

Series of images taken by remote sensing over long periods of time constitute the main source of continuous and consistent information about the marine environment, and offer opportunities for monitoring its variations and for understanding the associated relationships among parameters at large scale [1,2]. Spatiotemporal variations in marine environmental properties and their relationship with El Niño–Southern Oscillation (ENSO) make up a complex and interrelated system [3,4,5]. The complexities of such a system require analysis techniques that go beyond the conventional methods of spatiotemporal analysis, such as empirical orthogonal functions [6], canonical analysis [7], and singular value decomposition [8]. Such analyses require an inductive mining technique that accounts for the complex set of interdependencies [9,10,11].
In recent decades, data mining has become widely used in analyses of large data sets generated by remote sensing. It has been used to develop techniques such as spatiotemporal mining frameworks [12,13,14,15,16], mining algorithms [17,18,19], and knowledge visualization techniques [13,14,20].
In the field of spatiotemporal mining frameworks, Lee and Lee’s [12] proposal includes a two-tier knowledge discovery model that integrates a foundation model for spatiotemporal representation and an executing model for knowledge discovery. Bertolotto et al. [13] and Compieta et al. [14] designed a mining architecture that includes a data layer for data processing, an application layer for association acquisition, and a visualization layer for knowledge visualization. Xue et al. [16] discussed pixel- and object-based spatiotemporal mining frameworks, and addressed some key issues ranging from image preprocessing, through information mining, to knowledge visualization.
In terms of mining algorithms, the Apriori algorithm was first proposed by Agrawall and Srikant [21] to determine which items co-occur in a transaction. To deepen the analysis of such relationships, the quantitative Apriori algorithm has been revised and improved by Srikant and Agrawal [22]. Reductions in the computational cost of remote sensing image processing have been sought through the development of various mining algorithms based on the core idea of Apriori and quantitative Apriori, e.g., by embedding spatial constricts [17], spatial clusters [23], object-oriented techniques [18,24], and mutual information [19].
The complicated patterns arising from remote sensing data require sophisticated presentation. For this purpose, Bertolotto et al. [13] and Compieta et al. [14] integrated components from Google Earth and Java3D to visualize data, geograhical parameters, and associaion rules. Li et al. [20] designed an interactive framework to visualize association patterns over a range of scales from global to local, i.e., grid pixel. The framework consists of three complementary components: three-dimensional pie charts, two-dimensional variation maps, and triple-layer mosaics.
The effective use of the considerable achievements of mining frameworks, algorithms, and visualizations relies on several systems and operational tools that have been developed to transform remote sensing images into useful information. For example, Datcu et al. [25] demonstrated a prototype of a knowledge-driven content-based information mining system to manage large volumes of remote sensing images, and Zhang et al. [26] designed a visual data mining system with two classes of components for classifying remotely sensed images and exploring image classification processes. Julea et al. [27] proposed a frequent sequence pattern mining algorithm for agricultural monitoring, which aimed to extract the evolution of each grid pixel from a time series of images. Korting et al. [28] proposed and implemented a new toolbox, Geographic Data Mining Analyst (GeoDMA), which integrates a series of processes including segmentation, feature extraction, feature selection, landscape and multi-temporal features, as well as data mining for pattern recognition and multi-temporal analysis of remote sensing imagery. Romani et al. [29] developed the RemoteAgri system to discover the Plateau–Valley–Mountain (P–V–M) association patterns for monitoring sugar cane fields via time series of remote sensing images. They found that the P–V–M pattern mainly analyzed the association patterns between two geographical parameters. Finally, Saulquini et al. [11] designed an event-based mining algorithm for dealing with sea surface temperature (SST) anomalies relative to ENSO events, which considers each one-dimensional time series as a sequence of significant time-scale events for each grid pixel.
In spite of the considerable achievements made in remote sensing image analysis, such mining systems and tools are suited to specific problems related to the process of extracting useful geographical knowledge from remote sensing images. Examples include image database management [25], image classification [26,28], applications and domains (e.g., evolution in a given location [27]), and one-to-one relationships [11,29]. Given the complexity of marine environments, the above systems and tools must overcome great challenges to achieve the following: (i) to extract marine objects, events, and processes from remote sensing images, and then to represent and store them; (ii) to design mining strategies to explore association patterns among events, processes, and among multiple parameters; and (iii) to visualize such association patterns. End users still lack effective and useful tools to obtain marine association patterns from remote sensing images. Therefore, the main aim of this study is to develop a mining system for multiple remote sensing images by integrating existing popular techniques and methods. The result is a platform for the end user to explore marine association patterns from remote sensing images, i.e., a system that performs marine information extraction and visualization, and so provides knowledge discovery.
The remainder of this paper is organized as follows. Section 2 outlines the design of the system architecture, and gives its operational workflow and technical workflow. Section 3 describes remote sensing image preprocessing and the construction of a mining database. Section 4 presents the design of a spatiotemporal mining module. Section 5 describes an association pattern visualization module, and Section 6 considers the northwestern Pacific Ocean as a case of study for analyzing association patterns among marine bio-optical parameters and dynamic parameters, ranging from image pretreatment, through mining algorithms, to visualization. Finally, a discussion and conclusions are presented in Section 7.

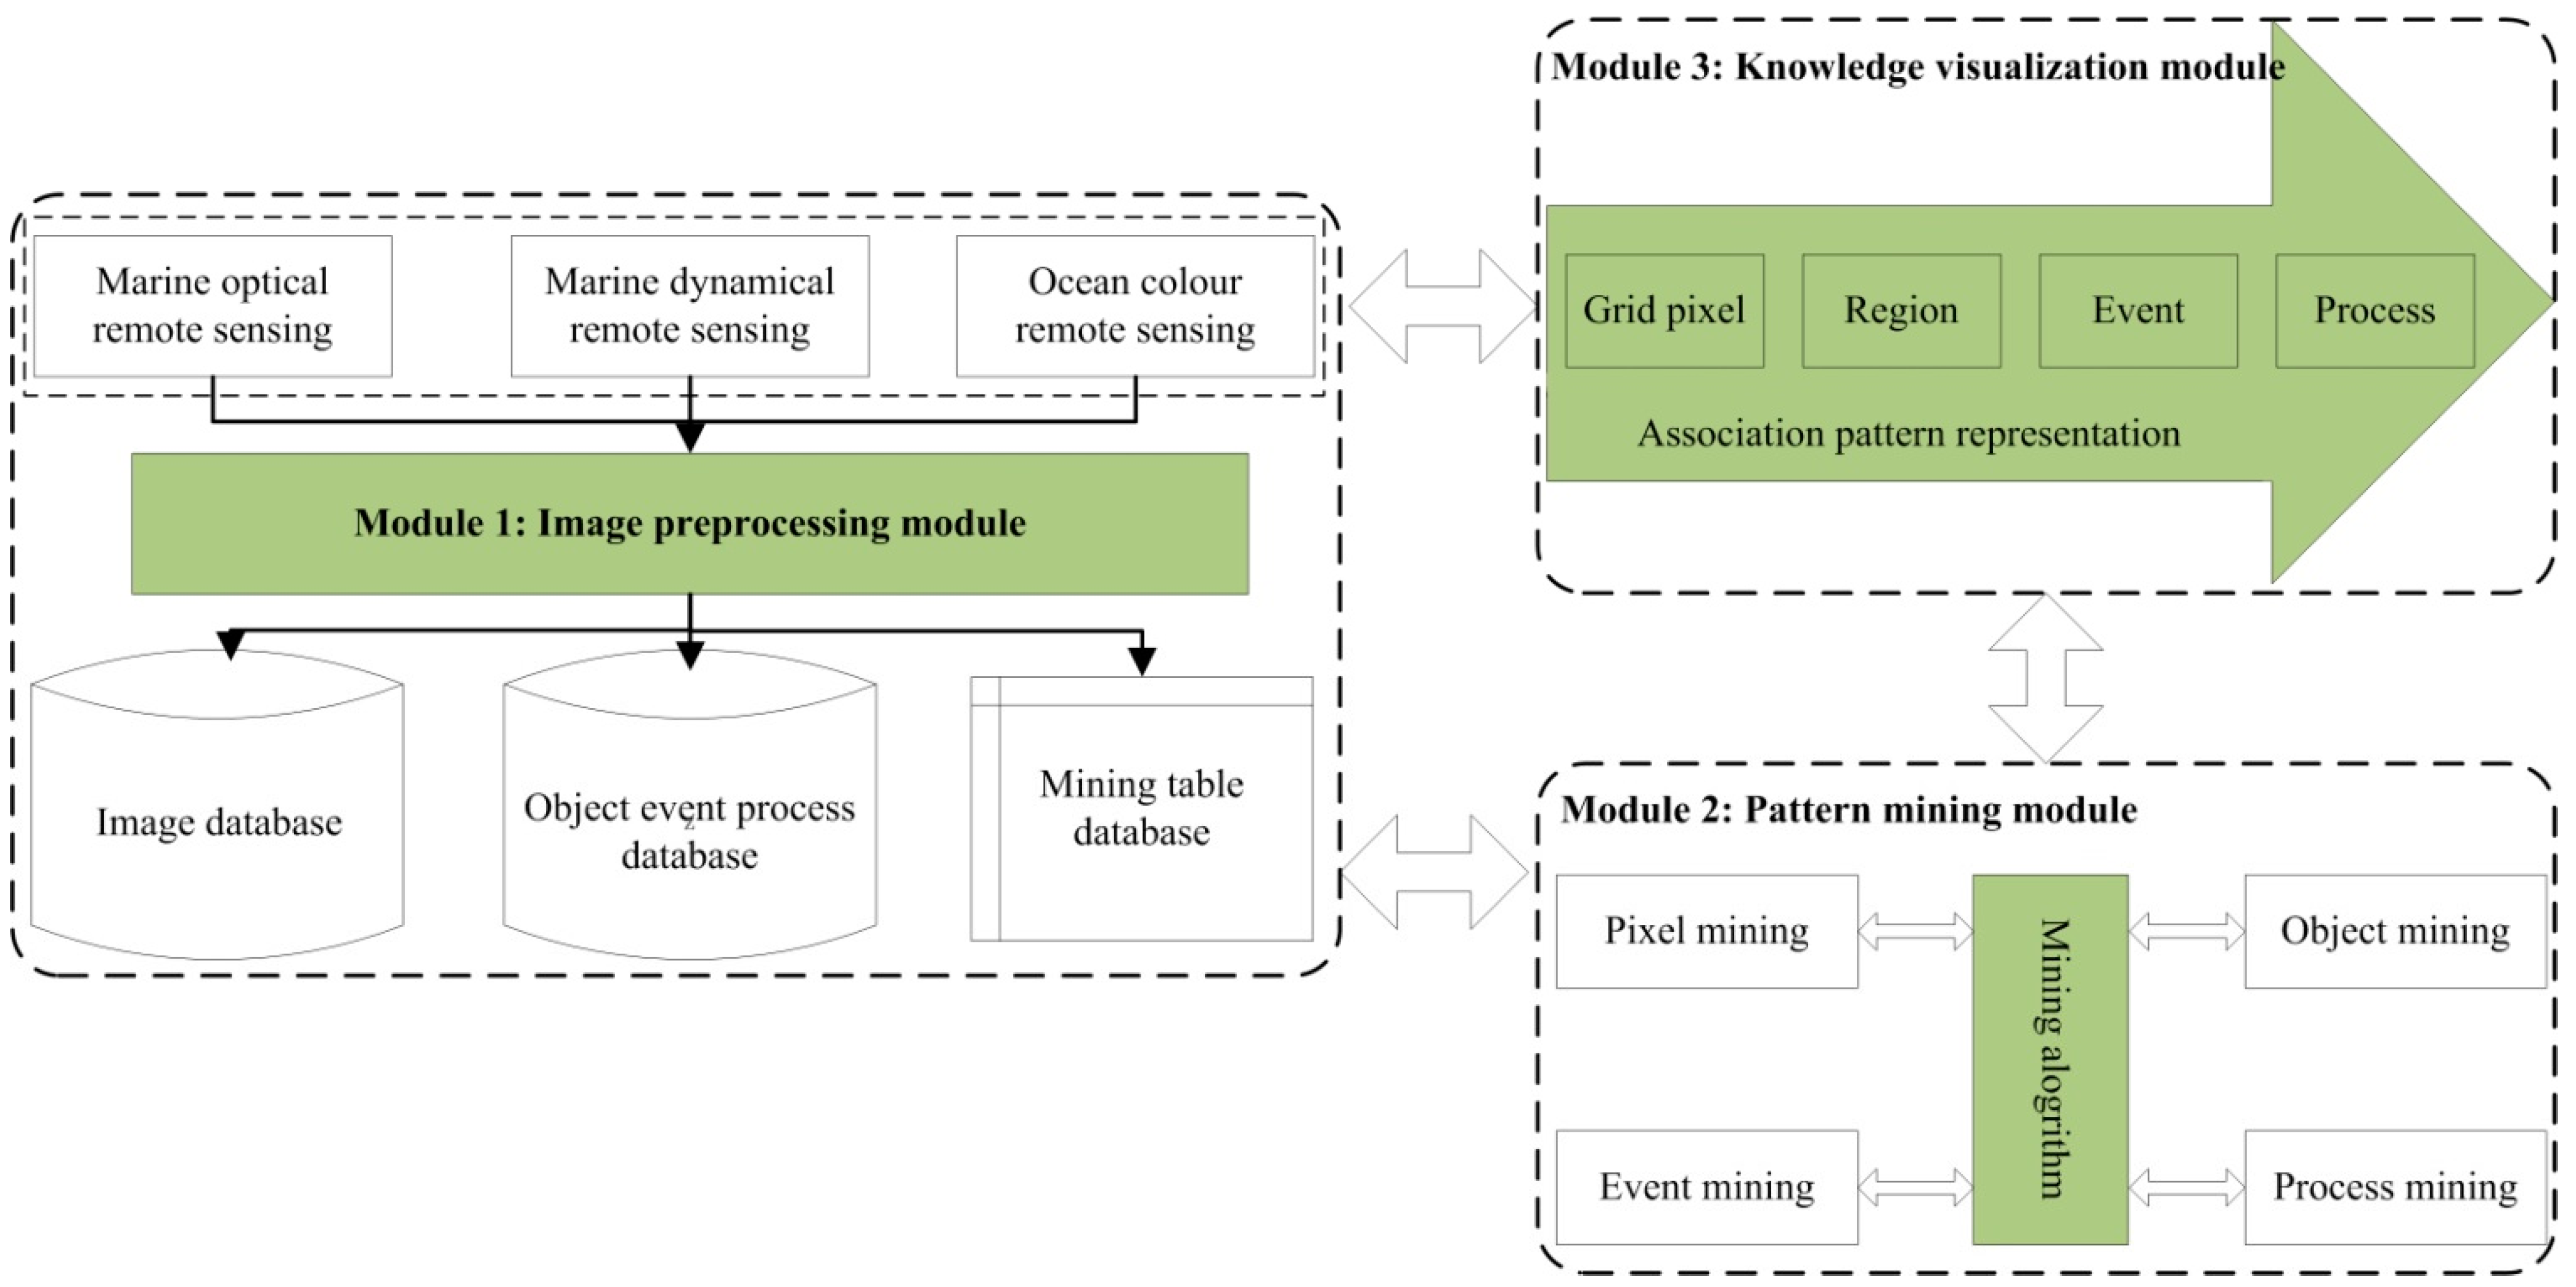
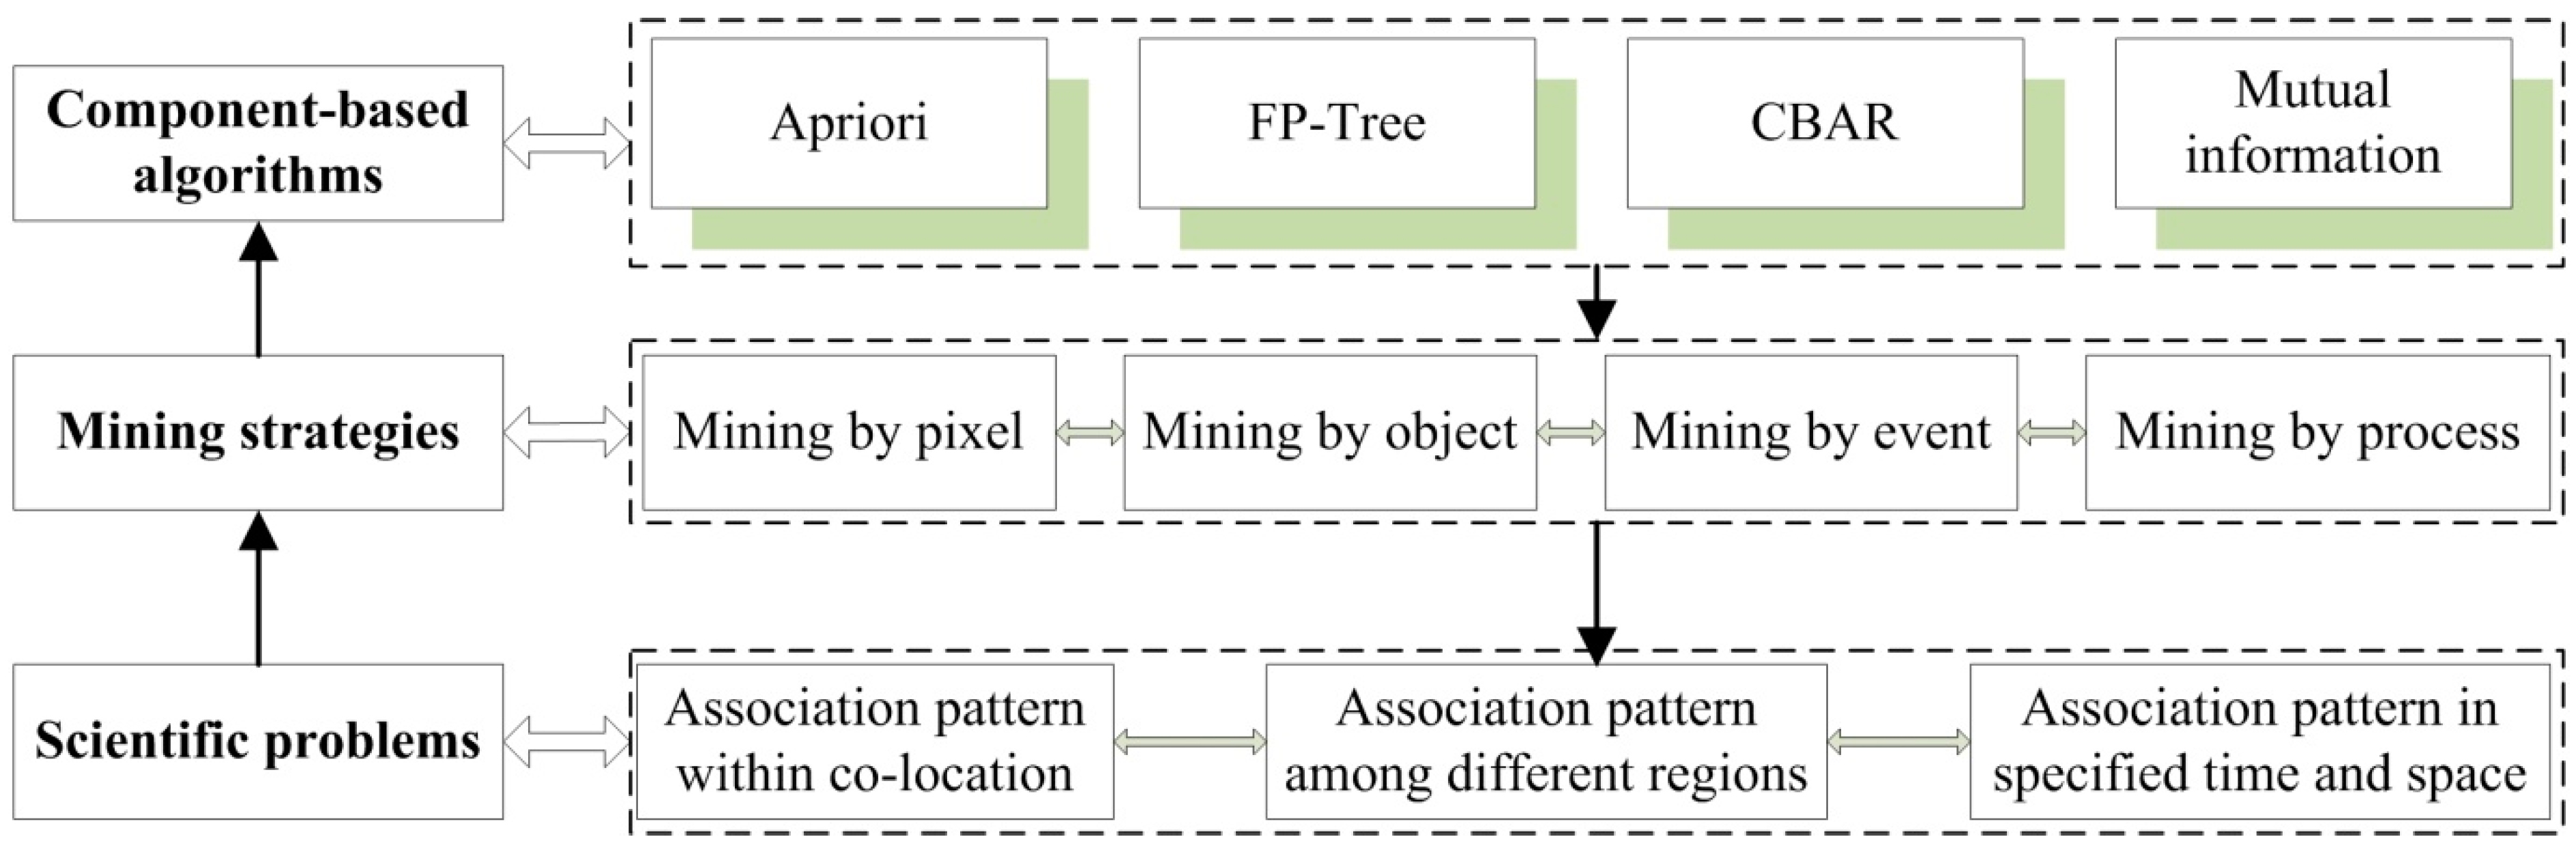
2. System Architecture

A marine association pattern is the association of relationships among mutually codependent marine environmental parameters. The parameters can be bio-optical or dynamic. This paper considers sea surface chlorophyll-a (Chl-a), SST, sea surface precipitation (SSP), sea level anomaly (SLA), and sea surface wind (SSW), all of which can be derived by remote sensing. To provide an effective and useful tool for exploring marine association patterns from multiple remote sensing images, we develop a mining system called RSMapMining (Remote Sensing driven Marine spatiotemporal Association Pattern Mining system). This system aids the analysis of remote sensing images through integrating image analysis tools, data organization and management techniques, data mining models, and a visualization framework.
Figure 1 shows a general diagram of the RSMapMining system and its three constituent modules for image preprocessing, pattern mining, and knowledge visualization. The image preprocessing module builds a mining database from multiple remote sensing images, and supports the other two modules with input data. The pattern mining module designs the mining strategies, develops the mining algorithms, and implements the mining process. The mining strategies determine the structure of the mining transaction table, and the mined results are the inputs of the visualization module. Visualization of the marine association patterns is implemented through the design of a series of interactive visualization components, which then help to improve the preprocessing and mining modules. In Figure 1, knowledge means an interesting and meaningful association pattern through a series of validations, and the mining table database consists of series of mining transaction tables.
Figure 1. Architecture of Remote Sensing driven Marine spatiotemporal Association Pattern Mining system(RSMapMining).
Remotesensing 07 09149 g001
From remote sensing images to knowledge discovery, the principal capabilities of the RSMapMining system are as follows:
  • To offer a set of tools for dealing with different data types (e.g., geographical objects, geographical events, and geographical processes).
  • To explore the association patterns in one or more marine environmental parameters.
  • To explore the co-location association patterns among different marine environmental parameters, and the regional association patterns among different sea areas.
  • To offer a series of flexible visualization components for displaying marine association patterns from global and regional scales to a detailed view.
ArcGIS 10.0 is a widely used commercial GIS program that includes several components such as ArcGeoDatabase, an object relational model for storing remote sensing images and other graphical data, and ArcEngine, an embeddable GIS component library for building custom applications using multiple application programming interfaces. Oracle is a commercial software package for database systems supporting image storage. To realize its four major capabilities, RSMapMining selects ArcGeoDatabase 10.0 and Oracle 11 g for the bottom database to store image product datasets; this includes all kinds of tables, geographical objects, events, and processes. Visual Studio 2008 and ArcEngine 10.0 are used as a programming environment to develop the necessary interfaces and components.
Figure 2. Workflow of RSMapMining.
Remotesensing 07 09149 g002
Figure 2 gives the workflow of the modules, interfaces, and components. From the operational workflow, we design four interfaces, one each for database management, marine information extraction, spatiotemporal association pattern mining, and knowledge visualization. Through these interfaces, RSMapMining calls three modules, each consisting of one or more components that contain the specified algorithms. In the technical workflow, after the initial marine information extraction and image pretreatment, the image datasets (raster grid pixel), marine objects, events, and processes are stored in a database according to the data presentation and storage model. Similarly, the data presentation and storage model supports an association pattern mining module with different mining strategies (i.e., strategies based on grid pixels, objects, events, and processes) and a visualization module for displaying marine association patterns at various view levels.

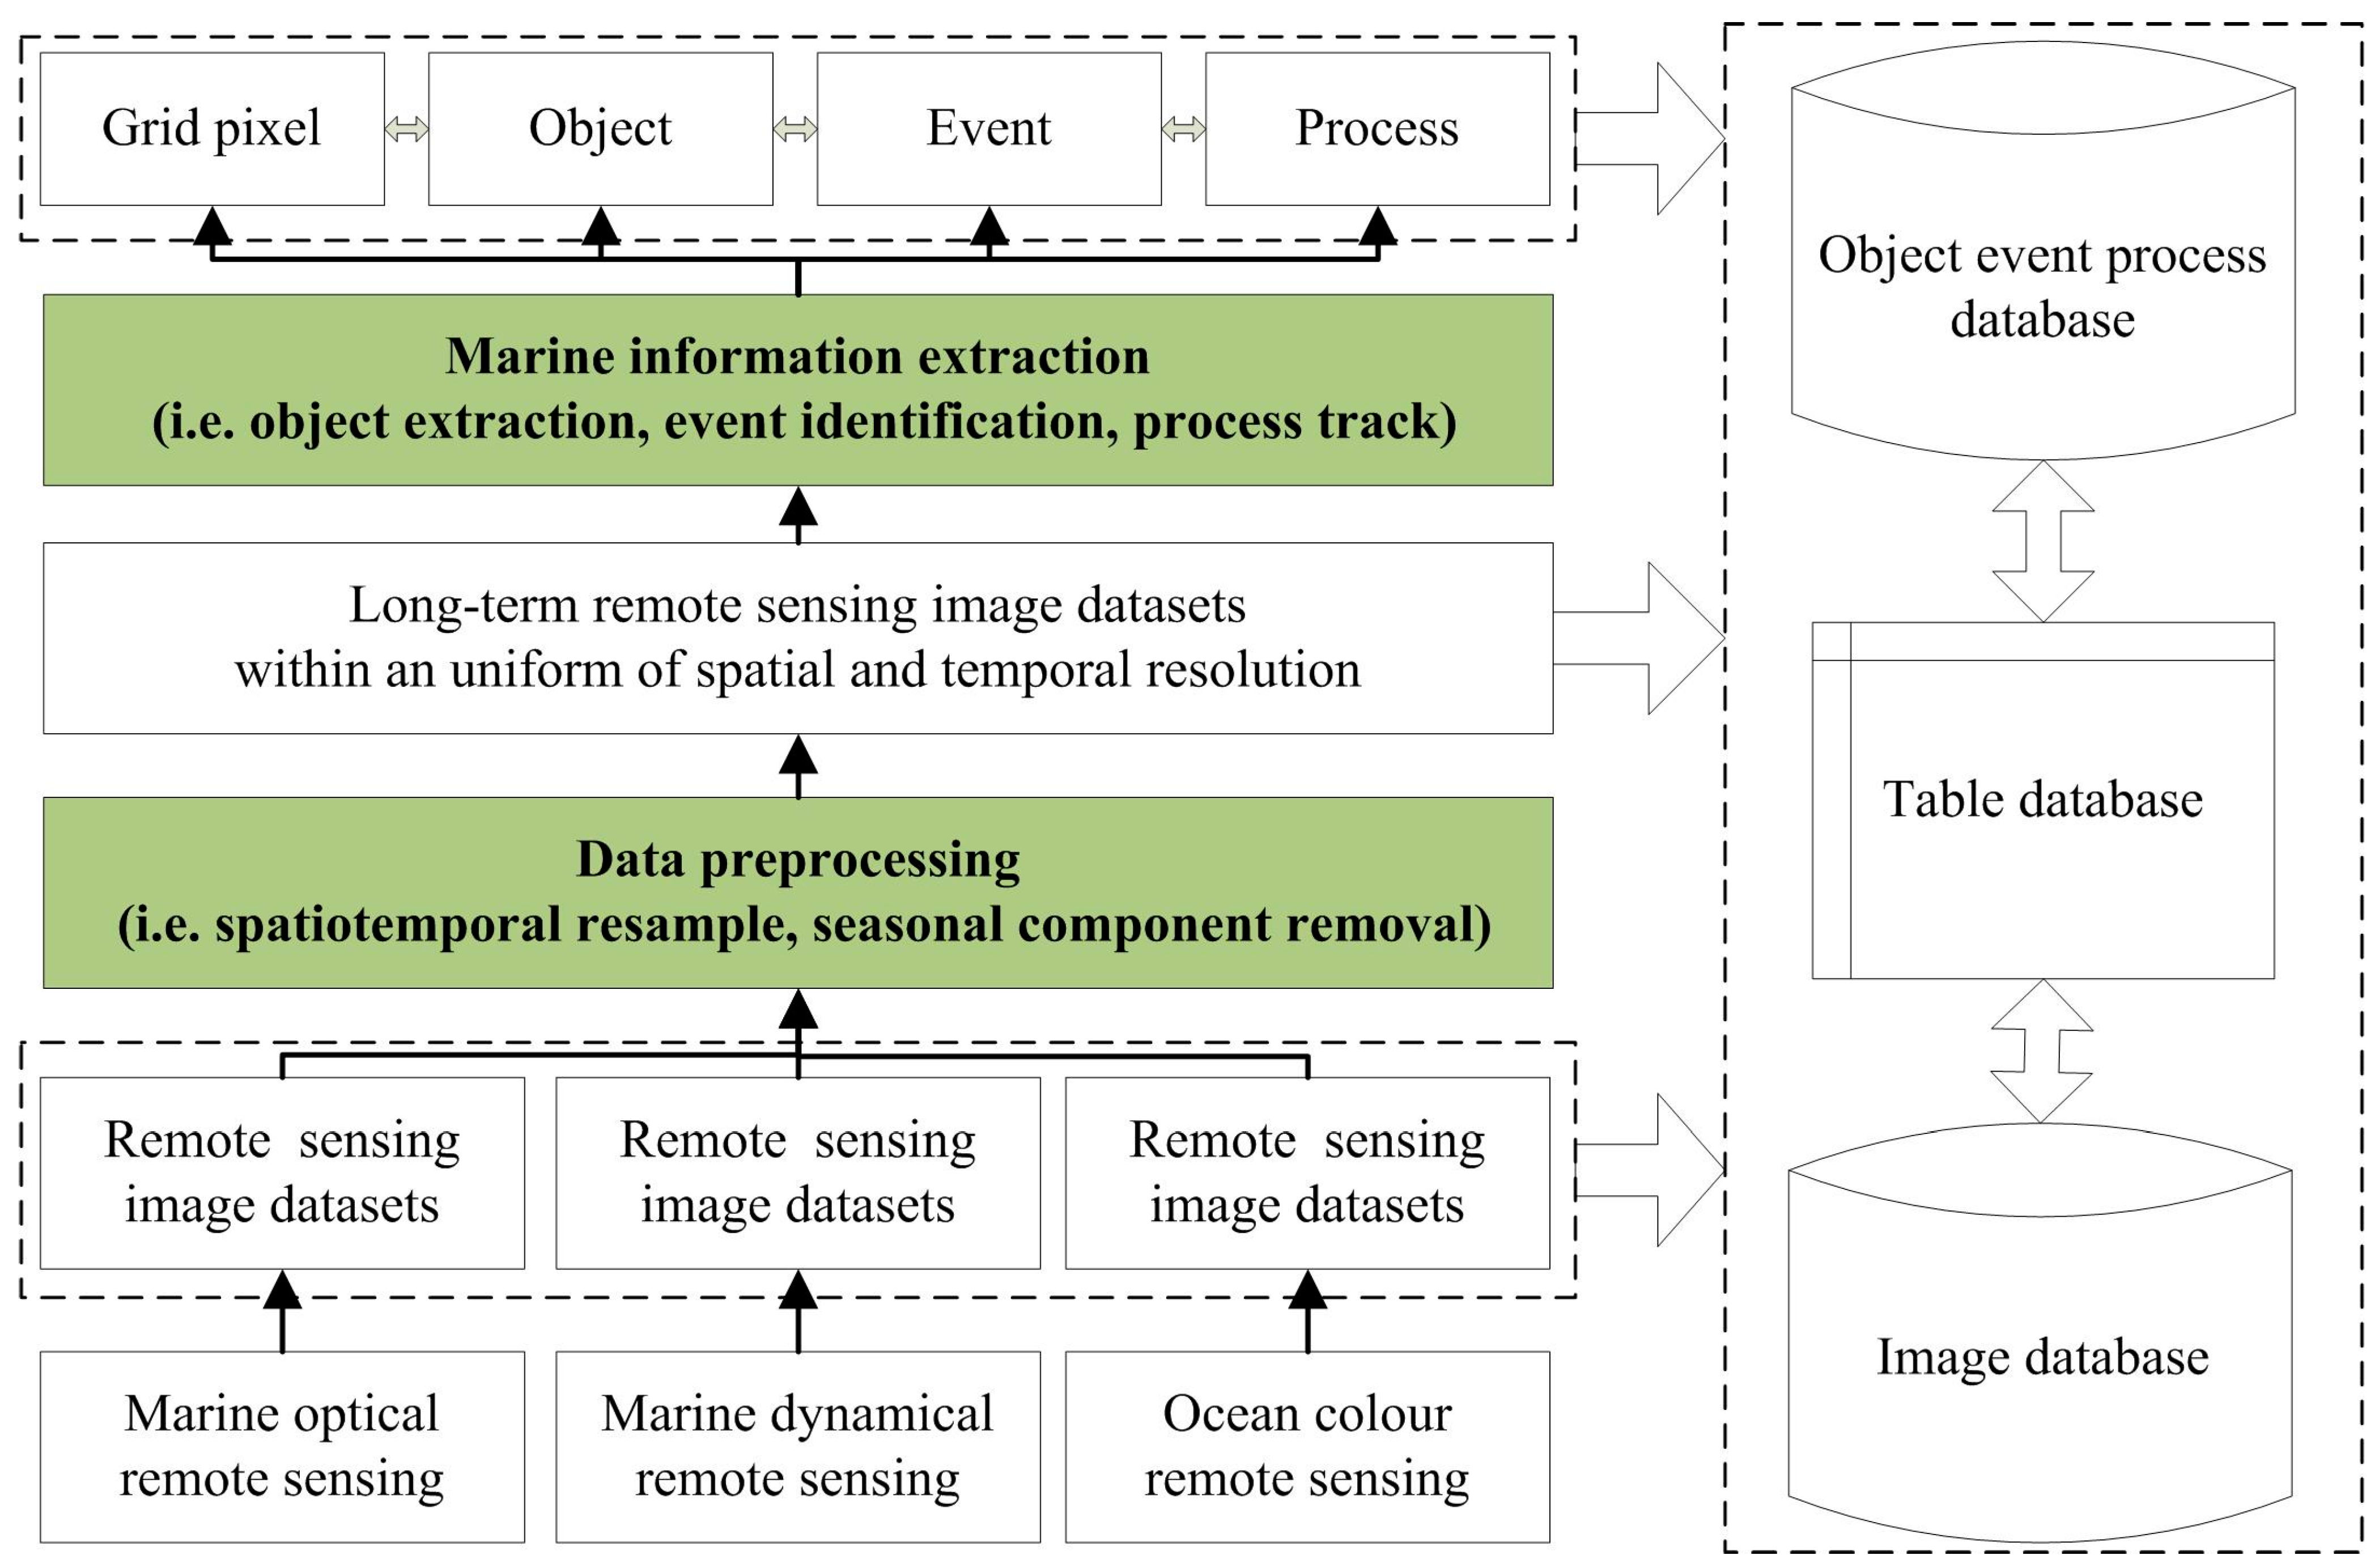
3. Marine Remote Sensing Image Preprocessing and Mining Database

The image processing module starts by defining the input images, and then implements image preprocessing and feature extraction to form a mining database. This module deals with two key issues when handling multiple marine remote sensing images. One is image preprocessing, which aims to produce long-term marine remote sensing datasets within a uniform spatial and temporal resolution; the other is feature extraction, which finds the marine objects, events, and processes. The mining database is responsible for storing the marine product datasets in image format, the marine objects, events, and processes in vector format, and the mining transaction table in tabular form. The workflow of the image processing module is shown in Figure 3.
Figure 3. Workflow of the image processing module.
Remotesensing 07 09149 g003

3.1. Image Preprocessing

RSMapMining deals with a variety of marine images gathered by remote sensing. These include optical and dynamic remote sensing images and ocean color images, which are used to retrieve marine bio-optical parameters (e.g., Chl-a and marine primary production) and marine dynamic parameters (e.g., SST, SSP, SSW, SLA, and sea surface salinity). The surveys producing the initial data may be conducted at greatly different intervals ranging from daily to annual; their spatial resolutions may also vary, from meters to kilometers, and even to global scale. To produce uniform product datasets, RSMapMining develops a spatiotemporal slicing component and a resampling component based on a spatiotemporal statistical model, and also a spatiotemporal interpolation component. To remove the seasonal variations that are dominated by solar radiance, RSMapMining also integrates the standard monthly averaged anomaly algorithm [9]. Thus, the image database comprises three categories of image datasets: the original remote sensing images, image products, and monthly averaged anomalies of the image product.

3.2. Extraction of Marine Information

Some marine environmental parameters have been proposed as global-change-sensitive factors [30] or essential climate variables [31]; these include SST, ocean color, sea level, and sea ice [5], which are each sensitive neither everywhere nor at all times. Regions that show sensitive changes in specified time intervals are more suitable for analyzing association patterns, especially those connected with global climate change. Therefore, the marine information extraction module aims to extract these sensitive sea areas and their evolutions over specified time intervals.
The following four geographical data types are used in RSMapMining to represent marine information.
  • Grid pixel: A grid pixel is the basic unit of a raster image; it represents the original image information at a specified row and column. RSMapMining develops a spatial cutting tool to obtain the grid pixels of any sea area, and stores them in raster format.
  • Marine object: An object represents a common attribute or behavior with a precise and “crisp” spatial location and extent [32]. Object-based approaches use homogeneous regions from image segmentation. RSMapMining integrates an ENSO-oriented cluster-based method to extract the sensitive marine regions [33] and store them in vector format.
  • Marine event: An “event” is defined as a significant occurrence that results in both the creation and destruction of an object [34]. Multi-temporal images can be represented as a sequence of raster snapshots that are used to extract a sequence of values for each region at different intervals that define an event or process. RSMapMining develops a statistical algorithm to extract a marine event, and stores its spatial coverage as a vector format and the logical relationship as a table.
  • Marine process: A “process” is defined as a significant event with an evolution from production via development to death [35]. Generally, such processes occur in sensitive marine regions. RSMapMining adopts the concept of the marine spatiotemporal process to obtain a marine sensitive region, and store it according to the spatiotemporal process organization model [36].
Grid pixels and marine objects represent static information. Events represent the production or death of marine objects or phenomena, while processes represent the dynamic changes from production through development to death. Events and processes take the grid pixels and objects as their basis; e.g., the evolution of an eddy may be taken as a grid-pixel-based or object-based process.

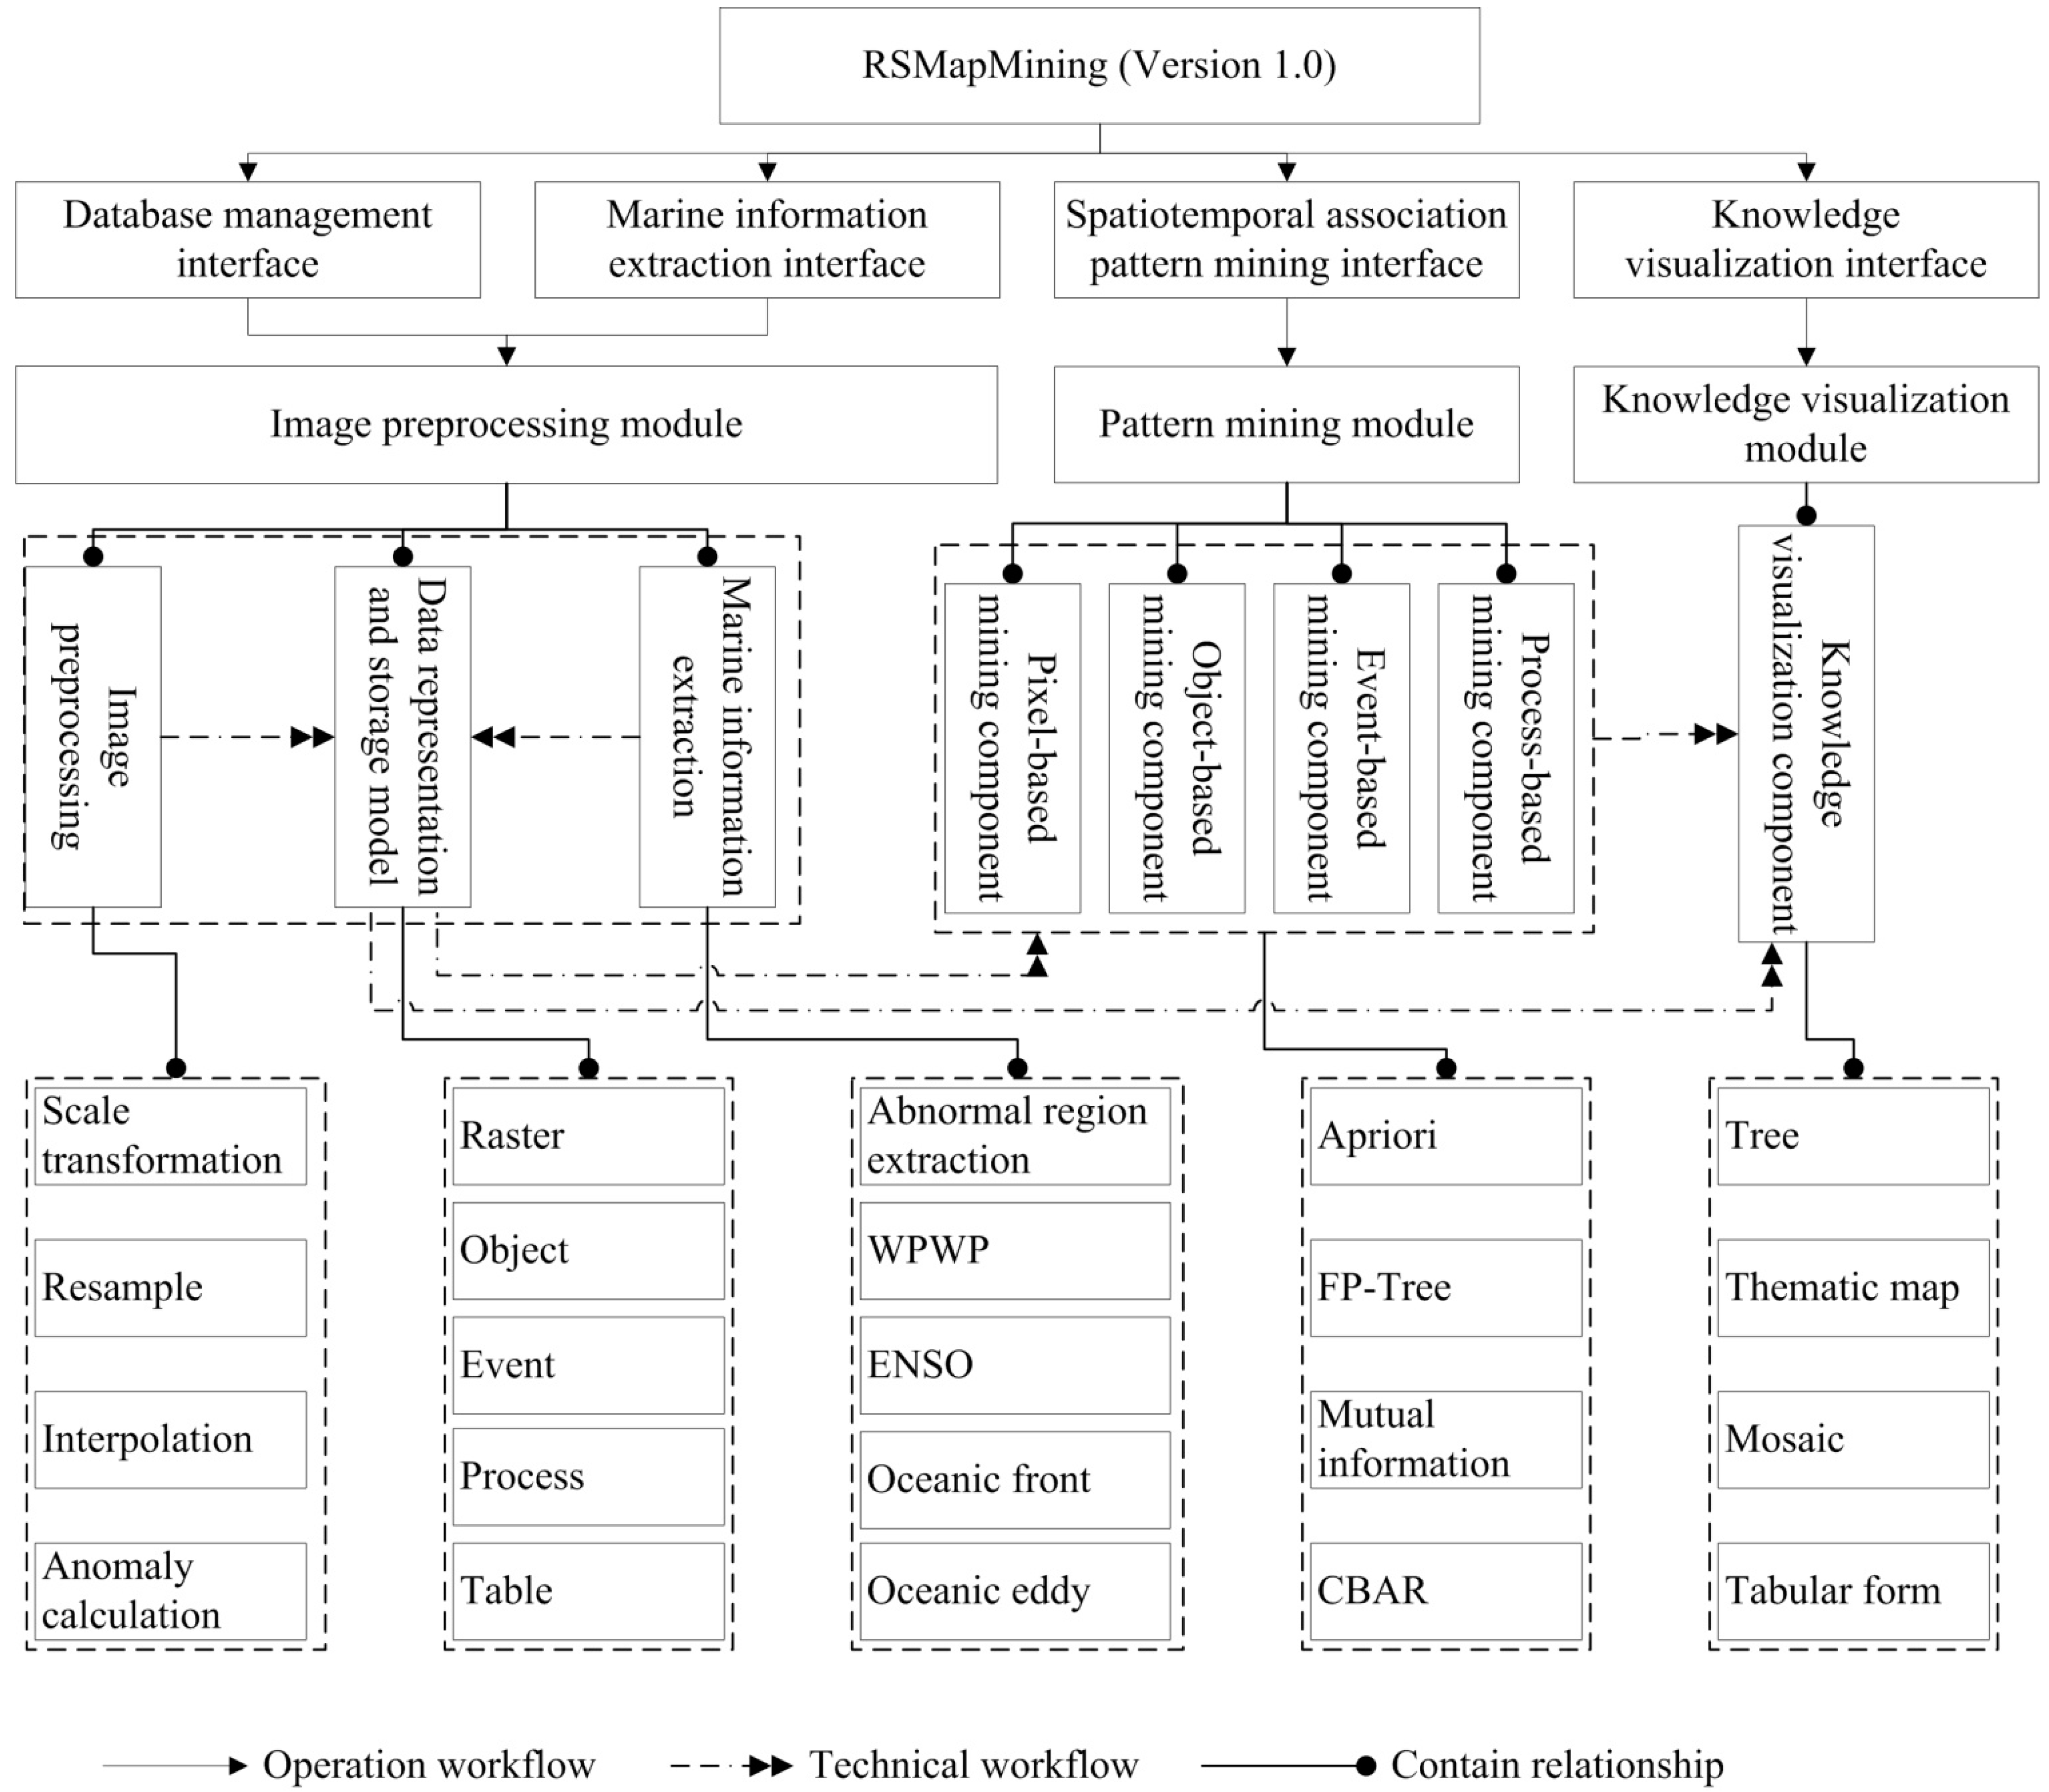
4. Spatiotemporal Association Pattern Mining Module

Using the mining database, the mining module identifies marine spatiotemporal association patterns. It starts from scientific problems, works via through the mining strategies, and then implements the mining algorithms, as shown in Figure 4.
Figure 4. Workflow of the pattern mining module.
Remotesensing 07 09149 g004
RSMapMining deals with three categories of scientific problem: the co-location association patterns among marine environmental parameters, the association patterns among different sea regions, and the evolution of marine association patterns within specified areas and for specified durations. The first of the categories focuses on the spatiotemporal association characteristics at large scales, the second explores the spatial relationships of the association patterns within different regions, and the third addresses the spatiotemporal variations of the association patterns.
Given the various problems faced by RSMapMining, it can design corresponding mining strategies as grid pixel-based, object-based, event-based, and process-based. To deal with the co-location association patterns among parameters and the association patterns among regions, RSMapMining integrates complementary pixel- and object-based mining frameworks with multiple remote sensing images to find mining association patterns by grid pixels or by objects [16]. Regarding the evolution of marine association patterns, RSMapMining considers the evolution of an object from its start to its end as an event or process; it develops an event- or process-based mining model to explore the evolution of the association patterns.
RSMapMining adopts object-based techniques to develop the mining algorithms. These include quantitative Apriori [21], FP-Tree [23], cluster-based association rule (CBAR) [37], and mutual-information-based quantitative association algorithm (MIQarma) [19]. Each of these algorithms is encapsulated into components with series of variants to implement the different mining strategies. Except for specific implementations, these function variants have the same input and output parameter interfaces, and this simplifies some of the complexities of the RSMapMining program.
For example, MIQarma has four variants, one each corresponding to grid-pixel mining, object mining, event mining, and process mining. The function structure is of the following form.
BOOL MIQarma (INPUT ITable MiningTransactionTable, INPUT INT GeographicalDataType, OUTPUT ITable AssociationPatternTable)
  • If MIQarma succeeds, it returns true; if not, it returns false.
  • The first input parameter, MiningTransactionTable, has different table structures that are defined by different mining strategies (i.e., grid pixel-based, object-based, event-based, or process-based).
  • The second input parameter, GeographicalDataType, is an enumeration to represent the geographical data type corresponding to the different mining strategies: 0 denotes grid pixel data; 1, object data; 2, event data; and 3, process data.
  • The output parameter, AssociationPatternTable, stores the mined results in a similar table structure consisting of spatial information, temporal information, an antecedent and consequent of association attributes, and evaluation indicators.

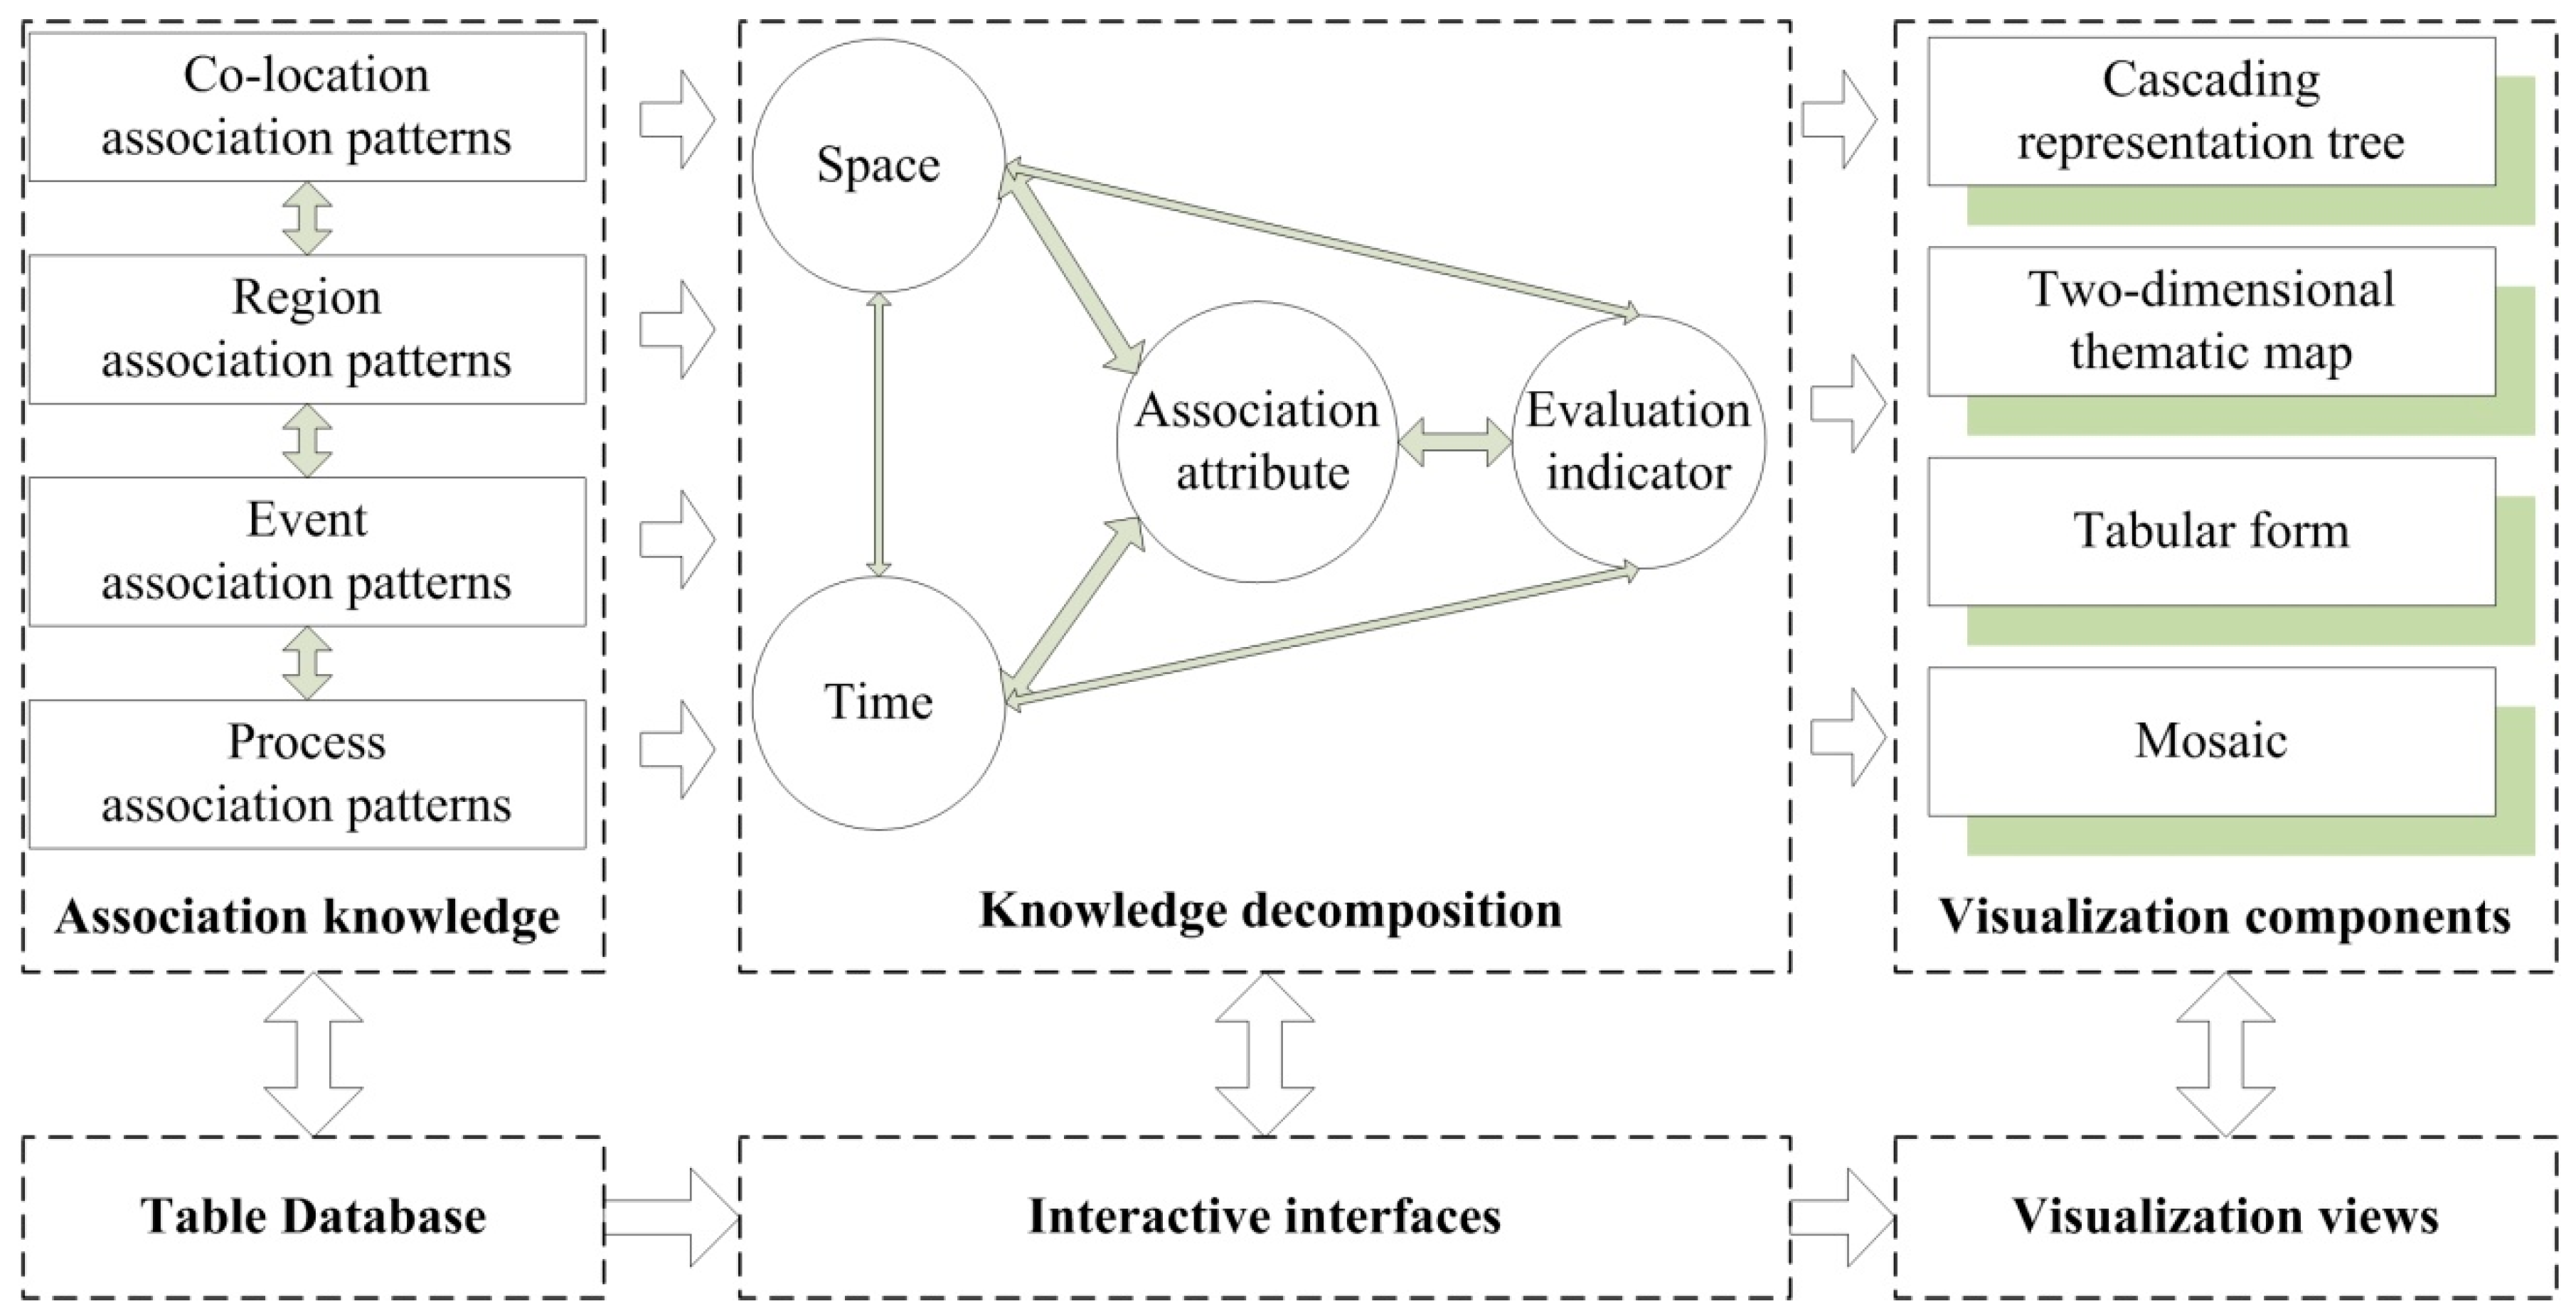
5. Knowledge Visualization

From the collected association pattern tables in a bottom database, RSMapMining designs a series of interactive interfaces to display the relevant information about the associations in its generated visualizations. The data for each association pattern (whether pixel-, object-, event- or process-based) contains spatial information, temporal information, association attributes (i.e., an antecedent and a consequent), and evaluation indicators (e.g., support, confidence, lift). Therefore, such association knowledge can be decomposed into four-dimensional information representing space, time, attributes, and evaluation indicators, which are used to design the interactive interfaces. Through the series of interactive interfaces, RSMapMining develops four visualization components: cascading tree, two-dimensional thematic map, table, and mosaic. Finally, the specified association knowledge, which can be chosen by the user, is displayed in a visualization view. The user transfers the chosen association knowledge to the visualization component through an interactive interface. Figure 5 outlines the workflow of the visualization module from left to right.
Figure 5. Diagram of the visualization module.
Remotesensing 07 09149 g005
The visualization components (right side in Figure 5) are listed as follows.
  • Cascading representation tree: This component represents an overview at large scale, showing the locations where marine environmental parameters are more interrelated, the parameters involved, and which parameters are causes or induced.
  • Two-dimensional thematic map: This component is designed to identify where, how, and when one marine environmental parameter affects or responds to other parameters. The relevant parameters (i.e., the antecedent and consequent) are determined by the user through an interface.
  • Table: The ordering of association patterns row-by-row has each row representing one piece of association knowledge.
  • Mosaic: This component represents detailed association knowledge.
For grid-pixel-based association knowledge, each grid lattice in raster format has zero or more spatiotemporal association patterns among the marine environmental parameters, and each pattern may consist of several related parameters, with corresponding temporal information and evaluation indicators. To visualize such complicated association knowledge at any scale from global to detailed, RSMapMining combines the above visualization components.
Object-based association knowledge relies on spatial relationships; e.g., spatial location, distance, and direction are very important. Although a table can easily display attributes (i.e., antecedent and consequent, temporal information, and evaluation indicators), it does not easily represent spatial relationships between marine regions or objects. RSMapMining can integrate a table and a thematic map to show the association knowledge among marine regions or objects. The table lists detailed data, and the map depicts their spatial relationships. For example, consider the association knowledge among marine regions over the northwestern Pacific Ocean of the form “NWPObj2.SSTA[–2,0]->NWPObj1.SLAA[2,(0,4)], 16.78%, 78.12%, 2.77” [24]. A two-dimensional thematic map displays its location and spatial relationship, i.e., the spatial regions of NWPObj1 and NWPObj1. From the location data, the other spatial relationships (e.g., spatial distance, direction, and topology) can be obtained by calculation.
Event- or process-based association knowledge concerns the association relationship among marine parameters covering specified ranges and lasting for specified durations. The spatial coverage may vary with time. To visualize such association knowledge, RSMapMining lists marine environmental parameters and evaluation indicators in tables, and uses a series of thematic map components to display the spatial coverage at different times.

6. Case Study of Marine Spatiotemporal Association Patterns in the Northwestern Pacific Ocean

6.1. Remote Sensing Images and Databases

Monthly marine parameters are considered here: the bio-optical parameter Chl-a and the dynamic parameters SST, SSP, SLA, and SSW as derived from remote sensing imagery. The multivariate ENSO index (MEI) during the period January 1998 to December 2013 is also considered. Detailed information on the products is summarized in Table 1. The northwestern Pacific Ocean, covering 100°–180°E and 0°–50°N, plays a significant role in the global climate system and regional air–sea interactions. This is a highly interactive ocean region, which makes it suitable for a case study. After image pretreatment, RSMapMining produces monthly averaged anomalies with a spatial resolution of 1.0°, and stores them in a database denoted as PacificAbnormalDB. Monthly anomalies of these marine parameters are denoted as SSTA (monthly anomaly of SST), CHLA (monthly anomaly of CHL), SLAA (monthly anomaly of SLA), SSPA (monthly anomaly of SSP), and SSWA (monthly anomaly of SSW), respectively.
Table 1. Sources and resolution of remote sensing imagery used in the case study.
ProductSourceTimespanTemporal ResolutionSpatial CoverageSpatial Resolution
1SSTNOAA/PSDDecember 1981–December 2014MonthlyGlobal
2Chl-aSeaWifsSeptember1997–November 2010MonthlyGlobal9 km
MODISJuly 2002–December 2014MonthlyGlobal4 km
3SSPTRMMJanuary 1998–December 2014MonthlyGlobal0.25°
4SSWCCMPJuly 1987–June 2014MonthlyGlobal0.25°
5SLAAVISODecember 1992–June 2014MonthlyGlobal0.25°
6ENSOMEIJanuary 1950–December 2014Monthly--

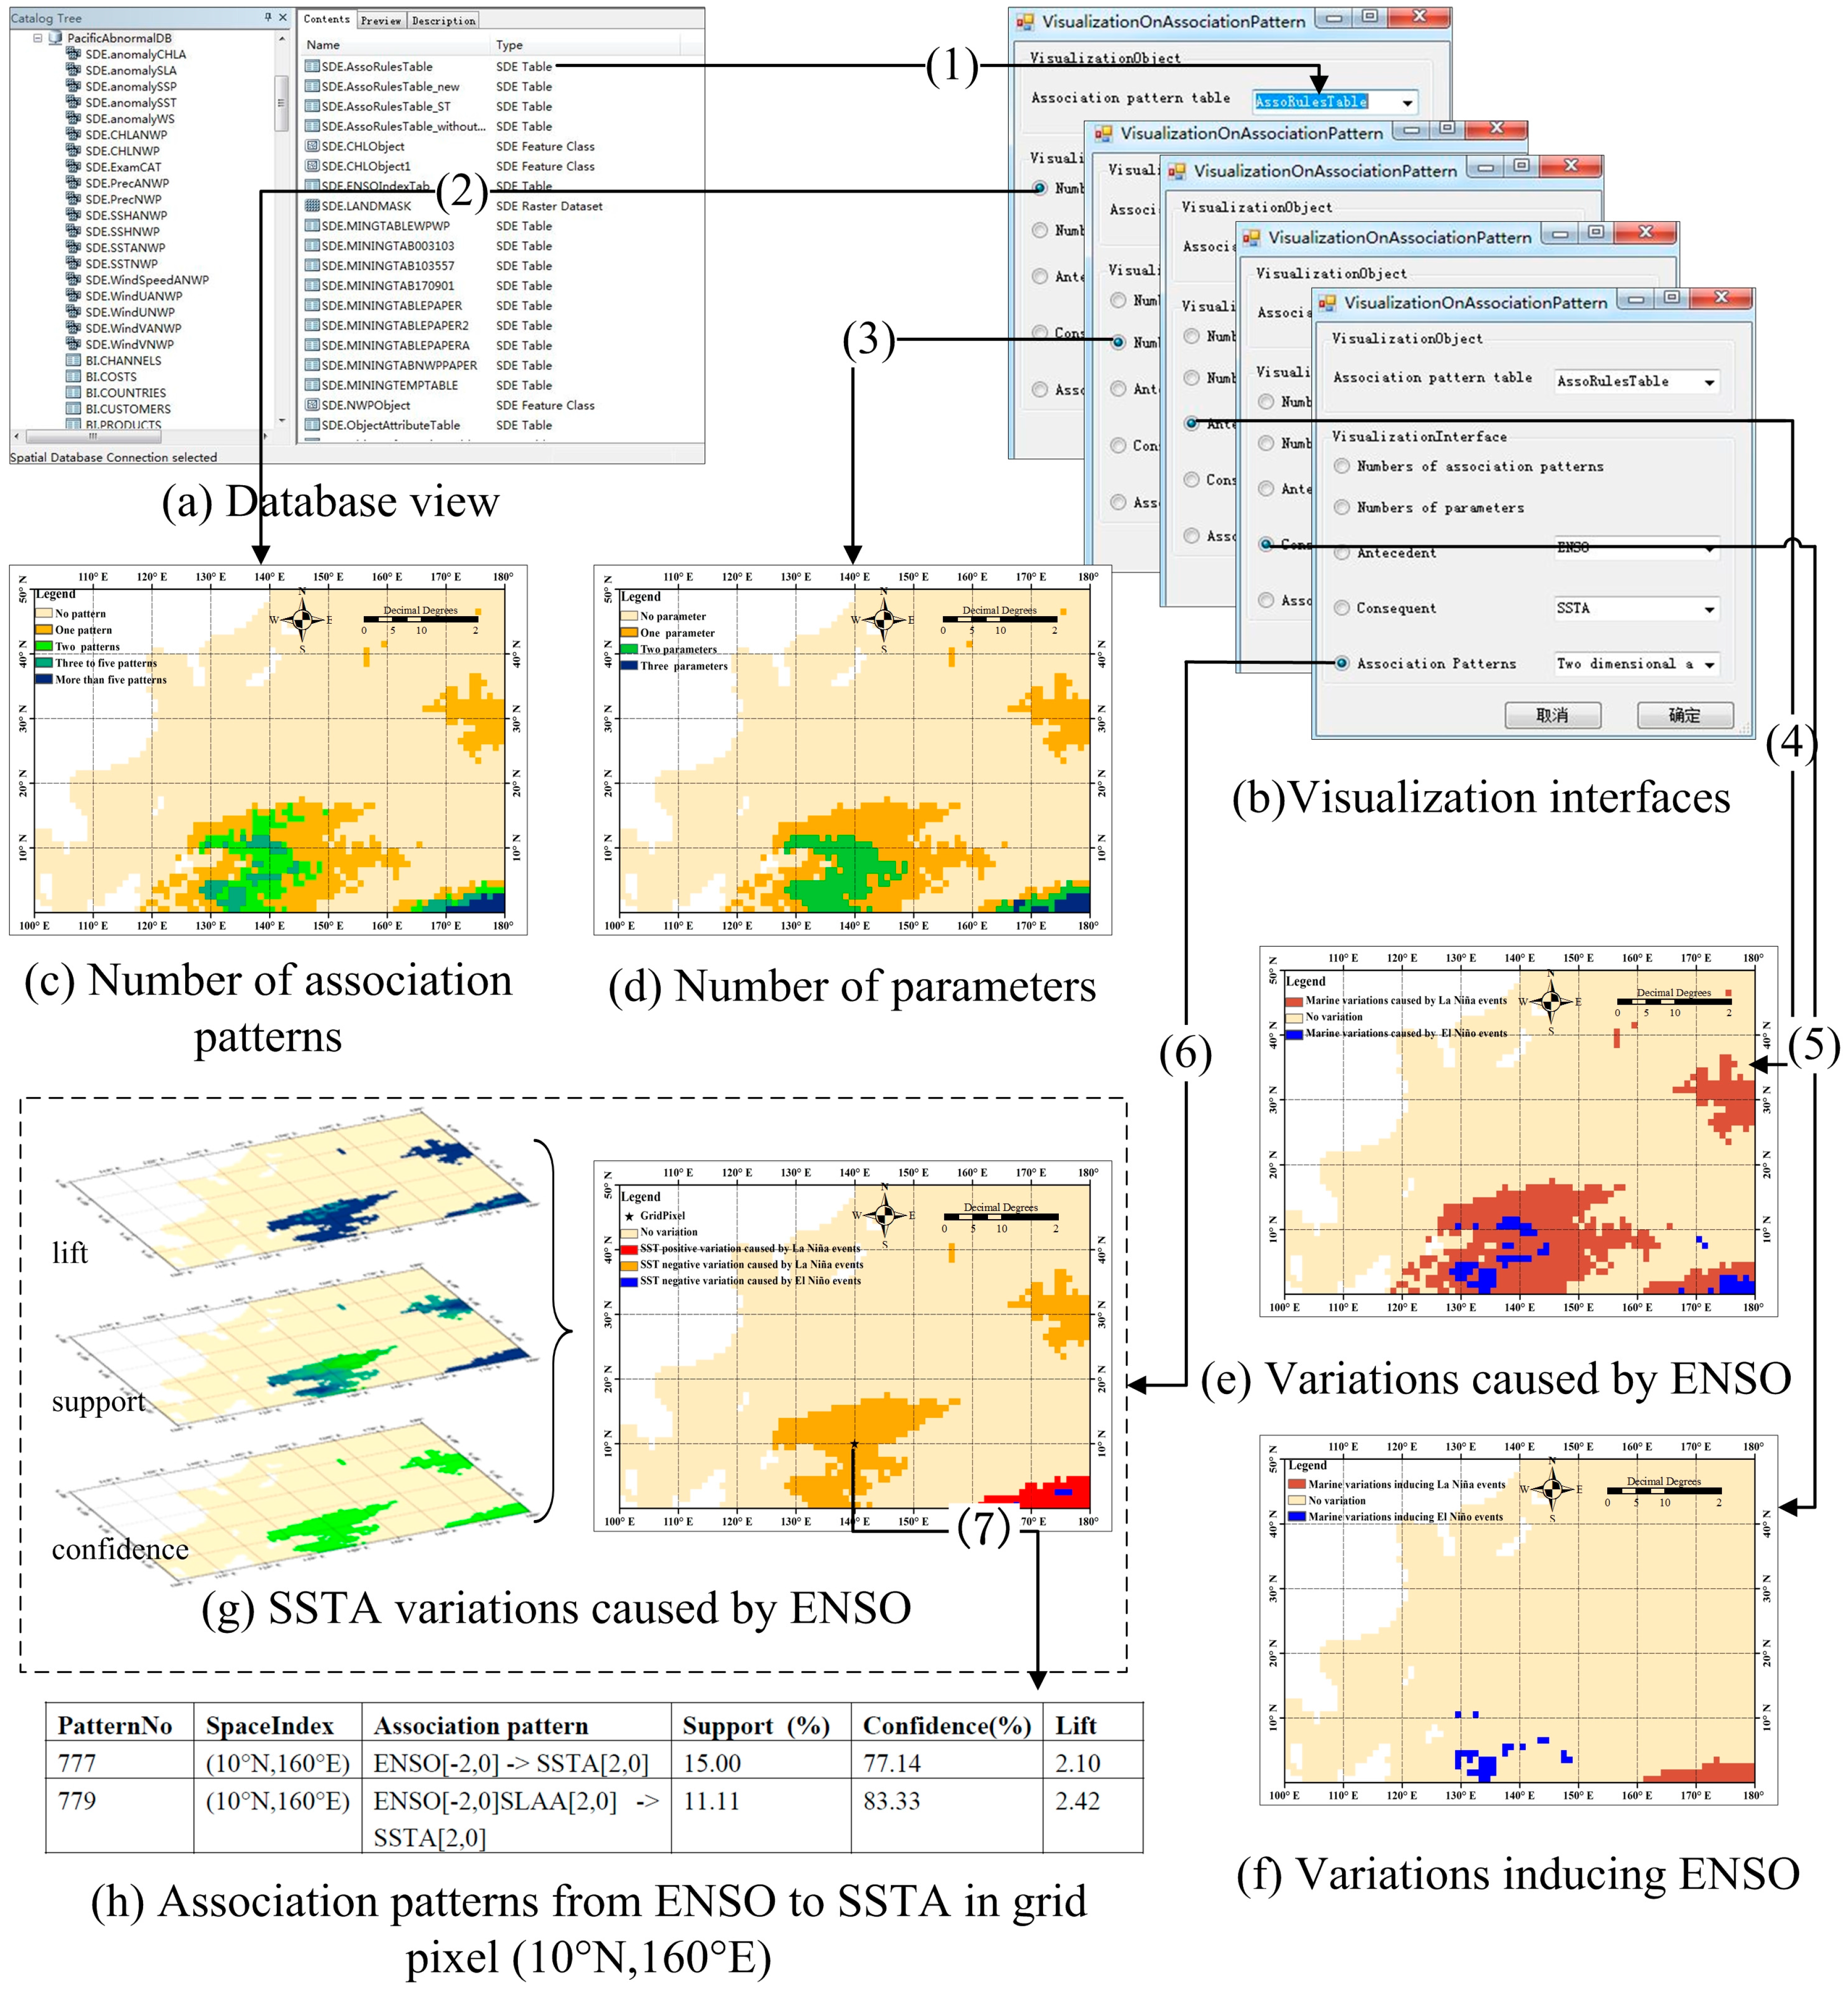
6.2. Methods and Results

Given that object- and pixel-based mining strategies are complementary components and that object-based strategies are discussed in our previous work [24], the current case study adopts pixel-based mining strategies to explore marine spatiotemporal association patterns. The results of this and the previous work may mutually test and support each other. The MIQarma (mutual-information-based quantitative association rule-mining algorithm) function for dealing with grid pixels was used here. Its core principle is the use of asymmetrical mutual information to reduce the required scans of the database and so improve mining efficiency [19].
The information threshold is set to the mean value to obtain pair-wise related items, the time interval is set to zero, and the support, confidence, and lift thresholds are set to 10%, 60%, and 2.0%, respectively. The mined marine association patterns are stored in a mining database in tabular form, denoted as AssociatedPatternTable. The spatiotemporal association patterns are represented in the following form, and the table structure is as shown in Table 2.
Table 2. Storage structure of association patterns about grid pixels.
PatternNoSpaceIndexAssociation PatternSupport (%)Confidence (%)Lift
3530(0°, 178°E)ENSO [–2,0] -> SSTA [–2,0]15.0077.143.31
3536(0°, 178°E)ENSO [–2,0] -> SSPA [–1,0]16.1182.862.07
3543(0°, 178°E)SLAA [2,0] -> CHLA [–2,0]11.6765.622.81
3548(0°, 178°E)ENSO [–2,0] -> SSTA [–2,0] SSPA [–1,0]14.4476.473.93
Part of AssociatedPatternTable stored in a tabular database.
Attra1[qa1, t] Attra2[qa2, t]…Attram[qam, t]Attrc1[qc1, t1] Attrc2[qc2, t2]…
Attrcn[qcn, tn](s%, c%, l)
where the attributes Attra1, Attra2, Attram and Attrc1, Attrc2, Attrcn represent the marine environmental parameters of pixels in lattices; the subscript a denotes an antecedent of the association pattern, and subscript c a consequent; qa1, qa2, qam and qc1, qc2, qcn are the quantitative levels of the attributes from −2 to +2; t is the occurrence time of the antecedent; t1, t2, and tn are the time differences from t when the antecedent occurred; and positive values indicate a lag and negative values a lead. The evaluation indicators s%, c%, and l correspond to the support, confidence, and lift, respectively, which are used to identify the meaningful association patterns.
In this case study, marine environmental parameters are sorted into five levels according to the mean-standard deviation method [19]. The levels −2 to +2 represent abnormally negative changes to abnormally positive changes. For the ENSO index the five levels represent strong La Niña, weak La Niña, a neutral condition, weak El Niño, and strong El Niño, using similar results to the general definition of El Niño and La Niña [16].

6.3. Process of Visualization

All visualizations here are based on the AssociatedPatternTable. Generally, each grid pixel may have zero or more association patterns, and each pattern evolves several parameters. The effective analysis and visualization of the complicated association patterns requires RSMapMining to design a series of interactive interfaces and to call corresponding visualization components.
Figure 6 shows a visualization process from an integrated view to a detailed view through a series of interactive interfaces. Thousands to millions of association patterns are stored in a tabular database, through an interface (1), and the table is linked for visualizing association patterns in a variety of forms. Through interfaces (2) and (3), the number of association patterns and involved parameters are obtained for each grid pixel. Interfaces (4) and (5) provide the spatial distribution of marine variations caused by or inducing other parameters. Interface (6) generates a detailed view between any specified marine parameters with a series of evaluation indicators, and in combination with Figure 6h, the detailed association patterns are obtained.

6.4. Analysis of Association Knowledge

Through a series of views, RSMapMining analyzes marine association knowledge at various levels. The large-scale depiction broadly indicates the interactive regions and identifies the associated parameters. Such an integrated view helps us understand which marine parameters are more related and where the relations occur. For example, marine variations caused by ENSO are located mainly in three regions of the Pacific Ocean: the western tropical, central tropical, and subtropical regions. Therefore, analysis of these regions could help us to better understand the origin and evolution of La Niña events.
The antecedent–consequent visualization view (Figure 6g) depicts some well-known patterns between ENSO to SSTA. When a La Niña event occurs, SSTA shows an anomalous increase in the western tropical Pacific Ocean region (0° to 18°N and 130°E to 150°E), and an anomalous decrease in the central tropical Pacific Ocean (0°to 5°N and 160°E to180°) [38]. Besides the well-known patterns, RSMapMining can also discern some lesser-known patterns: an abnormal rise in SSTA in the subtropical Pacific Ocean region (25°N to 33°N and 170°E to180°) may indicate La Niña events. This might be because when La Niña occurs, the North Pacific Current flows eastward through the middle of the northern subtropical region, resulting in a mean SST increase. Such lesser-known patterns may not have been revealed previously.
Figure 6. The visualization process from database to final views at various scales: (a) Database storing image datasets, object datasets, and table datasets. (b) Series of interactive interfaces linking the database and visualization views. (c) Spatial distribution of a number of association patterns showing which areas are interactive and which are not. (d) Spatial distribution of a number of parameters showing which marine parameters are associated, or not, and where they are associated. (e) Variations caused by antecedents (i.e., ENSO) showing the spatial distribution of marine variations caused by other marine parameters. (f) Variations inducing consequents (i.e., ENSO) showing the spatial distribution of marine variations that induce other marine parameters. (g) Association patterns between two marine parameters (ENSO → SSTA) showing the detailed association characteristics between them with a series of evaluation indicators (support, confidence, and lift). (h) Detailed association characteristics for a specified grid pixel (10°N, 160°E).
Remotesensing 07 09149 g006

7. Conclusions

Advanced satellite observation technology can provide marine environmental parameters at large scales over long time periods, thus facilitating studies of their interrelationships. To aid such relationship-finding in marine environmental analysis, we developed a mining system, RSMapMining. This system aims to allow automatic/semi-automatic marine environmental analysis from remote sensing images to provide new knowledge discovery. This is achieved through three modules: an image preprocessing module, a pattern mining module, and a knowledge visualization module. These modules are encapsulated in a series of components for processing images, implementing algorithms, and designing visualization interfaces, respectively. RSMapMining integrates our developed methods of marine object extraction [33], marine process definition [36], association pattern mining [19], mining strategies [16], and visualization [20]. It also incorporates several other popular components; e.g., object, event, and process definition [32,34,35], and an association pattern mining algorithm [21,23,37]. The preliminary results from a case of study of the northwestern Pacific Ocean are encouraging, and demonstrate that RSMapMining is useful and convenient for obtaining marine association patterns at various levels from the global scale to a detailed view. The program’s components can reasonably supplement existing commercial tools (e.g., ArcGIS).
The proposed RSMapMining system is a promising analytical tool for spatiotemporal association analysis of long time series of remote sensing images, but further development is still needed. Future studies will aim to expand the interfaces to integrate the latest mining methods and techniques, ensuring that RSMapMining will keep pace with the developments of remote sensing. In addition, some components depend on commercial software, which limits the extension and portability of RSMapMining. Therefore, another key issue is to revise and improve the existing components to make RSMapMining independent of any external software or source.

Acknowledgments

This research was supported by the National Natural Science Foundation of China (No. 41371385 and No. 41476154), and the State Key Laboratory of Resources and Environmental Information System project.

Author Contributions

Cunjin Xue led the research work, proposed the idea and structure of this manuscript, wrote the introduction and conclusion sections, and integrated the contributions from all authors as a whole. Qing Dong proposed the idea of this manuscript, designed the system architecture, wrote the system architecture sections, and collaborated with Cunjin Xue who wrote the full paper. Xiaohong Li collaborated with Cunjin Xue, integrated the modules and codes about spatiotemporal mining algorithms, and wrote the spatiotemporal association pattern mining module section. Xing Fan collaborated with Cunjin Xue, evaluated this system by dealing with the case of study for exploring marine association patterns in northwestern Pacific Ocean, and wrote a case of study section. Yilong Li collaborated with Cunjin Xue, integrated the work about visualization techniques, and designed interactive interfaces, developed visualization components, and wrote the knowledge visualization section. Shuchao Wu contributed to image pretreatment, and, in collaborating with Cunjin Xue, integrated the algorithms and codes about marine information extraction, designed the structure of database, and wrote the marine remote sensing preprocessing and mining database section.

Conflicts of Interest

The authors declare no conflict of interest.

References

  1. Yang, J.; Gong, P.; Fu, R.; Zhang, M.H.; Chen, J.M.; Liang, S.L.; Xu, B.; Shi, J.C.; Dickinson, R. The role of satellite remote sensing in climate change studies. Nat. Clim. Chang. 2013, 3, 875–883. [Google Scholar] [CrossRef]
  2. Du, P.J.; Liu, P.; Xia, J.S.; Li, F.; Liu, S.C.; Tan, K.; Cheng, L. Remote sensing image interpretation for urban environment analysis: Methods, system and examples. Remote Sens. 2014, 6, 9458–9474. [Google Scholar] [CrossRef]
  3. McPhaden, M.J.; Zebiak, S.E.; Glantz, M.H. ENSO as an integrating concept in earth science. Science 2006, 314, 1740–1745. [Google Scholar] [CrossRef] [PubMed]
  4. Couto, A.B.; Holbrook, N.J.; Maharaj, A.M. Unravelling Eastern Pacific and Central Pacific ENSO contributions in South Pacific Chlorophyll-a variability through remote sensing. Remote Sens. 2013, 5, 4067–4087. [Google Scholar] [CrossRef]
  5. Hollmann, R.; Merchant, C.R.; Saunders, R.; Downy, C.; Buchwitz, M.; Cazenave, A.; Chuvieco, E.; Defourny, P.; de Leeuw, G.; Forsberg, R.; et al. The ESA Climate Change Initiative: Satellite data records for essential climate variables. Bull. Am. Meteorol. Soc. 2013, 94, 1541–1552. [Google Scholar] [CrossRef]
  6. Hannachi, A.; Jolliffe, I.T.; Stephenson, D.B. Empirical orthogonal functions and related techniques in atmospheric science: A review. Int. J. Climatol. 2007, 27, 1119–1152. [Google Scholar] [CrossRef]
  7. Smith, T.M.; Arkin, P.A.; Sapiano, M.R.P. Reconstruction of near-global annual precipitation using correlations with sea surface temperature and sea level pressure. J. Geophys. Res. 2009, 114, D12107. [Google Scholar] [CrossRef]
  8. Cherry, S. Some comments on singular value decomposition analysis. J. Clim. 1997, 10, 1759–1761. [Google Scholar] [CrossRef]
  9. Kumar, V. Discovery of patterns in global earth science data using data mining. Lect. Notes Comput. Sci. 2010, 6118. [Google Scholar] [CrossRef]
  10. Hoffman, F.M.; Larson, W.J.; Mills, R.T.; Brooks, B.G.J.; Ganguly, A.R.; Hargrove, W.W.; Huang, J.; Kumar, J.; Vatsavai, R.R. Data Mining in Earth System Science (DMESS 2011). Proc. Comput. Sci. 2011, 4, 1450–1455. [Google Scholar] [CrossRef]
  11. Saulquin, B.; Fablet, R.; Mercier, G.; Demarcq, H.; Mangin, A.; Fantond’Andon, O.H. Multiscale Event-Based Mining in Geophysical Time Series: Characterization and Distribution of Significant Time-Scales in the Sea Surface Temperature Anomalies Relatively to ENSO Periods from 1985 to 2009. IEEE J. Sel. Top. Appl. Earth Obs. Remote Sens. 2014, 7, 3543–3552. [Google Scholar] [CrossRef]
  12. Lee, J.W.; Lee, Y.J. A knowledge discovery framework for spatiotemporal data mining. Int. J. Inf. Proc. Syst. 2006, 2, 124–129. [Google Scholar]
  13. Bertolotto, M.; DiMartino, S.; Ferrucci, F.; Kechadi, T. Towards a framework for mining and analysing spatio-temporal datasets. Int. J. Geogr. Inf. Sci. 2007, 21, 895–906. [Google Scholar] [CrossRef]
  14. Compieta, P.; Martino, S.D.; Bertolotto, M.; Ferrucci, F.; Kechadi, T. Exploratory spatio-temporal data mining and visualization. J. Vis. Lang. Comput. 2007, 18, 255–279. [Google Scholar] [CrossRef]
  15. Fernando, B.; Cubero, J.C.; Jiménez, A. The design and use of the TMiner component-based data mining framework. Expert Syst. Appl. 2009, 36, 7882–7887. [Google Scholar]
  16. Xue, C.J.; Song, W.J.; Qin, L.J.; Dong, Q.; Wen, X.Y. A spatiotemporal mining framework for abnormal association patterns in marine environments with a time series of remote sensing images. Int. J. Appl. Earth Obs. Geoinf. 2015, 38, 105–114. [Google Scholar] [CrossRef]
  17. Su, F.Z.; Zhou, C.H.; Lyne, V.; Du, Y.Y.; Shi, W.Z. A data mining approach to determine the spatio-temporal relationship between environmental factors and fish distribution. Ecol. Model. 2004, 174, 421–431. [Google Scholar] [CrossRef]
  18. Huang, P.Y.; Kao, L.J.; Sandnes, F.E. Efficient mining of salinity and temperature association rules from ARGO data. Expert Syst. Appl. 2008, 35, 59–68. [Google Scholar] [CrossRef]
  19. Xue, C.J.; Song, W.J.; Qin, L.J.; Dong, Q. A mutual-information-based mining method for marine abnormal association rules. Comput. Geosci. 2015, 76, 121–129. [Google Scholar]
  20. Li, L.W.; Xue, C.J.; Liu, J.; Wang, Z.J.; Qin, L.J. Raster-based visualization of abnormal association patterns in marine environments. J. Appl. Remote Sens. 2014, 8, 083615. [Google Scholar] [CrossRef]
  21. Srikant, R.; Agrawal, R. Mining quantitative association rules in large relational tables. In Proceeding of the ACM SIGMOD Conference on Management of Data, Montreal, QC, Canada, 4–6 June 1996; Volume 25, pp. 1–12.
  22. Agrawal, R.; Srikant, R. Fast algorithms for mining association rules. In Proceeding of the 20th International Conference on Very Large Databases, Santiago de Chile, Chile, 12–15 September 1994; pp. 407–419.
  23. Wu, E. Spatio-Temporal Data Mining and Analysis of Precipitation Extremes. Ph.D. Thesis, University of Sydney, Sydney, Australia, 2008. [Google Scholar]
  24. Xue, C.J.; Dong, Q.; Fan, X. Spatiotemporal association patterns of multiple parameters in the northwestern Pacific Ocean and their relationships with ENSO. Int. J. Remote Sens. 2014, 35, 4467–4483. [Google Scholar] [CrossRef]
  25. Datcu, M.; Daschiel, H.; Pelizzari, A.; Marco, Q.; Annalisa, G.; Andrea, C.; Marco, P.; Klaus, S.; Pier, G.M.; Sergio, D.E. Information mining in remote sensing image archives: System concepts. IEEE Trans. Geosci. Remote Sens. 2003, 41, 2923–2936. [Google Scholar] [CrossRef]
  26. Zhang, J.T.; Gruenwald, L.; Michael, G. VDM-RS: A visual data mining system for exploring and classifying remotely sensed images. Comput. Geosci. 2009, 35, 1827–1836. [Google Scholar] [CrossRef]
  27. Julea, N.; Meger, P.; Bolon, C.; Rigotti, M.P.; Doin, C.L.; Trouve, E.; Lazarescu, V.N. Unsupervised spatiotemporal mining of satellite image time series using grouped frequent sequential patterns. IEEE Trans. Geosci. Remote Sens. 2011, 49, 1417–1430. [Google Scholar] [CrossRef]
  28. Korting, T.S.; Fonseca, L.M.G.; Camara, G. GeoDMA—Geographic Data Mining Analyst. Comput. Geosci. 2013, 57, 133–145. [Google Scholar] [CrossRef]
  29. Romani, L.A.S.; de Avila, A.M.H.; Chino, D.Y.T.; Zullo, J.; Chbeir, R.; Traina, A.J.M.; Traina, A.J.M. A New Time Series Mining Approach Applied to Multitemporal Remote Sensing Imagery. IEEE Trans. Geosci. Remote Sens. 2013, 51, 140–150. [Google Scholar] [CrossRef]
  30. Guo, H.D. Space_based observation for sensitive factors of global change. Bull. Chin. Acad. Sci. 2009, 23, 226–229. [Google Scholar]
  31. GCOS. Oceans. In Systematic Observation Requirements for Satellite-Based Products for Climate; 2011 Update; GCOS Report 154; WMO: Geneva, Switzerland, 2011; pp. 43–58. [Google Scholar]
  32. Egenhofer, M.J.; Glasgow, J.; Gunther, O.; Herring, J.R.; Peuquet, D.J. Progress in computational methods for representing geographical objects. Int. J. Geogr. Inf. Sci. 1999, 13, 775–796. [Google Scholar] [CrossRef]
  33. Xue, C.J.; Dong, Q.; Qin, L.J. A cluster-based method for marine sensitive object extraction and representation. J. Chin. Ocean Univ. 2015, 14, 1–9. [Google Scholar]
  34. Yuan, M. Representing complex geographic penomena in GIS. Cartogr. Geogr. Inf. Sci. 2001, 28, 83–96. [Google Scholar] [CrossRef]
  35. Su, F.Z.; Zhou, C.H. A Framework for process geographical information system. Geogr. Res. 2006, 25, 477–484. [Google Scholar]
  36. Xue, C.J.; Dong, Q.; Xie, J. Marine spatio-temporal process semantics and its applications-taking the ENSO process and Chinese rainfall anomaly as an example. Acta Oceanol. Sin. 2012, 33, 16–24. [Google Scholar] [CrossRef]
  37. Tsay, Y.J.; Chiang, J.Y. CBAR: An efficient method for mining association rules. Knowl. Based Syst. 2005, 18, 99–105. [Google Scholar] [CrossRef]
  38. Hoell, A.; Funk, C.; Barlow, M. The regional forcing of Northern hemisphere drought during recent warm tropical west Pacific Ocean La Niña events. Clim. Dyn. 2014, 11–12, 3289–3311. [Google Scholar] [CrossRef]

