
Mapping Ground Subsidence Phenomena in Ho Chi Minh City through the Radar Interferometry Technique Using ALOS PALSAR Data

Abstract
: The rapidly developing urbanization since the last decade of the 20th century has led to extensive groundwater extraction, resulting in subsidence in Ho Chi Minh City, Vietnam. Recent advances in multi-temporal spaceborne SAR interferometry, especially with a persistent scatters interferometry (PSI) approach, has made this a robust remote sensing technique for measuring large-scale ground subsidence with millimetric accuracy. This work has presented an advanced PSI analysis, to provide an unprecedented spatial extent and continuous temporal coverage of the subsidence in Ho Chi Minh City from 2006 to 2010. The study shows that subsidence is most severe in the Holocene silt loam areas along the Sai Gon River and in the southwest of the city. The groundwater extraction resulting from urbanization and urban growth is mainly responsible for the subsidence. Subsidence in turn leads to more flooding and water nuisance. The correlation between the reference leveling velocity and the estimated PSI result is R2 = 0.88, and the root mean square error is 4.3 (mm/year), confirming their good agreement. From 2006 to 2010, the estimation of the average subsidence rate is −8.0 mm/year, with the maximum value up to −70 mm/year. After four years, in regions along Sai Gon River and in the southwest of the city, the land has sunk up to −12 cm. If not addressed, subsidence leads to the increase of inundation, both in frequency and spatial extent. Finally, regarding climate change, the effects of subsidence should be considered as appreciably greater than those resulting from rising sea level. It is essential to consider these two factors, because the city is inhabited by more than 7.5 million people, where subsidence directly impacts urban structures and infrastructure.1. Introduction
Urban flooding is a major hazard affecting our society [1,2]. In Ho Chi Minh City (HCMC), flooding is becoming a more frequent and serious problem, as it happens as a result of both regular and extreme climatic events, such as tropical storms and typhoons [3,4]. This problem can be seen to result mainly from: (1) the rise of sea level, for which the city ranks among the top 20 cities in the world to be severely affected by climate change [5,6]; and (2) the lowering of the land surface elevation, for which the rapid increase of population leads to excessive pumping of water from underground reservoirs [4,7]. In response to the flooding challenges, besides climate change adaptation [4], knowledge of ground subsidence, such as the spatial extent and temporal evolution, is essential.
Ground subsidence induced by water overexploitation of underground reservoirs is a common problem happening in many cities around the world [8,9]. The most dramatic subsidence value has been reported in cities, such as 5 m in Tokyo, 3 m in Shanghai and 2 m in Bangkok, during the 20th century [6]. In HCMC, the rapid increase of ground water use started in the late 1990s (the groundwater abstraction was approximately 80,000 m3/day in 1950, 130,000 m3/day in 1960, 358,000 m3/day in 1996, 475,000 m3/day in 1998 and 583,000 m3/day in 2008, whereas the safe level of abstraction is less than 300,000 m3/day [10]). This resulted in the water table lowering, leading to the subsidence of some areas in the city. Land subsidence at the rate of a few centimeters per year can be measured at many ground water pumping stations [7,10].
Multi-temporal Synthetic Aperture Radar (SAR) Interferometry (InSAR), Differential Global Positioning System (DGPS) and leveling are widely used techniques to measure the ground deformation. However, techniques like leveling and DGPS can only measure ground subsidence at a few discrete points, not over a wide and continuous area. A multi-temporal InSAR approach [11–13] has already shown its ability to map ground deformation on a large spatial scale with short-term data sampling rates, associated with either ground subsidence (e.g., [14]), co-seismic activity (e.g., [15]) or landslides (e.g., [16]), etc. Particularly in [13], a maximum likelihood estimator-based method offers a rigorous way to jointly exploit not only stable point-like scatterers (so-called permanent scatterers (PS)), but also distributed scatterers (DS). Such an increased number of identified PS/DS points on the ground results in an increased confidence of the ground motion, compared to the previous PS algorithm [11].
The purpose of the present paper is to: (i) present a detailed spatial ground subsidence trend of the Ho Chi Minh City area for the period of 2006 to 2010, outlining the importance of the rate (decreasing) of the velocity ground motion; (ii) discuss the role of the geological features and urbanization on the resultant subsidence; and (iii) discuss the implication of subsidence for flooding in the context of climate change. The study of the ground subsidence was based on the detailed analysis of ALOS PALSAR radar imaging.
The paper is structured as follows: in Section 2, the study site is introduced; Section 3 presents multi-temporal InSAR methodology; in Section 4, the results of ground subsidence are presented, a discussion of the role of the geological features and urbanization is provided, as well as a discussion of the implication of ground subsidence for flooding; in Section 5, conclusions are drawn.
2. Ho Chi Minh City Study Site and Dataset
2.1. Study Site and Problem Statement
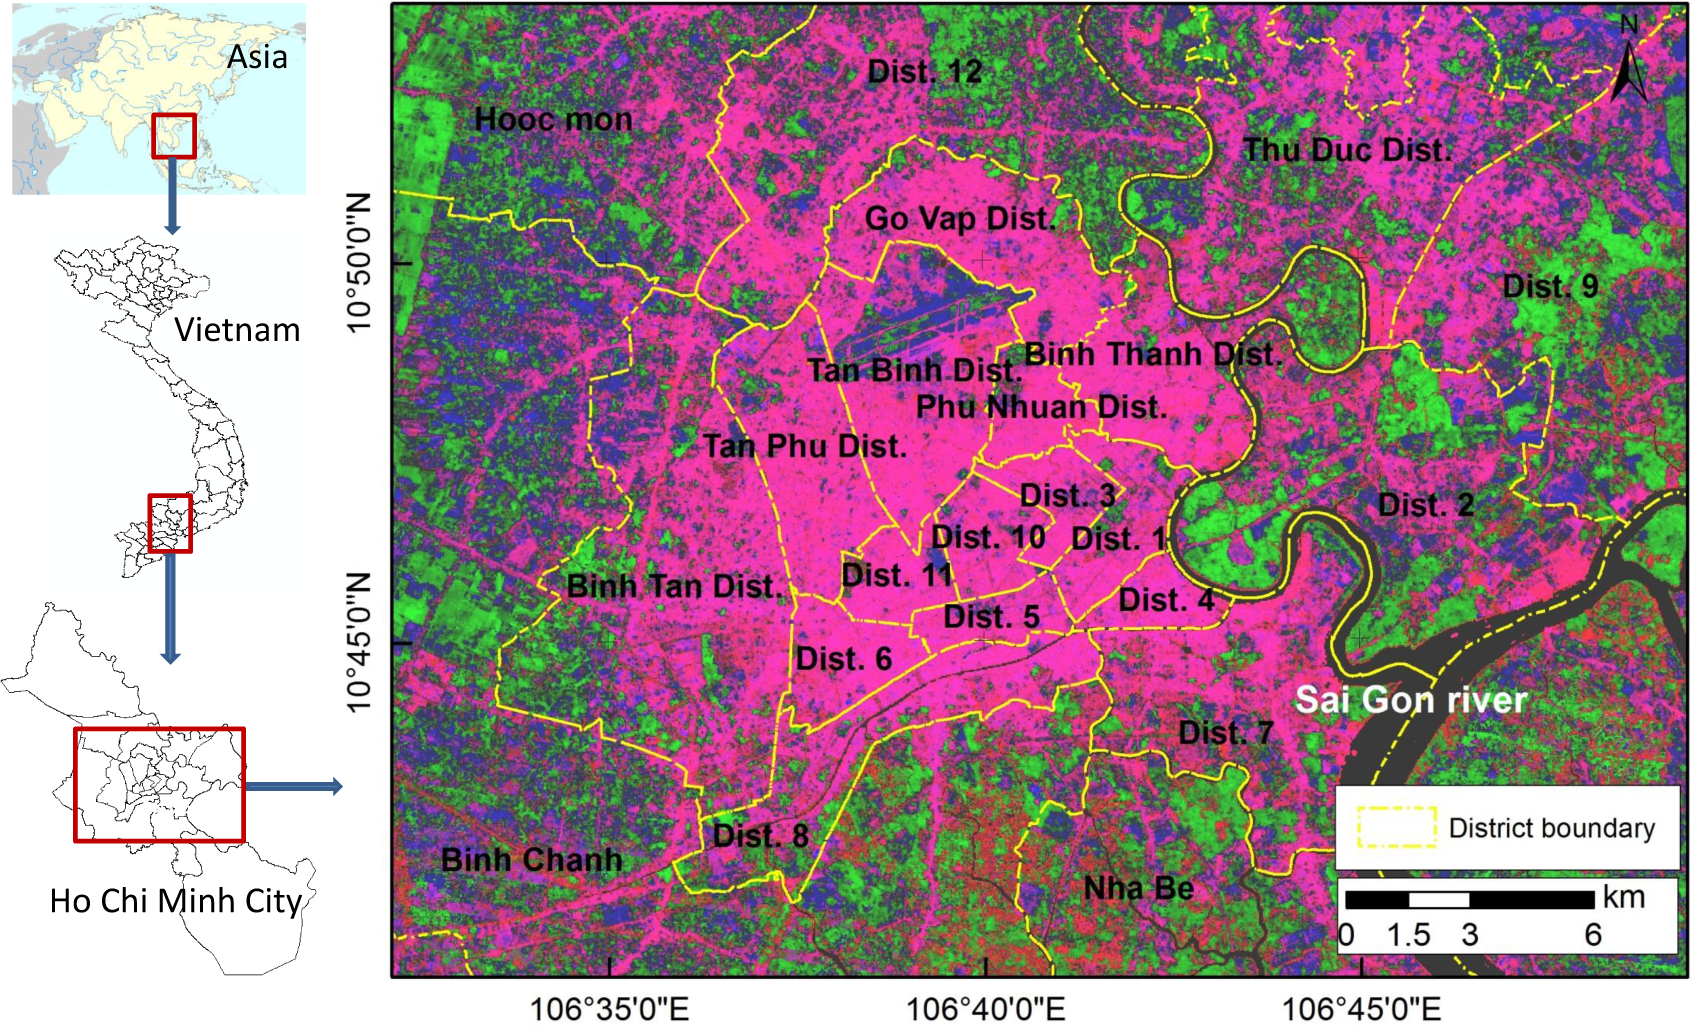
The study area is composed of the urban and a part of the suburban region of Ho Chi Minh City, Vietnam. This is a megacity with a population of more than 7.5 million (in 2011) and great potential for developing industry, exports, tourism and services. It is located at 10.85 N latitude, 106.65 E longitude, lies about 55 km inland from the East Sea and is surrounded by the Sai Gon River system. The whole area is approximately 25 km × 30 km; see Figure 1. The background is the composite image (red: Band 1; green: Band 2; blue: Band 3) of Landsat data in 2012 [17], which allows us to observe the distribution of urban areas (in pink).
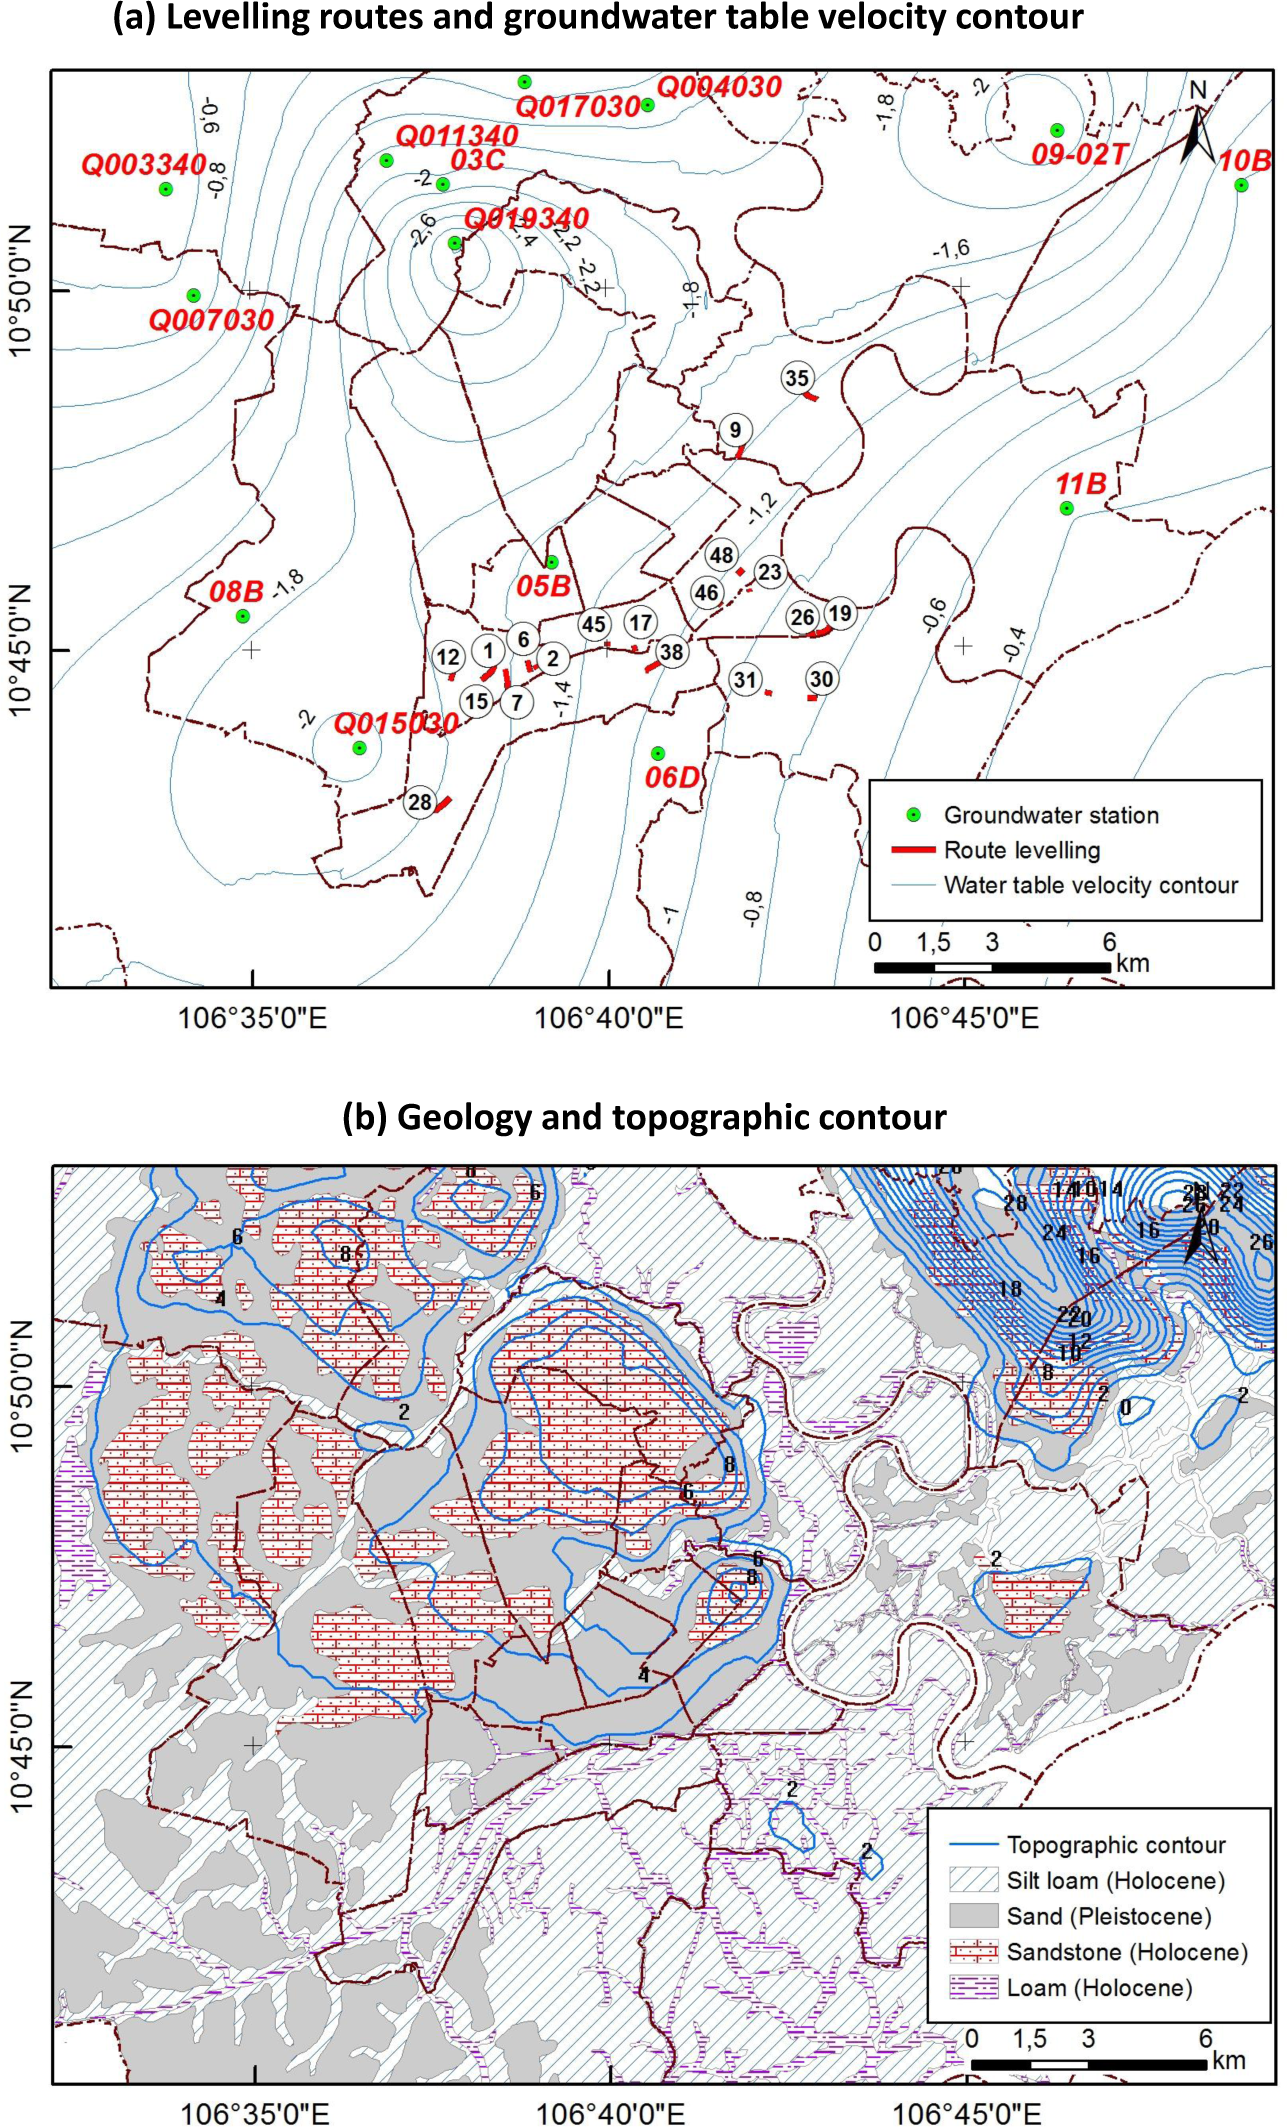
Table 1 shows three basic statistics numbers: urban building, population and industrial product. The rapid urbanization of HCMC has resulted from two urban policies [18]: (1) in January 1997, five new districts were established (Districts 2, 7, 9, 12 and Thu Duc); and (2) in November 2003, there were two new districts, namely Binh Tan and Tan Phu Districts. Those new districts are intended to attract people, the construction of buildings and economic industrial investments; see Table 1. However, such rapid urbanization leads to the reduction of water supply (from the Sai Gon and Dong Nai Rivers through the Thu Duc Wasuco Company). People and the industries had to pump more groundwater. As a result, the groundwater table had been getting lower with a velocity of up to −2 m/year (from 2000 to 2006); see Figure 2a. This factor together with buildings and infrastructure loading consequently resulted in the state of stress change, leading to the change in the consolidation of soil layers. Such change certainly leads to land subsidence.
2.2. Ground Data
The ground data are from the HCMC subsidence monitoring project [10] that was conducted by the HCMC Natural Resources and Environment Department and Geomatics Center-International Technology Park, HCMC National University in 2008 to 2010. The main objective of this project was the measuring and monitoring of the subsidence of the city by using InSAR. The ground data were collected and are shown in Figures 2 and 3.
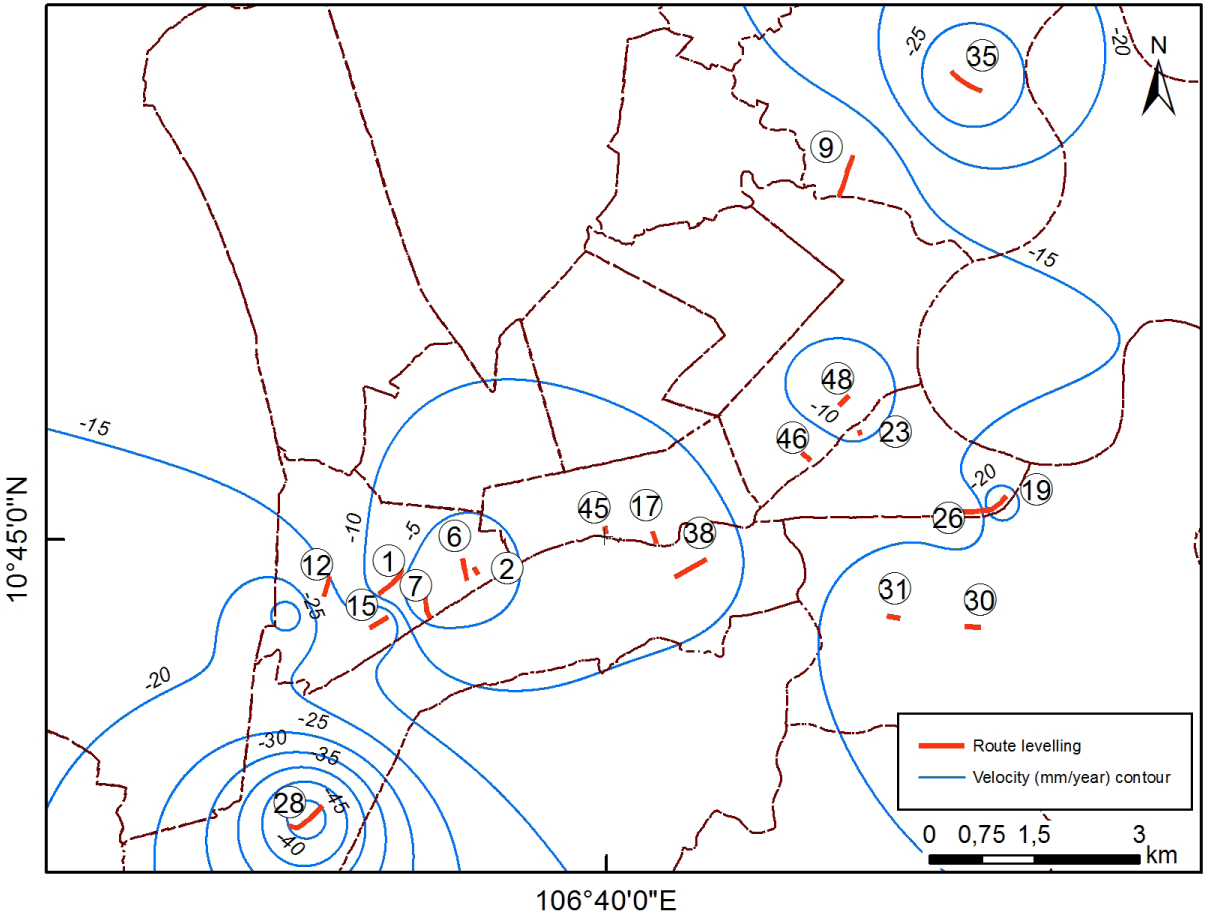
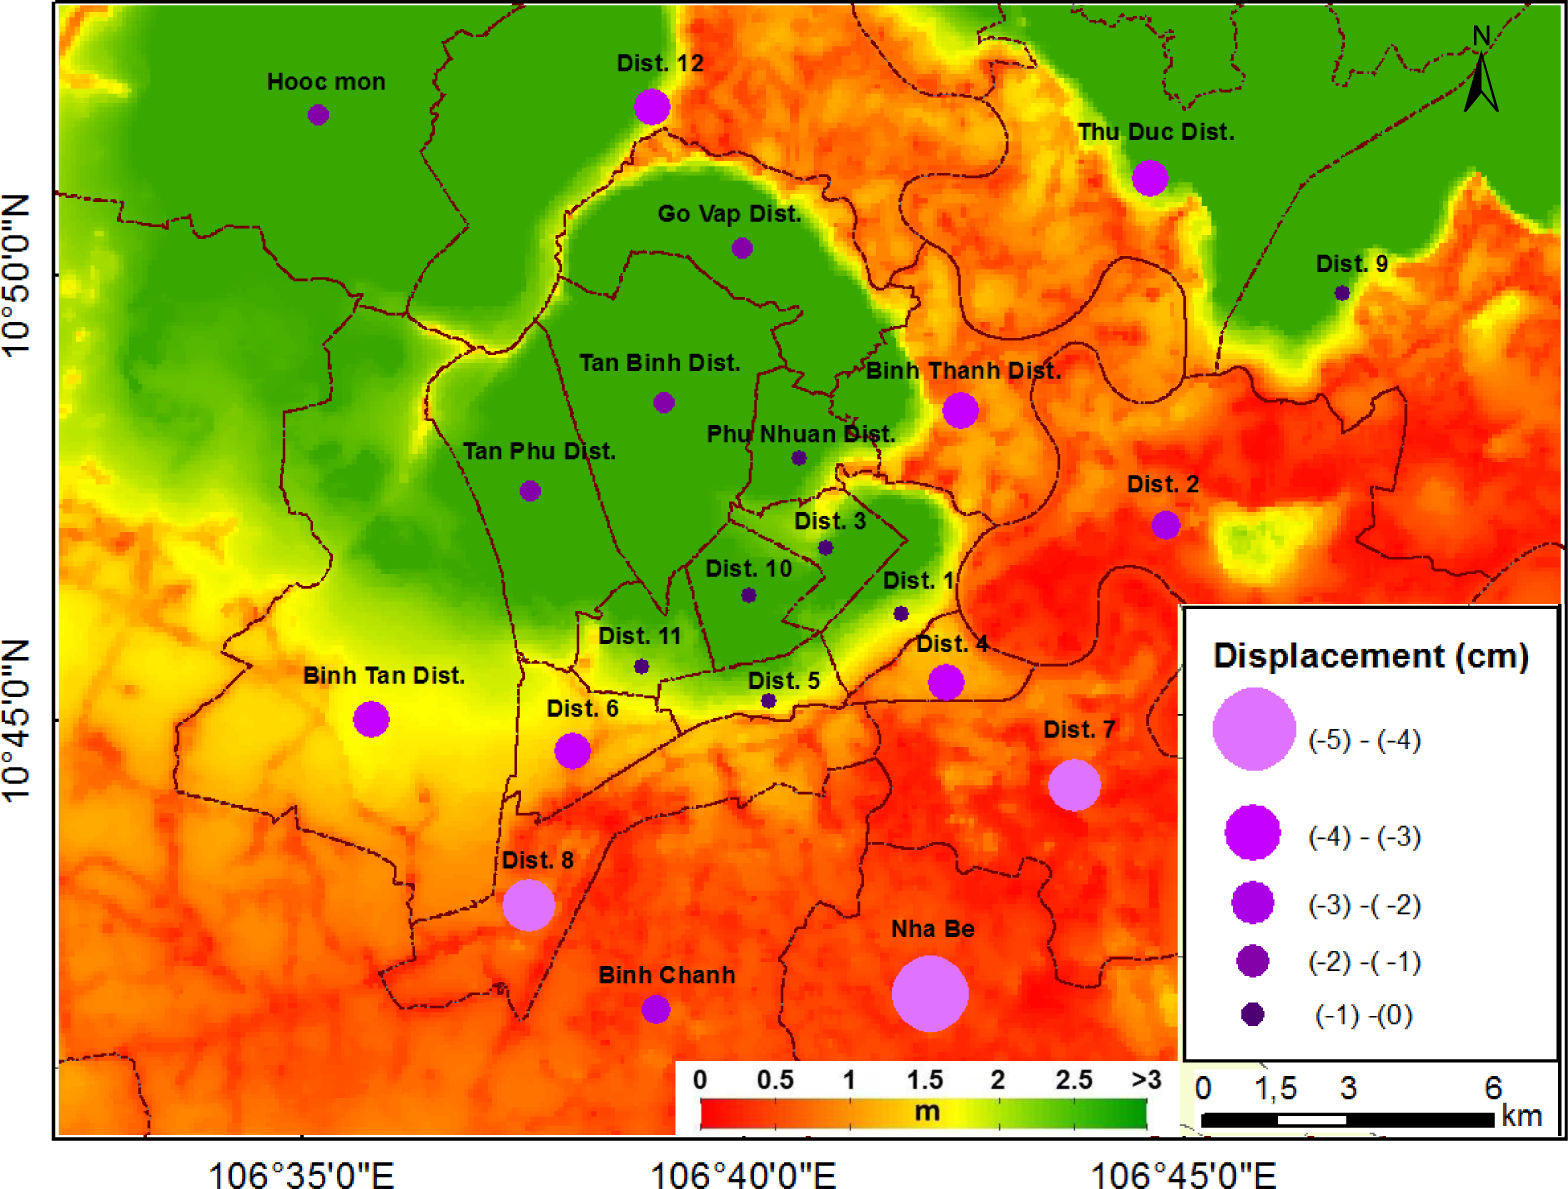
In Figure 2a, confined aquifer groundwater stations are shown. At such stations, the water level value was available yearly from 2000 to 2006. One example is shown in Figure A1 in the Appendix, where the steady decline of the groundwater level can be observed. The velocity (m/year) of the water table was estimated and interpolated as contour lines. The confined aquifer (upper Pleistocene) layer is distributed in the whole city area. The average depth is from 50 m to 120 m, with the maximum value up to 138 m [10]. This layer is the main source for abstraction with a capacity approximately from 2.6 L/s to 19.3 L/s. Leveling data had been surveyed along selected routes in 2003 and in 2009. Each route leveling procedure was carried out by using an optical micrometer to determine the difference in level between points, allowing the elevation of given points above the mean sea level to be computed [20]. A zoom version of Figure 2a is provided in Figure A2 in the Appendix to facilitate visualization leveling results. The velocity (mm/year) of 19 route leveling measurements was calculated for comparison with the multi-temporal InSAR approach. The vertical velocity of ground motion varies from −47 to 2 mm/year with about a −15-mm/year average.
The topographic contour and Quaternary geologic map, all surveyed in 2003, are shown in Figure 2b. Except for the high hill (up to 30 m) in the northeast of the city, the topography is quite flat and varies between 0 and 10 m with about a 3-m average height. In HCMC, the Cenozoic subsoil mainly includes Holocene and Pleistocene sediments [18]. There are four basic deposits ranking in the order of their compaction: silt loam, loam, sand and sandstone. Loam and silt loam deposits, which have a thickness varying approximately from 10 to 35 m, are mostly mud and/or have high organic content, distributed mainly along the Sai Gon River and the south of the city [18]. Even without human activities, for such deposits, the accumulating weight over each mud layer can easily squeeze water out of it, compressing it and causing surface subsidence. Before 1975 in HCMC, in such unstable areas, there was almost no human inhabitants and activities (except Districts 4 and 8) [18].
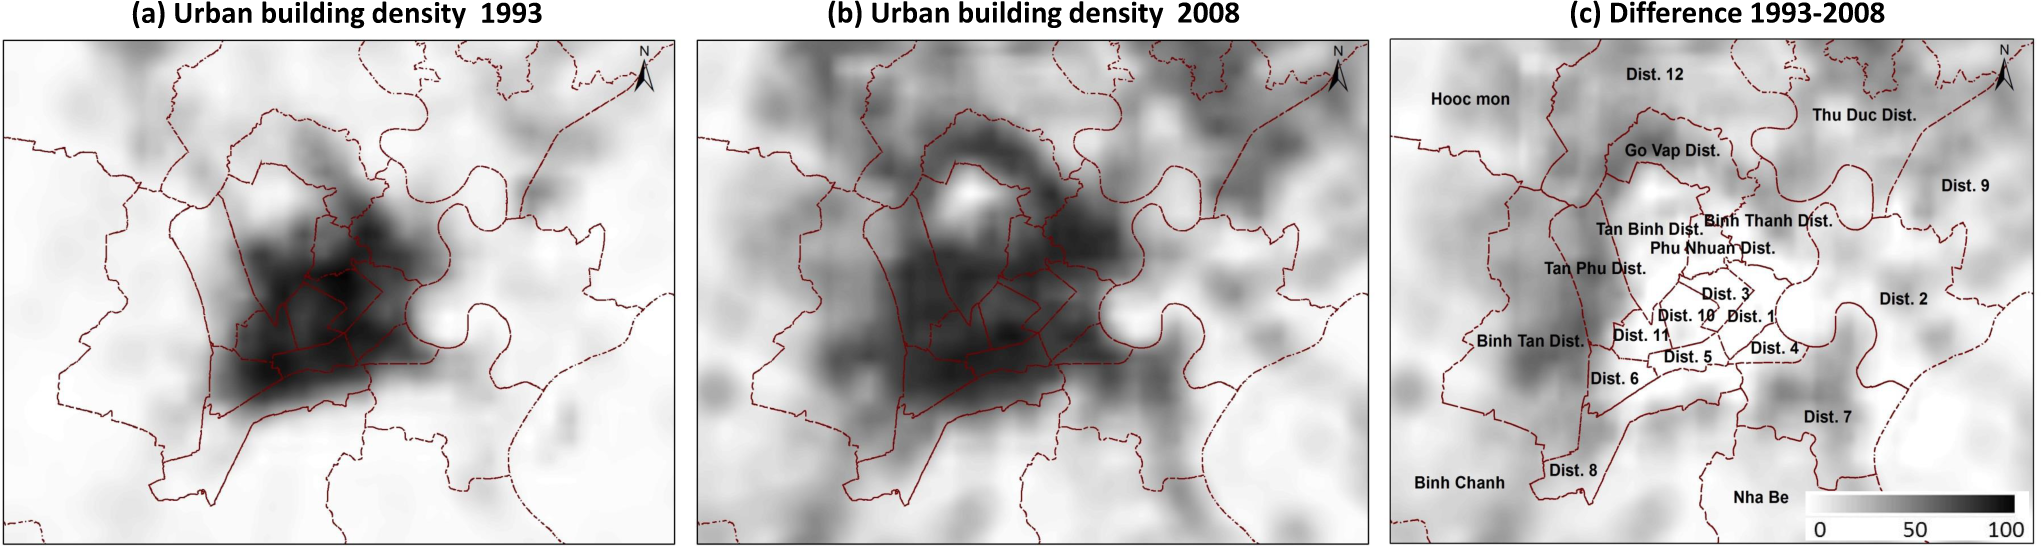
Figure 3a,b shows the urban building density (percent) in 1993 and 2008, respectively. Figure 3c is the difference between 1993 and 2008, allowing us to examine the spatial distribution of urban expansion. In this work, we refer to such differences as the urban growth factor. In the study area, HCMC can be roughly classified into two regions based on the urban growth: (1) the urban core region, where the region is mostly finished with urbanization (such as Districts 1, 3, 4, 5, 6, 10, 11 and Phu Nhuan); and (2) the urban fringe region, where urban growth is mostly still taking place.
2.3. SAR Data
The Phased Array L-band Synthetic Aperture Radar (PALSAR) of the ALOS (Advanced Land Observation Satellite) data descending stack is from the Japan Aerospace Exploration Agency. In single-imaging mode, the resolution is about 4.7 m in the slant range and 4.5 m in the azimuth direction [21]. Each image has been resampled on a common grid (so-called master) on 11 December 2008. Table A2 in Appendix provides detailed information.
It is important to note that the Ho Chi Minh City site and other Asian areas are outside the Copernicus data policy of ESA. There is very little ESA data, e.g., ENVISAT ASAR, suitable for such applications, which typically require a stack of multi-temporal data. In this work, we find that the ALOS PALSAR data are the best dataset available for this study.
3. Methodology: PS/DS Processing Chain
The conventional spaceborne InSAR takes advantage of the geometry between two SAR acquisitions to obtain the interferometric phase, but this technique has issues relative to atmospheric, spatial and temporal decorrelations that cannot be efficiently eliminated, resulting in not entirely reliable interferograms that represent the ground deformation [22]. This deficiency has been overcome by a specific analysis considering phase changes in a series of SAR images acquired at different times over the same region.
The first approach is permanent/persistent scatters interferometry (PSI). This was developed by [23], representing the first attempt to give a formal framework to the problem of multi-temporal InSAR. Instead of analyzing the entire images, the analysis is based only on the selection of a number of highly-coherent, temporally-stable, point-like targets within the imaged scene, which can be identified by analyzing the amplitude stability of every pixel [11,24]. Such deterministic targets, named permanent/persistent scatterers (PS), often correspond to man-made objects widely available over an urban city, but are less present in non-urban areas.
Several approaches have been presented in the literature to perform SAR interferometric analysis over scenes where the PS assumption may not be retained, e.g., by considering distributed scatterers (DS). A number of these works share the idea of minimizing the effect of target decorrelation by the exploitation of a subset of interferograms taken with the shortest temporal and/or spatial baselines possible (small baseline subsets (SBAS)) [15,25,26]. This approach can be considered as the complement to the PSI approach [26].
Finally, the attempt to combine PS and DS has been considered through maximum likelihood estimation (MLE) frameworks [13,27,28]. The rationale of MLE techniques is to exploit target statistics, represented by the ensemble of the coherences of every available interferogram, to design a statistically-optimal estimator for the parameters of interest. The advantage of this technique is that the criteria, which determine the weight of each interferogram in the estimation process, are directly derived from the coherences, through a rigorous mathematical approach. Furthermore, by virtue of the properties of the MLE, the estimates of the parameters of interest are asymptotically unbiased and of minimum variance [29]. However, a common drawback of these techniques is the need for reliable information about target statistics, required to drive the estimation algorithm. The MLE approach proposed by [27] consists of estimating the residual topography and the deformation rate directly from the data. This estimator is the most robust, due to the estimation of the whole structure of the model performed in a single step, but this would result in an overwhelming computational burden.
In the work by [13,28], the estimation process is split into two steps. In the first step, the MLE is used, which jointly exploits all of the N(N-1)/2interferograms available from N images, in order to squeeze the best estimates from the N − 1 interferometric phases. This step is known as phase linking [30] or phase triangulation [13]. Such a step is very powerful for DS-based phase calibration in forest SAR tomography frameworks, even with N = 6 images [31]. The computational burden of the first step is very low, but the same performance as the one-step MLE can be approached only under the condition that the N(N − 1)/2 phases are estimated with sufficient accuracy, as happens by exploiting a large estimation window and/or at a high signal-to-noise ratio. Once the first estimation step has yielded the estimates of the N − 1 interferometric phases, the second step is required to separate the contributions of the decorrelation noises from the parameters of interest, as in PSI.
3.1. PS/DS Processing Chain Detail
In this work, we are in principle following the two-step approach in the MLE framework, to exploit not only PS, but also DS information for estimating the deformation. The reader is referred to [13] for the full rigorous mathematical descriptions. In the following, the PS/DS processing chain adapted in this work can be described as follows:
Carry out coregistration of the slave SAR to the master SAR. Each image within the ALOS data stack has been resampled on a common master grid on 11 December 2008. A digital elevation model (DEM) is built from land surveying data in 2003, which has an accuracy of about 0.1 m and 0.4 m in flat and topographic areas, respectively. The surveyed DEM has been transformed to each master grid and then compensated for the topographic contribution.
For each pixel, find the family of statistically homogeneous pixels (SHP) by applying the two-sample Kolmogorov–Smirnov test [13]. A window of 15 × 15 is used for the ALOS PALSAR dataset.
Define DS at those pixels for which the number of SHP is larger than a certain threshold. The threshold is chosen as 50 pixels to maintain the point-wise radar response of PS. We thus expect the number of looks for sample coherence estimation to range from 50 to 225.
For all DS, estimate the sample coherence matrix taking advantage of the SHP families identified in Step 2 above.
Apply the phase linking algorithm to each coherence matrix associated with each DS to squeeze optimized phases.
Select the DS exhibiting a phase linking coherence value higher than 0.2 and substitute the phase values of the original SAR images with their optimized values.
Select PS/DS candidates by an iterative algorithm based directly on a phase stability criterion [12].
Process the selected PS/DS jointly using the traditional PSI algorithm for the estimation of displacement time series of each measurement point.
4. Ground Subsidence Results and Discussions
4.1. Ground Subsidence Results
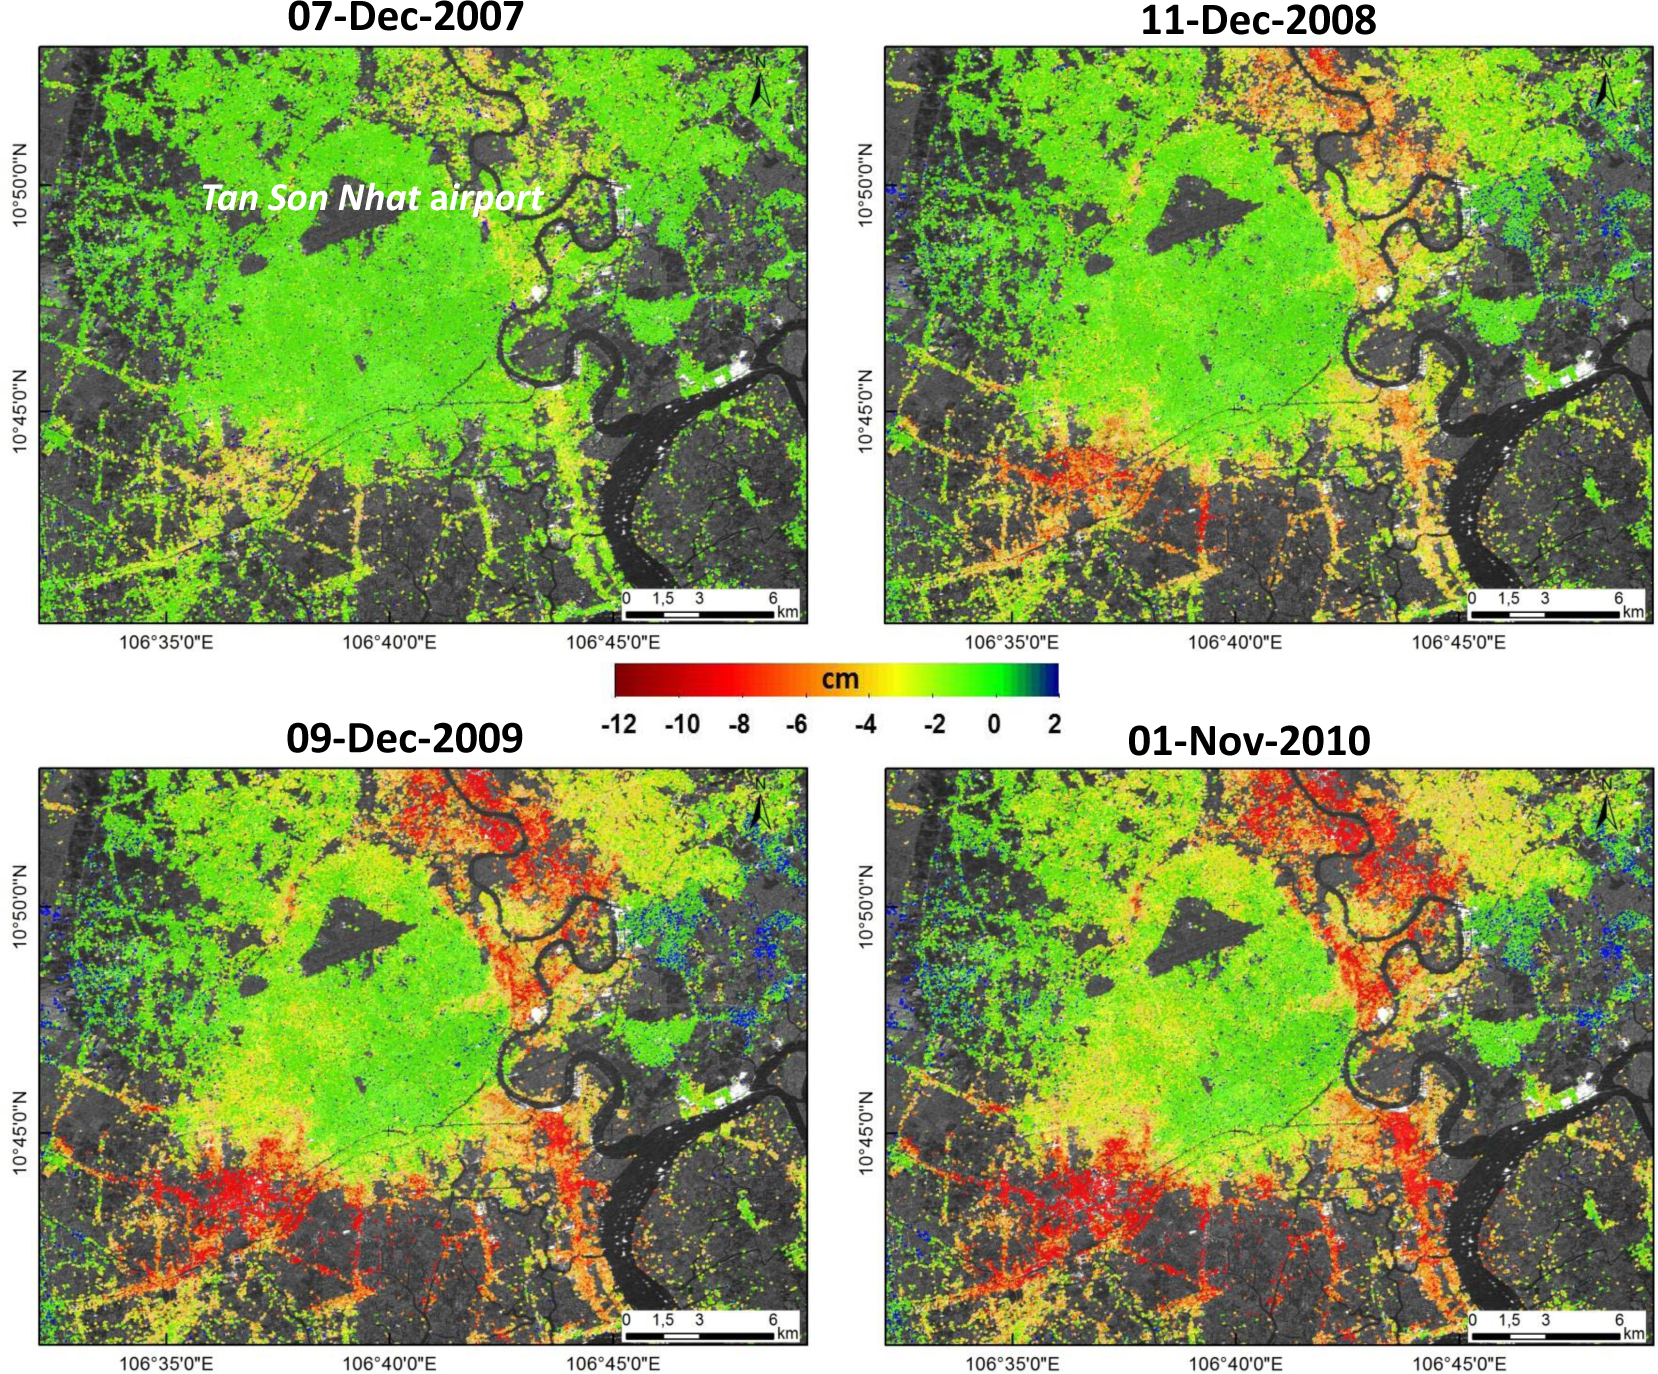
The period of 2006 to 2010 using ALOS PALSAR data was processed by using the PS/DS processing chain mentioned in Section 3.1. More than 400,000 PS/DS measuring points in the ALOS PALSAR L-band (LOS angle: 34.9 degree) dataset were identified within an area extent of about 750 km2. We note that there is an area that lacks PS/DS points in the north part of Tan Binh District, which is the Tan Son Nhat airport. This can be due to temporal decorrelation caused by vegetation. Long wavelength P band is foreseen to yield better performances; see, for example, [32].
Assuming that most of the measured deformation corresponds to vertical displacement of the surface due to subsidence, we can then obtain vertical displacement through straightforward geometrical arguments. The assumption is supported by the fact that tectonics are found only in northwestern and in central Vietnam [33]. The date of 6 December 2006 was specified as the start temporal reference. The result is reported in Figure 4. Positive velocities (blue colors) represent uplift; negative velocities (red colors) represent subsidence. The subsidence is detected in areas along the Sai Gon River and in the southwest of the city, where the land has sunk up to −12 cm after four years.
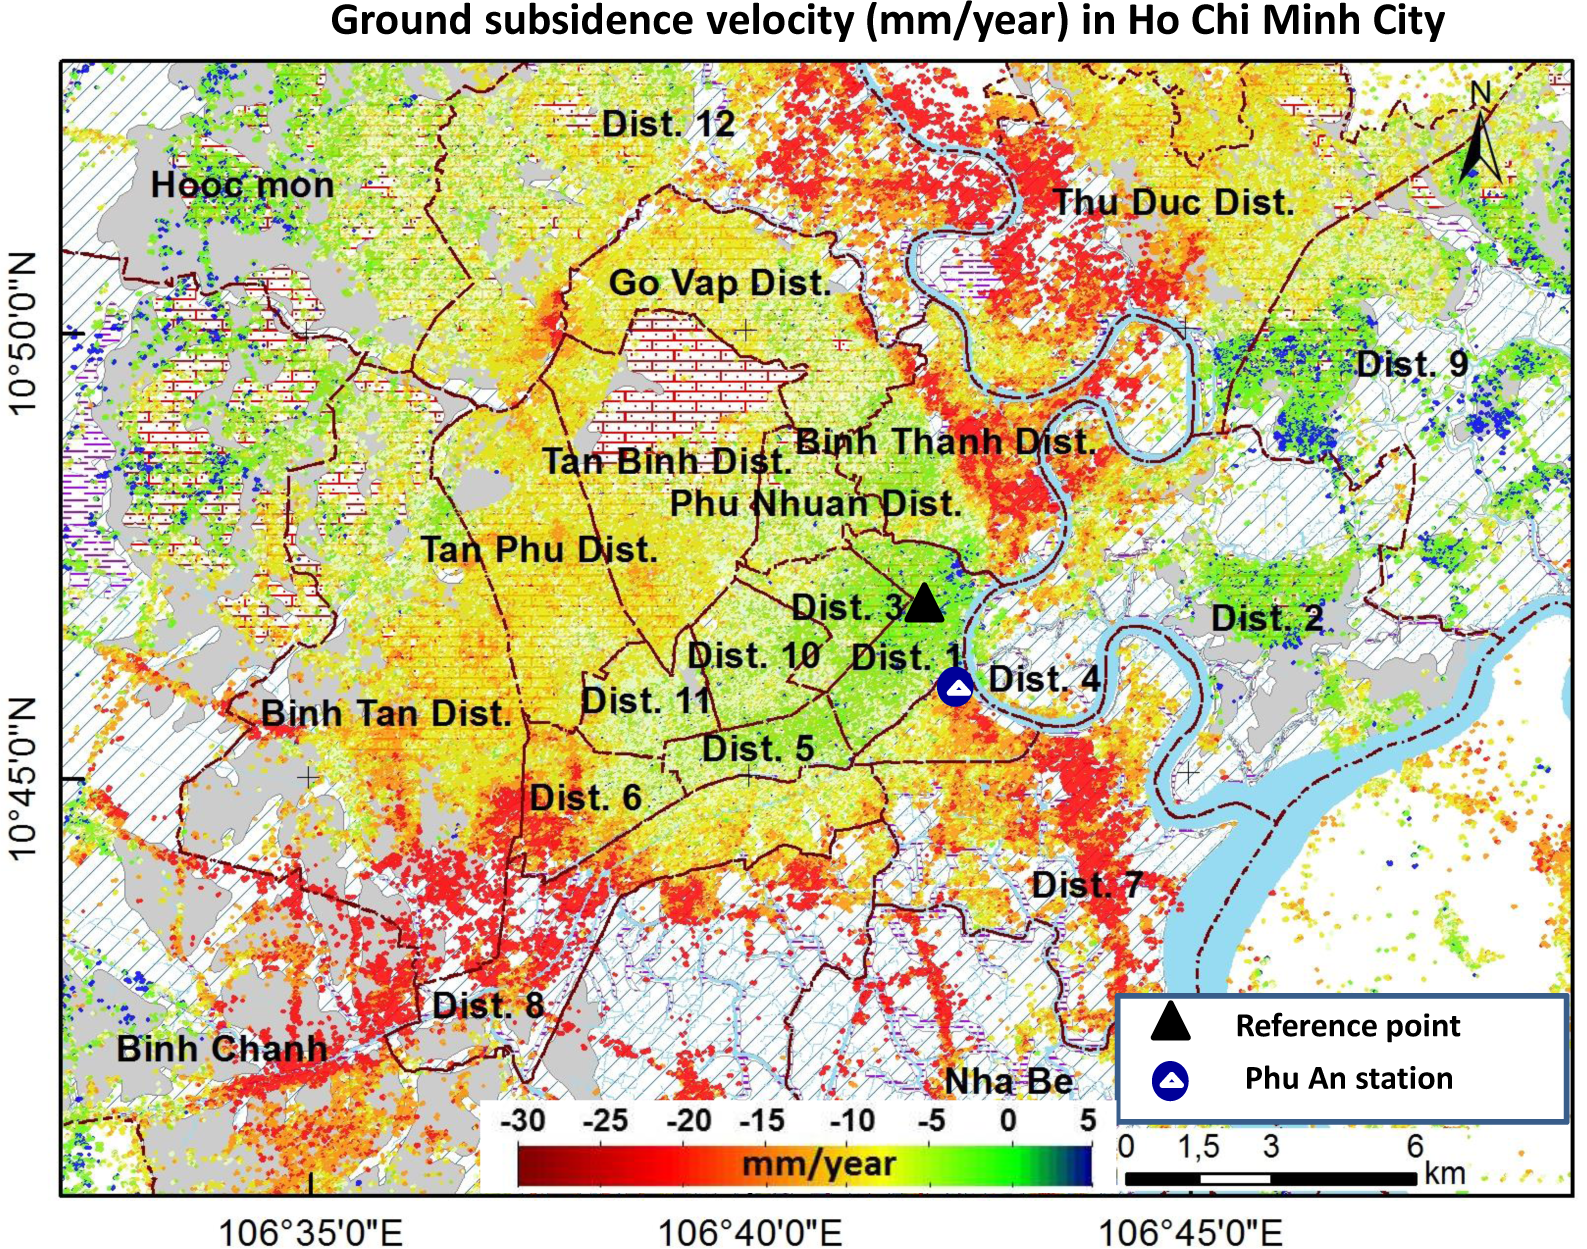
Furthermore, we assume that there is no obvious seasonal variability, so that the subsidence history can be approximated by a linear function. Such an assumption is supported by the fact that in HCMC, the groundwater abstraction is mainly from confined aquifer layers (at a 50- to 120-m depth), which are little affected by seasonal recharge. In Figure 5, the averaged vertical velocity (mm/year) map is shown. In order to minimize the motion bias, the reference point was chosen for the interferometric analysis and located at the geological sandstone area in District 1, which is the most stable unit compared to the rest of the study area (see Section 4.3).
The estimation of the average subsidence rate is −8.0 mm/year with the maximum value up to −70 mm/year in the period of 2006 to 2010. The ground subsidence phenomena were found mostly in geological loam and silt loam areas, as expected; see Figure 2b and Section 2.2.
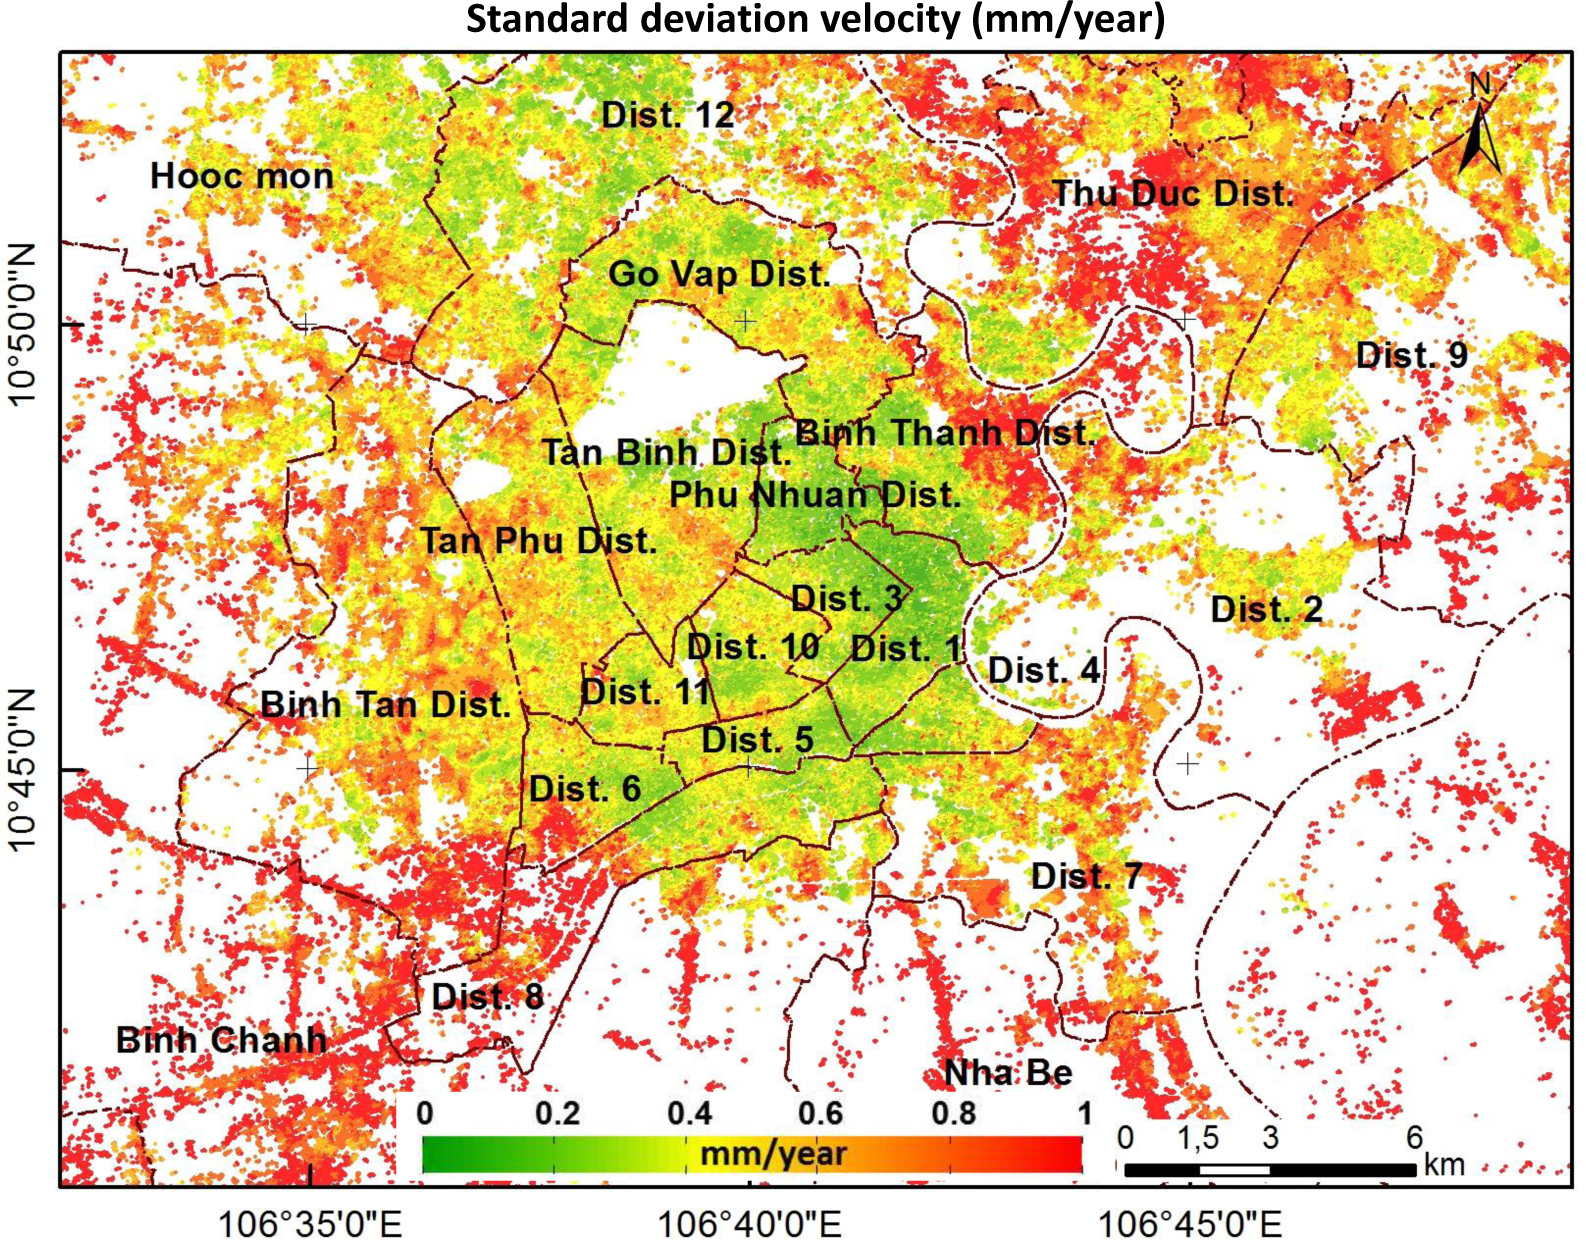
If a PS/DS point exhibits a strong non-linear motion, e.g., a seasonal movement, it would result in a large residual with respect to the linear model and, thus, in a high standard deviation value. In Figure 6, the standard deviation of the velocity was shown. The values are mostly less than 1 mm/year. Hence, it can be inferred that an almost linear subsidence is taking place in HCMC for the period of 2006 to 2010.
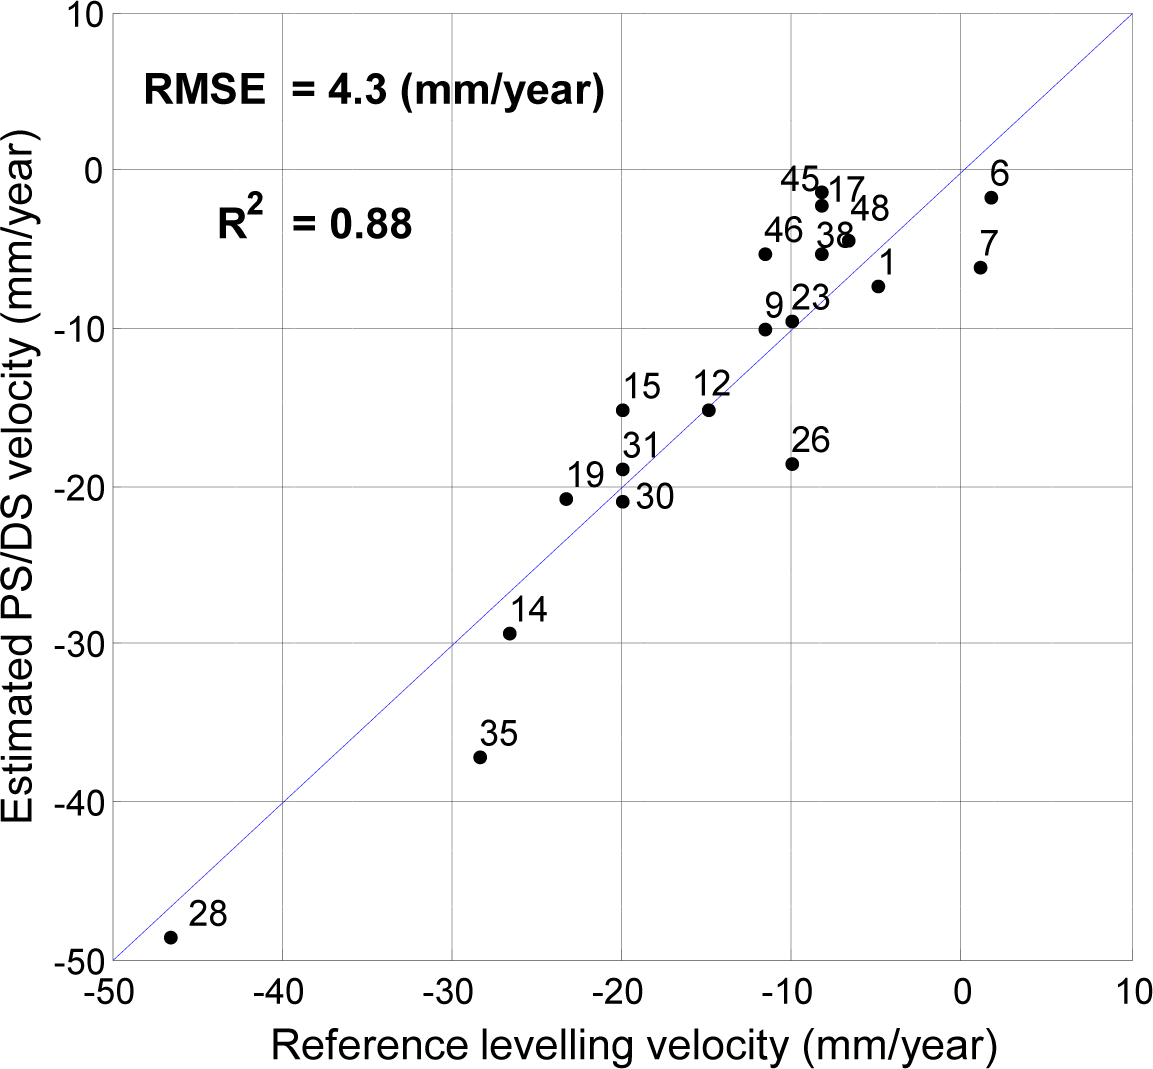
To compare velocity values obtained by the reference leveling and the estimated PS/DS result, a buffer of 200 m in diameter centered on each leveling route (see Figure 2a) will be associated with a cluster of PS/DS. This will not only reduce the effects of noise from PS/DS measurements, but also ensure the same subsidence pattern. All of the PS/DS inside this cluster were used to calculate the average velocity of the cluster. The result is shown in Figure 7. The correlation is R2 = 0.88, and the RMSE is 4.3 (mm/year), confirming their good agreement. This is expected as compared with the previous works [28,34,35]. Hence, the PS/DS processing is effective at detecting and estimating the subsidence phenomena.
4.2. Discussions
Land subsidence can be caused by a variety of processes, but based on those discussed in Section 4.1, we deem there are two drivers for the subsidence phenomena that need be highlighted, namely:
Natural processes, in which the geological signature has an important role.
Mixed processes, for which, due to urbanization, the subsidence problem becomes worse.
The aim of this section is to provide an interpretation of the results highlighted above.
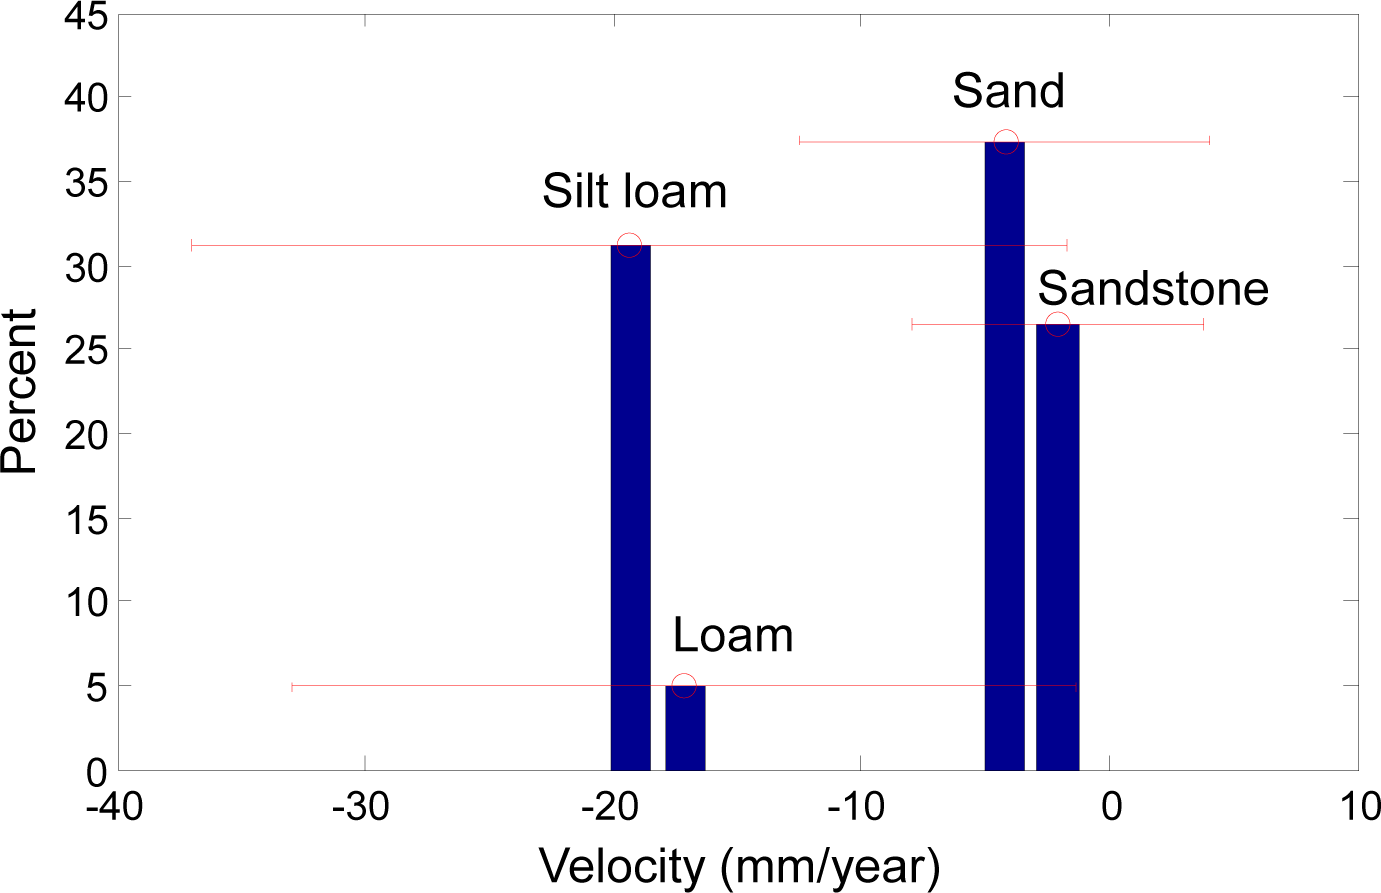
To reveal the rates of subsidence and the relation to the geology, all of the PS/DS inside each geological class were extracted and used to calculate their statistics values. In order to capture their distribution, the format for reporting in this paper is the mean and the standard deviation. It is important to note that in this form, the standard deviation number provides a concept of the distribution, rather than a metric of the accuracy of the measurement.
In Figure 8, the subsidence rate results may be observed from the contributions of all geological classes. The subsidence of soft soils, namely loam and silt loam, is important. The mechanism of loam and silt loam geological classes is quite similar. However, relevant subsidence from the sandstone and sand geological classes was also observed.
We recall that in the areas where land subsidence happened, geological silt loam is the main geological factor. Therefore, we mainly consider the urbanization and geological silt loam areas in the following. The result is shown in Table 2.
We can observe the dual relation between urbanization and groundwater withdrawal, in that the faster the urban growth, the faster the groundwater table lowering. The velocity of groundwater of −1 m/year has an important contribution to the subsidence process. Coupled with urban growth, the subsidence problem simply becomes worse.
4.3. Implications of Ground Subsidence
The aim of this section is to provide a discussion of the implication of ground subsidence for flooding.
To reveal the land displacement rates in detail, we calculated the average value for each district and report it in Table 3. A new topographic elevation map in 2010, where measured subsidence was removed from the elevation value in 2003, is presented in Figure 9. The average displacement value for each district for the period 2006 to 2010 was also reported. In 2010, after nearly four years, most of the region located in the unstable areas, where the geological loam and silt loam deposits are dominant, had sunk by up to −5 cm (Districts 7, 8, Binh Thanh and Nha Be). On the contrary, the most stable area is District 1 (−0.4 ± 0.9 cm), where the geological deposits are mostly sandstone and sand. With this in mind, we discuss the following implications of the land displacement for the flooding.
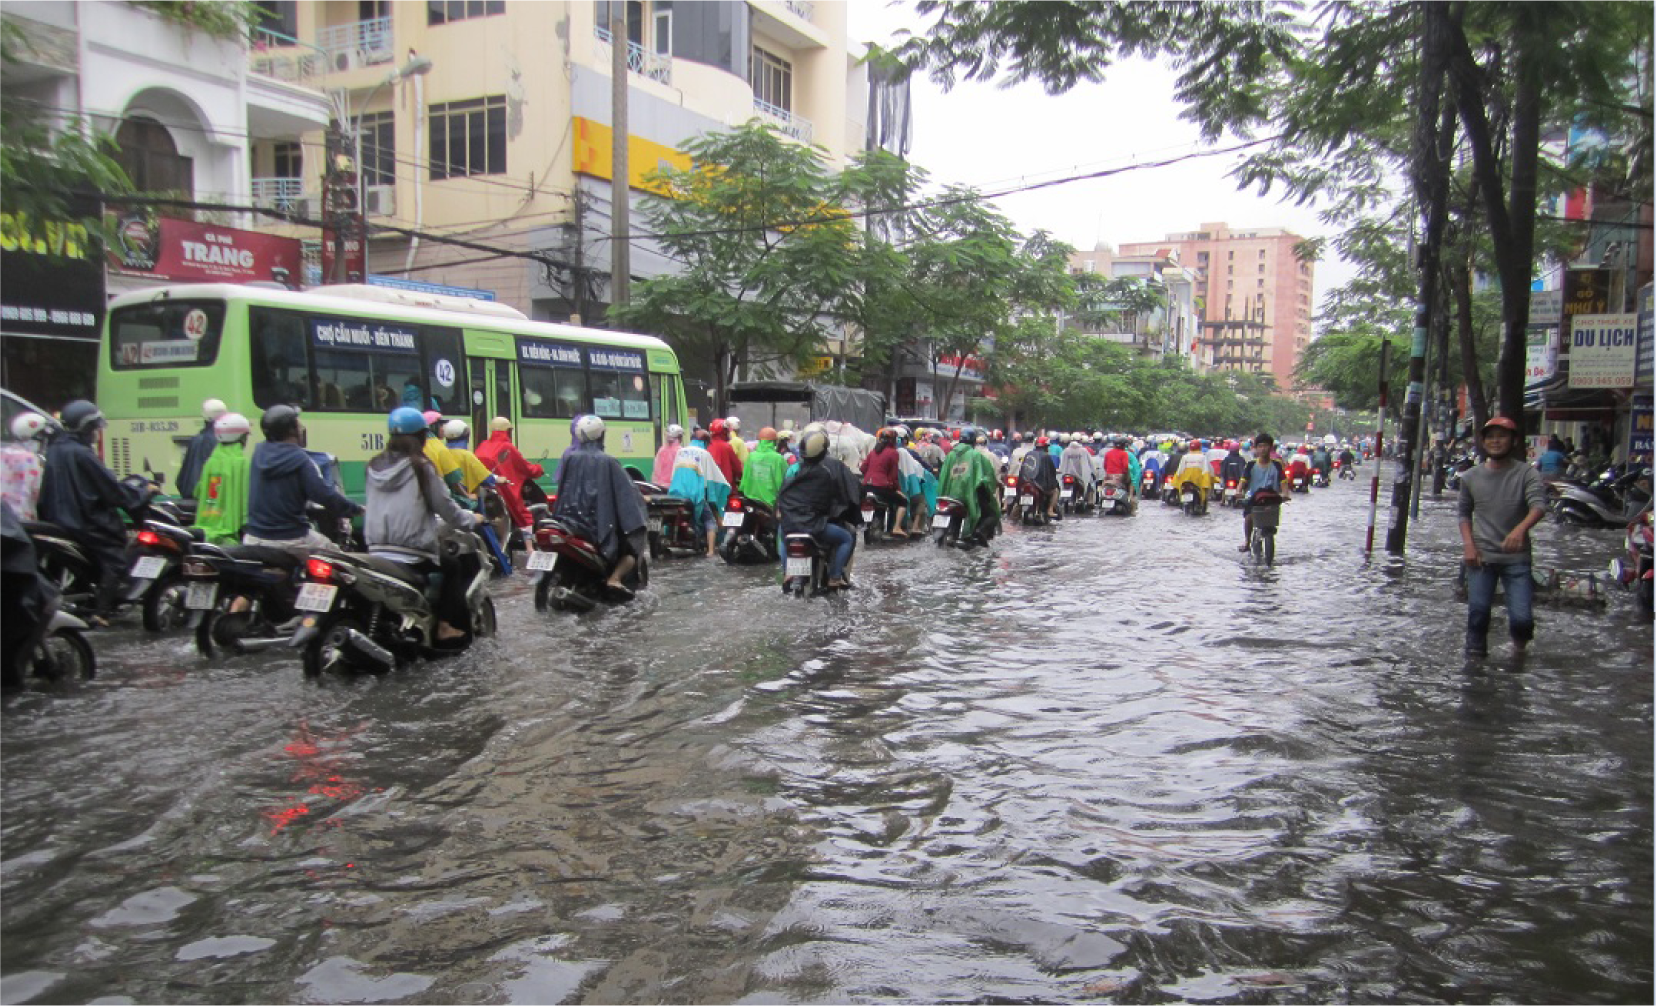
Ho Chi Minh City is located in a tropical delta area, with a rising sea level, and on the banks of the Sai Gon River. Furthermore, the water levels in the rivers surrounding and crossing HCMC are quite high. The average elevation of the deepest water level of the Sai Gon River from 2008 to 2011, recorded monthly at Phu An station (see Figure 5) is 1.38 ± 0.12 m with the maximum value of 1.59 m (in December 2011) [19]. The water surface elevation of the rest is certainly different and dependent on the nature of the landscape and channel dimensions. Such elevation can be estimated by using hydraulic modeling (e.g., [36]), but this is beyond the scope of this paper. In fact, we can observe that many low-elevation regions in HCMC (see Table 3 and Figure 9) are well below the water surface elevation of 1.38 m and, hence, could be inundated. One example is reported in Figure 10, where flooding and water nuisance directly impact on the city residents. This shows one of the worst flooding events recorded in 2013, at the location that is close to the leveling ID 35 shown in Figure 2a. This was on 7 November 2013, when the water surface elevation at Phu An station was up to 1.62 m, resulting in many places around HCMC being completely inundated [37].
In the context of global climate change, ocean thermal expansion and glacier melting are the dominant contributors to the global mean sea level rise [38]. Such a rise considerably influences human populations in coastal and island regions [39]. From 1993 to 2009, the mean rate of sea-level amounted to 3.3 ± 0.4 mm/year [40]. As a result, the river water level in HCMC is foreseen to accelerate (e.g., [3]), due to sea water flowing (from the estuary mouth in the south of the Sai Gon River) into the river system.
In the context of the local land subsidence, the urban development and land subsidence are interlinked and interact negatively; see Section 4.2. The average land surface has sunk from 2006 to 2010 at −8.0 mm/year. Hence, the ground surface is sinking faster than the sea level is rising. These are obviously the dominant contributors to increasing the risk of flooding, but the local land subsidence plays a more significant role than the rise in sea level. Although the impacts of sea level rise are potentially large (e.g., [40,41]), future works should take the subsidence factor into account to reduce the uncertainty of the results (the velocity map and displacement history are freely available for download).
5. Conclusions
This work has presented an analysis of the ground subsidence phenomena in Ho Chi Minh City. The advanced multi-temporal InSAR technique, which jointly manages the estimation of both PS and DS targets, is applied to this site using 18 ALOS images acquired from 2006 to 2010. The average subsidence velocity map has been retrieved by the PS/DS processing, and the validation indicates good agreement with leveling data. This allows us to provide an unprecedented spatial extent and continuous temporal coverage of the subsidence of HCMC. The study shows that subsidence is most severe in the Holocene silt loam areas along the Sai Gon River and in the southwest of the city. The urbanization and urban growth, which have resulted in more groundwater extraction, are mainly responsible for the subsidence in HCMC. Subsidence in turn leads to flooding and water nuisance.
The correlation between the reference leveling velocity and the estimated PS/DS result is R2 = 0.88, and the RMSE is 4.3 (mm/year), confirming their good agreement. From 2006 to 2010, the estimation of the average subsidence rate is −8.0 mm/year with the maximum value up to −70 mm/year, potentially suffering damages in the midterm. After four years, in regions along Sai Gon River and in the southwest of the city, the land had sunk up to −12 cm. If not addressed, subsidence leads to an increase of inundation, both in frequency and spatial extent.
Regarding climate change, HCMC will be confronted with flooding more often as a result of sea level rise, with the mean rate up to 3.3 ± 0.4 mm/year. However, subsidence will be appreciably greater locally. It is essential to consider these two factors, because the city is inhabited by more than 7.5 million people where subsidence directly impacts on urban structures and infrastructure. Further works should be carried out by applying the PS/DS technique using new coming SAR data, e.g., ALOS PALSAR 2 and Sentinel-1, to continuously monitor the ground subsidence phenomena.
Acknowledgments
This work was supported in part by European Space Agency (ESA), Centre National d’Etudes Spatiales/Terre Ocean Surfaces Continentales, Atmosphere (CNES/TOSCA) and IRSTEA, UMR TETIS. ALOS PALSAR images were provided by the Japan Aerospace Exploration Agency under the framework of Kyoto and Carbon Phase 3, and in particular thank to Masanobu Shimada. The authors would like to thank the entire Geomatics Center team at International Technology Park, HCMC National University, and particularly, Msc. Vuong Quoc Viet for providing ground data. We thank Alan Murray for English corrections. We gratefully acknowledge Ngo Yen Nhi for discussions on HCMC water nuisance and for allowing us to use the photograph in figure 10. We are grateful to Tran Thi Thu Luong for discussions on the urbanization of HCMC. Finally, we would like to thank Fabio Rocca for clarifying and motivating the discussion on the topic.
Author Contributions
Dinh Ho Tong Minh and Le Van Trung developed the main idea that led to this paper. Dinh Ho Tong Minh developed the Irstea TomoSAR toolkit (in C and MATLAB), which offers SAR, InSAR and Tomography processing. Dinh Ho Tong Minh provided InSAR processing and its description. Thuy Le Toan contributed to the discussion. All authors read and approved the final manuscript.
Conflicts of Interest
The authors declare no conflict of interest.
Appendix
The time series groundwater table of two example stations is shown in Figure A1.

The location of leveling measurements is provided in Table A1 and Figure A2.

| District | Leveling ID | Latitude (degree) | Longitude (degree) | Velocity (mm/year) 2003 to 2009 |
|---|---|---|---|---|
| Binh Thanh | 9 | 10.797 | 106.699 | −12 |
| 35 | 10.809 | 106.714 | −28 | |
| 1 | 46 | 10.760 | 106.694 | −12 |
| 48 | 10.768 | 106.698 | −7 | |
| 4 | 19 | 10.754 | 106.717 | −23 |
| 23 | 10.763 | 106.700 | −10 | |
| 26 | 10.753 | 106.714 | −10 | |
| 5 | 17 | 10.750 | 106.673 | −8 |
| 45 | 10.751 | 106.667 | −8 | |
| 6 | 1 | 10.744 | 106.639 | −5 |
| 6 | 10.746 | 106.649 | 2 | |
| 7 | 10.743 | 106.643 | 1 | |
| 12 | 10.744 | 106.630 | −15 | |
| 14 | 10.740 | 106.626 | −27 | |
| 15 | 10.739 | 106.637 | −20 | |
| 7 | 30 | 10.730 | 106.715 | −19 |
| 31 | 10.740 | 106.704 | −20 | |
| 8 | 28 | 10.714 | 106.628 | −47 |
| 38 | 10.746 | 106.678 | −8 | |
The detailed information of the ALOS PALSAR L band data descending stack is reported in Table A2.
| ID | Sensor | Date | Baseline (m) |
|---|---|---|---|
| 1 | PALSAR | 06 December 2006 | 1211 |
| 2 | PALSAR | 21 January 2007 | −1105 |
| 3 | PALSAR | 08 June 2007 | 512 |
| 4 | PALSAR | 08 September 2007 | 909 |
| 5 | PALSAR | 09 December 2007 | 959 |
| 6 | PALSAR | 24 January 2008 | 1032 |
| 7 | PALSAR | 10 March 2008 | 1202 |
| 8 | PALSAR | 25 April 2008 | 1823 |
| 9 | PALSAR | 10 June 2008 | 1706 |
| 10 (M) | PALSAR | 11 December 2008 | 0 |
| 11 | PALSAR | 26 January 2009 | −85 |
| 12 | PALSAR | 13 June 2009 | 154 |
| 13 | PALSAR | 29 July 2009 | −312 |
| 14 | PALSAR | 14 December 2009 | 541 |
| 15 | PALSAR | 9 January 2010 | 914 |
| 16 | PALSAR | 16 June 2010 | 909 |
| 17 | PALSAR | 16 September 2010 | 876 |
| 18 | PALSAR | 01 November 2010 | 962 |
References
- Mason, D.; Speck, R.; Devereux, B.; Schumann, G.J.P.; Neal, J.; Bates, P. Flood Detection in Urban Areas Using TerraSAR-X. IEEE Trans. Geosci. Remote Sens. 2010, 48, 882–894. [Google Scholar]
- Ziegler, A.D.; She, L.H.; Tantasarin, C.; Jachowski, N.R.; Wasson, R. Floods, false hope, and the future. Hydrol. Process. 2012, 26, 1748–1750. [Google Scholar]
- Ho, L. Phi Impacts of Climate Changes and Urbanisation on Urban Inundation in Ho Chi Minh City, Proceedings of the 11th International Conference on Urban Drainage, Edinburgh, UK, 31 August–5 September 2008; pp. 1–7.
- Moens, E.; Phuoc, N.V. Ho Chi Minh City Moving towards the Sea with Climate Change Adaptation; Ho Chi Minh City Climate Adaptation Strategy Project, 2013; Volume 1, p. 126. [Google Scholar]
- Stern, N. The Stern Review on the Economics of Climate Change; Cambridge University Press: Cambridge, UK and New York, NY, USA, 2008; p. 662. [Google Scholar]
- Nicholls, R.J.; Hanson, S.; Herweijer, C.; Patmore, N.; Hallegatte, S.; Corfee-Morlot, J.; Chateau, J.; Muir-Wood, R. Ranking Port Cities with High Exposure and Vulnerability to Climate Extremes: Exposure Estimates; OCD Environment Working Papers No. 1; OECD Publishing: Paris, France, 2008; p. 63. [Google Scholar]
- Trung, Le V.; Ho Tong Minh, D. Measuring Ground Subsidence in Ho Chi Minh City using Differential InSAR Techniques. J. Sci. Technol. Vietnam Natl. Univ. Ho Chi Minh City 2008, 11, 121–130. [Google Scholar]
- Tomas, R.; Marquez, Y.; Lopez-Sanchez, J.M.; Delgado, J.; Blanco, P.; Mallorqui, J.J.; Martinez, M.; Herrera, G.; Mulas, J. Mapping ground subsidence induced by aquifer overexploitation using advanced Differential SAR Interferometry: Vega Media of the Segura River (SE Spain) case study. Remote Sens. Environ. 2005, 98, 269–283. [Google Scholar]
- Chaussard, E.; Amelung, F.; Abidin, H.; Hong, S.H. Sinking cities in Indonesia: ALOS PALSAR detects rapid subsidence due to groundwater and gas extraction. Remote Sens. Environ. 2013, 128, 150–161. [Google Scholar]
- Trung, Le V.; Nga, Nguyen V. Subsidence Monitoring in Ho Chi Minh City by Differential InSAR; Ho Chi Minh City Natural Resources and Environment Department (NRED) Project Code 7918/HD-TNMT-QLTN; Ho Chi Minh City Natural Resources and Environment Department: Ho Chi Minh City, Vietnam, 2010; Volume 1. [Google Scholar]
- Ferretti, A.; Prati, C.; Rocca, F. Permanent scatterers in SAR interferometry. IEEE Trans. Geosci. Remote Sens. 2001, 39, 8–20. [Google Scholar]
- Hooper, A.; Zebker, H.; Segall, P.; Kampes, B. A new method for measuring deformation on volcanoes and other non-urban areas using InSAR persistent scatterers. Geophys. Res. Lett. 2004, 31. [Google Scholar] [CrossRef]
- Ferretti, A.; Fumagalli, A.; Novali, F.; Prati, C.; Rocca, F.; Rucci, A. A new algorithm for processing interferometric data-stacks: SqueeSAR. IEEE Trans. Geosci. Remote Sens. 2011, 49, 3460–3470. [Google Scholar]
- Przylucka, M.; Herrera, G.; Graniczny, M.; Colombo, D.; Bejar-Pizarro, M. Combination of conventional and advanced DInSAR to monitor very fast mining subsidence with TerraSAR-X Data: Bytom City (Poland). Remote Sens. 2015, 7, 5300–5328. [Google Scholar]
- Fialko, Y. Interseismic strain accumulation and the earthquake potential on the southern San Andreas fault system. Nature 2006, 441, 968–971. [Google Scholar]
- Hilley, G.E.; Burgmann, R.; Ferretti, A.; Novali, F.; Rocca, F. Dynamics of slow-moving landslides from permanent scatterer Analysis. Science 2004, 304, 1952–1955. [Google Scholar]
- Hansen, M.C.; Potapov, P.V.; Moore, R.; Hancher, M.; Turubanova, S.A.; Tyukavina, A.; Thau, D.; Stehman, S.V.; Goetz, S.J.; Loveland, T.R. High-resolution global maps of 21st-century forest cover change. Science 2013, 342, 850–853. [Google Scholar]
- Tran, T.T.L. Managing and Using Urban Area in Ho Chi Minh City; Ho Chi Minh City National University Press: Ho Chi Minh City, Vietnam, 2008; p. 301, In Vietnamese. [Google Scholar]
- GSO HCMC. Statistical Yearbook of Ho Chi Minh City 2011; General Statistical Office of Ho Chi Minh City Press: Ho Chi Minh City, Vietnam, 2011. [Google Scholar]
- Bhavikatti, S.S.. Surveying and Leveling; I. K. International Publishing House Press: New Delhi, India, 2008; p. 404. [Google Scholar]
- Shimada, M.; Isoguchi, O.; Tadono, T.; Isono, K. PALSAR radiometric and geometric calibration. IEEE Trans. Geosci. Remote Sens. 2009, 47, 3915–3932. [Google Scholar]
- Hanssen, R.F. Radar Interferometry: Data Interpretation and Error Analysis; Springer Netherlands: Delft, The Netherlands, 2001. [Google Scholar]
- Ferretti, A.; Prati, C.; Rocca, F. Nonlinear subsidence rate estimation using permanent scatterers in differential SAR interferometry. IEEE Trans. Geosci. Remote Sens. 2000, 38, 2202–2212. [Google Scholar]
- Werner, C.; Wegmuller, U.; Strozzi, T.; Wiesmann, A. Interferometric point target analysis for deformation mapping, Proceedings of the International Geoscience and Remote Sensing Symposium, Toulouse, France, 21–25 July 2003.
- Berardino, P.; Fornaro, G.; Lanari, R.; Sansosti, E. A new algorithm for surface deformation monitoring based on small baseline differential SAR interferograms. IEEE Trans. Geosci. Remote Sens. 2002, 40, 2375–2383. [Google Scholar]
- Hooper, A. A multi-temporal InSAR method incorporating both persistent scatterer and small baseline approaches. Geophys. Res. Lett. 2008, 35, 1–5. [Google Scholar]
- Ferretti, A.; Novali, F.; Zan, F.D.; Prati, C.; Rocca, F. Moving from PS to slowly decorrelating targets: A prospective view, Proceedings of the 2008 7th European Conference on Synthetic Aperture Radar (EUSAR), Friedrichshafen, Germany, 2–5 June 2008.
- Rocca, F. Modeling interferogram stacks. IEEE Trans. Geosci. Remote Sens. 2007, 45, 3289–3299. [Google Scholar]
- Tebaldini, S.; Monti Guarnieri, A. On the role of phase stability in SAR multibaseline applications. IEEE Trans. Geosci. Remote Sens. 2010, 48, 2953–2966. [Google Scholar]
- Guarnieri, A.M.; Tebaldini, S. On the exploitation of target statistics for SAR interferometry Applications. IEEE Trans. Geosci. Remote Sens. 2008, 46, 3436–3443. [Google Scholar]
- Ho Tong Minh, D.; Le Toan, T.; Rocca, F.; Tebaldini, S.; Mariotti d’Alessandro, M.; Villard, L. Relating P-band synthetic aperture radar tomography to tropical forest biomass. IEEE Trans. Geosci. Remote Sens. 2014, 52, 967–979. [Google Scholar]
- Ho Minh Tong, D.; Tebaldini, S.; Rocca, F.; Le Toan, T. The impact of temporal decorrelation on BIOMASS tomography of tropical forests. IEEE Geosci. Remote Sens. Lett. 2015, 12, 1297–1301. [Google Scholar]
- Lepvrier, C.; Vuong, N.V.; Maluski, H.; Thi, P.T.; Vu, T.V. Indosinian tectonics in Vietnam. Compt. Rendus Geosci. 2008, 340, 94–111. [Google Scholar]
- Raucoules, D.; Bourgine, B.; de Michele, M.; Cozannet, G.L.; Closset, L.; Bremmer, C.; Veldkamp, H.; Tragheim, D.; Bateson, L.; Crosetto, M.; Agudo, M.; Engdahl, M. Validation and intercomparison of Persistent Scatterers Interferometry: PSIC4 project results. J. Appl. Geophys. 2009, 68, 335–347. [Google Scholar]
- Lan, H.; Gao, X.; Liu, H.; Yang, Z.; Li, L. Integration of TerraSAR-X and PALSAR PSI for detecting ground deformation. Int. J. Remote Sens. 2013, 34, 5393–5408. [Google Scholar]
- Chowdhury, S.; Kjelds, J. Simulation of coastal flooding with MIKE 11 and HEC-UNET. In Solutions to Coastal Disasters ’02; American Society of Civil Engineers Press: San Diego, CA, USA, 2002; Chapter 18; pp. 205–214. [Google Scholar]
- Tuoi Tre. Land Subsidence to Blame for Flooding in Saigon; Tuoitrenews Press: Ho Chi Minh City, Vietnam, 2013; p. 1. [Google Scholar]
- Church, J.A.; Clark, P.U.; Cazenave, A.; Gregory, J.M.; Jevrejeva, S.; Levermann, A.; Merrifield, M.A.; Milne, G.A.; Nerem, R.S.; Nunn, P.D.; et al. Sea level change. In Climate Change 2013: The Physical Science Basis; Cambridge University Press: Cambridge, UK and New York, NY, USA, 2013; pp. 1137–1216. [Google Scholar]
- Bindoff, N.; Willebrand, V.A.; Gregory, J.; Gulev, S.; Hanawa, K.; Quere, C.L.; Levitus, S.; Nojiri, Y.; Shum, C.; Talley, L.; et al. Observations: Ocean climate change and sea level. In Climate Change 2007: The Physical Science Basis. Contribution of Working Group I to the Fourth Assessment Report of the Intergovernmental Panel on Climate Change; Cambridge University Press: Cambridge, UK and New York, NY, USA, 2007; pp. 387–432. [Google Scholar]
- Nicholls, R.J.; Cazenave, A. Sea-level rise and its impact on coastal zones. Science 2010, 328, 1517–1520. [Google Scholar]
- Lasage, R.; Veldkamp, T.I.E.; de Moel, H.; van, T.C.; Phi, H.L.; Vellinga, P.; Aerts, J.C.J.H. Assessment of the effectiveness of participatory developed adaptation strategies for HCMC. Nat. Hazards Earth Syst. Sci. Discuss. 2014, 2, 385–425. [Google Scholar]


| Year | Building Area (1000 ha) | Population Total (1000 people) | Construction Product (Bill.VND) |
|---|---|---|---|
| 2000 | 11.2 | 5274.9 | 23,313 |
| 2005 | 15.3 | 6291.1 | 41,770 |
| 2009 | 21.2 | 7201.6 | 60,670 |
| 2011 | 24.0 | 7521.1 | 75,943 |
| Urban Growth (%) 1993 to 2008 | Vel. Water Table (m/year) 2000 to 2006
| Vel. Subsidence (mm/year) 2006 to 2010
| ||
|---|---|---|---|---|
| Mean | Standard Deviation | Mean | Standard Deviation | |
| <5 | −1.0 | 0.4 | −8.2 | 13.2 |
| 5 to 10 | −1.0 | 0.4 | −14.8 | 18.3 |
| 10 to 15 | −1.0 | 0.5 | −17.0 | 17.9 |
| 15 to 20 | −1.1 | 0.5 | −19.6 | 19.4 |
| 20 to 25 | −1.2 | 0.5 | −20.1 | 19.0 |
| 25 to 30 | −1.3 | 0.5 | −25.8 | 18.6 |
| >30 | −1.4 | 0.5 | −24.7 | 20.6 |
| District | Ground Elevation 2003 (m)
| Ground Displacement 2006 to 2010 (cm)
| ||
|---|---|---|---|---|
| Mean | Standard Deviation | Mean | Standard Deviation | |
| 1 | 3.7 | 1.9 | −0.4 | 0.9 |
| 2 | 1.7 | 0.8 | −2.0 | 2.3 |
| 3 | 4.4 | 1.5 | −0.6 | 1.4 |
| 4 | 1.5 | 0.1 | −3.5 | 2.0 |
| 5 | 2.6 | 0.7 | −0.4 | 0.7 |
| 6 | 1.6 | 0.1 | −3.4 | 2.2 |
| 7 | 1.5 | 0.2 | −5.3 | 2.7 |
| 8 | 1.4 | 0.2 | −3.8 | 2.8 |
| 9 | 6.2 | 7.1 | 0.1 | 1.9 |
| 10 | 3.9 | 0.3 | −0.4 | 0.7 |
| 11 | 3.0 | 0.8 | −0.9 | 1.3 |
| 12 | 3.3 | 2.6 | −2.3 | 2.2 |
| Go Vap | 6.3 | 2.9 | −1.7 | 1.2 |
| Phu Nhuan | 5.3 | 2.1 | −0.1 | 1.2 |
| Binh Thanh | 2.5 | 2.2 | −3.8 | 2.8 |
| Tan Binh | 5.5 | 1.6 | −1.2 | 1.6 |
| Binh Tan | 2.2 | 0.9 | −3.4 | 2.8 |
| Tan Phu | 3.9 | 0.9 | −1.6 | 0.8 |
| Thu Duc | 10.6 | 9.7 | −3.5 | 2.1 |
| Nha Be | 1.1 | 0.2 | −5.1 | 1.8 |
| Hooc Mon | 4.6 | 2.2 | −1.5 | 1.9 |
| Binh Chanh | 1.1 | 0.8 | −2.2 | 3.5 |
| Average | 3.4 | 2.2 | −2.2 | 1.7 |
© 2015 by the authors; licensee MDPI, Basel, Switzerland This article is an open access article distributed under the terms and conditions of the Creative Commons Attribution license (http://creativecommons.org/licenses/by/4.0/).
Share and Cite
Minh, D.H.T.; Van Trung, L.; Toan, T.L. Mapping Ground Subsidence Phenomena in Ho Chi Minh City through the Radar Interferometry Technique Using ALOS PALSAR Data. Remote Sens. 2015, 7, 8543-8562. https://doi.org/10.3390/rs70708543
Minh DHT, Van Trung L, Toan TL. Mapping Ground Subsidence Phenomena in Ho Chi Minh City through the Radar Interferometry Technique Using ALOS PALSAR Data. Remote Sensing. 2015; 7(7):8543-8562. https://doi.org/10.3390/rs70708543
Chicago/Turabian StyleMinh, Dinh Ho Tong, Le Van Trung, and Thuy Le Toan. 2015. "Mapping Ground Subsidence Phenomena in Ho Chi Minh City through the Radar Interferometry Technique Using ALOS PALSAR Data" Remote Sensing 7, no. 7: 8543-8562. https://doi.org/10.3390/rs70708543