1. Introduction
Groundwater is an essential natural and national resource because it provides drinking water for urban and rural communities, supports irrigation and industry, sustains the flow of streams and rivers, and maintains riparian and wetland ecosystems. Land subsidence is the settling or sinking of the surface of the earth caused by downward movement of subsurface earth materials. Land subsidence is typically caused by human activities. It has become a global problem and is primarily caused by the removal of groundwater [
1,
2,
3,
4]. Subsidence can cause numerous problems, including changes in elevation that damage structures such as storm drains, sanitary sewers, roads, railroads, levees, bridges, and public and private buildings. Furthermore, subsidence increases the potential for flooding [
5]. The need to monitor and mitigate land subsidence is clearly urgent [
6,
7,
8,
9].
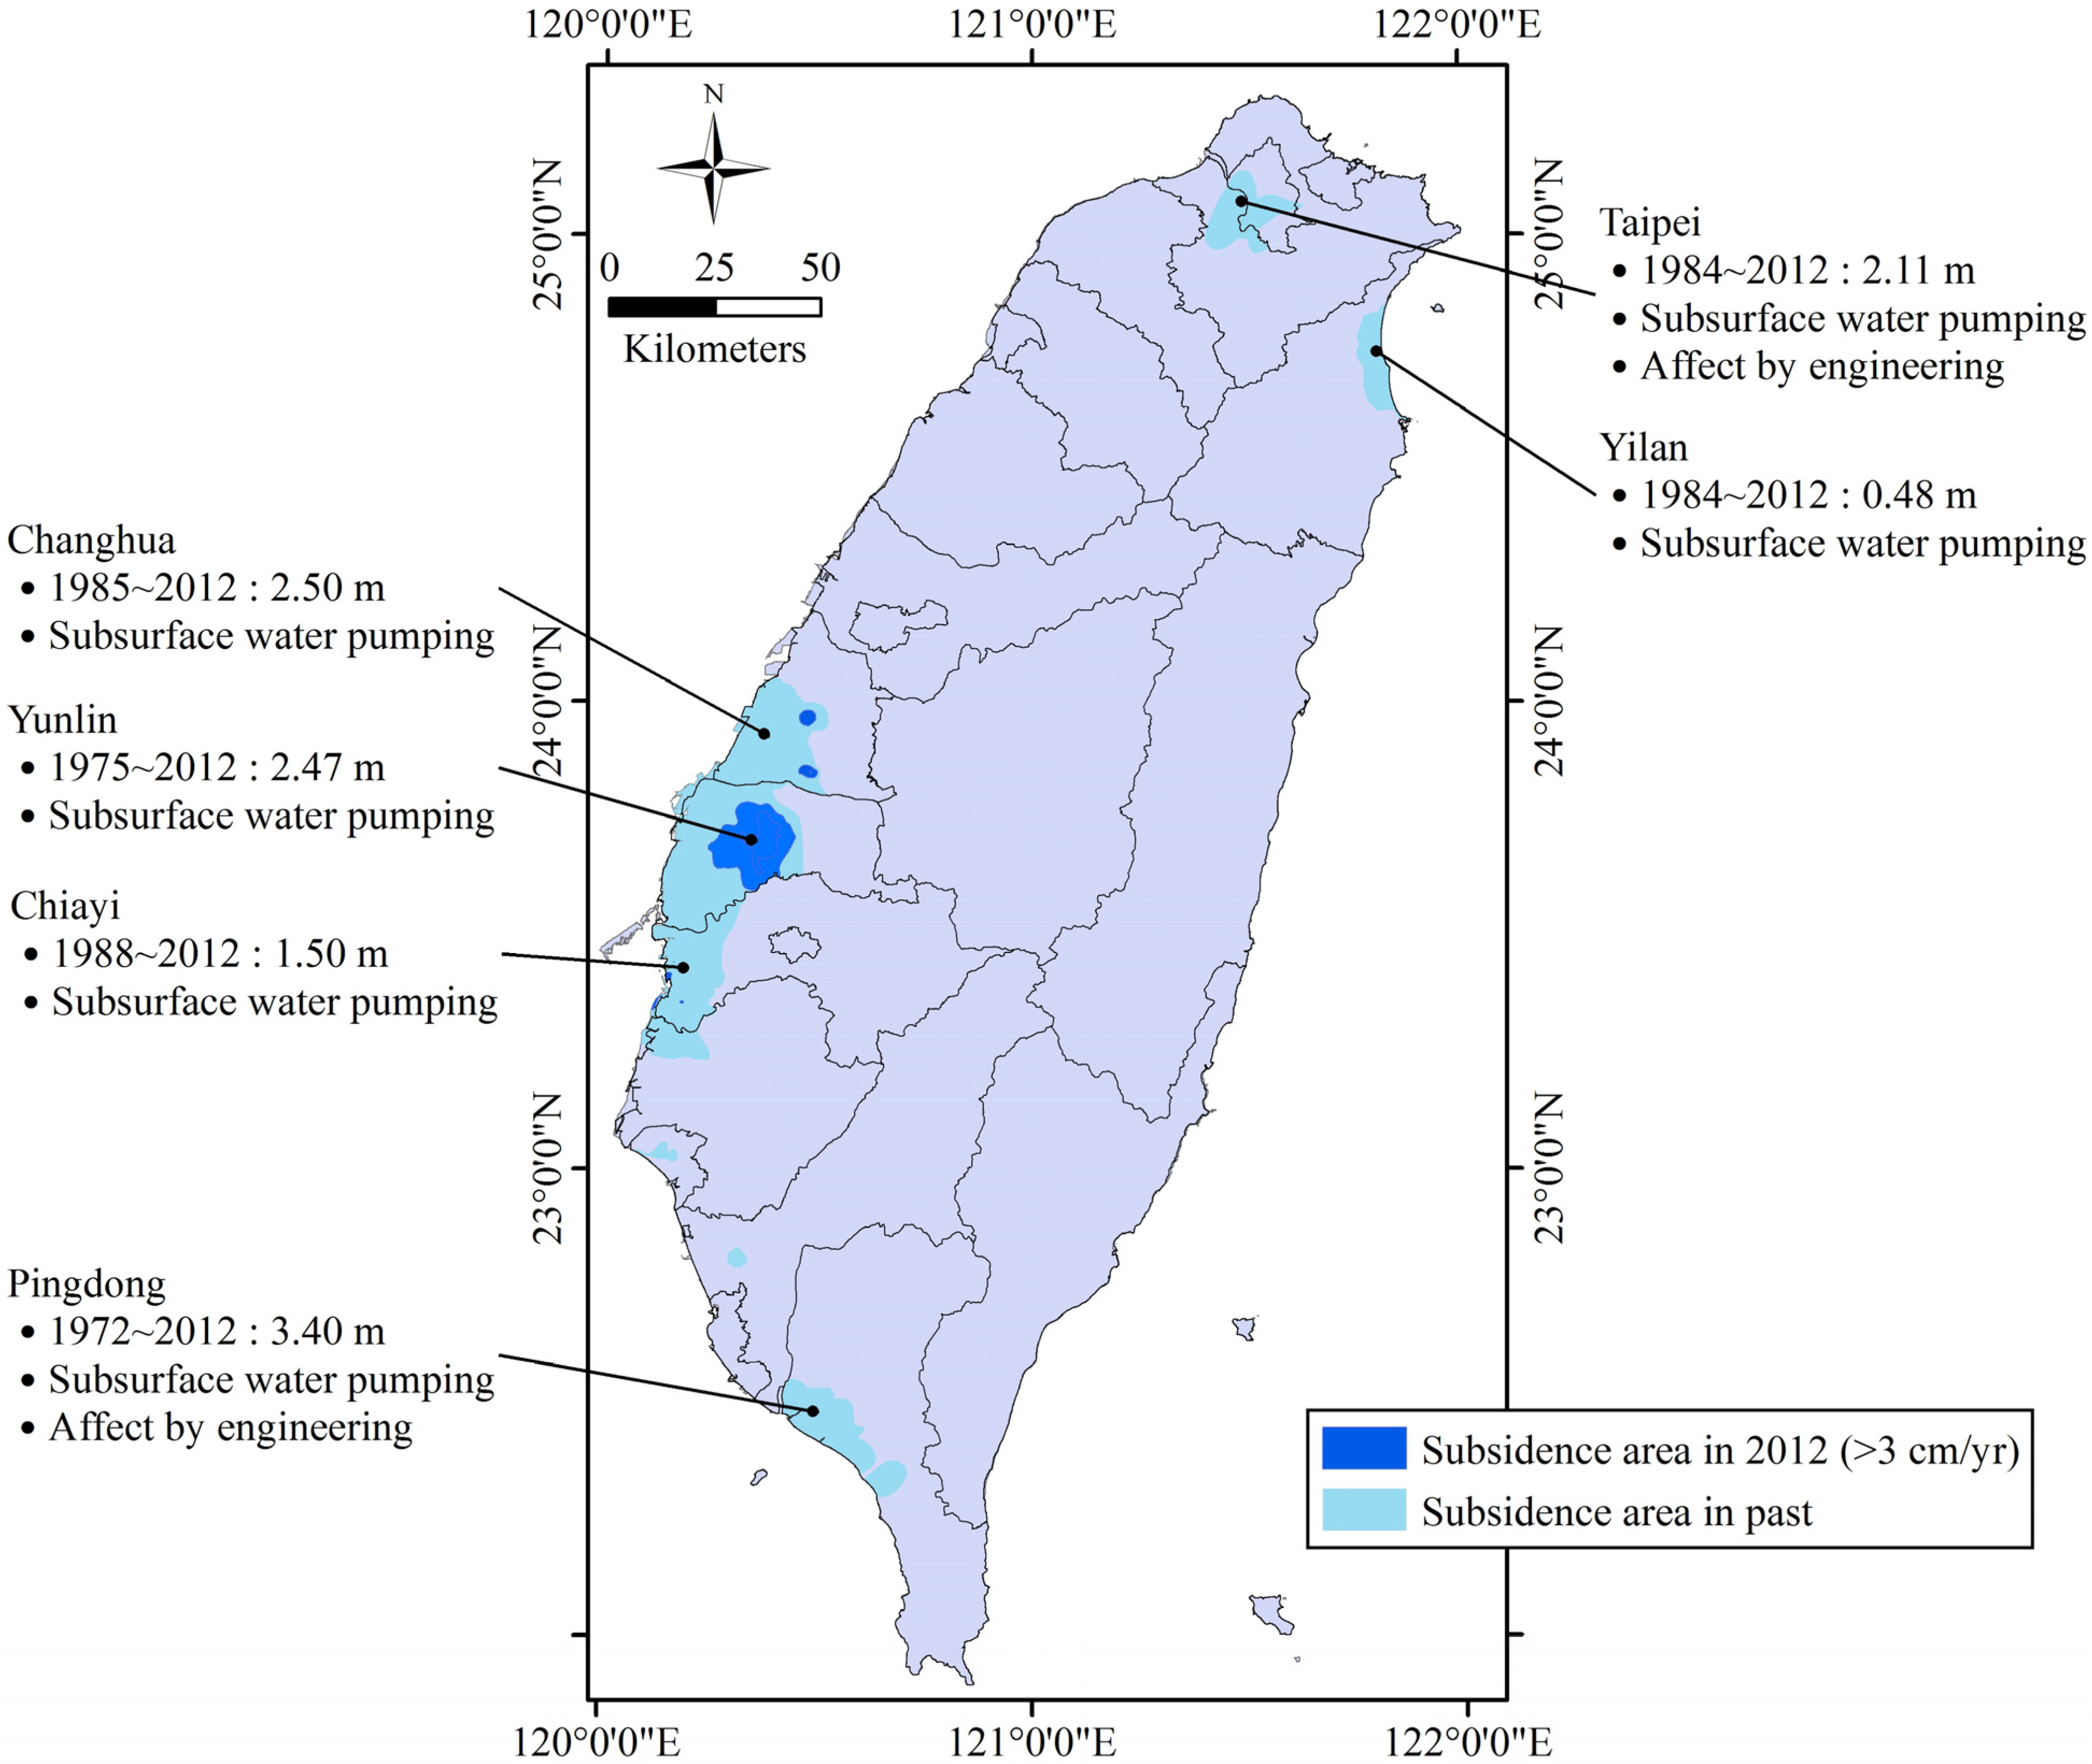
Land subsidence occurs in municipalities and counties throughout Taiwan, including Taipei and Yilan in the north, and Changhua, Yunlin, Chiayi, and Pingdong in Central and Southern Taiwan [
10,
11] as shown in
Figure 1. Maximal subsidence ranges from 1.2 m to 3.2 m, affecting an area of 2000 km
2. The most severely affected areas are located in Yunlin County. Their effects include dike failures, seawater encroachment in coastal aquifers, coastal inundation, and salinity intrusion. Recent national construction projects, such as a high-speed railway, expressways, urban rapid transportation systems, and science-based industrial parks have been adversely influenced by land subsidence, jeopardizing public safety.
In light of the negative impacts of land subsidence on the environment, Taiwan’s government has constantly supported mass projects in recent two decades or so to monitor land subsidence and to understand its causes and the factors that influence it, which are then considered in order to initiate and enforce policy to prevent further land subsidence and, if possible, even attempt subsidence recovery. Among the many project results, Hung
et al. [
6] used multiple equipment to monitor land subsidence, including leveling, multi-level compaction monitoring wells, continuous GPS, and differential radar interferometry. They gave a general description of land subsidence monitoring sensors, including leveling, with a primary focus on quantifying subsidence and conducting an inter-comparison analysis on the measurements.
Figure 1.
Distribution of land subsidence in Taiwan from 1972 to 2012 (adapted from the Water Resources Agency, Ministry of Economic Affairs, Taiwan).
Figure 1.
Distribution of land subsidence in Taiwan from 1972 to 2012 (adapted from the Water Resources Agency, Ministry of Economic Affairs, Taiwan).
In this study, it is our intention to improve understanding of the relevant land subsidence issues beyond Hung
et al. [
6] in two respects. First, we update the status of the land subsidence monitoring campaigns in the study region until the end of 2013 by using a comprehensive monitoring system that consists of various sensing equipment and techniques, including traditional leveling surveys, continuous GPS stations, monitoring wells, and PS-InSAR, according to the guidelines of groundwater conservation management and land subsidence mitigation plans. Secondly and most importantly, the possible main factors affecting land subsidence and its distribution are revealed. This is very crucial information to assist the government in setting up rules to take precautions and tackle the resulting environmental problems, in order to bring the greatest benefit to the people.
2. Study Area
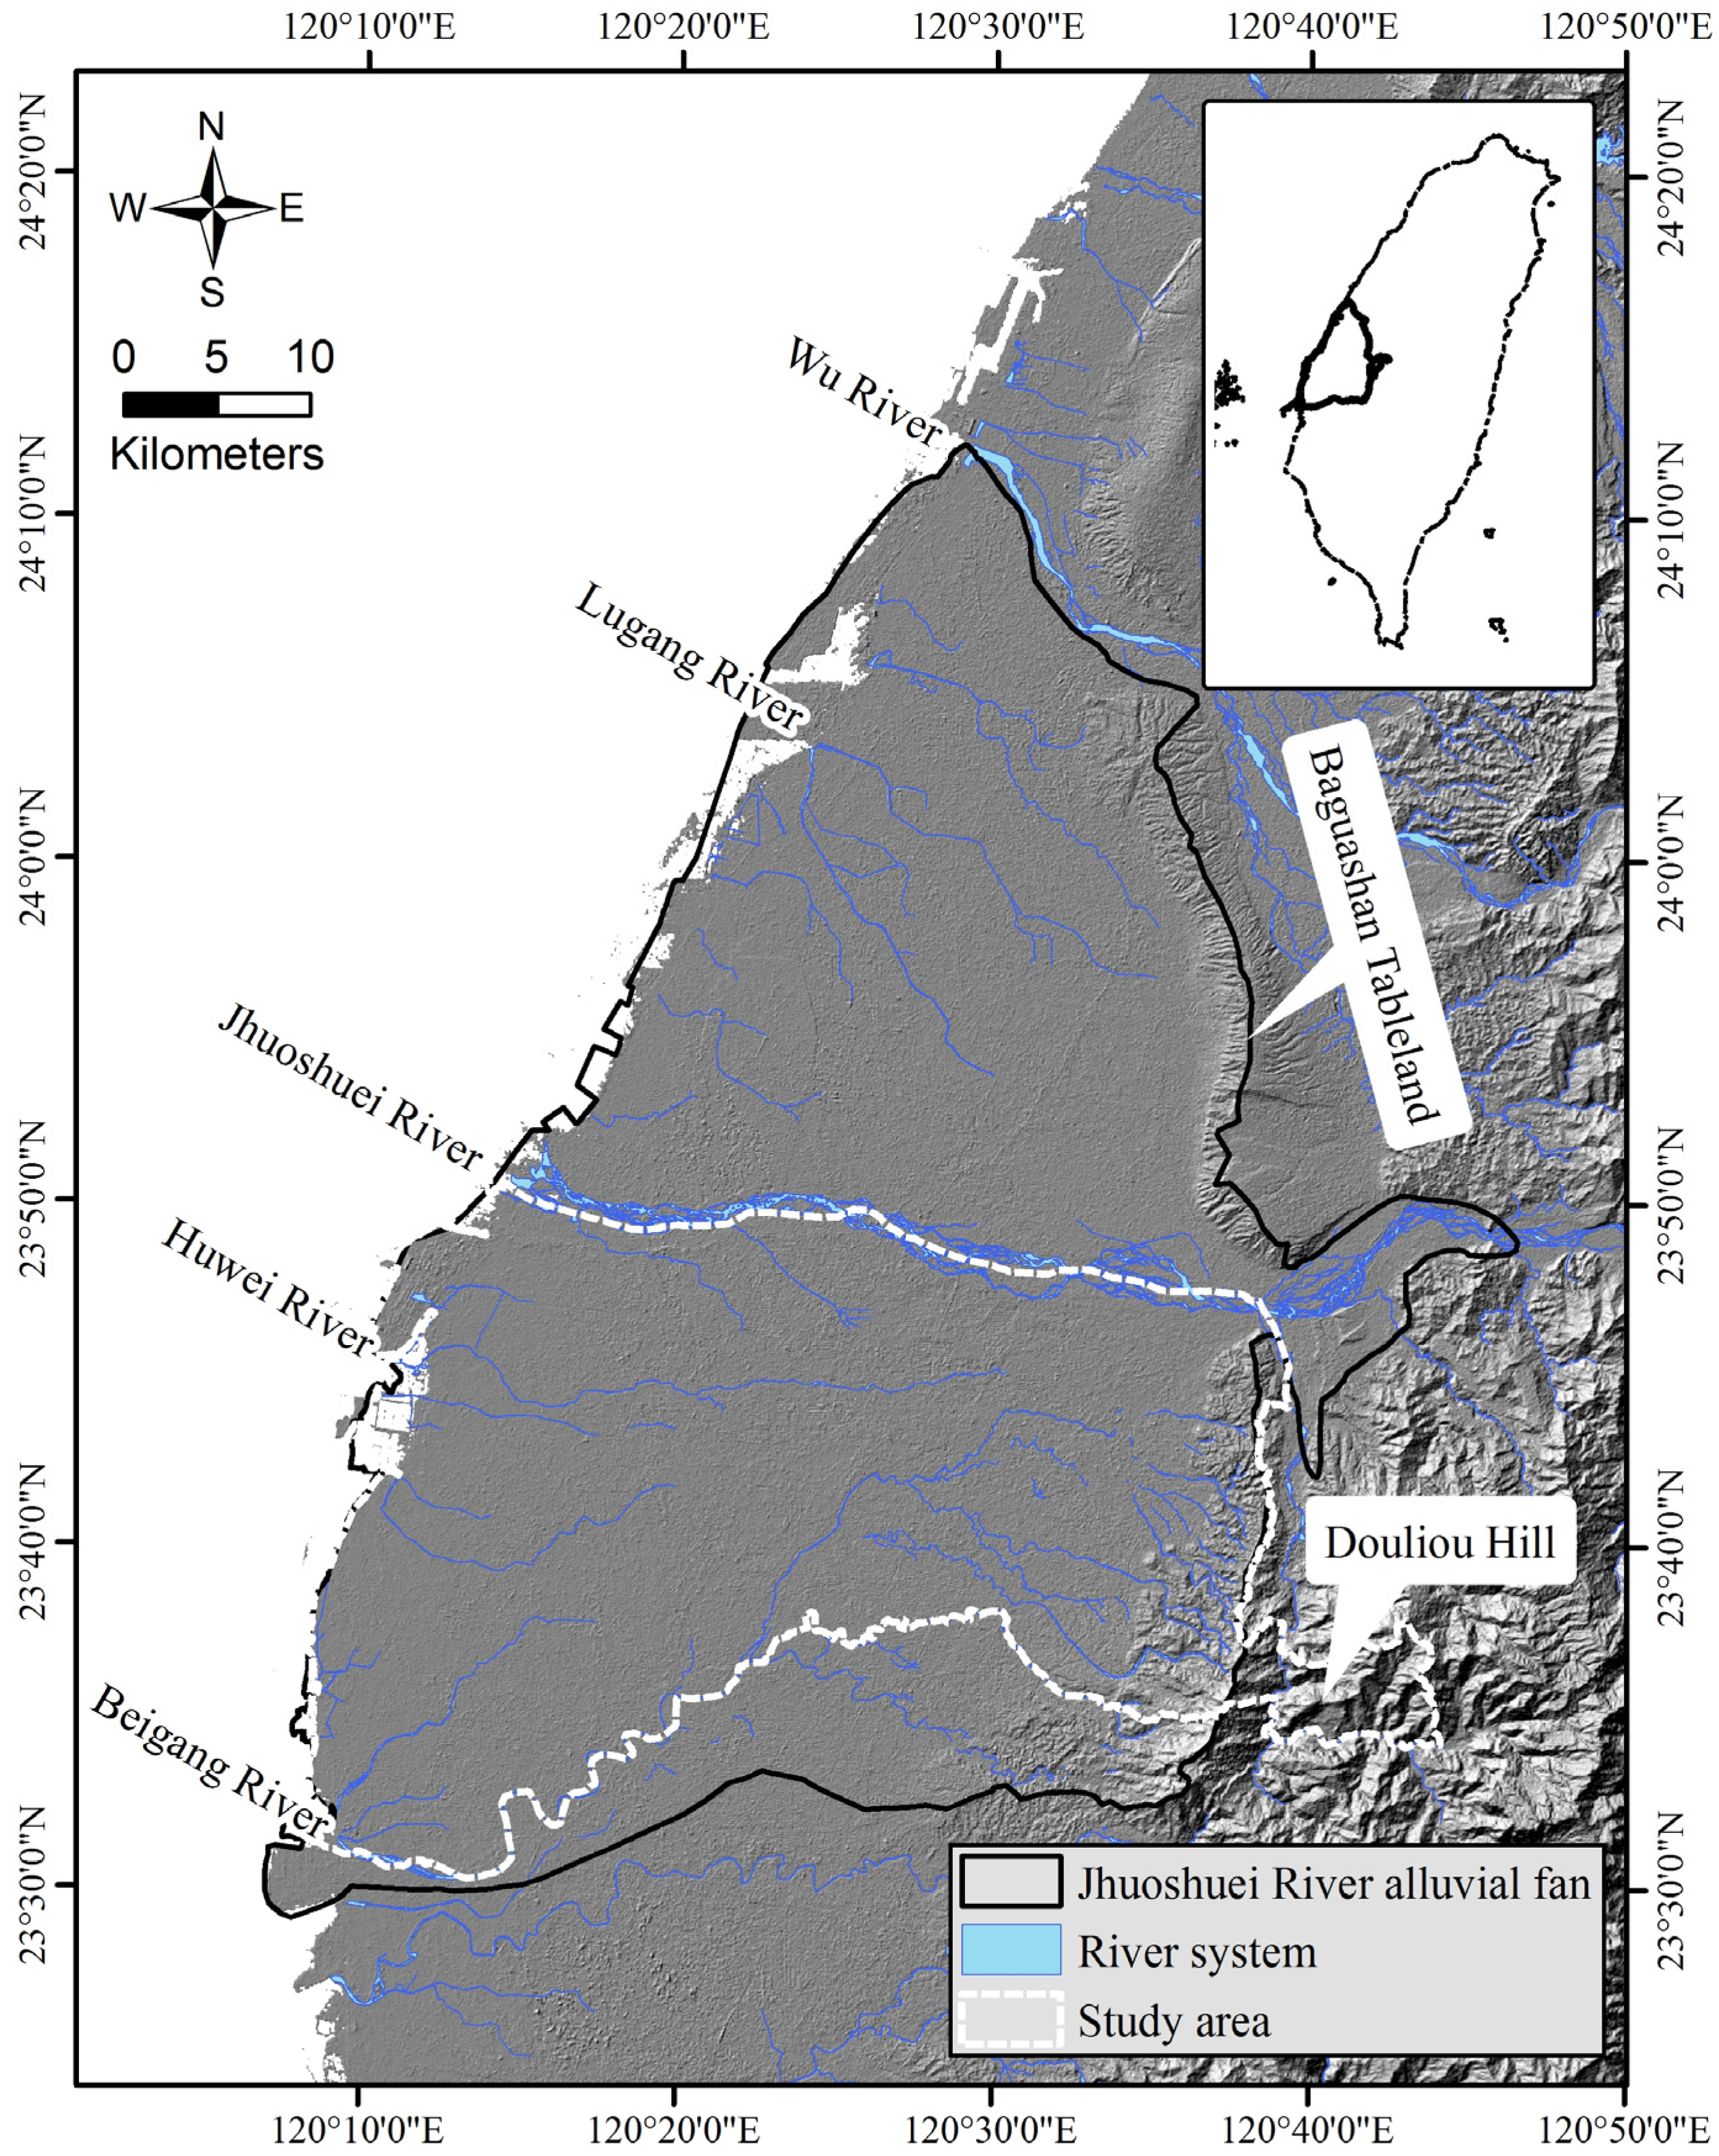
The study area is characterized by severe land subsidence and is located in Yunlin County, south of the Jhuoshuei River alluvial fan. The Jhuoshuei River alluvial fan constitutes the largest aquifer in Taiwan and extends from the Wu River in the north to the Beigang River in the south and from the Baguashan Tableland and Douliou Hill in the east to the Taiwan Strait in the west, as shown in
Figure 2.
Figure 2.
The white dash line indicates the study area south of the Jhuoshuei River alluvial fan.
Figure 2.
The white dash line indicates the study area south of the Jhuoshuei River alluvial fan.
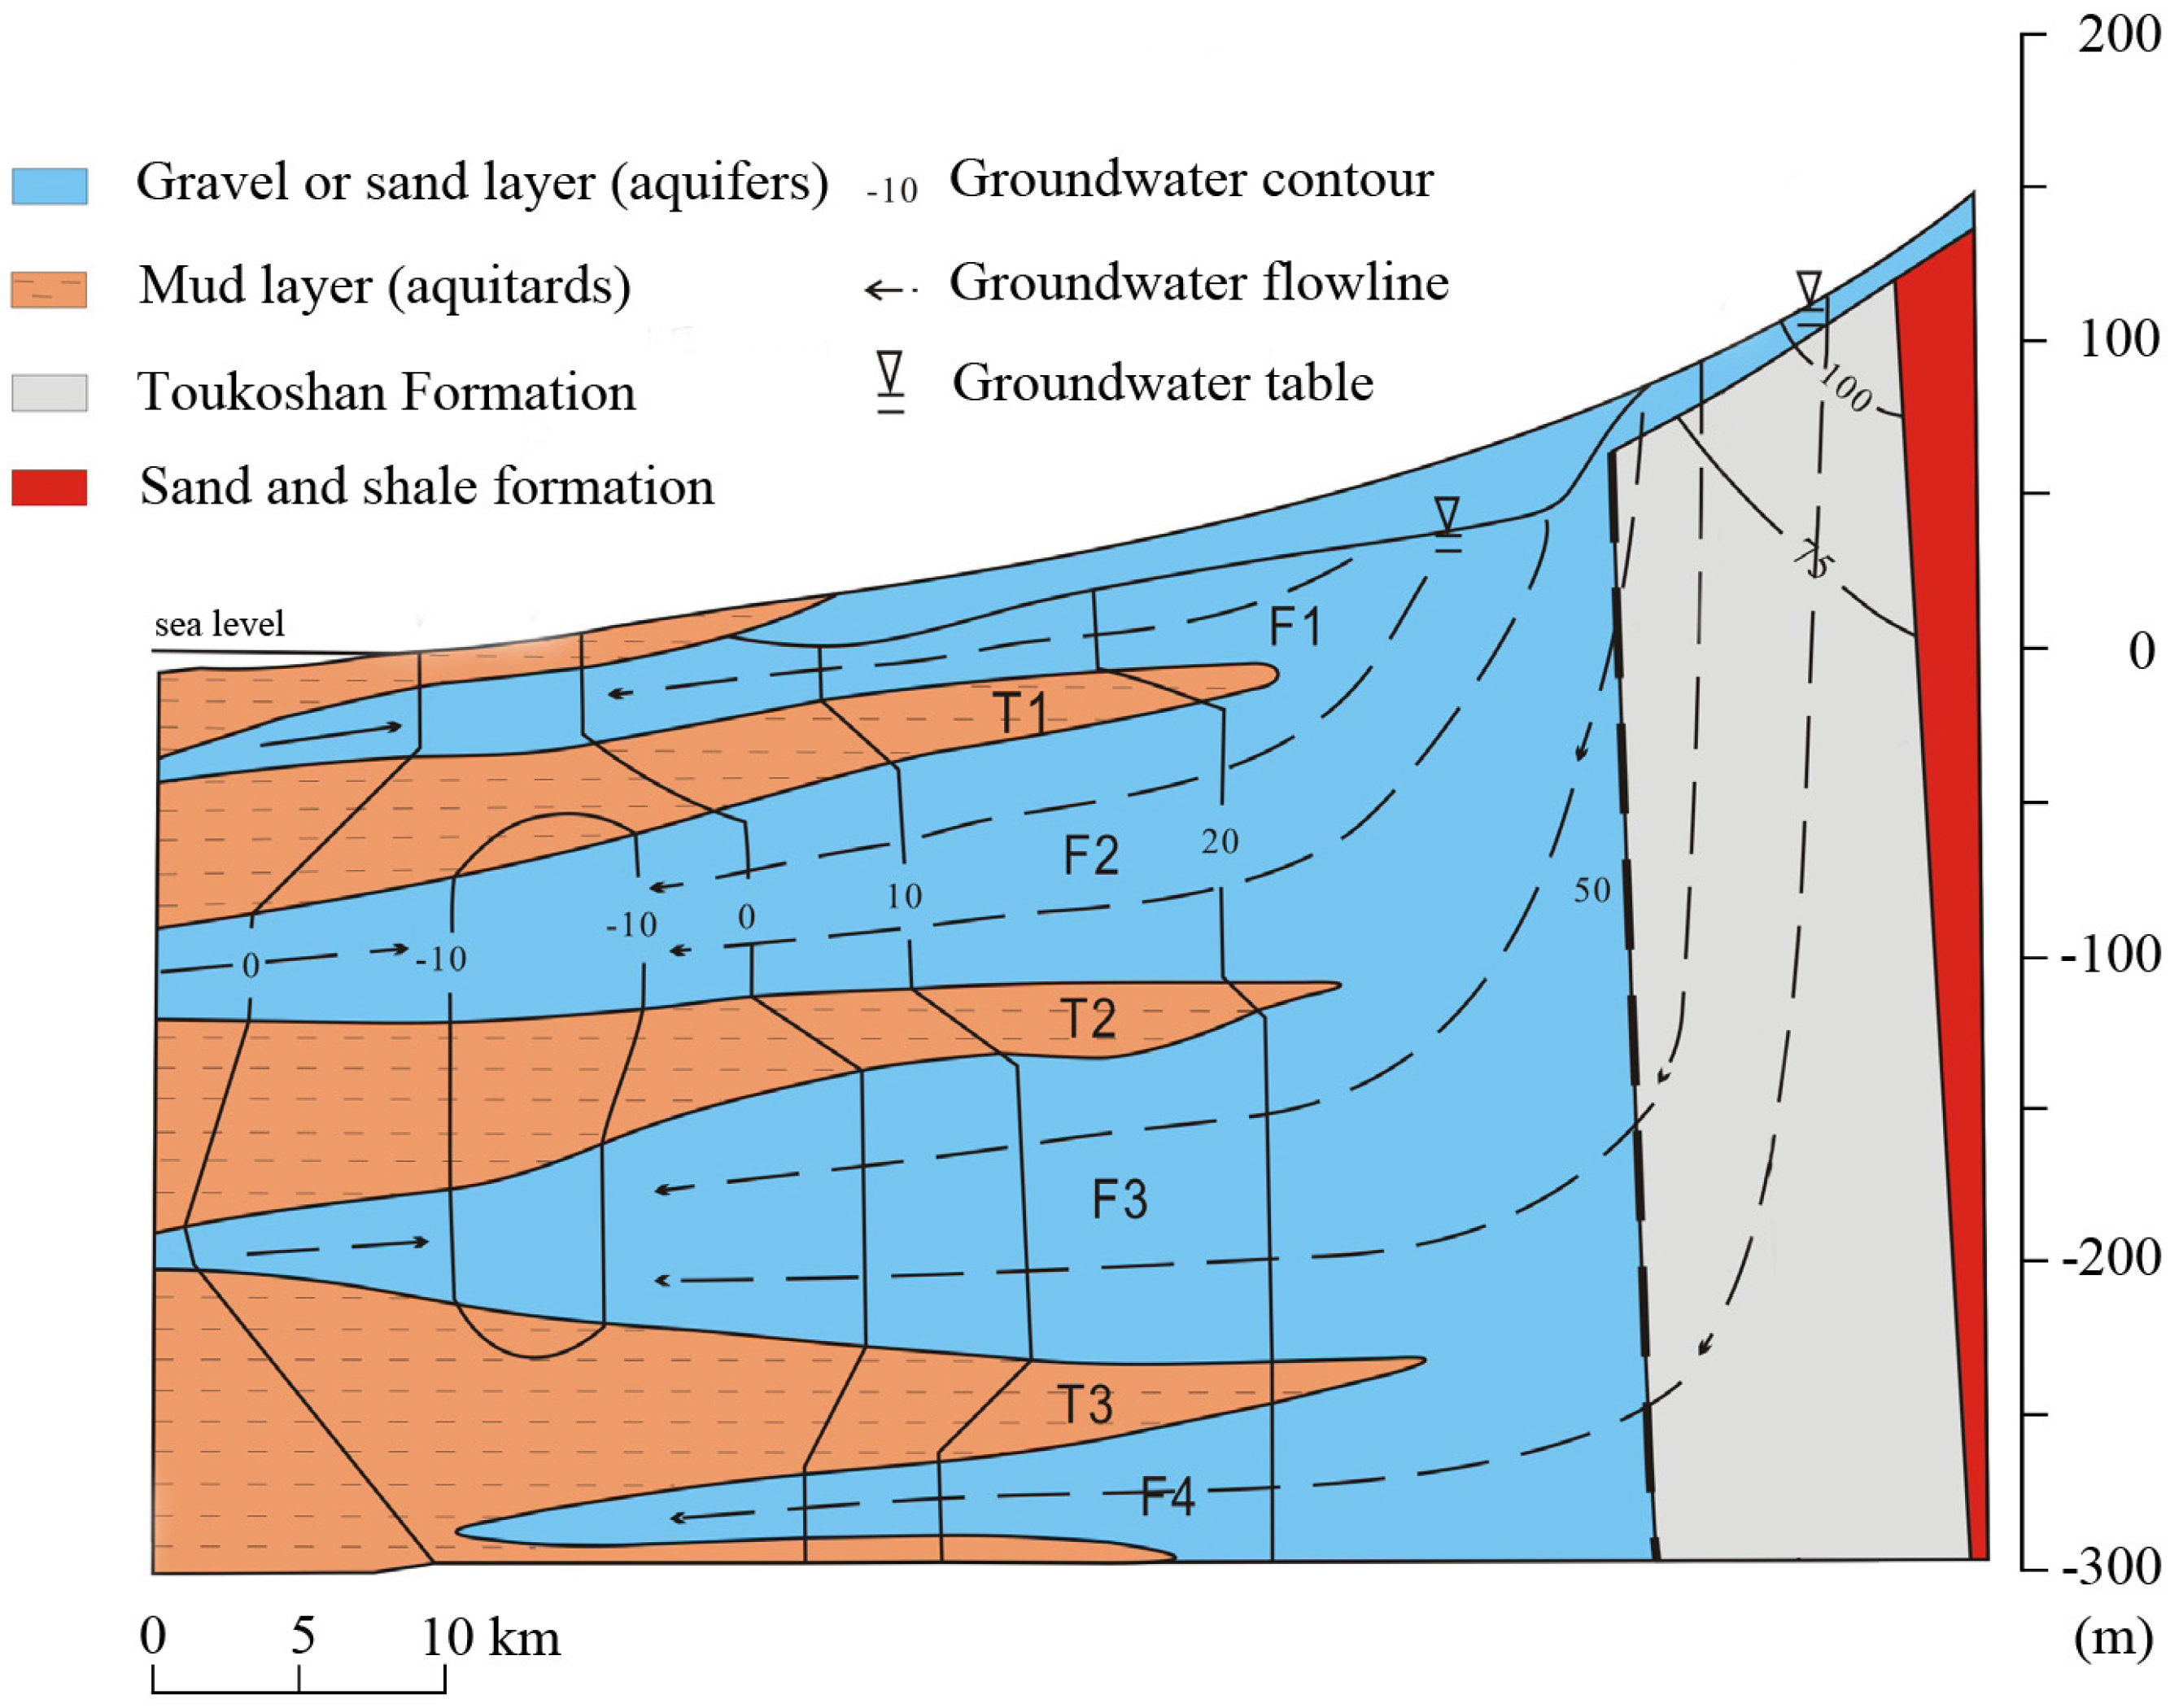
The Jhuoshuei River alluvial fan is composed of unconsolidated sediments, mainly gravel, sand, and mud, which are transported by the Jhuoshuei, Lugang, and Huwei Rivers from the Pleistocene Toukoshan Formation in the east part of the alluvial fan. The sediment deposits in the Jhuoshuei River alluvial fan are the result of frequent flooding that has led to the formation of large-grain-size material, including gravel and coarse-grained sand, constituting an overlapping, layered distribution [
12].
During marine transgression, mud covers an aquifer, thus forming an aquitard. In the Jhuoshuei River alluvial fan, marine transgression and regression have formed four aquifers and four aquitards that exhibit interlocking sedimentary layers, and also cause the thickness to decrease toward the inland for the aquitards, and toward the coast for the aquifers. Four aquifers merge at the top of the alluvial fan.
Figure 3 depicts a hydrogeological model of the Jhuoshuei River alluvial fan and clearly shows that the aquifers and aquitards are formed by marine transgression and regression [
12].
Figure 3.
The east-west hydrogeology concept model of the Jhuoshuei River alluvial fan, composed of four aquifers and aquitards (adapted from [
12]).
Figure 3.
The east-west hydrogeology concept model of the Jhuoshuei River alluvial fan, composed of four aquifers and aquitards (adapted from [
12]).
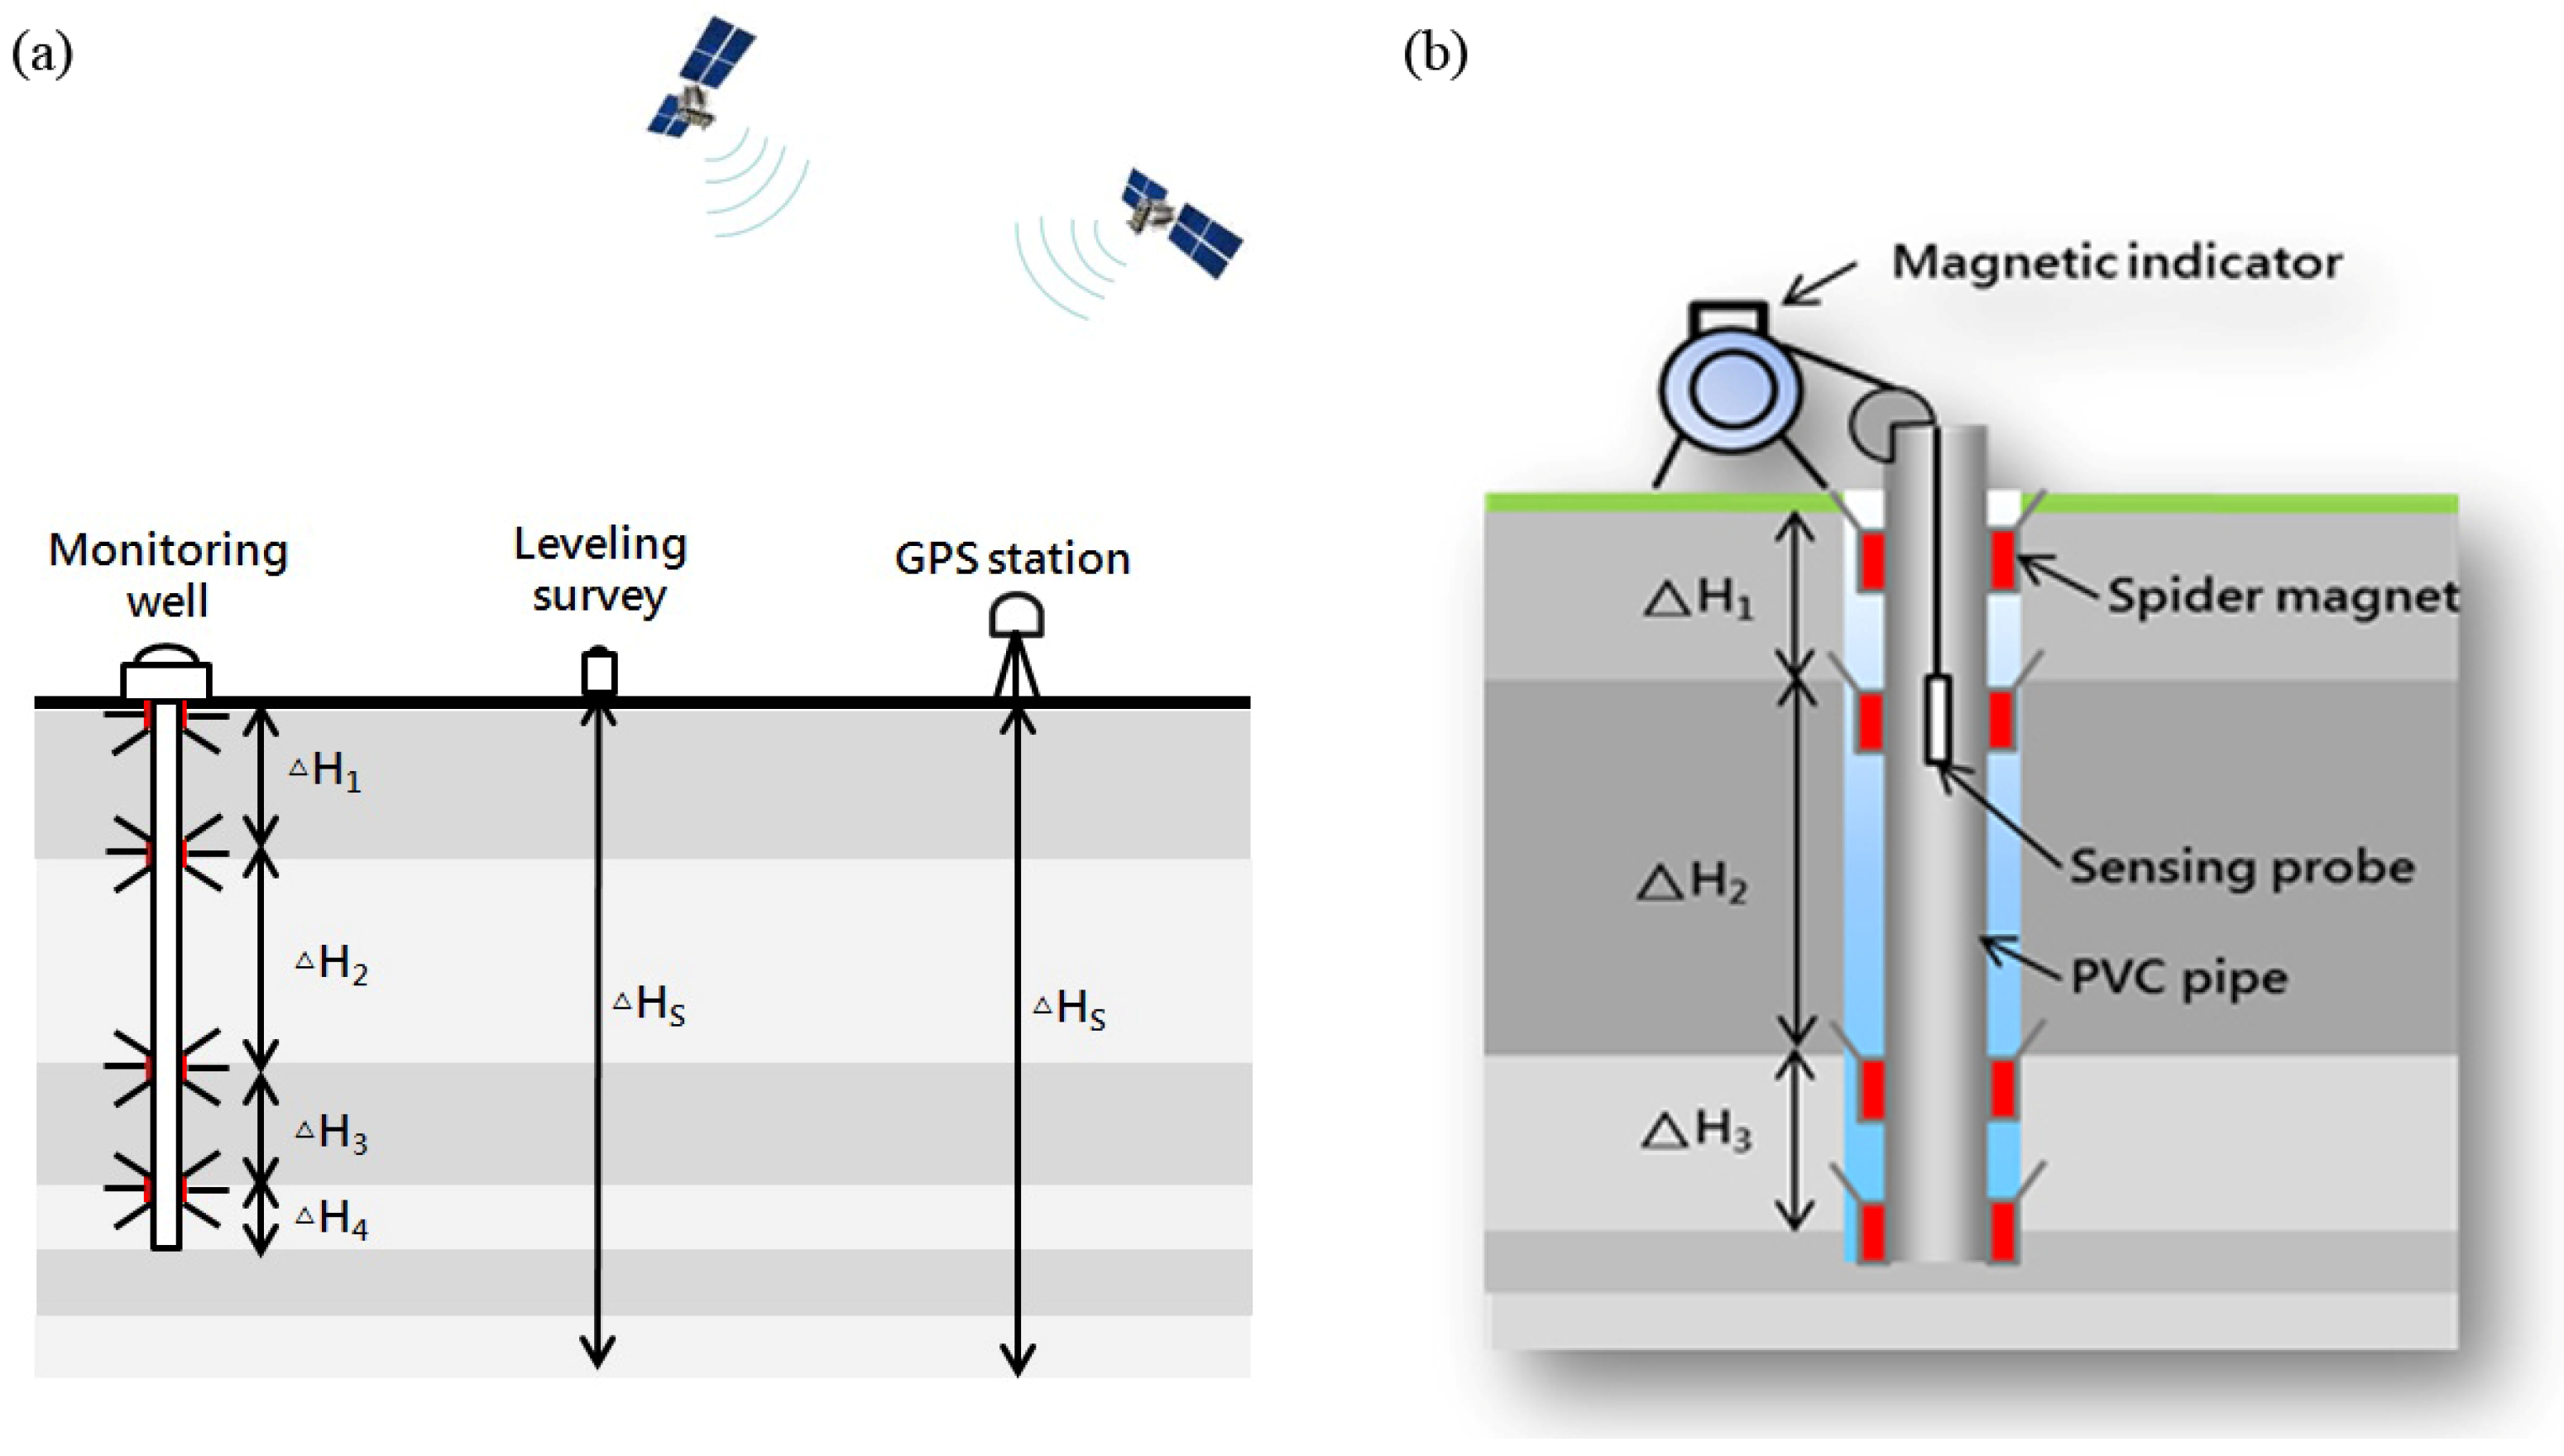
Figure 4.
(a) Integrated multisensor system for monitoring land subsidence; (b) principle of monitoring wells for observing land subsidence.
Figure 4.
(a) Integrated multisensor system for monitoring land subsidence; (b) principle of monitoring wells for observing land subsidence.
3. Methodologies
In this study, the leveling surveys, permanent GPS stations, monitoring wells, and PS-InSAR were integrated into a multisensor monitoring system to monitor the land subsidence in Yunlin County as shown in
Figure 4. The survey period was in 2012. In addition, this study collected the leveling data from 1992 to 2011, permanent GPS data from 2001 to 2011, monitoring well data from 1996 to 2011, and SAR images from 2007 to 2010, which were surveyed by the Industrial Technology Research Institute to analyze land subsidence characteristics.
Table 1 shows the sampling strategies used to ensure spatial and temporal resolution and accuracy. The survey methods are described as follows.
Table 1.
Sampling strategies for ensuring spatial and temporal resolution and accuracy with the multisensor subsidence monitoring system.
Table 1.
Sampling strategies for ensuring spatial and temporal resolution and accuracy with the multisensor subsidence monitoring system.
| Methods | Dense Array */Spatial Resolution ** | Survey Frequency/Period | Survey Period | Vertical Accuracy | Usage |
|---|
| Leveling survey | 1.5–2 km * | 1 year/1992–2012 | 1 year | <1 cm | For subsidence rate of each individual benchmark and isopleth of annual subsidence rate for 3 cm |
| Continuous GPS stations | 5–20 km * | 1 week/2001–2012 | 1 week | <1 cm | For a comparison with the other two observations to understand subsiding mechanism |
| Monitoring wells | 5–15 km * | 1 month/1996–2011 | 1 month | <0.5 cm | For a comparison with the other two observations to understand mechanism |
PS-InSAR
(ALOS) | 25 m ** | 46 days/2007–2010 | 46 days | <1 cm | Feasibility study by comparing with those historical results |
3.1. Leveling Survey
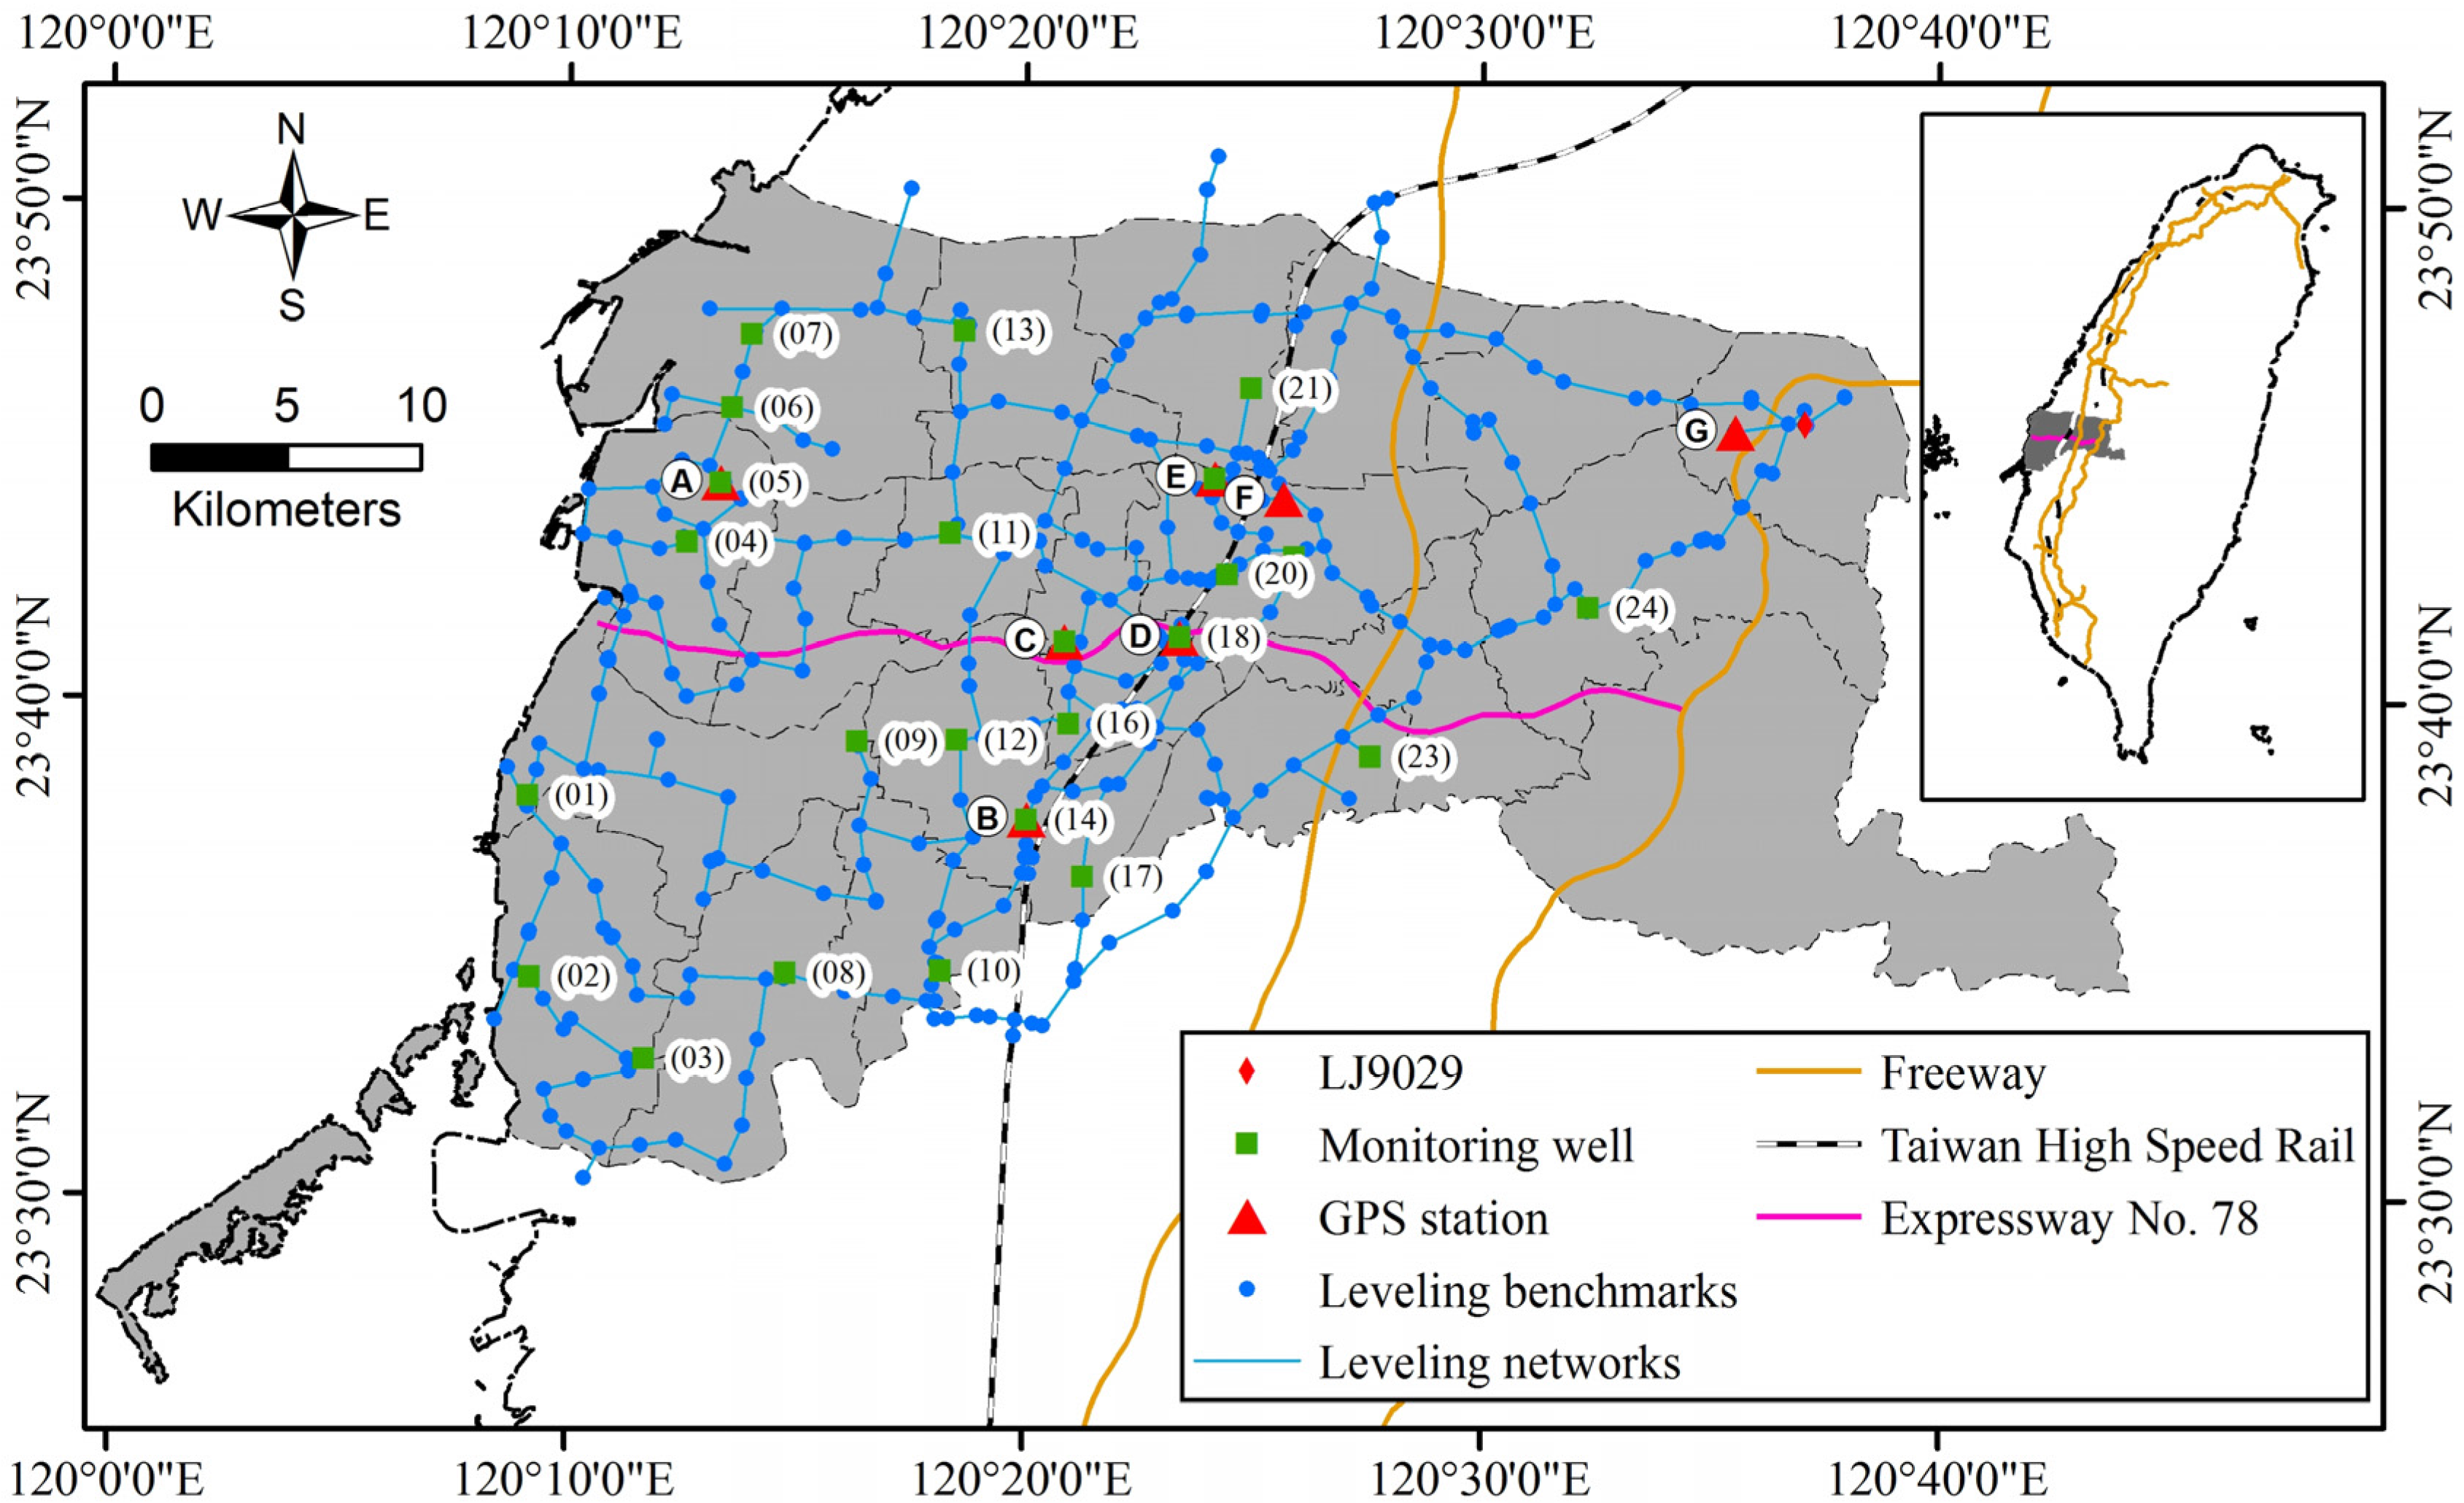
The leveling survey method involved the use of a Trimble DINI digital level with LD12 bar code rods to determine the benchmark networks from 2012 to 2013 with calibration implemented by National Measurement Laboratory R.O.C before surveying is conducted. The requirements for the leveling measurements followed the standards of the TWVD2001 first-order and class II leveling enforced by the Department of Land Administration, Ministry of Interior, Taiwan. Observations were made by comparing an observed height with a reference benchmark that was assumed to be fixed and with known ground deformation. For comparison with the previous leveling results, most locations of benchmarks are consistent with the past layout. However, leveling survey networks have been reorganized. There was a total of 383 benchmarks in the investigation area of Yunlin County, the total length of the leveling network is 502 km, and the distance between benchmarks is around 1.5–2.0 km (
Figure 5). This study adopted 102 routes forming 26 loops and used BFFB survey method to measure the height of the benchmarks related to the LJ9029 located in the western foothills, which is a relative stable area (
Figure 5).
To examine the stability of the reference point LJ9029, two test methods were performed: (1) the leveling procedure was adopted to determine the elevation of LJ9029 with respect to nearby known first-order benchmarks; and (2) a static GPS survey was conducted to verify the horizontal displacements of the LJ9029 and its neighboring known first-order benchmarks. The stability results indicate that absolute change of elevation difference between LJ9029 and nine first-order benchmarks range from 0.0 to 4.2 mm. In addition, the maximum horizontal displacement of neighboring benchmarks is 2.6 cm, so it is believed LJ9029 is located on a stable region. In order to maintain a high-precision leveling survey, the required accuracy for the final adjustment of the leveling survey is 3 mm, where K is the length of a surveying segment in kilometers. Leveling survey data were adopted to monitor annual land-surface deformation and used to generate the subsidence isopleth map. In the data processing, the errors with collimation and earth’s curvature were corrected, while the atmospheric refraction is not corrected without a known or measured atmospheric profile from collocated sounding equipment. A least squares method was utilized to adjust the data.
Figure 5.
Leveling survey networks, benchmarks, GPS stations, and monitoring wells for land subsidence measurement in the study area. Monitoring wells are denoted (1)–(24) and GPS stations are denoted Ⓐ–Ⓖ.
Figure 5.
Leveling survey networks, benchmarks, GPS stations, and monitoring wells for land subsidence measurement in the study area. Monitoring wells are denoted (1)–(24) and GPS stations are denoted Ⓐ–Ⓖ.
3.2. Permanent GPS Survey
Seven continuous GPS monitoring stations in Yunlin County were used in this study to monitor land-surface deformation from 2012 to 2013 (
Figure 5). These stations were installed on the same pillars located in areas undergoing substantial subsidence to provide regular and frequent observations. Monitoring signals and observation data were transmitted to a remote server through the Internet. Like most GPS survey practices, the epoch interval was 30 seconds with 15-degree elevation cutoff. The Bernese 5.0 [
13] was used to calculate the weekly movement of GPS stations relative to an IGS station called TWTF. TWTF is located in Taoyuan city in Taiwan over the Eurasia plate with ITRF coordinates (X, Y, Z) = (−2,994,425.04, 4,951,312.24, 2,674,498.60), in meters, and Latitude = +245,712.96; Longitude = +1,210,952.20; and elevation = 203.122 m. Its receiver type is ASHTECH Z-XII3T with firmware version Z-XII3. It was installed on 1 August 2001. Its antenna type is ASH701945C_M SCIS with a 30 m Andraw FSJ1-50A cable. In order to understand atmospheric influence on GPS surveying and to even reduce the atmospheric effect [
14,
15], the site is also equipped with meteorological instrument MET-3 A, manufactured by Paroscientific, Inc., with a high sampling rate of 5 s, and high accuracies of 2%, 0.08 hPa, and 0.5 degrees for relative humidity, pressure, and temperature, respectively.
3.3. Monitoring Wells
In this study, 24 monitoring wells were used (
Figure 5).
Figure 4b shows the components of the monitoring wells. Magnetic rings were installed at the boundaries of sedimentary layers to enable distinguishing gravel, sand, silt, and clay. The locations of the magnetic rings of each well were measured monthly to observe the relative compaction of the sedimentary layers from 2012 to 2013. This information was critical in elucidating the relationship between the water extraction and subsidence mechanisms.
3.4. PS-InSAR
In order to accurately measure the ground displacement, the PS-InSAR technique, a more accurate and improved analysis algorithm as compared to other InSAR methods, was also adopted in our research. In total, twenty images were obtained from the phased array-type L-band SAR for the current study. Out of the twenty images, fourteen images were selected to form paired images in order to determine the land subsidence for further comparison with that measured by the leveling results. The acquisition time of the ALOS PALSAR images selected from the archives was between 15 February 2007 and 26 December 2010 (
Table 2).
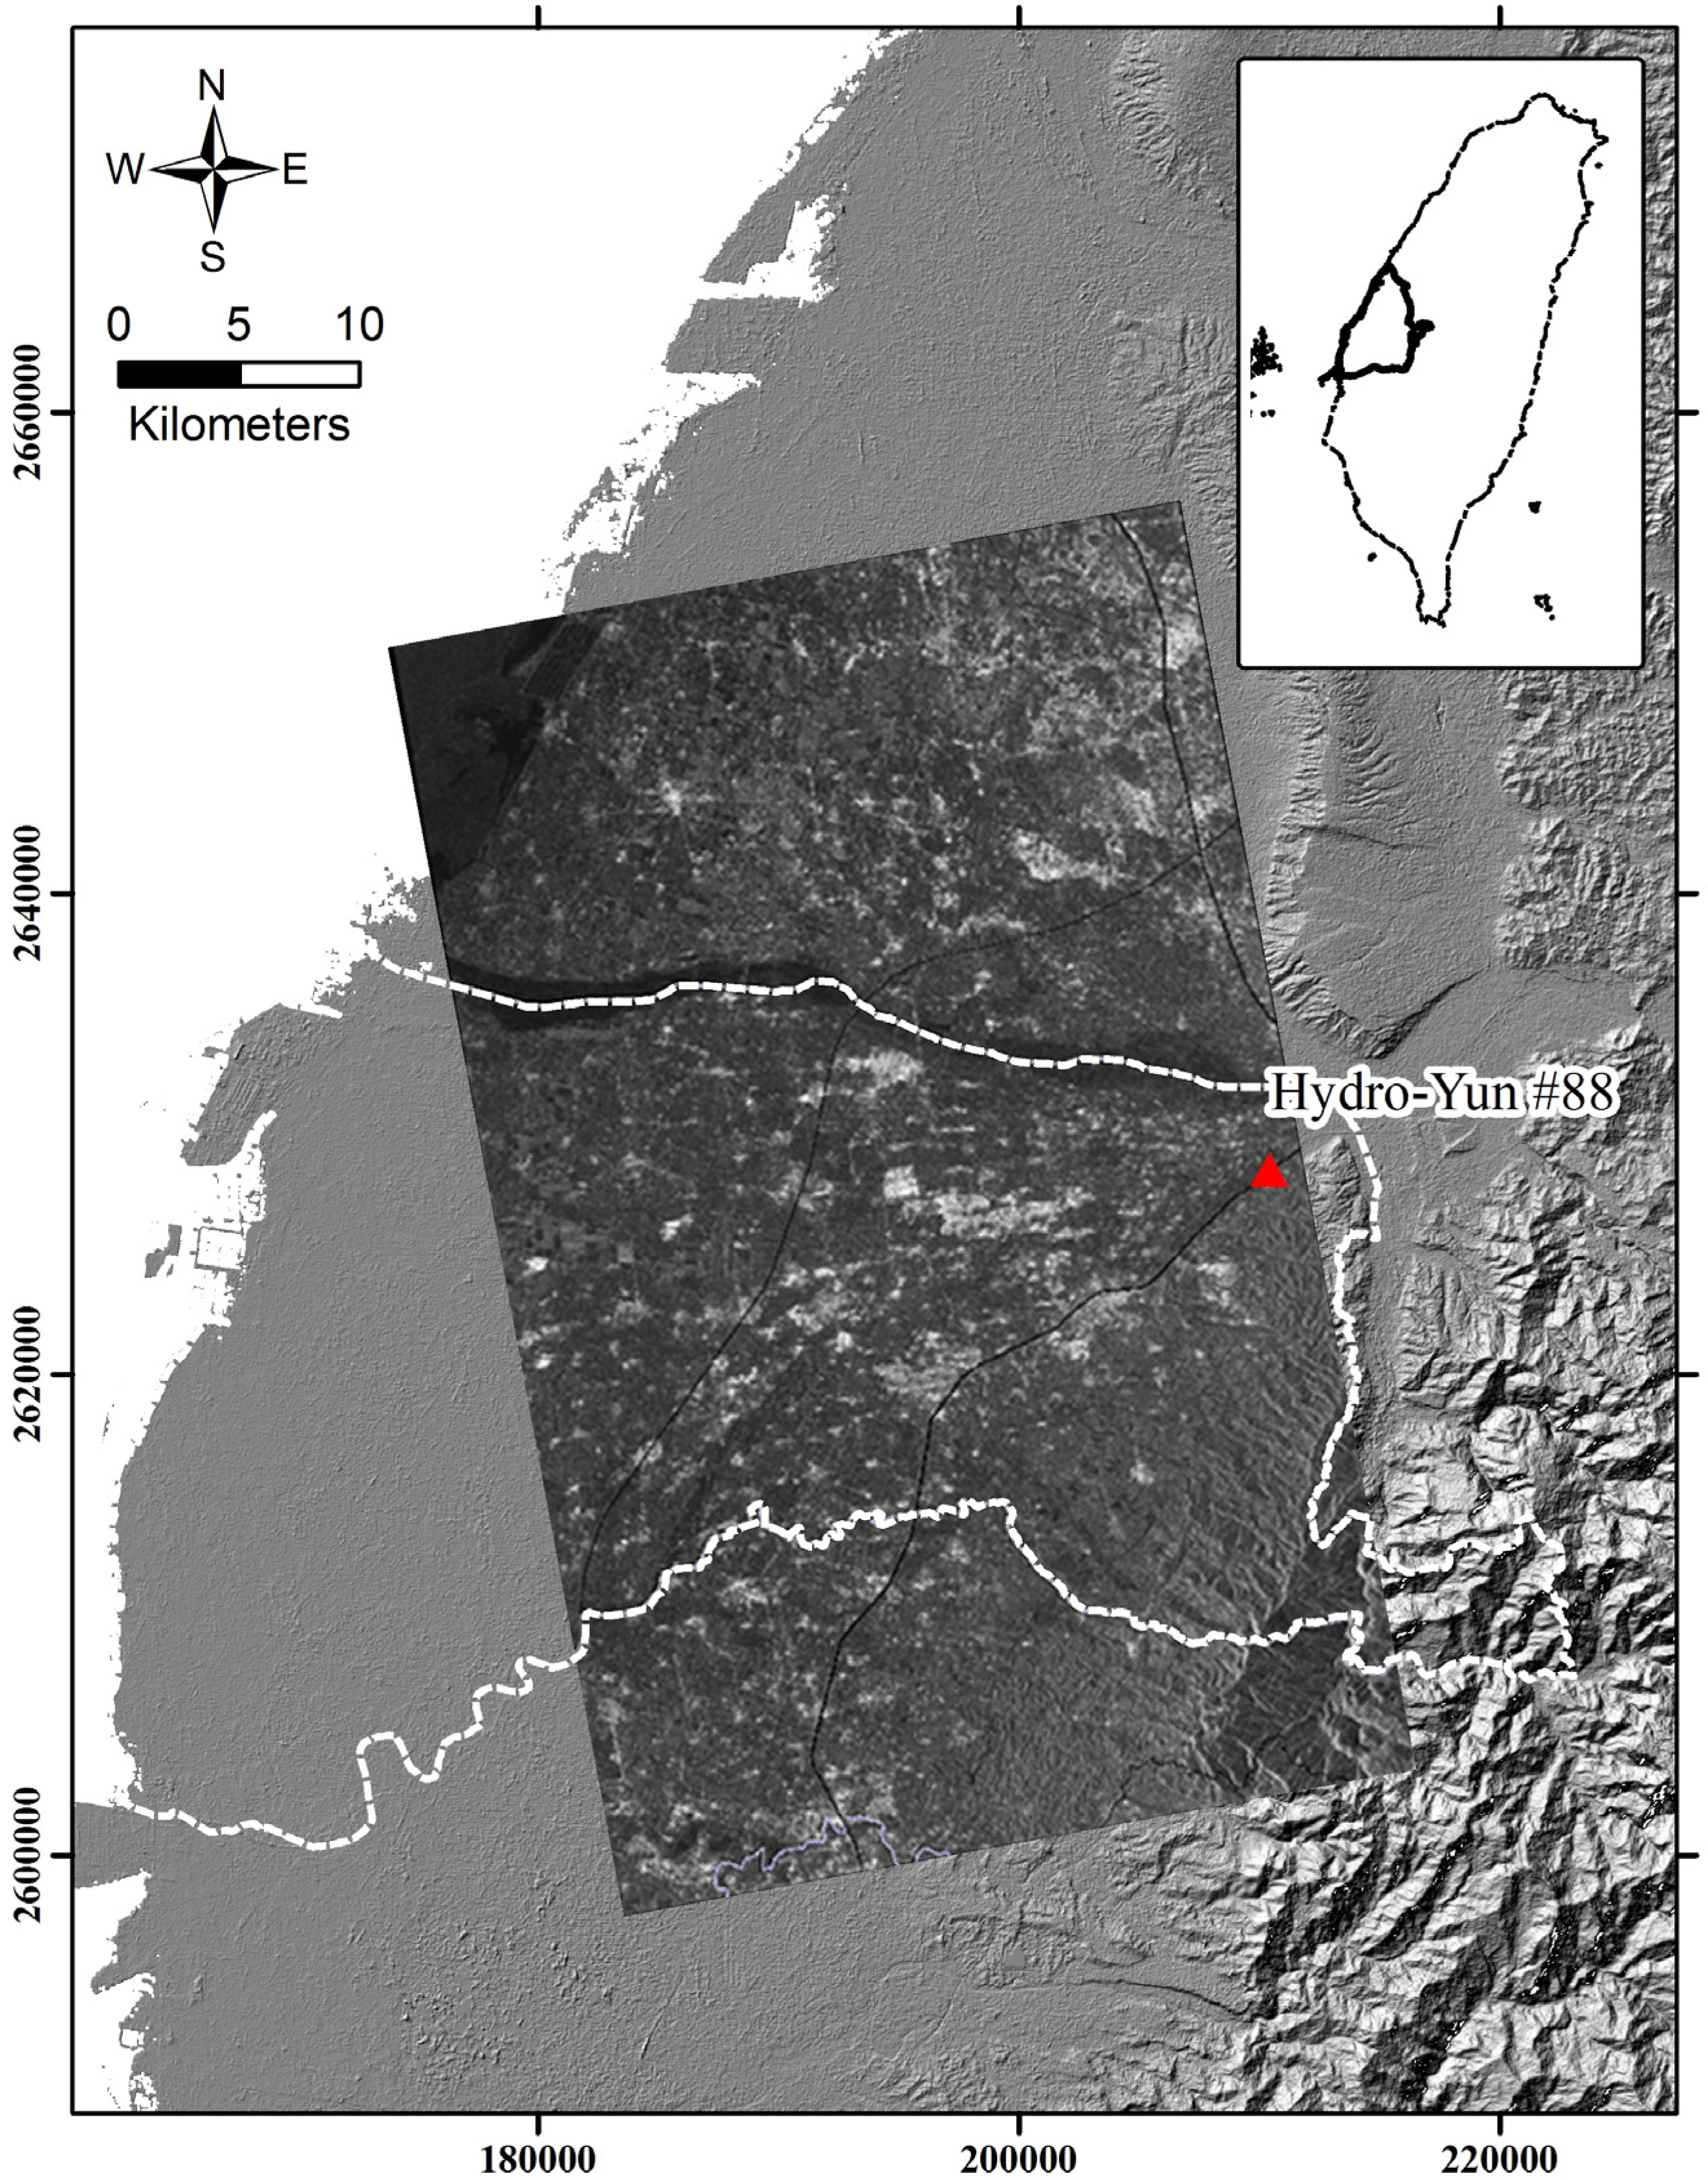
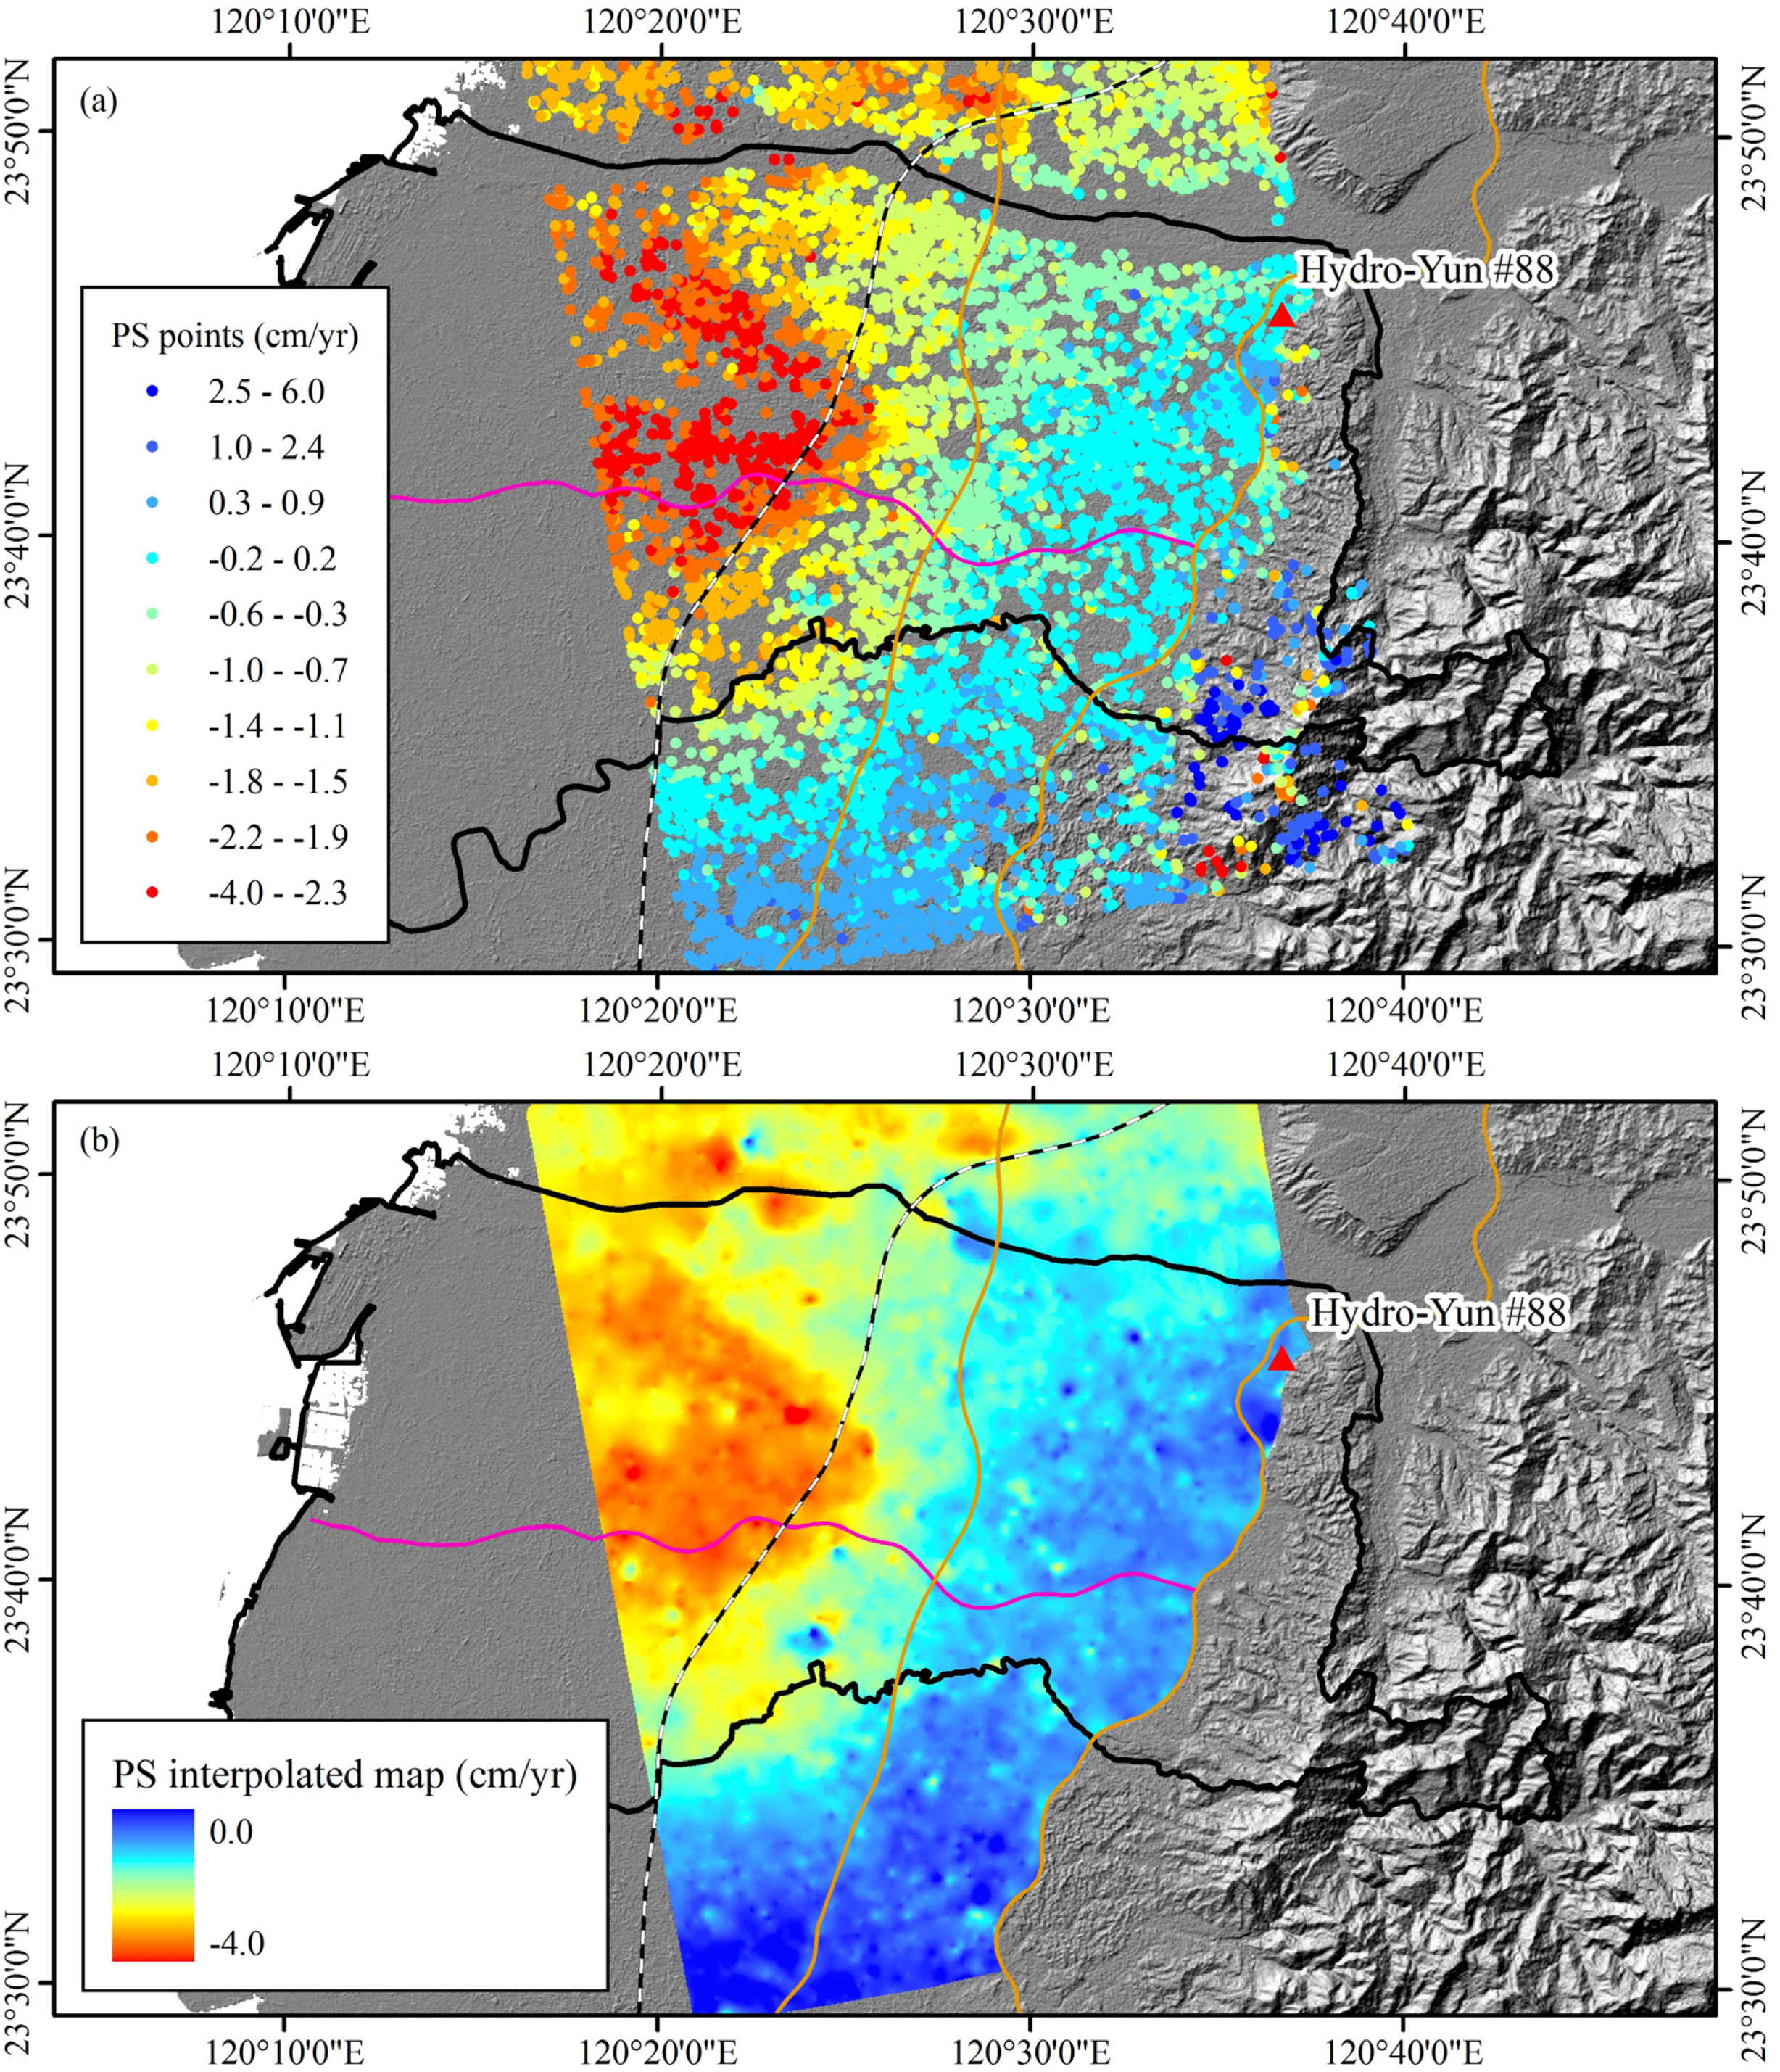
Figure 6 depicts a SAR intensity image of the study area (33 km × 54 km), including the townships of Sihu, Erhlin, and Sicho in Changhua County to the north and the townships of Huwei, Tuku, and Yuenchang in Yunlin County to the south. The Hydro-Yun #88 benchmark was used as a reference point because the site is stable and has exhibited no detectable deformation over the past few years.
Table 2.
SAR image pairs used in this study.
Table 2.
SAR image pairs used in this study.
| Image | Date | Perpendicular Baseline (m) | Temporal Baseline (Days) |
|---|
| 1 | 2007/02/15 | 330.3 | −966 |
| 2 | 2007/08/18 | 657.9 | −782 |
| 3 | 2007/10/03 | 333.8 | −736 |
| 4 | 2008//01/03 | 580.6 | −644 |
| 5 | 2008/07/05 | 721.8 | −460 |
| 6 | 2009/01/05 | 1223.9 | −276 |
| 7 | 2009/08/23 | 240.6 | −46 |
| 8 * | 2009/10/08 | / | / |
| 9 | 2010/01/08 | 90.1 | 92 |
| 10 | 2010/02/23 | 641.1 | 138 |
| 11 | 2010/07/11 | 964.5 | 276 |
| 12 | 2010/08/26 | 1262.4 | 322 |
| 13 | 2010/10/11 | 1254.6 | 368 |
| 14 | 2010/11/26 | 1206.1 | 414 |
Doris Software for Interferometric SAR processing from Delft University of Technology was used to perform the D-InSAR processing. Subsequently, the method by Mora et al. [
16], and the Matlab program by Yang et al. [
17] were used for PS-InSAR processing. The PS-InSAR data processing is briefly described here: (1) subset the study area from the image dataset; (2) compute the baselines of every pair; (3) select a pair that exhibits a minimal temporal baseline to generate an interferogram of the topographic effects; (4) select a minimal temporal baseline as master image and set all other images as slave images, and then select the image pairs for further processing; (5) generate deformation interferograms and corresponding coherence maps for all paired images; (6) generate topographic interferograms for all paired images; (7) compute the difference between deformation and topographic interferograms for all paired images, (8) select the permanent scatterer candidate (PSC) points based on the coherence maps. A PSC point is selected when the coherence of all identical pairs is larger than the threshold; (9) compute PS-InSAR by using the phase information of each PSC, extracting permanent scatterer (PS) points and their range deformation; and (10) convert the slant range deformation to vertical deformation at the target of interest by multiplying the line-of-sight (LOS) deformation by the cosine of the incident angle.
Figure 6.
SAR intensity image of the study area (white dash line).
Figure 6.
SAR intensity image of the study area (white dash line).
In data processing, generally a coherence threshold value of 0.4 or higher is chosen, as a higher threshold is better. In this study, a value of 0.34 for the threshold was selected in order to preserve a sufficient number of PSC points for extracting PS points as suggested by Yang [
18] based on the previous experiences of PS-InSAR processing in the area of concern. The mean, minimum, and maximum coherences of PS are 0.63, 0.44, and 0.88, respectively. Finally, PS-InSAR was performed using the phase information on each PSC and extracted 9413 PS points with range results for further comparison with leveling results.
Note that the displacement information revealed by PS-InSAR is along the LOS direction. For our investigation, the incident angle of image center is 38.7° for the RADAR data. According to characteristics of ALOS radar images with swath width of 70 km and track altitude of 691.65 km, as compared to earth diameter of 6371 km, the incident angles for the two edges of the image are 36.5° and 40.8°, respectively. Due to the fact that the annual horizontal movements for the two edges are smaller than 1 mm/y, the incident angle for all the areas of concern can be considered a constant 38.7°. That is, the incident angles of the radar beam in the near and far range are assumed to be fixed. Furthermore, based on the permanent GPS horizontal velocity analysis, Hung [
19] found that the horizontal displacement in the study area was close to zero. Therefore, we did not consider the horizontal motion of PS-InSAR in this study.
5. Discussion
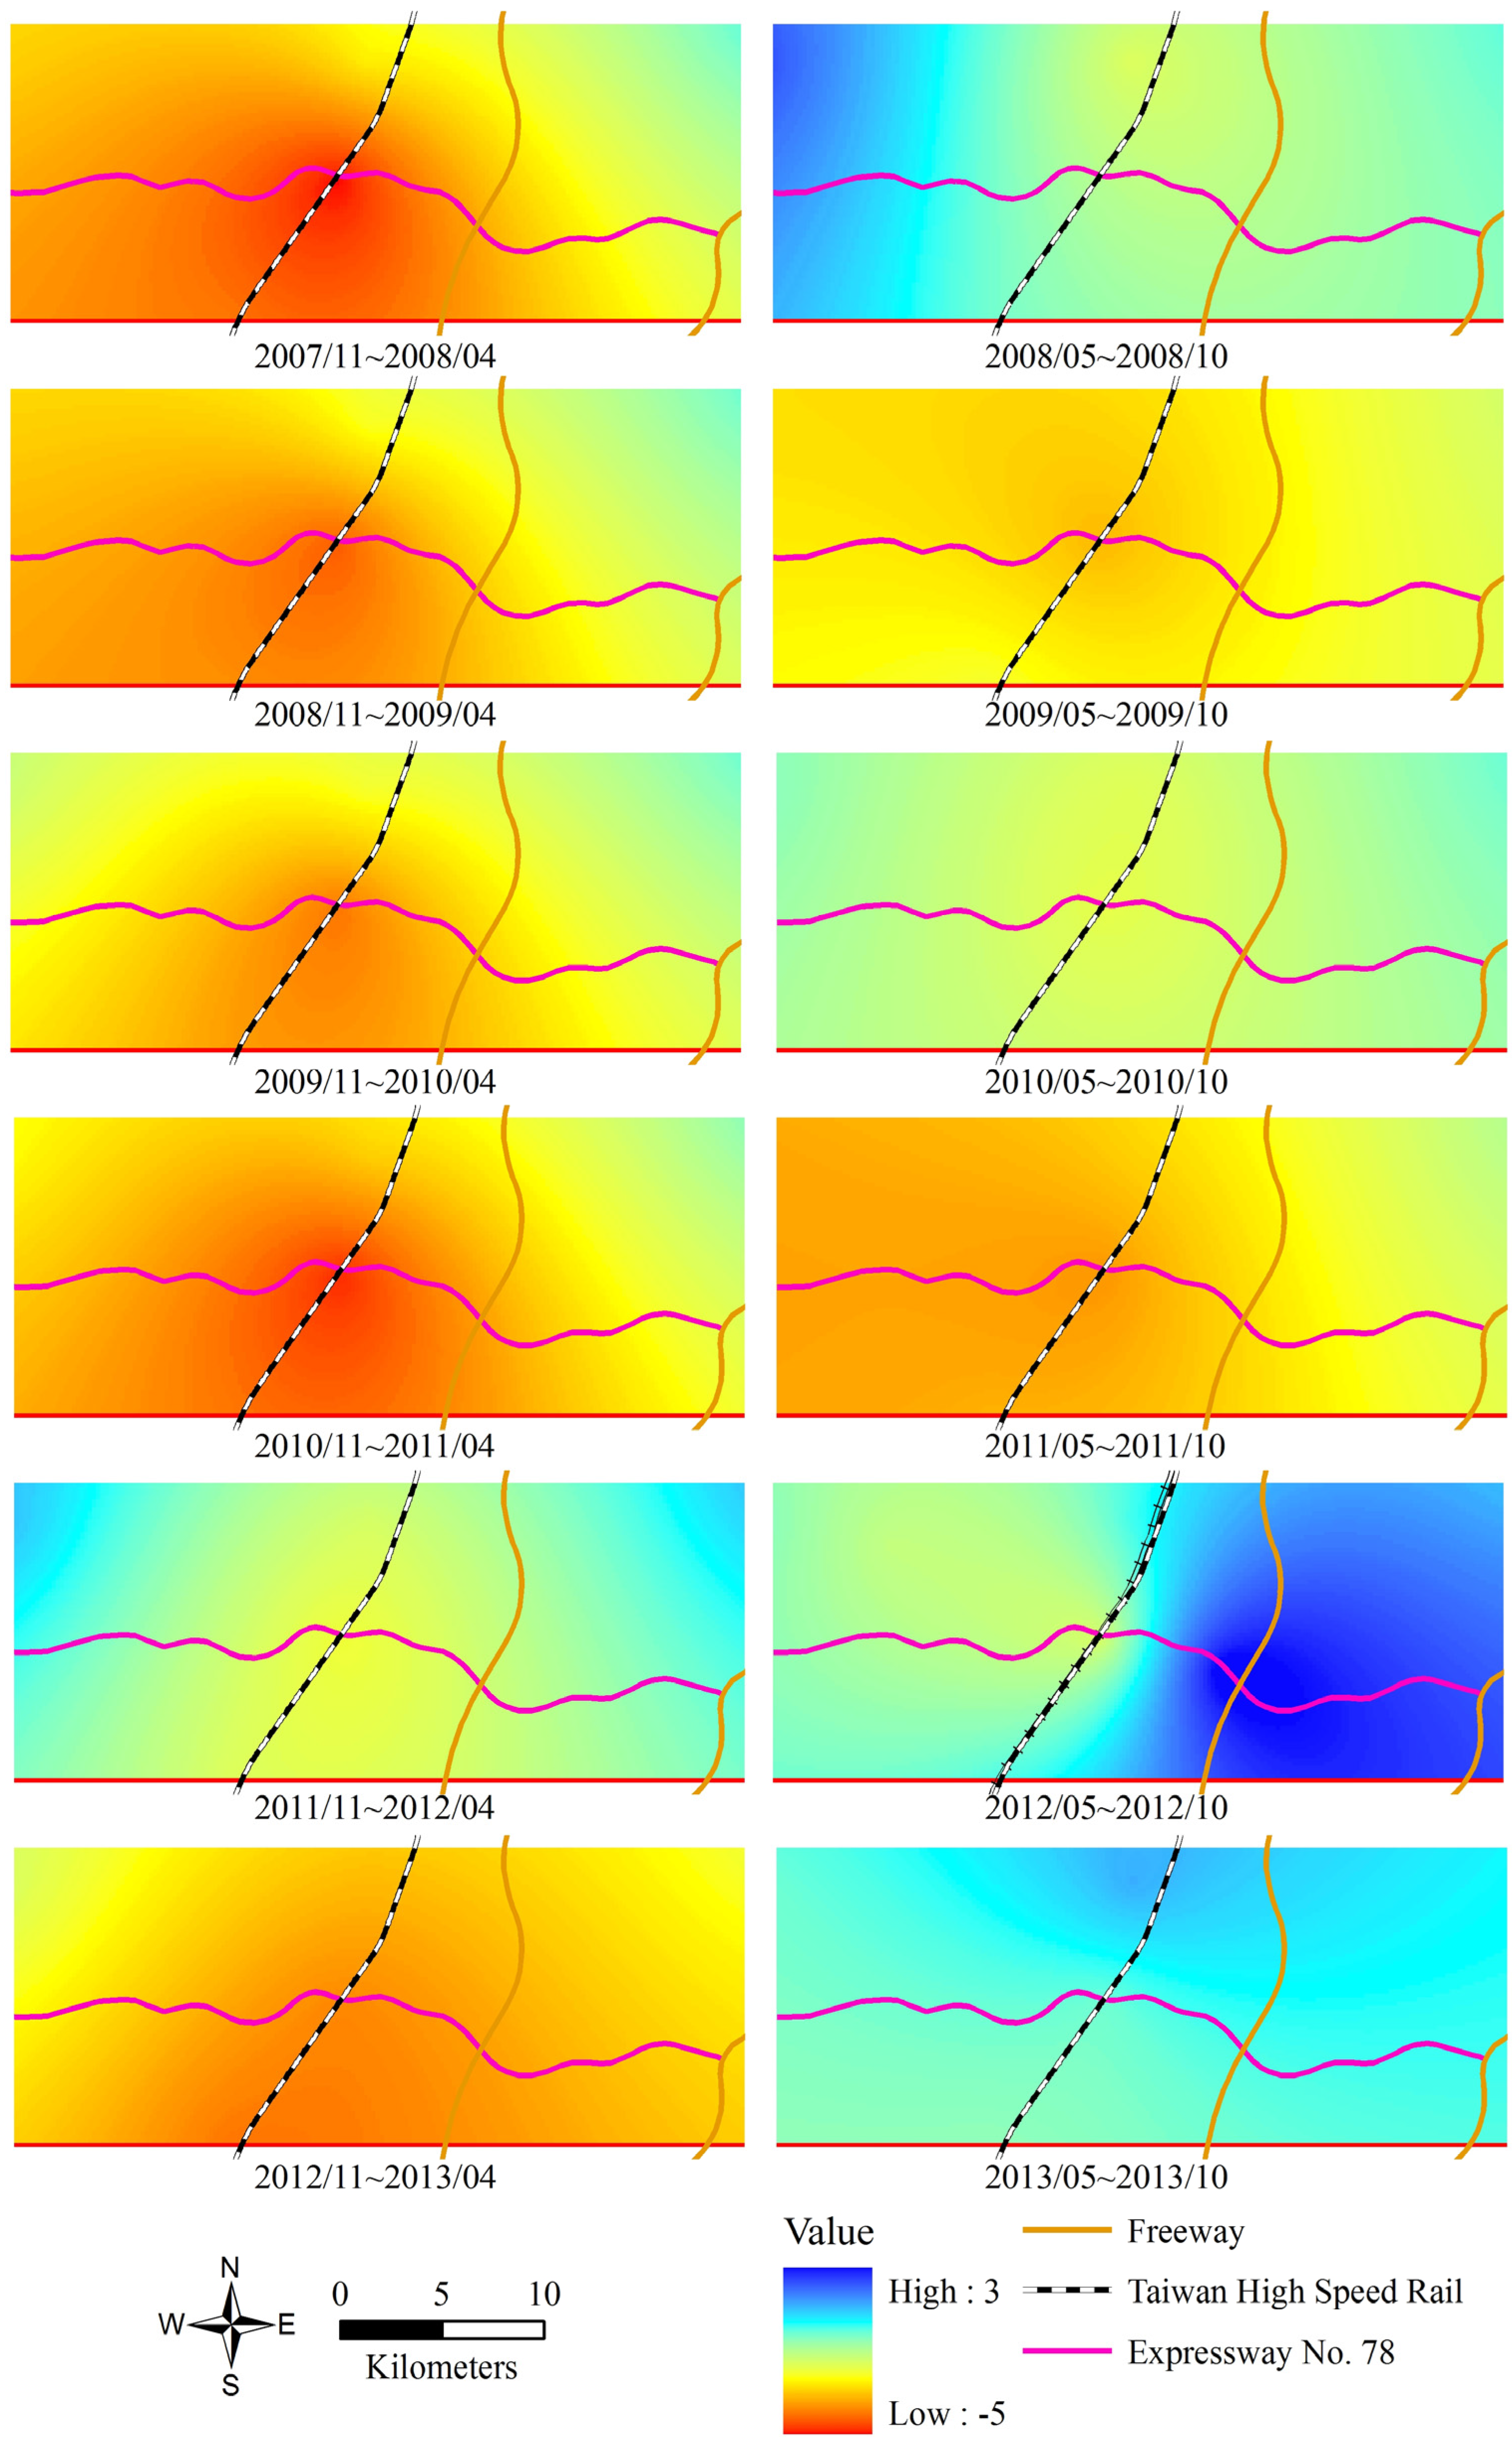
To understand land subsidence in Yunlin County, GPS data were collected to compare subsidence in the wet and dry seasons. The GPS data were divided into the dry season (November, December, January, February, March, and April) and wet season (May, June, July, August, September, and October) and used the Kriging method to obtain an interpolated map. The vertical uplift movement in the wet season was higher than that in the dry season. However, several vertical uplift movements in the wet season did not exhibit the same level compared with other wet seasons, particularly in 2009, 2010 and 2011 (
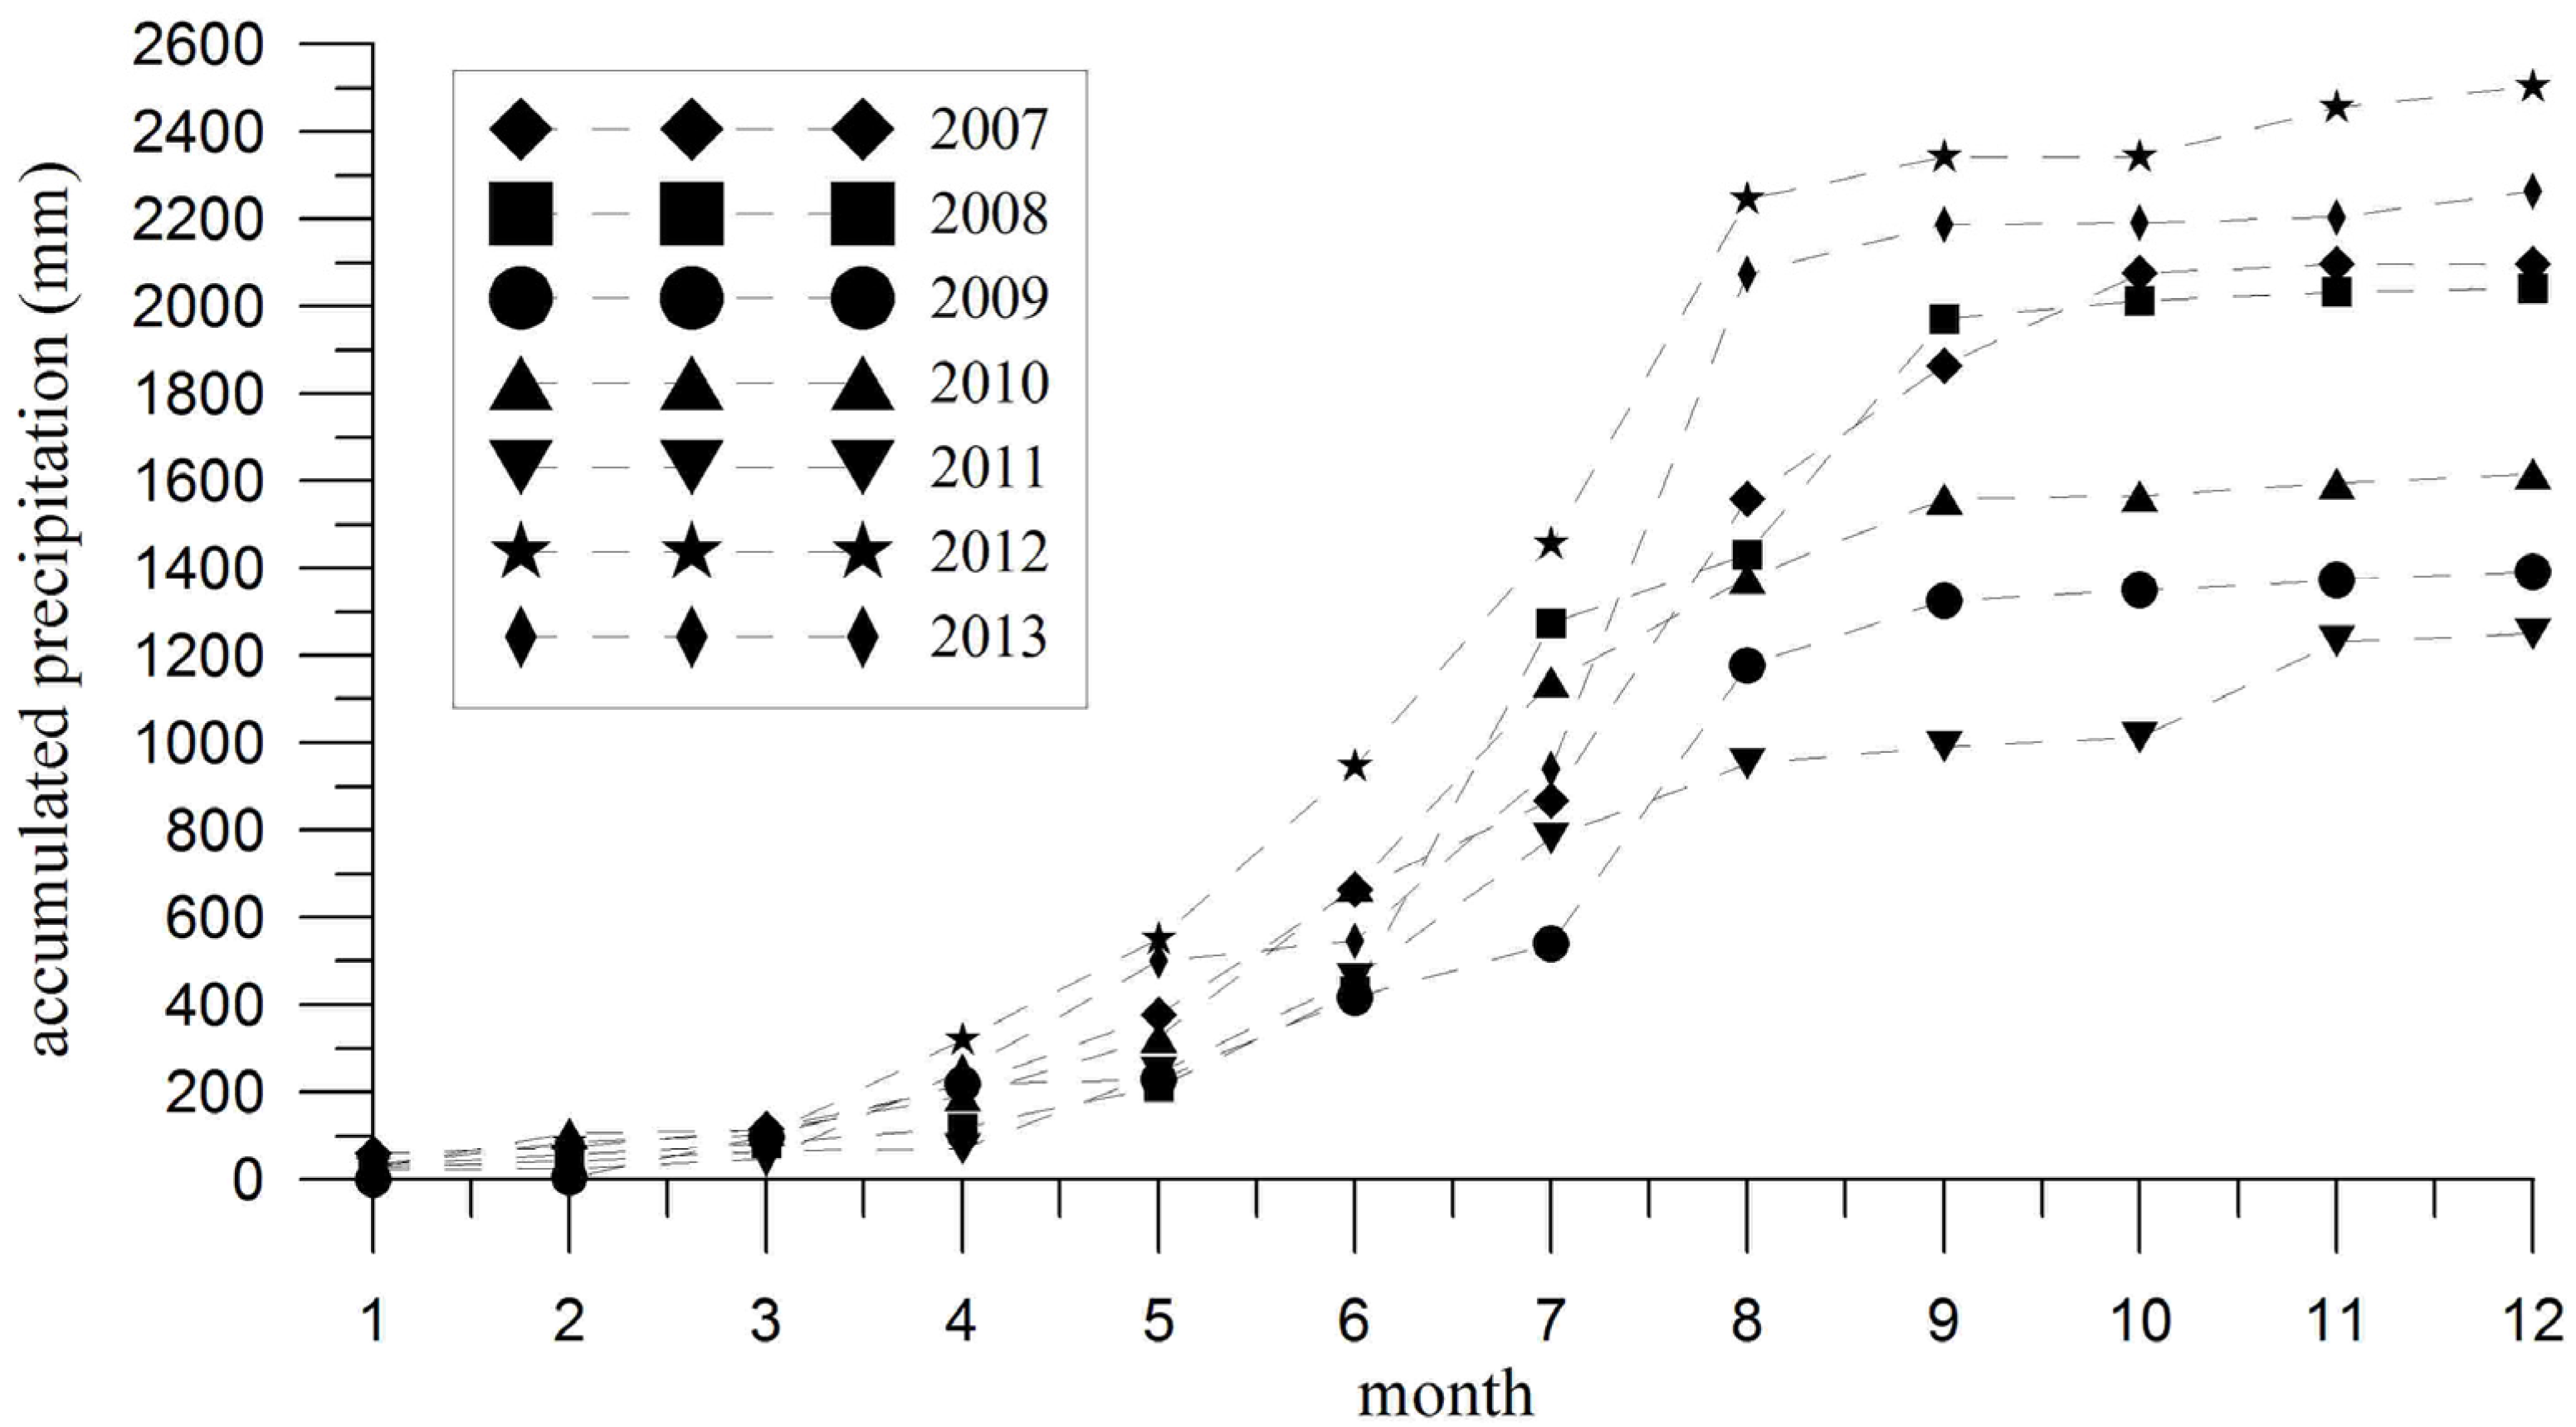
Figure 11). Subsequently, this study examined the precipitation at Yunlin weather stations from 2007 to 2013 (
Figure 12). The precipitation in 2009, 2010 and 2011 was lower than that in the other years. Based on the above analysis, the land subsidence behavior during the wet and dry seasons is partly caused by precipitation. High precipitation in the wet season causes the land subsidence rate to decrease.
Figure 12.
Monthly precipitation in Yunlin County from 2007 and 2013.
Figure 12.
Monthly precipitation in Yunlin County from 2007 and 2013.
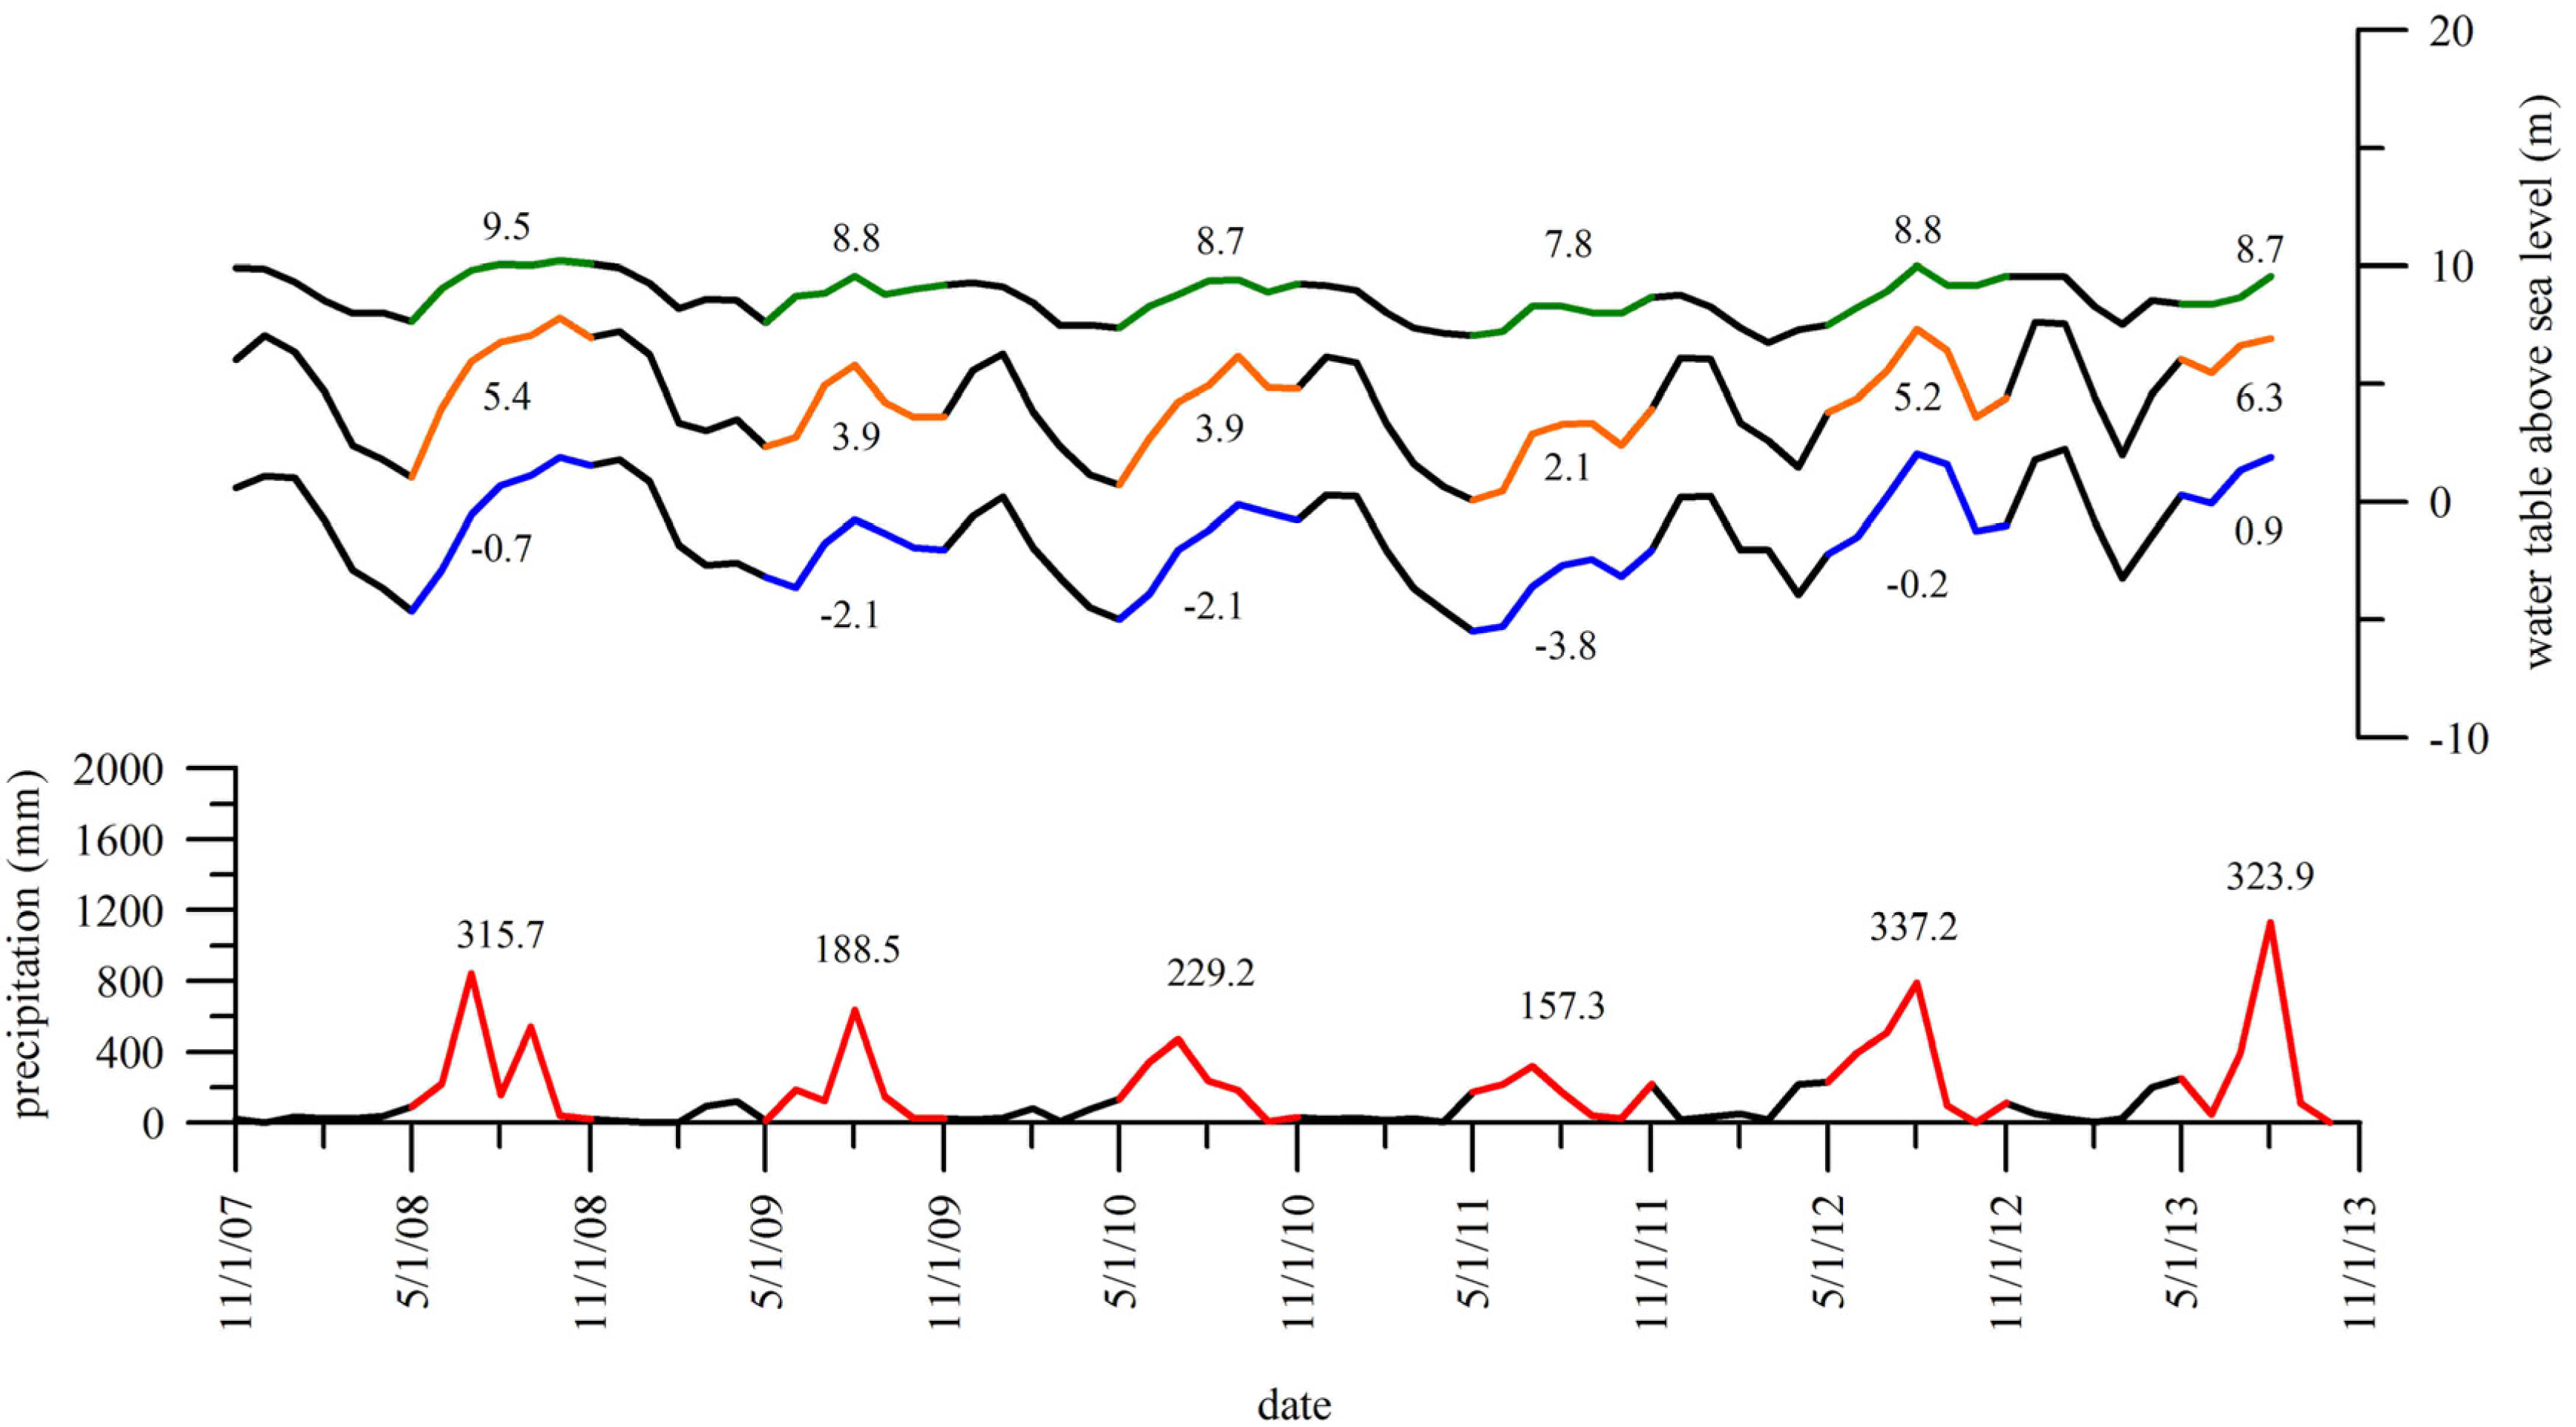
This study also used the measurements from the Tuku groundwater well located in the center of the severe subsidence to analyze the relation between water table changes and precipitation. From the 6-year water table changes and precipitation results, it is clear that high precipitation usually accompanies a high water table (
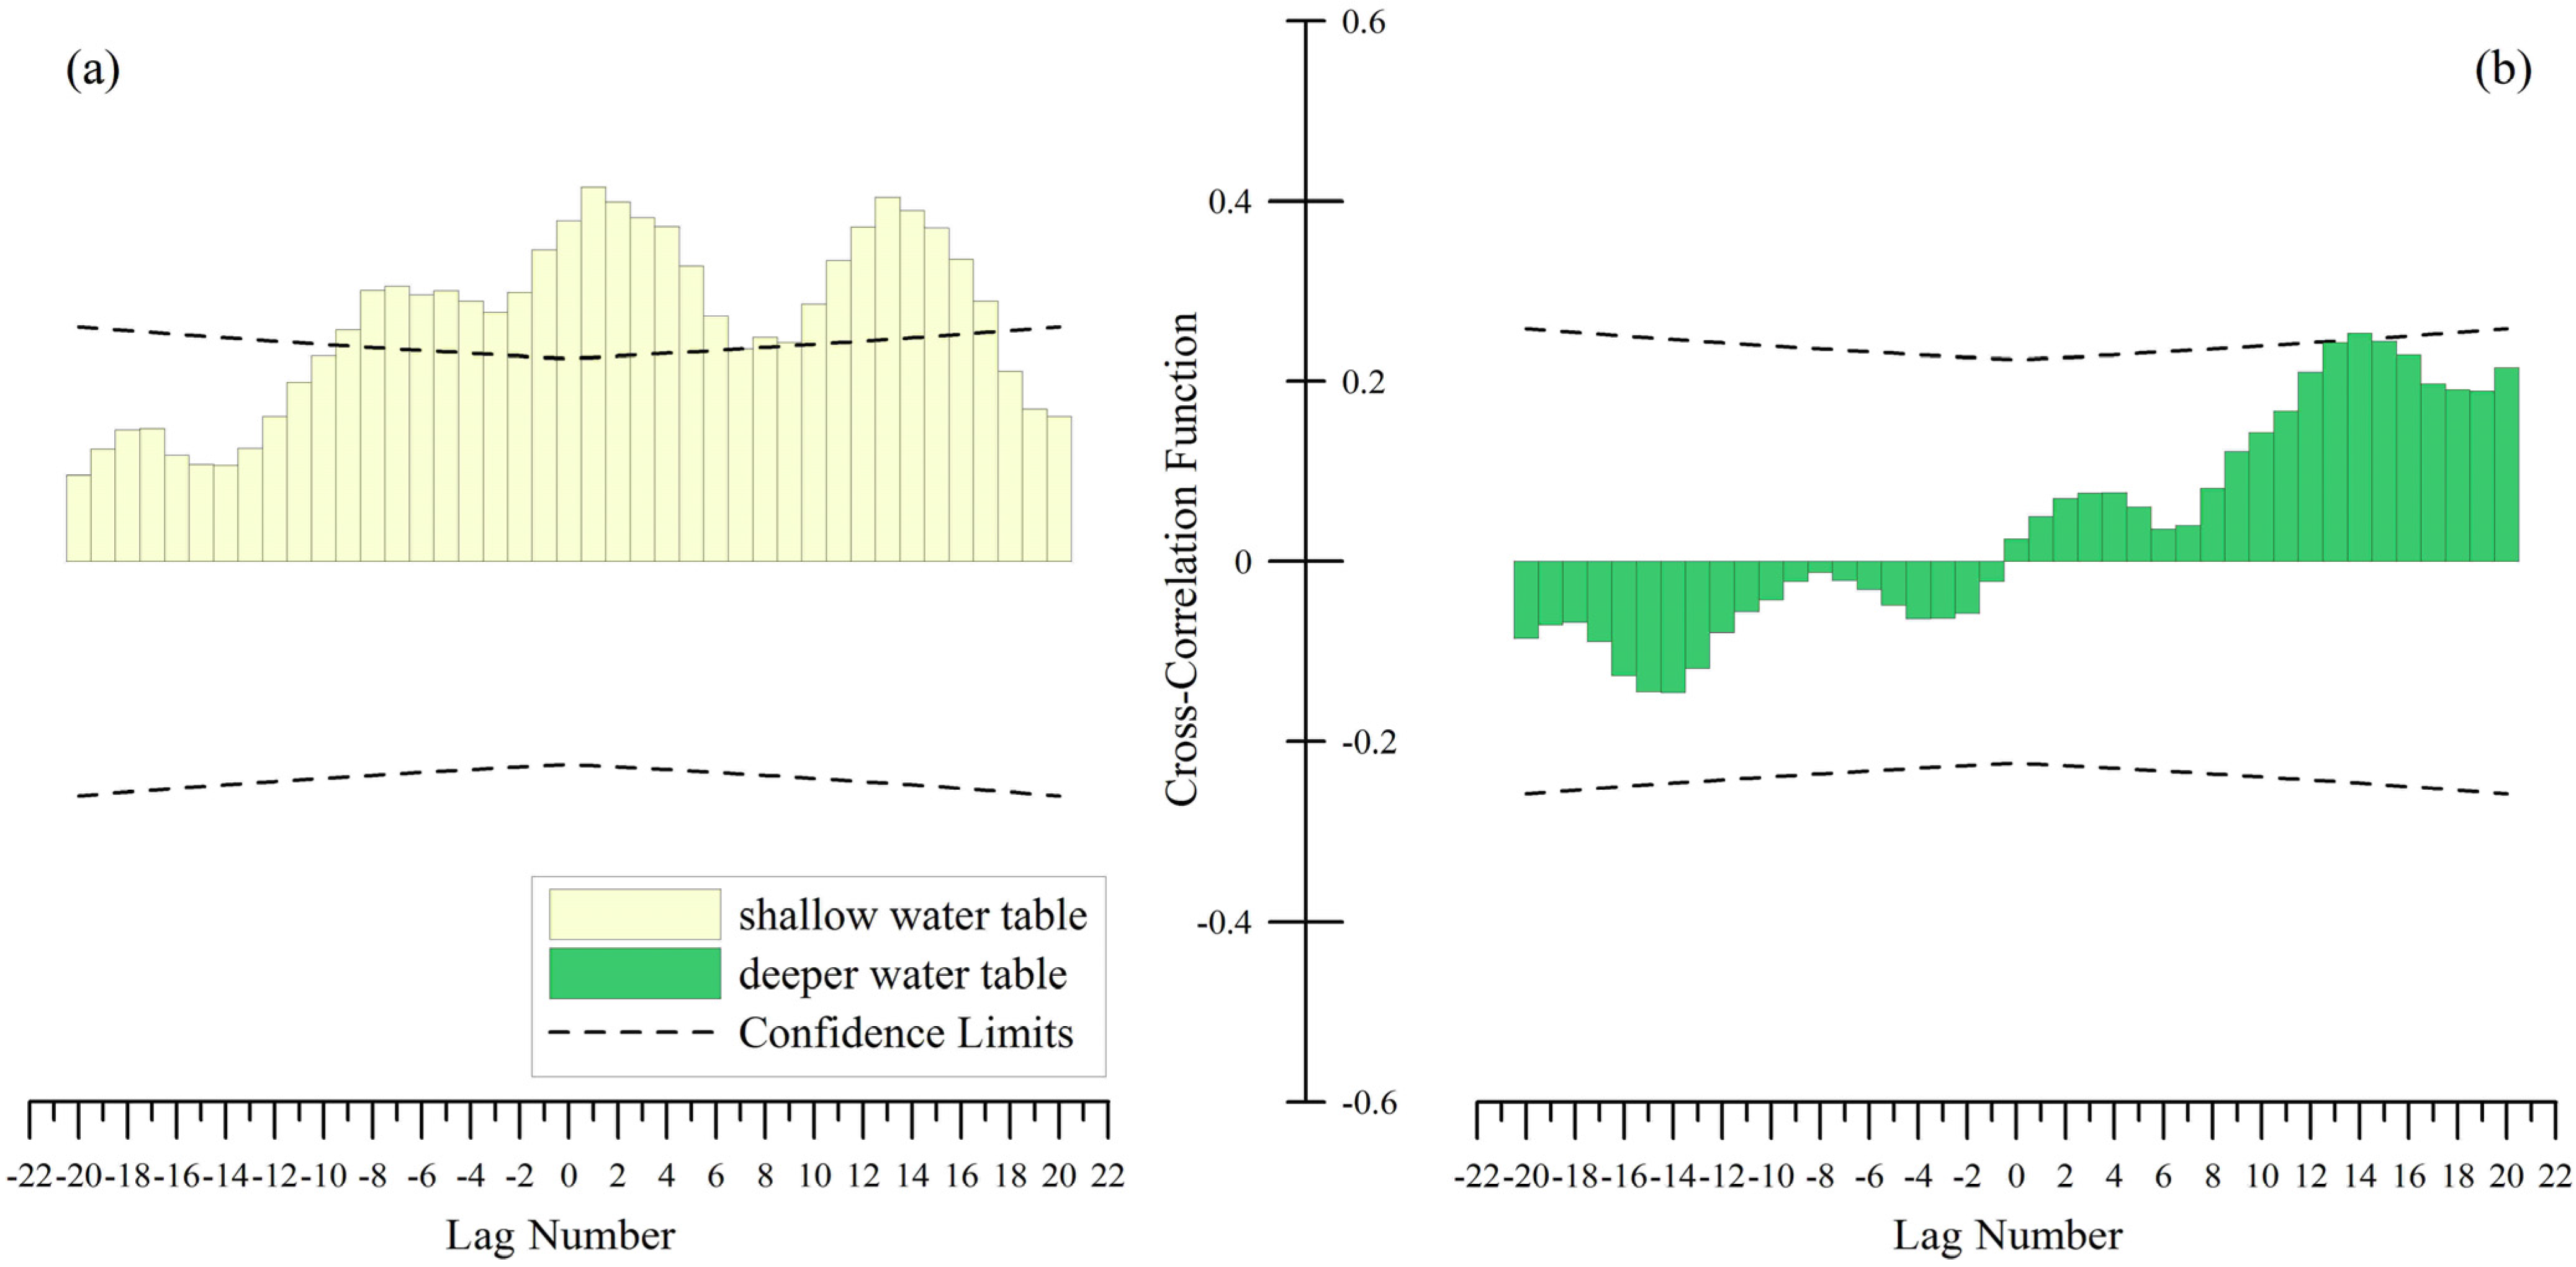
Figure 13). The phenomenon indicates effective aquifer recharge is able to mitigate the subsidence, and also produces an interesting question: what is the time lag between water table change and surface subsidence. Therefore, this study utilizes the cross-correlation scheme to examine the time lag between Tuku aquifers 1, 4 water table changes and Tuku GPS vertical movement. The deeper water table changes (aquifer 4) show a less cross-correlation with surface change, but the shallow water table changes (aquifer 1) exhibit a positive cross-correlation (0.415) with surface change by a time lag of around 7 days (
Figure 14). These results demonstrate that a rapid surface subsidence or uplift is mainly affected by shallow water table changes.
Figure 13.
The water table and precipitation data in Tuku well station from 1 November 2007 to 1 November 2013. The lower curve is monthly precipitation and the other 3 curves are water table above sea level in different aquifers (F1, F3, and F4 see
Figure 3). In addition, the color curves represent the wet season and the numbers close to the color curves are the mean value.
Figure 14.
The cross correlation between shallow (a) or deeper (b) water table changes and Tuku GPS vertical movement. The results show the shallow water table changes and GPS vertical movement have highest coefficient 0.415 in the first week (lag number is 1), indicating that the ground water recharge occurs in the shallow water table and after 7 days vertical movement may be observed. On the other hand, the cross correlation between deeper water table changes and Tuku GPS vertical movement is rather weak.
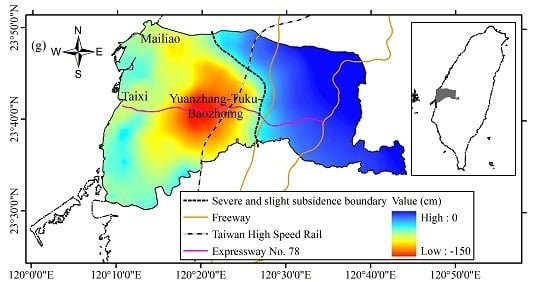
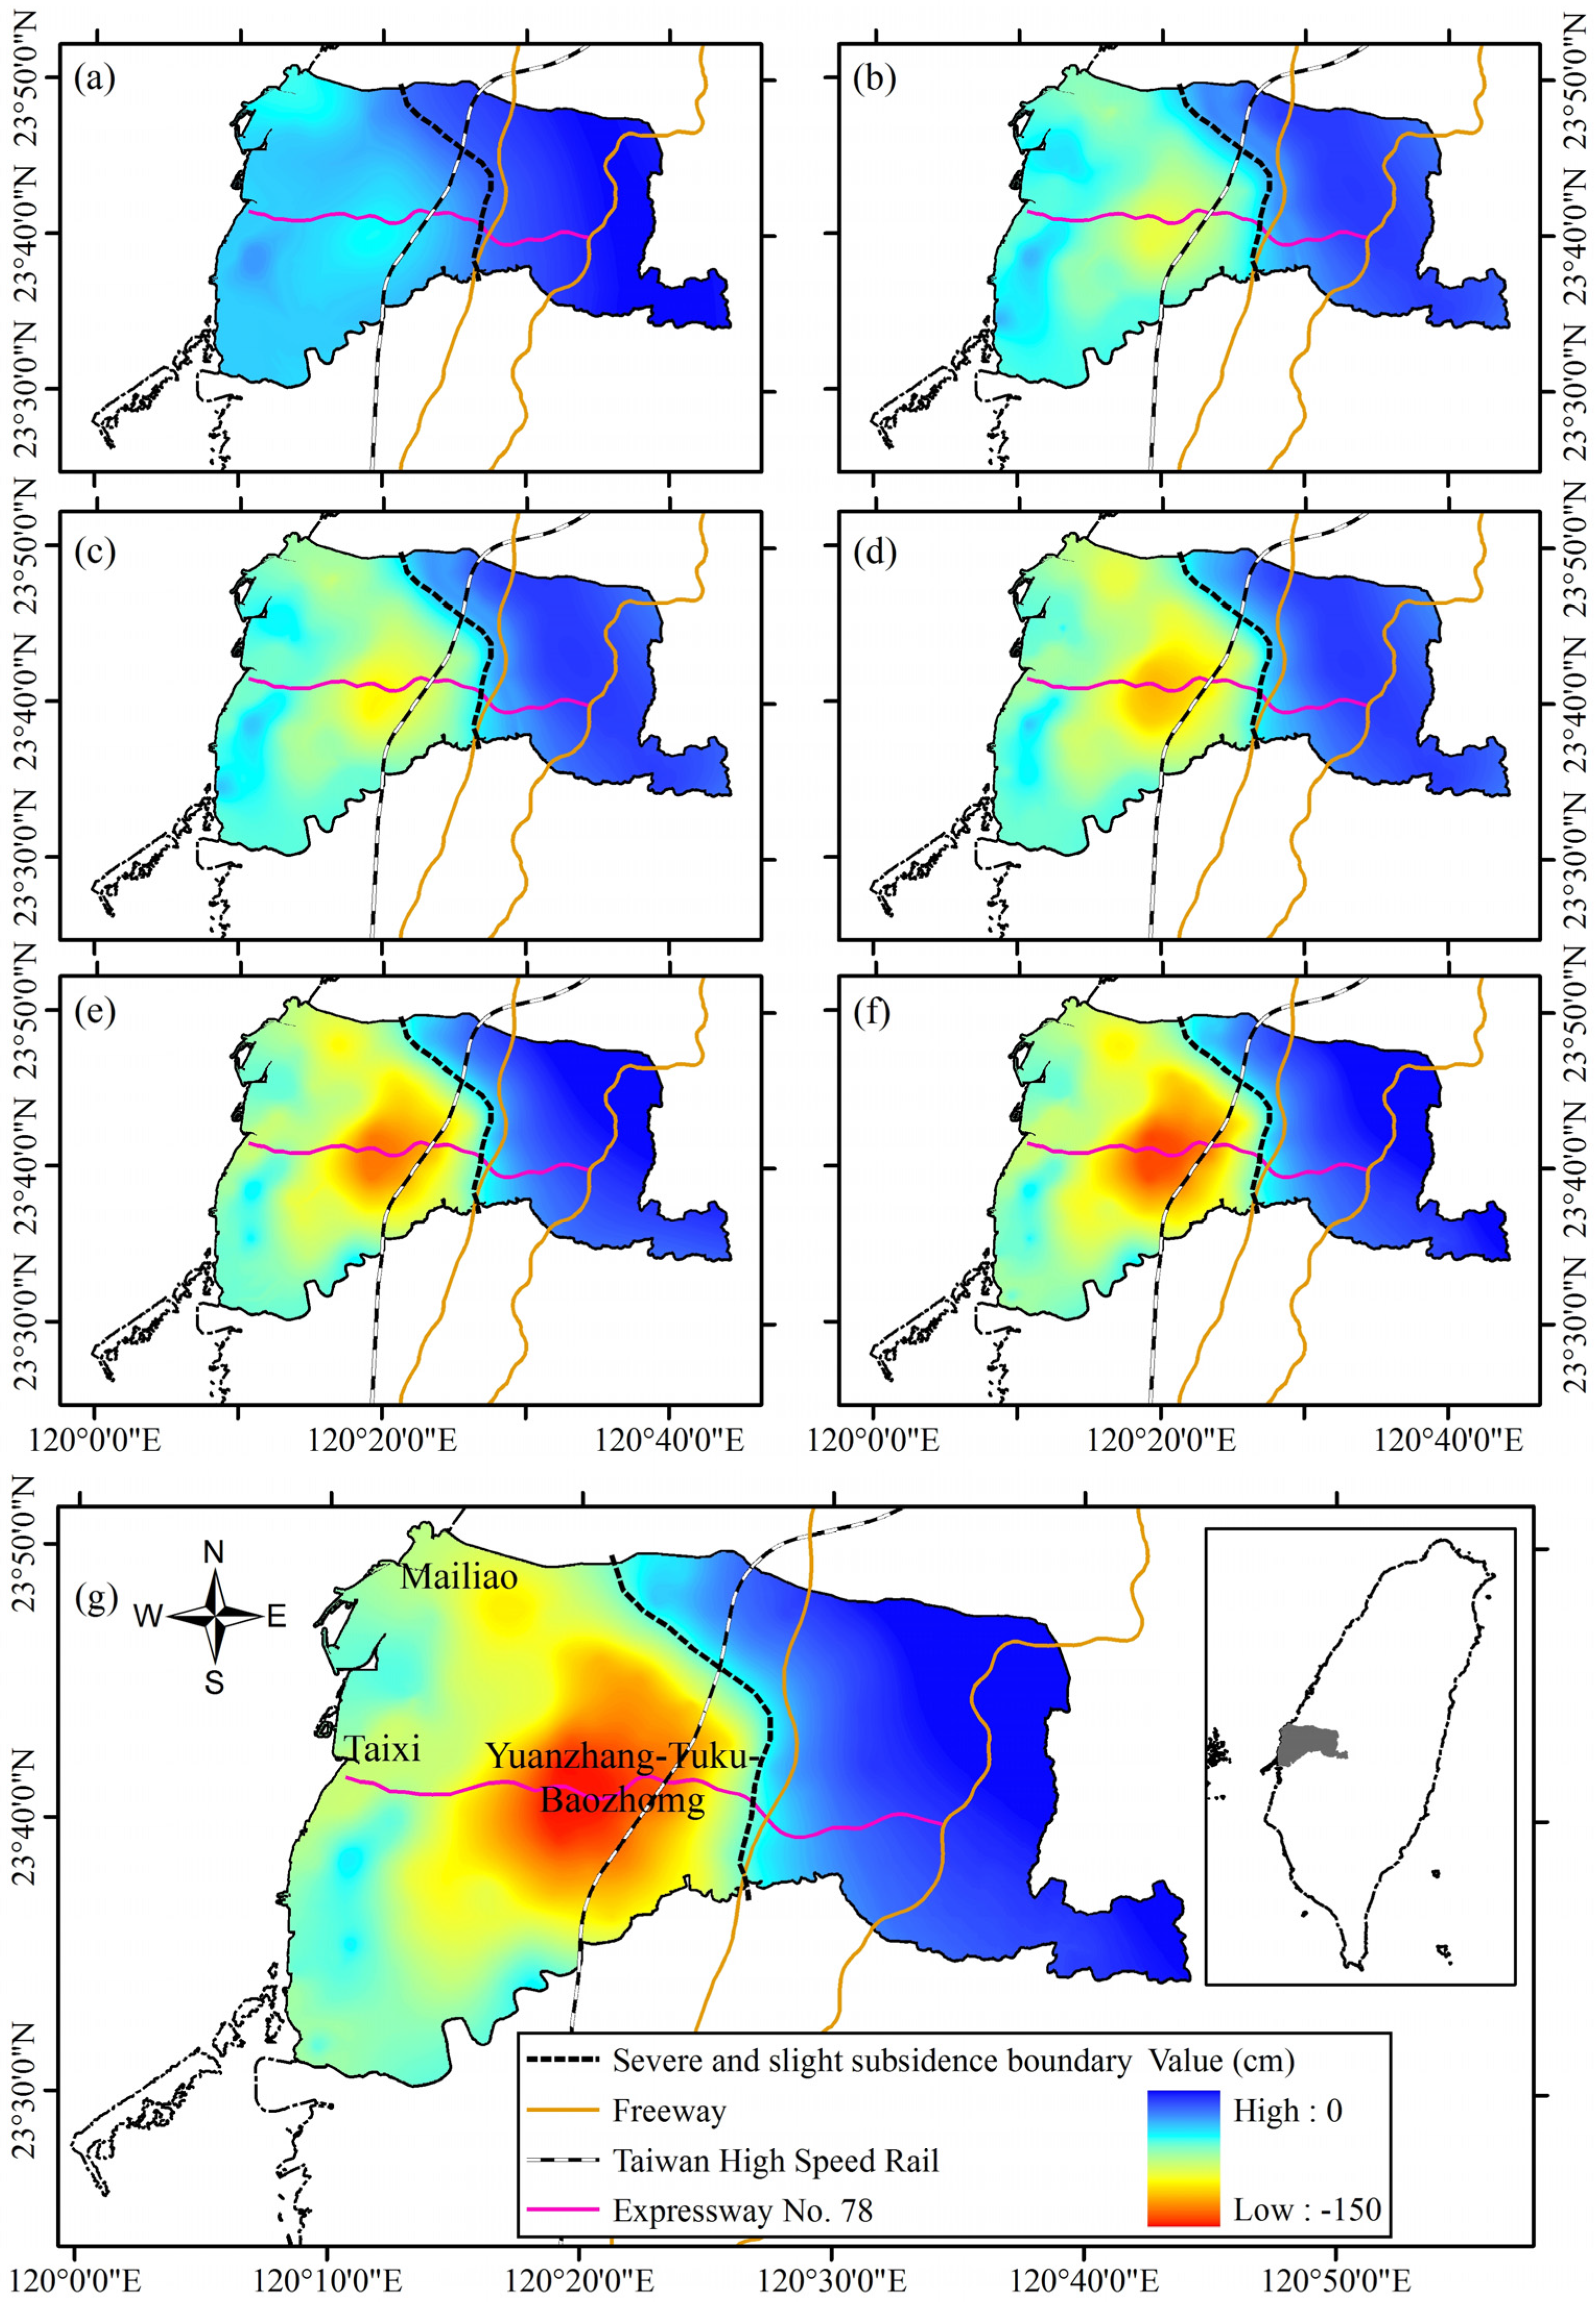
According to the leveling and GPS survey results, the study area was divided into three subareas: severe subsidence appeared in the center of the study area, moderate subsidence occurred along the coastal area, and slight subsidence existed in the western foothills. According to the long-term survey, the subsidence that occurred in the coastal and central regions of the study area moved toward the east and became severe, a clear boundary demarcated it from the slight subsidence area (dash line in
Figure 7). The subsidence rate of the boundary gradually increased over time, whereas the shape of the boundary remained constant, indicating that the boundary reflected the composition of subsurface sediments. According to Central Geological Survey, Ministry of Economic Affairs report [
12], the sediments in the study area, from east to west, consisted of gravel, sand, and mud. When groundwater is pumped, the compaction of mud is greater than that of sand and gravel. This study employed a multisensor approach for monitoring land subsidence in Yunlin County. The results showed that land subsidence did not occur uniformly, reflecting the composition of subsurface sediments.
In addition, it is found that the vertical movement of PS-InSAR was consistent with leveling result. By subtracting the interpolated leveling results from PS-InSAR measurements, the effect of horizontal motion, which has an important implication on the behavior of the subsurface aquifer system, can be addressed [
20]. However, the horizontal motion is much smaller than the vertical motion in the area of concern. Besides, it has been reported that the vectors of horizontal deformation occur in the same direction with a similar deformation velocity in the study area [
19]. This means that the relative horizontal motion approaches zero, while the LOS deformation is converted to vertical deformation, and the effects of horizontal deformation can be ignored. Thus, the horizontal motion is not further discussed in the current work.
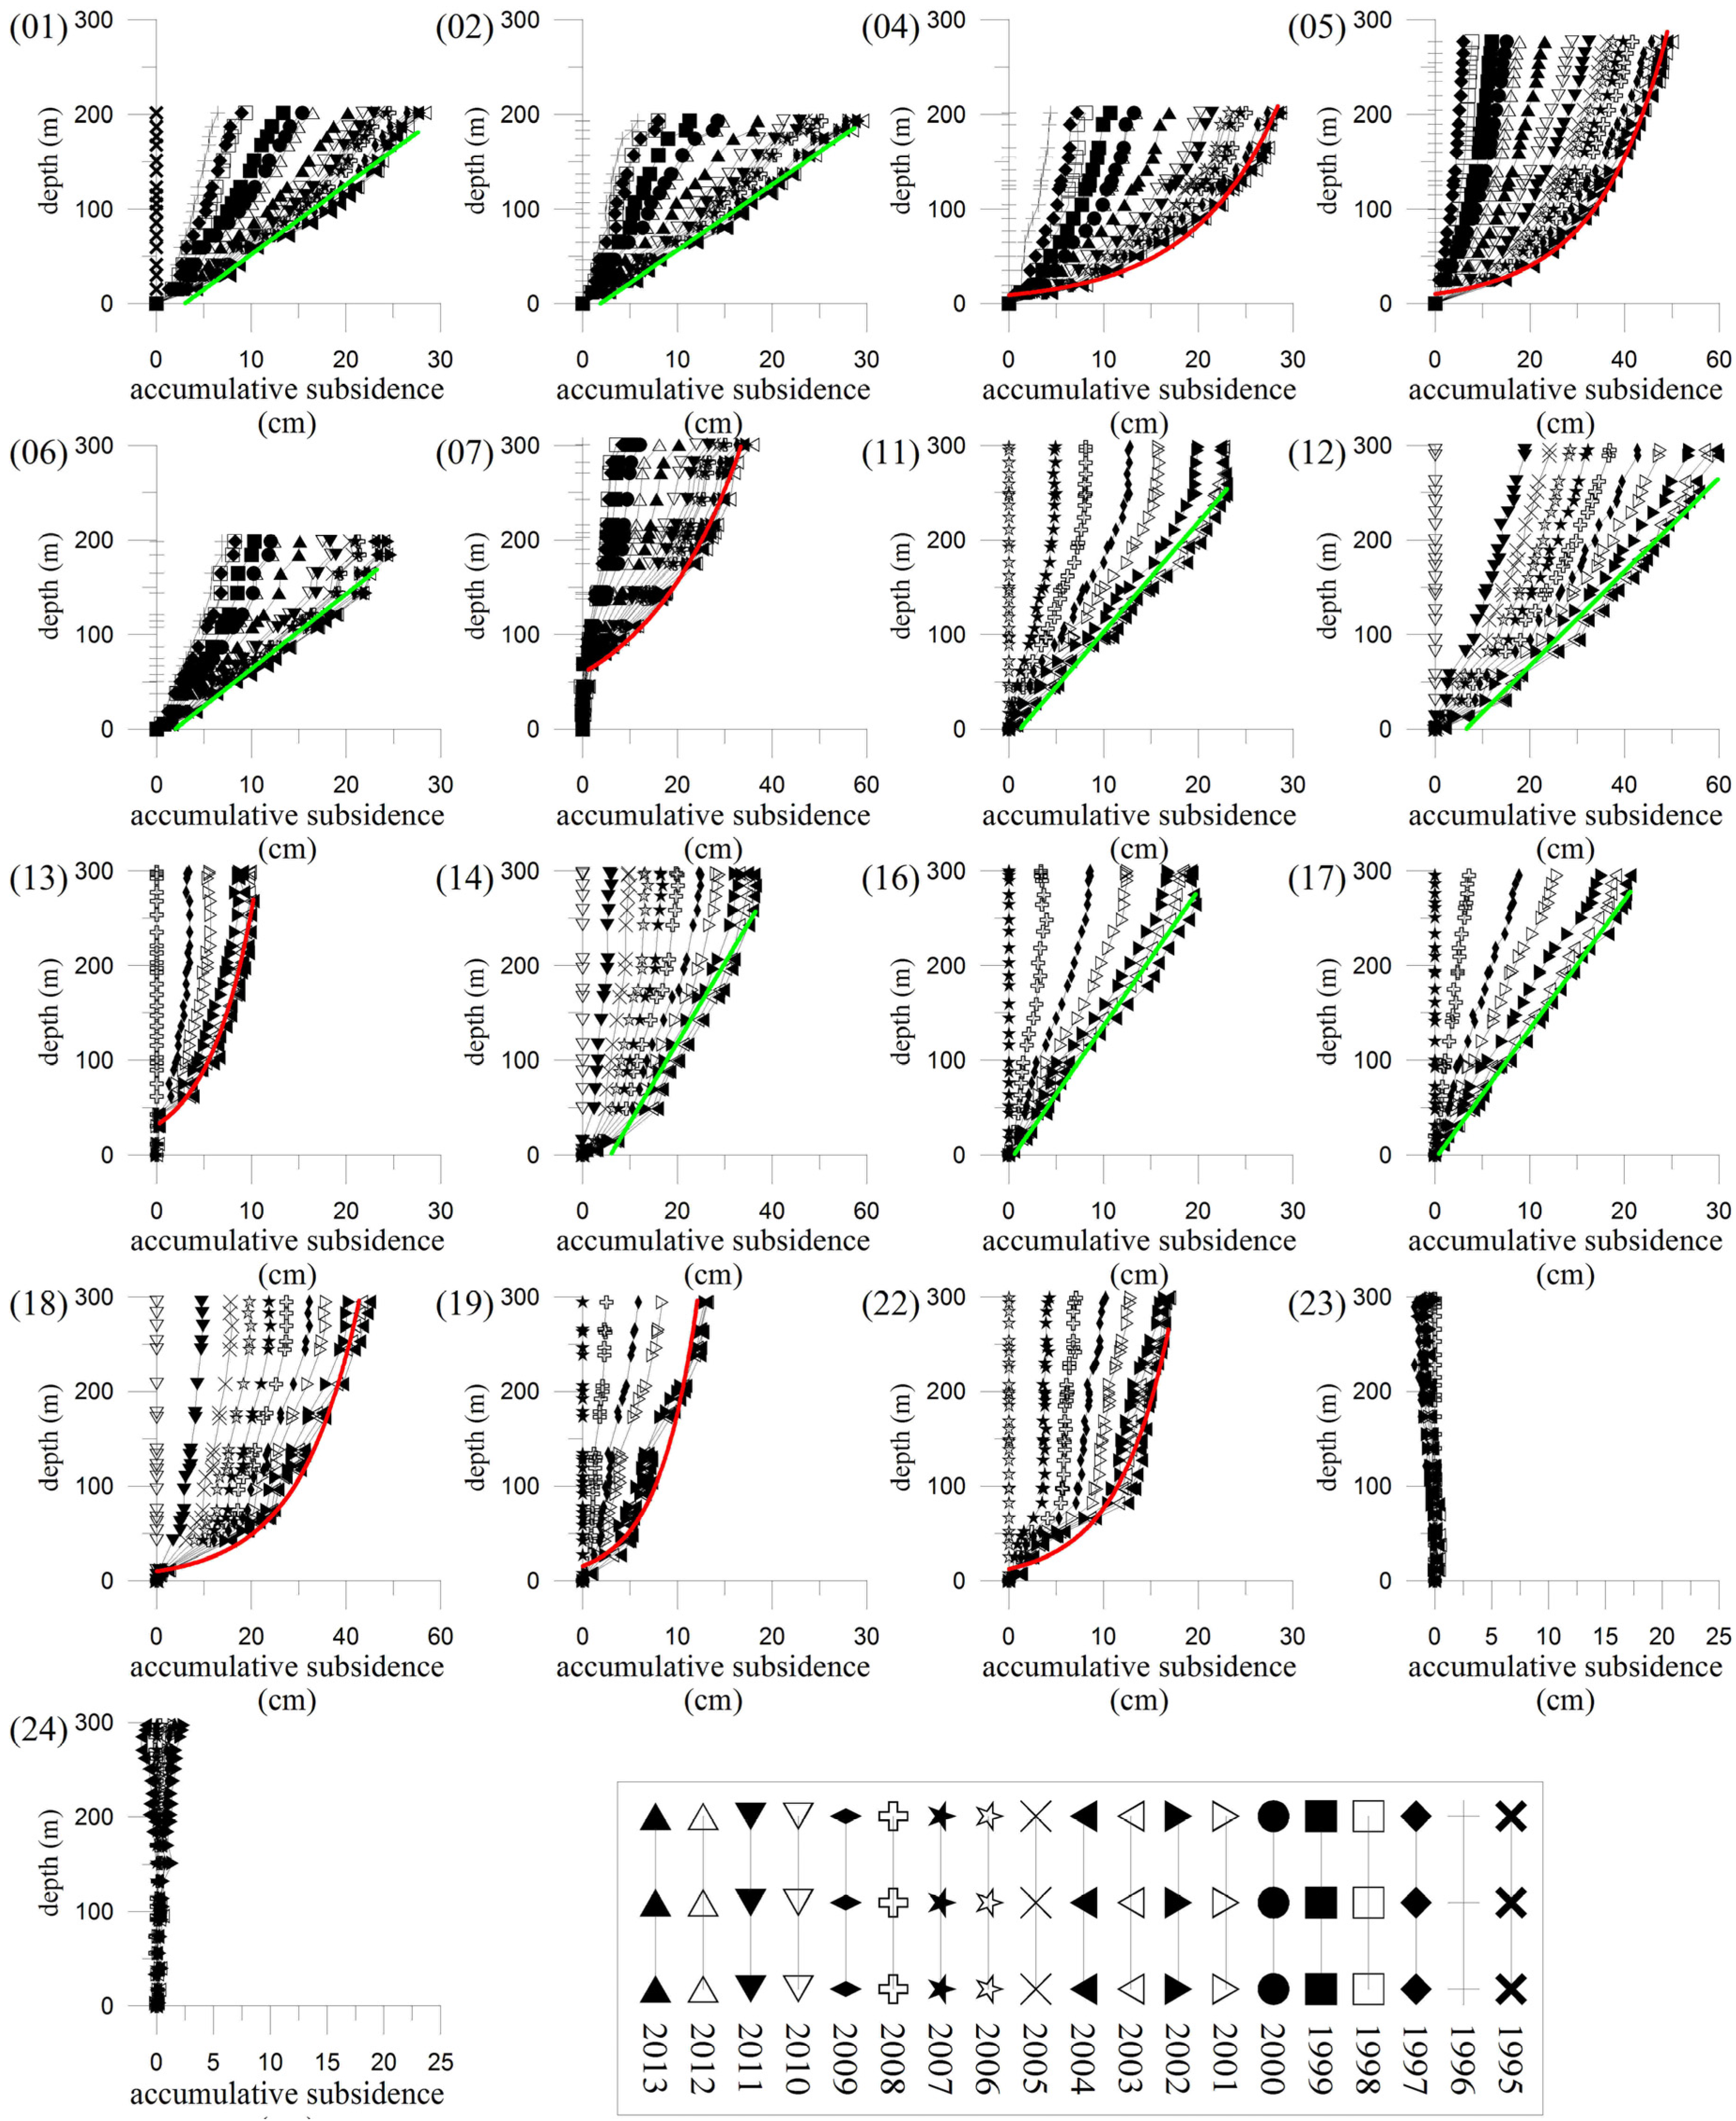
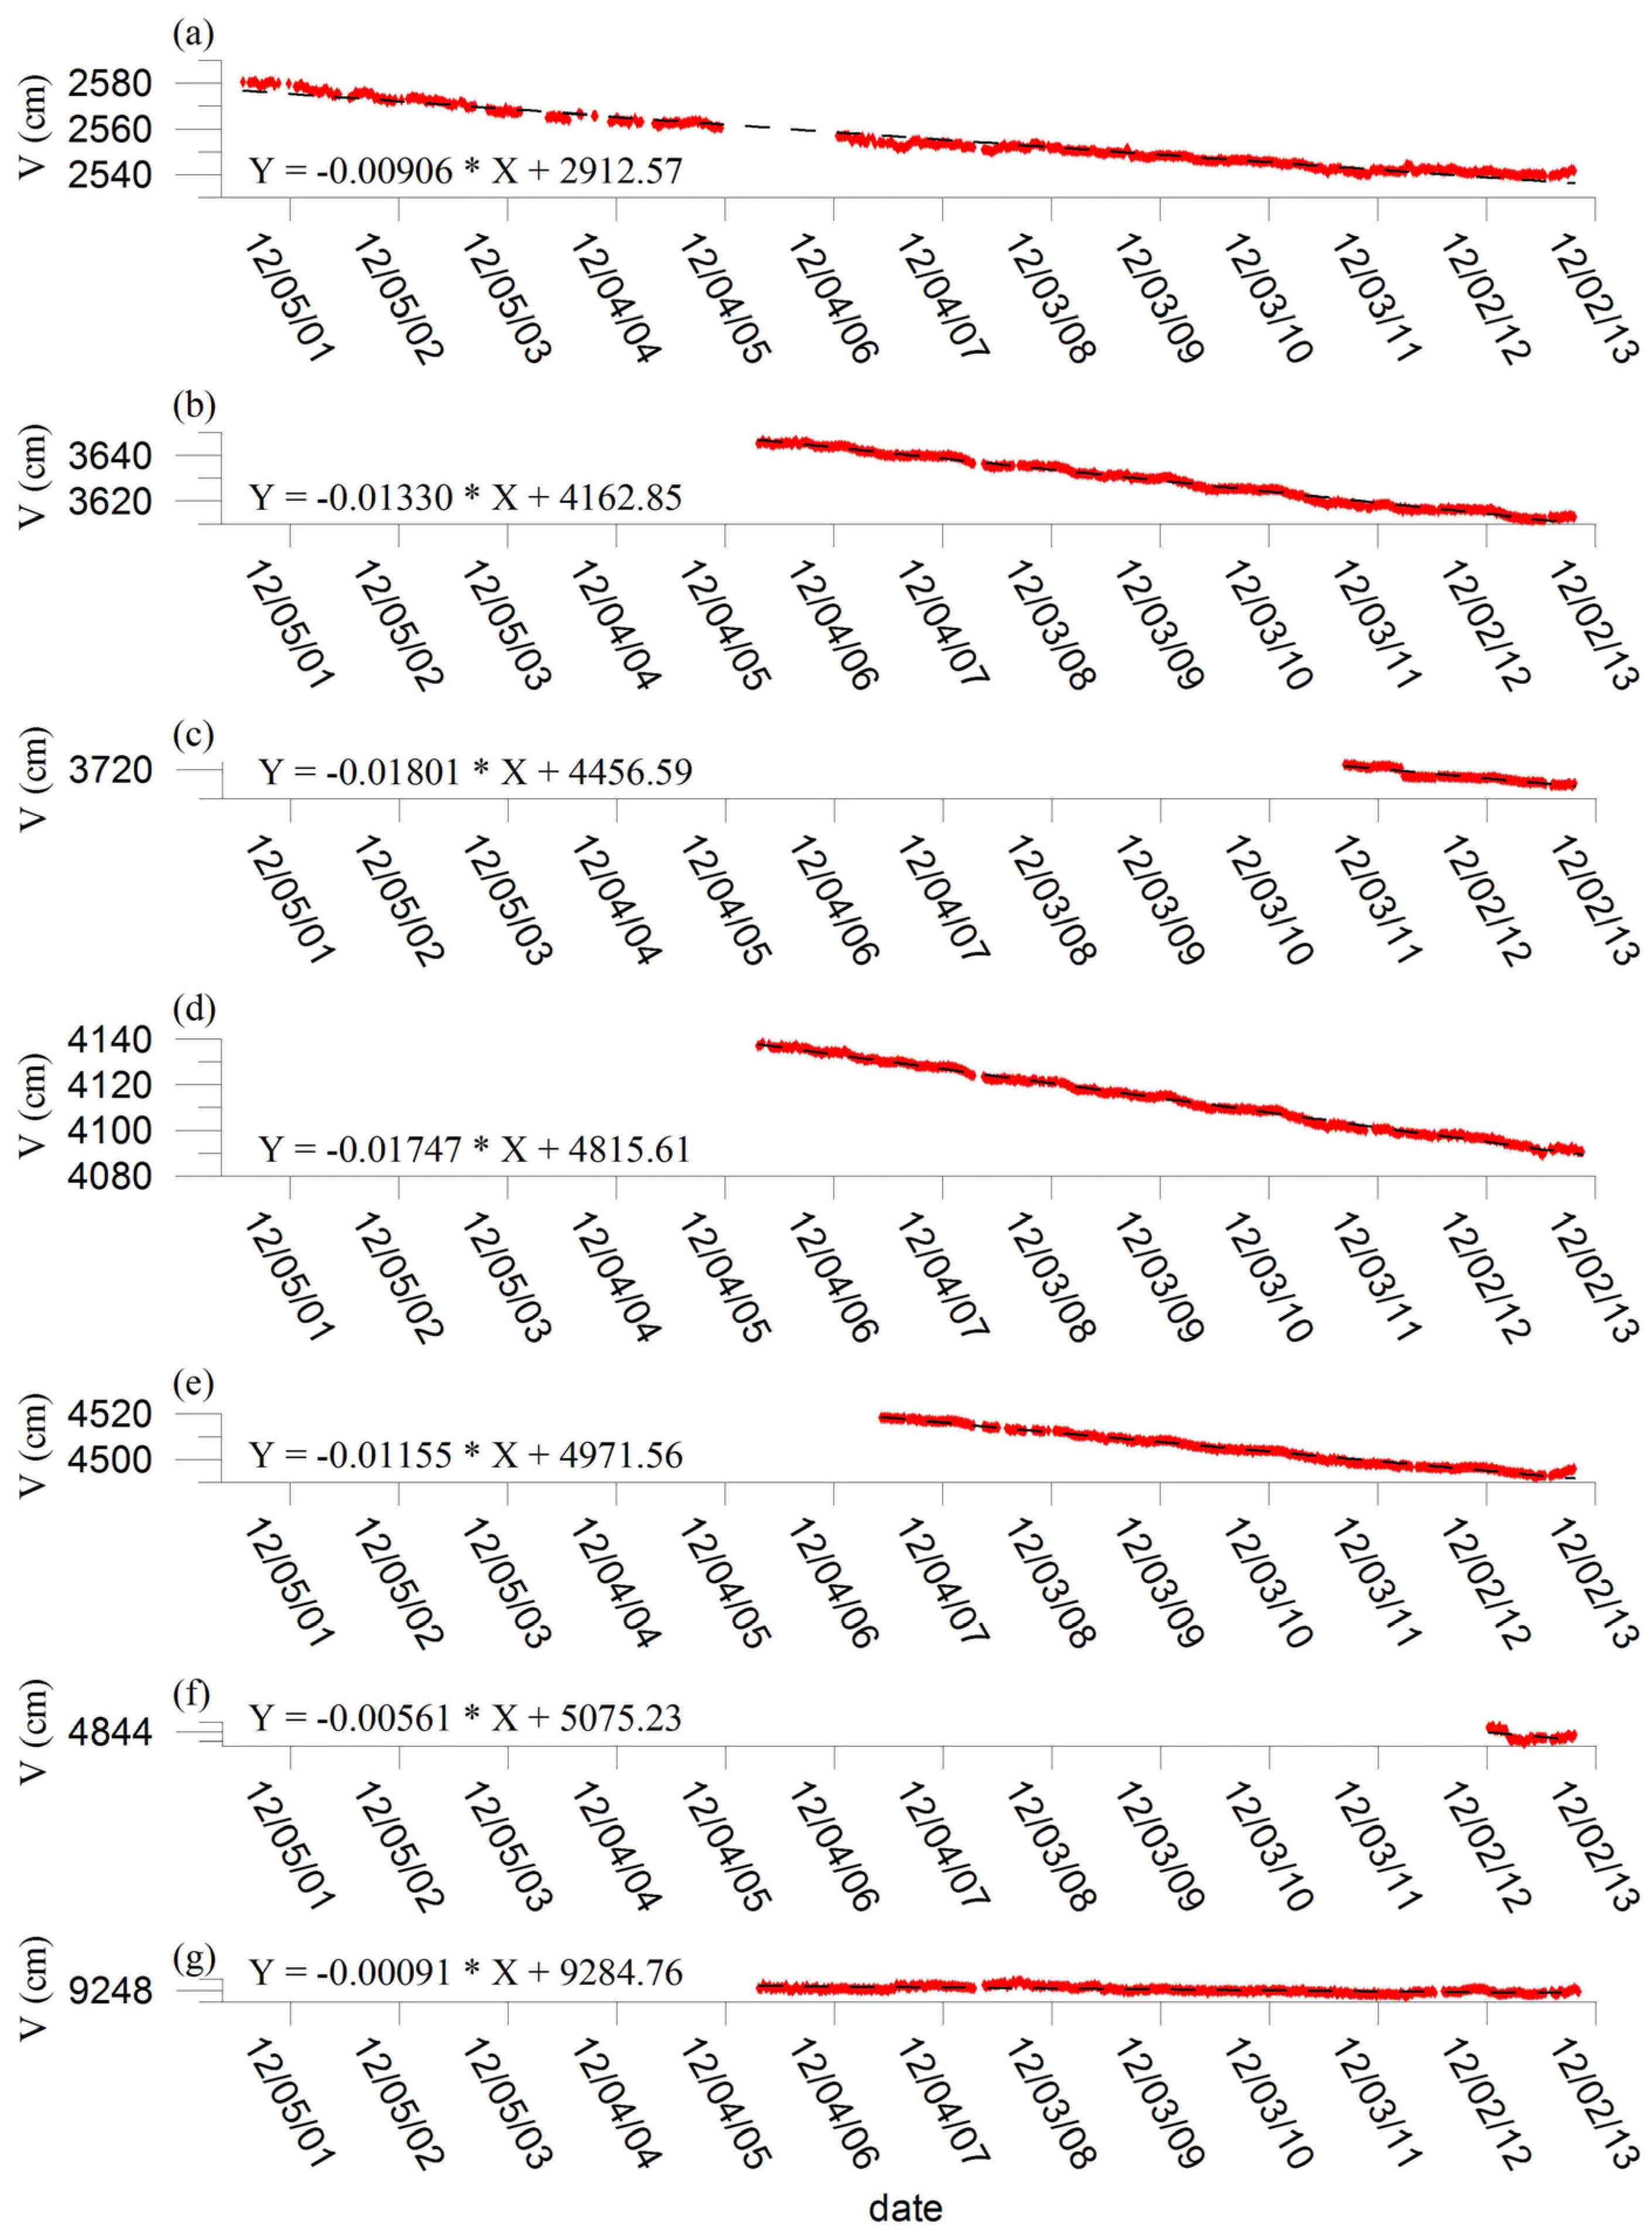
The fitting line of the layer compaction value indicates that deep soil compaction occurred in the northwest (Wells 4, 5, 7, and 13) and center (Wells 18, 19, and 22) of the study area. These deep soil compaction areas exhibited a high correlation with severe subsidence, indicating that severe subsidence is caused by deep soil compaction and reflects the composition of subsurface sediments, compaction of subsurface soils, over-pumping of groundwater from deep soils, and deep soil compaction.
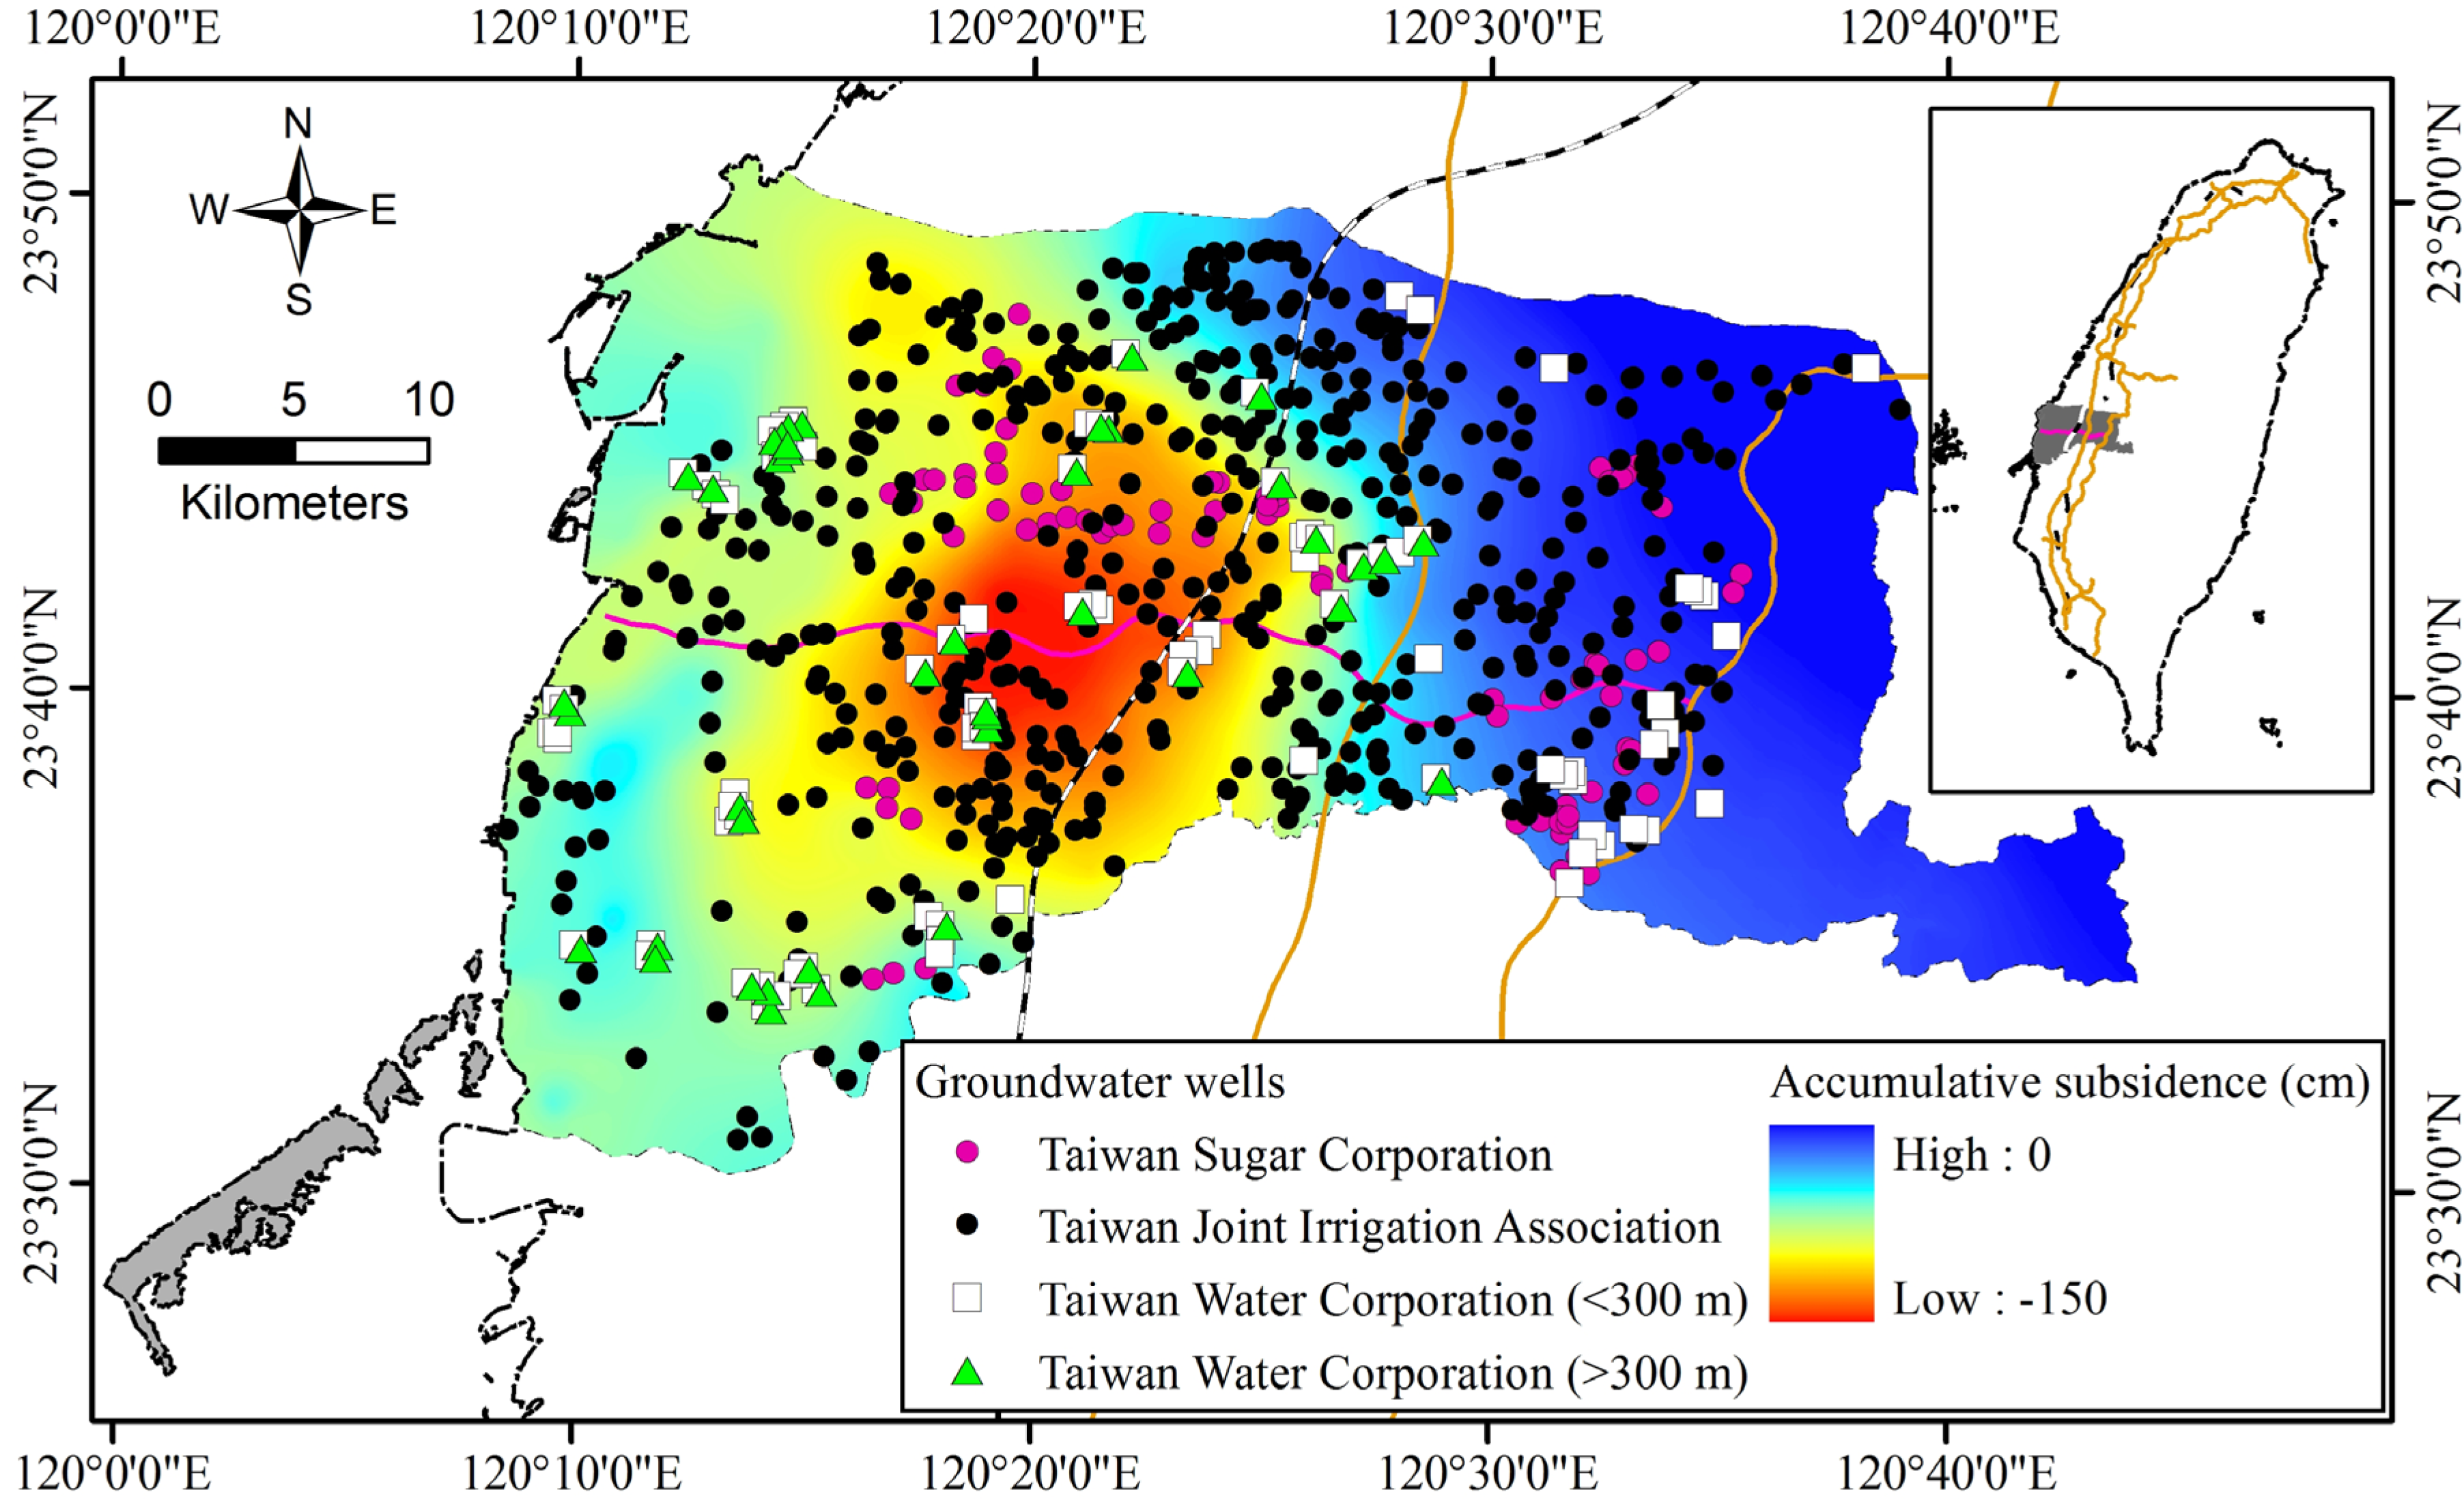
According to the groundwater well and land subsidence distributions (
Figure 15), the severe subsidence areas did not exhibit any relationship with whole groundwater wells, but a slight correlation with wells deeper than 300 m. According to the leveling, monitoring well, and hydrogeology analysis results, severe subsidence was probably caused by deep groundwater well pumping and reflected the composition of subsurface sediments.
Figure 15.
Groundwater well distribution and accumulative subsidence in the study area from 1992 to 2013. The groundwater well locations were adapted from [
21].
Figure 15.
Groundwater well distribution and accumulative subsidence in the study area from 1992 to 2013. The groundwater well locations were adapted from [
21].
6. Conclusions
This study involved integrating leveling surveys, continuous GPS stations, monitoring wells, and PS-InSAR to monitor a severe land subsidence area in Yunlin County, Taiwan. The results indicated that a severe subsidence area (7.1 cm/y) was located in the center of the study area, a moderate subsidence area was along the coast (2.3 cm/y), and a slight subsidence area (~0 cm/y) was in the western foothills.
Precipitation substantially affects land subsidence. The shallow water table changes show a high relationship with precipitation, indicating the deeper deep soil compaction is one of the main factors that influence the subsidence.
According to the fitting of the soil compaction values recorded by monitoring wells, groundwater well and land subsidence distributions, this paper proposes that deep soil compaction caused severe land subsidence. The land subsidence is relevant to the composition of subsurface sediments and deep groundwater wells.
Base on the result of a multisensor survey, this study tries to figure out the main factors that influence the distribution of subsidence. Subsidence occurred in west Taiwan, causing many environmental problems and especially affecting the Taiwan High Speed Rail’s traffic safety. This study hopes the results will help the government to provide a solution to mitigate the subsidence.


