Article

Potential of VIS-NIR-SWIR Spectroscopy from the Chinese Soil Spectral Library for Assessment of Nitrogen Fertilization Rates in the Paddy-Rice Region, China

1
Institute of Applied Remote Sensing and Information Technology, College of Environmental and Resource Sciences, Zhejiang University, Hangzhou 310058, China
2
Cyrus Tang Center for Sensor Materials and Application, Zhejiang University, Hangzhou, 310058, China
*
Author to whom correspondence should be addressed.
Remote Sens. 2015, 7(6), 7029-7043; https://doi.org/10.3390/rs70607029
Submission received: 14 March 2015 / Accepted: 15 May 2015 / Published: 29 May 2015
(This article belongs to the Special Issue Field Spectroscopy and Radiometry)

Abstract

:
To meet growing food demand with limited land and reduced environmental impact, soil testing and formulated fertilization methods have been widely adopted around the world. However, conventional technology for investigating nitrogen fertilization rates (NFR) is time consuming and expensive. Here, we evaluated the use of visible near-infrared shortwave-infrared (VIS-NIR-SWIR: 400–2500 nm) spectroscopy for the assessment of NFR to provide necessary information for fast, cost-effective and precise fertilization rating. Over 2000 samples were collected from paddy-rice fields in 10 Chinese provinces; samples were added to the Chinese Soil Spectral Library (CSSL). Two kinds of modeling strategies for NFR, quantitative estimation of soil N prior to classification and qualitative by classification, were employed using partial least squares regression (PLSR), locally weighted regression (LWR), and support vector machine discriminant analogy (SVMDA). Overall, both LWR and SVMDA had moderate accuracies with Cohen’s kappa coefficients of 0.47 and 0.48, respectively, while PLSR had fair accuracy (0.37). We conclude that VIS-NIR-SWIR spectroscopy coupled with the CSSL appears to be a viable, rapid means for the assessment of NFR in paddy-rice soil. Based on qualitative classification of soil spectral data only, it is recommended that the SVMDA be adopted for rapid implementation.

Graphical Abstract

1. Introduction

Nitrogen (N) is an essential nutrient required for crops and a basic resource for maintaining the Earth’s ecosystems. Considering the challenges associated with feeding >20% of the world’s population (approximately 1.3 billion) with only 9% of the world’s arable land, yields must be increased to keep up with growing demands associated with a rapidly growing human population. According to statistics from the FAO [1] there were 150.8 million of people undernourished in China from 2012 to 2014. Among existing agricultural practices, the application of N fertilizer has gained increasing popularity, and has played a major role in significantly increasing crop yield, especially in intensive paddy-rice systems [2]. This is because rice, which grows under flooded low-land conditions in paddies, is a key staple food for daily consumption in China, making up about 43.7% of the total national grain production [3].
China is a dominant force in the international N fertilizer market, consuming about 18% (approximately 190 kg∙ha−1) of global N fertilizer applied to paddy-rice, which is 90% greater than the global average [4]. However, less than half is taken up by crops, while the rest is lost to the environment in gaseous (NH3, NO, N2O, and N2) or dissolved (NH4+ and NO3−) forms [5,6]. This has led to adverse impacts on the environment, including loss of biodiversity [7], eutrophication [8], and soil acidification [9]. Thus, N fertilizer is one of the most environmentally sensitive factors in rice production. The determination of appropriate N fertilization rate (NFR) will lead to greater profitability of crops and sustainability of the environment [10]. Therefore, there is an increasing requirement for the study of NFR in paddy-rice fields.
Over the past decades, researchers have attempted to develop reliable methods to estimate optimal NFR to solve the economic and environmental problems associated with the over-application of N. Soil testing and formulated fertilization technology is a scientific fertilization technology widely adopted in China and around the world. It can be used to determine soil nutrient status, balance soil N levels, maintain soil fertility, decrease nutrient loss, and reduce environmental pollution [11,12]. However, routine soil testing is often both time- and labor-intensive. In order to enhance or complement the conventional laboratory techniques used for quantitative soil information, exploring a more time- and cost-effective method is of vital importance.
Instead of the complex chemical and physical analyses involved in routine soil testing, visible (VIS: 400–700 nm), near-infrared (NIR: 700–1100 nm), and shortwave-infrared (SWIR: 1100–2500 nm) spectroscopy has been suggested as a useful, rapid, and inexpensive tool for estimating the concentration of N in soil [13,14]. Over the past 10 years, with the goal of taking full advantage of the VIS-NIR-SWIR spectroscopy technique to measure soil properties of targeted samples more efficiently, soil spectral libraries including larger and more geographically diverse soils with their corresponding spectra have been established. These libraries consist of soil spectra and corresponding laboratory analytical data, which can be used to develop calibration models for the prediction of soil properties in a local field by using spectra only. Several of such databases exist today, such as those described by Shepherd and Walsh [15], Brown et al. [16], Sankey et al. [17], Knadel et al. [18], Viscarra Rossel and Webster [19], Stevens et al. [20], Shi et al. [21], and Gogé et al. [22]. Among physical and chemical soil properties, soil N, organic carbon (C), clay content, pH, and cation-exchange capacity (CEC) have been reported to be the most successfully predicted with moderate or better accuracies using different multivariate calibration methods. However, it remains unknown whether the large VIS-NIR-SWIR spectral database can be applied to the development of recommendations for NFR.
As one of the major rice producers, China has a large area of paddy fields, mainly in northeast and southeast China (e.g., southern part of the Qinling-Huai River, the Yangtze River Delta, and the Three-River Plain). Therefore, accurate characterization of the spatial variability of soil N is essential for informed decision-making, sustainable development of rice production, and rural ecological-environment protection. Here, the objective of this study was to examine the feasibility of using VIS-NIR-SWIR to guide the development of NFR recommendations based on the Chinese Soil Spectral Library (CSSL).

2. Materials and Methods

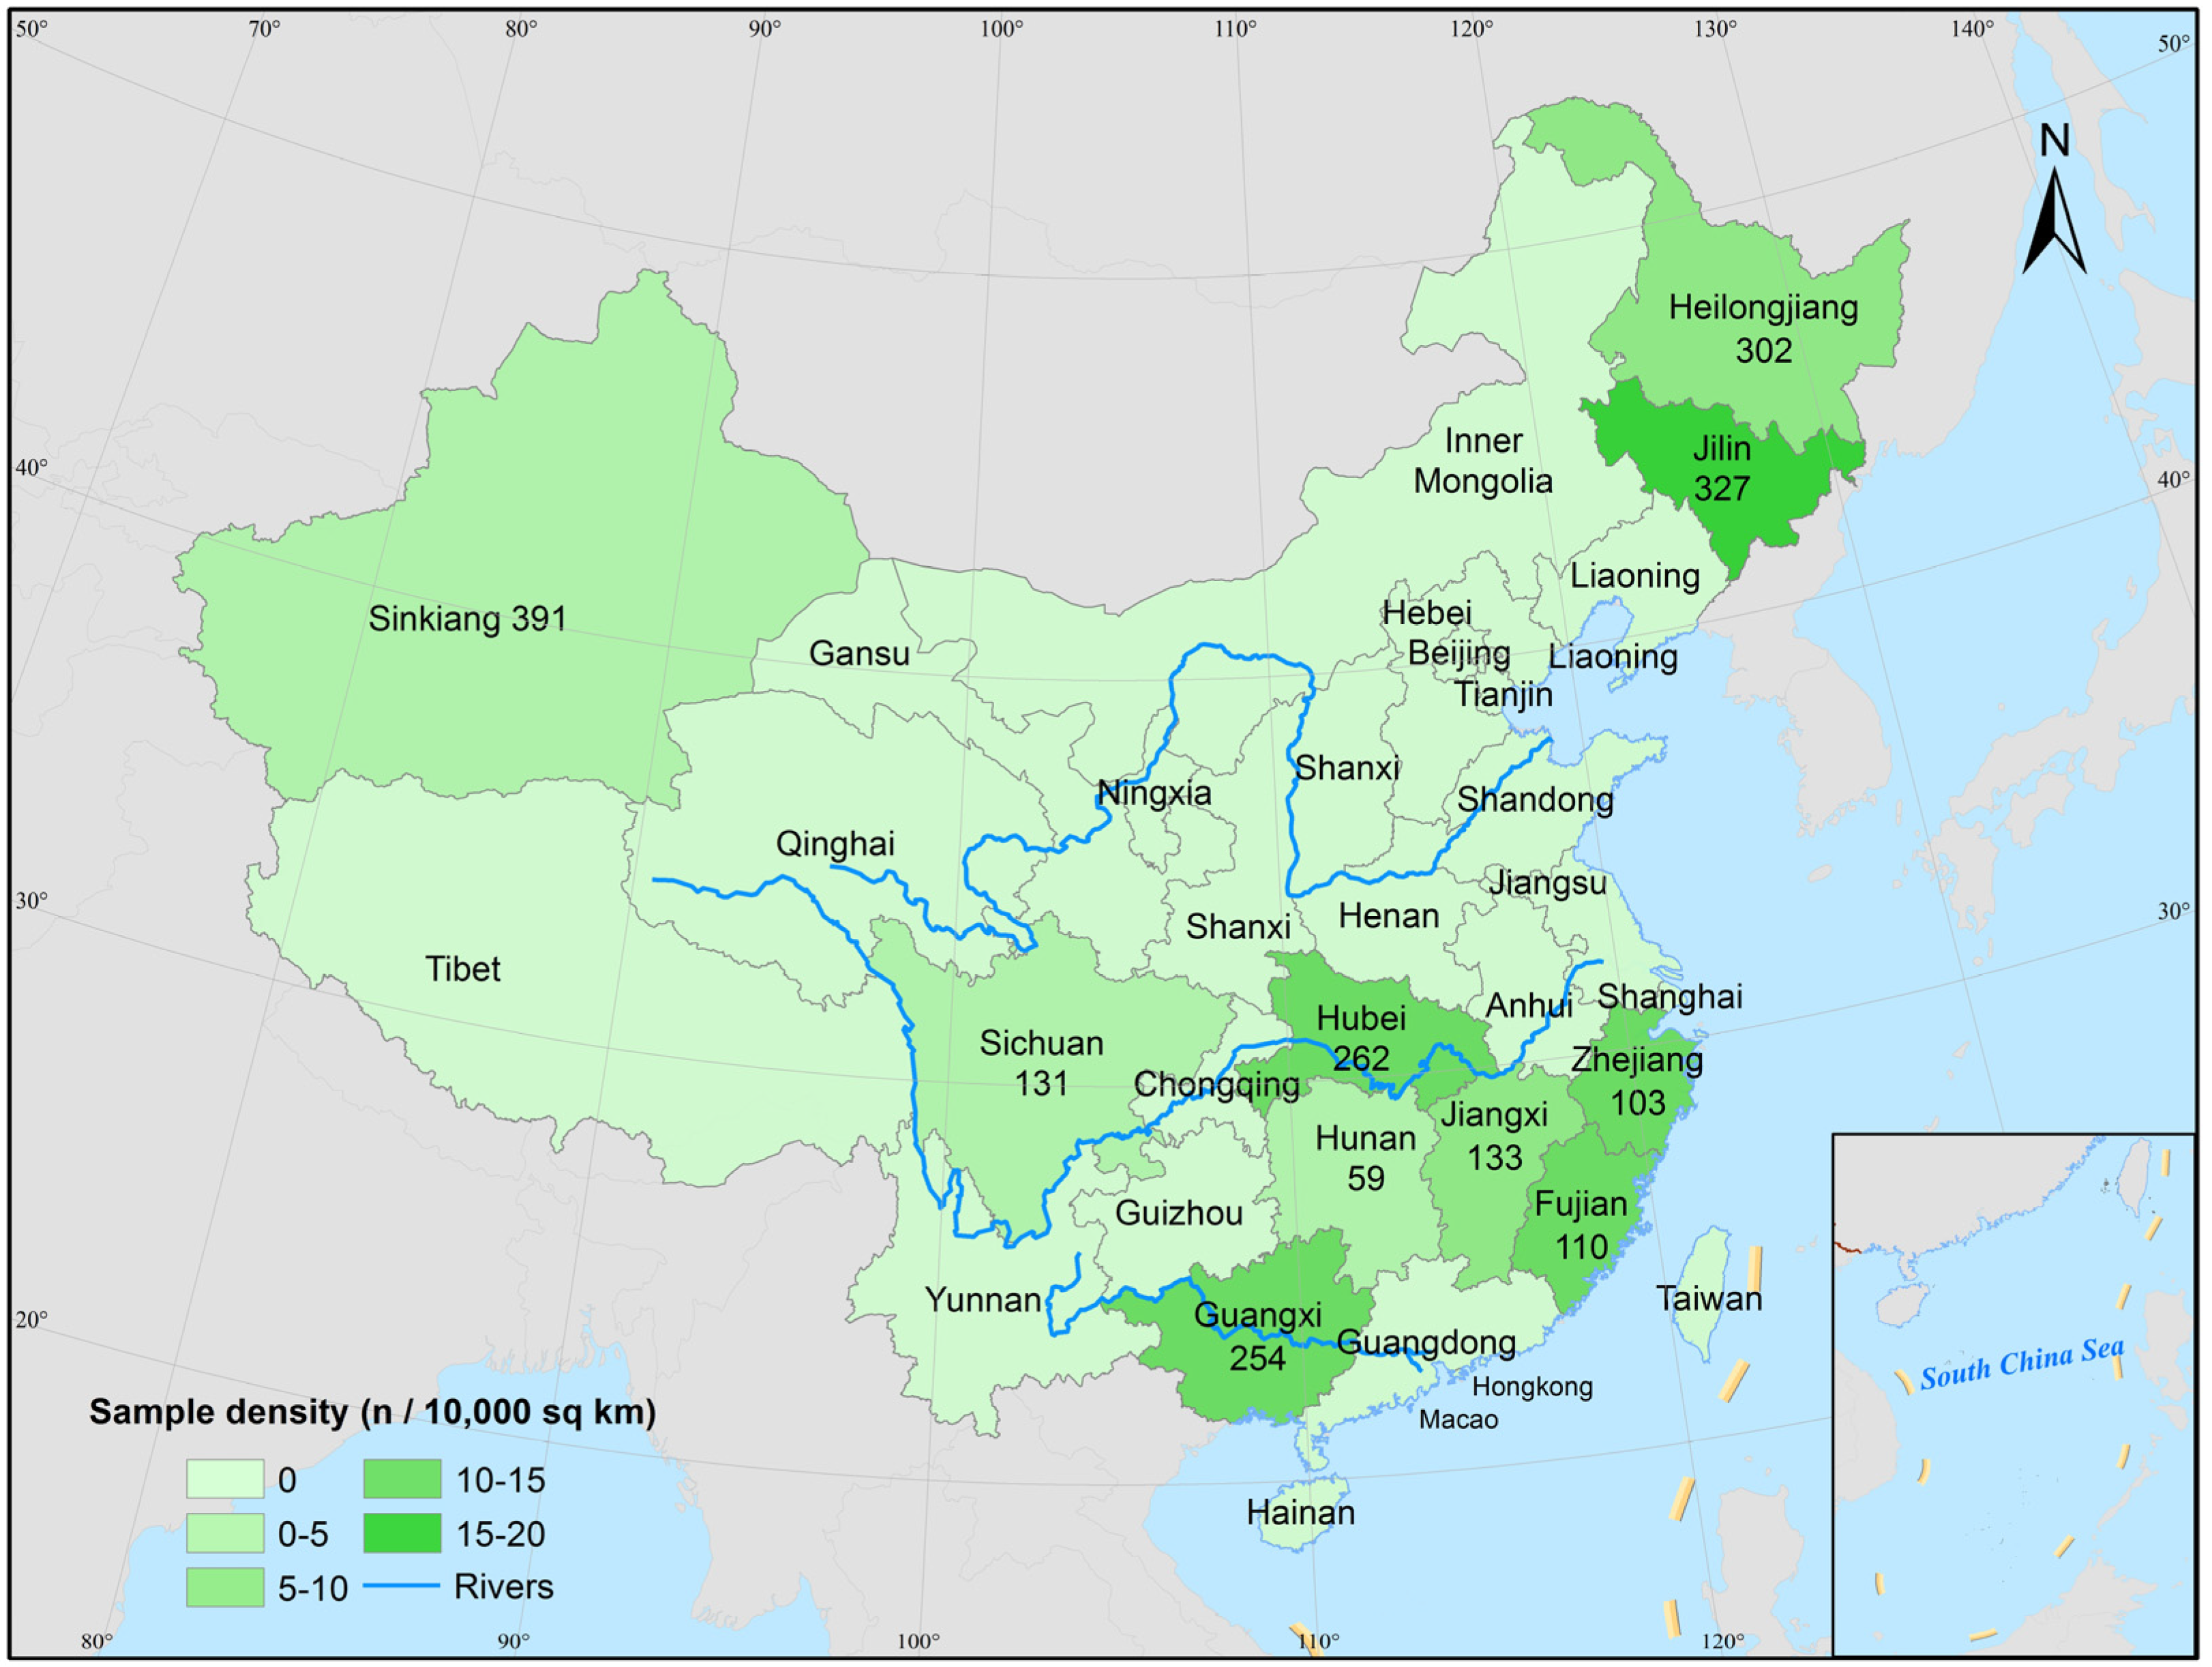
2.1. Chinese Soil Spectral Library

A total of 2072 top layer (0–20 cm) soil samples were collected from paddy-rice fields in 10 provinces (Figure 1) in China; of these, 17 outlier samples were removed because of their unusual spectra. Each topsoil (0–20 cm) samples with a 10 m2 plot were collected and mixed at each sample site. Stones and plant residues were excluded. Then, samples were air dried, ground, sieved to less than 2 mm, and divided into two parts by the quartering method for chemical analysis and spectroscopic measurement. The remaining samples were used as the primary components of the nationwide CSSL.

2.2. Chemical Analyses

The soil total N (TN) content was measured by the semi-micro Macro Kjeldahl method. We systematically selected one quarter of which for validation from the whole data to represent the full range of TN contents. The data were ranked from the lowest to highest values in TN, and were stratified into 518 strata. A sample was then systematically taken from each stratum, then the remaining for calibration.

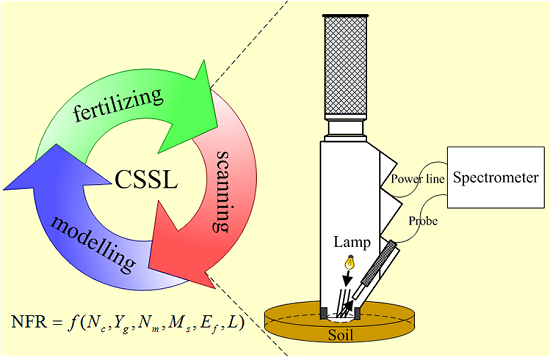
2.3. Spectral Measurements

Each sample was placed in a petri dish 10 cm in diameter and 1.5 cm deep. The VIS-NIR-SWIR spectroscopy measurements were carried out with an ASD FieldSpec® Pro FR spectrometer (Analytical Spectral Devices Inc., Boulder, CO, USA), with a high-intensity contact probe. The instrument has a spectral range of 350 to 2500 nm and a resolution from 3 nm (at 700 nm) to 10 nm (at 1400 and 2100 nm) because of its three detectors. We used it with an independent light source to minimize measurement errors caused by stray light. The spectrometer was calibrated before each scan using a Spectralon® panel with 99% reflectance. Three random measurements were made at each sample within an area. Ten internal scans were made for each measurement to minimize noise and maximize the signal-to-noise ratio. A total of 30 spectra were averaged into one spectrum for each sample recorded.
Figure 1. Sampling density of the Chinese Soil Spectral Library in China by province. Map labels show the total number of samples per province in China.
Remotesensing 07 07029 g001

2.4. Chemical Analyses

All spectra were first resampled to a uniform resolution of 1 nm, which gave us 2151 reflectance variables for each spectrum. The resampled spectra were then reduced to 400–2450 nm (2051 bands) to eliminate significant noise at the edges of each spectrum. To further reduce noise or to enhance the signals, or both, the Savitzky-Golay algorithm [23] and first derivatives were chosen with polynomials of order 2, and 17 filter widths were performed.

2.5. Spectroscopic Modelling

In this study, two different strategies can be used for modelling: one is quantitative estimation of soil N prior to classification, and the other is qualitative classification. We compared three: partial least-squares regression (PLSR), one of the most popular multivariate techniques for spectral calibration and prediction; locally weighted regression (LWR), a promising algorithm for large and heterogeneous datasets; and the support vector machine discriminant analogy (SVMDA), a kernel-based learning algorithm that is widely used for pattern classification.

2.5.1. Partial Least-Squares Regression

Partial least-squares regression takes the dependent variables into account when calculating the principal components. The advantages of PLSR are that it is able to handle data with strong collinearity and noise as well as situations in which the number of variables considerably exceeds the number of available samples. Leave-one-out cross-validation was used to determine the optimal number of factors to be retained in the calibration models by minimizing the prediction error of validation. Martens and Næs [24] provide details.

2.5.2. Locally Weighted Regression

Locally weighted regression searches for the samples from the calibration set most spectrally similar to the new sample to be predicted. This algorithm is based on three main steps: (1) it decomposes and compresses the spectral library data matrix into a number of principal components (PCs); (2) the unknown sample is then projected in the new space and a subset of samples similar to that sample expressed in the same PC scores and selected based on the Mahalanobis distance; (3) once the subset is chosen, a tri-cube weight function is used for the calculation of the different weights for each calibration sample in the regression model, depending on its spectral distance to the unknown sample. In this study, the LWR approach was based on PLS for data reduction, and 100 similar samples were set as the number of local points. For details, see Næs et al. [25].

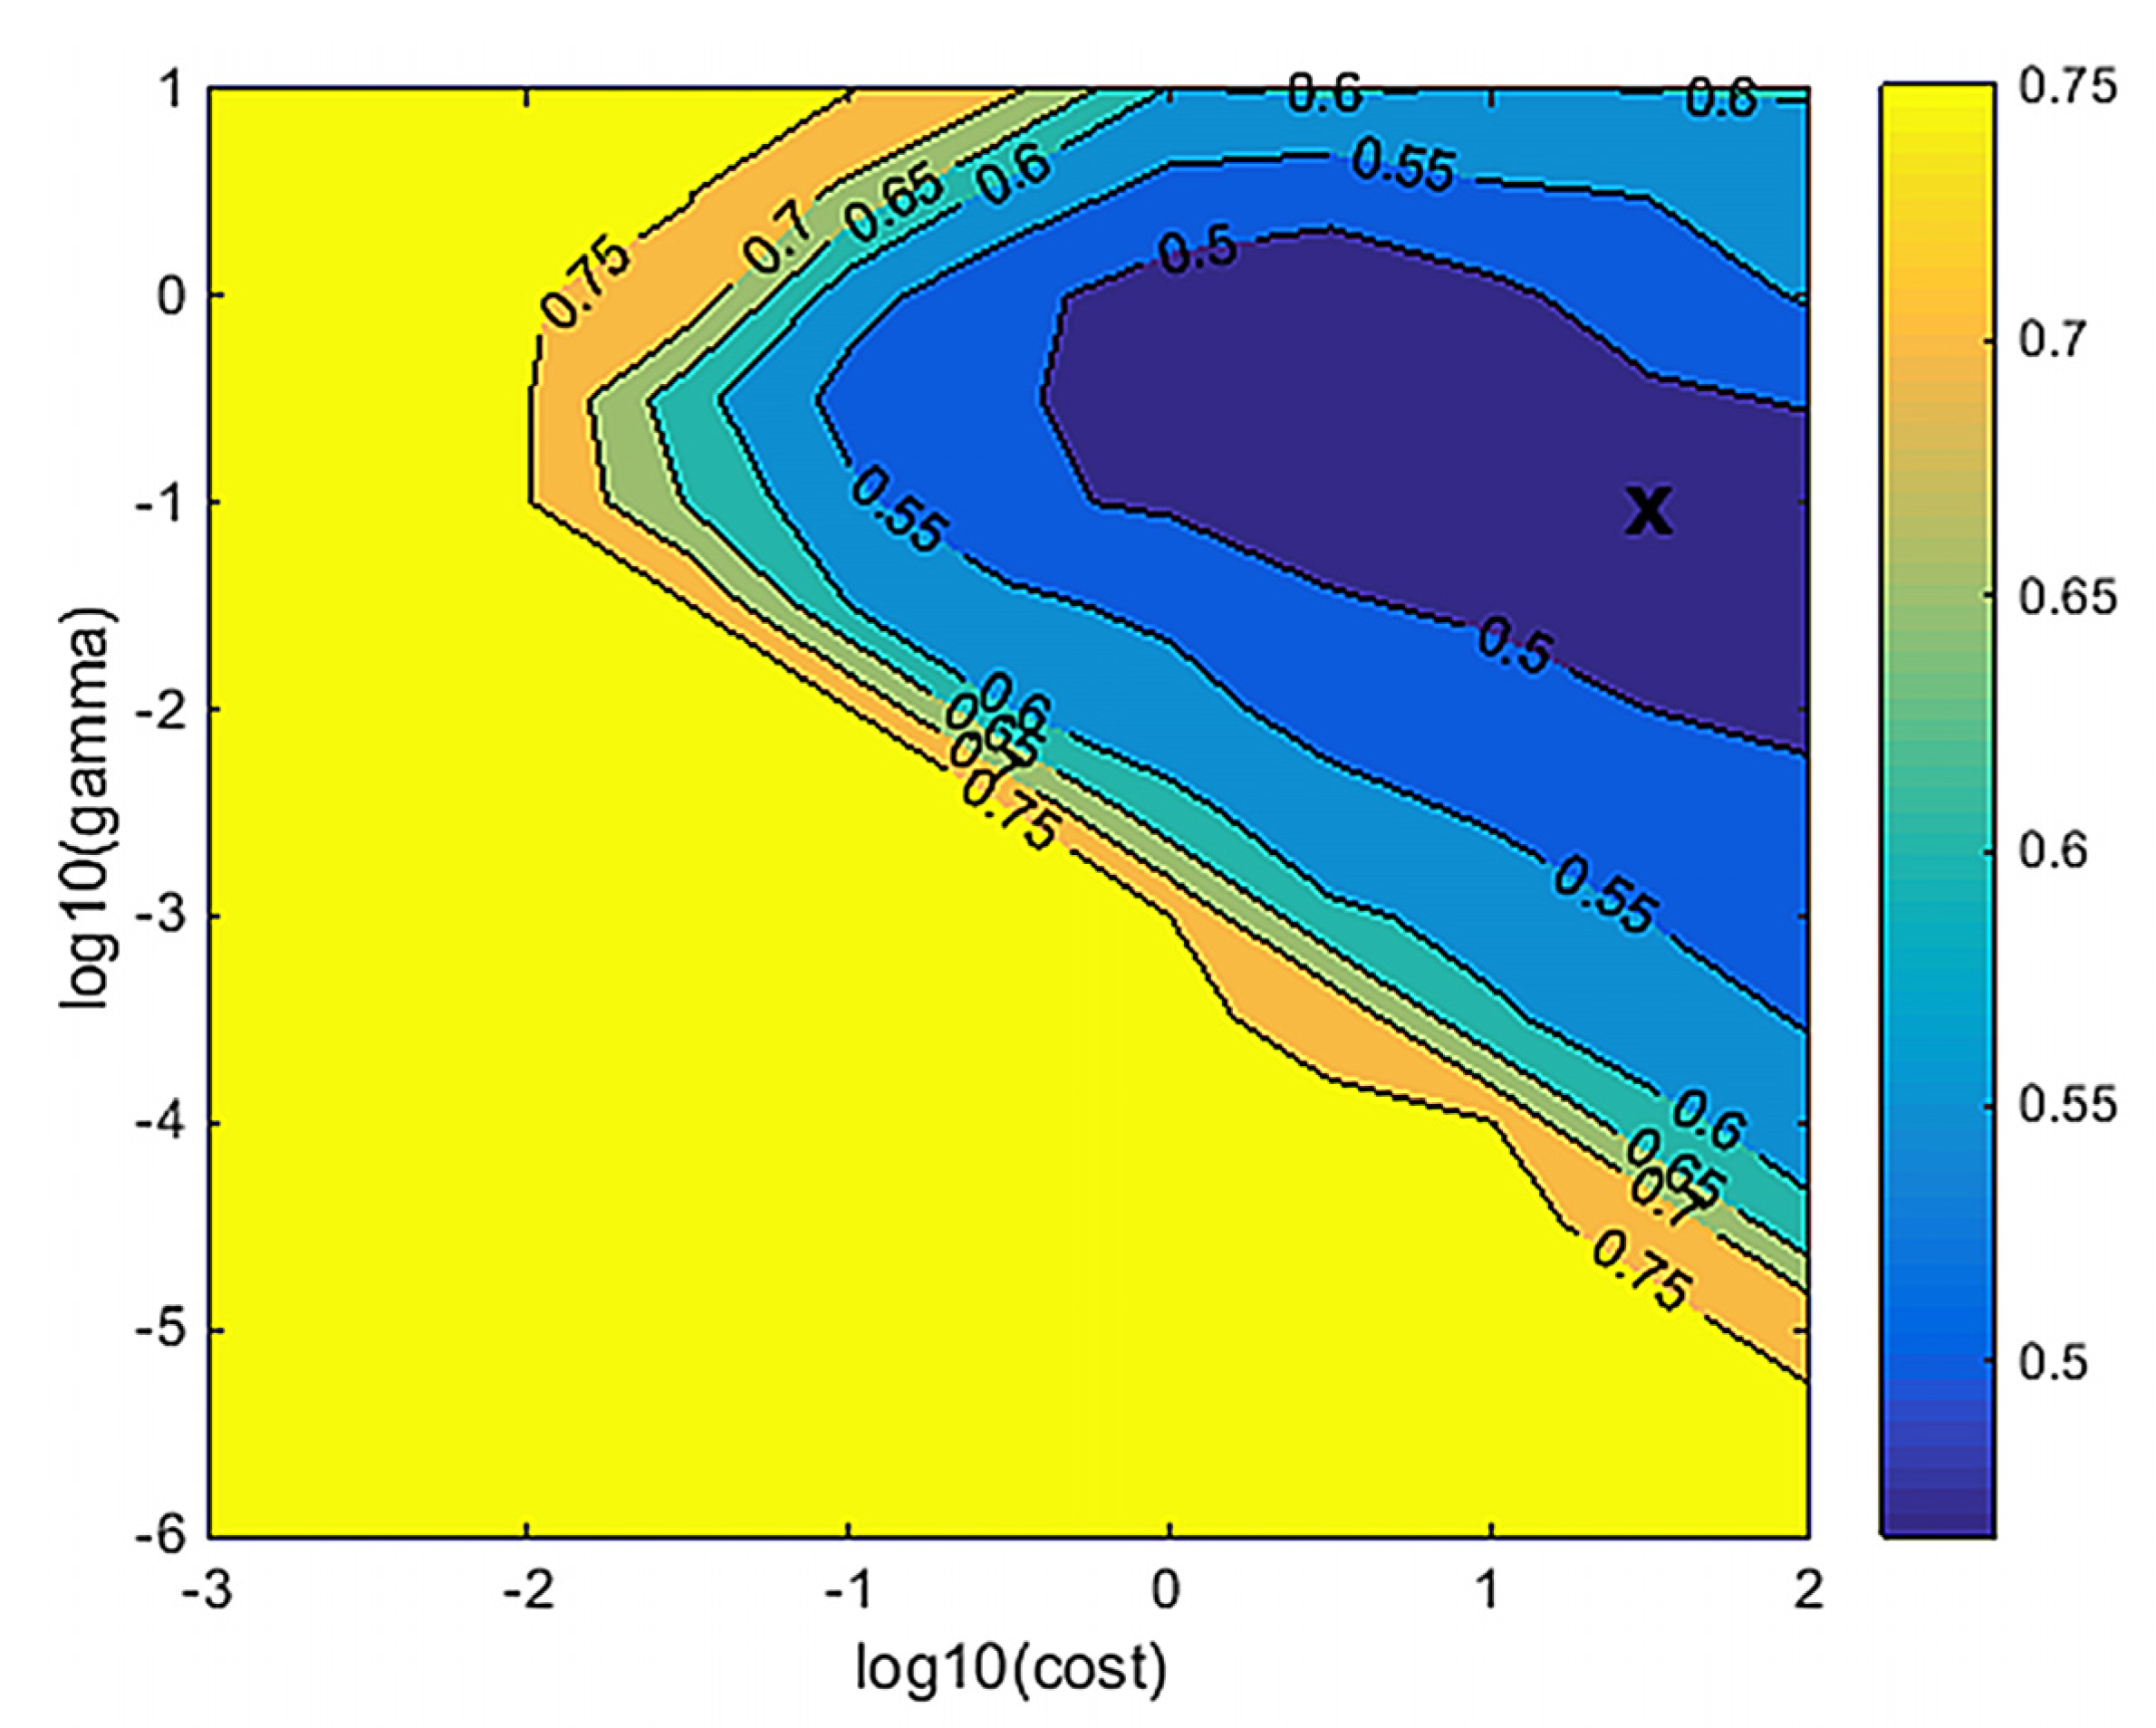
2.5.3. Support Vector Machine Discriminant Analogy

A support vector machine’s basic principle is that an input vector is mapped from the input domain into a higher dimensional feature space via a kernel function, by which data are spread out in a way that facilitates the finding of an interpolation function. The SVM discriminant analogy, the SVMDA, performs calibration and application of SVM classification models. Such a non-linear model consists of a number of support vectors (essentially samples selected from the calibration set) and non-linear model coefficients which define the non-linear mapping of variables in the input x-block. The model allows prediction of the classification based on either the class field of the calibration x-block or a y-block which contains integer-valued classes. The kernel function uses a search over the grid of appropriate parameters using cross-validation to select the optimal SVM parameter values (cost and gamma) and builds an SVM model using those values. In this study, principal component analysis (PCA) was used to compress the spectral matrix. Classification was modeled by LIBSVM developed by Chang and Lin [26], and a Gaussian Radial Basis Function (RBF) was applied as kernel function. Suykens and Vandewalle [27] provide details.

2.6. Assessment of Statistics

The coefficient of determination between the measured and predicted values for calibration (Rc2) and validation (Rv2) datasets and the ratio of performance to deviation (RPD) were used to evaluate the performance of the above models. For the VIS-NIR-SWIR estimation of a soil property such as TN, an RPD > 1.4 indicates an acceptable predictive model and an RPD > 2.0 indicates an excellent quantitative model [28]. Generally, a model that performs well would have large values of R2 and RPD.
The confusion matrix was used to describe the classification accuracy (or rating accuracy) and to characterize the errors. In the confusion matrix, the numbers of samples in training rates (columns) are cross-tabulated against the samples actually classified into each rate (rows). We calculated the overall accuracy representing the percentage of training area samples allocated into the right rate (elements on the main diagonal of the matrix), the producer’s accuracy (number of samples allocated correctly in each row), and the user’s accuracy (number of appointed samples allocated correctly in each row). Additionally, Cohen’s kappa coefficient was calculated as a quality index that considers the effects of chance agreement [29]. Landis and Koch [30] classified kappa values into different categories: 0–0.20, 0.21–0.40, 0.41–0.60, 0.61–0.80, and 0.81–1, which indicate slight, fair, moderate, substantial, and almost perfect agreements, respectively.
All pre-processing steps were programmed and implemented in MatLab version 7 (The MathWorks Inc., Natick, MA, USA) and PLS_Toolbox 7.9 (Eigenvector Research Inc., Wenatchee, WA, USA).

2.7. Calculating the NFR

To calculate the required amount of N fertilizer (46.4% N in urea) per hectare, we used the following equation [31,32]:
N f = ( N c × Y g N m × M s ) / E f
in which Nf is the required amount of N fertilizer per hectare (kg∙ha−1); Nc is the required N for a crop per 100 kg yield (kg∙kg−1); Yg is the yield goal per hectare (kg∙ha−1); Nm is the measured inorganic N per unit soil (kg∙kg−1); Ms is the amount of topsoil per hectare (kg∙ha−1); and Ef is the use efficiency of N fertilizer. According to the study of soil testing and formulated fertilization on Chinese paddy-rice fields in Anhui [33], Fujian [34], Heilongjiang [35], and Zhejiang [36], here we considered the yield goal of rice (Yg) to be 9000 kg∙ha−1 and 2 kg of N fertilizer was required for a yield of 100 kg·(Nc); Ms was 22.5 × 10⁶ kg∙ha−1; and Ef was 40% for the current season. Nm was converted from measured soil TN assuming that the amount of inorganic N present in TN was 2% [37]. Six levels of TN concentrations (L) were classified according to the 2nd National Soil Survey [38]. Based on those levels, the calculated Nf values for different NFR are shown in Table 1.
Table 1. Statistical descriptions of total nitrogen concentrations (g∙kg−1) at six levels and the required amounts (kg∙ha−1) of soil nitrogen fertilizer (Nf) for different nitrogen fertilization rate (NFR) groups.
NFRTNNf
LevelRange
R1very high>2.00225
R2high1.50–2.00253
R3moderate1.00–1.50309
R4deficient0.75–1.00352
R5very deficient0.50–0.75380
R6extremely deficient<0.50394

3. Results and Discussion

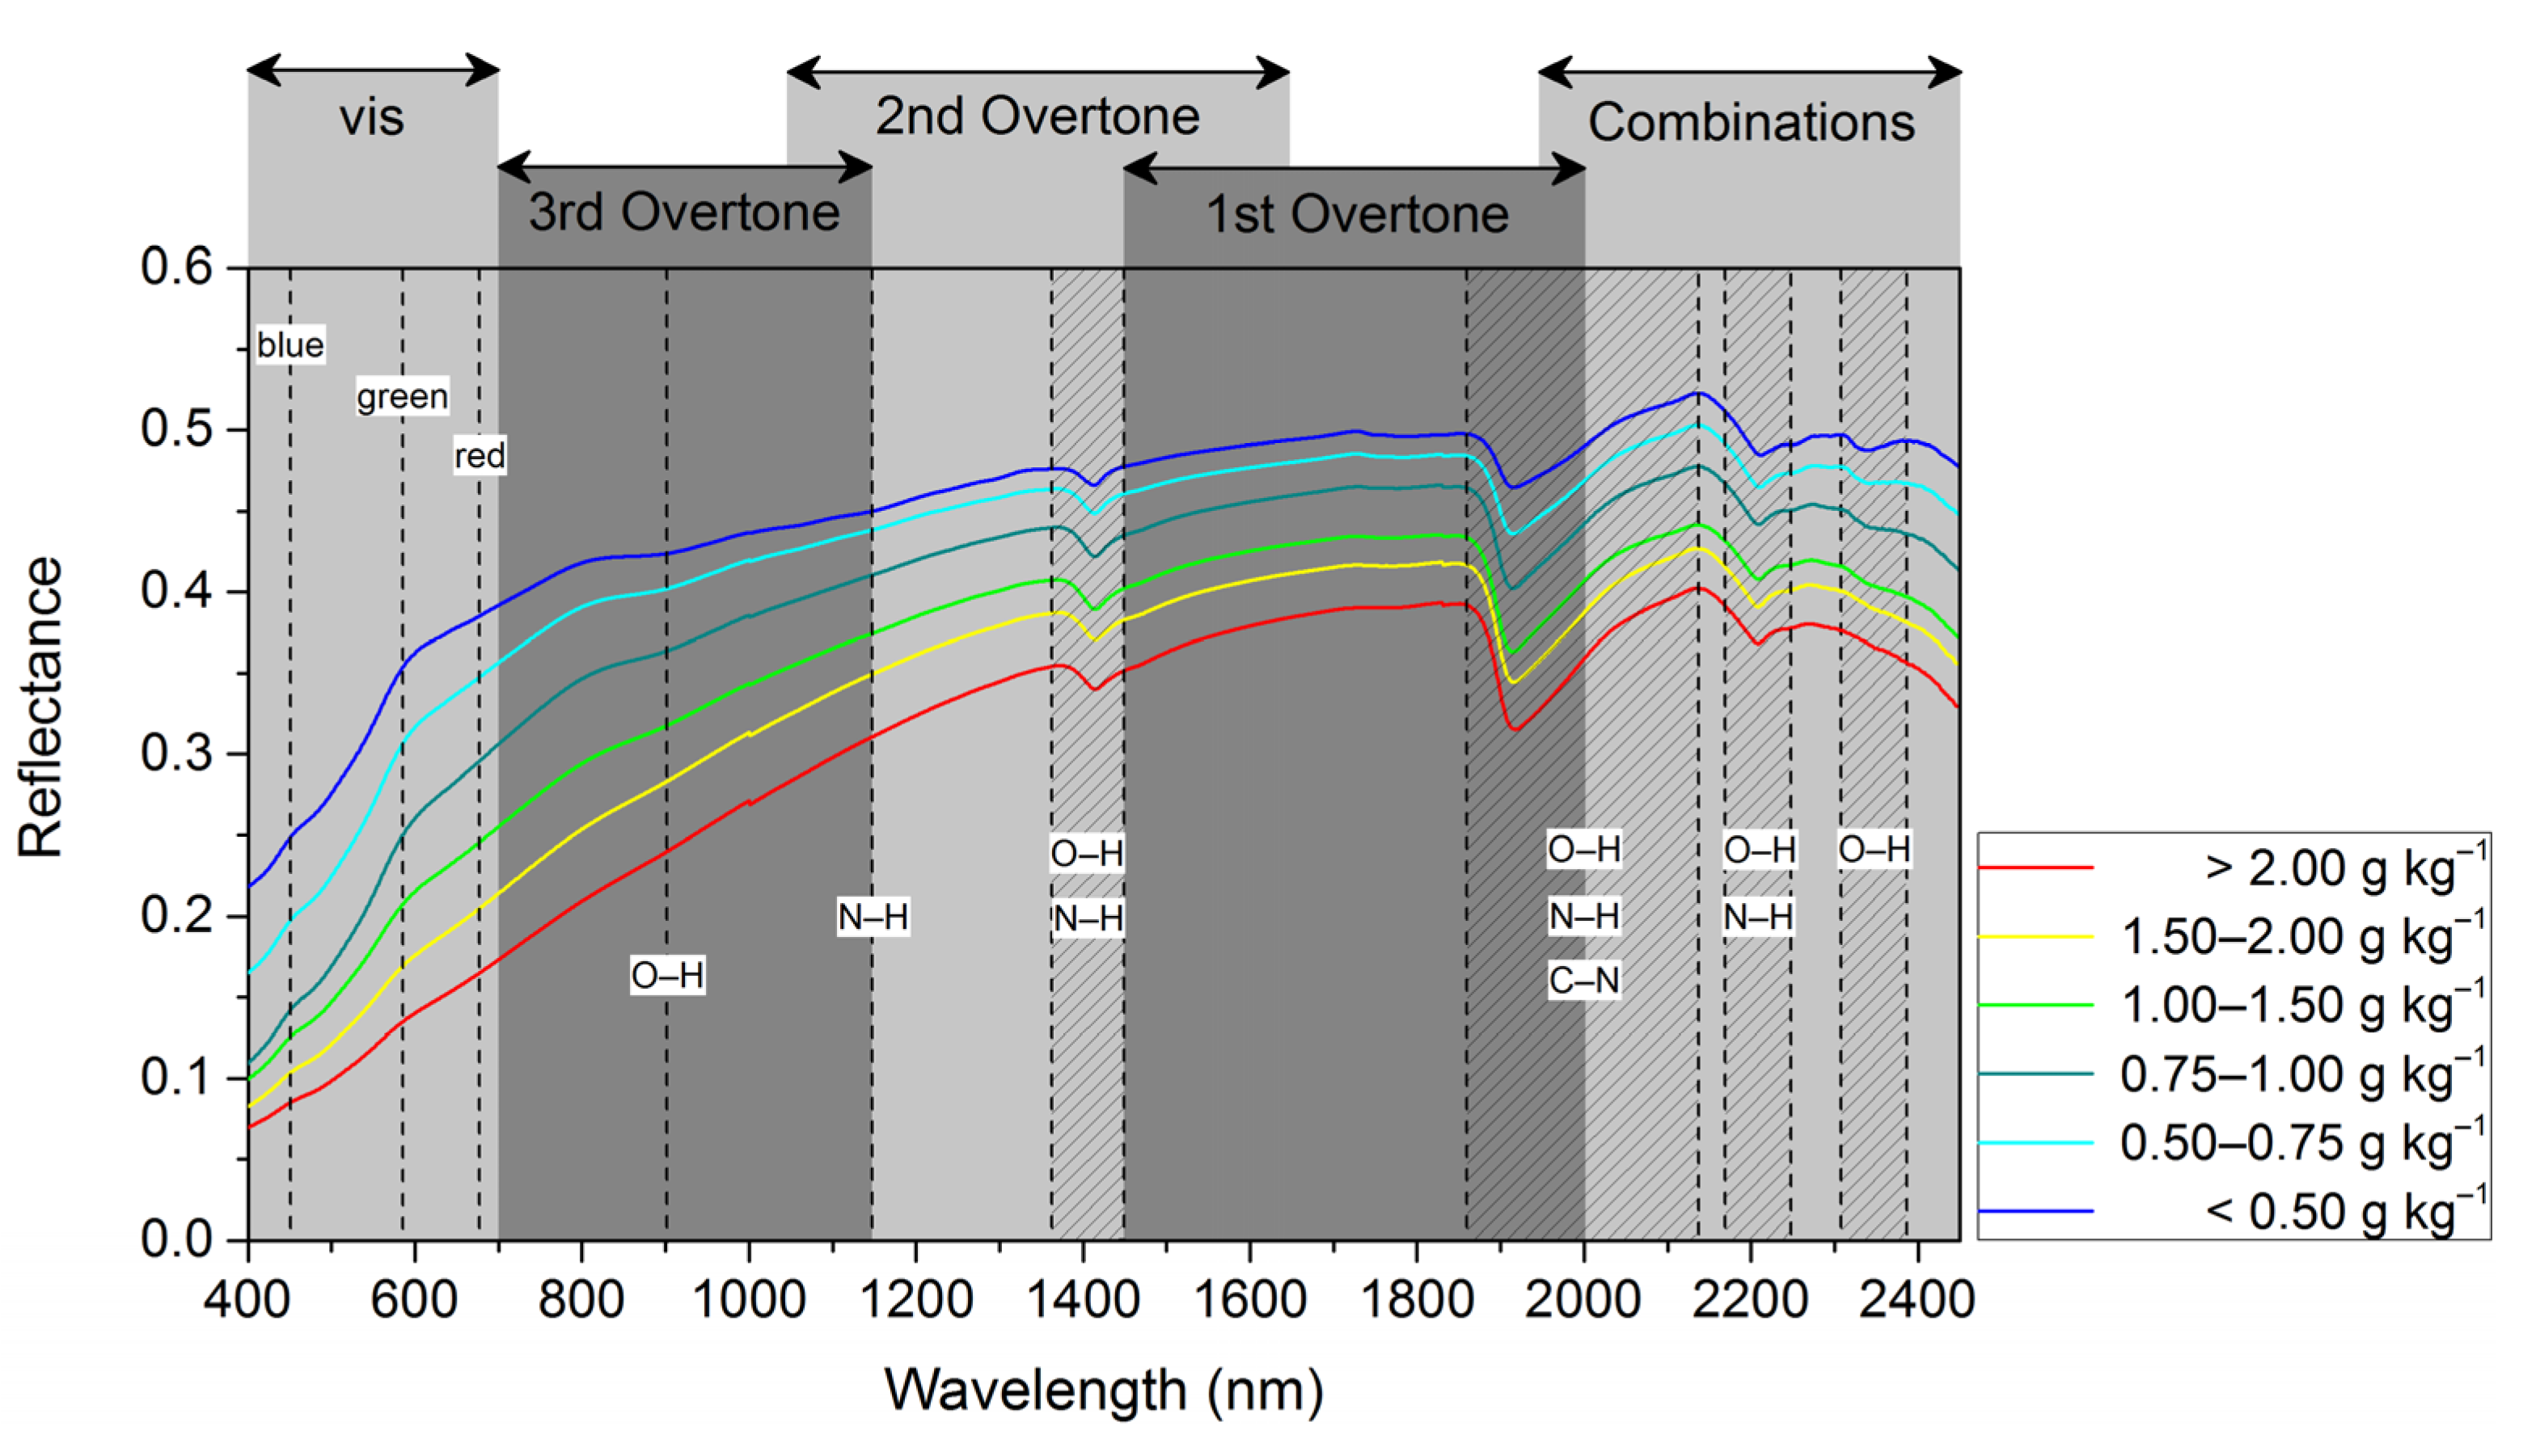
3.1. Soil TN Concentrations and Reflectance Spectra

Table 2 summarizes the measurements of TN content of the soil in all 2072 samples and in the calibration and validation sets separately. The TN content for the whole set of data varied from 0.19 g∙kg−1 to 3.96 g∙kg−1, with an average of 1.18 g∙kg−1. The statistical characteristics of the calibration dataset and the validation dataset were similar to that of the whole dataset, which indicates that the calibration and validation datasets sufficiently represented the whole dataset.
Table 2. Statistics of total nitrogen concentrations (g∙kg−1) for the calibration and validation datasets.
Data SetNMin.Max.MeanStd DevCV (%)
Calibration set15540.193.961.180.6857
Validation set5180.213.761.170.6757
All data20720.193.961.180.6857
Note: N = sample size; Min. = minimum; Max. = maximum; Std dev. = standard deviation; CV = coefficient of variation.
Figure 2 shows the average reflectance of each of the six level groups. The six TN concentration levels are negatively related to their average reflectance spectra. Higher reflectance of soil samples was associated with lower TN concentrations over almost the entire spectral range (400–2450 nm). The positions of constituents causing spectral absorption are also shown. Because the bands are broad and overlap, the spectra are difficult to interpret. Nevertheless, this VIS-NIR-SWIR region contains useful information related to the N in the soil, due to the various chemical bonds such as N-H, C-N, and O-H [39,40]. Three prominent absorption peaks around 1400 (the second overtone of O-H), 1900 (the first overtone of O-H) identified and are associated with the presence of water molecules, and the absorption around 2200 nm (O-H and N-H combinations) was correlated with clay minerals in soil.
Figure 2. Mean reflectance of total nitrogen concentration for different levels.
Remotesensing 07 07029 g002

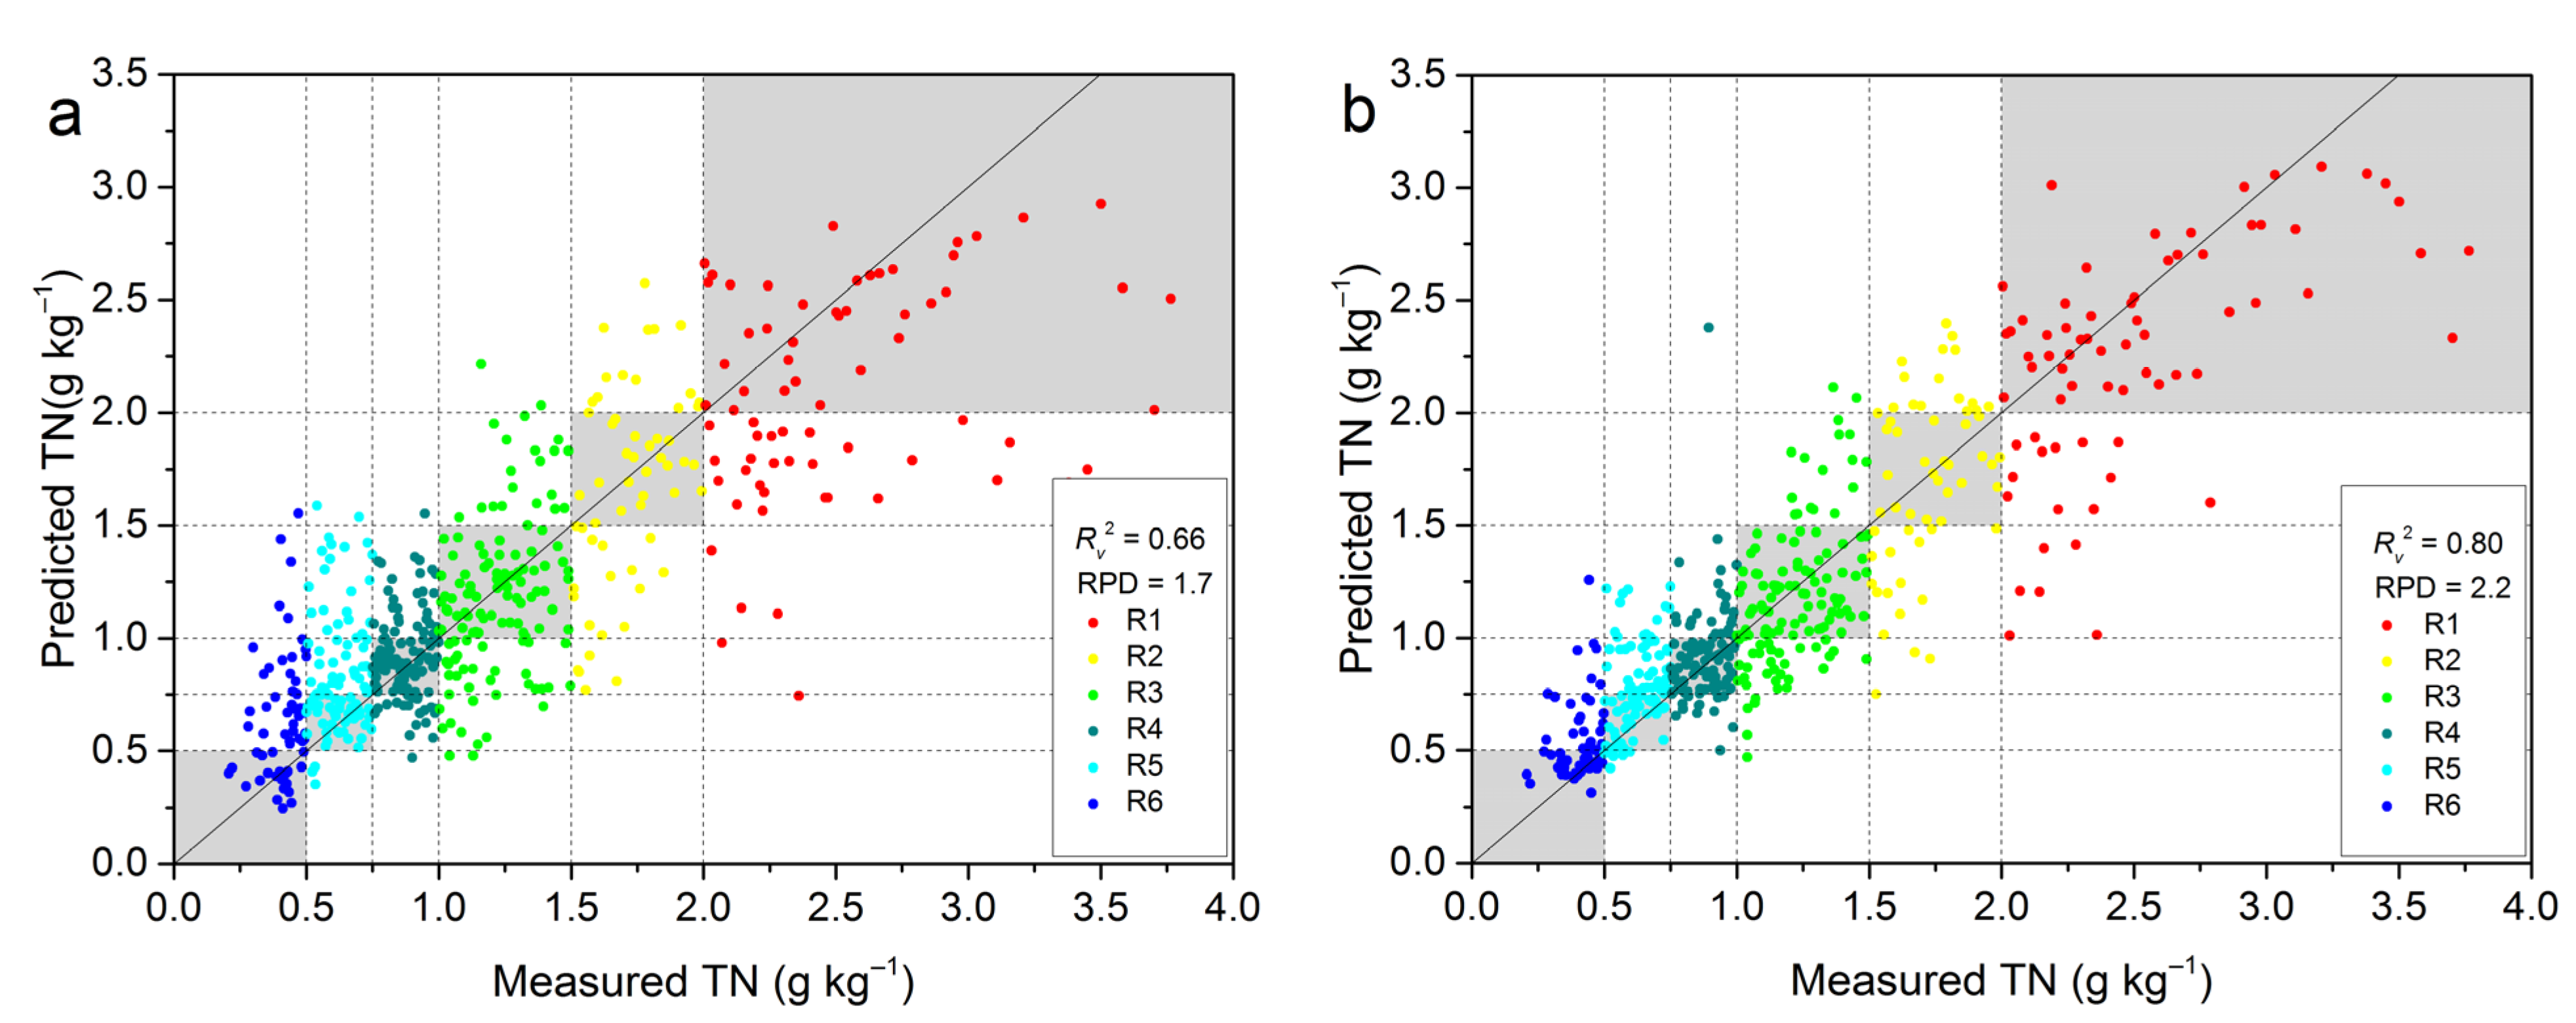
3.2. Prediction of PLSR and LWR

The prediction results of PLSR and LWR are shown in Figure 3. Six colored spots represent six different concentration rate groups, as shown in Table 1. The dotted line on the figure separates different TN concentration rate groups. In general, the PLSR model has a fair predictive ability (Rv2 = 0.66, RPD = 1.7), while the LWR model performs better, with higher Rv2 (0.80) and RPD (2.2) values for producing very good quantitative predictions.
Figure 3. Prediction accuracy of total nitrogen concentrations for 518 samples using the Chinese Soil Spectral Library with PLSR (a) and LWR (b) methods.
Remotesensing 07 07029 g003
However, a portion of the spots are clearly outside of the gray zones; in particular, the PLSR model tends to strongly overestimate low values and underestimate high values. This phenomenon is consistent with findings in recent literature [16,40]. The LWR model has alleviated problems of underestimation and overestimation in head and tail zones through local samples modeling. Therefore, it can be concluded that the LWR method produces more accurate predictions than PLSR for large-scale samples.
To generate a robust model for future use, a library should cover as much of the variation in soil properties as possible. However, there are still nearly half of spots outside the gray zones of LWR, and the R2 was lower than that reported in previous studies in which the number of samples was much lower than in this study [28,41]. This finding may be explained by the high variability of the high number of samples included in this study. Additionally, the diversity of soil genesis and mineralogical backgrounds may cause differences in soil reflectance, and thus lead to a decrease in the accuracy of predictions [21]. Therefore, there is still room for improvement of the prediction accuracy of LWR using CSSL, such as by optimizing pre-processing methods and optimal model parameters.
Although several studies on VIS-NIR-SWIR predictions for the content of inorganic N or mineral N in soil have reported promising results, with R2 values between 0.7 and 0.8 and RPD values of approximately 2 [42,43], several other investigators have obtained less accurate results (R2 < 0.5) [44,45]. Such contradictory results also appeared in our CSSL database (results not shown), but they will be further explored to study its feasibility and stability in order to promote its application. At present, we therefore recommend using the ratio of the TN transformed into inorganic N to work on, although it could further reduce the final accuracy of NFR assessment.

3.3. Classification of SVMDA

The misclassification fraction (error rate) using the model’s cross-validation predictions in Figure 4 shows the results of searching over ranges of cost and gamma to find the best values to use to build the final SVMDA model. The bold “X” identifies cost (31.6) and gamma (0.1) values which produce the model with the smallest misclassification fraction for cross-validation predictions of calibration data. These values are then used to build the actual SVMDA model using the whole calibration dataset, and to make predictions on a validation dataset.
Figure 4. Misclassification fraction by cross-validation in SVMDA.
Remotesensing 07 07029 g004

3.4. Assessment of NFR

The producer’s accuracy of each rate and the Cohen’s kappa coefficient for PLSR, LWR, and SVMDA are shown in Table 3. The NFR results of PLSR and LWR were calculated from their validation results. The Cohen’s kappa coefficients for LWR (0.47) and SVMDA (0.48) are very similar, and the two approaches are considered to have moderate accuracy, while PLSR has a fair accuracy (Cohen’s kappa coefficient = 0.37). Rates 2, 3, 4, and 5 have similar producer’s accuracies for the three methods while the producer’s accuracies for Rates 1 and 6 vary widely between different methods. The user’s accuracy was calculated by merging the rating results highlighted in shades into one column. The user’s accuracy for PLSR was generally higher than 70%, while those of LWR and SVMDA were higher than 80%. The amounts of N over-fertilization and under-fertilization predicted using the three algorithms were calculated by the wrongly classified samples (located outside the diagonal of the matrix), and are shown in Table 3.
Compared with LWR and SVMDA, PLSR has the lowest producer’s accuracies in classifying Rates 1 and 6. Although it produced an acceptable quantitative estimation model for TN concentration (RPD>1.4), for a satisfactory qualitative classification of each rate, the quality of correctively classified samples should be located as much as possible in the diagonal of the matrix, much like how the same-colored spots should be concentrated in the gray zone as much as possible in Figure 3 (close to a 1:1 line). According to PLSR, higher amounts of N are required for both N over-fertilization and under-fertilization compared to LWR and SVMDA (Table 3). From both economic and environmental perspectives, PLSR should not be used for developing fertilization recommendations.
Table 3. The accuracy of three rating methods depicted in a confusion matrix using six training rates from all 518 samples associated with nitrogen over-fertilization (kg) and under-fertilization (kg).
NFRPLSRLWRSVMDA
R1R2R3R4R5R6User’s AccuracyR1R2R3R4R5R6User’s AccuracyR1R2R3R4R5R6User’s Accuracy
R13827311092.95212600091.4539710088.6
R214231450091.115241430094.621191321094.6
R321968259289.621575284194.421181246192.8
R401306019198.210267211198.201296119198.2
R502202844377.300143640785.6031325431383.5
R601412212171.20016203288.10025114188.1
Producer’s accuracy54.341.154.454.145.435.674.342.96064.941.254.275.733.964.85544.369.5
Cohen's kappa0.370.470.48
Over-fertilization506939424586
Under-fertilization675052925513
Columns represent the composition of the six classes and the producer’s accuracy in % (quality of correctively classified samples (located in the diagonal of the matrix); e.g., in the PLSR method for 70 samples from R1, 38 were classified as R1, leading to a producer’s accuracy of 54.3%; others were misclassified as R2 (27) and R3 (3)); Lines show the assignment of the classified samples to the six rates and the user’s accuracy (quality of the appointed samples assigned by shades; e.g., 70 samples were classified as R1 by PLSR, but only 65 samples (92.9%) (shown as shades) were classified correctly; others were classified as R3 (3) and R4 (1).
Although the Cohen’s kappa coefficient of LWR is slightly lower than that of SVMDA, the N fertilizer requirements predicted by LWR are lower than those predicted by SVMDA. However, SVMDA only requires qualitative classification of soil spectral data, while LWR performs quantitative estimation of soil N prior to classification; therefore, the development of the SVMDA model is more time-consuming than development of the LWR model. Additionally, LWR had a higher Rv2 and its RPD had good prediction performance, while the kappa had moderate performance. This indicates that although higher values are obtained, the Rv2 or RPD could not sufficiently assess the accuracy of NFR. It is worth noting that the incorrectly classified samples are mostly located in adjacent columns (shown as shades in Table 3) to the correct rates, which means the approach might be applicable as long as the error is within the tolerance range. We conclude that combining environmental factors and budget requirements is required to choose a suitable method for NFR predictions in future research.
Despite our success, we would like to see more studies conducted with VIS-NIR-SWIR spectroscopy in the local field for estimating NFR. Smaller areas tend to be less variable in terms of the dependent variable [46], which also indicated that if the library dataset can lay the foundation, the LWR or SVMDA (or both) for a local dataset could do so, and possibly perform better. Recent advances in proximal soil sensing indicated that VIS-NIR-SWIR can also be performed directly in the field with mobile or non-mobile instruments, which improve time- and cost-effectiveness [47,48], which might be beneficial for NFR recommendations in field. However, in situ measurements may not work as well as laboratory measurements because of the influence of external environmental factors [49], such as ambient light, texture, color, temperature, soil structural conditions, and especially the impact of moisture with unknown content [50,51,52]. One of our aims is to create a site-specific or “geographically-local” spectral library of paddy-rice soils from the whole plant area in China at an affordable price. For this purpose, we would require a rigorous protocol [53] for measuring spectra in flooded soil conditions in paddy-rice fields and a robust standard combination of pre-treatment to remove the effects of external environmental factors, statistical modelling and uncertainty analysis of the geographical locations. Some tentative methods for removing the effects of moisture on the VIS-NIR-SWIR spectra in the field will also be adopted; for example, direct standardization (DS) and external parameter orthogonalization (EPO) [54,55]. We believe the above investigation is a promising start, and we intend to build on it.

4. Conclusions

This study examined the use of the CSSL to derive spectroscopic models of NFR recommendations for paddy-rice soils in China. PLSR, LWR, and SVMDA were compared to explore their accuracies with regard to NFR. We concluded that the following:
(1)
The LWR model performed better than the PLSR model in the validation process with regard to quantitative estimation of TN concentrations. Rv2 and RPD for LWR were higher than those obtained from PLSR models. This suggests that large spectral libraries can be very useful to predict soil TN with high accuracy.
(2)
The qualitative classification accuracies of NFR using LWR and SVMDA with moderate accuracy were more suitable than PLSR. The development of the SVMDA model is also more time-consuming than development of the LWR model, which only requires qualitative classification of soil spectral data while LWR performs quantitative estimation of soil N prior to classification.

Acknowledgments

We received funding for this research from the National Natural Science Foundation of China (No. 41271234), the Research Fund of State Key Laboratory of Soil and Sustainable Agriculture, Nanjing Institute of Soil Science, Chinese Academy of Science (No. Y412201430), and the National High Technology Research and Development Program of China (No. 2013AA102301).

Author Contributions

Zhou Shi and Shuo Li conceived and designed the research. Shuo Li, Wenjun Ji, Songchao Chen, Jie Peng and Yin Zhou made substantial contributions to the acquisition, analysis and interpretation of the data. All authors discussed the basic structure of the manuscript, and Shuo Li finished the first draft. All authors read and approved the submitted manuscript, agreed to be listed and accepted the version for publication.

Conflicts of Interest

The authors declare no conflict of interest.

References

  1. Food and Agriculture Organization of the United Nations (FAO). Available online: http://www.fao.org/publications/card/en/c/56efd1a2-0f6e-4185-8005-62170e9b27bb/ (accessed on 16 November 2014).
  2. Wang, W.; Lu, J.; Ren, T.; Li, X.; Su, W.; Lu, M. Evaluating regional mean optimal nitrogen rates in combination with indigenous nitrogen supply for rice production. Field Crop. Res. 2012, 137, 37–48. [Google Scholar] [CrossRef]
  3. Zhang, X.; Yin, S.; Li, Y.; Zhuang, H.; Li, C.; Liu, C. Comparison of greenhouse gas emissions from rice paddy fields under different nitrogen fertilization loads in Chongming Island, Eastern China. Sci. Total Environ. 2014, 472, 381–388. [Google Scholar] [CrossRef] [PubMed]
  4. Heffer, P. Assessment of Fertilizer Use by Crop at the Global Level: 2006/07–2007/08; International Fertilizer Industry Association (IFA): Paris, France, 2009. [Google Scholar]
  5. Zhu, Z.L.; Chen, D.L. Nitrogen fertilizer use in China—Contributions to food production impacts on the environment and best management strategies. Nutr. Cycl. Agroecosyst. 2002, 63, 117–127. [Google Scholar] [CrossRef]
  6. Ju, X.T.; Xing, G.X.; Chen, X.P.; Zhang, S.L.; Zhang, L.J.; Liu, X.J.; Zhang, F.S. Reducing environmental risk by improving N management in intensive Chinese agricultural systems. PNAS 2009, 106, 3041–3046. [Google Scholar] [CrossRef] [PubMed] [Green Version]
  7. Stevens, C.J.; Dise, N.B.; Mountford, J.O.; Gowing, D.J. Impact of nitrogen deposition on the species richness of grasslands. Science 2004, 303, 1876–1879. [Google Scholar] [CrossRef] [PubMed]
  8. Aber, J.; McDowell, W.; Nadelhoffer, K.; Magill, A.; Berntson, G.; Kamakea, M.; Fernandez, I. Nitrogen saturation in temperate forest ecosystems. BioScience 1998, 48, 921–934. [Google Scholar] [CrossRef]
  9. Richter, D.D., Jr.; Markewitz, D.; Reiners, W.A.; Sanchez, P. Understanding Soil Change: Soil Sustainability over Millennia Centuries and Decades; Cambridge University Press: New York, NY, USA, 2001; pp. 182–205. [Google Scholar]
  10. Cerrato, M.E.; Blackmer, A.M. Comparison of models for describing, corn yield response to nitrogen fertilizer. Agron. J. 1990, 82, 138–143. [Google Scholar] [CrossRef]
  11. Dowdle, S.; Portch, S. A systematic approach for determining soil nutrient constrains and establishing balanced fertilizer recommendations for sustained high yields. In The Soil and Fertilizer Institute of the Chinese academy of Agricultural Science Proceedings of the Soil International Symposium on Balanced Fertilization; China Agriculture Press: Beijing, China, 1988; pp. 8–12. [Google Scholar]
  12. Rice, C.W.; Havlin, J.L. Integrating mineralizable nitrogen indices into fertilizer nitrogen recommendations. In Soil testing: Prospects for Improving Nutrient Recommendations; Havlin, J.L., Ed.; SSSA: Madison, WI, USA, 1994; pp. 1–13. [Google Scholar]
  13. Ben-Dor, E.; Banin, A. Near-infrared analysis as a rapid method to simultaneously evaluate several soil properties. Soil Sci. Soc. Am. J. 1995, 59, 364–372. [Google Scholar] [CrossRef]
  14. Viscarra Rossel, R.A.; Walvoort, D.J.J.; McBratney, A.B.; Janik, L.J.; Skjemstad, J.O. Visible, near infrared, mid infrared or combined diffuse reflectance spectroscopy for simultaneous assessment of various soil properties. Geoderma 2006, 131, 59–75. [Google Scholar] [CrossRef]
  15. Shepherd, K.D.; Walsh, M.G. Development of reflectance spectral libraries for characterization of soil properties. Soil Sci. Soc. Am. J. 2002, 66, 988–998. [Google Scholar] [CrossRef]
  16. Brown, D.J. Using a global VNIR soil-spectral library for local soil characterization and landscape modeling in a 2nd-order Uganda watershed. Geoderma 2007, 140, 444–453. [Google Scholar] [CrossRef]
  17. Sankey, J.B.; Brown, D.J.; Bernard, M.L.; Lawrence, R.L. Comparing local vs. global visible and near-infrared (VisNIR) diffuse reflectance spectroscopy (DRS) calibrations for the prediction of soil clay, organic C and inorganic C. Geoderma 2008, 148, 149–158. [Google Scholar] [CrossRef]
  18. Knadel, M.; Deng, F.; Thomsen, A.; Greve, M.H. Development of a Danish national VIS-NIR soil spectral library for soil organic carbon determination. In Digital Soil Assessment and Beyond; Minasny, B., Malone, B.P., McBratney, A.B, Eds.; Taylor & Francis: London, UK, 2012; pp. 403–408. [Google Scholar]
  19. Viscarra Rossel, R.A.; Webster, R. Predicting soil properties from the Australian soil visible-near infrared spectroscopic database. Eur. J. Soil Sci. 2012, 63, 848–860. [Google Scholar] [CrossRef]
  20. Stevens, A.; Nocita, M.; Tóth, G.; Montanarella, L.; van Wesemael, B. Prediction of soil organic carbon at the European scale by visible and near infrared reflectance spectroscopy. PLoS ONE 2013, 8, e66409. [Google Scholar] [CrossRef] [PubMed]
  21. Shi, Z.; Wang, Q.L.; Peng, J.; Ji, W.J.; Liu, H.J.; Li, X.; Viscarra Rossel, R.A. Development of national VNIR soil-spectral library for soil classification and the predictions of organic matter. Sci. China Earth Sci. 2014, 57, 1–10. [Google Scholar]
  22. Gogé, F.; Gomez, C.; Jolivet, C.; Joffre, R. Which strategy is best to predict soil properties of a local site from a national Vis-NIR database? Geoderma 2014, 213, 1–9. [Google Scholar] [CrossRef]
  23. Savitzky, A.; Golay, M.J.E. Smoothing and differentiation of data by simplified least squares procedures. Anal. Chem. 1964, 36, 1627–1639. [Google Scholar] [CrossRef]
  24. Martens, H.; Næs, T. Multivariate Calibration; John Wiley & Sons: Chichester, UK, 1989; p. 419. [Google Scholar]
  25. Næs, T.; Isaksson, T.; Kowalski, B. Locally weighted regression and scatter correction for near infrared reflectance data. Anal. Chem. 1990, 62, 664–673. [Google Scholar] [CrossRef]
  26. Chang, C.C.; Lin, C.J. LIBSVM: A library for support vector machines. ACM Trans. Intell. Syst. Technol. 2011, 2. [Google Scholar] [CrossRef]
  27. Suykens, J.A.K.; Vandewalle, J. Least squares support vector machine classifiers. Neural Process. Lett. 1999, 9, 293–300. [Google Scholar] [CrossRef]
  28. Chang, C.W.; Laird, D.A.; Mausbach, M.J.; Hurburgh, C.R. Near-infrared reflectance spectroscopy–principal components regression analyses of soil properties. Soil Sci. Soc. Am. J. 2001, 65, 480–490. [Google Scholar] [CrossRef]
  29. Foody, G.M. Status of land cover classification accuracy assessment. Remote Sens. Environ. 2002, 80, 185–201. [Google Scholar] [CrossRef]
  30. Landis, J.R.; Koch, G.G. The measurement of observer agreement for categorical data. Biometrics 1977, 33, 159–174. [Google Scholar] [CrossRef] [PubMed]
  31. Stanford, G. Rationale for optimum nitrogen fertilization in corn production. J. Environ. Qual. 1973, 2, 159–166. [Google Scholar] [CrossRef]
  32. Ministry of Agriculture of the People’s Republic of China. Protocols of Soil Testing and Formulated Fertilization Technology. Available online: http://www.moa.gov.cn/ztzl/ctpfsf/gzdt/201109/P020110922365288911962.doc (accessed on 7 September 2014).
  33. Wang, H.L.; He, X.W. “3414” fertilizer response experiment on rice in 2008 at Jixi county, Anhui province. Soils 2009, 41, 320–323. (in Chinese). [Google Scholar]
  34. Xu, Z.P.; Yao, B.Q.; Zhang, M.Q.; Lin, Q.; Chen, Z.C.; Li, J.; Yan, M.J.; Zhang, J.L. Soil testing and fertilizer formulation for major crops in Fujian-effects of soil condition of and fertilization on crop yield. Fujian J. Agric. Sci. 2008, 23, 396–402. (in Chinese). [Google Scholar]
  35. Wei, Y.G.; Zhao, L.Q. Effects of formula fertilization by soil testing on rice. Heilongjiang Agric. Sci. 2007, 37–39. (in Chinese). [Google Scholar]
  36. Fan, H.D.; Jiang, L.N.; Feng, G.G.; Zhang, D.; Lv, J.; Shen, J. Effects of formula fertilization by soil testing on single-cropped rice verified by nutrient-restrict-factor trials. J. Zhejiang Agric. Sci. 2006, 2, 171–173. (in Chinese). [Google Scholar]
  37. Mulvaney, R.L. Nitrogen—Inorganic forms. In Methods Soil Anal.Part 3–Chemical Methods; Sparks, D.L., Page, A.L., Helmke, P.A., Loeppert, R.H., Eds.; SSSA: Madison, WI, USA, 1996; pp. 1123–1185. [Google Scholar]
  38. State Soil Survey Service of China (SSSC). Technical Report of the National Soil Survey of China; China Agriculture Press: Beijing, China, 1992. (in Chinese) [Google Scholar]
  39. Viscarra Rossel, R.A.; Behrens, T. Using data mining to model and interpret soil diffuse reflectance spectra. Geoderm 2010, 158, 46–54. [Google Scholar] [CrossRef]
  40. Vasques, G.M.; Grunwald, S.; Harris, W.G. Spectroscopic models of soil organic carbon in Florida USA. J. Environ. Qual. 2010, 39, 923–934. [Google Scholar] [CrossRef] [PubMed]
  41. Mutuo, P.K.; Shepherd, K.D.; Albrecht, A.; Cadisch, G. Prediction of carbon mineralization rates from different soil physical fractions using diffuse reflectance spectroscopy. Soil. Biol. Biochem. 2006, 38, 1658–1664. [Google Scholar] [CrossRef]
  42. Fystro, G. The prediction of C and N content and their potential mineralisation in heterogeneous soil samples using Vis–NIR spectroscopy and comparative methods. Plant Soil 2002, 246, 139–149. [Google Scholar]
  43. Moron, A.; Cozzolino, D. Determination of potentially mineralizable nitrogen and nitrogen in particulate organic matter fractions in soil by visible and near-infrared reflectance spectroscopy. J. Agric. Sci. 2004, 142, 335–343. [Google Scholar] [CrossRef]
  44. Reeves, J.B.; McCarty, G.W.; Meisinger, J.J. Near infrared reflectance spectroscopy for the analysis of agricultural soils. J. Near Infrared Spectrosc. 1999, 7, 179–193. [Google Scholar] [CrossRef]
  45. Van Groenigen, J.W.; Mutters, C.S.; Horwath, W.R.; Van Kessel, C. NIR and DRIFT-MIR spectrometry of soils for predicting soil and crop parameters in a flooded field. Plant Soil 2003, 250, 155–165. [Google Scholar] [CrossRef]
  46. Guerrero, C.; Stenberg, B.; Wetterlind, J.; Viscarra Rossel, R.A.; Maestre, F.T.; Mouazen, A.M.; Zornoza, R.; Ruiz-Sinoga, J.D.; Kuang, B. Assessment of soil organic carbon at local scale with spiked NIR calibrations: Effects of selection and extra-weighting on the spiking subset. Eur. J. Soil Sci. 2014, 65, 248–263. [Google Scholar] [CrossRef]
  47. Kuang, B.; Mouazen, A.M. Effect of spiking strategy and ratio on calibration of on-line visible and near infrared soil sensor for measurement in European farms. Soil Till. Res. 2013, 128, 125–136. [Google Scholar] [CrossRef] [Green Version]
  48. Ji, W.; Shi, Z.; Huang, J.; Li, S. In situ measurement of some soil properties in paddy soils using vis-NIR spectroscopy. PLoS ONE 2014, 9, e105708. [Google Scholar]
  49. Li, S.; Shi, Z.; Chen, S.; Ji, W.; Zhou, L.; Yu, W.; Webster, R. In situ measurements of organic carbon in soil profiles using vis-NIR spectroscopy on the Qinghai-Tibet Plateau. Environ. Sci. Technol. 2015, 49, 4980–4987. [Google Scholar] [CrossRef] [PubMed]
  50. Idso, S.B.; Jackson, R.D.; Reginato, R.J.; Kimball, B.A.; Nakayama, F.S. The dependence of bare soil albedo on soil water content. J. Appl. Meteorol. 1975, 14, 109–113. [Google Scholar] [CrossRef]
  51. Torrion, J.A.; Maas, S.J.; Guo, W.; Bordovsky, J.P.; Cranmer, A.M. A three-dimensional index for characterizing crop water stress. Remote Sens. 2014, 6, 4025–4042. [Google Scholar] [CrossRef]
  52. Nocita, M.; Stevens, A.; Noon, C.; van Wesemael, B. Prediction of soil organic carbon for different levels of soil moisture using Vis-NIR spectroscopy. Geoderma 2013, 199, 37–42. [Google Scholar] [CrossRef]
  53. Ben Dor, E.; Ong, C.; Lau, I.C. Reflectance measurements of soils in the laboratory: Standards and protocols. Geoderma 2015, 245, 112–124. [Google Scholar] [CrossRef]
  54. Ji, W.; Viscarra Rossel, R.A.; Shi, Z. Accounting for the effects of water and the environment on proximally sensed VIS-NIR spectra and their calibrations. Eur. J. Soil Sci. 2015. [Google Scholar] [CrossRef]
  55. Ge, Y.; Morgan, C.L.S.; Ackerson, J.P. VisNIR spectra of dried ground soils predict properties of soils scanned moist and intact. Geoderma 2014, 221, 61–69. [Google Scholar] [CrossRef]

