
Monitoring Earthquake-Damaged Vegetation after the 2008 Wenchuan Earthquake in the Mountainous River Basins, Dujiangyan County

Abstract
:
1. Introduction
2. Study Area
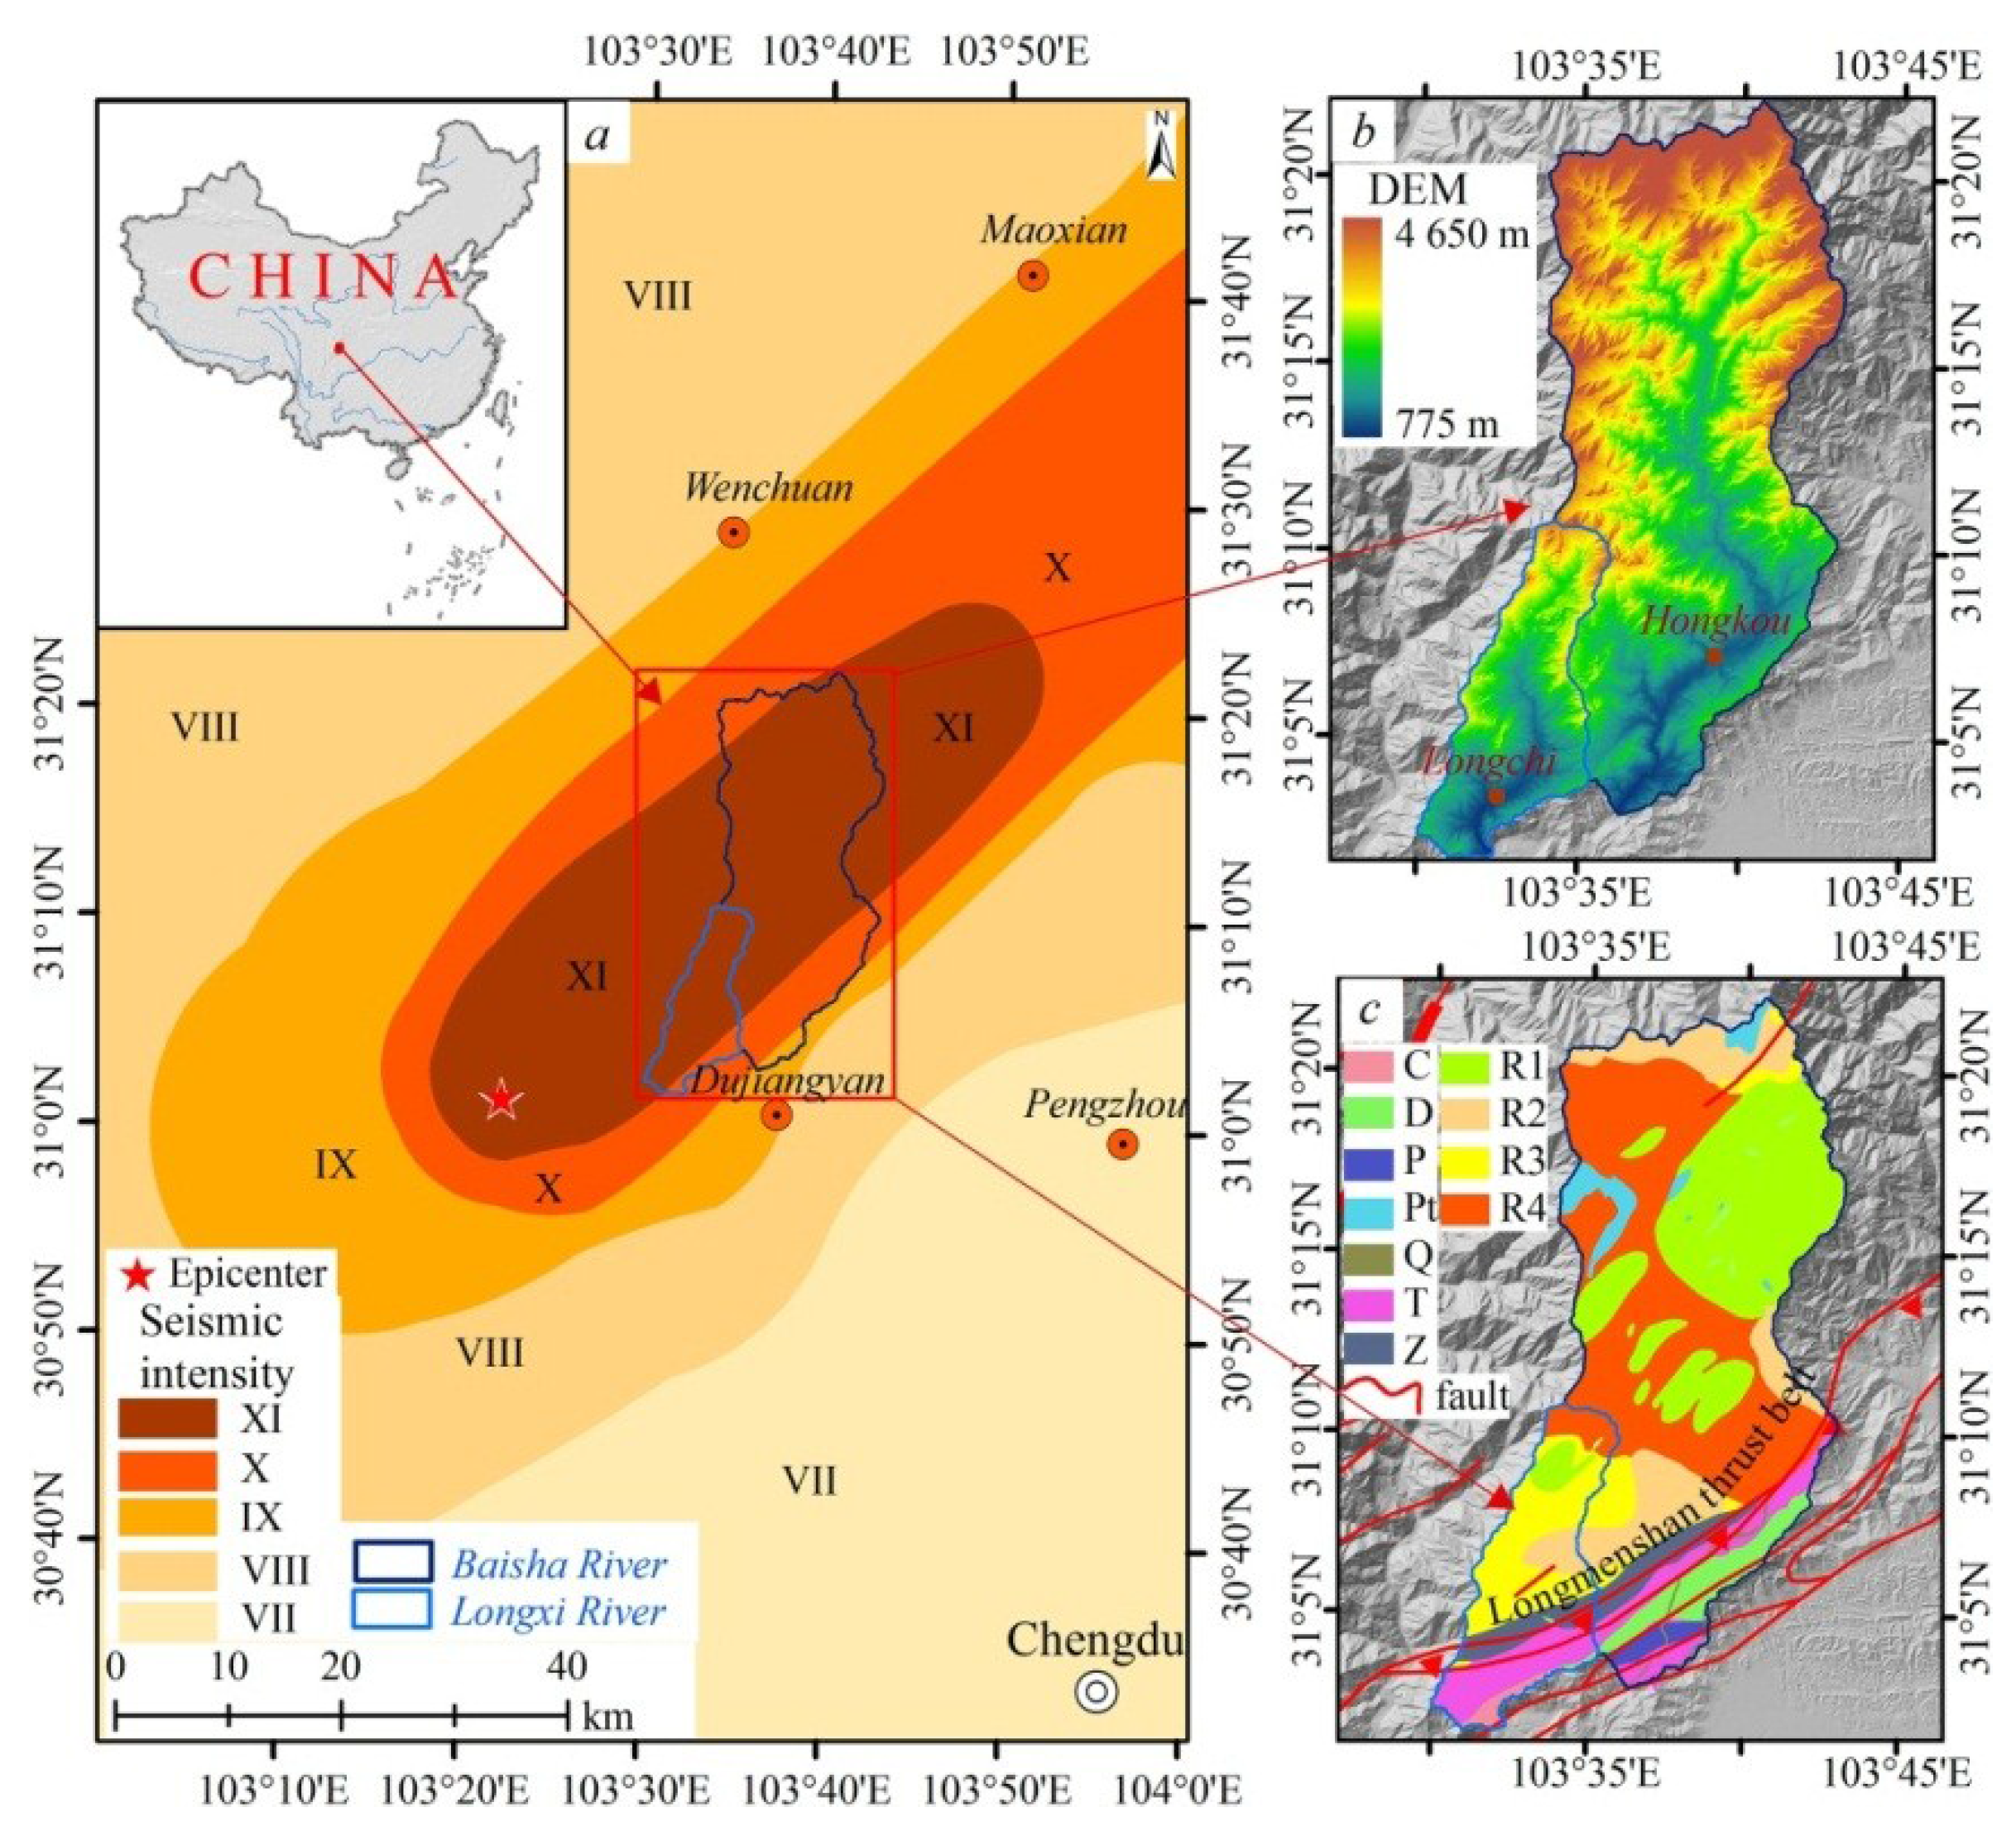
2.1. Location

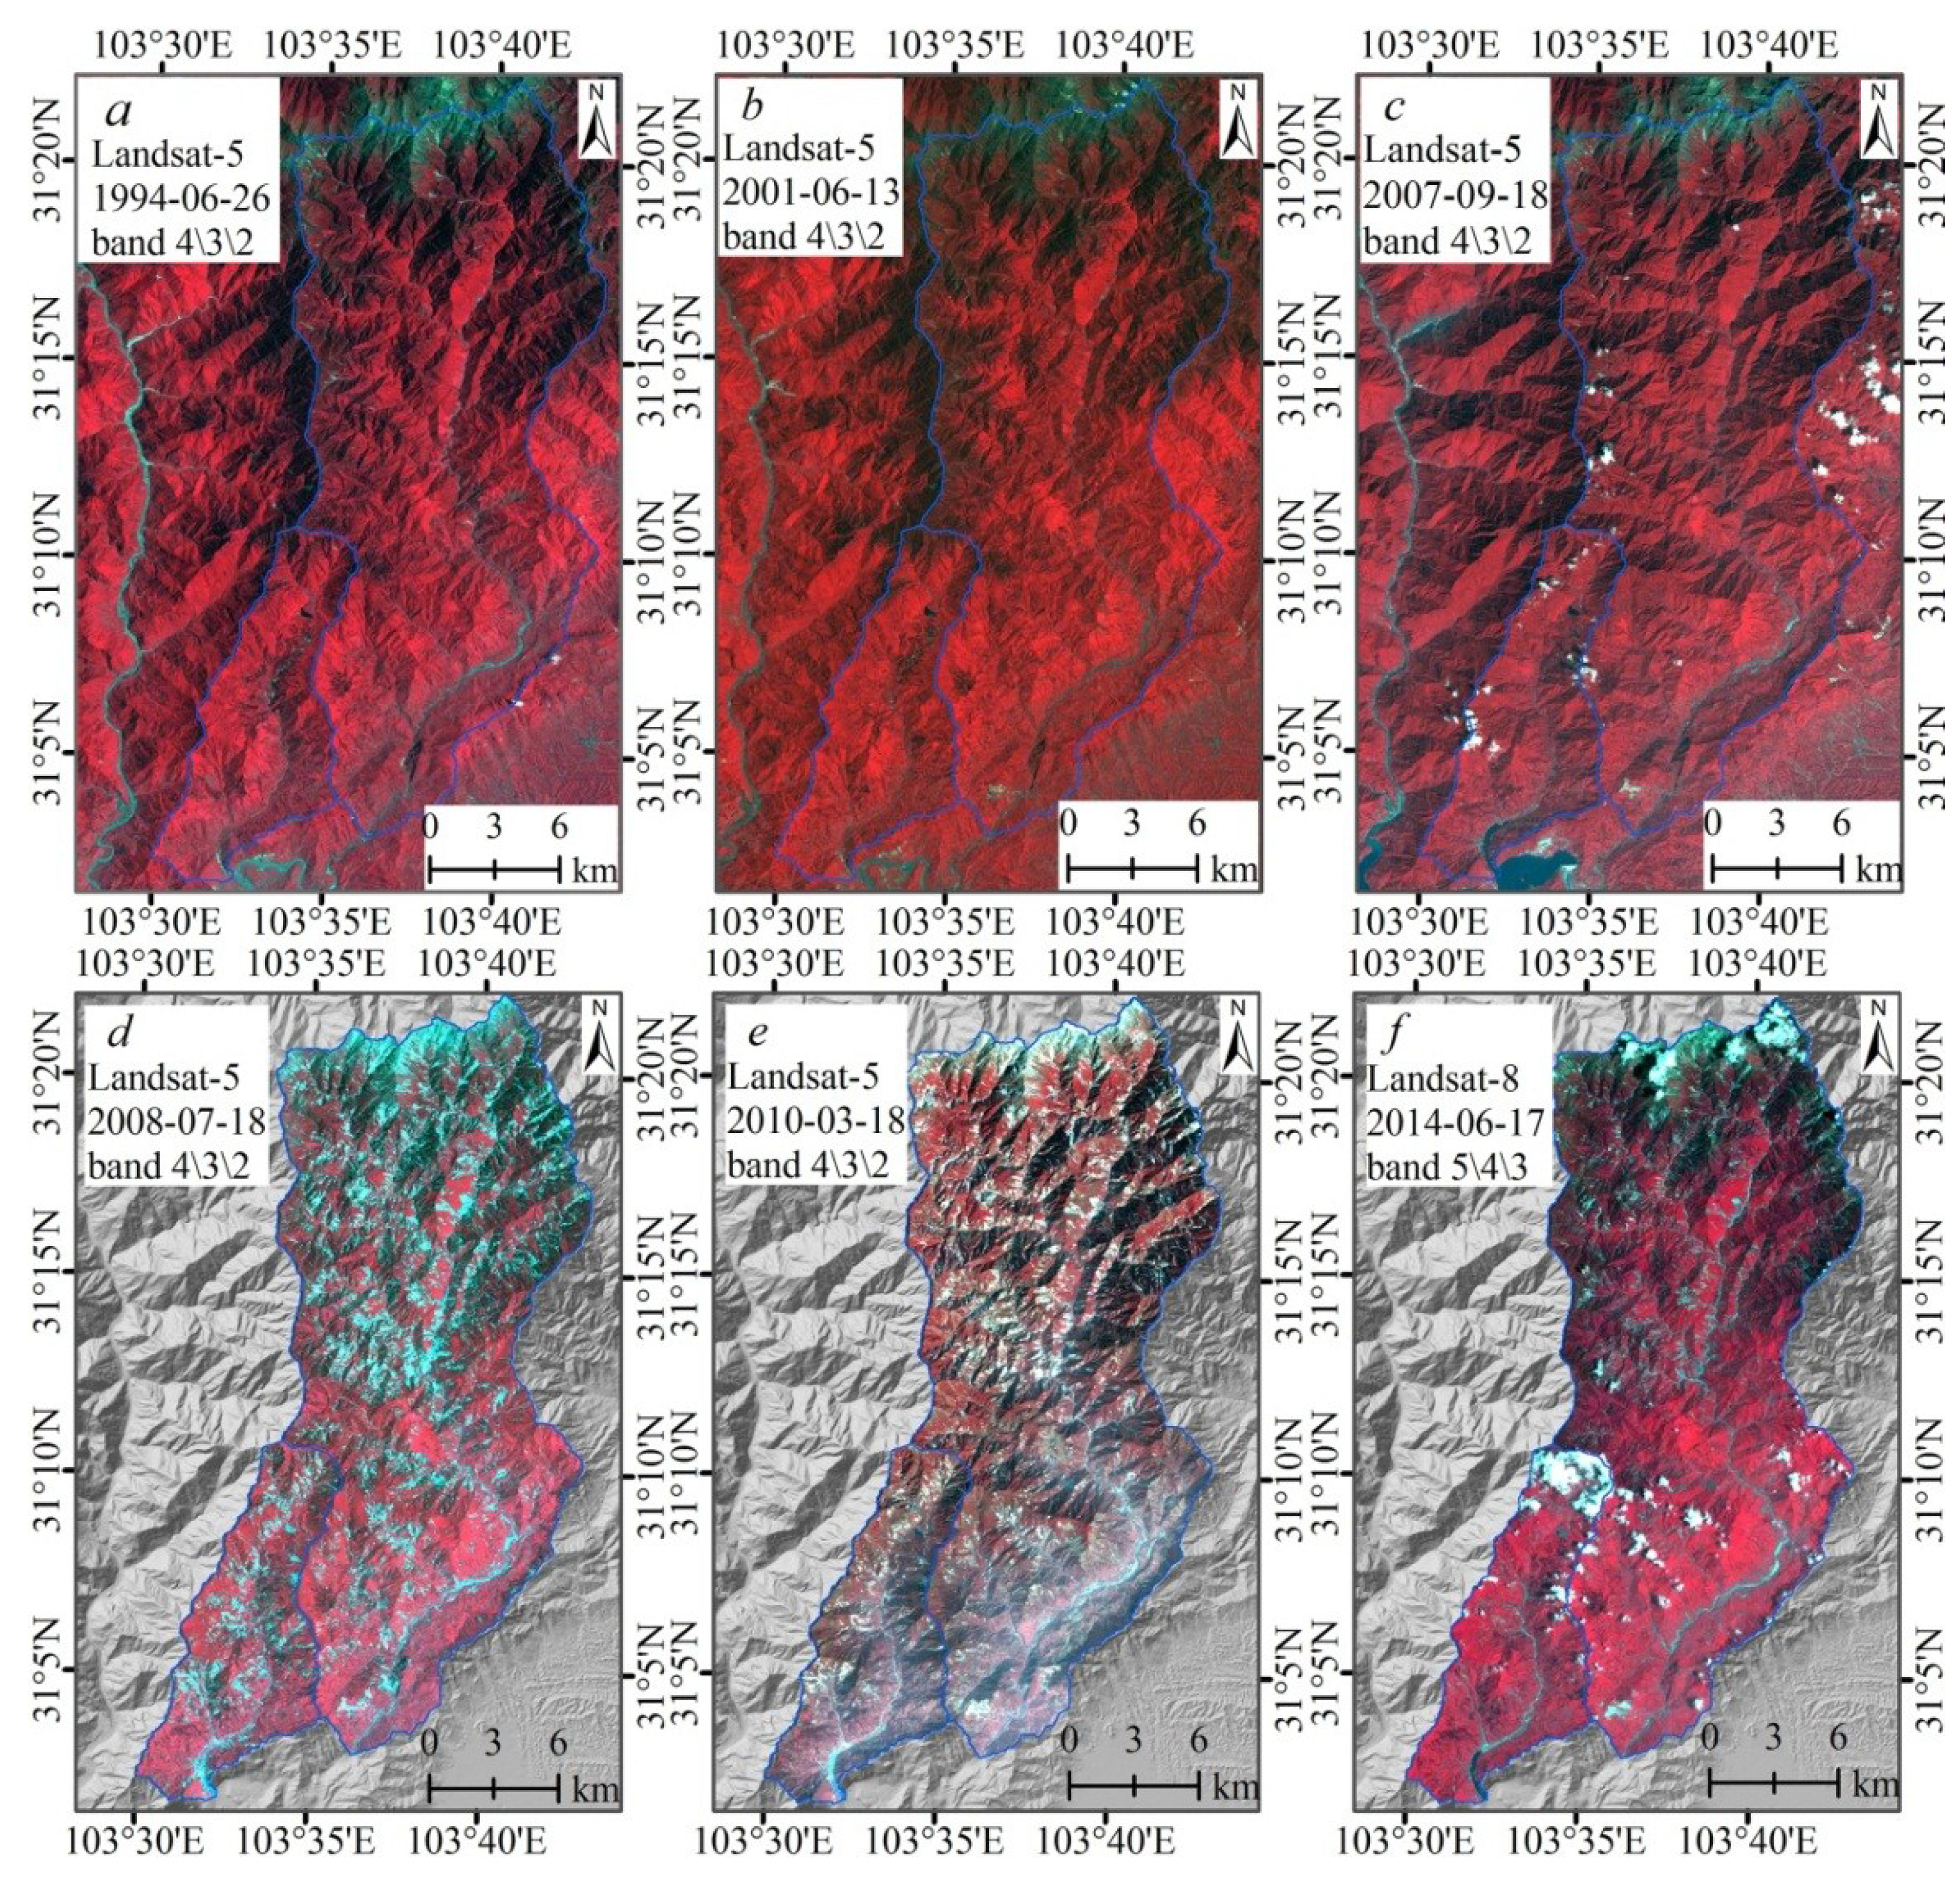
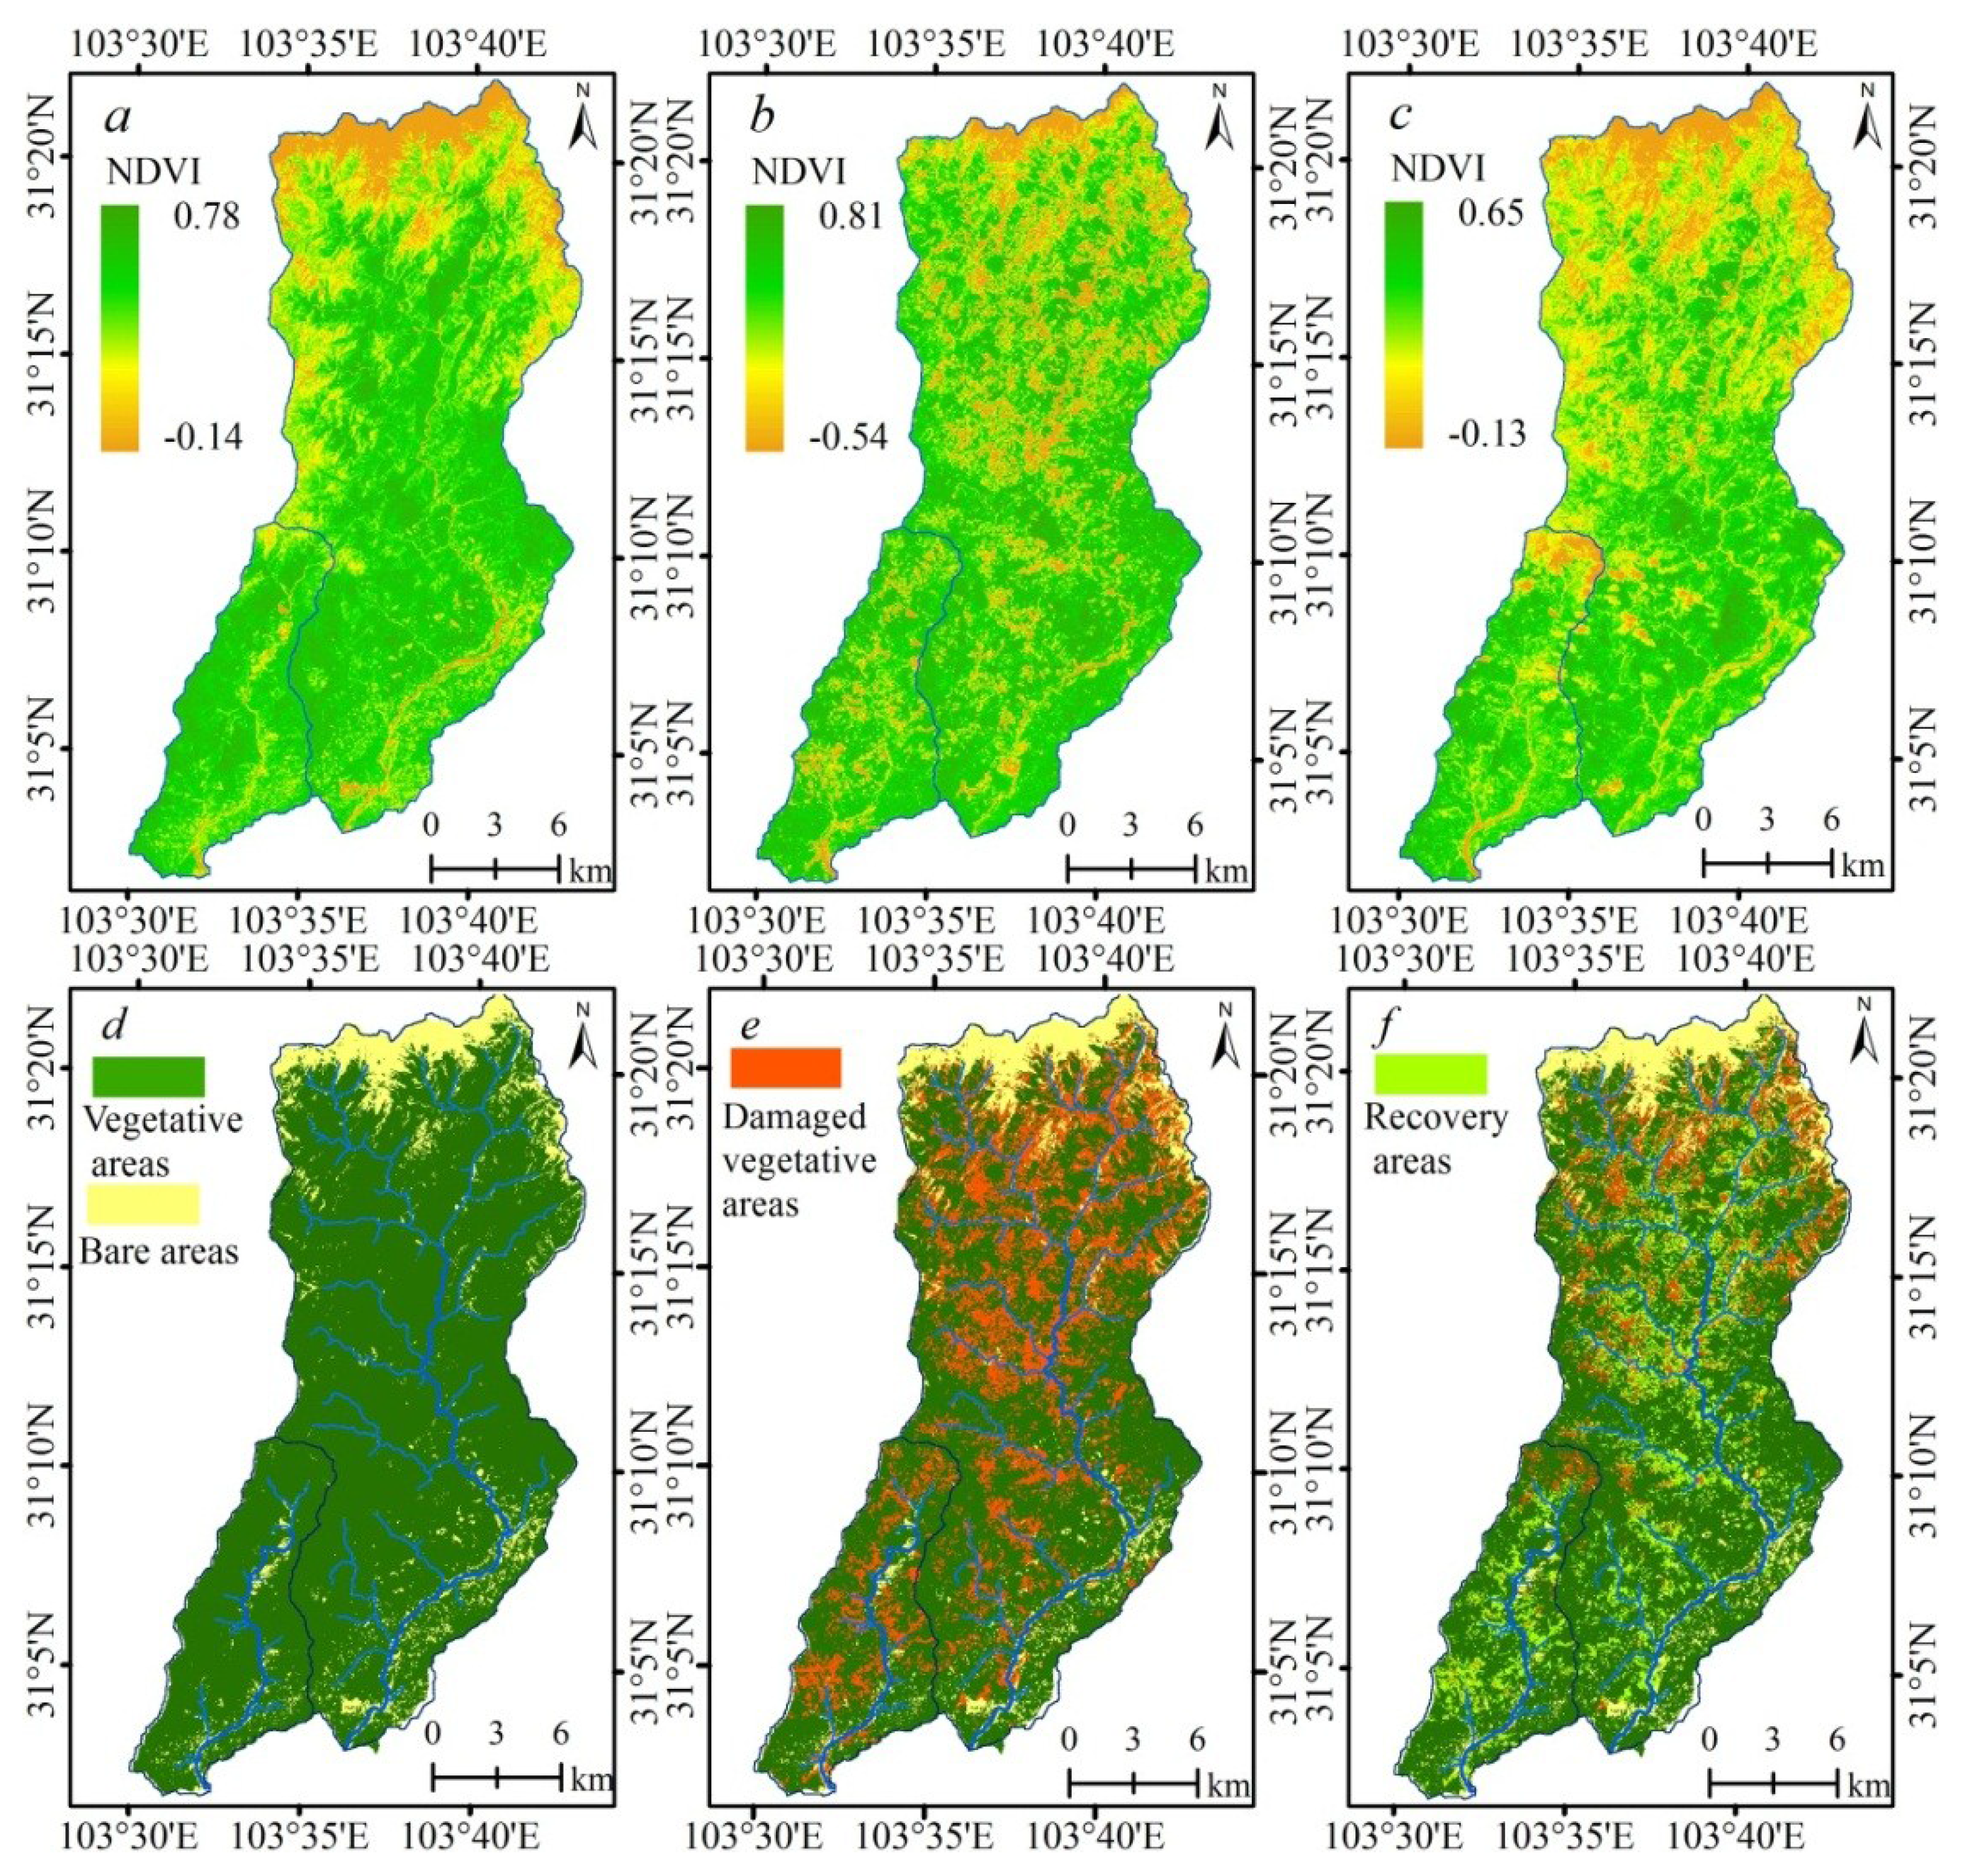
2.2. Pre-Earthquake and Post-Earthquake Vegetation in Study Area


3. Data Analysis
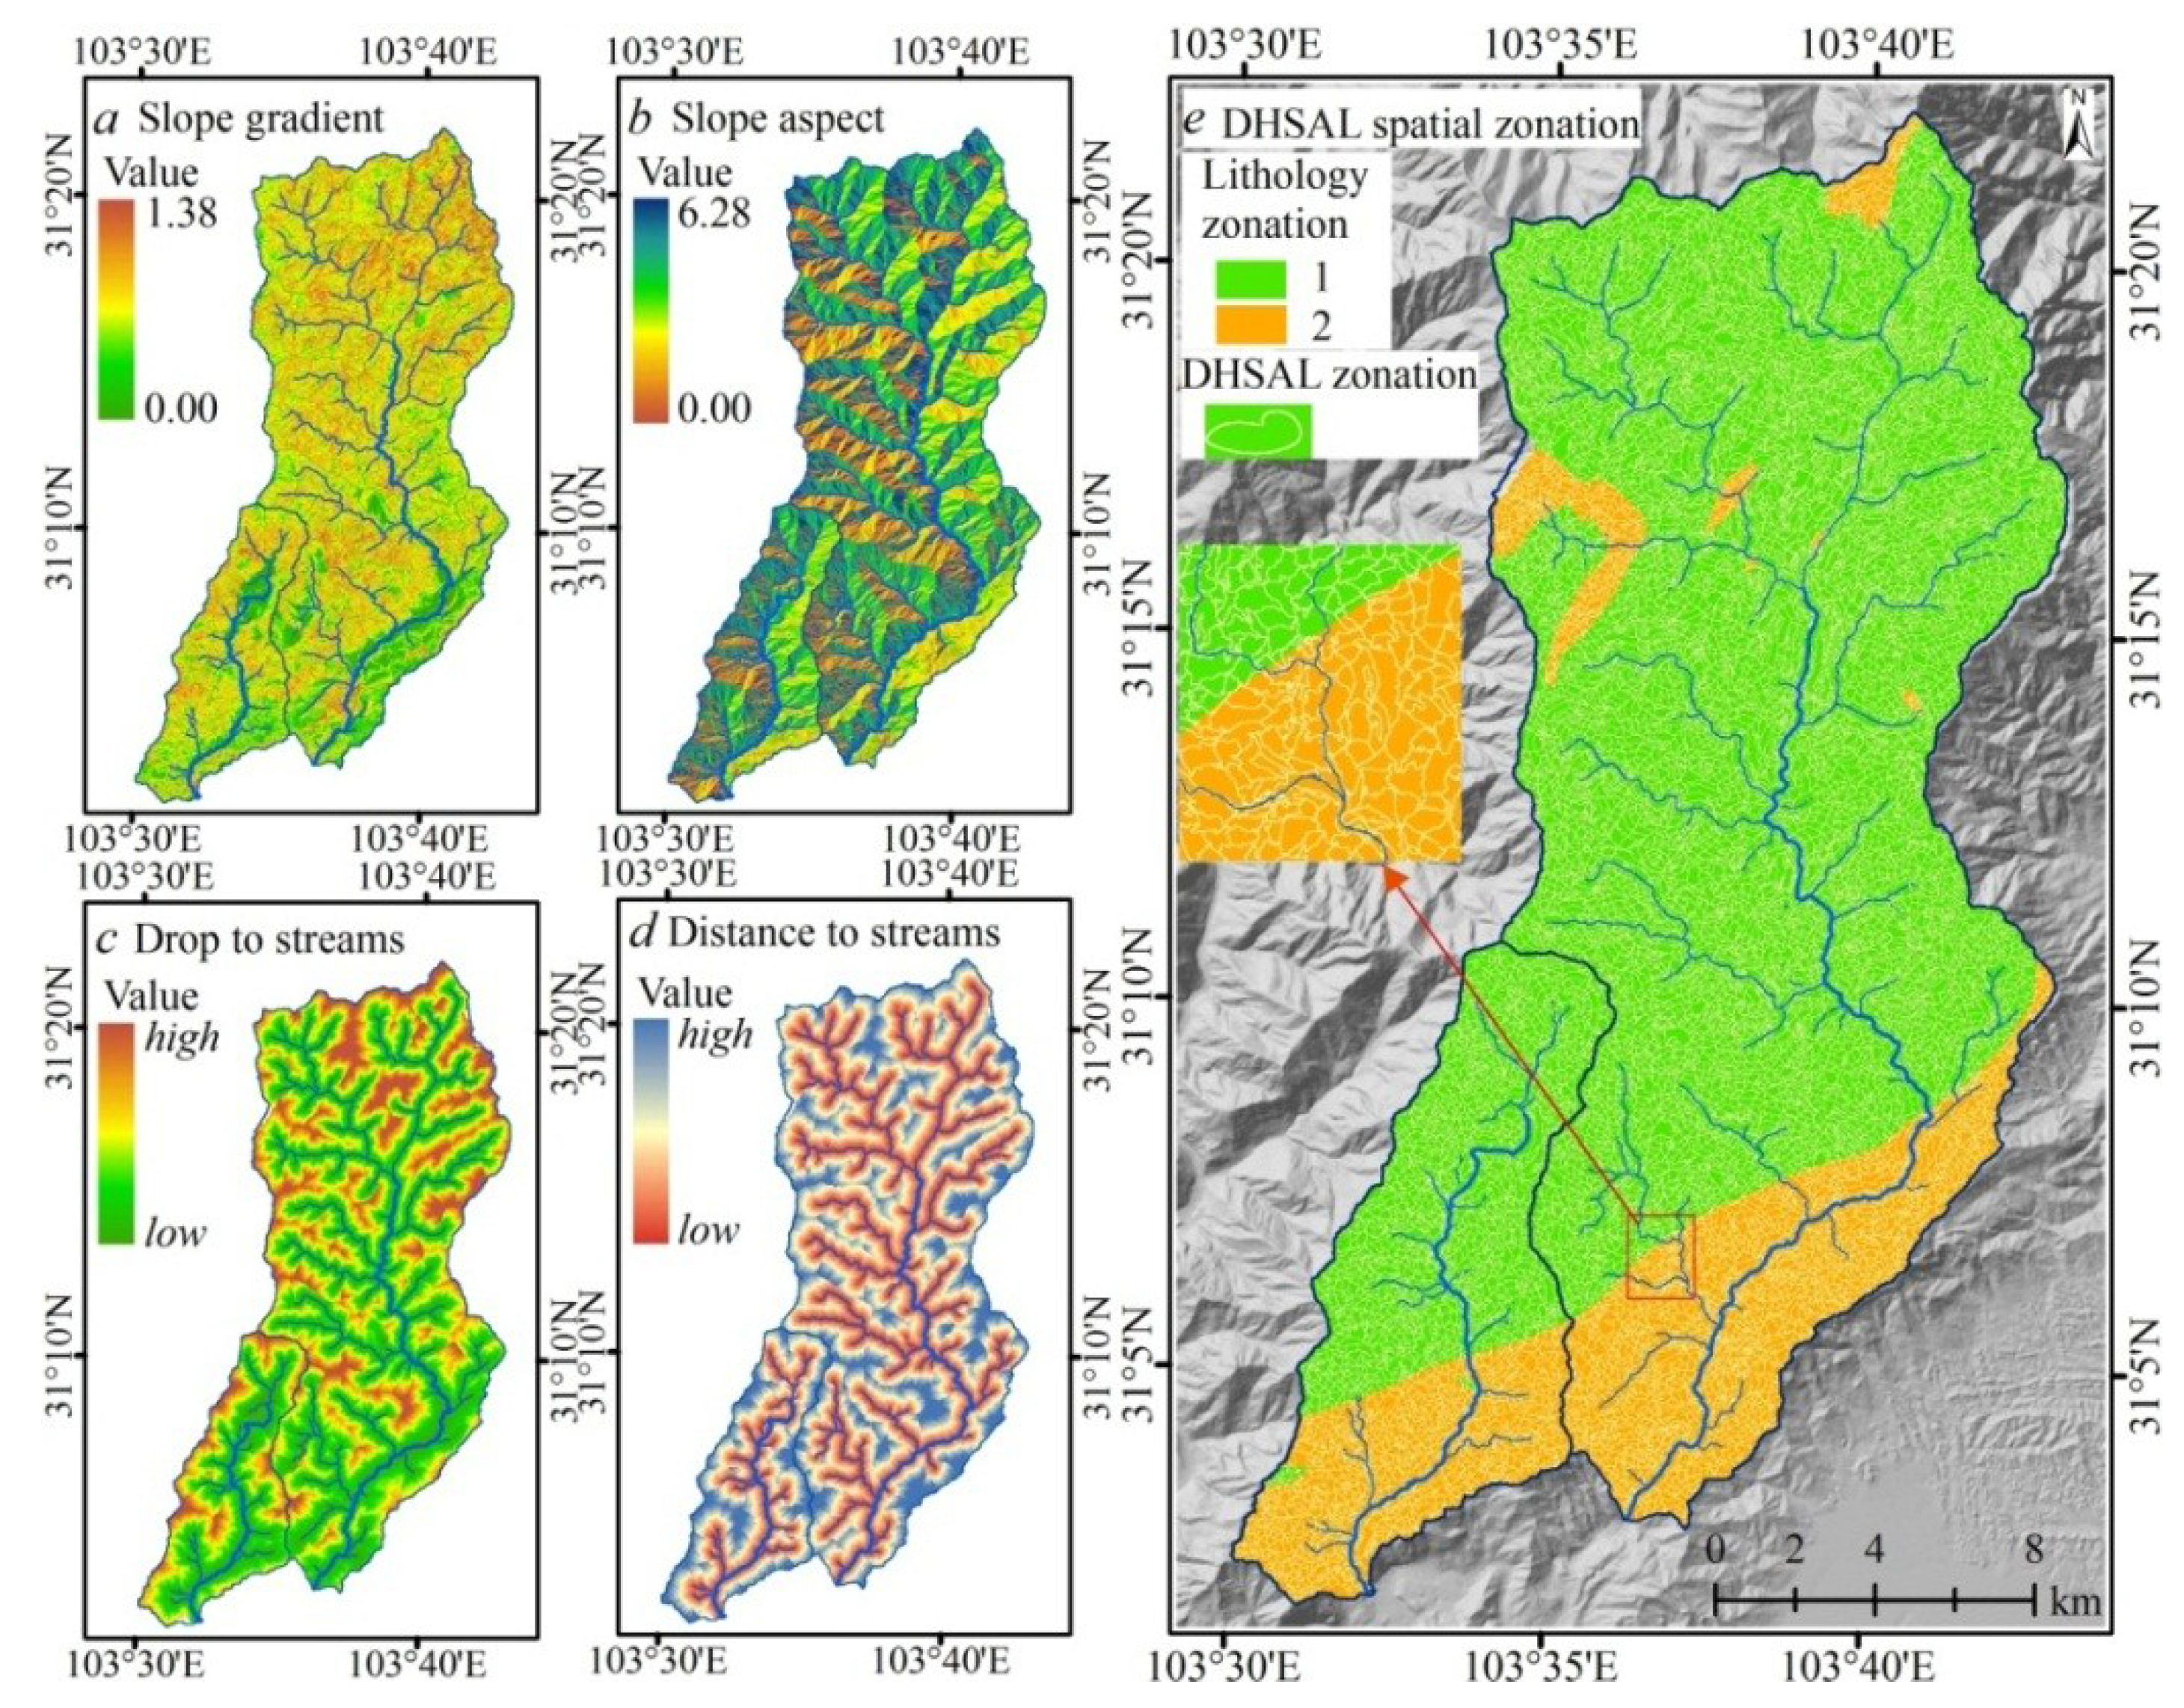
3.1. Vegetation Survival Environments in Mountain Basins


| River basin | i | R2 | |||
|---|---|---|---|---|---|
| Baisha | 0.816 | −0.307 | 0.053 | 1 | 0.874 |
| Baisha | 0.745 | −0.208 | 0.015 | 2 | 0.835 |
| Longxi | 0.590 | 0.314 | 0.097 | 1 | 0.854 |
| Longxi | 0.600 | 0.282 | 0.181 | 2 | 0.792 |
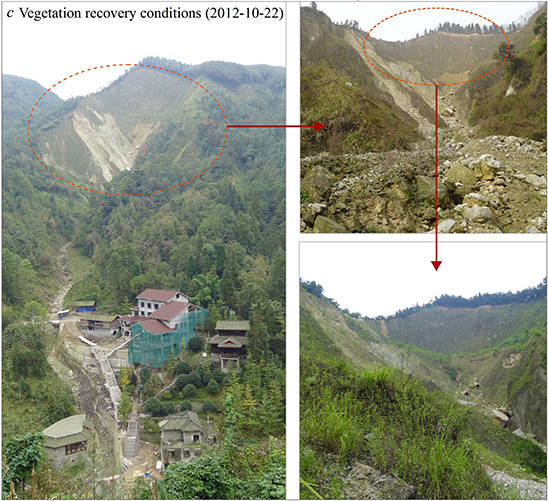
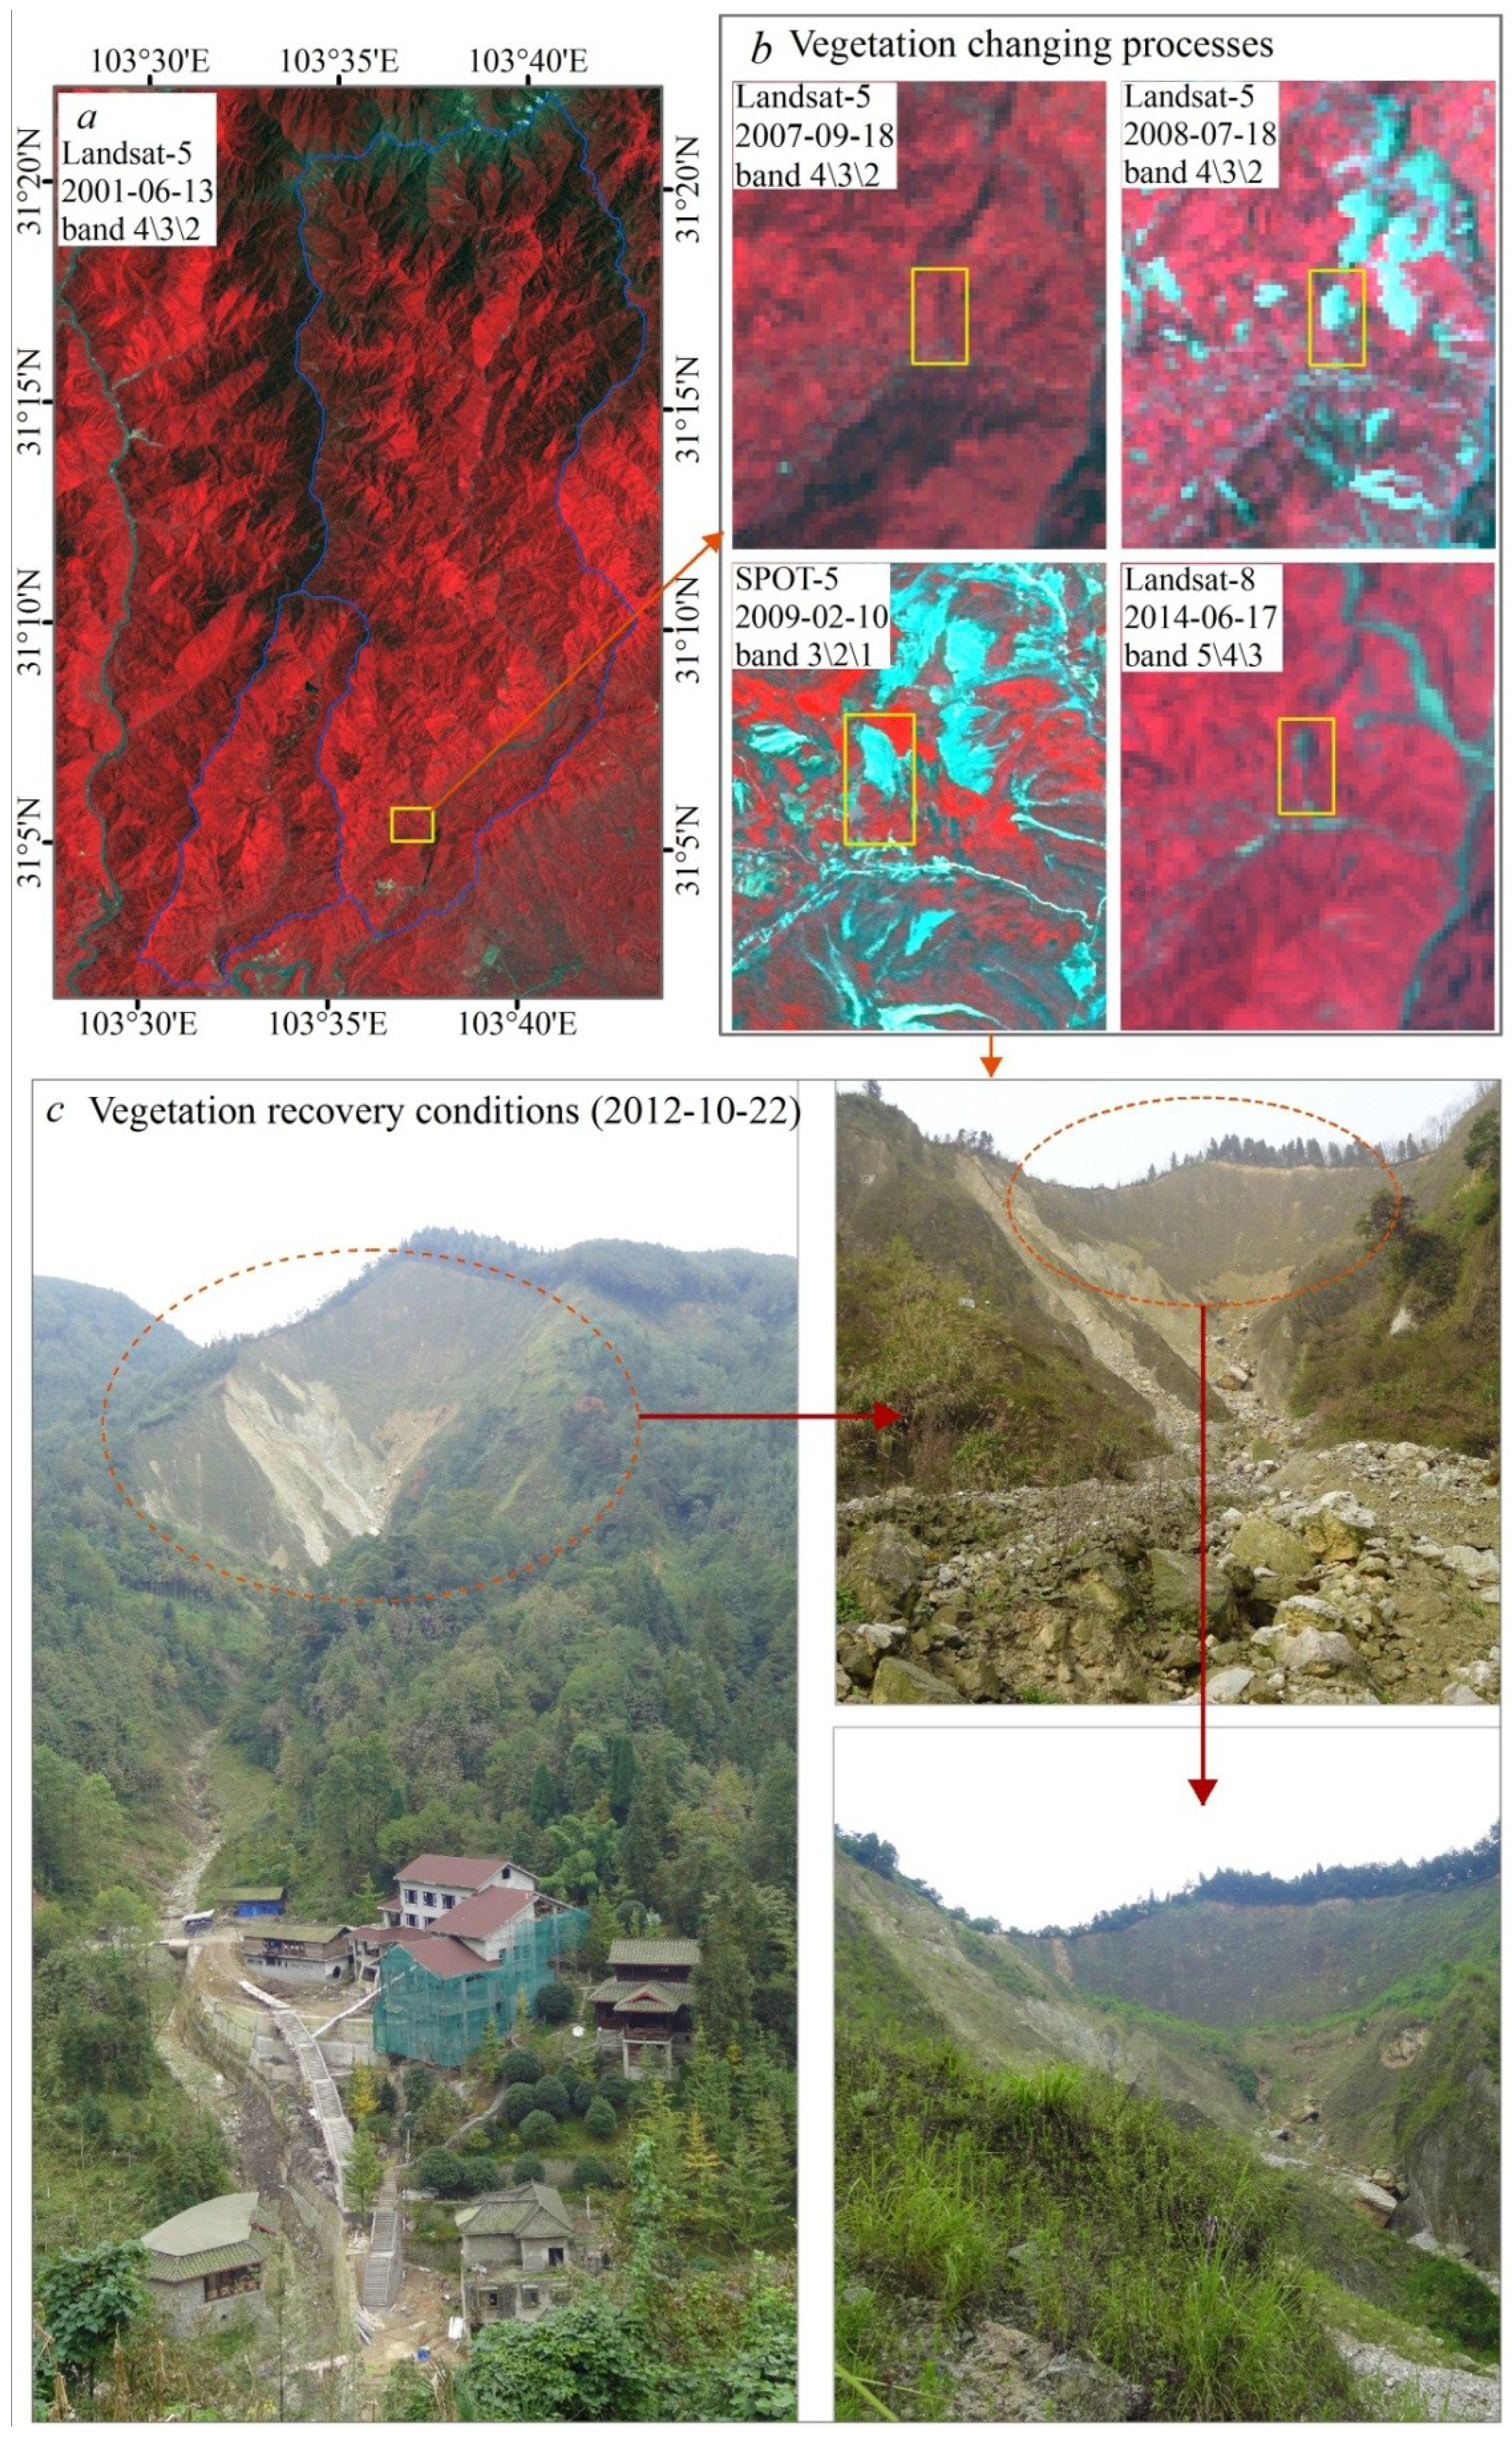
3.2. Vegetation Damaged during the Earthquake and Its Recovery Conditions after
| River basin | i | R2 | |||
|---|---|---|---|---|---|
| Baisha | 0.676 | −0.545 | 0.273 | 1 | 0.813 |
| Baisha | 0.561 | −0.457 | 0.244 | 2 | 0.754 |
| Longxi | 0.613 | −0.326 | 0.159 | 1 | 0.805 |
| Longxi | 0.754 | −0.556 | 0.250 | 2 | 0.726 |
| River basin | I | R2 | ||
|---|---|---|---|---|
| Baisha | 1.831 | −0.189 | 1 | 0.874 |
| Baisha | 1.713 | −0.231 | 2 | 0.835 |
| Longxi | 1.988 | −0.343 | 1 | 0.854 |
| Longxi | 1.295 | −0.132 | 2 | 0.792 |
4. Modeling Sediment and Flow Connectivity in One Given Basin
4.1. Modeling the Slope Material Stability
4.2. Sediment and Flow Connectivity Index, SCFI
5. Results
5.1. Slope Material Stability Changes in Study Area

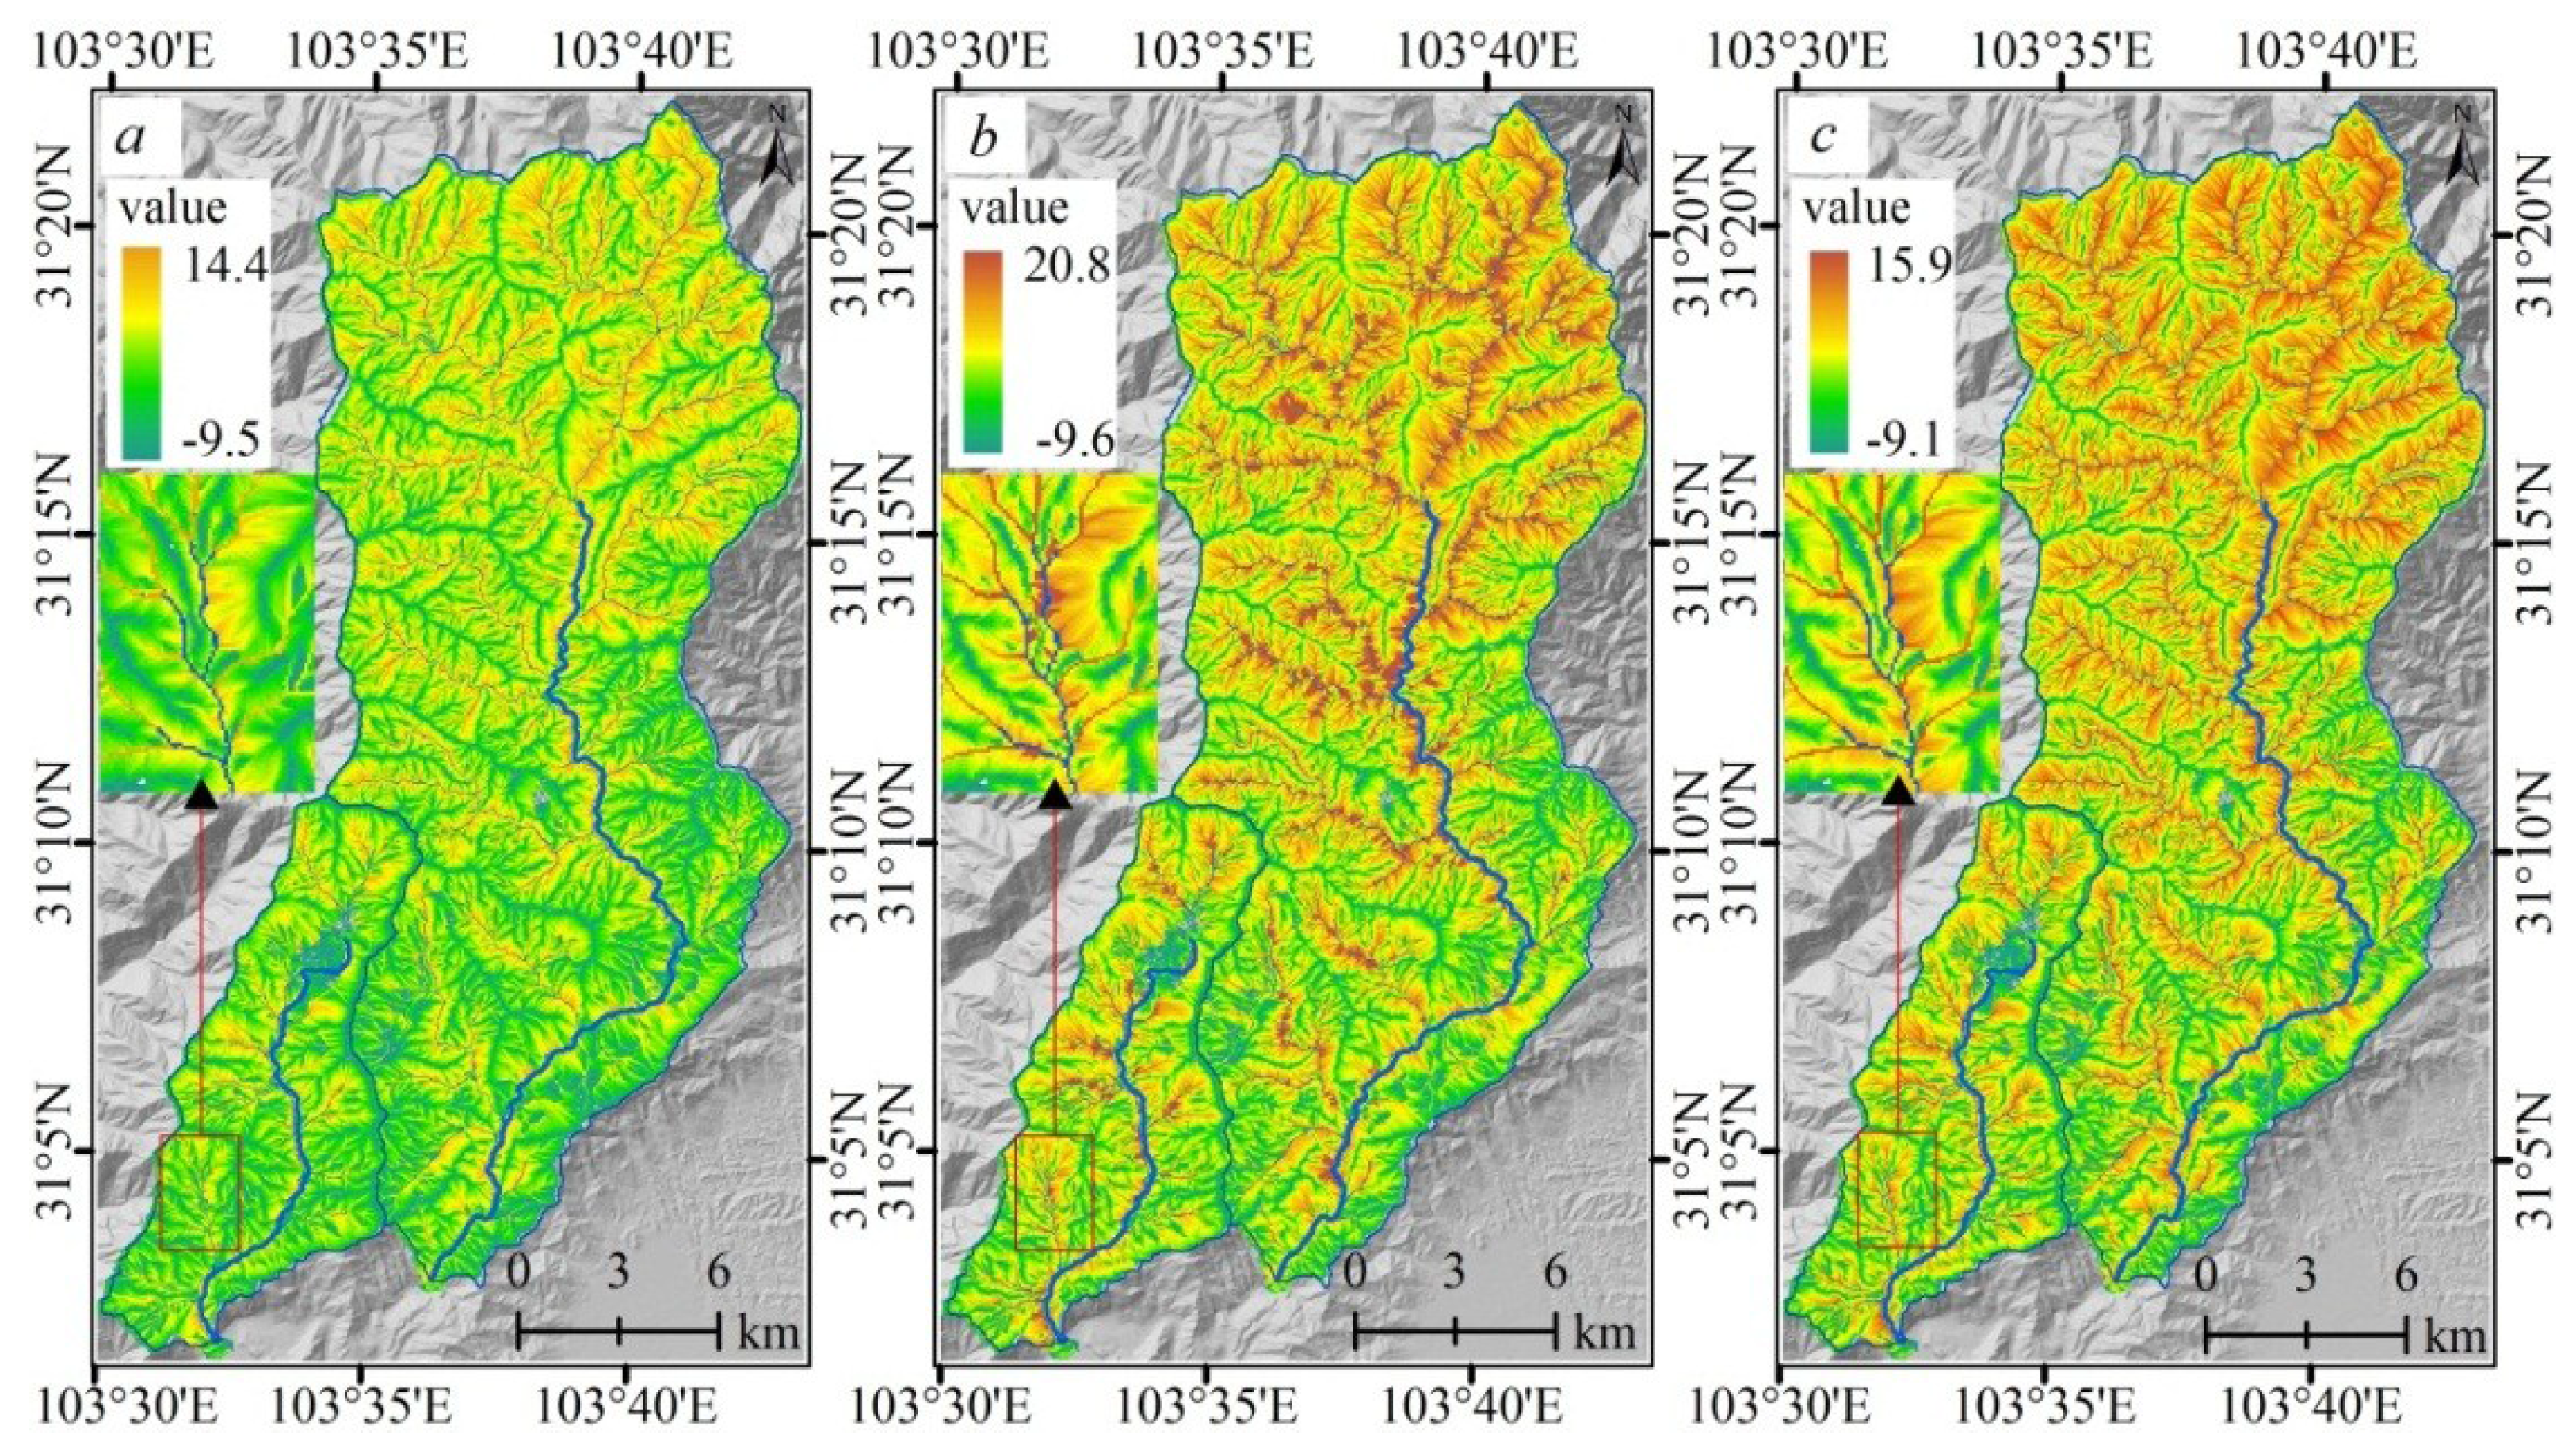
5.2. SFCI Changes in Study Area


6. Discussion
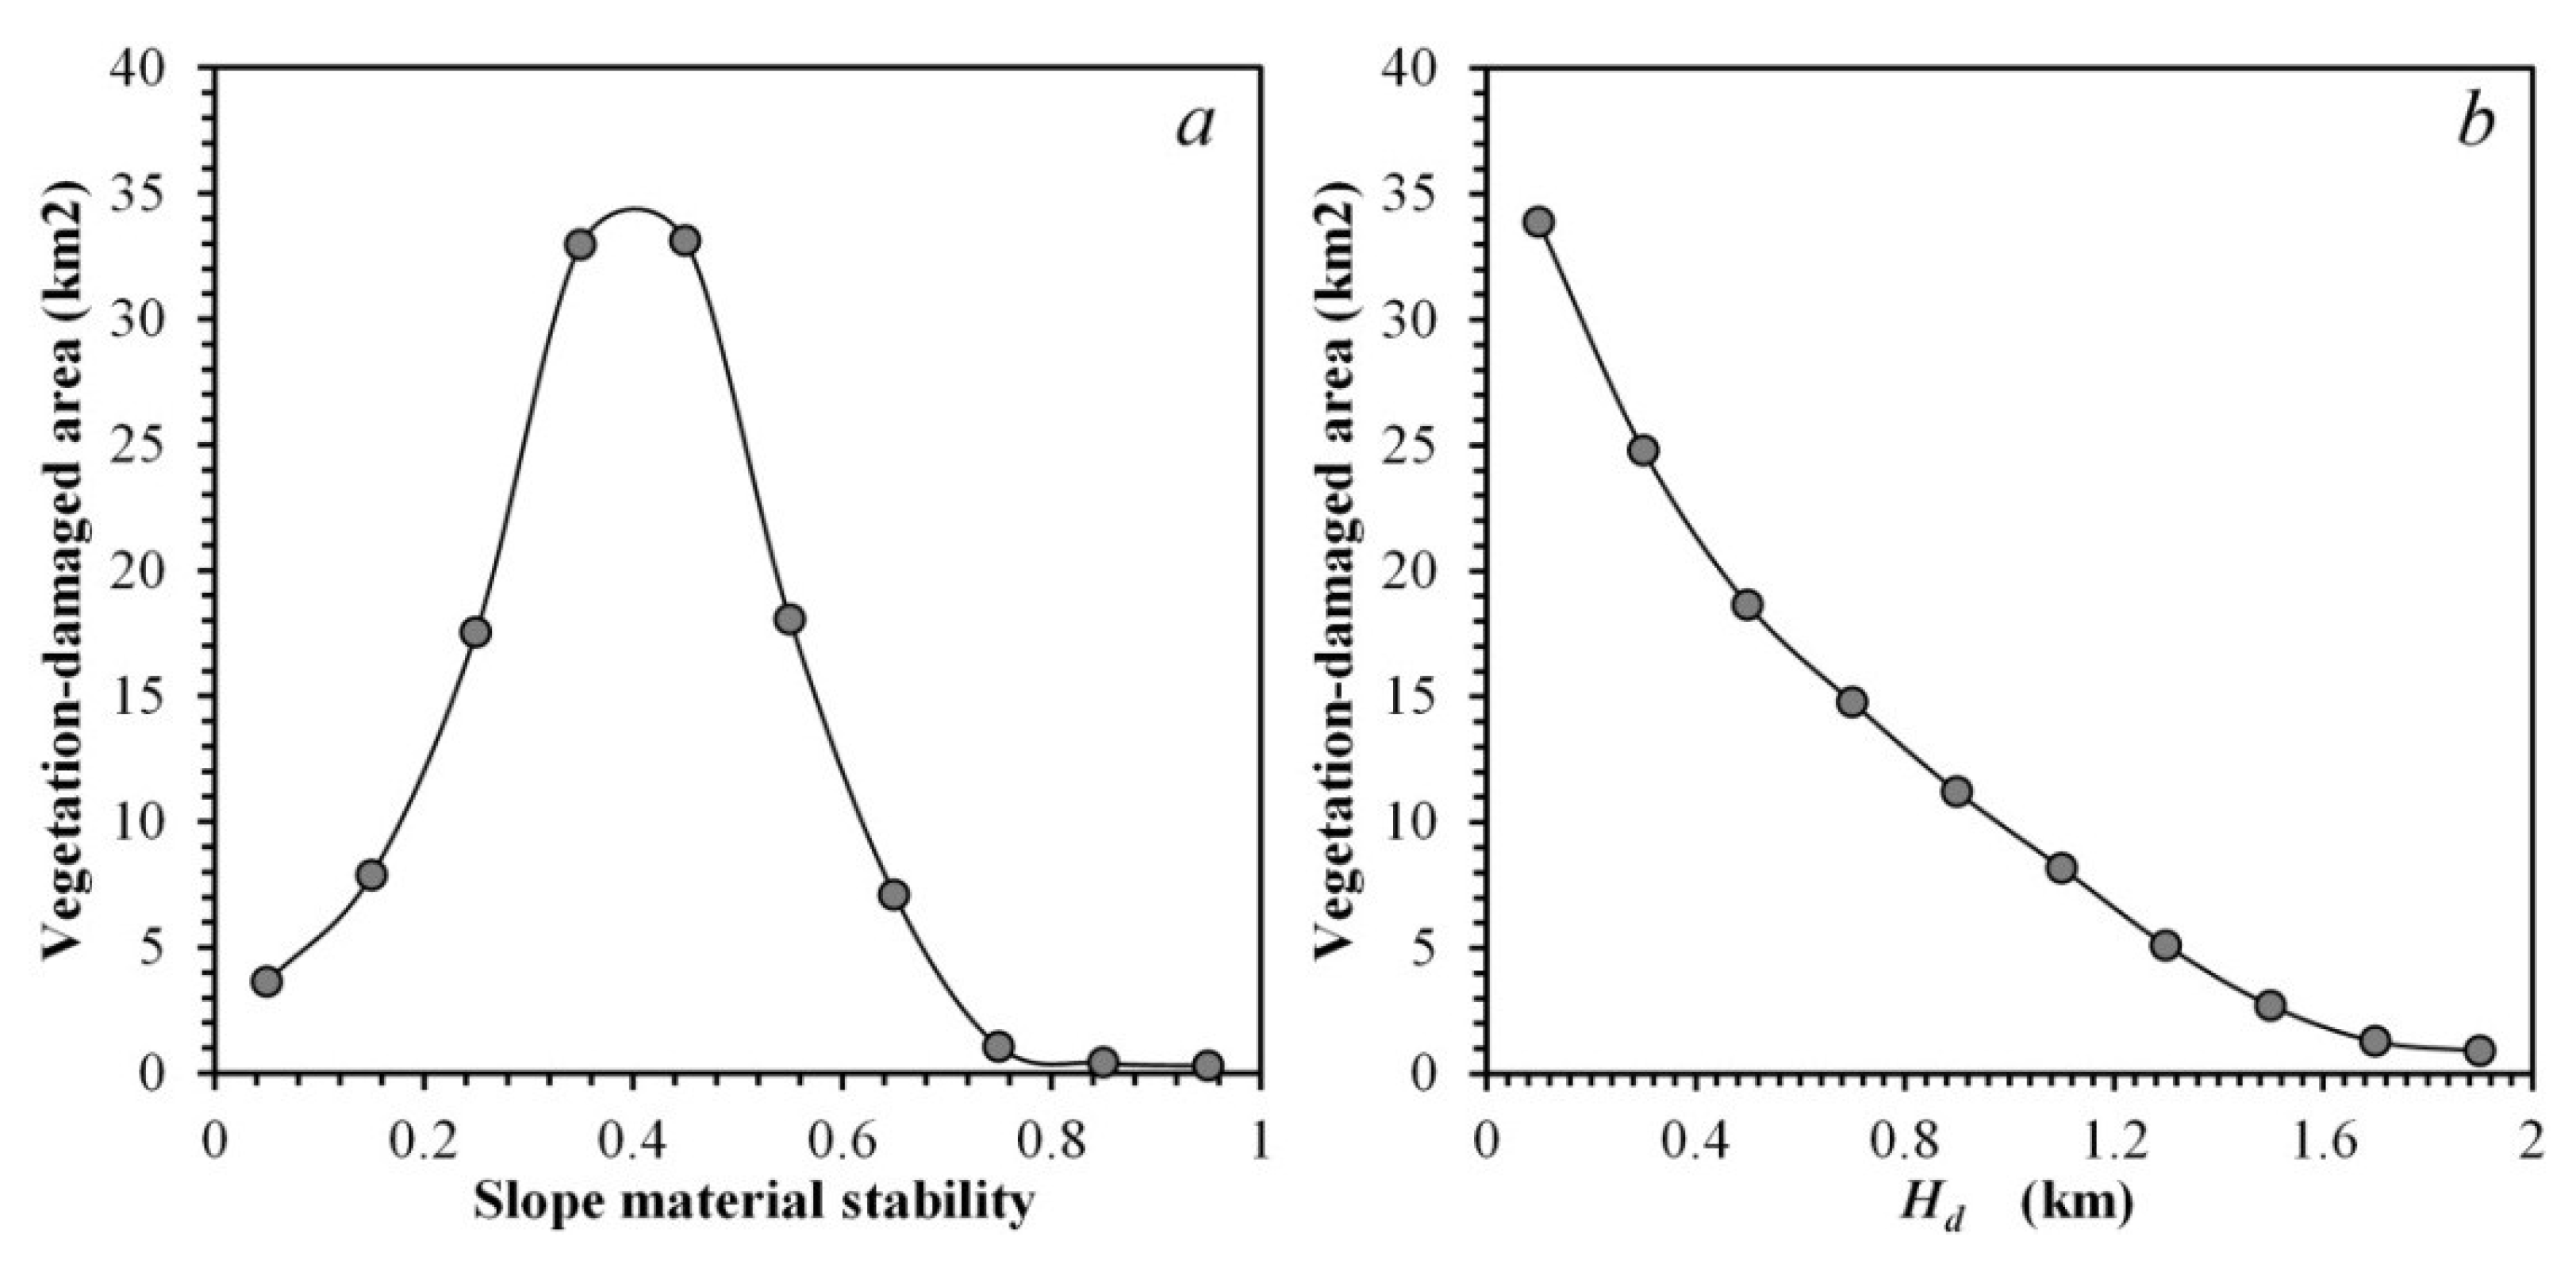
6.1. Relationships between Vegetation and Slope Stability
6.2. Debris Flow Events in Longxi River

6.3. Validity of the Sediment and Flow Connectivity Model
7. Conclusions
Acknowledgments
Author Contributions
Conflicts of Interest
References
- Huang, R.; Li, W. Development and distribution of geohazards triggered by the 5.12 Wenchuan earthquake in China. Sci. China Series E: Technol. Sci. 2009, 52, 810–819. [Google Scholar] [CrossRef]
- Cui, P.; Chen, X.; Zhu, Y.; Su, F.; Wei, F.; Han, Y.; Liu, H.; Zhuang, J. The Wenchuan earthquake (may 12, 2008), Sichuan Province, China, and resulting geohazards. Nat. Hazards 2009, 56, 19–36. [Google Scholar] [CrossRef]
- Dai, F.C.; Xu, C.; Yao, X.; Xu, L.; Tu, X.B.; Gong, Q.M. Spatial distribution of landslides triggered by the 2008 Ms 8.0 Wenchuan earthquake, China. J. Asian Earth Sci. 2011, 40, 883–895. [Google Scholar] [CrossRef]
- Qi, S.; Xu, Q.; Lan, H.; Zhang, B.; Liu, J. Spatial distribution analysis of landslides triggered by 2008.5.12 Wenchuan earthquake, China. Eng. Geol. 2010, 116, 95–108. [Google Scholar] [CrossRef]
- Xu, C.; Xu, X.; Yao, X.; Dai, F. Three (nearly) complete inventories of landslides triggered by the may 12, 2008 Wenchuan Mw 7.9 earthquake of China and their spatial distribution statistical analysis. Landslides 2013, 11, 441–461. [Google Scholar] [CrossRef]
- Cui, P.; Lin, Y.; Chen, C. Destruction of vegetation due to geo-hazards and its environmental impacts in the Wenchuan earthquake areas. Ecol. Eng. 2012, 44, 61–69. [Google Scholar] [CrossRef]
- Tang, C.; Zhu, J.; Qi, X.; Ding, J. Landslides induced by the Wenchuan earthquake and the subsequent strong rainfall event: A case study in the beichuan area of China. Eng. Geol. 2011, 122, 22–33. [Google Scholar] [CrossRef]
- Zhang, S.; Zhang, L.M.; Glade, T. Characteristics of earthquake- and rain-induced landslides near the epicenter of Wenchuan earthquake. Eng. Geol. 2014, 175, 58–73. [Google Scholar] [CrossRef]
- Wu, Z.; Barosh, P.J.; Zhang, Z.; Liao, H. Effects from the Wenchuan earthquake and seismic hazard in the Longmenshan Mountains at the eastern margin of the Tibetan Plateau. Eng. Geol. 2012, 143–144, 28–36. [Google Scholar] [CrossRef]
- Liu, G.; Li, J.; Xu, Z.; Wu, J.; Chen, Q.; Zhang, H.; Zhang, R.; Jia, H.; Luo, X. Surface deformation associated with the 2008 Ms8.0 Wenchuan earthquake from ALOS l-band SAR interferometry. Int. J. Appl. Earth Obs. Geoinform. 2010, 12, 496–505. [Google Scholar] [CrossRef]
- Chen, F.; Guo, H.; Ishwaran, N.; Zhou, W.; Yang, R.; Jing, L.; Chen, F.; Zeng, H. Synthetic aperture radar (SAR) interferometry for assessing Wenchuan earthquake (2008) deforestation in the Sichuan giant panda site. Remote Sens. 2014, 6, 6283–6299. [Google Scholar] [CrossRef]
- Liu, Y.; Liu, R.; Ge, Q. Evaluating the vegetation destruction and recovery of Wenchuan earthquake using modis data. Nat. Hazards 2010, 54, 851–862. [Google Scholar] [CrossRef]
- Lu, T.; Zeng, H.; Luo, Y.; Wang, Q.; Shi, F.; Sun, G.; Wu, Y.; Wu, N. Monitoring vegetation recovery after China’s may 2008 Wenchuan earthquake using Landsat TM time-series data: A case study in Mao County. Ecol. Res. 2012, 27, 955–966. [Google Scholar] [CrossRef]
- Jiao, Q.; Zhang, B.; Liu, L.; Li, Z.; Yue, Y.; Hu, Y. Assessment of spatio-temporal variations in vegetation recovery after the Wenchuan earthquake using Landsat data. Nat. Hazards 2014, 70, 1309–1326. [Google Scholar] [CrossRef]
- Zhang, J.; Hull, V.; Huang, J.; Yang, W.; Zhou, S.; Xu, W.; Huang, Y.; Ouyang, Z.; Zhang, H.; Liu, J. Natural recovery and restoration in giant panda habitat after the Wenchuan earthquake. For. Ecol. Manag. 2014, 319, 1–9. [Google Scholar] [CrossRef]
- Li, Z.; Jiao, Q.; Liu, L.; Tang, H.; Liu, T. Monitoring geologic hazards and vegetation recovery in the Wenchuan earthquake region using aerial photography. ISPRS Int. J. Geo-Inform. 2014, 3, 368–390. [Google Scholar] [CrossRef]
- Lin, W.-T.; Chou, W.-C.; Lin, C.-Y.; Huang, P.-H.; Tsai, J.-S. Vegetation recovery monitoring and assessment at landslides caused by earthquake in central taiwan. For. Ecol. Manag. 2005, 210, 55–66. [Google Scholar] [CrossRef]
- Garwood, N.C. Earthquake-caused landslides in panama: Recovery of the vegetation. Natl. Geogr. Soc. Res. Rep. (USA) 1985, 21, 182–183. [Google Scholar]
- Lin, W.-T.; Chou, W.-C.; Lin, C.-Y. Earthquake-induced landslide hazard and vegetation recovery assessment using remotely sensed data and a neural network-based classifier: A case study in central taiwan. Nat. Hazards 2008, 47, 331–347. [Google Scholar] [CrossRef]
- Koi, T.; Hotta, N.; Ishigaki, I.; Matuzaki, N.; Uchiyama, Y.; Suzuki, M. Prolonged impact of earthquake-induced landslides on sediment yield in a mountain watershed: The Tanzawa Region, japan. Geomorphology 2008, 101, 692–702. [Google Scholar] [CrossRef]
- Lin, W.-T.; Lin, C.-Y.; Chou, W.-C. Assessment of vegetation recovery and soil erosion at landslides caused by a catastrophic earthquake: A case study in Central Taiwan. Ecol. Eng. 2006, 28, 79–89. [Google Scholar] [CrossRef]
- Rau, J.-Y.; Chen, L.-C.; Liu, J.-K.; Wu, T.-H. Dynamics monitoring and disaster assessment for watershed management using time-series satellite images. IEEE Trans. Geosci. Remote Sens. 2007, 45, 1641–1649. [Google Scholar] [CrossRef]
- Yeh, C.-H.; Loh, C.-H.; Tsai, K.-C. Overview of Taiwan earthquake loss estimation system. Nat. Hazards 2006, 37, 23–37. [Google Scholar] [CrossRef]
- Stow, D.A.; Hope, A.; McGuire, D.; Verbyla, D.; Gamon, J.; Huemmrich, F.; Houston, S.; Racine, C.; Sturm, M.; Tape, K.; et al. Remote sensing of vegetation and land-cover change in arctic tundra ecosystems. Remote Sens. Environ. 2004, 89, 281–308. [Google Scholar] [CrossRef]
- Stern, M.J.; Churchill, S.; Balslev, H.; Forero, E.; Luteyn, J. Vegetation recovery on earthquake-triggered landslide sites in the Ecuadorian Andes. In Proceedings of a Symposium Biodiversity and Conservation of Neotropical montane Forests, New York Botanical Garden, NY, USA, 21–26 June 1995; pp. 207–220.
- Nakashizuka, T.; Iida, S.; Suzuki, W.; Tanimoto, T. Seed dispersal and vegetation development on a debris avalanche on the Ontake Volcano, Central Japan. J. Veg. Sci. 1993, 4, 537–542. [Google Scholar] [CrossRef]
- Lin, C.-Y.; Lo, H.-M.; Chou, W.-C.; Lin, W.-T. Vegetation recovery assessment at the Jou-Jou Mountain landslide area caused by the 921 earthquake in Central Taiwan. Ecol. Modell. 2004, 176, 75–81. [Google Scholar] [CrossRef]
- Chou, W.-C.; Lin, W.-T.; Lin, C.-Y. Vegetation recovery patterns assessment at landslides caused by catastrophic earthquake: A case study in Central Taiwan. Environ. Monit. Assess. 2009, 152, 245–257. [Google Scholar] [CrossRef] [PubMed]
- Shieh, C.L.; Chen, Y.S.; Tsai, Y.J.; Wu, J.H. Variability in rainfall threshold for debris flow after the Chi-Chi earthquake in Central Taiwan, China. Int. J. Sediment Res. 2009, 24, 177–188. [Google Scholar] [CrossRef]
- Chu, H.-J. Spatiotemporal analysis of vegetation index after typhoons in the mountainous watershed. Int. J. Appl. Earth Obs. Geoinform. 2014, 28, 20–27. [Google Scholar] [CrossRef]
- Tofani, V.; Del Ventisette, C.; Moretti, S.; Casagli, N. Integration of remote sensing techniques for intensity zonation within a landslide area: A case study in the Northern Apennines, Italy. Remote Sens. 2014, 6, 907–924. [Google Scholar] [CrossRef]
- Qiao, G.; Lu, P.; Scaioni, M.; Xu, S.; Tong, X.; Feng, T.; Wu, H.; Chen, W.; Tian, Y.; Wang, W.; et al. Landslide investigation with remote sensing and sensor network: From susceptibility mapping and scaled-down simulation towards in situ sensor network design. Remote Sens. 2013, 5, 4319–4346. [Google Scholar] [CrossRef]
- Bathurst, J.C.; Bovolo, C.I.; Cisneros, F. Modelling the effect of forest cover on shallow landslides at the river basin scale. Ecol. Eng. 2010, 36, 317–327. [Google Scholar] [CrossRef] [Green Version]
- Zhang, H.; Chi, T.; Fan, J.; Hu, K.; Peng, L. Spatial analysis of Wenchuan earthquake-damaged vegetation in the mountainous basins and its applications. Remote Sens. 2015, 7, 5785–5804. [Google Scholar] [CrossRef]
- Yang, X.; Chen, L. Using multi-temporal remote sensor imagery to detect earthquake-triggered landslides. Int. J. Appl. Earth Obs. Geoinform. 2010, 12, 487–495. [Google Scholar] [CrossRef]
- Croke, J.; Mockler, S.; Fogarty, P.; Takken, I. Sediment concentration changes in runoff pathways from a forest road network and the resultant spatial pattern of catchment connectivity. Geomorphology 2005, 68, 257–268. [Google Scholar] [CrossRef]
- Borselli, L.; Cassi, P.; Torri, D. Prolegomena to sediment and flow connectivity in the landscape: A GIS and field numerical assessment. Catena 2008, 75, 268–277. [Google Scholar] [CrossRef]
- Hooke, J. Coarse sediment connectivity in river channel systems: A conceptual framework and methodology. Geomorphology 2003, 56, 79–94. [Google Scholar] [CrossRef]
- Haneberg, W.C. Observation and analysis of pore pressure fluctuations in a thin colluvium landslide complex near cincinnati, Ohio. Eng. Geol. 1991, 31, 159–184. [Google Scholar] [CrossRef]
- Marston, R.A. Geomorphology and vegetation on hillslopes: Interactions, dependencies, and feedback loops. Geomorphology 2010, 116, 206–217. [Google Scholar] [CrossRef]
- Harden, C.P. Human impacts on headwater fluvial systems in the northern and central Andes. Geomorphology 2006, 79, 249–263. [Google Scholar] [CrossRef]
- Tang, C.; Zhu, J.; Li, W.L.; Liang, J.T. Rainfall-triggered debris flows following the Wenchuan earthquake. Bull. Eng. Geol. Environ. 2009, 68, 187–194. [Google Scholar] [CrossRef]
- Tang, C.; Zhu, J.; Ding, J.; Cui, X.F.; Chen, L.; Zhang, J.S. Catastrophic debris flows triggered by a 14 August 2010 rainfall at the epicenter of the Wenchuan earthquake. Landslides 2011, 8, 485–497. [Google Scholar] [CrossRef]
- Xu, Q.; Zhang, S.; Li, W.L.; van Asch, T.W.J. The 13 August 2010 catastrophic debris flows after the 2008 Wenchuan earthquake, China. Nat. Hazards Earth Syst. Sci. 2012, 12, 201–216. [Google Scholar] [CrossRef] [Green Version]
- Li, L.; Yu, B.; Zhu, Y.; Chu, S.; Wu, Y. Topographical factors in the formation of gully-type debris flows in Longxi River Catchment, Sichuan, China. Environ. Earth Sci. 2014. [Google Scholar] [CrossRef]
- Cui, P.; Hu, K.; Zhuang, J.; Yang, Y.; Zhang, J. Prediction of debris-flow danger area by combining hydrological and inundation simulation methods. J. Mt. Sci. 2011, 8, 1–9. [Google Scholar] [CrossRef]
- Cui, P.; Zhou, G.G.D.; Zhu, X.H.; Zhang, J.Q. Scale amplification of natural debris flows caused by cascading landslide dam failures. Geomorphology 2013, 182, 173–189. [Google Scholar] [CrossRef]
- Guo, X.; Cui, P.; Ma, L.; Kong, Y. Triggering rainfall characteristics for debris flows along Dujiangyan-Wenchuan Highway of Sichuan. Mount. Res. 2014, 6, 736–346. [Google Scholar]
© 2015 by the authors; licensee MDPI, Basel, Switzerland. This article is an open access article distributed under the terms and conditions of the Creative Commons Attribution license (http://creativecommons.org/licenses/by/4.0/).
Share and Cite
Zhang, H.; Wang, X.; Fan, J.; Chi, T.; Yang, S.; Peng, L. Monitoring Earthquake-Damaged Vegetation after the 2008 Wenchuan Earthquake in the Mountainous River Basins, Dujiangyan County. Remote Sens. 2015, 7, 6808-6827. https://doi.org/10.3390/rs70606808
Zhang H, Wang X, Fan J, Chi T, Yang S, Peng L. Monitoring Earthquake-Damaged Vegetation after the 2008 Wenchuan Earthquake in the Mountainous River Basins, Dujiangyan County. Remote Sensing. 2015; 7(6):6808-6827. https://doi.org/10.3390/rs70606808
Chicago/Turabian StyleZhang, Huaizhen, Xiaomeng Wang, Jianrong Fan, Tianhe Chi, Shun Yang, and Ling Peng. 2015. "Monitoring Earthquake-Damaged Vegetation after the 2008 Wenchuan Earthquake in the Mountainous River Basins, Dujiangyan County" Remote Sensing 7, no. 6: 6808-6827. https://doi.org/10.3390/rs70606808