Article

Integration of UAV-Based Photogrammetry and Terrestrial Laser Scanning for the Three-Dimensional Mapping and Monitoring of Open-Pit Mine Areas

College of Surveying and Geo-Informatics, Tongji University, 1239 Siping Road, Shanghai 200092, China
*
Author to whom correspondence should be addressed.
Remote Sens. 2015, 7(6), 6635-6662; https://doi.org/10.3390/rs70606635
Submission received: 28 February 2015 / Revised: 8 May 2015 / Accepted: 18 May 2015 / Published: 26 May 2015

Abstract

:
This paper presents a practical framework for the integration of unmanned aerial vehicle (UAV) based photogrammetry and terrestrial laser scanning (TLS) with application to open-pit mine areas, which includes UAV image and TLS point cloud acquisition, image and cloud point processing and integration, object-oriented classification and three-dimensional (3D) mapping and monitoring of open-pit mine areas. The proposed framework was tested in three open-pit mine areas in southwestern China. (1) With respect to extracting the conjugate points of the stereo pair of UAV images and those points between TLS point clouds and UAV images, some feature points were first extracted by the scale-invariant feature transform (SIFT) operator and the outliers were identified and therefore eliminated by the RANdom SAmple Consensus (RANSAC) approach; (2) With respect to improving the accuracy of geo-positioning based on UAV imagery, the ground control points (GCPs) surveyed from global positioning systems (GPS) and the feature points extracted from TLS were integrated in the bundle adjustment, and three scenarios were designed and compared; (3) With respect to monitoring and mapping the mine areas for land reclamation, an object-based image analysis approach was used for the classification of the accuracy improved UAV ortho-image. The experimental results show that by introduction of TLS derived point clouds as GCPs, the accuracy of geo-positioning based on UAV imagery can be improved. At the same time, the accuracy of geo-positioning based on GCPs form the TLS derived point clouds is close to that based on GCPs from the GPS survey. The results also show that the TLS derived point clouds can be used as GCPs in areas such as in mountainous or high-risk environments where it is difficult to conduct a GPS survey. The proposed framework achieved a decimeter-level accuracy for the generated digital surface model (DSM) and digital orthophoto map (DOM), and an overall accuracy of 90.67% for classification of the land covers in the open-pit mine.

Graphical Abstract

1. Introduction

With the advent and availability of accurate and miniature global navigation satellite systems (GNSS) and inertial measurement units (IMUs), together with the availability of quality consumer-grade digital cameras and other miniature sensors, the unmanned aerial vehicle (UAV) technique has been developing rapidly in the civilian community [1,2,3]. The term UAV is defined as “uninhabited and reusable motorized aerial vehicles” [4], which can be remotely controlled by means of autonomous, semi-autonomous or manual operations. The UAV systems, which are based on multiple low-cost and conventional platforms [5,6,7,8] and are equipped with multiple flexible and efficient sensors [9,10,11], are able to acquire high-resolution images for photogrammetric and remote sensing applications.
In general, three types of space-borne and airborne remote sensing techniques are used for the acquisition of high-resolution images of large areas: satellites, manned aircraft, and UAVs. Satellites are often restricted by the running cycle, height orbit and cloud cover, and manned aircraft are affected by airspace limits and weather [12,13]. UAV-based remote sensing systems have both the common characteristics of aerial remote sensing and their own unique features. Compared to manned aircraft systems, UAVs, which need to obtain flight permission from the civilian aviation authority, can be deployed quickly and repeatedly and can be used to avoid windy days and to perform flight tasks in high-risk areas, but cover small areas due to battery duration [14]. Moreover, UAVs are able to operate close to the target objects and can acquire images with high resolution [15,16]. Therefore, UAV remote sensing is a flexible and efficient way of obtaining high-resolution images providing accurate information from low altitudes with less interference from clouds.
With respect to the civilian applications of UAV-based low-altitude remote sensing, since the first geomatics test was carried out by Przybilla and Wester-Ebbinghaus (1979) [17], there has been an increasing amount of interest in many fields such as forestry and agricultural resource assessment and monitoring [18,19,20]; environmental and atmospheric surveying and monitoring [21,22,23,24]; disaster monitoring and assessment [25,26,27]; three-dimensional (3D) building reconstruction and landscape mapping [13,16,28]; and 3D documentation and mapping of sites and structures of archaeological and cultural heritage [7,29,30]. Several works have been done with respect to 3D mapping and monitoring of open-pit mine areas by the use of UAVs [31,32,33]. McLeod et al. [34] presented a method for measuring fracture orientation in an open-pit mine by use of video images acquired from an UAV. By integrating with terrestrial laser scanning (TLS), Salvini et al. [31] proposed an approach for observing the structural-geological setting of a quarry wall and to identify the potentially unstable zones. The images acquired by UAV-based photogrammetric systems have the characteristics of large overlap areas, multiple viewing angles and high ground resolution [35], and, at the same time, small footprints [3], large overlap variations and large perspective distortions [16]. Therefore, with respect to the processing of UAV images, much effort has been made in the development of processing approaches and systems. Laliberte et al. [10] presented a workflow of using UAV for rangeland inventory, assessment and monitoring. Chiabrando et al. [7] described a technique for the acquisition and processing to provide digital surface models (DSMs) and large-scale maps to support archaeological studies. Zhang et al. [16] proposed an approach for the parallel processing of UAV images. Niethammer et al. [27] proposed an approach for the production of high-resolution ortho-mosaics and digital terrain models (DTMs) in landslide investigations. Harwin and Lucieer [35] assessed the accuracy of georeferenced point clouds generated via multi-view stereo (MVS) from UAV imagery. Rosnell and Honkavaara [36] proposed a method for point cloud generation by image matching using aerial image data collected by a light UAV quadrocopter system. Turner et al. [3] presented an approach for the geometric correction and mosaicking of UAV photography by the use of feature matching and structure-from-motion (SfM) techniques. Generally, there are two approaches for processing of UAV imagery. The first one is photogrammetric approach by the use of bundle adjustment, and the second is computer vision based approach by the use of MVS-SfM technique. The bundle adjustment usually needs more GCPs to provide a global homogeneous result over the entire area. However, it is difficult to introduce additional data to the MVS-SfM, and it is not easily accessible because the images lack texture. In the existing studies, the UAV imagery is only used to aid GCPs surveyed by GPS. TLS can capture high-accuracy dense point cloud of the object surface at high rates in near real time. Therefore, we need to integrate feature points extracted from TLS supplement as GCPs in the bundle adjustment to improve the accuracy of UAV imagery geo-positioning. Furthermore, to our best knowledge, there is not a practical framework for the integration of UAV-based photogrammetry and TLS with applications in open-pit mine areas at present.
Open-pit mine areas are usually large and are located in remote mountainous areas. As a result, traditional techniques such as global positioning systems (GPS) and electronic total station (TS), which provide the point-based observations, might sometimes have difficulty in monitoring entire large areas. The cost of these ground monitoring techniques is also rather high. Therefore, this paper is concerned with conducting a UAV campaign for the photogrammetric mapping, monitoring and assessment of open-pit mine areas and their surrounding environment. In addition, the optimization of slope angle in open-pit mine areas plays an important role in making full use of recycling resources, reducing production costs and increasing mining efficiency [37]. However, the slope zones may result in its failure. Thus, it is essential for accurate 3D mapping and monitoring of the slope zones. TLS can be used to acquire 3D point clouds of the slopes rapidly and accurately. As a result, this paper is also concerned with integrating TLS derived point clouds and UAV images for 3D mapping of the slope zones.
However, with respect to mine area inventory, assessment and monitoring by the use of UAVs, there are two critical issues that need to be further investigated. The first one is that mine areas are usually located in remote mountainous areas. Thus, it is crucial to design a specific workflow to conduct a UAV campaign for the photogrammetric mapping of open-pit mine areas and their surrounding environment. The second is that the side slope in the open-pit mine area presents irregular shapes for land surfaces and can lack texture. In order to monitor the instability of the side slopes, high-accuracy dense clouds from TLS are acquired to build an accurate geometric model of the side slope, and high-resolution UAV images are used to build a texture model of the side slope. In addition, the other areas in the open-pit mine areas, high dense clouds from UAV photogrammetry are generated to build 3D modelling of these areas with the aid of the GCPs from both GPS and TLS. For these reasons, it is necessary to integrate the high-resolution UAV images and high-quality dense point clouds from TLS to create an accurate 3D model of the side slope, and at the same time to improve the accuracy of UAV imagery geo-positioning with the aid of GCPs from both GPS and TLS to generate accurate 3D modeling of the open-pit mine areas.
The Kunyang, Jinning and Jianshan phosphate mines were founded in 1965, 1981 and 1999, respectively, and are some of the largest open-pit phosphate mines in China. Due to lengthy and extensive open-pit mining, the surrounding ecological environment has been seriously damaged, and a number of slope failures have occurred in the past decade. The water quality of Dianchi Lake near the mines has been particularly influenced. As a result, it is necessary to assess and monitor the mine areas, for the purpose of mine tailing, land reclamation, and planning the vegetation resources.
The objective of this paper is to present a framework for the integration of UAV-based photogrammetry and TLS for the 3D mapping and monitoring of open-pit mine areas and for the accurate 3D modeling of the side slopes, in southwestern China. Specifically, the focus of the paper is: (1) to demonstrate the practical workflow for UAV-based photogrammetric operations, which consists of flight planning, ground observation, image and point cloud acquisition, image and point cloud processing and integration, and 3D mapping and land-cover classification of the mine areas; (2) to investigate a method for improving the geo-positioning accuracy of UAV imagery by the use of the bundle block adjustment, with the aid of ground control points (GCPs) from a GPS survey and high-quality dense 3D point clouds from TLS; and (3) to integrate the 3D ground points from UAV images and point clouds from the TLS, aiming to provide accurate 3D mapping of the slope areas.

2. Methods

The framework for the acquisition and processing of UAV images in the open-pit mine areas consists of four main parts, i.e., configuration of ground network and flight route design, image acquisition and matching, accuracy improvement of UAV imagery geo-positioning and classification of land covers in open-pit mine areas from UAV ortho-images. Figure 1 shows the entire technological framework of the study. In the first part, the configuration of the ground control network includes the number and distribution of GCPs that are surveyed by the real-time kinematic global positioning system (RTK-GPS). The flight route is designed with the specific factors for UAV-based photogrammetric and aerial image orientation. In the second part, both UAV images and the position and orientation system (POS) data are acquired during autonomous flight operations. The conjugate points of a stereo pair of images are extracted by the scale-invariant feature transform (SIFT) operator [38] and the outliers are identified and eliminated by the RANdom SAmple Consensus (RANSAC) approach [39]. In the third part, with the aid of GCPs and 3D point clouds from TLS, the accuracy of the geo-positioning of UAV imagery is improved by using bundle block adjustment. In addition, accurate 3D mapping of the side slopes is generated by integration of high-resolution UAV images and high-quality 3D point clouds. In the fourth part, a multi-resolution segmentation algorithm and a bottom-up region merging technique are used for the image segmentation, and an object-based image analysis approach is used for image classification.
Figure 1. Entire workflow of the study.
Remotesensing 07 06635 g001

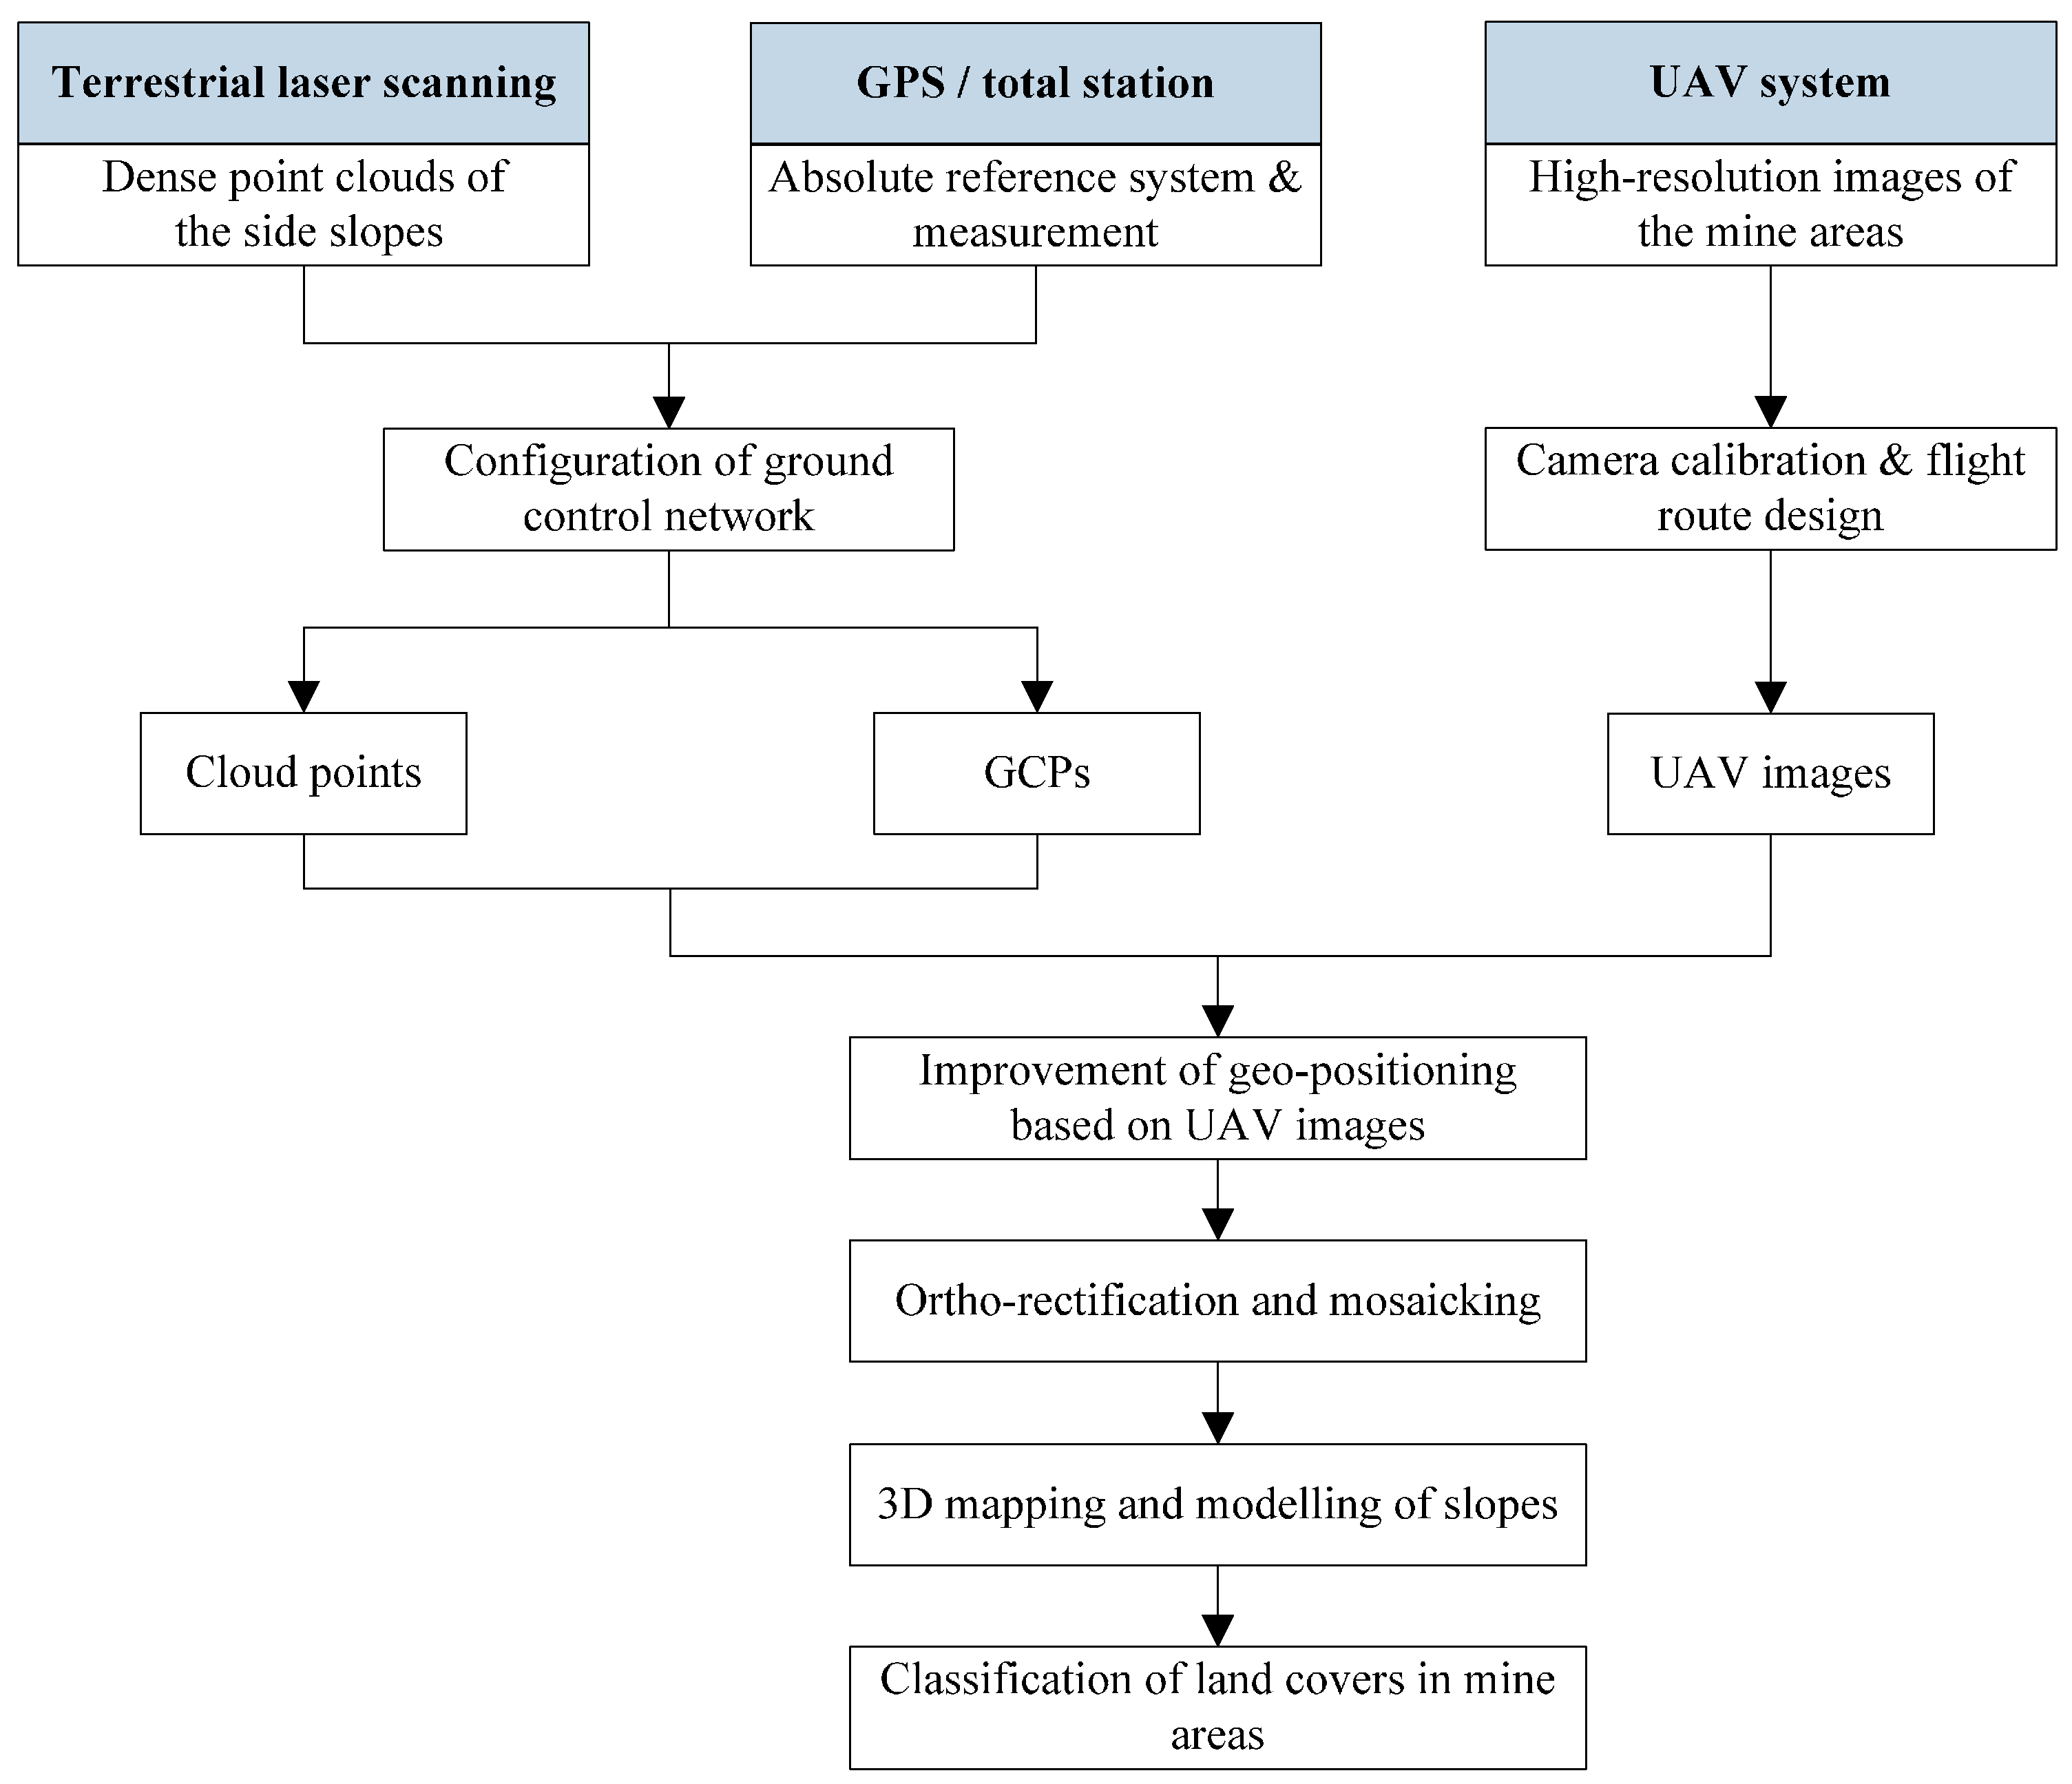
2.1. Materials and Data Acquisition

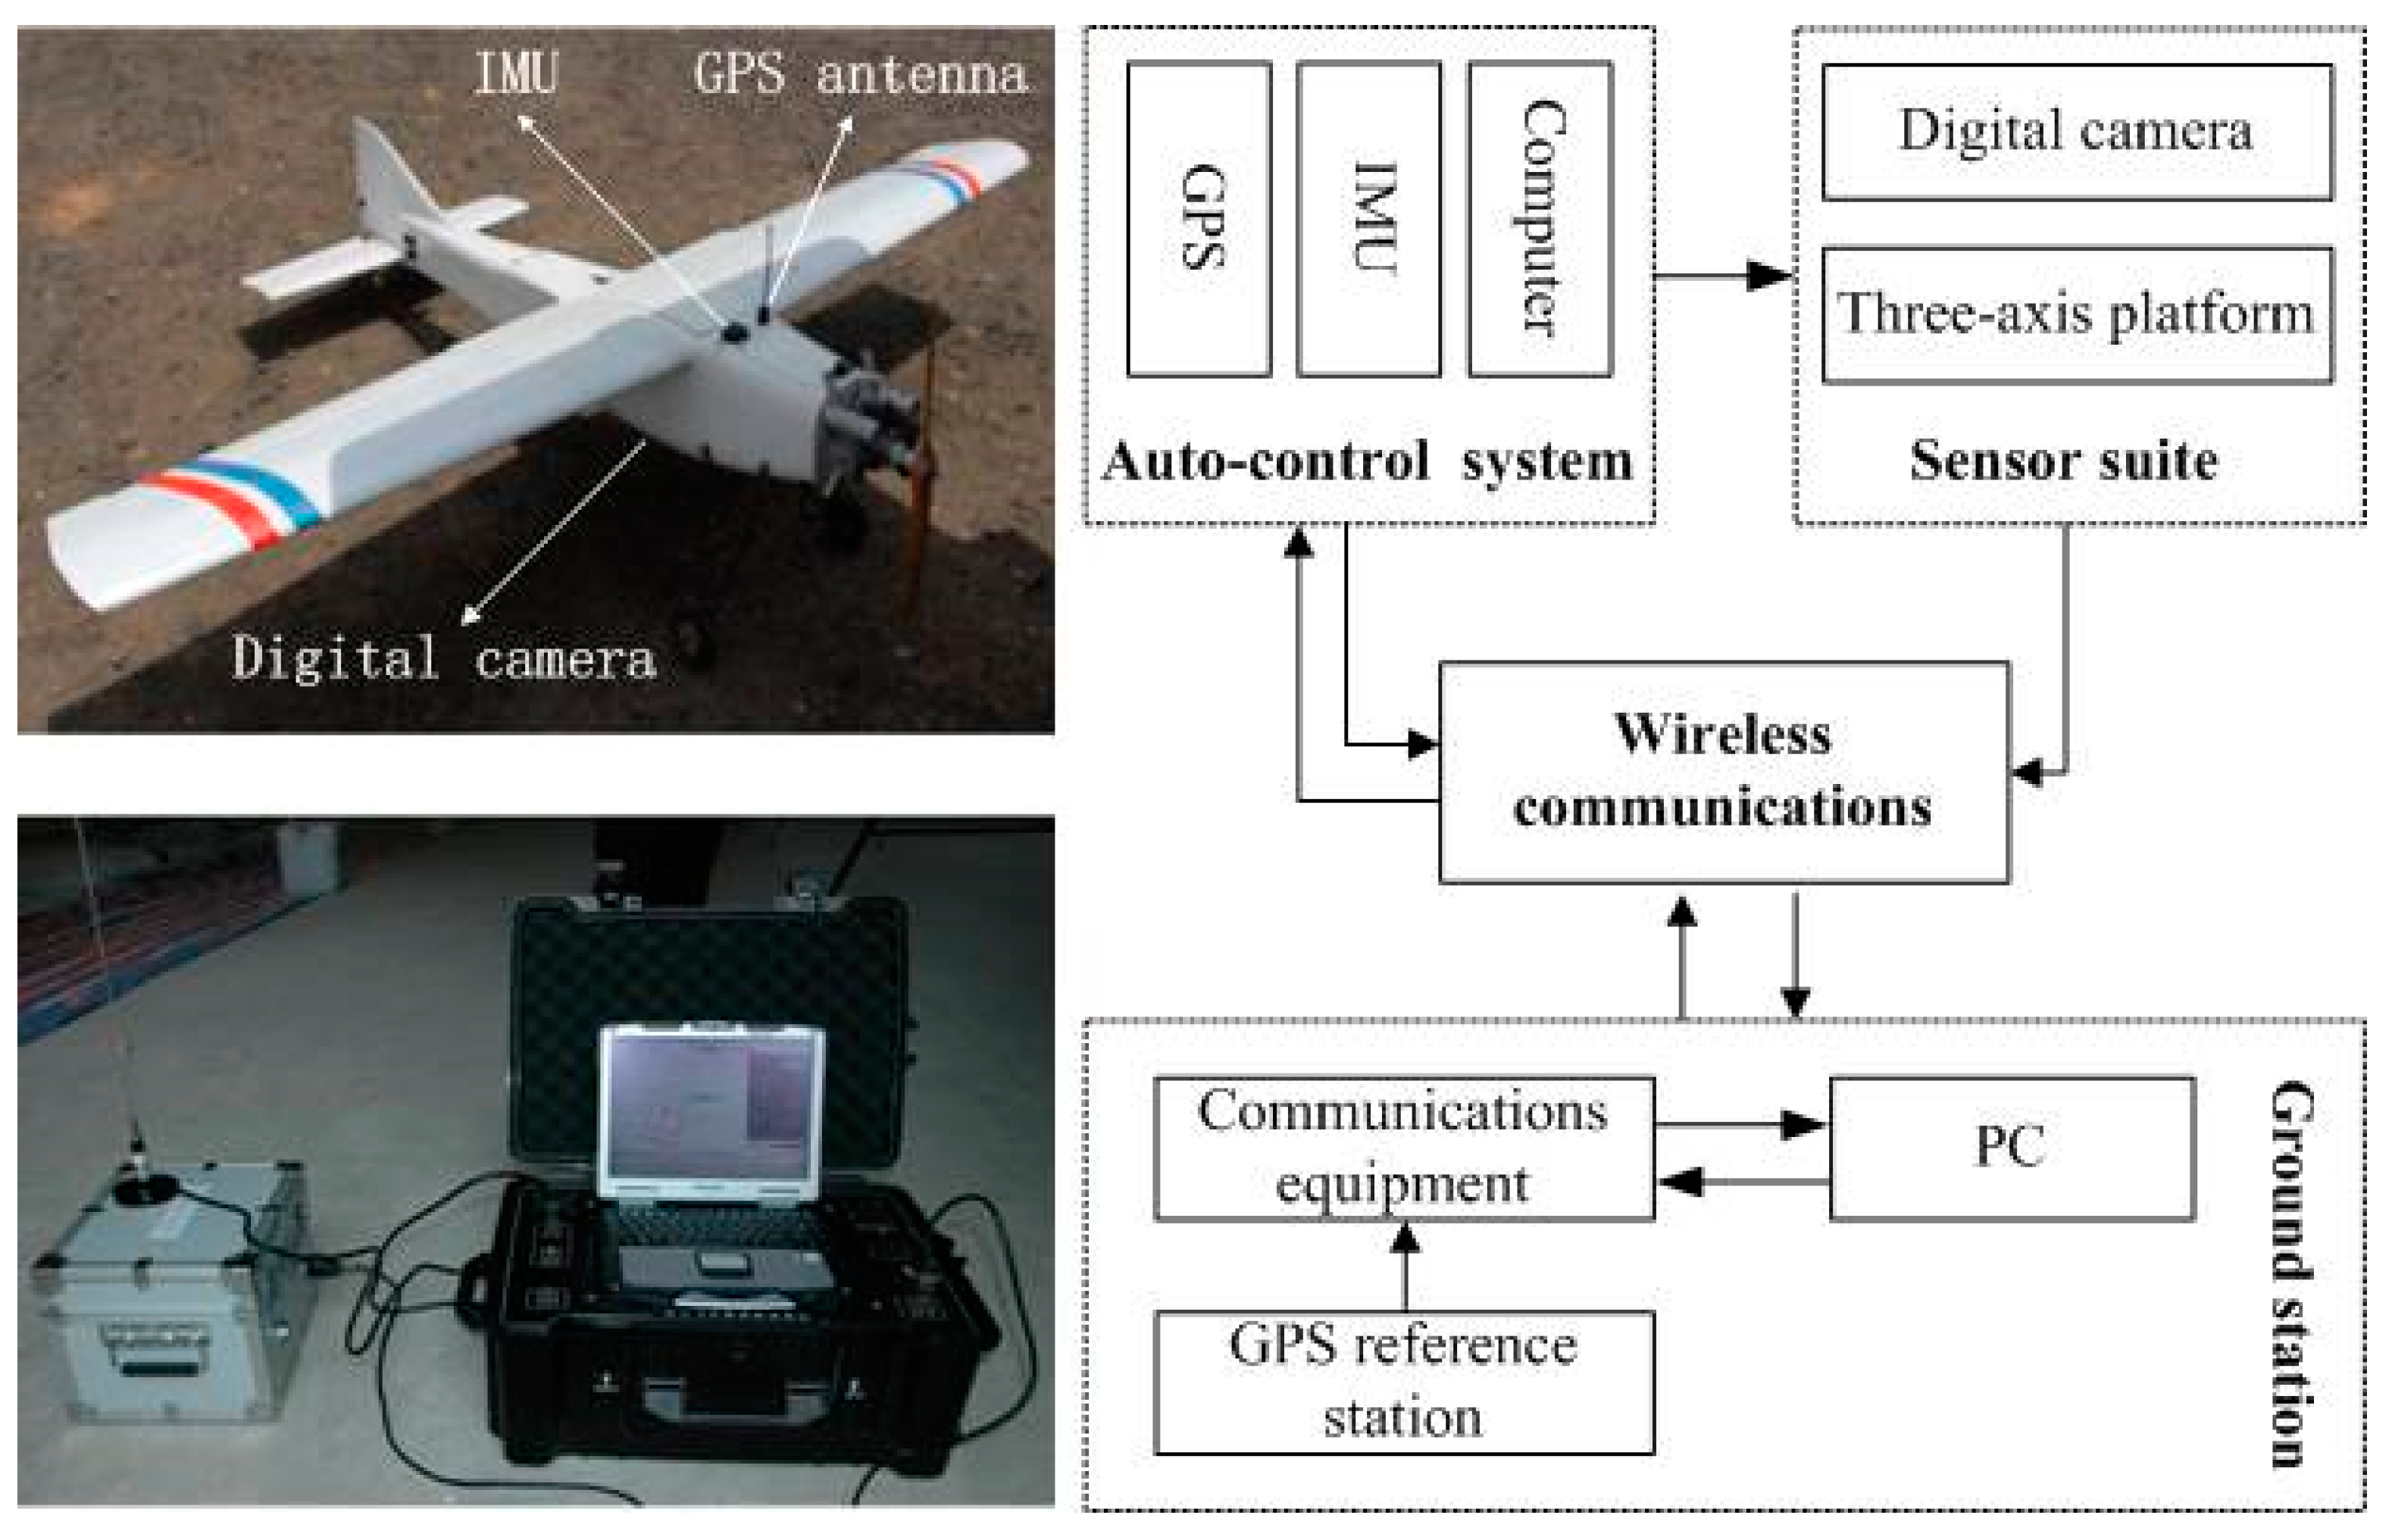
2.1.1. The UAV System, Sensors and the TLS System Used in the Experiment

The UAV system used in this study is an ISAR-II UAV manufactured by the Beijing Remote Sensing & Digital Earth Information Technology Company (http://www.uavrs.com/). The system consists of two main components: aerial and ground systems (Figure 2). The aerial systems consist of the remote sensing sensor suite, the automatic control system and the UAV platform. The main functions of the aerial systems are to upload the plan routes into the controller and to monitor the state of the UAV in flight. The ground components include a route planning system, a ground control system (GCS) and a data reception system. The main functions of the ground components are to design and schedule the flight routes, to receive real-time flight attitude data and to control the flight of the UAV. In the experiment, a GPS reference station was set within the distance of 30 km from the study area to navigate the UAV. In addition, a wireless transmission channel is used to transmit flight data between the aerial systems and the ground station with a maximum distance of 30 km to monitor the UAV flight routes, to change the flight plan or switch automatically to manual flight in case of emergency or landing.
In this study, the UAV platform used was a fixed-wing miniature plane, which has a payload capacity of approximately 4 kg and a flight duration of approximately 1.4 h (limited by the 2.2-liter gas tank). Table 1 shows the technical specifications of the UAV platform. The platform is equipped with a micro-autopilot unit, enabling automated navigation and real-time monitoring of the overlooked areas. The navigation system includes a GPS/DGPS unit, a three-axis gyroscope and accelerometer, and a relative airspeed probe. The UAV platform can fly automatically, according to the predefined flight routes, based on GPS and IMU navigation. Photos are taken during the flight at a set interval of time or distance. During the flight process, the flight parameters, such as the spatial location of the UAV, the three attitude angles and flight speed, are recorded. In addition, a Dagama SiRF3 SG-959 G-mouse module was mounted on the UAV having an update rate of 1 Hz. The IMU sensors include a three-axis rate gyroscope, accelerometer and magnetometer. The accuracy of the attitude data from the IMU is rated as ±2° for roll and pitch and ±5° for heading. Therefore, it is necessary to improve the accuracy of geo-positioning of UAV imagery by correcting the biases in the orientation parameters with aid of GCPs obtained from GPS survey and 3D point clouds obtained from the TLS. The detailed methods will be discussed in Section 2.3.
Figure 2. The UAV system used in the experiment.
Remotesensing 07 06635 g002
In the experiment, the single lens reflex (SLR) digital camera equipped in the platform is a Canon EOS 5D Mark II camera, with a focal length of about 24 mm, image size of 5616 × 3744 pixels, and pixel size of 6.41 μm. The CCD size of the camera is 36 mm × 24 mm, with 21 million pixels, and the images acquired by the camera are true colour photo with 8-bit radiometric resolution.
A Leica HDS8800 long-range TLS was used to acquire 3D point clouds of the side slopes in the mine areas. The position and orientation of the TLS used in the experiment will be discussed in Section 2.1.2. The main parameters of the TLS are presented in Table 2.
Table 1. Technical specifications of the UAV platform used in the experiment.
ItemValue
Length (m)1.8
Wingspan (m)2.6
Payload (kg)4
Take-off weight (kg)14
Endurance (h)1.8
Flying height (m)300–6000
Flying speed (km/h)80–120
CapacityFuel
Flight modeManual, semi-autonomous and autonomous
LaunchCatapult, runway
LandingSliding, parachute
SensorDigital camera, video camera
Table 2. Technical specifications of the TLS used in the experiment.
ItemValue
Range2.5–2000 m
1400 m to 80% albedo (rock)
500 m to 10% albedo (coal)
Scan rate8800 points per second
Divergence+0.25 mrad
Range accuracy10 mm to 200 m
20 mm to 1000 m
Angle accuracy±0.01°
Repeatability accuracy8 mm

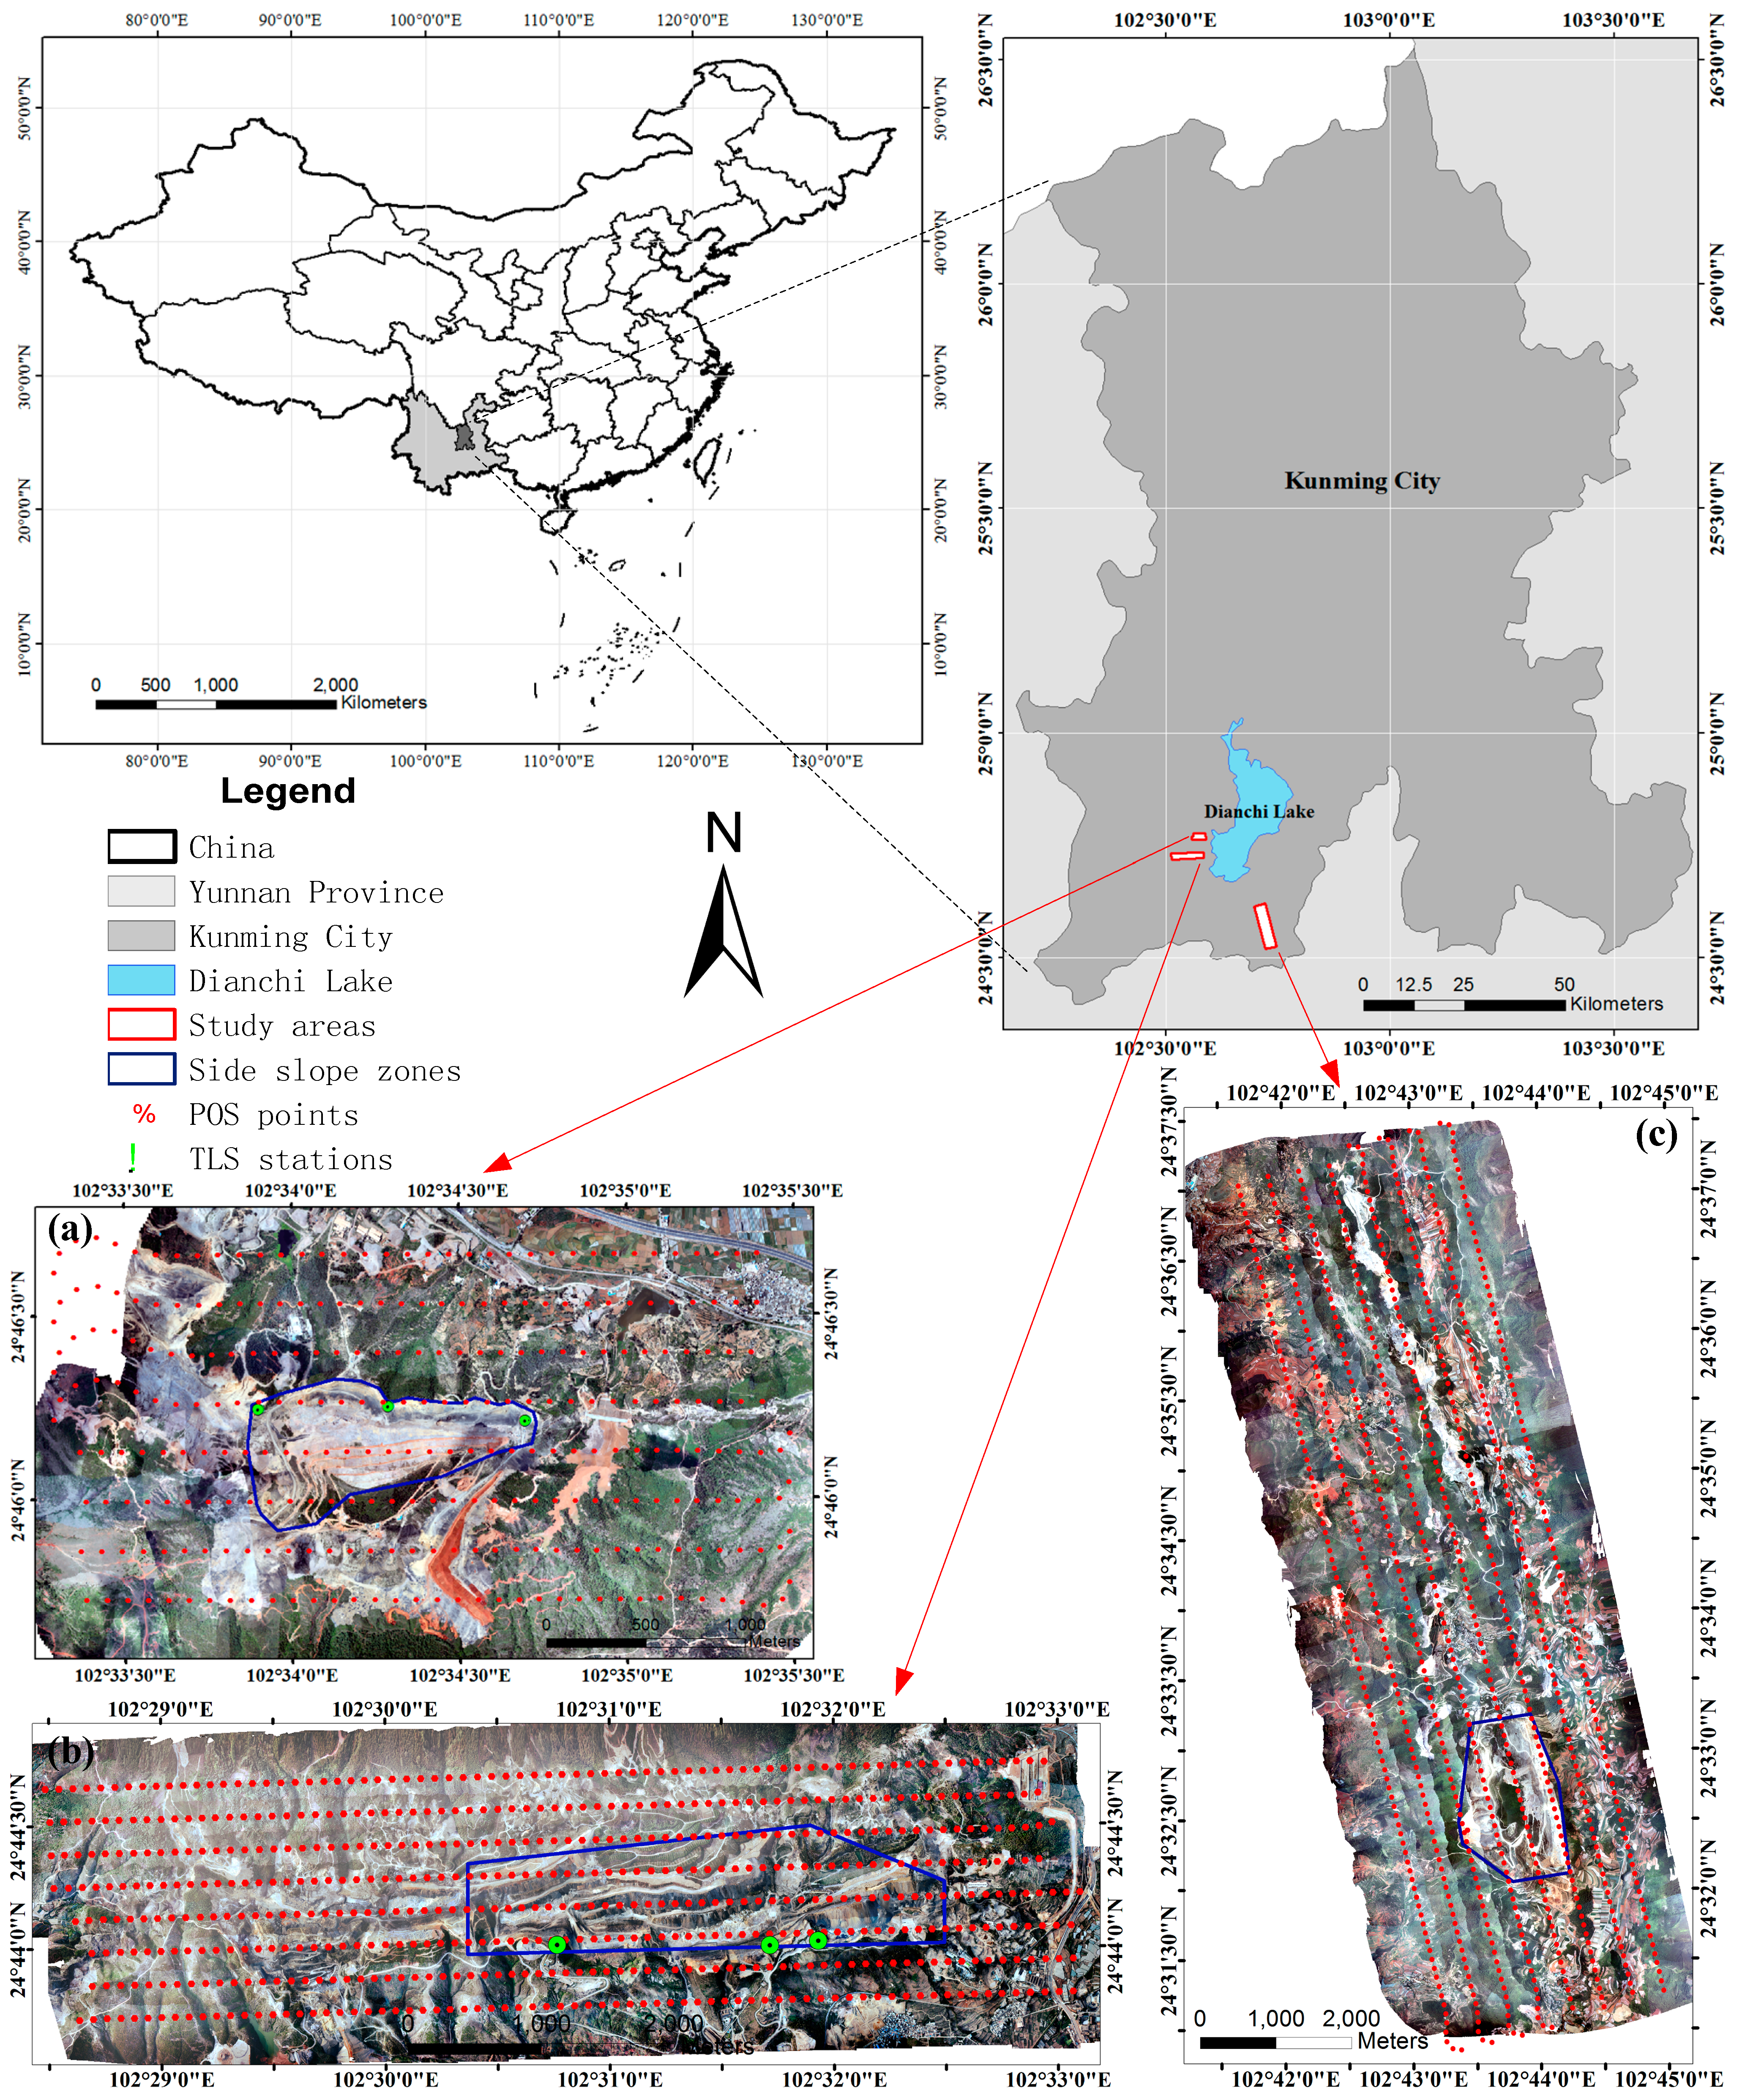
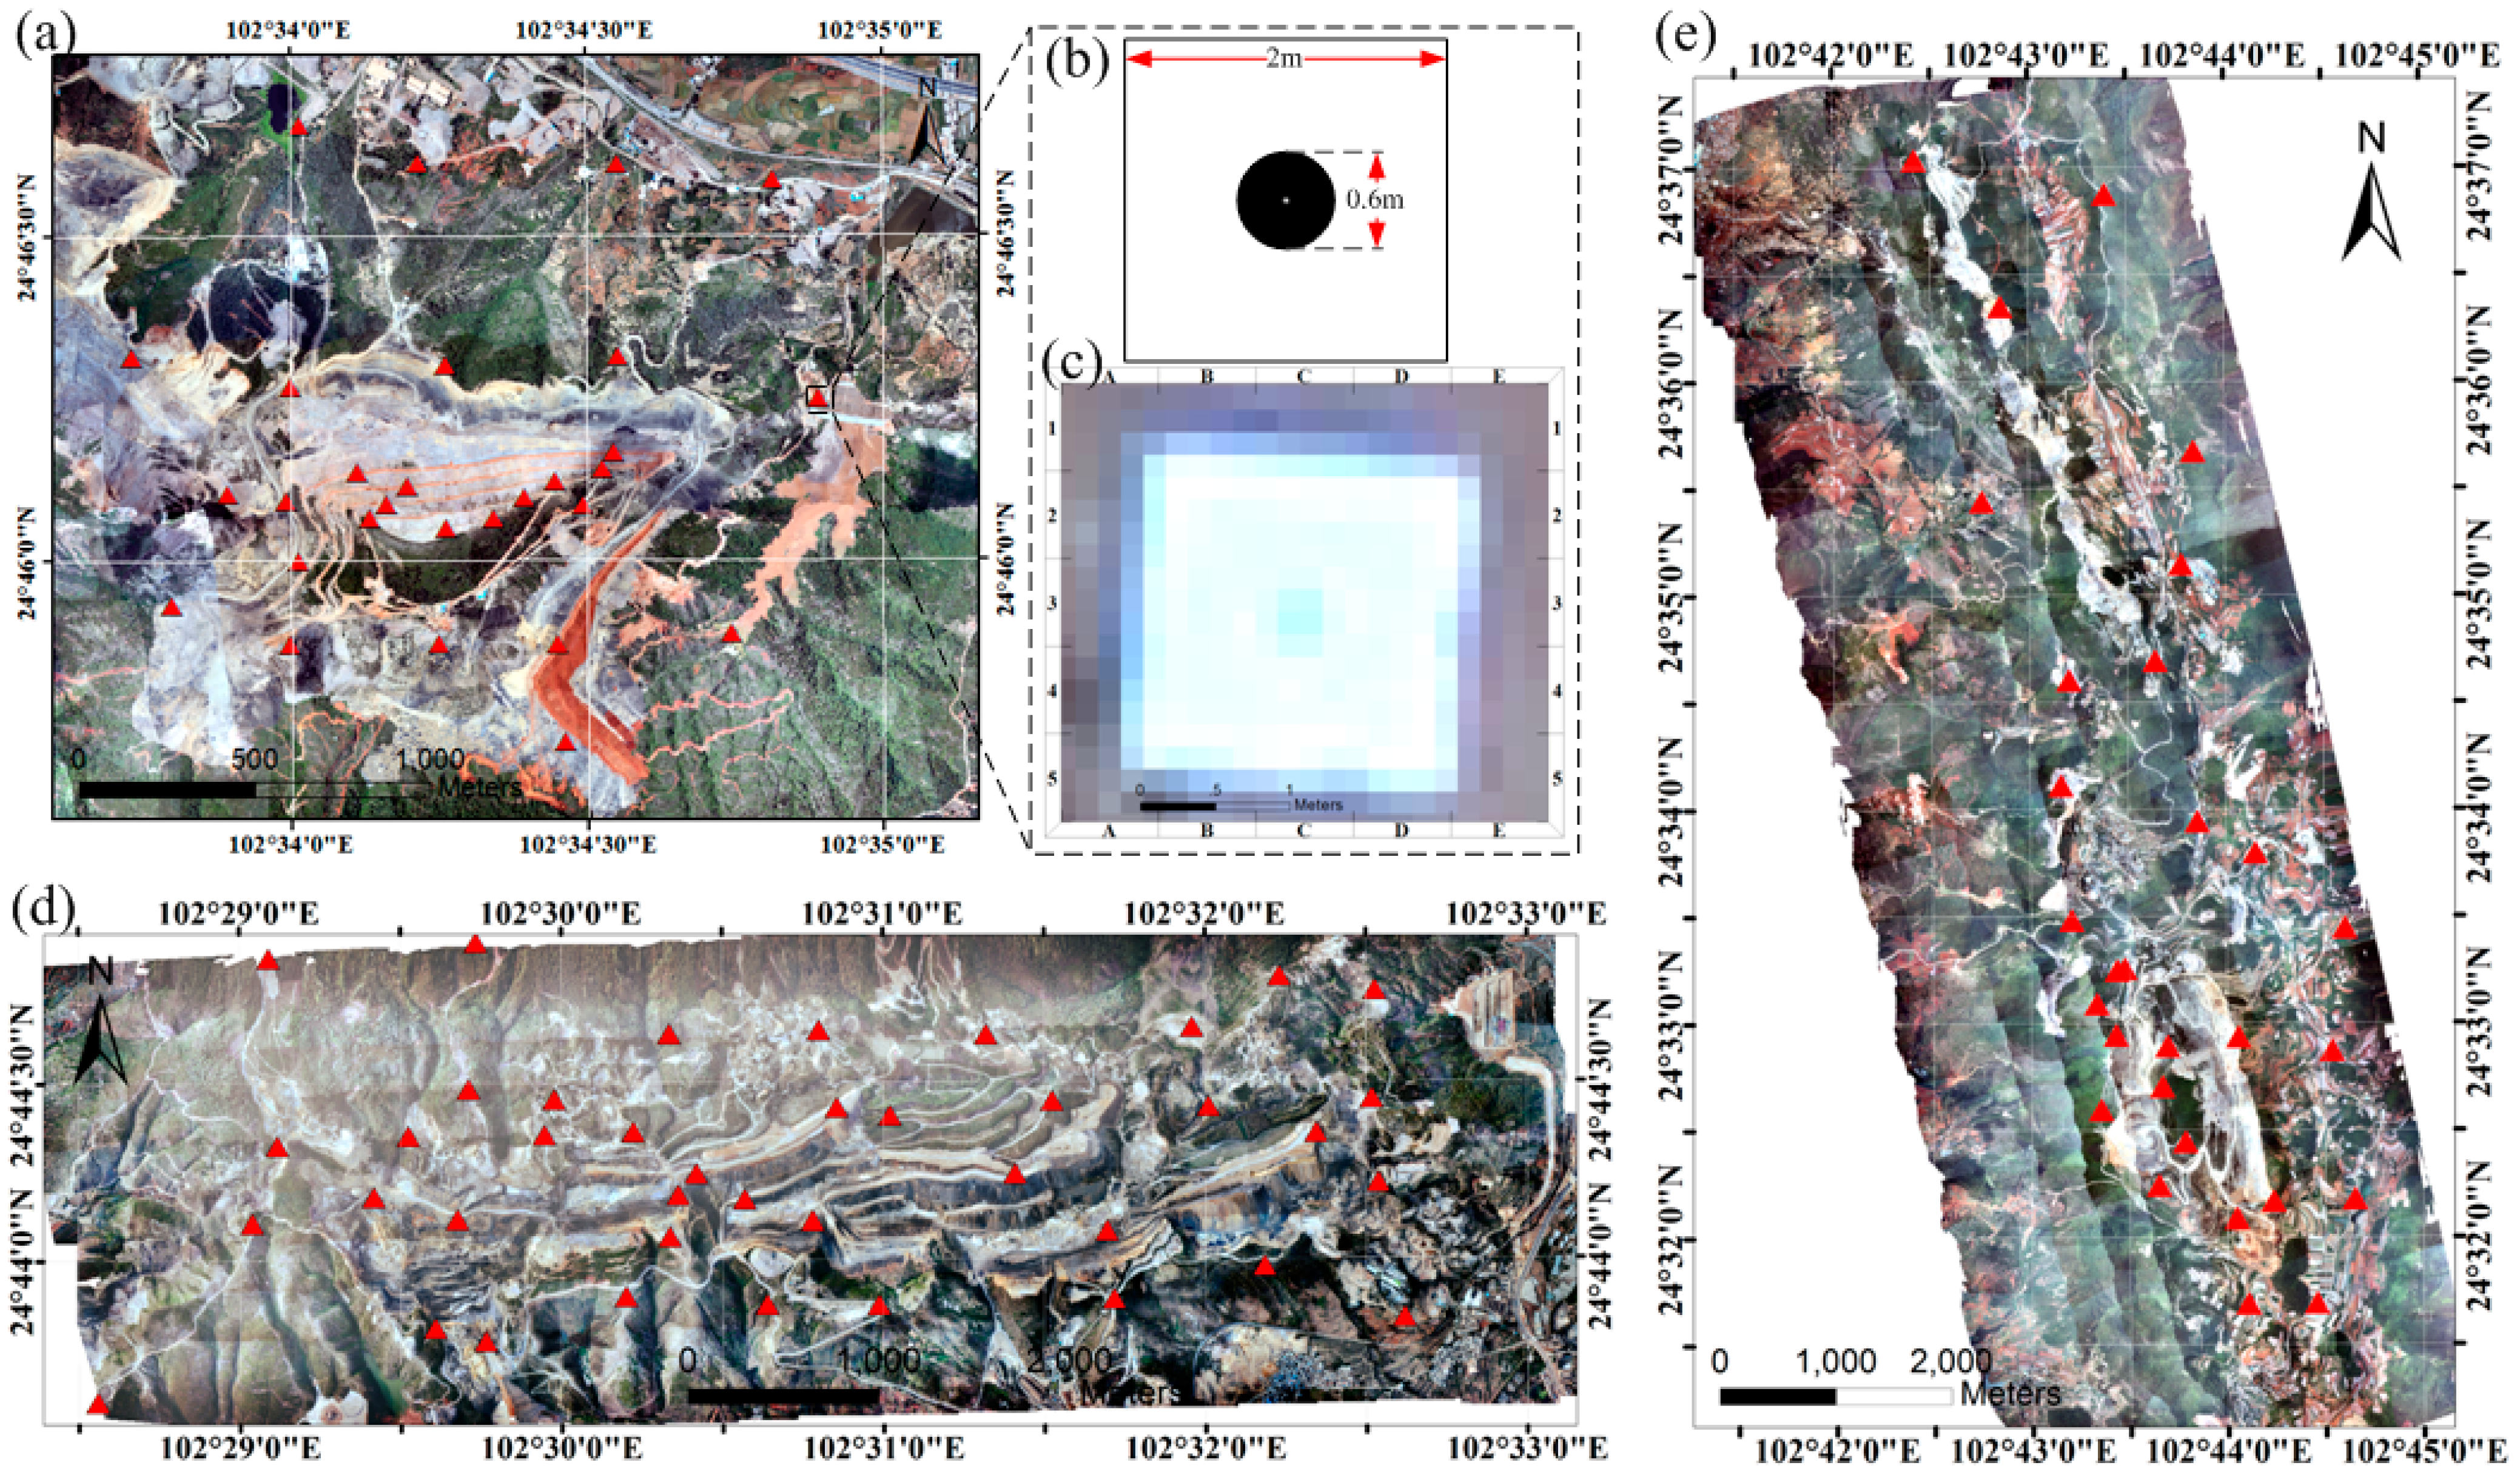
2.1.2. Study Area and Data Acquisition

The study area is located to the south-west of Kunming city in Yunnan province, China, and is adjacent to the southern border of Dianchi Lake (Figure 3). In the study area, there are three open-pit phosphate mines, Jianshan, Kunyang and Jinning, with areas of 7.8 km2, 18 km2 and 43 km2, respectively. The elevation in the study area ranges from 1888 m to 2485 m.
Prior to the image acquisition, fight route planning is necessary for the aerial image orientation and the subsequent generation of the photogrammetric products [30]. The specific factors for photogrammetric UAV flight planning can be found in many publications [14,19,40]. In the experiment, Google Earth™ and the UAV ground station software (GSS) were used to design the flight route. After the coordinates of the flight areas were determined, the information was transferred to the GSS, and the flight lines were generated based on the desired flying heights and image overlap.
Figure 3. The study area in southwestern China. The UAV flight areas are delineated as red polygons, the side slope zones are delineated as blue polygons, the planimetric positions of the photo centres are delineated as red points, and the TLS positions are delineated as green points. (a) Jianshan open-pit mine area; (b) Kunyang open-pit mine area; and (c) Jinning open-pit mine area.
Remotesensing 07 06635 g003
In the study area, during a flight time of approximately 143 minutes in May 2011, a total of 1688 UAV images were collected over the study areas, among which there were 290 images in the Jianshan area, 618 images in the Kunyang area and 780 images in the Jinning area. Table 3 shows the particular information of the data acquisition. The spatial resolution of these UAV images is approximately 15 cm, with 75% forward lap and 55% side lap. In the experiment, the UAV images were acquired during the flight operations and were stored on the camera’s 16 GB memory card. For each image, a timestamp, GPS location, roll, pitch and heading were recorded by the onboard computer. The images and flight data were downloaded after landing.
Table 3. Data acquisition achieved over the study areas.
AreaStripsImagesGCPsArea (km2)Consumed Time (min)Average Flying Height (m)
Jianshan8290287.830563.37
Kunyang8618401849476.23
Jinning8780294364563.37
The SLR digital camera mounted on the UAV has a non-metric lens. Prior to processing the obtained images, a digital camera distortion model was performed, which includes radial distortion (i.e., k1, k2 and k3), asymmetric distortion (i.e., p1, and p2) and plane distortion (i.e., α and β) in the camera calibration ([41]). Table 4 shows the result of the calibration parameters of the camera equipped on the UAV.
Table 4. Result of the calibrated parameters of the digital camera mounted on the UAV.
ItemValueDeviation
Focal Length (mm)24.37040.0001
Principal Point x0 (mm)0.20140.0001
Principal Point y0 (mm)0.06380.0001
Radial Distortionk1: 7.80246 e-092.7 e-010
k2: −5.20000 e-16−3.839 e-017
Decentering Distortionp1: −1.10102 e-078.6 e-008
p2: 9.25639 e-089.3 e-009
Affinity and Nonorthogonalityα: −5.24645 e-05
β: −2.78373 e-06
Image orthorectification and georegistration are related to aerial triangulation based on the presence of GCPs in the project area [3,42,43,44,45]. For UAV-based photogrammetry, GCPs are focused on obvious feature points on the images, such as road intersections and house corners. However, it is sometimes difficult to find obvious features in open-pit mine areas. Therefore, in the experiment, 97 man-made markers (Figure 4), which are designed as black and flat circles (with 60 cm diameter) printed on white cloth (with the size of 2 m × 2 m), were established as GCPs and were surveyed with the RTK-GPS in the national geodetic coordinate system, with an accuracy of 2–3 cm in the horizontal direction and up to 5 cm in the vertical direction. In addition, a total of eight GCPs were simultaneously measured by both GPS-RTK and TS in Jianshan area, with the aim of assessing the accuracy of GCPs surveyed by RTK-GPS through comparing the differences between the coordinates obtained from RTK-GPS and TS. Each GCP was measured three times, and the mean value was calculated as the coordinate of each GCP. In the experiment, the root-mean-squared errors (RMSE) of the coordinate residuals between RTK-GPS and TS in the X-, Y- and Z-directions are 0.034 m, 0.0098 m and 0.0374 m, respectively. Therefore, the accuracy of the GCPs is much higher than the spatial resolution (approximately 0.15 m) of the UAV images used in the experiment.
Figure 4. Distribution of GCPs in the study area. (a) configuration of the GCPs (delineated as red triangles) in the Jianshan area; (b) designed pattern of the GCPs; (c) example of a GCP in the UAV image; (d) configuration of the GCPs in the Kunyang area; (e) configuration of the GCPs in the Jinning area.
Remotesensing 07 06635 g004
Moreover, the surfaces of the side slopes in the mine areas were surveyed by TLS, which is a technique of direct 3D measurement, and a total of 10,826,832 points with intensity and RGB data were obtained, having an average point space of 5 cm. In the experiment, the position and orientation of TLS were determined by the direct georeferencing approach [46], in which the known control point was measured by TS, and the maximum distance between TLS and the object surface was 700 m; thus, the accuracy of point clouds was less than 122 mm, which is consistent with the result in [46,47]. Figure 3 shows the positions of TLS used in the experiment in the three study areas. The registration of TLS point clouds was processed in Leica Cyclone, and the accuracy was 8.7 mm, which is also similar to the result in [48,49,50,51].

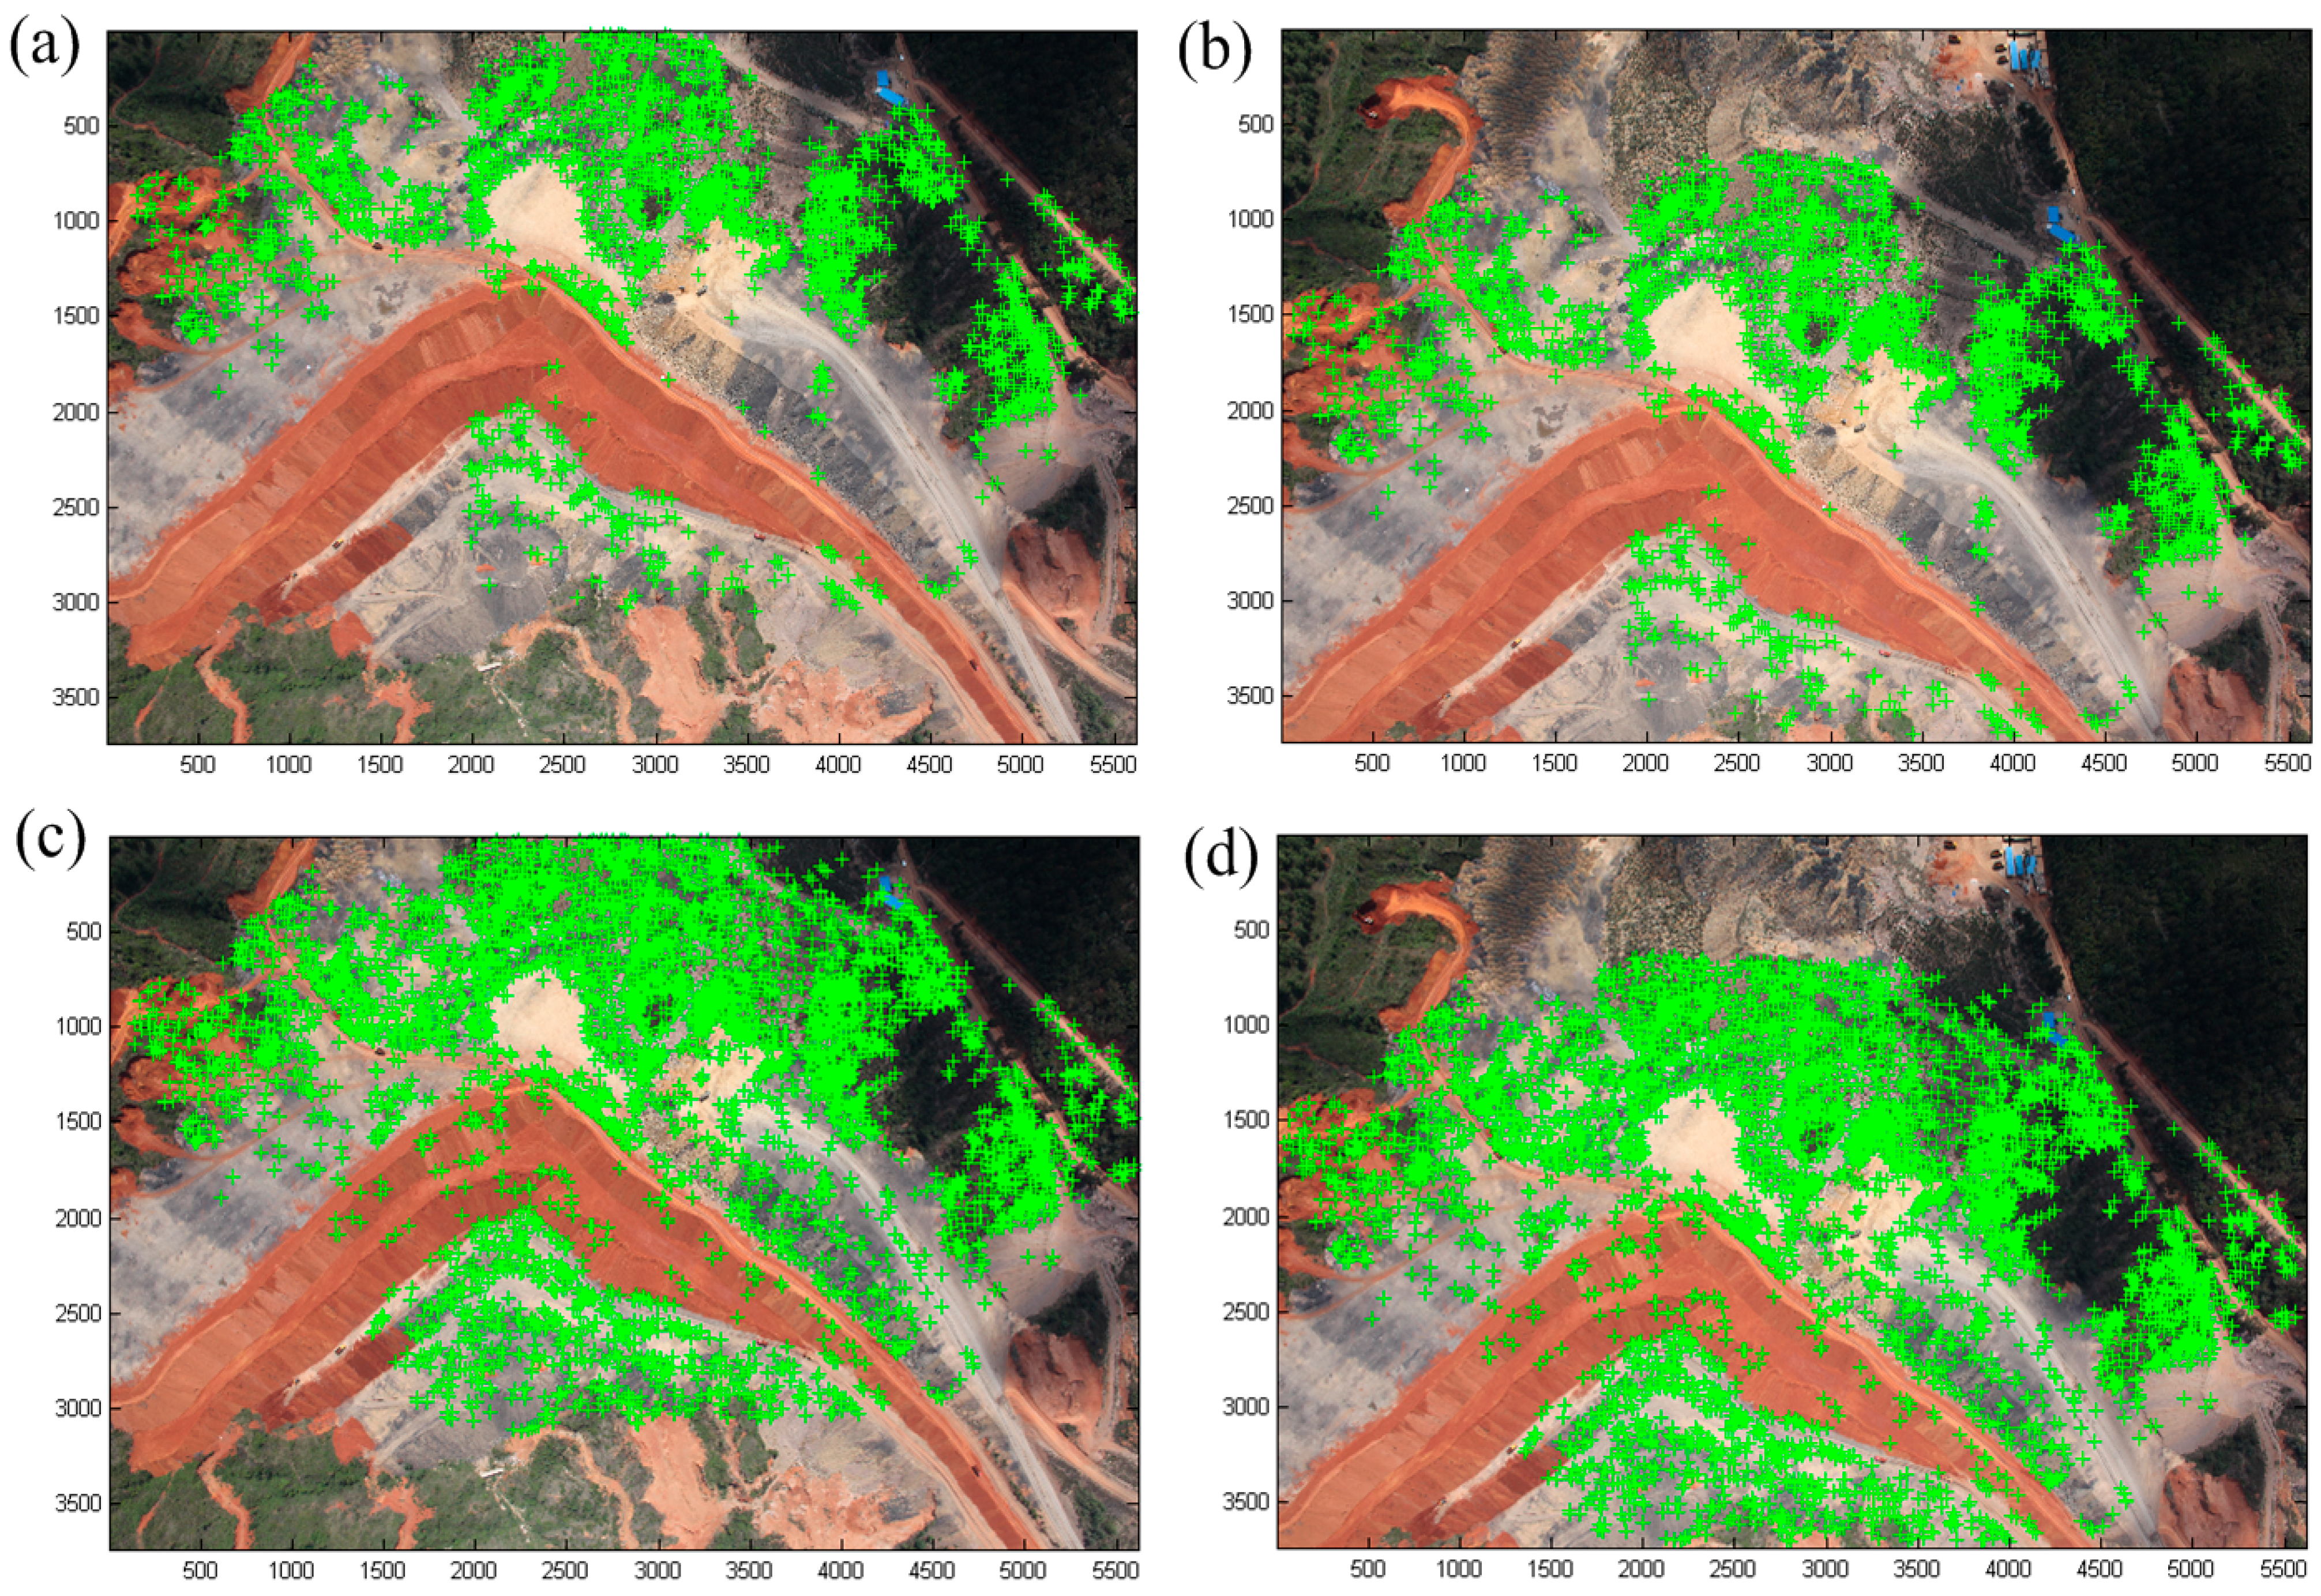
2.2. Image Matching and Extraction of Feature Point Cloud

Image matching is a very useful technique in any type of photogrammetry (aerial and terrestrial) and fundamental to the use of UAVs [16,52]. Traditionally, the feature-based matching operators (for example, Forstner and Harris operators) and area-based matching techniques (such as cross-correlation and least squared matching methods) are widely used in highly textured images. Furthermore, the images acquired within open-pit phosphate mines often lack texture. Therefore, it might be difficult to obtain reliable results with these traditional matching operators. In our study, the SIFT operator was used for feature extraction and matching, which has the advantages of matching image between UAV-based low-altitude image pairs with large rotation angles [16,36,52]. The SIFT features are first extracted from each image of a stereo pair, and then the two images are matched by comparing each feature in one image with all the features in the other image, and lastly conjugate points are found within the predefined searching range [16]. It is likely that there would be some mismatched points in the matching result. Therefore, in order to identify and eliminate these outliers, an iterative RANSAC approach is used to estimate the fundamental matrix (detailed in [53], p. 279) and to select the maximum number of inliers. In the experiment, the adopted approach started by using a random subsample of points to estimate the parameters that define the model, and the other points were checked with the estimated model, within a predefined threshold tolerance (i.e., a threshold of three pixels in the experiment). Figure 5 shows the result of the matched conjugate points of a stereo pair of UAV images.
Figure 5. Result of the matched points between two UAV images in the Jianshan area (Unit: pixel). (a,b) matched points by the use of SIFT operator (2901 matched point pairs from a total of 57,243 point pairs with a threshold of 0.3 pixels); (c,d) dense matched points based on the method of the optimal exterior orientation parameters (5517 matched point pairs with a searching size of 21 pixels, correlation size of 7 pixels and least squares size of 21 pixels).
Remotesensing 07 06635 g005
TLS and UAV photogrammetry can be complementary [54,55] because TLS can capture high-quality dense point clouds and provide accurate geometry information, and digital cameras can acquire high-resolution images and supply additional surface colour. In this paper, the integration of UAV images and 3D point clouds of TLS are studied by the use of the bundle block adjustment. The operational procedure for matching conjugate points between the TLS point clouds and the UAV images consists of four steps, as follows. (1) The TLS point clouds are first converted into an intensity image. The generated intensity image has 5500 × 1760 pixels with the cell size of 250 mm. Prior to the conversion, the singular or gross points were removed; (2) The intensity image is matched with the UAV image. During the matching process, the SIFT operator was used in the feature extraction, and a total of 141 conjugate points were extracted in the experiment; (3) The accuracy of the matched conjugate points is assessed. By the use of GCPs surveyed by RTK-GPS, the translation between the intensity image and UAV image is constructed. Thus, the image coordinates of the matched points from the UAV image is transformed into the ground coordinates, and the differences between the transformed coordinates and the coordinates of the TLS point clouds are calculated for evaluating the accuracy of the matched points; (4) The correctly matched conjugate points between the TLS point clouds and UAV images are selected based on the calculated root-mean-squared error of the residuals. In the experiment, the threshold was set as 2.35 pixels.

2.3. Geo-Positioning Accuracy Improvement and 3D Textural Modelling

The accuracy of geo-positioning of UAV images depends jointly on the camera orientation, configuration of the GCPs (i.e., accuracy, density and distribution), image quality, land cover and the topographic complexity of the scene [6]. The impact of the configuration of the GCPs on geo-positioning accuracy based on high-resolution satellite imagery has been studied [35,56,57,58,59]. In aerial triangulation, bundle block adjustment provides a global homogeneous result over the entire area [60]. In order to improve the accuracy of geo-positioning based on UAV imagery in the three mine areas, the extracted feature points in the 3D point clouds obtained from the TLS are used as a supplement to the GCPs in the bundle adjustment, and three scenarios for integration of both point clouds from 3D TLS and GCPs from a GPS survey were designed as follows. (1) Scenario one involves performing the bundle adjustment only with the support of the POS; (2) Scenario two involves performing the bundle adjustment with both the POS and the GCPs surveyed by the GPS; (3) Scenario three involves performing the bundle adjustment with the POS, GCPs and 3D point clouds from the TLS. As a result, both the 3D ground coordinates of the conjugate points and the exterior orientation parameters (EOPs) of the cameras are simultaneously estimated through bundle adjustment with the GCPs from the TLS point clouds and GPS control points. Based on the improved accuracy of geo-positioning based on UAV images in aerial triangulation, a DSM over the study area was produced by the use of the Delaunay triangles which were generated from the integration of 3D ground points of the entire area obtained from the aerial triangulation and 3D point clouds of the slope zone obtained from TLS, and the ortho-images were rectified from the original UAV images with the refined camera parameters and the generated DSM. In the study, UAV images covered the entire open-pit mine areas, where trees, grasses, vegetation and exposed rock/soil were present. In addition, the slope zone was covered by the point clouds from TLS, and the area had few trees and grasses. Moreover, a filtering operation in the creation of the DSM from UAV and DSM from TLS needs to be considered. The bundle adjustment, ortho-rectification and mosaicking of the acquired images were produced by using the commercial software Leica Photogrammetry Suite (LPS, ERDAS 9.2, Leica Geosystems Geospatial Imaging, Norcross, GA, USA). In the experiment, a quadratic optimal approach of aerial triangulation was used. Firstly, the matched conjugate points obtained by the SIFT operator with high accuracy were imported in the point measurement with the required data format, and a bundle block adjustment with the initial EOPs was then conducted to estimate the optimal EOPs. Afterwards, these dense matched points were extracted based on the estimated optimal EOPs (as shown in Figure 5), and the bundle block adjustment was performed once again.
The UAV-based photogrammetric system can provide high forward lap and side lap of high-resolution images and even oblique photos. At the same time, the dense 3D point clouds from the TLS can be more appropriate to model the complicated and irregular side slopes in detail. Therefore, the integrated high-resolution images and high-quality dense point clouds can be used to generate accurately textured 3D recordings and presentations [61]. In the experiment, a 3D representation of the side slopes was built by integrating the generated DSM in the commercial software ArcScene™ (ArcGIS 9.2), based on the point clouds from the TLS and the UAV ortho-images, with the aim of providing detailed information for assessment and planning of mine areas, even for monitoring with long time data collection. The correspondence between the two datasets was established by the GCPs from the TLS point clouds and GPS control points, and the two datasets can be registered into a common reference system.

2.4. Classification of the Land Covers in the Mine Areas

With respect to classification of land covers, an object-based image analysis (OBIA) approach is suitable for high-resolution imagery, and it has been demonstrated in many studies [5,15,62,63]. The accuracy improved UAV ortho-images have a high spatial resolution, however, both spectral and radiometric resolutions are highly correlated (i.e., red, green and blue bands) [64]. As a result, the intensity-hue-saturation (IHS) space, which is transformed from the RGB space, can increase the accuracy of classification [65]. In the experiment, the OBIA approach was developed in eCognition 8.64. The operational procedure for the OBIA approach consists of three steps, as follows. (1) Segmentation of the image by the use of a multi-resolution segmentation (MRS) algorithm [66]; (2) Selection of texture measures to separate the classes of interest, based on a decision tree; (3) Determination of the class separability and the accuracy of the classification of the land covers. In the MRS algorithm, a bottom-up region merging technique was used to combine the smaller segments into larger ones based on the relative homogeneity criteria such as scale, color and shape. Figure 6 shows the result of image segmentation at different scales. In the figure, the MRS is based on a local homogeneity criteria to describe the similarity of the adjacent image objects.
The UAV images, which acquired in the open-pit phosphate mines that are located in the mountain areas, showed more trees and grasses. In the experiment, a combination of rule-based and nearest-neighbour classification methods was used to distinguish the classes. Three types, which are the vegetation (Woodland, Grassland and Arable land), exposed rock/soil (Building, Road, Active mine, Reclaimed mine and Rural area) and water, were first classified using the rule-based classification with the defined thresholds of intensity, and the detailed classification at the species level was conducted using the nearest-neighbour classification method. With respect to the vegetation, an experiential vegetation index (VI') was first calculated by V I = ( 2 × G R B ) ( 1.4 × R G ) , where G = G / ( R + G + B ) , R = R / ( R + G + B ) and B = B / ( R + G + B ) , respectively. If the value of the calculated VI' is greater than the threshold of −0.1, then the vegetation type can be determined. With respect to the water, a grey level co-occurrence matrix (GLCM) homogeneity [15,67] was further calculated. If the value of GLCM is greater than 0.37 and the value of the calculated VI' is not between −0.28 and −0.15, then the water type can be determined accordingly. The accuracy of the classification was assessed by error matrices, and thus, by calculating the overall user’s (errors of omission) and producer’s (error of commission) accuracies, overall accuracy, as well as Kappa statistics [68]. In the accuracy assessment of the classification of the land covers, at least 10 point samples for each class were manually labeled as the ground truths (details can be seen in [69]). In addition, more than 100 point samples were selected in the active areas, reclaimed mines, woodland and grassland, and these samples were distributed evenly across the entire study area.
Figure 6. Comparison of image segmentation at the different levels used in the object-based classification. (a) UAV mosaic image from Jianshan; (b) Image segmentation with a MRS scale of 200; (c) Image segmentation with a MRS scale of 400; (d) Image segmentation with a MRS scale of 600.
Remotesensing 07 06635 g006

3. Results and Discussion

3.1. Result of the Geo-Positioning and Accuracy Assessment

With respect to the integration of UAV-based photogrammetry and TLS, Table 5 shows a comparison of the geo-positioning accuracy based on UAV images in the three scenarios, as discussed in Section 2.3, of the entire Jianshan area. In the test, 10 point clouds from the TLS (detailed see Section 2.2) and 28 GCPs surveyed by the GPS, in the Jianshan area, were used in the bundle block adjustment (in which nine GCPs were used as checkpoints to assess the accuracy of the geo-positioning). There were six point clouds from the TLS and 32 GCPs (in which eight GCPs were used as checkpoints) surveyed by the GPS in the Kunyang area. While in the Jinning area, only 21 GCPs (in which eight GCPs were used as checkpoints) surveyed by the GPS were used in the bundle block adjustment. From the table, we can see that: (1) the geo-positioning accuracies in both scenario two and three are much better than that in scenario one. This result indicates that in the steep slope zone area, the accuracy of geo-positioning based on UAV images only with the support of the POS in scenario one is relatively low. However, with the aid of more GCPs from the GPS or TLS, the geo-positioning accuracy can be significantly improved; (2) Scenario three achieves the best accuracy of the geo-positioning. The reason for this is that some accurate 3D point clouds obtained from the TLS are used as a supplement to the GCPs in the bundle adjustment. In general, the decimeter-level accuracy achievable from UAV images meets the demand for the subsequent application of images in mine areas; (3) The accuracy in Z-direction with GCP demonstrated more improvement; it may be there were more errors in the initial value of POS in Z-direction than in the planimetric. However, there remain more errors in the Z-direction, which may be influenced by the steep slope, and the images may have larger perspective distortions.
Table 5. Results of the geo-positioning accuracy with bundle block adjustment.
AreaScenarioMaximum ErrorMean ErrorRoot-Mean-Squared Error
X/mY/mZ/m|X|/m|Y|/m|Z|/mX/mY/mZ/m
JianshanScenario one−4.42162.168511.64743.88681.74118.07823.90911.75978.5113
Scenario two−0.25860.13911.47530.11160.08420.48500.14070.09490.6380
Scenario three−0.2477−0.14881.60740.09740.08270.41830.12530.09330.6210
KunyangScenario one−4.2221−7.0257−16.70151.44894.43866.66861.83314.60888.0069
Scenario two−0.25290.2839−1.43450.09900.12480.48750.14140.14470.7766
Scenario three−0.22500.2284−2.47850.10950.12620.54020.13780.14160.7080
JinningScenario one2.22022.3067−5.05250.41311.28431.48310.70881.43421.9025
Scenario two−0.3473−0.87491.18050.16460.33440.61370.21530.44960.7813
In addition, to compare the contribution of the 3D point clouds from the TLS in the accuracy improvement in the bundle block adjustment, three tests were further conducted in the side slope zone of the Jianshan area, where there are more 3D point clouds from the TLS that are used as control points in the bundle adjustment. (1) Test one involves performing the bundle adjustment only with the support of the POS; (2) Test two involves performing the bundle adjustment with both the POS and 3D point clouds from the TLS; (3) Test three involves performing the bundle adjustment with the POS and the GCPs surveyed by the GPS. Table 6 shows the results of the geo-positioning accuracy in the three scenarios. In the test, a total of 19 UAV images, 10 point clouds from the TLS and 16 GCPs surveyed by the GPS were used in the bundle block adjustment. Among which, six GCPs were used as checkpoints, and the accuracy of the geo-positioning was evaluated by the use of these check points through comparing the difference between their coordinates obtained from the bundle adjustment and those of surveyed by RTK-GPS. From the table, we can see that the geo-positioning accuracies in both Scenarios two and three are much better than that in Scenario one. This result shows that the introduction of 3D point clouds from the TLS as GCPs can improve the accuracy of geo-positioning based on UAV images. At the same time, the accuracy of geo-positioning based on 3D point clouds from the TLS is closer to that based on GCPs from the GPS survey. This result shows the potential of using 3D point clouds from the TLS as GCPs in bundle adjustment, in the case where it is difficult to conduct a GPS survey in mountainous and remote mine areas, such as the slope body with steeper angle and other high-risk areas.
Table 6. Results of the geo-positioning accuracy with bundle block adjustment in the side slope zone of the Jianshan area.
TestMaximum ErrorMean ErrorRoot-Mean-Squared Error
X/mY/mZ/m|X|/m|Y|/m|Z|/mX/mY/mZ/m
Test one0.5630.7411.7600.41080.36471.44270.42340.41781.6589
Test two0.2270.3761.5070.15400.19531.30780.16340.22601.5662
Test three0.1630.3721.4720.10480.14481.06030.11080.17261.3209

3.2. Results of the Digital Photogrammetric Products and the Accuracy Assessment

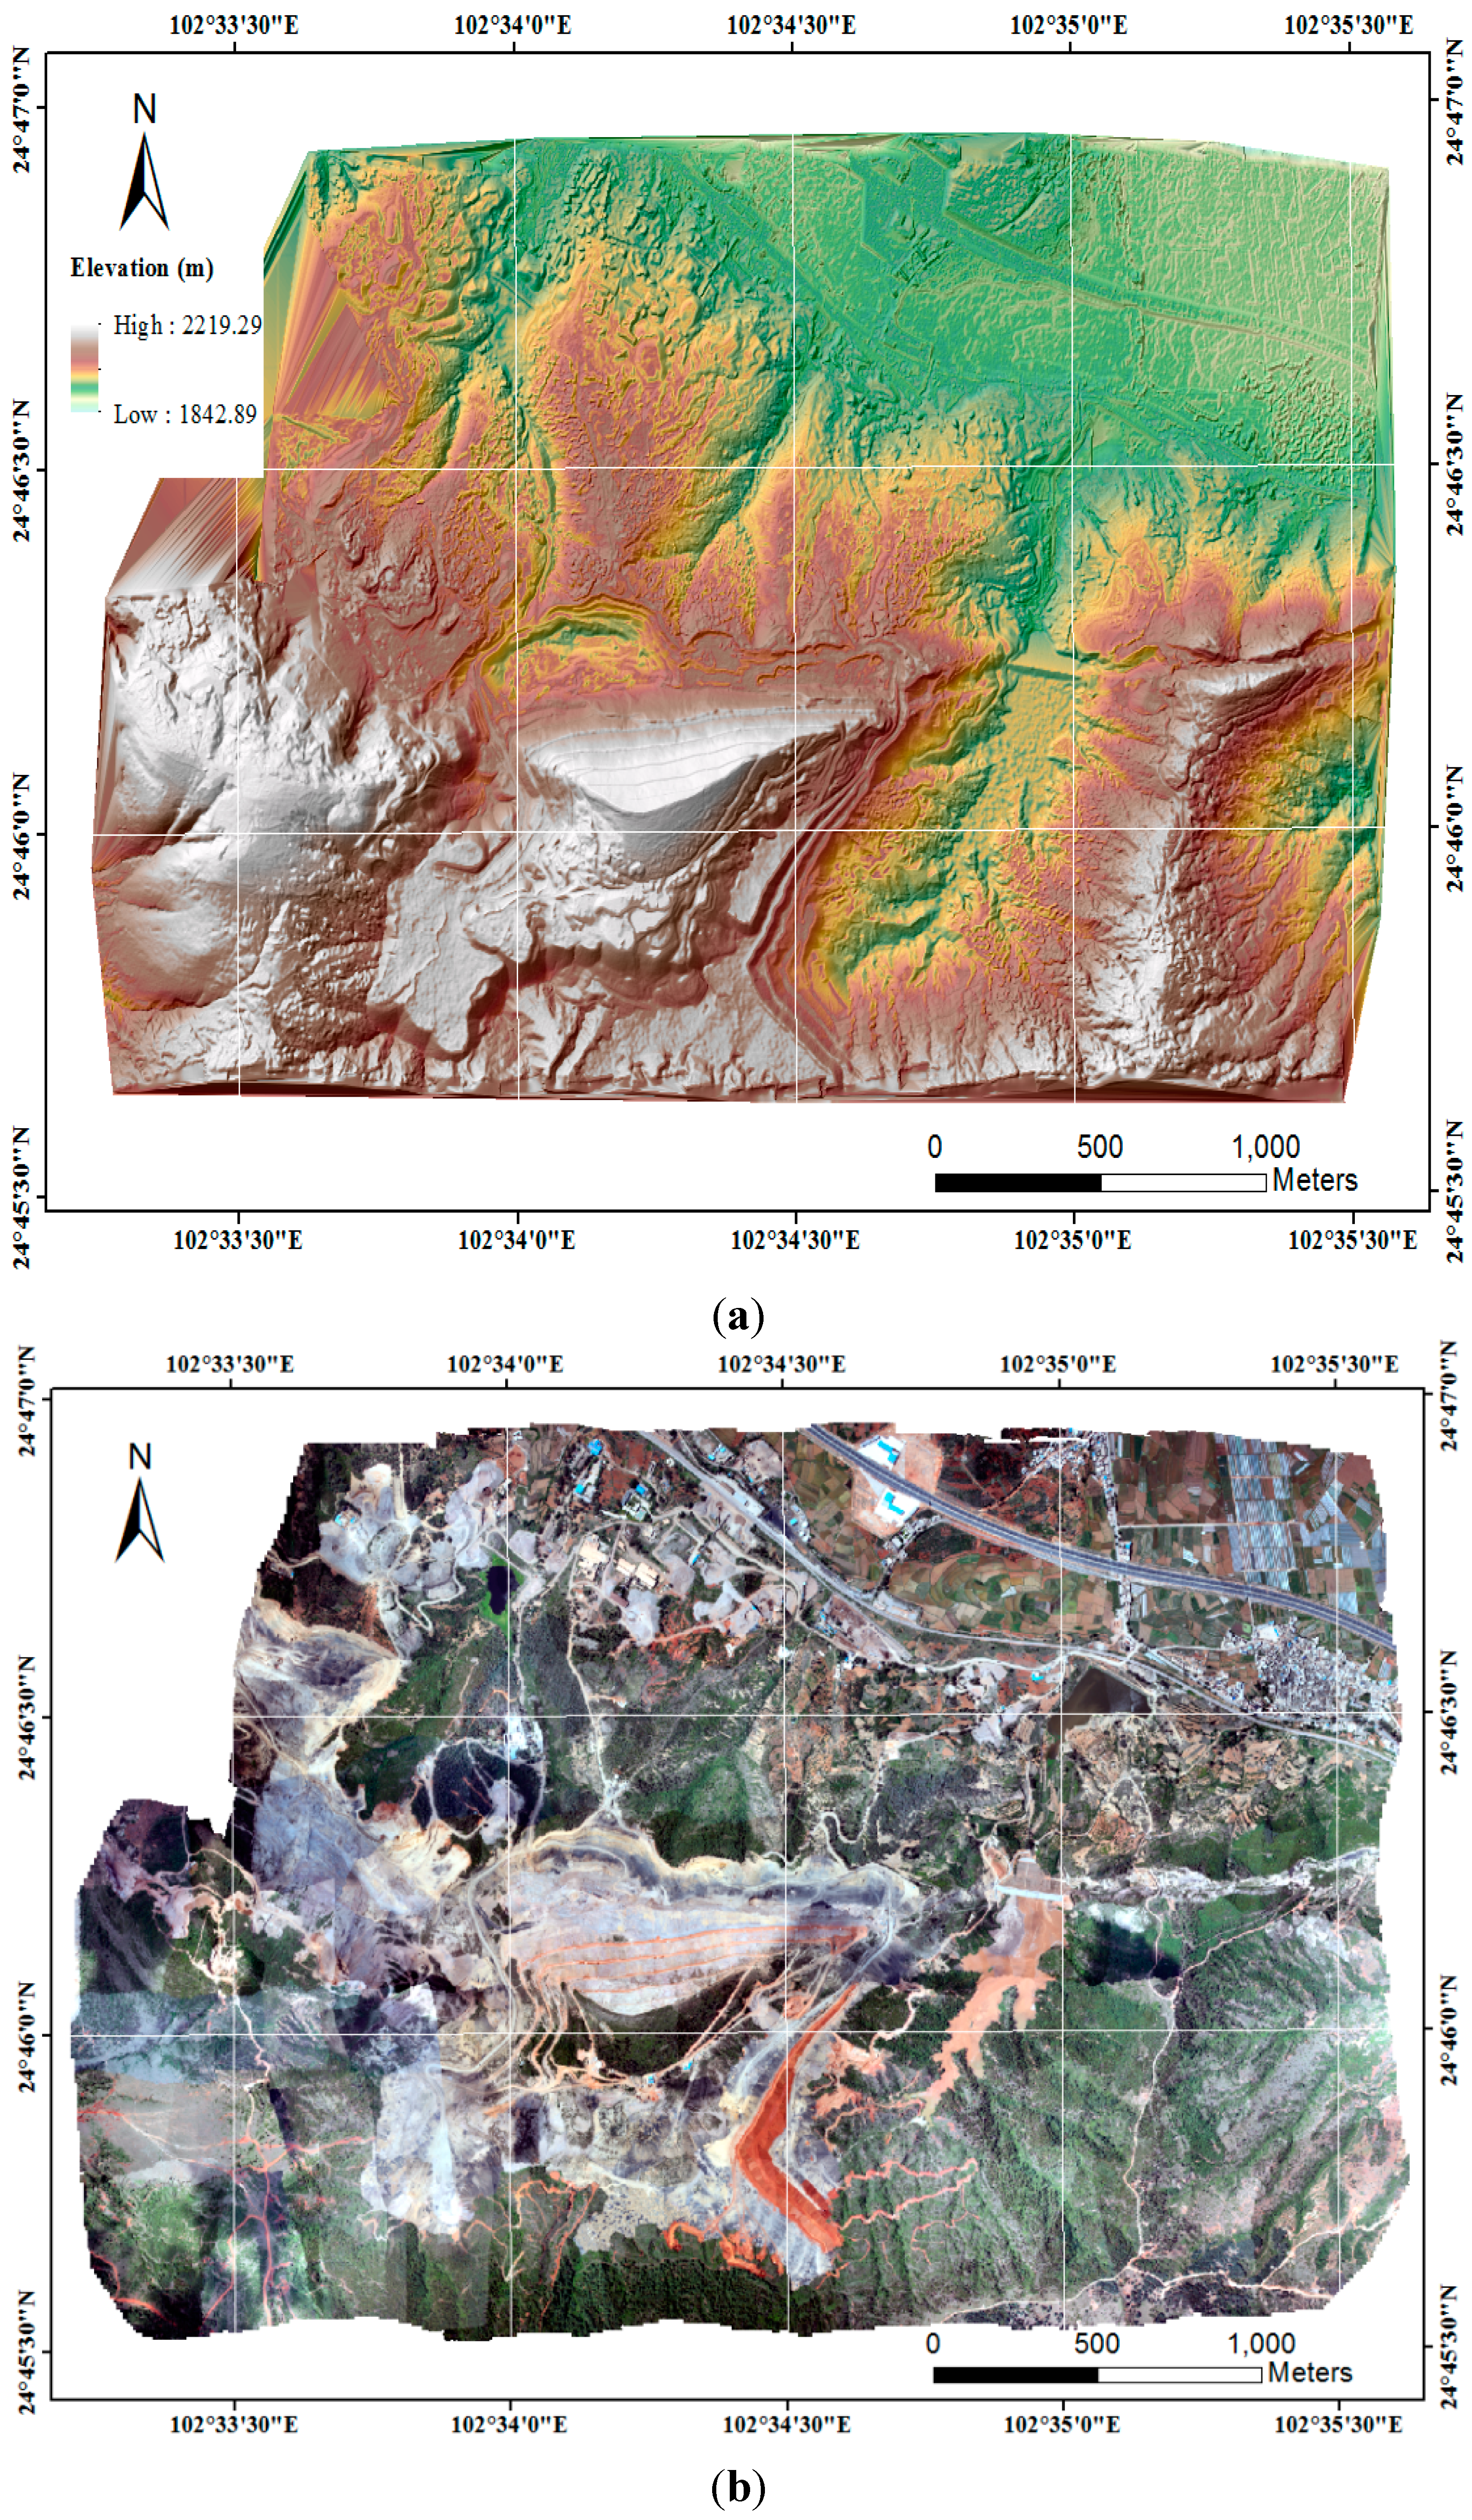
3.2.1. Results of the DSMs and DOMs for the Mine Areas

Once aerial triangulation is completed, a DSM can be generated from the 3D ground points by the methods of multi-image dense matching and forward intersection. After that, a digital orthophoto map (DOM) can be generated by orthorectification and mosaicking, based on the generated DSM and the known camera parameters. Figure 7 shows the results of the generated DSM (left) and ortho-image (right) in the Jianshan area, respectively.
In the experiment, the accuracies of the generated DSMs and DOMs were assessed. The coordinates of the checkpoints were first manually measured from the generated DOMs and DSMs, and they were then compared with the corresponding ground coordinates of these checkpoints surveyed from the GPS. Thus, the root-mean-squared error was further calculated based on the difference between the measured coordinates from the generated DOMs and DSMs and the surveyed coordinates from the GPS. Table 7 shows the results of the accuracy assessment of the generated DSMs and DOMs in the study areas. In the table, the accuracies of the generated DOMs in the X- and Y-directions are calculated, as well as the accuracies of the generated DSMs in the Z-direction. From the table, we can see that: (1) In all three areas, the accuracy in the X-direction is higher than those in both the Y- and Z-directions. In addition, the accuracy of the generated DSMs is two to three times higher than that of the generated DOMs; (2) In the horizontal direction, the accuracy of the generated DOM in the Jianshan area is the best and is close to the resolution of the UAV imagery. The reason for this result might be due to a better configuration of GCPs and a higher density of GCPs in this area; (3) In the Z-direction, the error in the value of Table 7 is higher than that of in Table 5, and the accuracy is lower than those of in both X- and Y-directions, in Jianshan area. The reason for this result may be some biases due to ortho-rectification, smoothing and the resampling introduced in the process of generating DSMs and DOMs, the accuracy of geo-positioning based on UAV images is related to topographic terrain. Because this test was conducted in the steep slope zone area, the accuracy in the Z-direction is lower than those of in both X- and Y-directions. For another, apart from active mines, the vegetation areas (occupied by woodlands) would have some impacts on the image matching and the creation of DSMs. However, the image matching algorithms in vegetated area were not addressed.
Figure 7. Result of the generated. (a) Hill-shaded DSM (with a cell size of 2 m) and (b) the generated DOM (with a spatial resolution of 0.15 m) in Jianshan area.
Remotesensing 07 06635 g007
Table 7. Results of the accuracy assessment of the generated DSMs and DOMs in respect to GCPs from GPS in the study areas.
AreaMaximum ErrorMean ErrorRoot-Mean-Squared Error
X/mY/mZ/m|X|/m|Y|/m|Z|/mX/mY/mZ/m
Jianshan0.2923−0.26261.82930.10550.07730.51500.13340.10910.7245
Kunyang0.4344−0.2529−1.66760.11520.13640.55100.14840.15450.7112
Jinning−0.8437−1.08071.44390.23820.42770.71420.30340.51040.8161

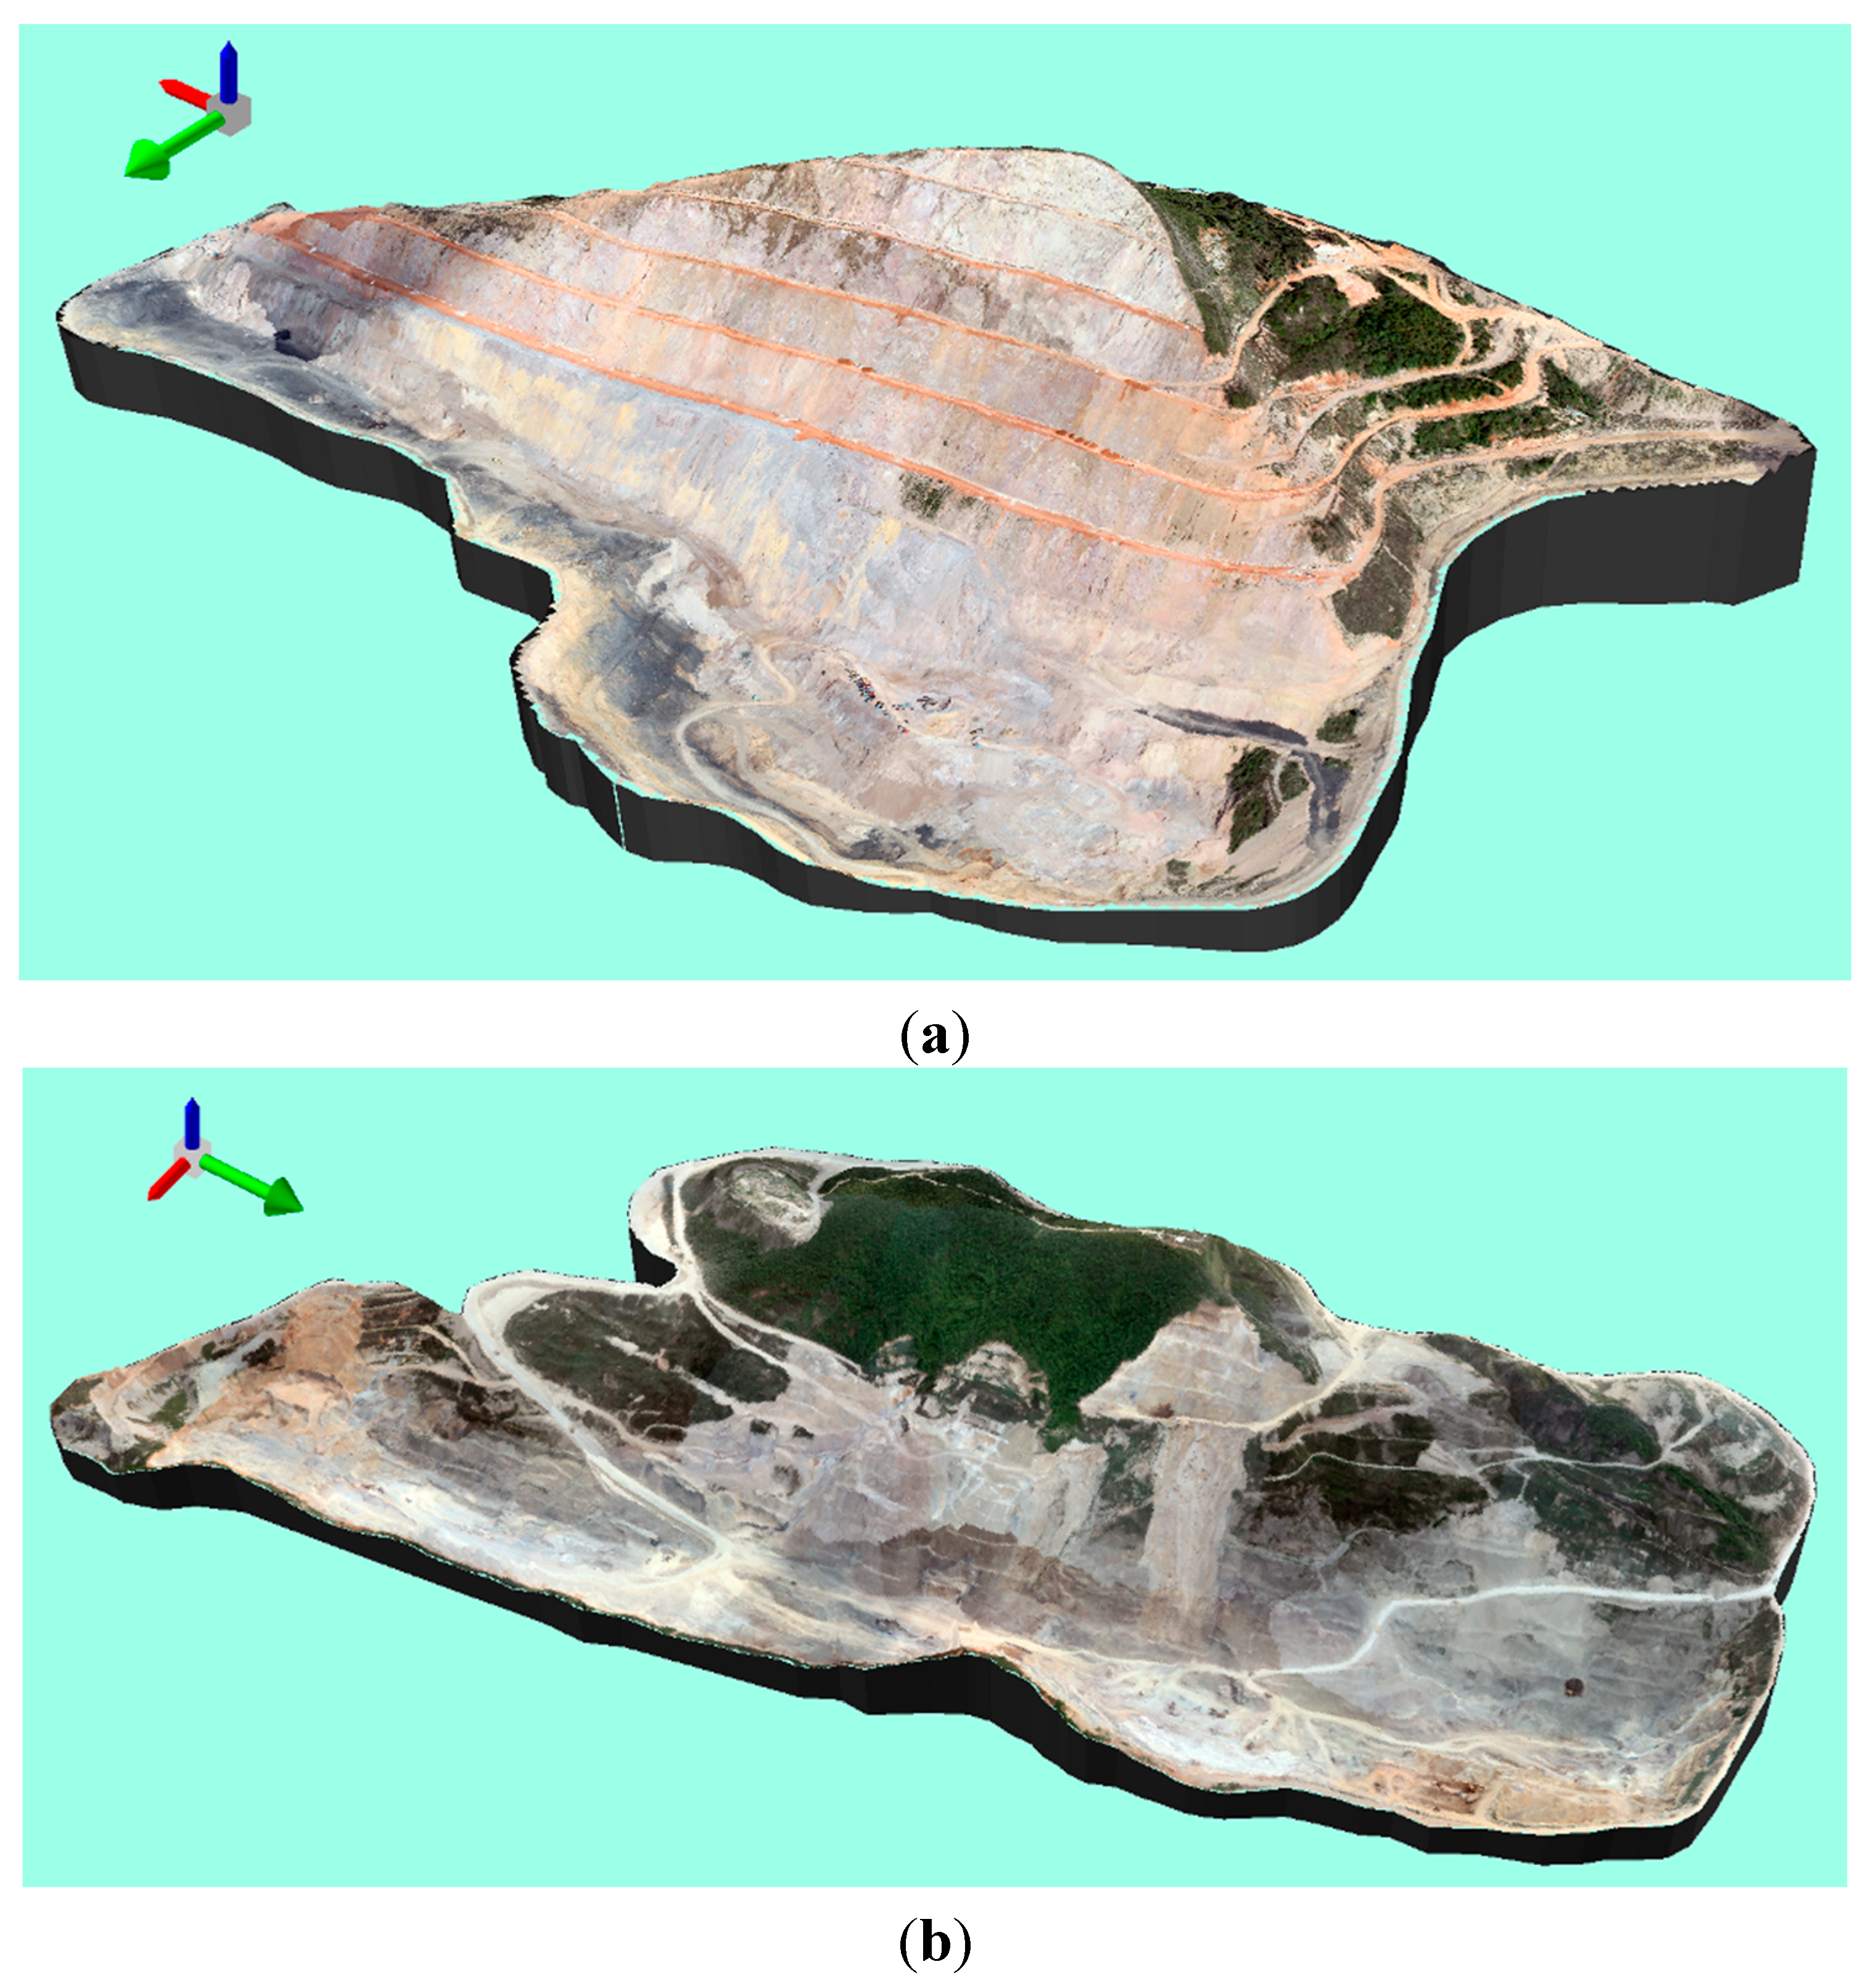
3.2.2. Results of the 3D Texture Models of the Side Slopes

The 3D texture model is one of the most important photogrammetric products, and it provides useful information for the monitoring, assessment and planning of mine areas. Furthermore, 3D models with fine textures were generated by integrating the UAV images and the point clouds of the TLS. Figure 8 shows the results of the 3D texture models of the side slopes in the study areas.
Figure 8. Result of the 3D texture model of the side slopes in the study area. (a,b) sided views from the top-left viewpoint with approximately 45° of the side slopes in Jianshan and Jinning areas, respectively.
Remotesensing 07 06635 g008
Figure 9. Result of the classification of land covers in the Jianshan area.
Remotesensing 07 06635 g009
Figure 10. Accuracy assessment of the classification of land covers in the Jianshan area.
Remotesensing 07 06635 g010

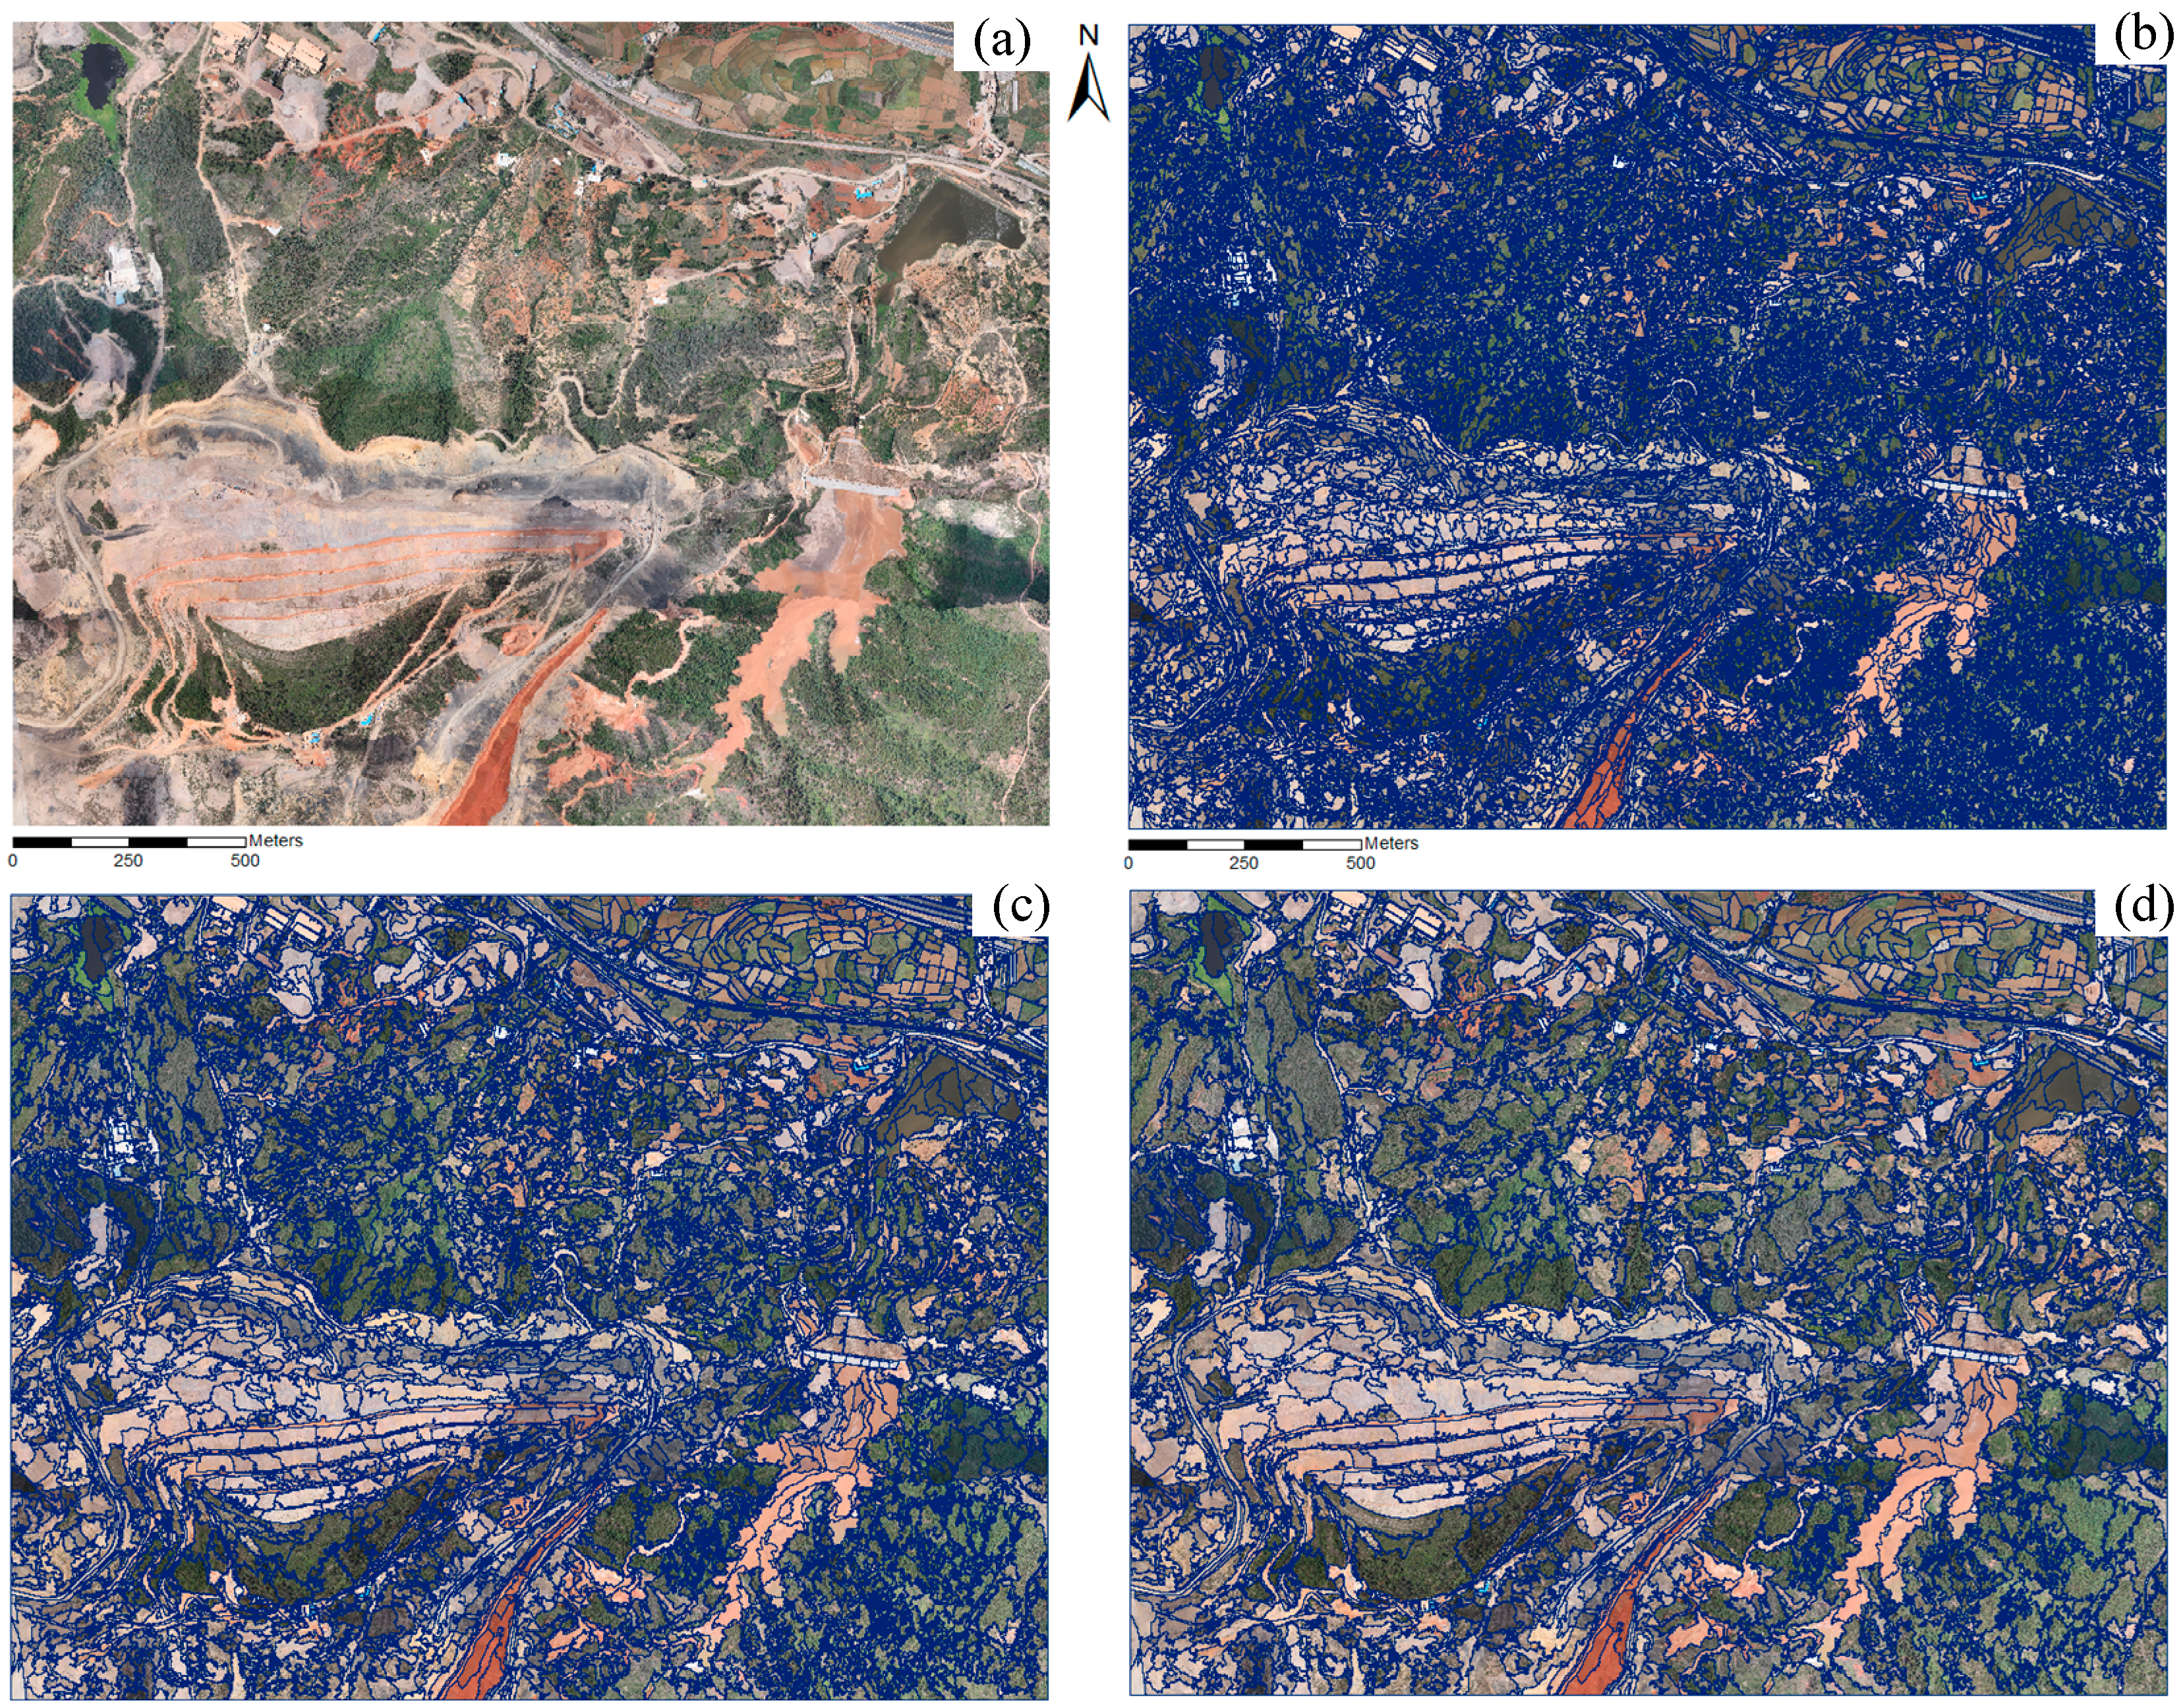
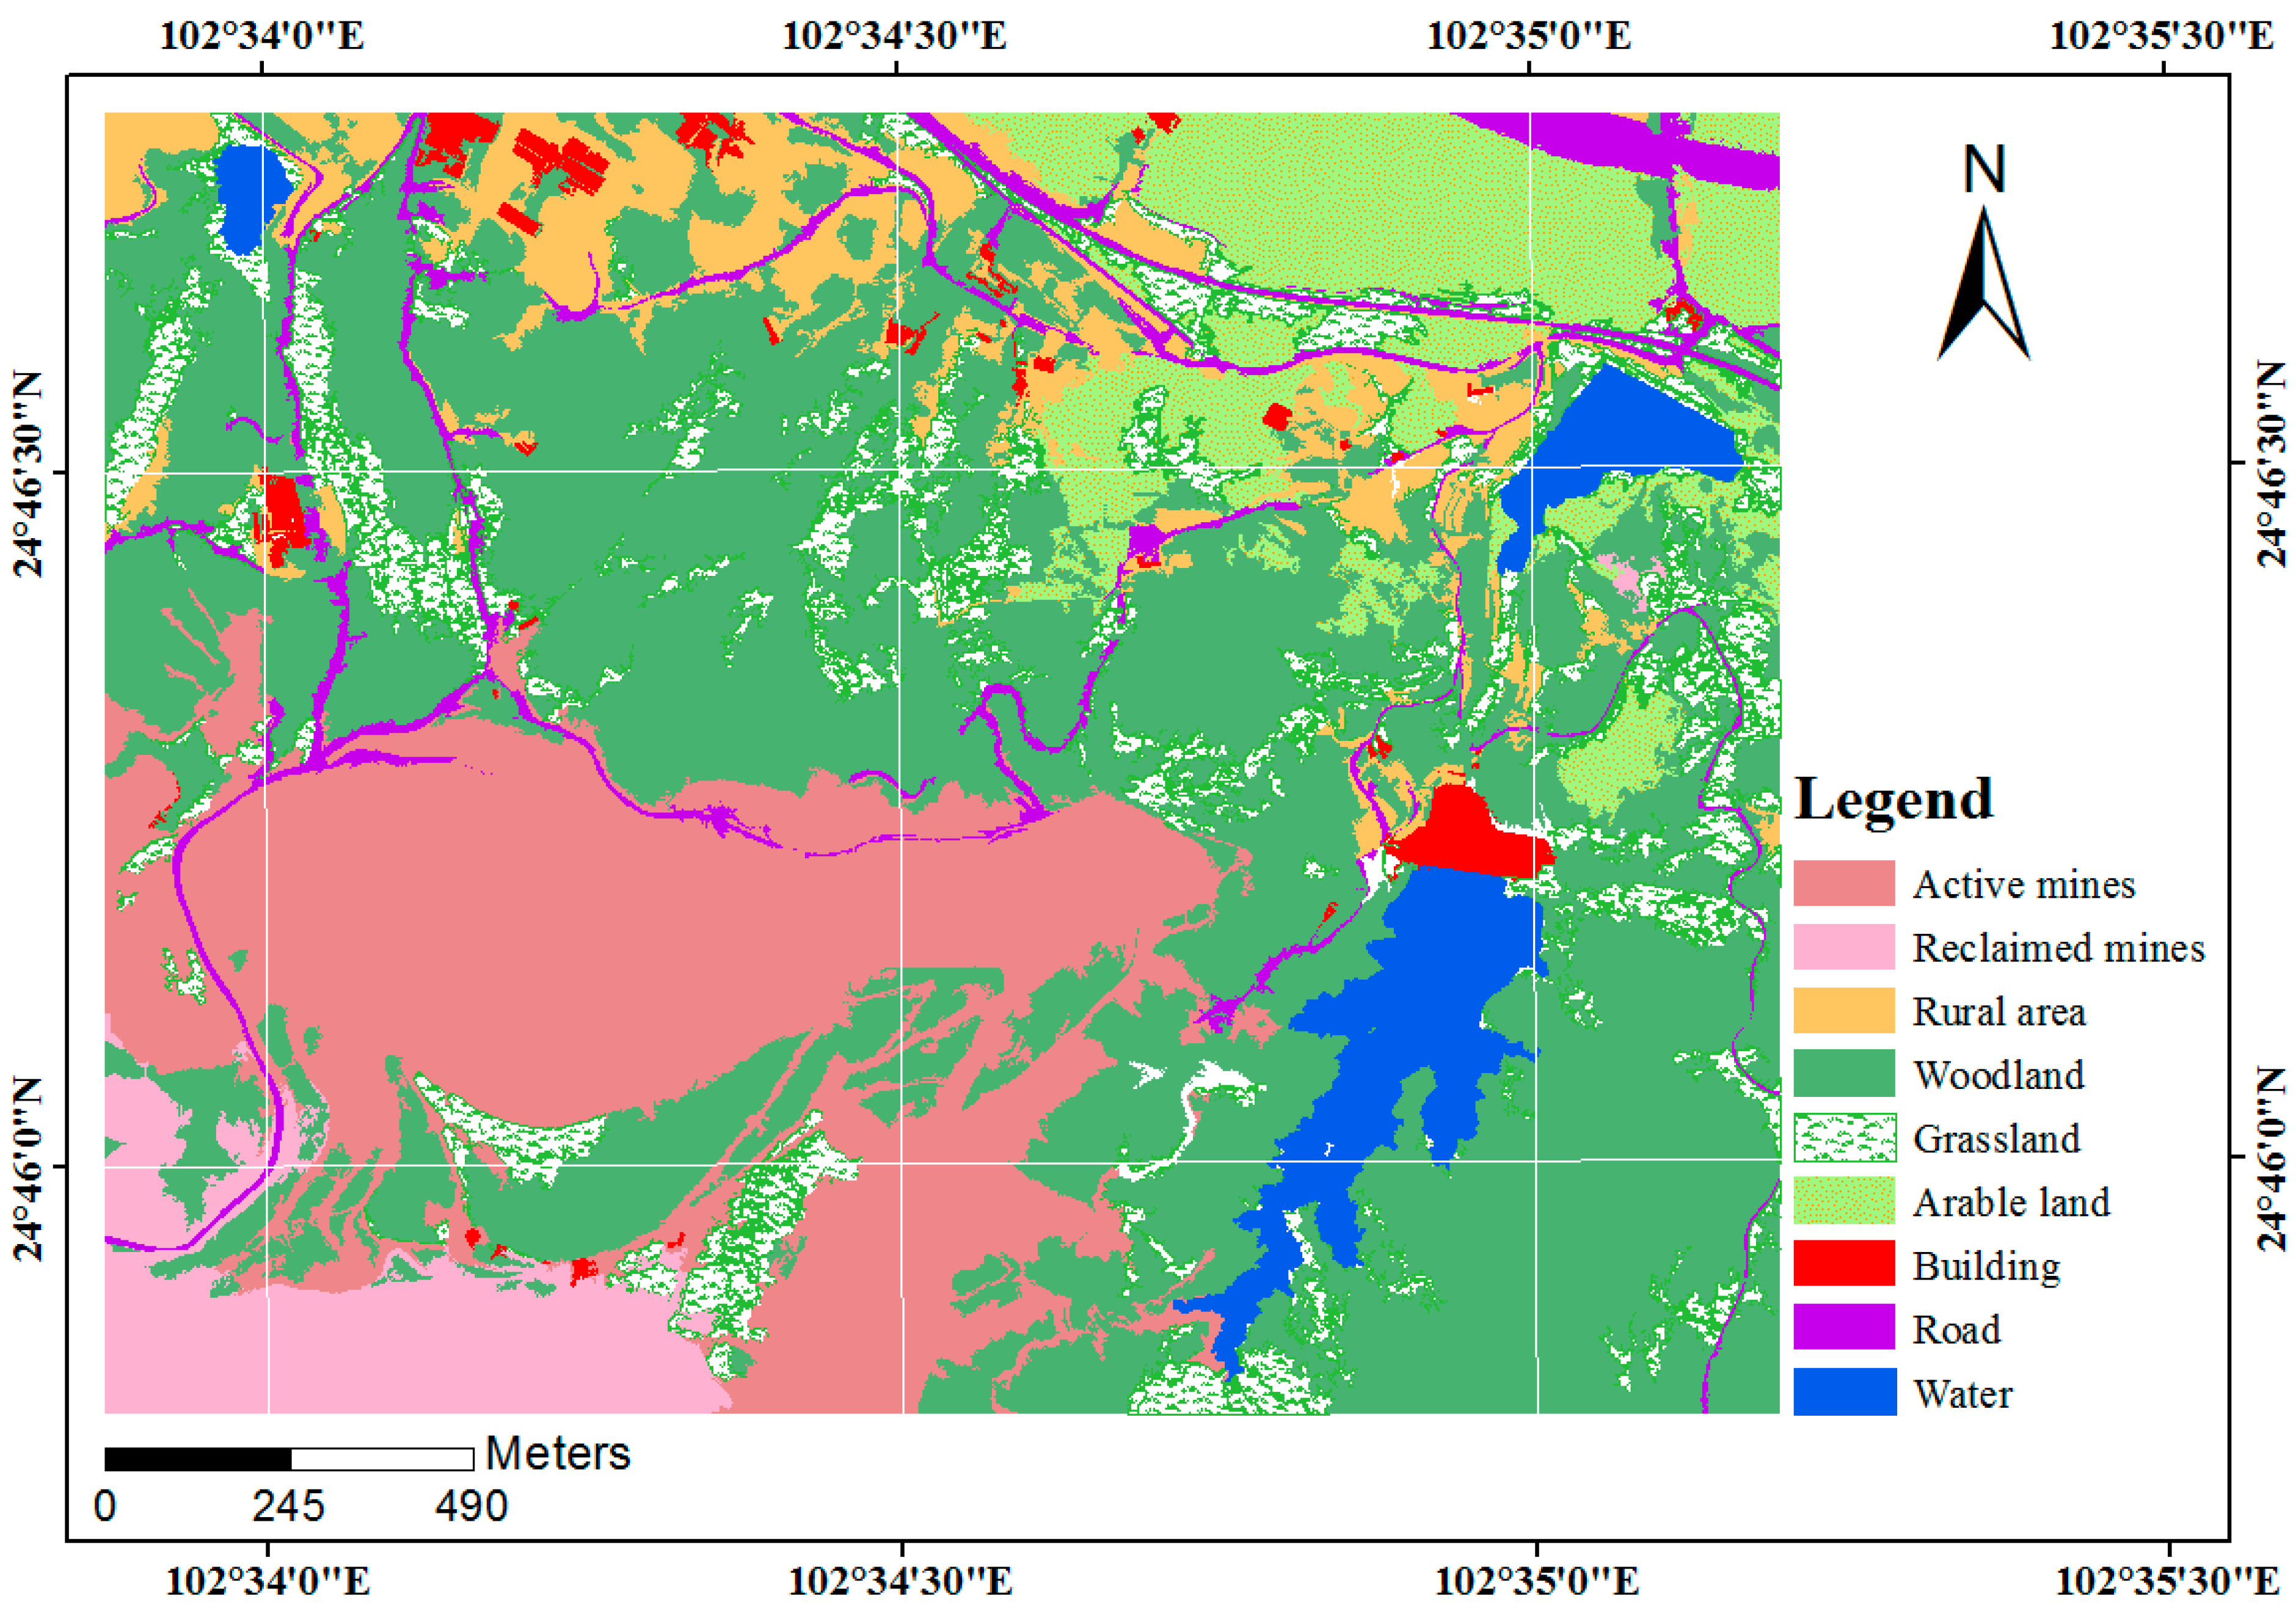
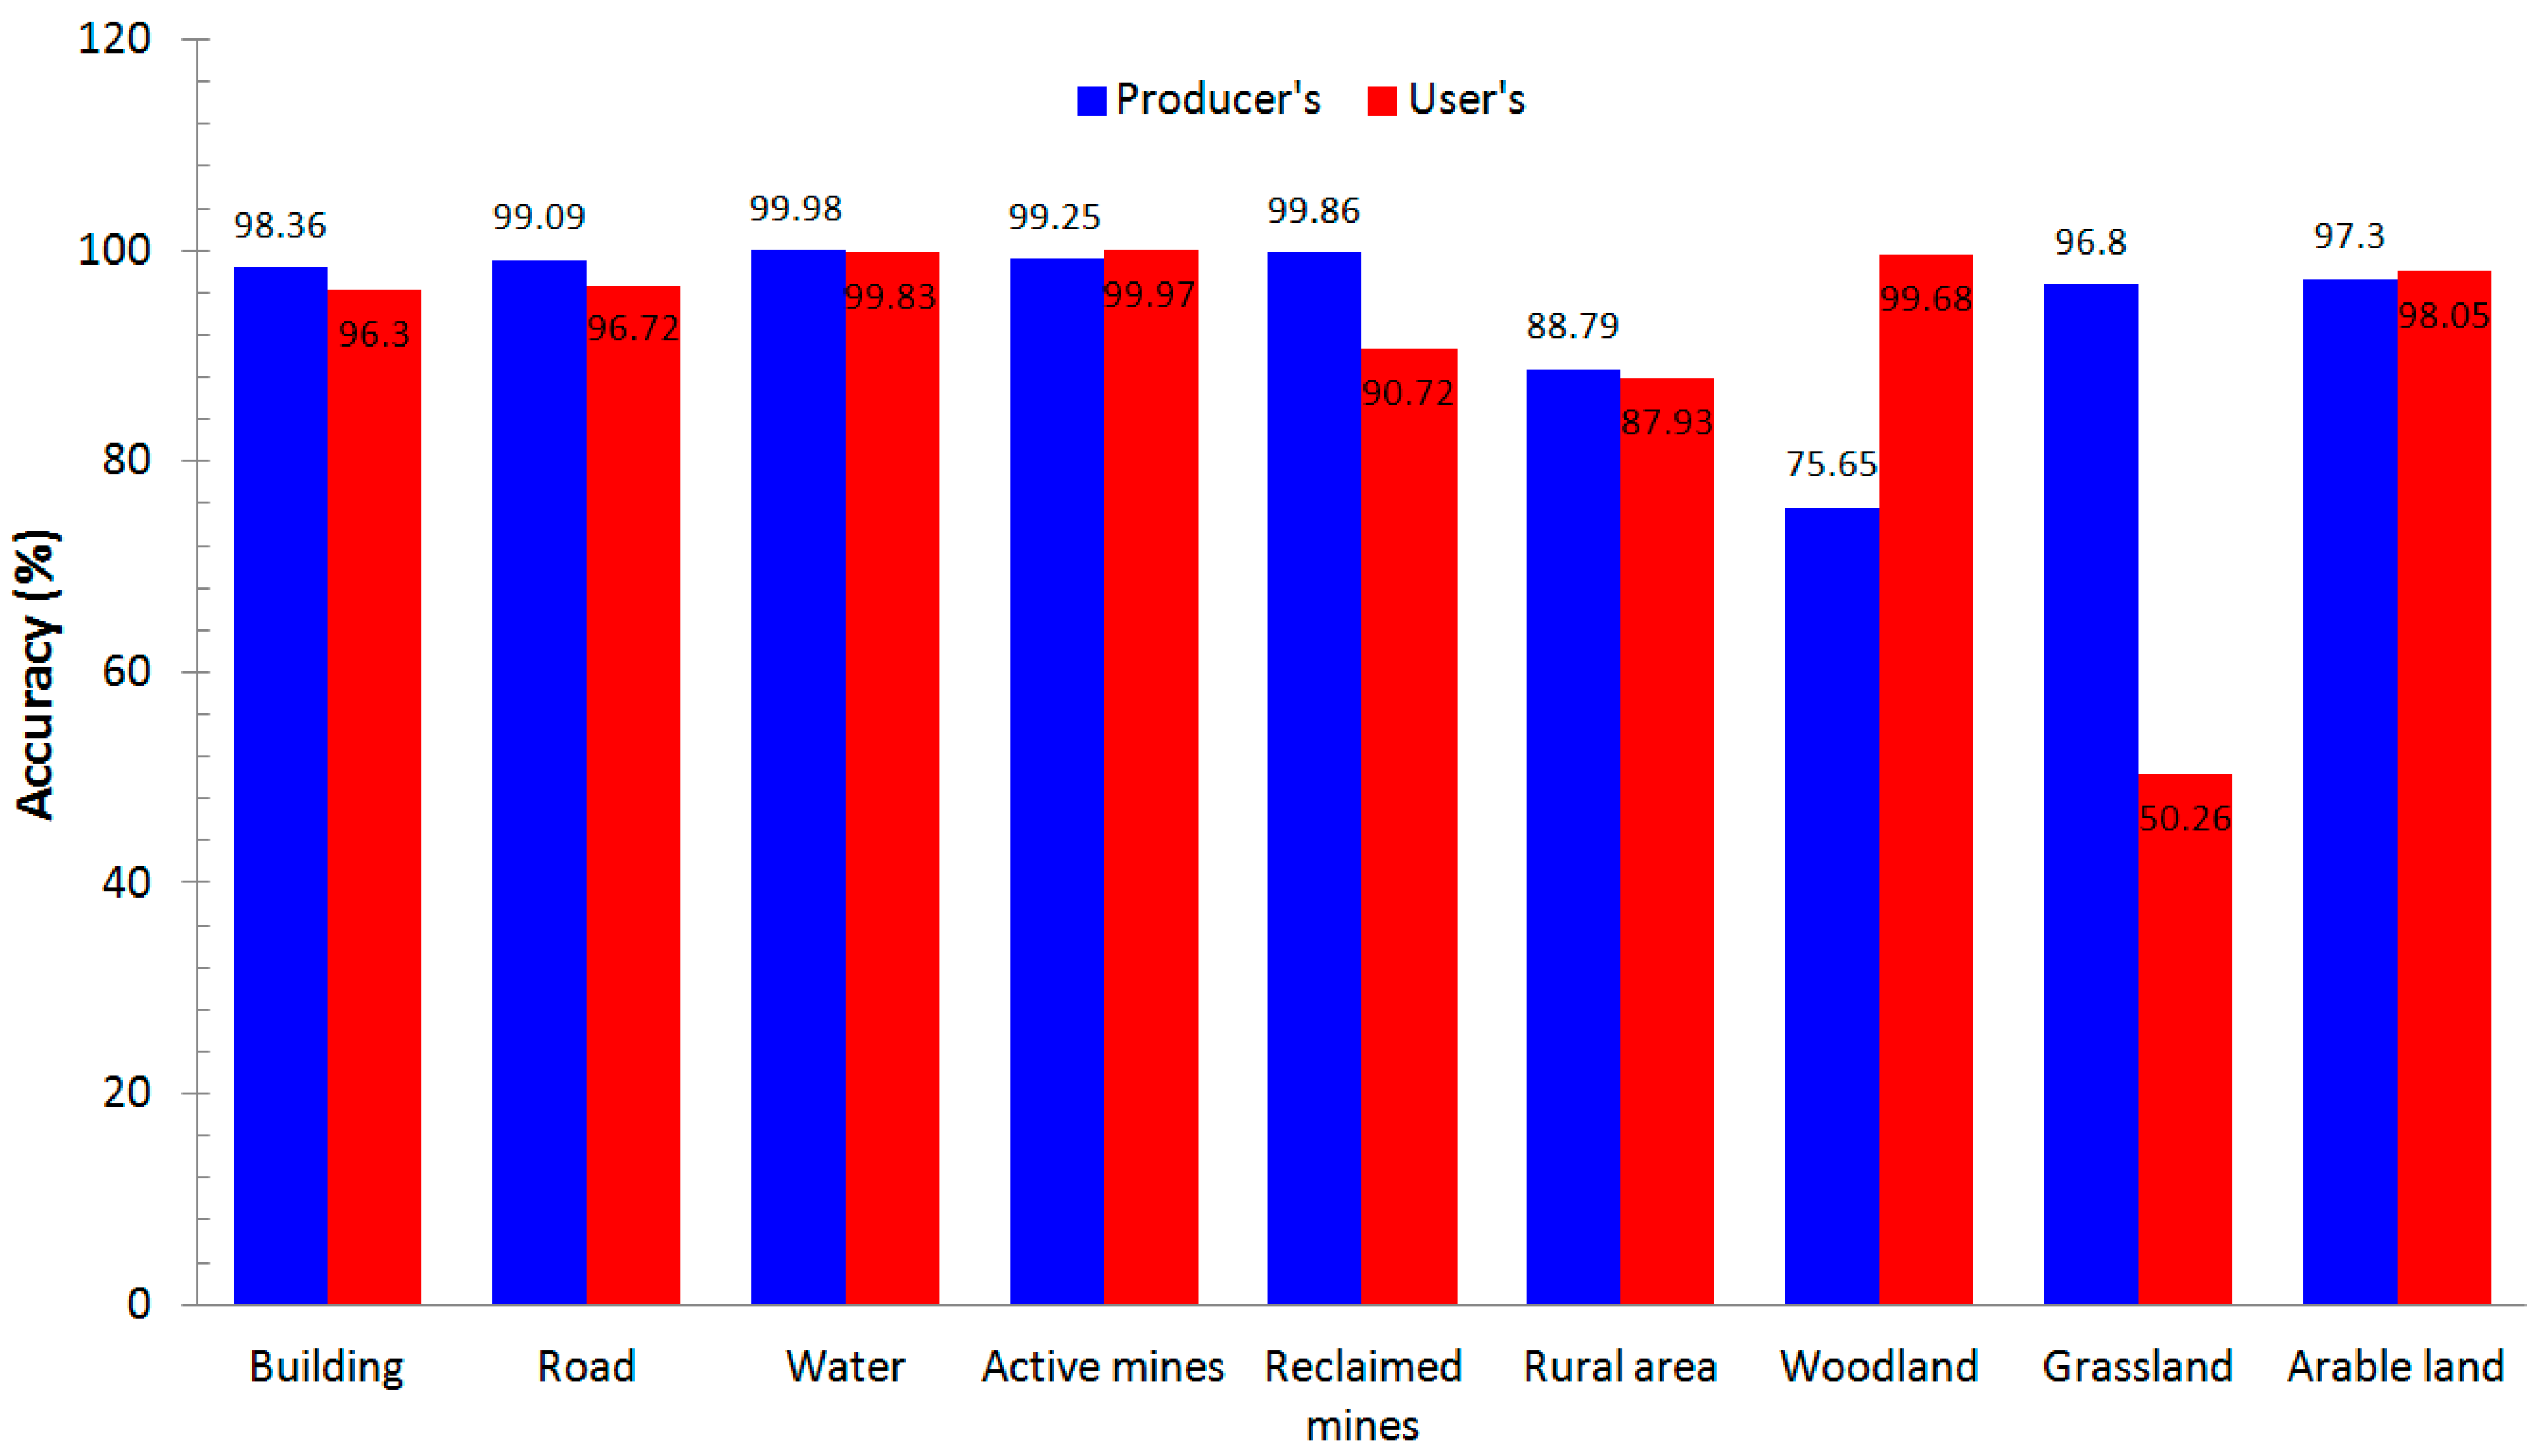
3.3. Results of the Image Classification and Accuracy Assessment

The open-pit mine area of Jianshan will be the first area designated for land reclamation. Therefore, the paper is focusing on this area for monitoring and mapping its environment and vegetation changes. Additionally, the OBIA approach was tested in this area. Figure 9 shows the result of the classification of land covers based on UAV images in the Jianshan area. Figure 10 shows the accuracy assessment of classification of the land covers in the Jianshan area. The producer accuracy for woodland is 75.65%, which is lower than any other classes. The user accuracy for grasslands is 50.26%, which is significantly lower than any other classes. This may be the grasslands confused with the woodland. The overall accuracy of the classification was 90.67% and the Kappa coefficient was 0.89, which is calculated with the confusion matrix of the classification.

3.4. Discussion

This study explored a photogrammetric approach for the joint use of UAV imagery and TLS point cloud by introducing additional input data from TLS in the bundle adjustment of UAV imagery, with the purpose of improving the geo-positioning accuracy of UAV images, particularly in the case where it is difficult to conduct a GPS survey in mountainous and high-risk areas. Based on the result of the aforementioned experiment in the open-pit mine areas, there are four issues that need to be discussed as follows.
(1)
By integration of 3D points extracted from the point clouds of TLS and ground points surveyed by GPS as GCPs in the bundle adjustment of UAV imagery, the geo-positioning accuracy of UAV images can be improved in open-pit mine areas. In our experiment, with the aid of POS equipped in UAV, the geo-positioning accuracies of UAV imagery are 4.29 m and 8.51 m in the planimetric and height directions, which are corresponding to 28.6 pixels and 56.7 pixels at the spatial resolution of 0.15 m of UAV imagery. Further, with the aid of POS, 19 GCPs from GPS survey and 10 3D points extracted from the point clouds of TLS, the accuracies can be improved to be 0.16 m and 0.62 m in the planimetric and height directions, which are corresponding to 1.07 pixels and 4.13 pixels with respect to the spatial resolution of 0.15 m of UAV imagery. In the existing studies on the geo-positioning accuracy of UAV imagery, by the use of a total of 33 GCPs in urban areas, Zhang et al. [16] achieved an accuracy of 0.02 m in planimetric direction and an accuracy of 0.03 m in vertical direction, which are corresponding to 0.4 pixels and 0.6 pixels compared with the 0.05 m ground sampling distance (GSD) of UAV imagery. Another result showed that the RMSEs of both planimetric position and height were better than 0.2 m, which are corresponding to 1 pixels with the 0.2 m GSD. In rangeland areas, Laliberte et al. [10] obtained an accuracy of 1.5 to 2 pixels in both planimetric and height directions. Laliberte et al. [65] showed the results of geometric accuracy in a relatively flat area with the RMSE of 0.65 m (corresponding to 10.8 pixels) and in the greater elevation difference area with the RMSE of 1.14 m (corresponding to 19 pixels), with the 6 cm GSD. In archaeological areas, Chiabrando et al. [7] achieved the standard deviations of 0.04 m, −0.034 m and 0.038 m in the X-, Y- and Z-directions, respectively, which are corresponding to 1 pixels, 0.85 pixels and 0.95 pixels, respectively, compared with the 0.04 m GSD. Therefore, from results of the geo-positioning accuracy based on our proposed approach and the existing ones, we can see that (1) the planimetric accuracy obtained in mine areas is higher than that obtained in rangeland areas, while the height accuracy obtained in mine areas is lower than that obtained in rangeland areas. The reason for this result might be that by introducing additional GCPs from TLS cloud points in our proposed approach, the number of GCPs used in the bundle adjustment of UAV imagery in mine areas is more than that in rangeland areas. However, due to the elevation change in open-pit mine areas, the vertical accuracy in mine areas is lower than that in rangeland areas with the flat topography. (2) Both planimetric and height accuracies obtained in mine areas are lower than those obtained in urban areas. The reason responsible for this result might be that there are more obvious ground features in urban areas than in open-pit mine areas, the topography is more flat in urban areas than in open-pit mine area, and it is easier to obtain more GCPs in urban areas than in open-pit mine areas. At the same time, the accuracy of geo-positioning achievable from UAV images based on our proposed approach meets the demand for the subsequent applications in open-pit mine areas.
(2)
The contribution of 3D point clouds from the TLS on the improvement of geo-positioning accuracy of UAV imagery shows the same level as that of GCPs surveyed by GPS. In our experiment in the side slope zone of the Jianshan area, with the aid of the POS and the GCPs surveyed by the GPS, the geo-positioning accuracies based on UAV imagery achieve 0.11 m, 0.17 m and 1.32 m in the X-, Y- and Z-directions, respectively. At the same time, the geo-positioning accuracies based on UAV imagery achieve 0.16 m, 0.23 m and 1.57 m in the X-, Y- and Z-directions, respectively, with the aid of the POS and 3D point clouds from the TLS. Therefore, the result shows that the accuracy of geo-positioning based on 3D point clouds from the TLS is closer to that based on GCPs from GPS survey. Further, this result shows the potential of using 3D point clouds from the TLS as GCPs in bundle adjustment, in the case where it is difficult to conduct a GPS survey in mountainous and remote mine areas. To the best of our knowledge, there is no similar report on the contribution of 3D point clouds obtained from the TLS as a supplement to the GCPs on the improvement of geo-positioning accuracy of UAV imagery.
(3)
By the use of the improved geo-positioning accuracy of UAV images, the accuracies achieved of the generated DOMs and DSMs may be about 0.13 m, 0.11 m and 0.72 m in the X-, Y- and Z-directions, with respect to the image resolution of approximately 0.15 m/pixel. In addition, an overall accuracy of the classification of the land covers is 90.67%, by the use of an object-based image analysis approach in mine areas. Laliberte et al. [10] achieved an accuracy of 1.5 to 2 m for the image mosaics with respect to the spatial resolution of 15 cm of the orthophoto, and overall classification accuracies for the two image mosaics were 83% and 88% in the rangeland area. By the use of UAV imagery with a spatial resolution of 21.8 cm, Dunford et al. [70] obtained an overall accuracy of 63% for classification of the vegetation units in species mapping in Mediterranean riparian forest. In addition, with respect to the accuracy of the classification of land covers in the open-pit mine area, the vegetation and exposed rock/soil can be classified with high accuracy by the use of the rule-based classification method. However, the classification accuracy of grasslands and woodland is significantly lower than those of the other land cover types due to the confusion of grasslands with the woodland in the mine areas.
(4)
Our study demonstrates a practical framework for the integration of UAV-based photogrammetry and TLS with application to the open-pit mine areas, which includes UAV image and TLS cloud point acquisition, image and cloud point processing and integration, object-oriented classification and three-dimensional (3D) mapping and monitoring of open-pit mine areas. Actually, the UAV-based photogrammetry has been widely employed in many fields, and some work has been reported in mine areas [31,32,33]. From the results of our experiments, we can see that UAVs, which need the permission of flight regulation, can be deployed quickly and repeatedly, flying with low altitude with less interference of clouds, and costing less than satellites and manned aircrafts. The novelty of the proposed framework is the joint use of UAV-based photogrammetry and TLS by introducing additional input data from TLS as GCPs can provide more accurate and detailed UAV images for monitoring of the mine areas. However, there are several limitations with respect to the proposed approach. The first one is that it is sometimes difficult to find ground characteristic features in the open-pit mine areas. As a result, some man-made markers need to be established as GCPs. The second one is that due to battery duration, UAV campaign needs more flight routes to cover a larger area. In addition, due to the limited payload capacity, only light and limit sensors can be equipped in UAVs. The third one is that due to the larger amount of UAV imagery and TLS point clouds, high performance parallel processing computation needs to be further developed.

4. Conclusions

This paper investigates a practical framework for the integration of unmanned aerial vehicle (UAV) imagery and terrestrial laser scanning (TLS) for the three-dimensional (3D) mapping and monitoring of open-pit mine areas, which includes flight planning, image acquisition, image processing, TLS point clouds and UAV images integration, and classification of land covers. The performance of the proposed approach is demonstrated in three open-pit phosphate mines in Yunnan province, China. In the proposed framework, (1) in order to extract the conjugate points of the stereo pair of UAV images and those points between TLS point clouds and UAV images, the feature points were first extracted by the scale-invariant feature transform (SIFT) operator and the outliers were identified and thus eliminated by the RANdom SAmple Consensus (RANSAC) approach; (2) In order to improve the accuracy of geo-positioning based on UAV imagery, the feature points extracted from TLS used as a supplement to ground control points (GCPs) and GCPs surveyed from global positioning systems (GPS) were integrated in the bundle adjustment, and three scenarios were designed and compared; (3) In order to monitor and map the mine areas for land reclamation, an object-based image analysis approach was used for the classification of the accuracy improved UAV ortho-image. The results showed that:
(1)
In the case of performing the bundle adjustment only with the support of the position and orientation system (POS) in the Jianshan area, the geo-positioning accuracies achieved based on UAV imagery are 3.91 m, 1.76 m and 8.51 m in the X-, Y- and Z-directions, respectively. In the case of performing the bundle adjustment with both the POS and the GCPs surveyed by the GPS, the geo-positioning accuracies achieved based on UAV imagery are 0.14 m, 0.09 m and 0.64 m in the X-, Y- and Z-directions, respectively. In the case of performing the bundle adjustment with POS, GCPs and 3D point clouds from the TLS, the geo-positioning accuracies based on UAV imagery achieved are 0.13 m, 0.09 m and 0.62 m in the X-, Y- and Z-directions, respectively.
(2)
For the test of the contribution of the 3D point clouds from the TLS in the accuracy improvement in the bundle block adjustment in the side slope zone of the Jianshan area, the geo-positioning accuracies achieved based on UAV imagery are 0.16 m, 0.23 m and 1.57 m in the X-, Y- and Z-directions, respectively, with the aid of the POS and 3D point clouds from the TLS. In addition, with the aid of the POS and the GCPs surveyed by the GPS, the geo-positioning accuracies achieved based on UAV imagery are 0.11 m, 0.17 m and 1.32 m in the X-, Y- and Z-directions, respectively.
(3)
With the use of the improved geo-positioning based on UAV images in the bundle adjustment, an accuracy of the decimeter-level was achieved for the generated digital surface models (DSMs) and digital orthophoto maps (DOMs) in the study areas, and the overall accuracy of the classification of the land covers was 90.67%, based on an object-based image analysis approach in the mine areas.
From the aforementioned experimental results with UAVs in the open-pit mines, we can discuss the following: (1) The proposed UAV-based photogtammetric system shows a flexible and efficient way of obtaining high-resolution images and of generating high accuracy of DSMs and DOMs. At the same time, the proposed UAV-based photogtammetric system costs less than those based on the satellites and manned aircrafts; (2) The experimental result shows the potential of using 3D point clouds from the TLS as GCPs in bundle adjustment for the improvement of geo-positioning accuracy based on UAV imagery, particularly in the case where it is difficult to conduct a GPS survey in mountainous and high-risk areas; (3) The proposed framework for the joint use of UAV-based photogrammetry and TLS, which is a photogrammetric approach with additional input data from TLS, can provide detailed information for monitoring, assessment, and planning of the mine areas with a high accuracy and frequent data acquisition. However, it is sometimes difficult to find obvious features in open-pit mine areas. As a result, some man-made markers need to be established as GCPs. In addition, some approaches for parallel processing of the large amount of TLS point clouds and UAV images need to be further developed in future work.

Acknowledgments

The work described in this paper was substantially supported by the National Natural Science Foundation of China (Project No. 41325005, 41171352 and 41401531), the China Special Funds for Meteorological and Surveying, Mapping and Geoinformation Research in the Public Interest (Project No. HY14122136 and GYHY201306055), the National High-tech Research and Development Program (Project No. 2012AA121302), and the Fundamental Research Funds for the Central Universities.

Author Contributions

The theoretical framework for the integration of UAV-based photogrammetry and terrestrial laser scanning for mapping and monitoring open-pit mine areas were presented by Xiaohua Tong, Xiangfeng Liu, Peng Chen and Shijie Liu. The approach for improving the geo-positioning accuracy was proposed by Xiaohua Tong, Xiangfeng Liu, Peng Chen and Shijie Liu. The photogrammetric processing of UAV imagery was conducted by Kuifeng Luan, Lingyun Li and Shuang Liu. The approach for integration of UAV imagery and TLS point clouds was studied by Xianglei Liu, Huan Xie, Yanmin Jin and Zhonghua Hong. The experiments were performed by Xiangfeng Liu, Peng Chen, Shijie Liu, Kuifeng Luan, Lingyun Li, Shuang Liu and Xianglei Liu. All authors have contributed significantly and have participated sufficiently to take the responsibility for this research. Moreover, all authors are in agreement with the submitted and accepted versions of the publication.

Conflicts of Interest

The authors declare no conflict of interest.

References

  1. American Institute of Aeronautics and Astronautics (AIAA). Committee of Standards “Terminology for Unmanned Aerial Vehicles and Remotely Operated Aircraft”; AIAA: Reston, VA, USA, 2004. [Google Scholar]
  2. Zhou, G.Q. Geo-referencing of video flow from small low-cost civilian UAV. IEEE Trans. Autom. Sci. Eng. 2010, 7, 156–166. [Google Scholar] [CrossRef]
  3. Turner, D.; Lucieer, A.; Watson, C. An automated technique for generating georectified mosaics from ultra-high resolution unmanned aerial vehicle (UAV) imagery, based on Structure from Motion (SfM) point clouds. Remote Sens. 2012, 4, 1392–1410. [Google Scholar] [CrossRef]
  4. Blyenburgh, P.V. UAVs: An overview. Air Space Eur. 1999, 1, 43–47. [Google Scholar] [CrossRef]
  5. Rango, A.; Laliberte, A.; Steele, C.; Herrick, J.E.; Bestelmeyer, B.; Schmugge, T.; Roanhorse, A.; Jenkins, V. Using unmanned aerial vehicles for rangelands: Current applications and future potentials. Environ. Pract. 2006, 8, 159–168. [Google Scholar] [CrossRef]
  6. Vericat, D.; Brasington, J.; Wheaton, J.; Cowie, M. Accuracy assessment of aerial photographs acquired using lighter-than-air blimps: Low-cost tools for mapping river corridors. River. Res. Applic. 2009, 25, 985–1000. [Google Scholar] [CrossRef]
  7. Chiabrando, F.; Nex, F.; Piatti, D.; Rinaudo, F. UAV and RPV systems for photogrammetric surveys in archaelogical areas: Two tests in the Piedmont region (Italy). J. Archaeol. Sci. 2011, 38, 697–710. [Google Scholar] [CrossRef]
  8. Watts, A.C.; Ambrosia, V.G.; Hinkley, E.A. Unmanned aircraft systems in remote sensing and scientific research: Classification and considerations of use. Remote Sens. 2012, 4, 1671–1692. [Google Scholar] [CrossRef]
  9. Nagai, M.; Chen, T.; Shibasaki, R.; Kumugai, H.; Ahmed, A. UAV-borne 3-D mapping system by multisensory integration. IEEE Trans. Geosci. Remote Sens. 2009, 47, 701–708. [Google Scholar] [CrossRef]
  10. Laliberte, A.S.; Herrick, J.E.; Rango, A.; Winters, C. Acquisition, orthorectification, and object-based classification of unmanned aerial vehicle (UAV) imagery for rangeland monitoring. Photogramm. Eng. Remote Sens. 2010, 76, 661–672. [Google Scholar] [CrossRef]
  11. Rango, A.; Laliberte, A.S. Impact of flight regulations on effective use of unmanned aircraft systems for natural resources applications. J. Appl. Remote Sens. 2010, 4, 043539. [Google Scholar]
  12. Peterson, D.L.; Brass, J.A.; Smith, W.H.; Langford, G.; Wegener, S.; Dunagan, S.; Hammer, P.; Snook, K. Platform options of free-flying satellites, UAVs or the International Space Station for remote sensing assessment of the littoral zone. Int. J. Remote Sens. 2003, 24, 2785–2804. [Google Scholar] [CrossRef]
  13. Wang, J.Z.; Li, C.M. Acquisition of UAV images and the application in 3D city modeling. Proc. SPIE 2008. [Google Scholar] [CrossRef]
  14. Eisenbeiss, H. UAV Photogrammetry. Ph.D. Thesis, University of Technology Dresden, Dresden, Germany, 2009. [Google Scholar]
  15. Laliberte, A.S.; Rango, A. Texture and scale in object-based analysis of subdecimeter resolution unmanned aerial vehicle (UAV) imagery. IEEE Trans. Geosci. Remote Sens. 2009, 47, 761–770. [Google Scholar] [CrossRef]
  16. Zhang, Y.J.; Xiong, J.X.; Hao, L.J. Photogrammetric processing of low-altitude images acquired by unpiloted aerial vehicles. Photogramm. Rec. 2011, 26, 190–211. [Google Scholar] [CrossRef]
  17. Przybilla, H.-J.; Wester-Ebbinghaus, W. Bildflug Mit Ferngelenktem Kleinflugzeug. In Bildmessung und Luftbildwesen; Zeitschrift fuer Photogrammetrie und Fernerkundung, Herbert Wichman Verlag: Karlsruhe, Germany, 1979; Volume 47, pp. 137–142. [Google Scholar]
  18. Herwitz, S.R.; Johnson, L.F.; Dunagan, S.E.; Higgins, R.G.; Sullivan, D.V.; Zheng, J.; Lobitz, B.M.; Leung, J.G.; Gallmeyer, B.A.; Aoyagi, M.; et al. Imaging from an unmanned aerial vehicle: Agricultural surveillance and decision support. Comput. Electron. Agric. 2004, 44, 49–61. [Google Scholar]
  19. Xiang, H.; Tian, L. Development of a low-cost agricultural remote sensing system based on an autonomous unmanned aerial vehicle (UAV). Biosyst. Eng. 2011, 108, 174–190. [Google Scholar] [CrossRef]
  20. Wallace, L.; Lucieer, A.; Watson, C.; Turner, D. Development of a UAV-LiDAR system with application to forest inventory. Remote Sens. 2012, 4, 1519–1543. [Google Scholar] [CrossRef]
  21. Watai, T.; Machida, T.; Ishizaki, N.; Inoue, G. A lightweight observation system for atmospheric carbon dioxide concentration using a small unmanned aerial vehicle. J. Atmos. Ocean. Technol. 2006, 23, 700–710. [Google Scholar] [CrossRef]
  22. McGonigle, A.J.S.; Aiuppa, A.; Giudice, G.; Tamburello, G.; Hodson, A.J.; Gurrieri, S. Unmanned aerial vehicle measurements of volcanic carbon dioxide fluxes. Geophys. Res. Lett. 2008, 35, L06303. [Google Scholar] [CrossRef]
  23. Hardin, P.J.; Jensen, R.R. Small-scale unmanned aerial vehicles in environmental remote sensing: Challenges and opportunities. GISci. Remote Sens. 2011, 48, 99–111. [Google Scholar] [CrossRef]
  24. Khan, A.; Schaefer, D.; Tao, L.; Miller, D.J.; Sun, K.; Zondlo, M.A.; Harrison, W.A.; Roscoe, B.; Lary, D.J. Low power greenhouse gas sensors for unmanned aerial vehicles. Remote Sens. 2012, 4, 1355–1368. [Google Scholar] [CrossRef]
  25. Zhang, Z.X.; Zhang, Y.J.; Ke, T.; Guo, D.H. Photogrammetry for first response in Wenchuan earthquake. Photogramm. Eng. Remote Sens. 2009, 75, 510–513. [Google Scholar]
  26. Zhou, G.Q. Near real-time orthorectification and mosaic of small UAV video flow for time-critical event response. IEEE Trans. Geosci. Remote Sens. 2009, 47, 739–747. [Google Scholar] [CrossRef]
  27. Niethammer, U.; James, M.R.; Rothmund, S.; Travelletti, J.; Joswig, M. UAV-based remote sensing of the Super-Sauze landslide: Evaluation and results. Eng. Geol. 2012, 128, 2–11. [Google Scholar] [CrossRef]
  28. Marzolff, I.; Poesen, J. The potential of 3D gully monitoring with GIS using high-resolution aerial photography and a digital photogrammetry system. Geomorphology 2009, 111, 48–60. [Google Scholar] [CrossRef]
  29. Verhoeven, G.J.J.; Loenders, J.; Vermeulen, F.; Docter, R. Helikite aerial photography—A versatile means of unmanned, radio controlled, low-altitude aerial archaeology. Archaeol. Prospect. 2009, 16, 125–138. [Google Scholar] [CrossRef]
  30. Eisenbeiss, H; Sauerbier, M. Investigation of UAV systems and flight modes for photogrammetric applications. Photogramm. Rec. 2011, 26, 400–421. [Google Scholar]
  31. Salvini, R.; Riccucci, S.; Gullì, D.; Giovannini, R.; Vanneschi, C.; Francioni, M. Geological Application of UAV photogrammetry and terrestrial laser scanning in Marble Quarrying (Apuan Alps, Italy). In Engineering Geology for Society and Territory—Urban Geology, Sustainable Planning and Landscape Exploitation; Springer International Publishing: Cham, Switzerland, 2015; Volume 5, pp. 979–983. [Google Scholar]
  32. Shan, B.; Luo, X.; Liang, L. Application of UAV in open-pit mine disaster monitoring. Opencast Min. Technol. 2013, 6, 69–71. [Google Scholar]
  33. González-Aguilera, D.; Fernández-Hernández, J.; Mancera-Taboada, J.; Rodríguez-Gonzálvez, P.; Hernández-López, D.; Felipe-García, B.; Arias-Perez, B. 3D modelling and accuracy assessment of granite quarry using unmannend aerial vehicle. In Proceedings of the ISPRS Annals of Photogrammetry, Remote Sensing and Spatial Information Sciences, Melbourne, VIC, Australia, 25 August–1 September 2012; Volume I-3, pp. 37–42.
  34. McLeod, T.; Samson, C.; Labrie, M.; Shehata, K.; Mah, J.; Lai, P.; Wang, L.; Elder, J. Using video data acquired from an unmanned aerial vehicle to measure fracture orientation in an open-pit mine. Geomatica 2013, 67, 163–171. [Google Scholar] [CrossRef]
  35. Harwin, S.; Lucieer, A. Assessing the accuracy of georeferenced point clouds produced via multi-view stereopsis from unmanned aerial vehicle (UAV) imagery. Remote Sens. 2012, 4, 1573–1599. [Google Scholar] [CrossRef]
  36. Rosnell, T.; Honkavaara, E. Point cloud generation from aerial image data acquired by a quadrocopter type micro unmanned aerial vehicle and a digital still camera. Sensors 2012, 12, 453–480. [Google Scholar] [CrossRef] [PubMed]
  37. Wang, J.P.; Gao, J.X.; Liu, C.; Wang, J. High precision slope deformation monitoring model based on the GPS/Pseudolites technology in open-pit mine. Min. Sci. Technol. (China) 2010, 20, 126–132. [Google Scholar] [CrossRef]
  38. Lowe, D.G. Object recognition from local scale-invariant features. In Proceedings of the Seventh IEEE International Conference on Computer Vision, Kerkyra, Greece, 20–27 September 1999; Volume 2, pp. 1150–1157.
  39. Fischler, M.A.; Bolles, R.C. Random sample consensus: A paradigm for model fitting with applications to image analysis and automated cartography. Commun. ACM. 1981, 24, 381–395. [Google Scholar] [CrossRef]
  40. Kraus, K. Photogrammetry: Geometry from Images and Laser Scans; Walter de Gruyter: Goettingen, Germany, 2007. [Google Scholar]
  41. Fraser, C.S. Digital camera self-calibration. ISPRS J. Photogramm. Remote Sens. 1997, 52, 149–159. [Google Scholar] [CrossRef]
  42. Skaloud, J. Optimizing Georeferencing of Airborne Survey Systems by INS/DGPS. Ph.D. Thesis, The University of Calgary, Calgary, Alberta, 1999. [Google Scholar]
  43. Kocaman, S. GPS and INS Integration with kalman Filtering for Direct Georeferencing of Airborne Imagery. Ph.D. Thesis, Institute of Geodesy and Photogrammetry, ETH Hönggerberg, Zurich, Switzerland, 2003. [Google Scholar]
  44. Tong, X.H.; Hong, Z.H.; Liu, S.J.; Zhang, X.; Xie, H.; Li, Z.Y.; Yang, S.L.; Wang, W.; Bao, F. Building-damage detection using pre-and post-seismic high-resolution satellite stereo imagery: A case study of the May 2008 Wenchuan earthquake. ISPRS J. Photogramm. Remote Sens. 2012, 68, 13–27. [Google Scholar] [CrossRef]
  45. Xiang, H.; Tian, L. Method for automatic georeferencing aerial remote sensing (RS) images from an unmanned aerial vehicle (UAV) platform. Biosyst. Eng. 2011, 108, 104–113. [Google Scholar] [CrossRef]
  46. Lichti, D.; Gordon, S. Error propagation in directly georeferenced terrestrial laser scanner point clouds for cultural heritage recording. In Proceedings of the FIG Working Week, Athens, Greece, 22–27 May 2004.
  47. Reshetyuk, Y. Self-Calibration and Direct Georeferencing in Terrestrial Laser Scanners. Ph.D. Thesis, Royal Institute of Technology, Stockholm, Sweden, 2009. [Google Scholar]
  48. Harvey, B.R. Registration and transformation of multiple site terrestrial laser scanning. Geomat. Res. Aust. 2004, 80, 33–50. [Google Scholar]
  49. Wang, Y.; Wang, G. Integrated registration of range images from terrestrial LiDAR. Int. Arch. Photogramm. Remote Sens. Spat. Inf. Sci. 2008, XXXVII(Part B3b), 361–365. [Google Scholar]
  50. Hodge, R.A. Using simulated terrestrial laser scanning to analyse errors in high-resolution scan data of irregular surfaces. ISPRS J. Photogramm. Remote Sens. 2010, 65, 227–240. [Google Scholar] [CrossRef]
  51. Zhang, Y.; Gong, L.; Yan, L. Research on error propagation of point cloud registration. In Proceedings of the 2012 IEEE International Conference on Computer Science and Automation Engineering (CSAE), Zhangjiajie, China, 25–27 May 2012; Volume 2, pp. 18–21.
  52. Lingua, A.; Marenchino, D.; Nex, F. Performance analysis of the SIFT operator for automatic feature extraction and matching in photogrammetric applications. Sensors 2009, 9, 3745–3766. [Google Scholar] [CrossRef] [PubMed]
  53. Hartley, R.; Zisserman, A. Multiple View Geometry in Computer Vision, 2nd ed.; Cambridge University Press: New York, NY, USA, 2004. [Google Scholar]
  54. Pesci, A.; Fabris, M.; Conforti, D.; Loddo, F.; Baldi, P.; Anzidei, M. Integration of ground-based laser scanner and aerial digital photogrammetry for topographic modelling of Vesuvio volcano. J. Volcanol. Geotherm. Res. 2007, 162, 123–138. [Google Scholar] [CrossRef]
  55. Baltsavias, E.P. A comparison between photogrammetry and laser scanning. ISPRS J. Photogramm. Remote Sens. 1999, 54, 83–94. [Google Scholar] [CrossRef]
  56. Wang, J.; Di, K.; Li, R. Evaluation and improvement of geopositioning accuracy of IKONOS stereo imagery. J. Surv. Eng. 2005, 131, 35–42. [Google Scholar] [CrossRef]
  57. Tong, X.H.; Liang, D.; Xu, G.S.; Zhang, S.L. Positional accuracy improvement: A comparative study in Shanghai, China. Int. J. Geogr. Inf. Sci. 2011, 25, 1147–1171. [Google Scholar] [CrossRef]
  58. Tong, X.H.; Liu, S.J.; Weng, Q.H. Bias-corrected rational polynomial coefficients for high accuracy geo-positioning of QuickBird stereo imagery. ISPRS J. Photogramm. Remote Sens. 2010, 65, 218–226. [Google Scholar] [CrossRef]
  59. Liu, S.J.; Fraser, C.S.; Zhang, C.S.; Ravanbakhsh, M.; Tong, X.H. Georeferencing performance of THEOS satellite imagery. Photogramm. Rec. 2011, 26, 250–262. [Google Scholar] [CrossRef]
  60. Henry, J.B.; Malet, J.-P.; Maquaire, O.; Grussenmeyer, P. The use of small-format and low-altitude aerial photos for the realization of high-resolution DEMs in mountainous areas: Application to the Super-Sauze earthflow (Alpes-de-Haute-Provence, France). Earth Surf. Process. Landf. 2002, 27, 1339–1350. [Google Scholar] [CrossRef] [Green Version]
  61. Guarnieri, A.; Remondino, F.; Vettore, A. Digital photogrammetry and TLS data fusion applied to cultural heritage 3D modelling. Int. Arch. Photogramm. Remote Sens. Spat. Inf. Sci. 2006, XXXVI(Part 5). [Google Scholar]
  62. Burnett, C.; Blaschke, T. A multi-scale segmentation/object relationship modeling methodology for landscape analysis. Ecol. Model. 2003, 168, 233–249. [Google Scholar] [CrossRef]
  63. Yu, Q.; Gong, P.; Clinton, N.; Biging, G.; Kelly, M.; Schirokauer, D. Object-based detailed vegetation classification with airborne high spatial resolution remote sensing imagery. Photogramm. Eng. Remote Sens. 2006, 72, 799–811. [Google Scholar] [CrossRef]
  64. Laliberte, A.S.; Rango, A. Image processing and classification procedures for analysis of sub-decimeter imagery acquired with an unmanned aircraft over arid rangelands. GISci. Remote Sens. 2011, 48, 4–23. [Google Scholar] [CrossRef]
  65. Laliberte, A.S.; Winters, C.; Rango, A. UAS remote sensing missions for rangeland applications. Geocarto Int. 2011, 26, 141–156. [Google Scholar] [CrossRef]
  66. Definiens. eCognition Developer 8.0 User Guide; Definiens AG.: Munich, Germany, 2009. [Google Scholar]
  67. Stumpf, A.; Kerle, N. Object-oriented mapping of landslides using random forests. Remote Sens. Environ. 2011, 115, 2564–2577. [Google Scholar] [CrossRef]
  68. Congalton, R.G.; Green, K. Assessing the Accuracy of Remotely Sensed Data: Principles and Practices; CRC Press: Boca Raton, FL, USA, 2009. [Google Scholar]
  69. Tong, X.; Li, X.; Xu, X.; Xie, H.; Feng, T.; Sun, T.; Jin, Y.; Liu, X. A two-phase classification of urban vegetation using airborne LiDAR data and aerial photography. IEEE J. Sel. Top. Appl. Earth Obs. Remote Sens. 2014. [Google Scholar] [CrossRef]
  70. Dunford, R.; Michel, K.; Gagnage, M.; Piégay, H.; Trémelo, M.L. Potential and constraints of unmanned aerial vehicle technology for the characterization of Mediterranean riparian forest. Int. J. Remote Sens. 2009, 30, 4915–4935. [Google Scholar] [CrossRef]

