
Spatial Analysis of Wenchuan Earthquake-Damaged Vegetation in the Mountainous Basins and Its Applications

Abstract
:
1. Introduction
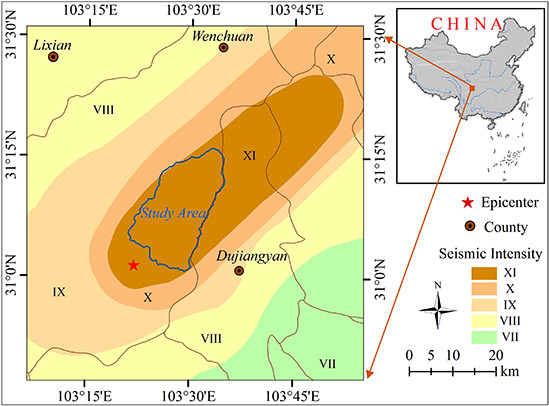
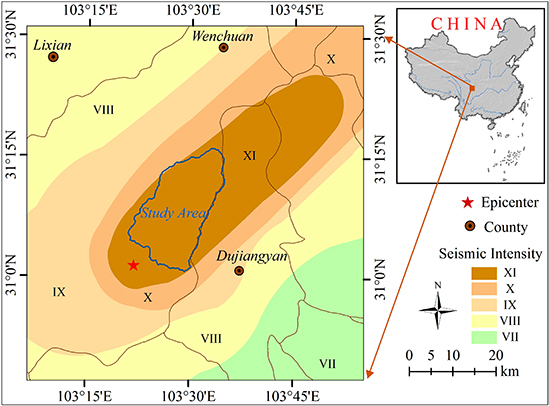
2. Study Area

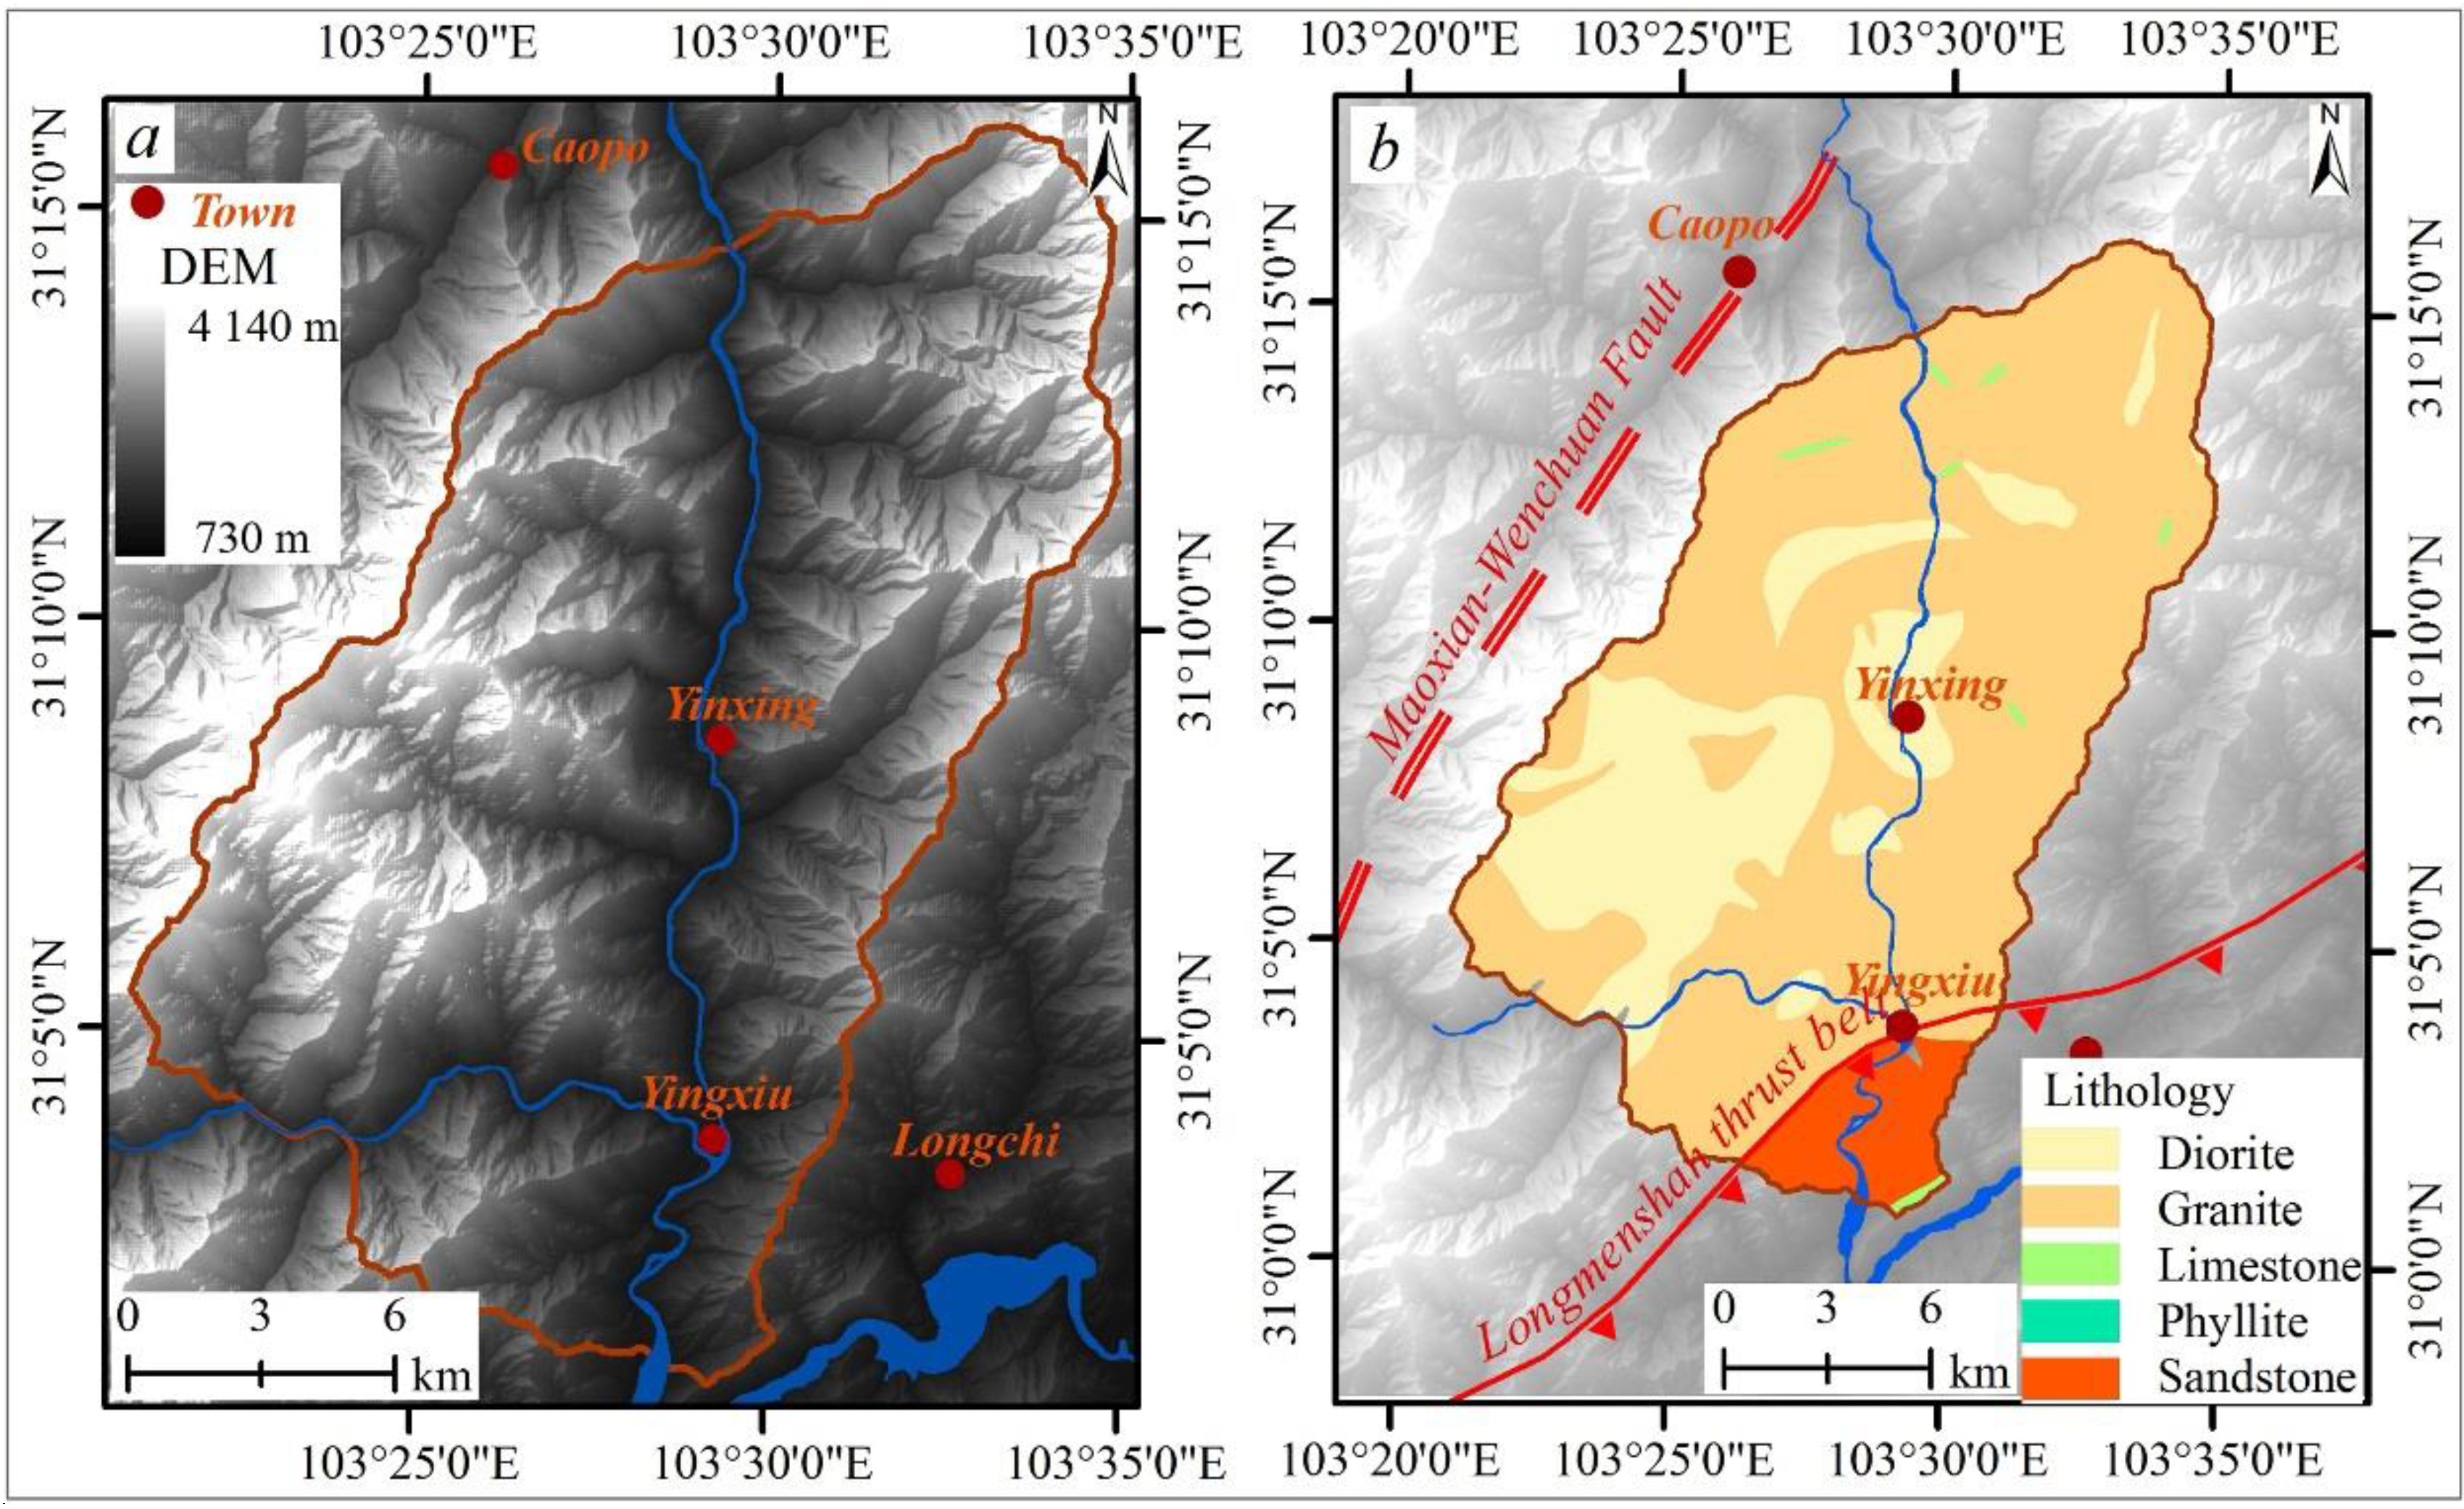
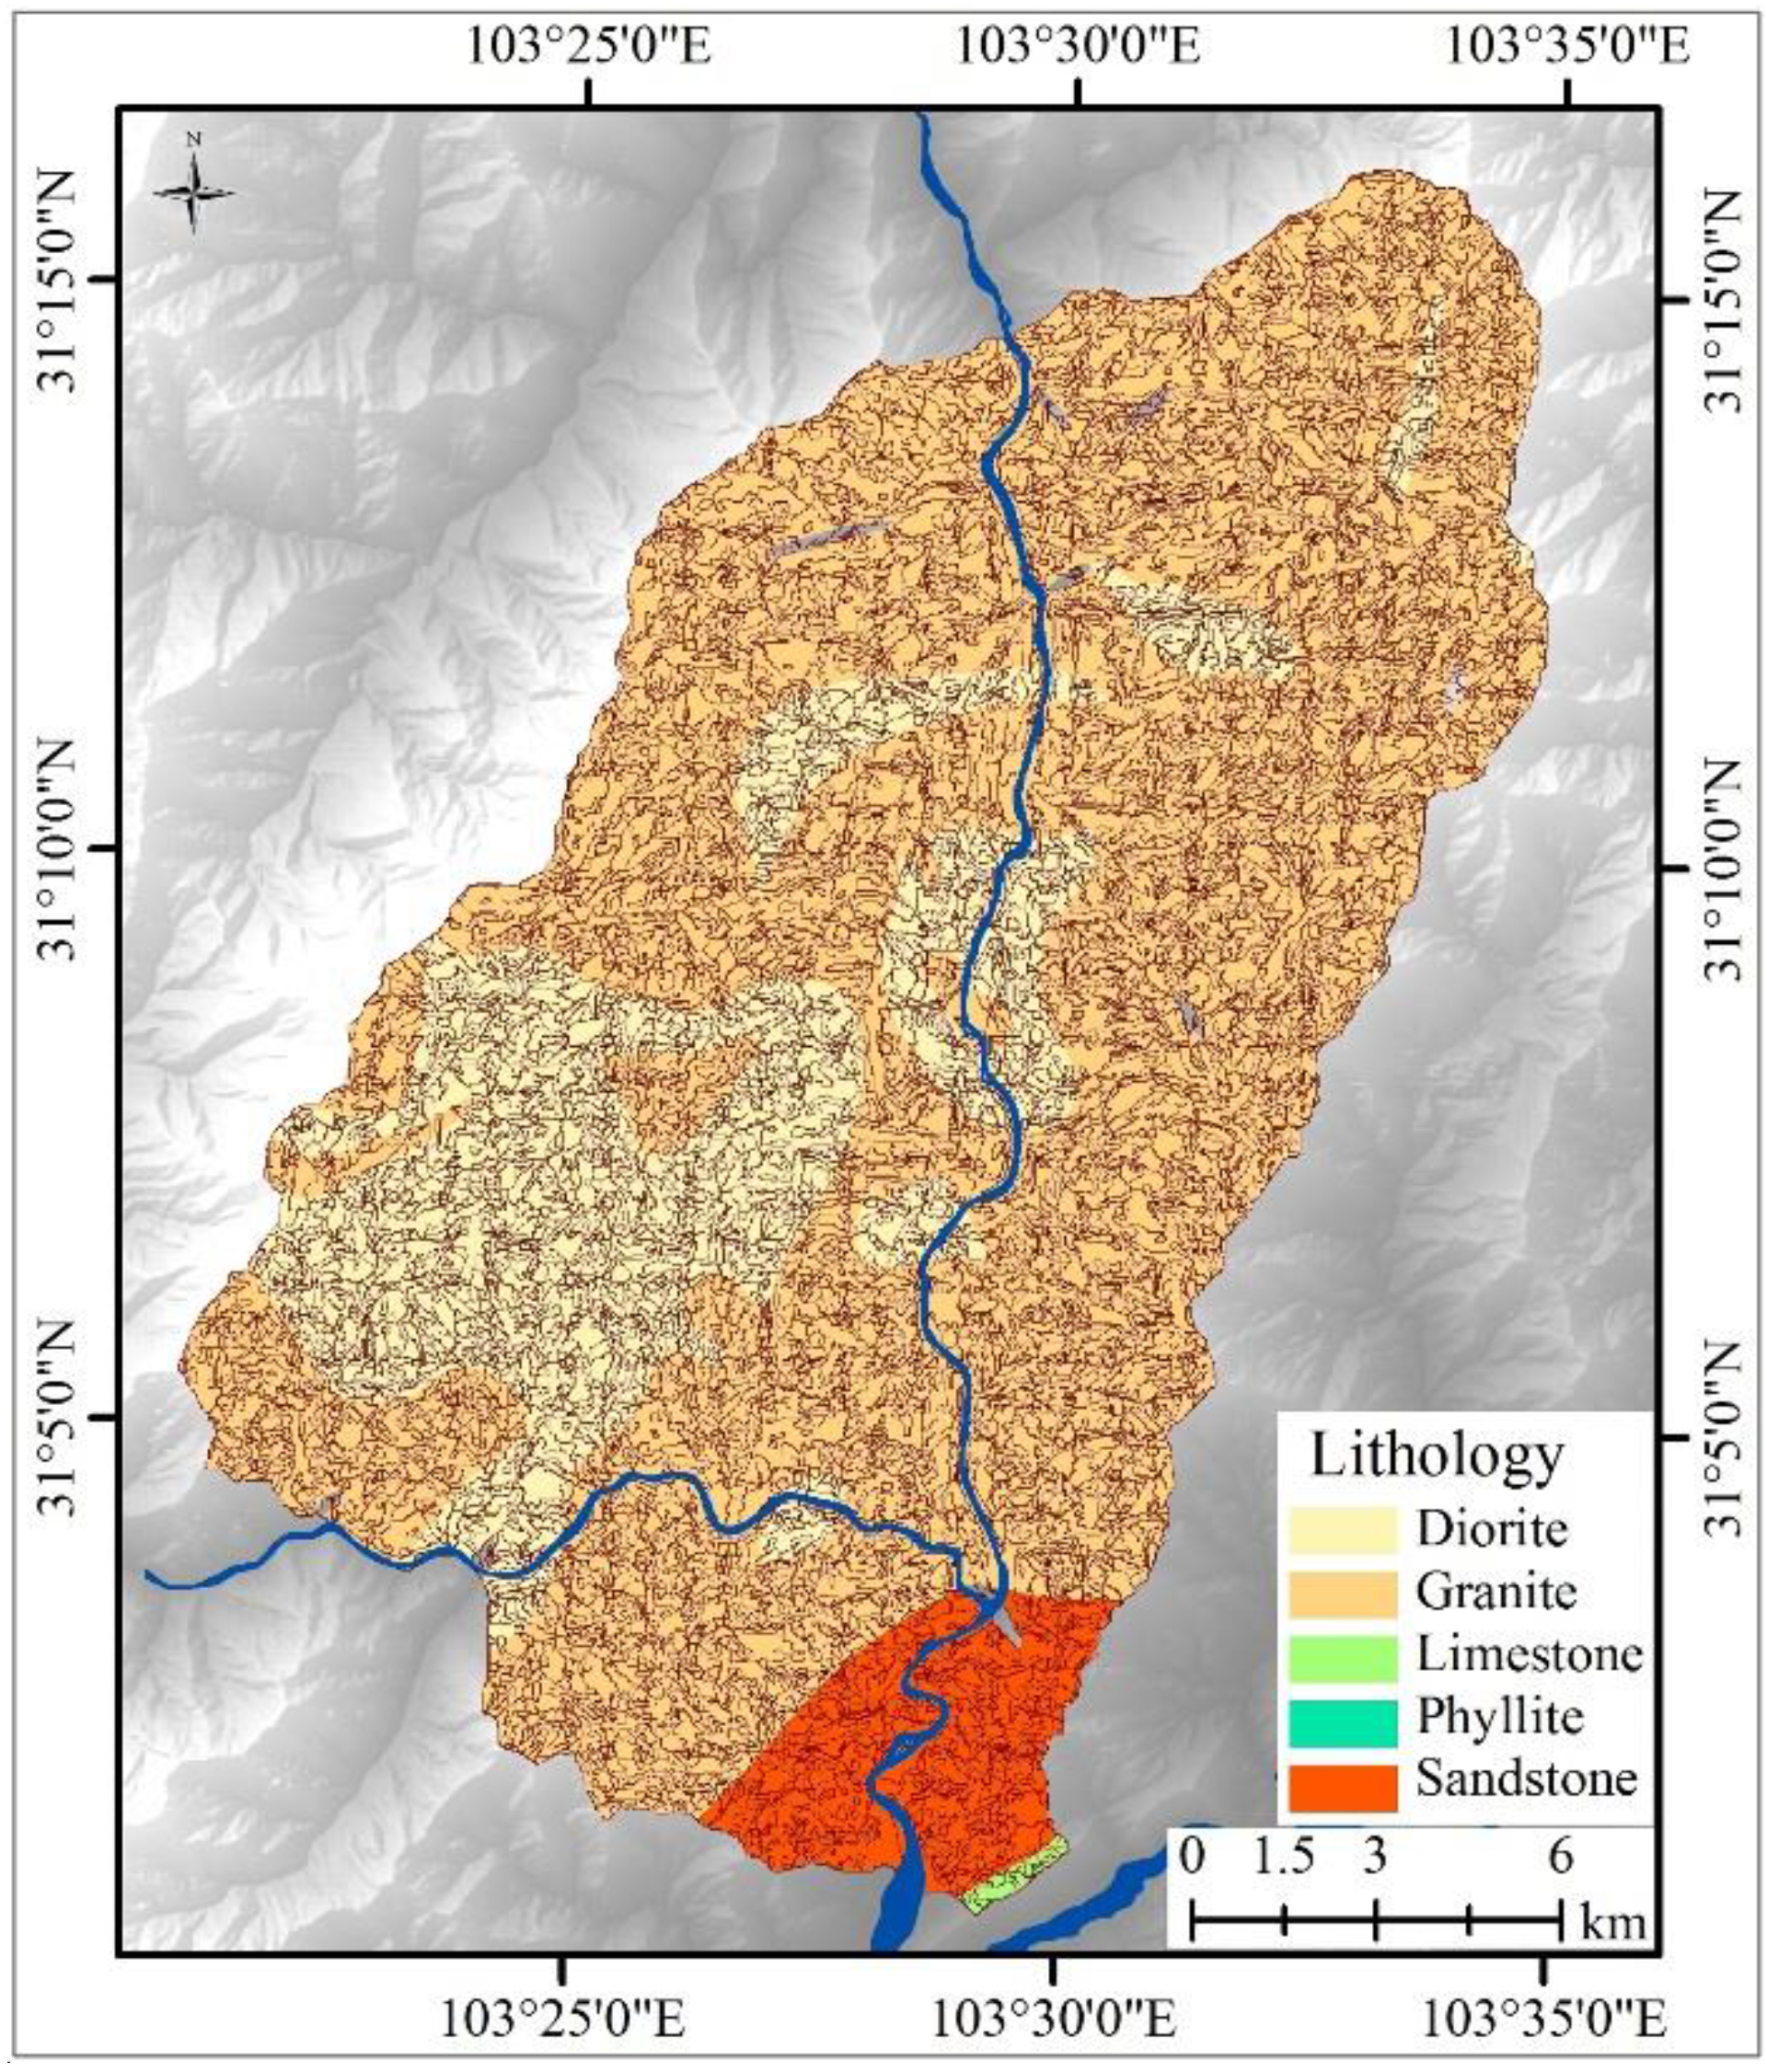
2.1. Topographical and Geological Setting of the Study Area

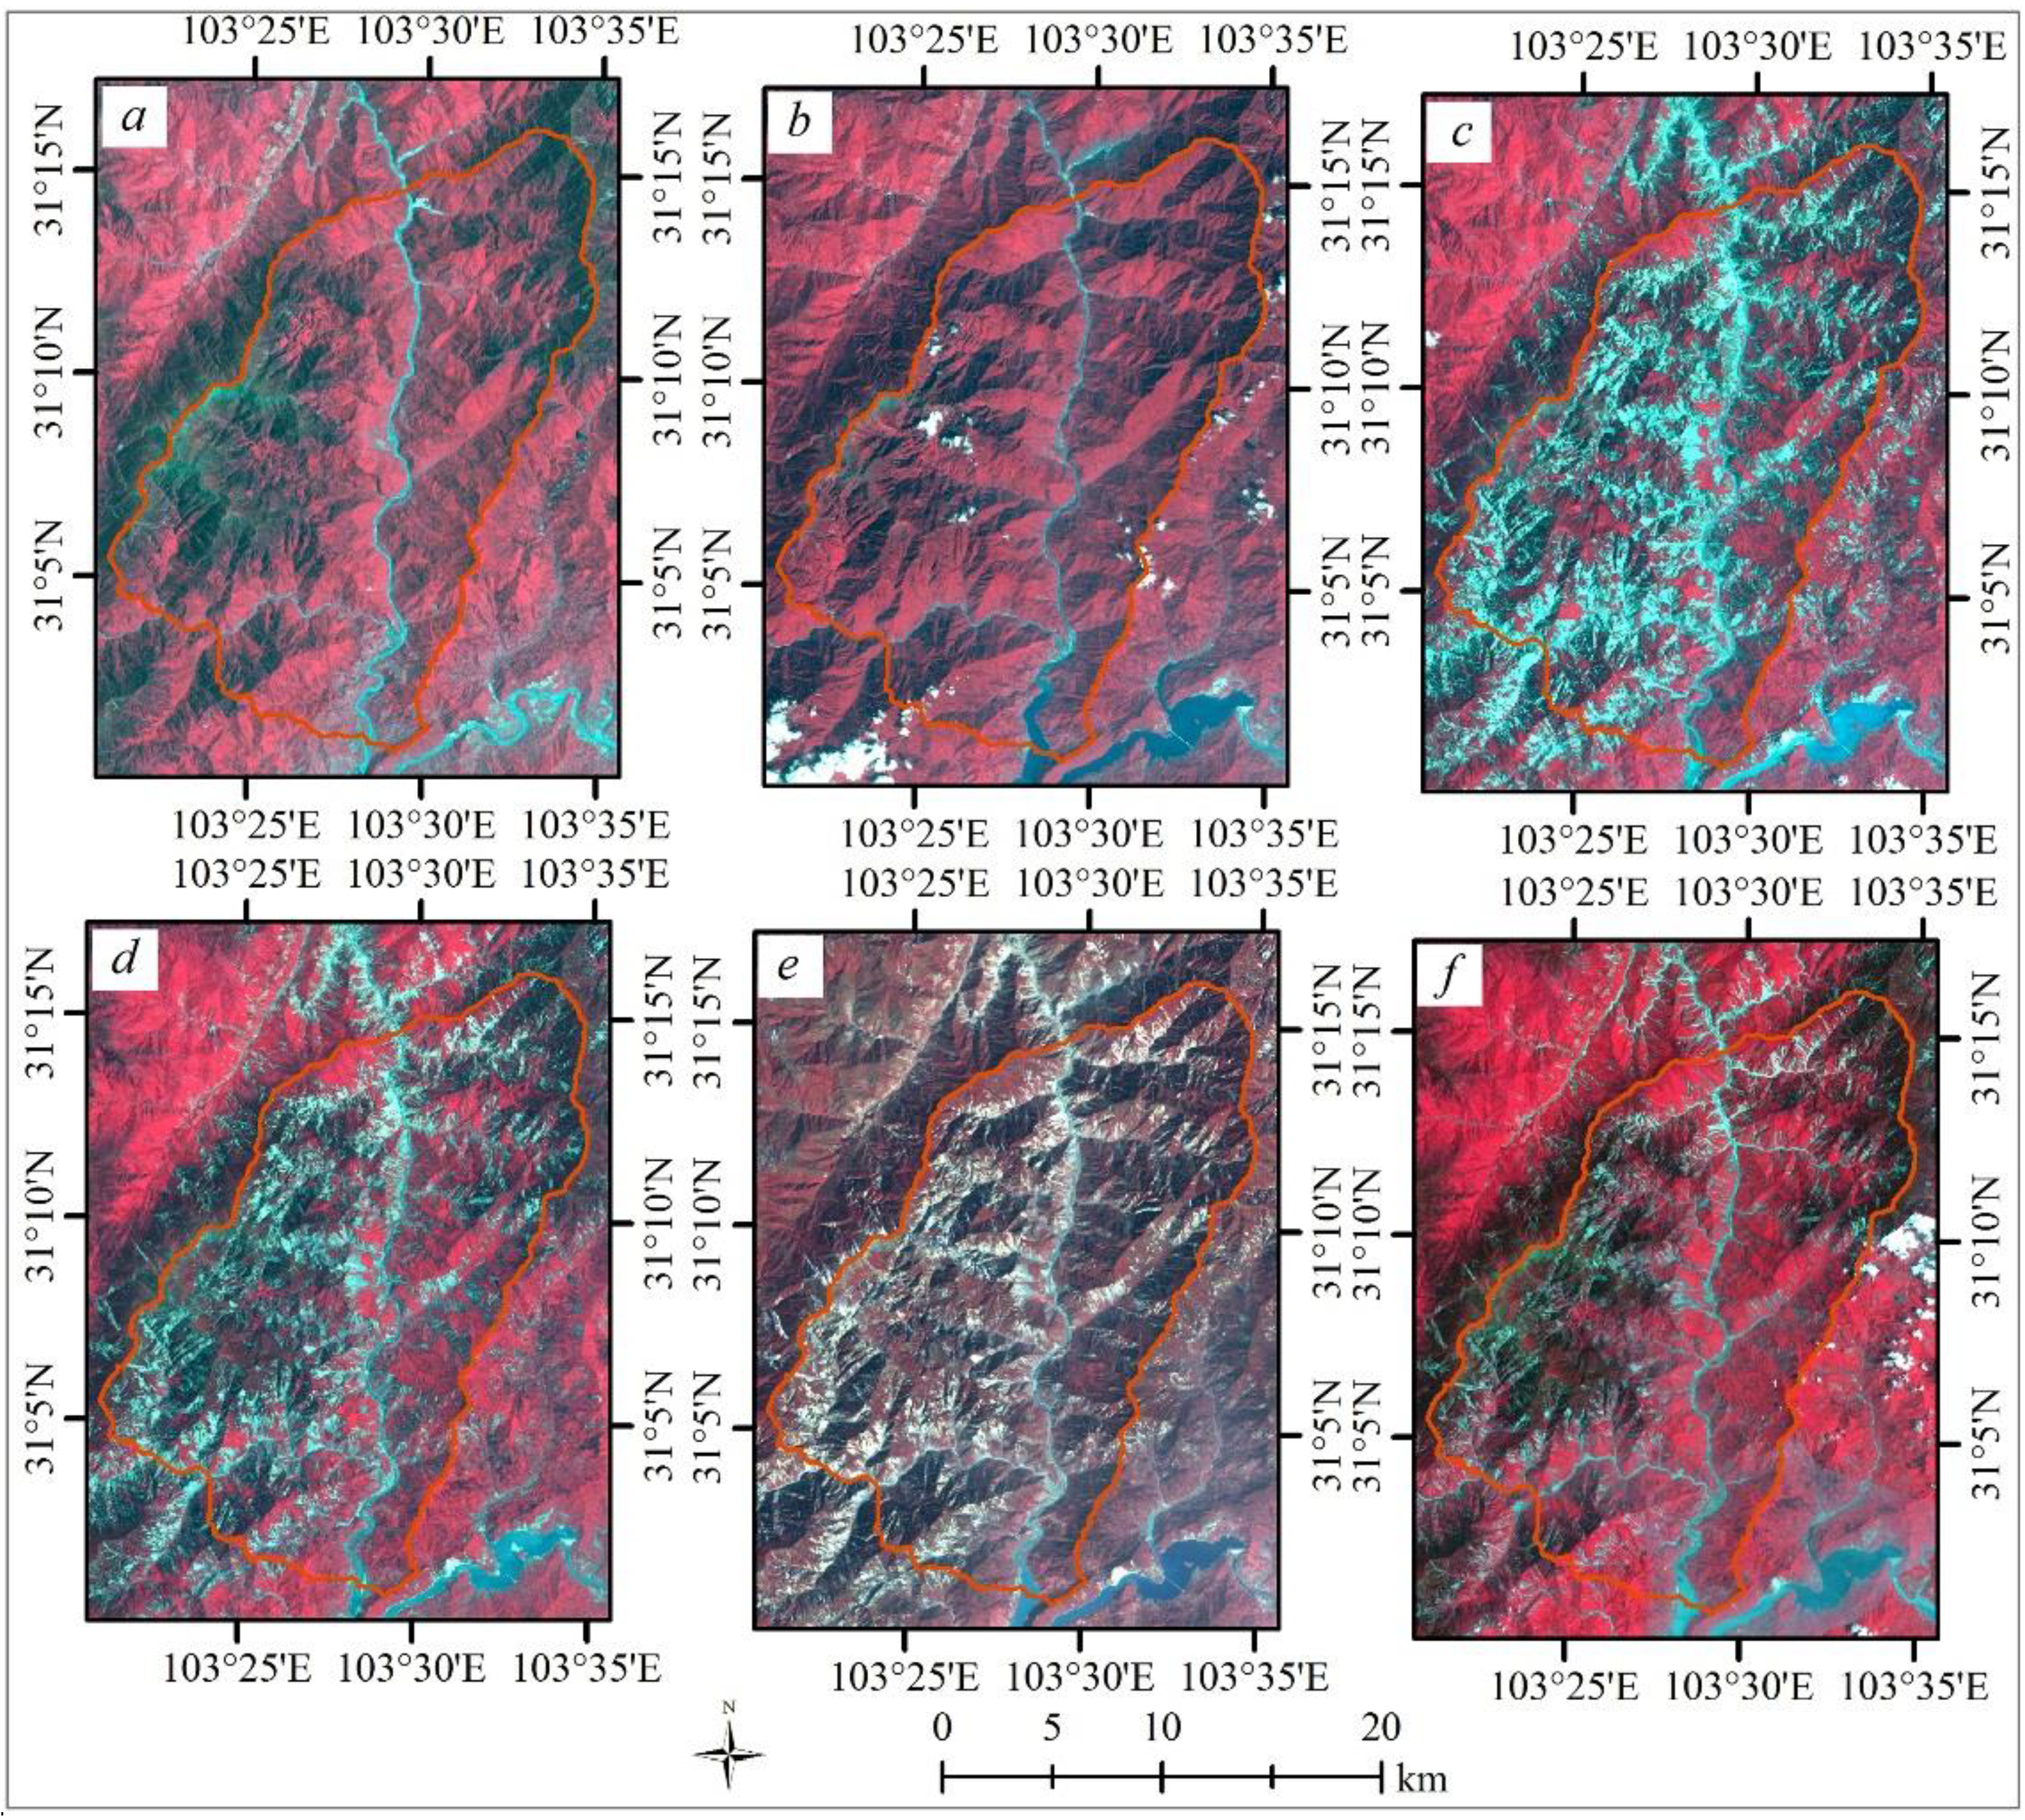
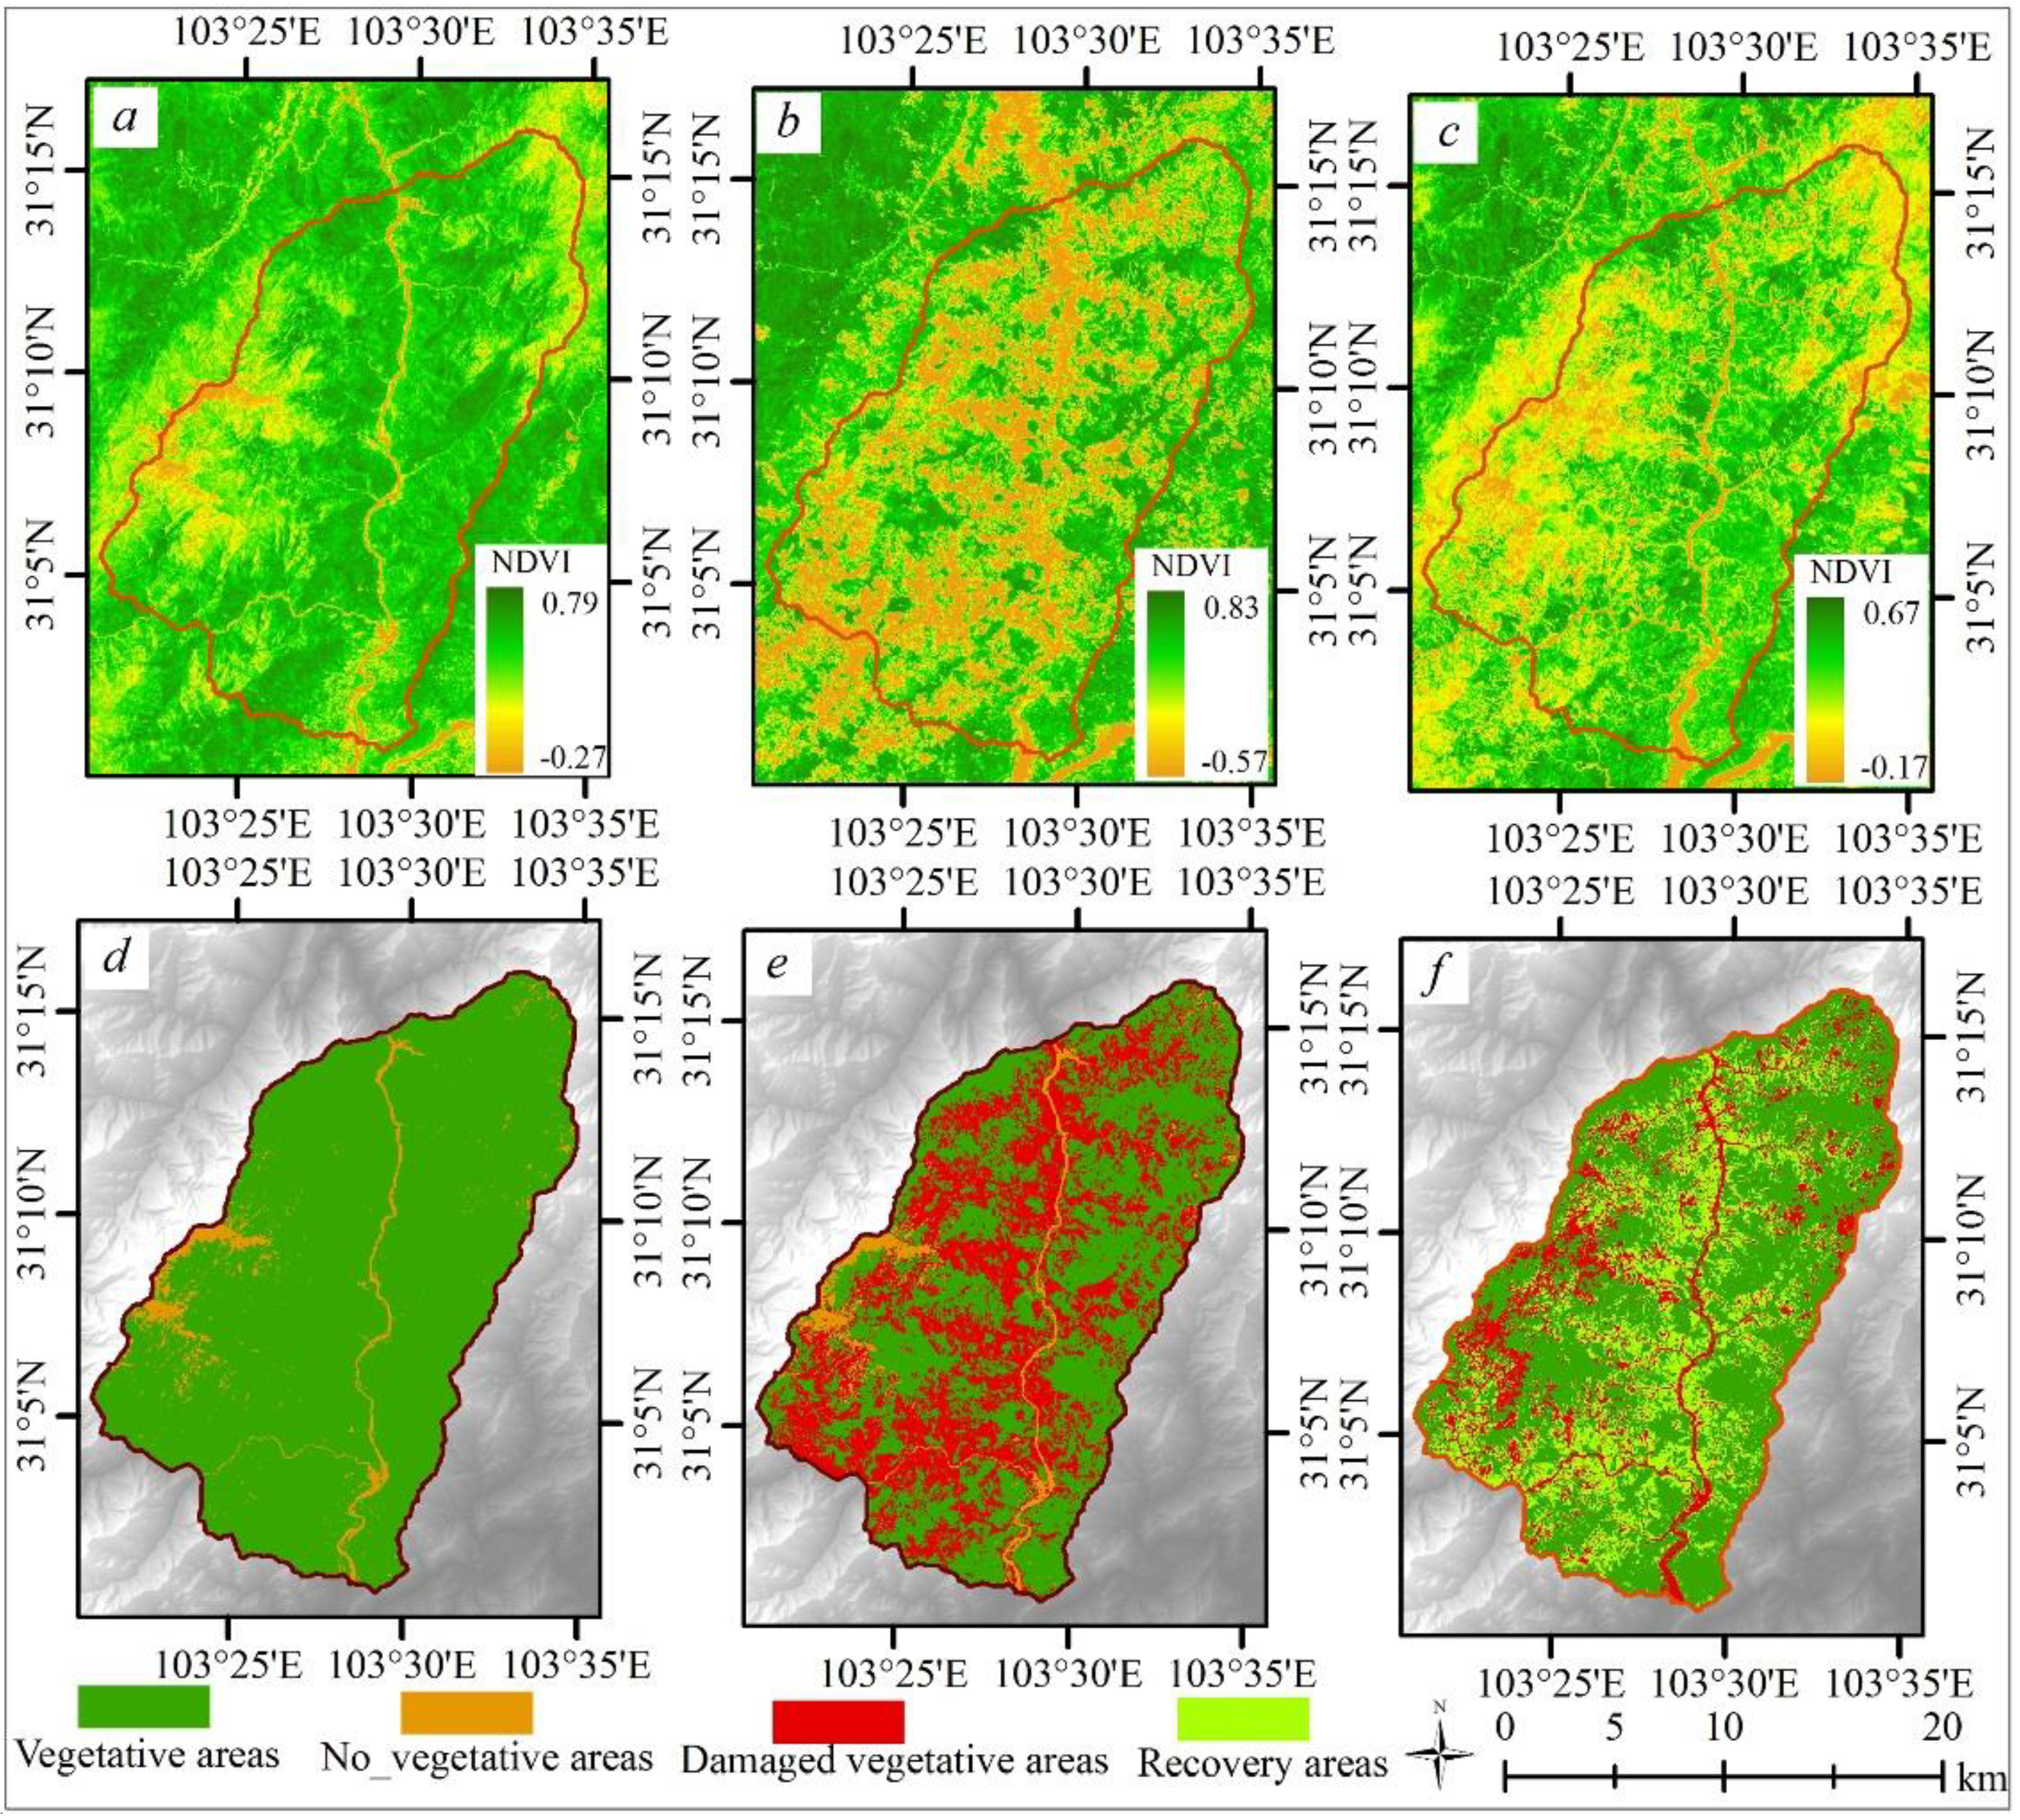
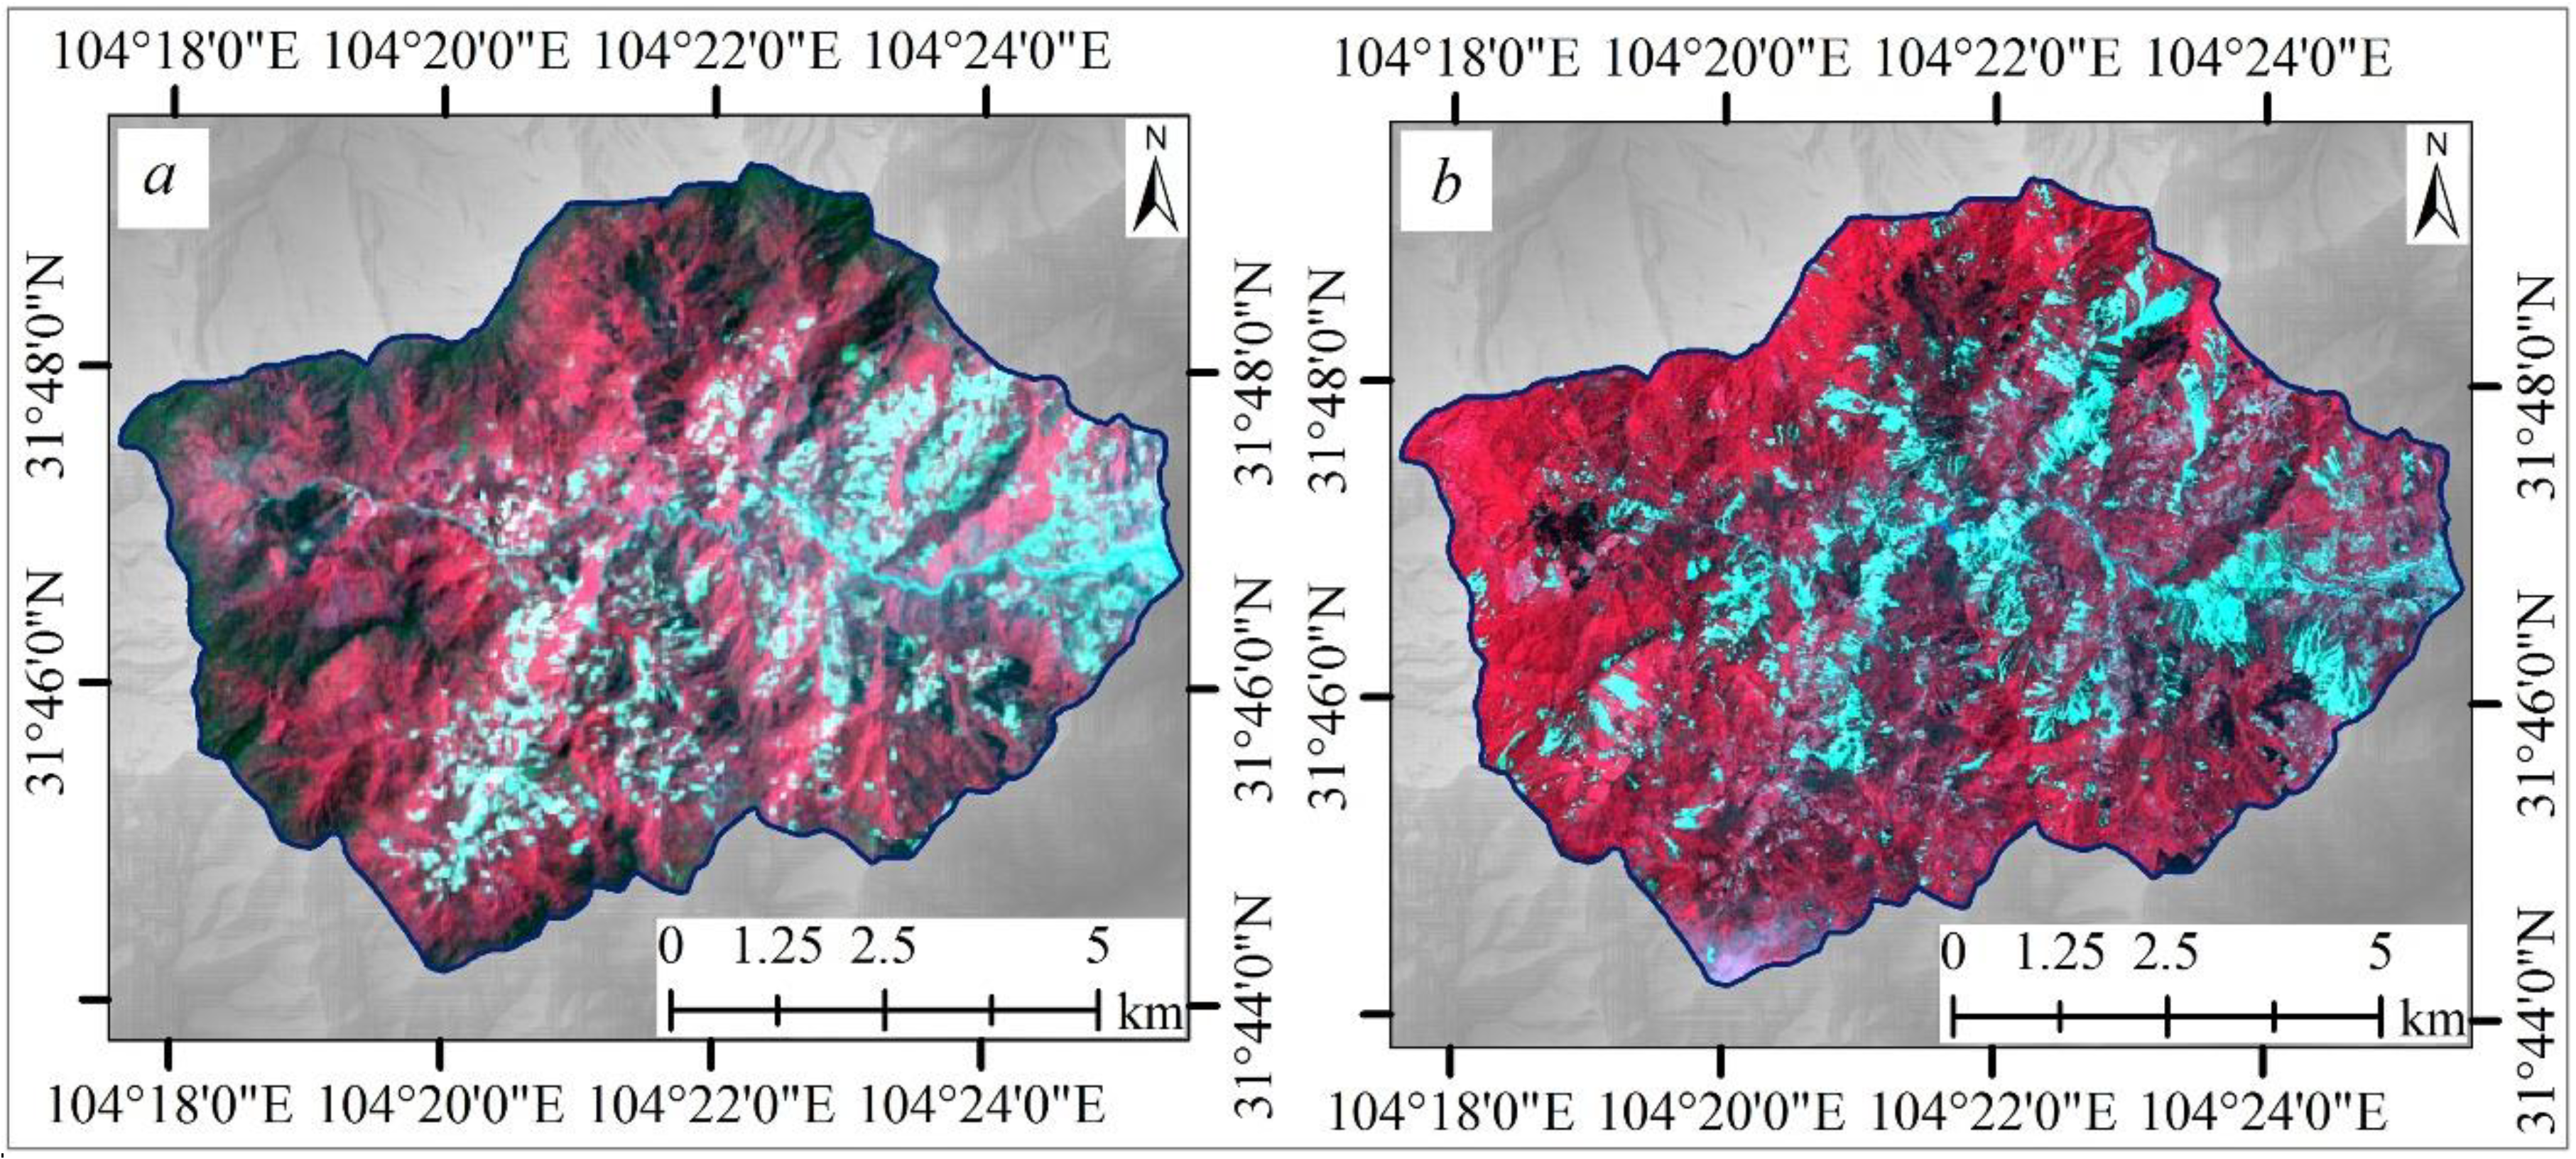
2.2. Vegetation Changes in the Study Area before and after the Wenchuan Earthquake

3. Spatial Analysis of the Earthquake-Damaged Vegetation in the Study Area
3.1. DSAL Spatial Zonation for Vegetation Survival Environments

3.2. Relationships between Damaged Vegetation and Its Survival Environments in the Study Area

| Equation | Min | Max | Mean | Variance | Standard Deviation | Multiple Correlation Coefficient | Residual Standard Error |
|---|---|---|---|---|---|---|---|
| Function (1) | 0.000 | 0.825 | 0.556 | 0.008 | 0.072 | 0.779 | 0.092 |
| Function (2) | 0.000 | 1.000 | 0.605 | 0.005 | 0.091 | 0.806 | 0.174 |
| Function (3) | 0.013 | 0.928 | 0.605 | 0.006 | 0.121 | 0.712 | 0.253 |
3.3. Relationships between Vegetation and Slope Stability
3.4. Slope Stability Susceptibility Assessment in the Earthquake-Affected Region

4. Application
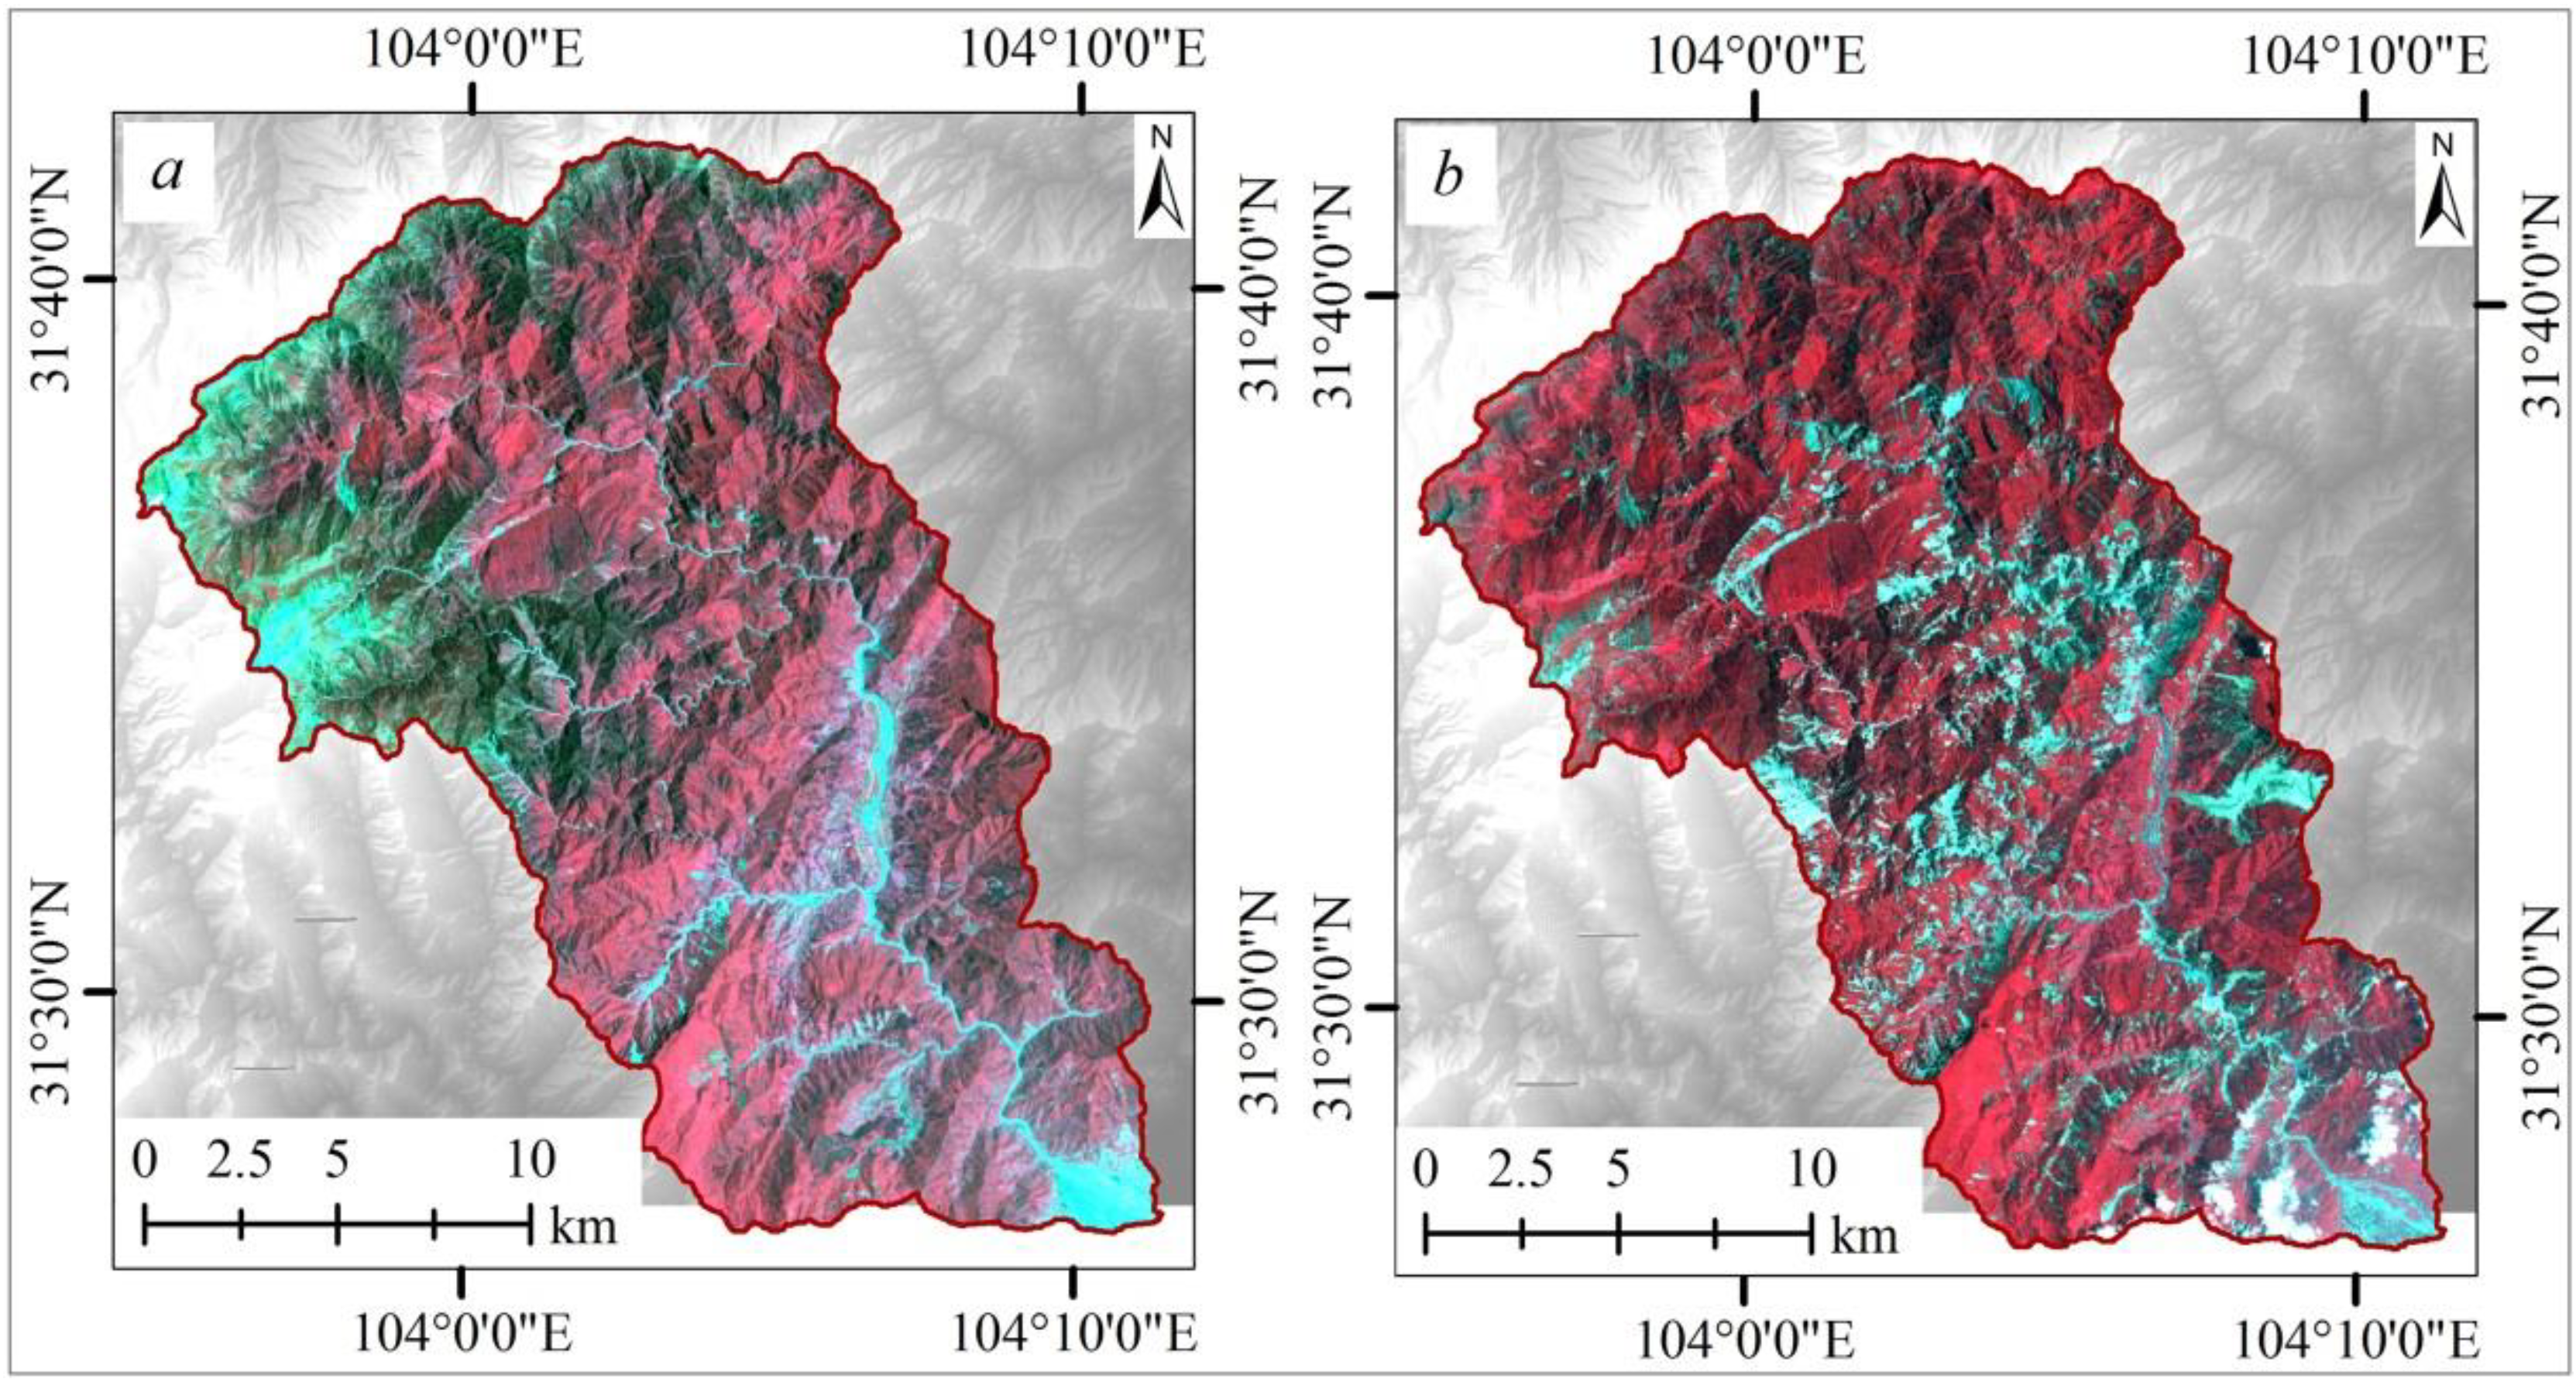
4.1. The Conditions of the Mianyuan River and Subao River


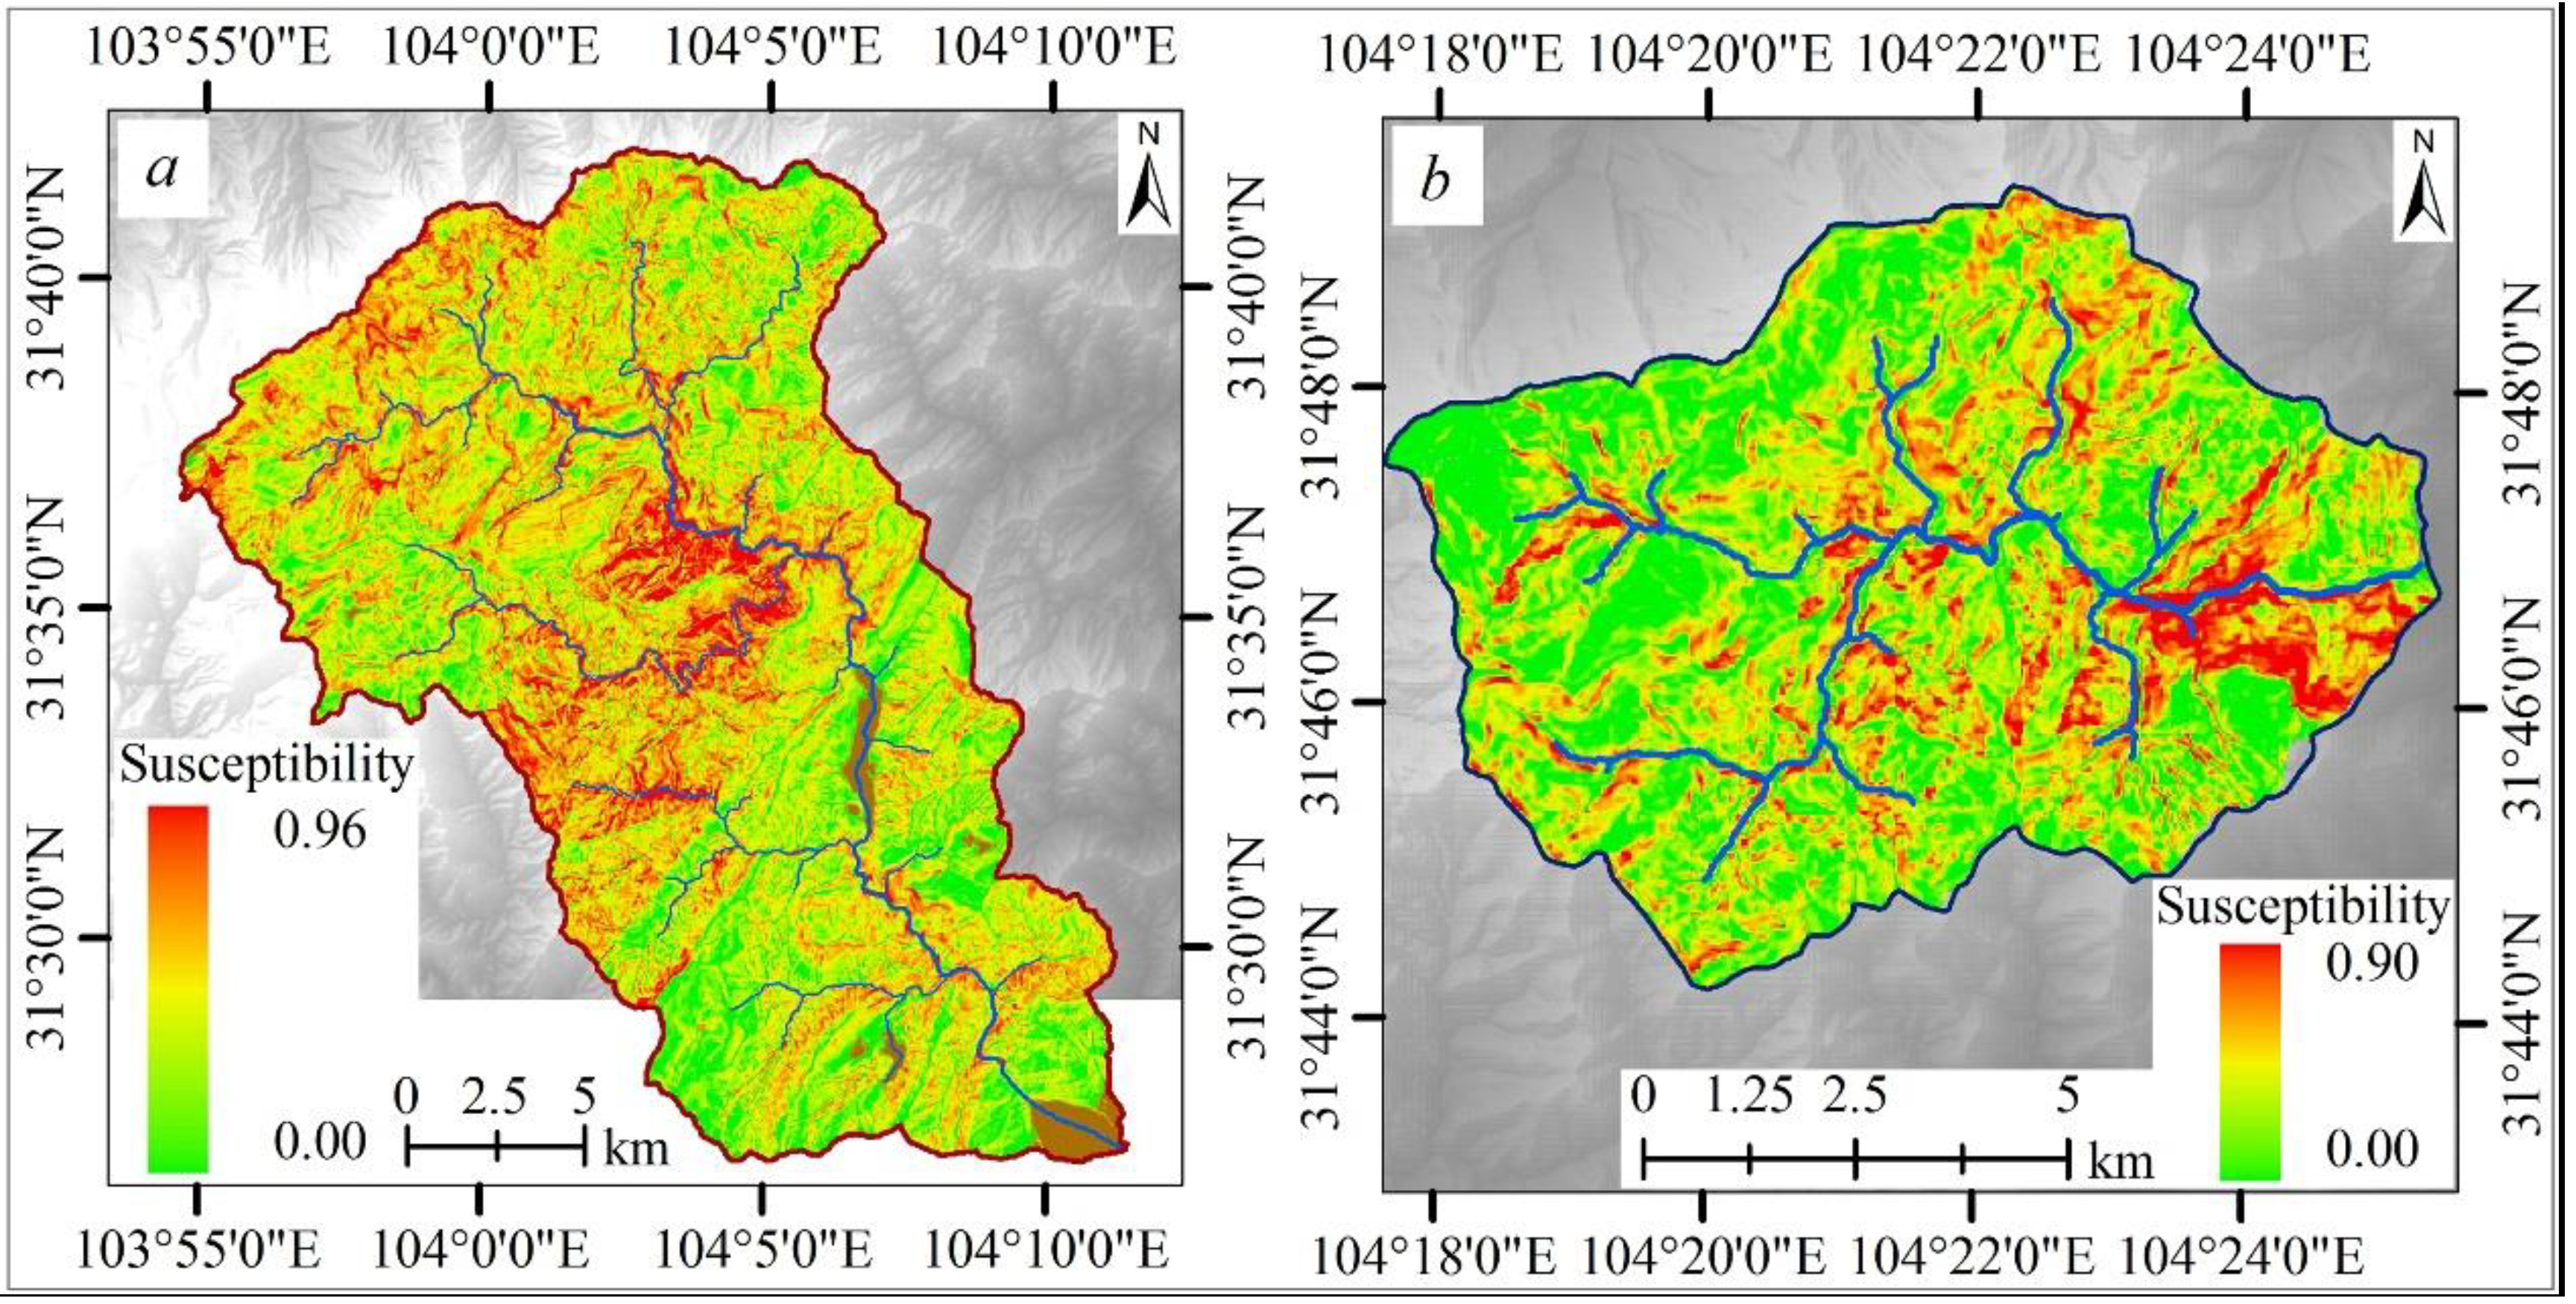
4.2. The Assessment of Slope Stability Susceptibility in the Mianyuan River and Subao River

4.3. Results Analysis
| Susceptibility Level | Mianyuan River (km2) | Subao River (km2) | ||||
|---|---|---|---|---|---|---|
| TA | DA | DP (%) | TA | DA | DP (%) | |
| 1: 0.0~0.1 | 65.04 | 5.96 | 9.2 | 27.54 | 1.39 | 5.1 |
| 2: 0.1~0.2 | 47.89 | 5.40 | 11.3 | 15.19 | 1.29 | 8.5 |
| 3: 0.2~0.3 | 69.78 | 12.72 | 18.2 | 14.06 | 2.28 | 16.2 |
| 4: 0.3~0.4 | 83.28 | 20.44 | 24.5 | 9.13 | 2.41 | 26.4 |
| 5: 0.4~0.5 | 70.11 | 21.35 | 30.5 | 3.97 | 1.26 | 31.6 |
| 6: 0.5~0.6 | 43.03 | 17.18 | 39.9 | 1.25 | 0.56 | 44.7 |
| 7: 0.6~0.7 | 19.68 | 10.16 | 51.6 | 0.68 | 0.38 | 55.4 |
| 8: 0.7~0.8 | 8.40 | 5.49 | 65.4 | 0.44 | 0.29 | 66.3 |
| 9: 0.8~0.9 | 2.70 | 1.90 | 70.4 | 0.29 | 0.23 | 78.3 |
| 10: 0.9~1.0 | 0.97 | 0.78 | 80.7 | / | / | / |
5. Discussion
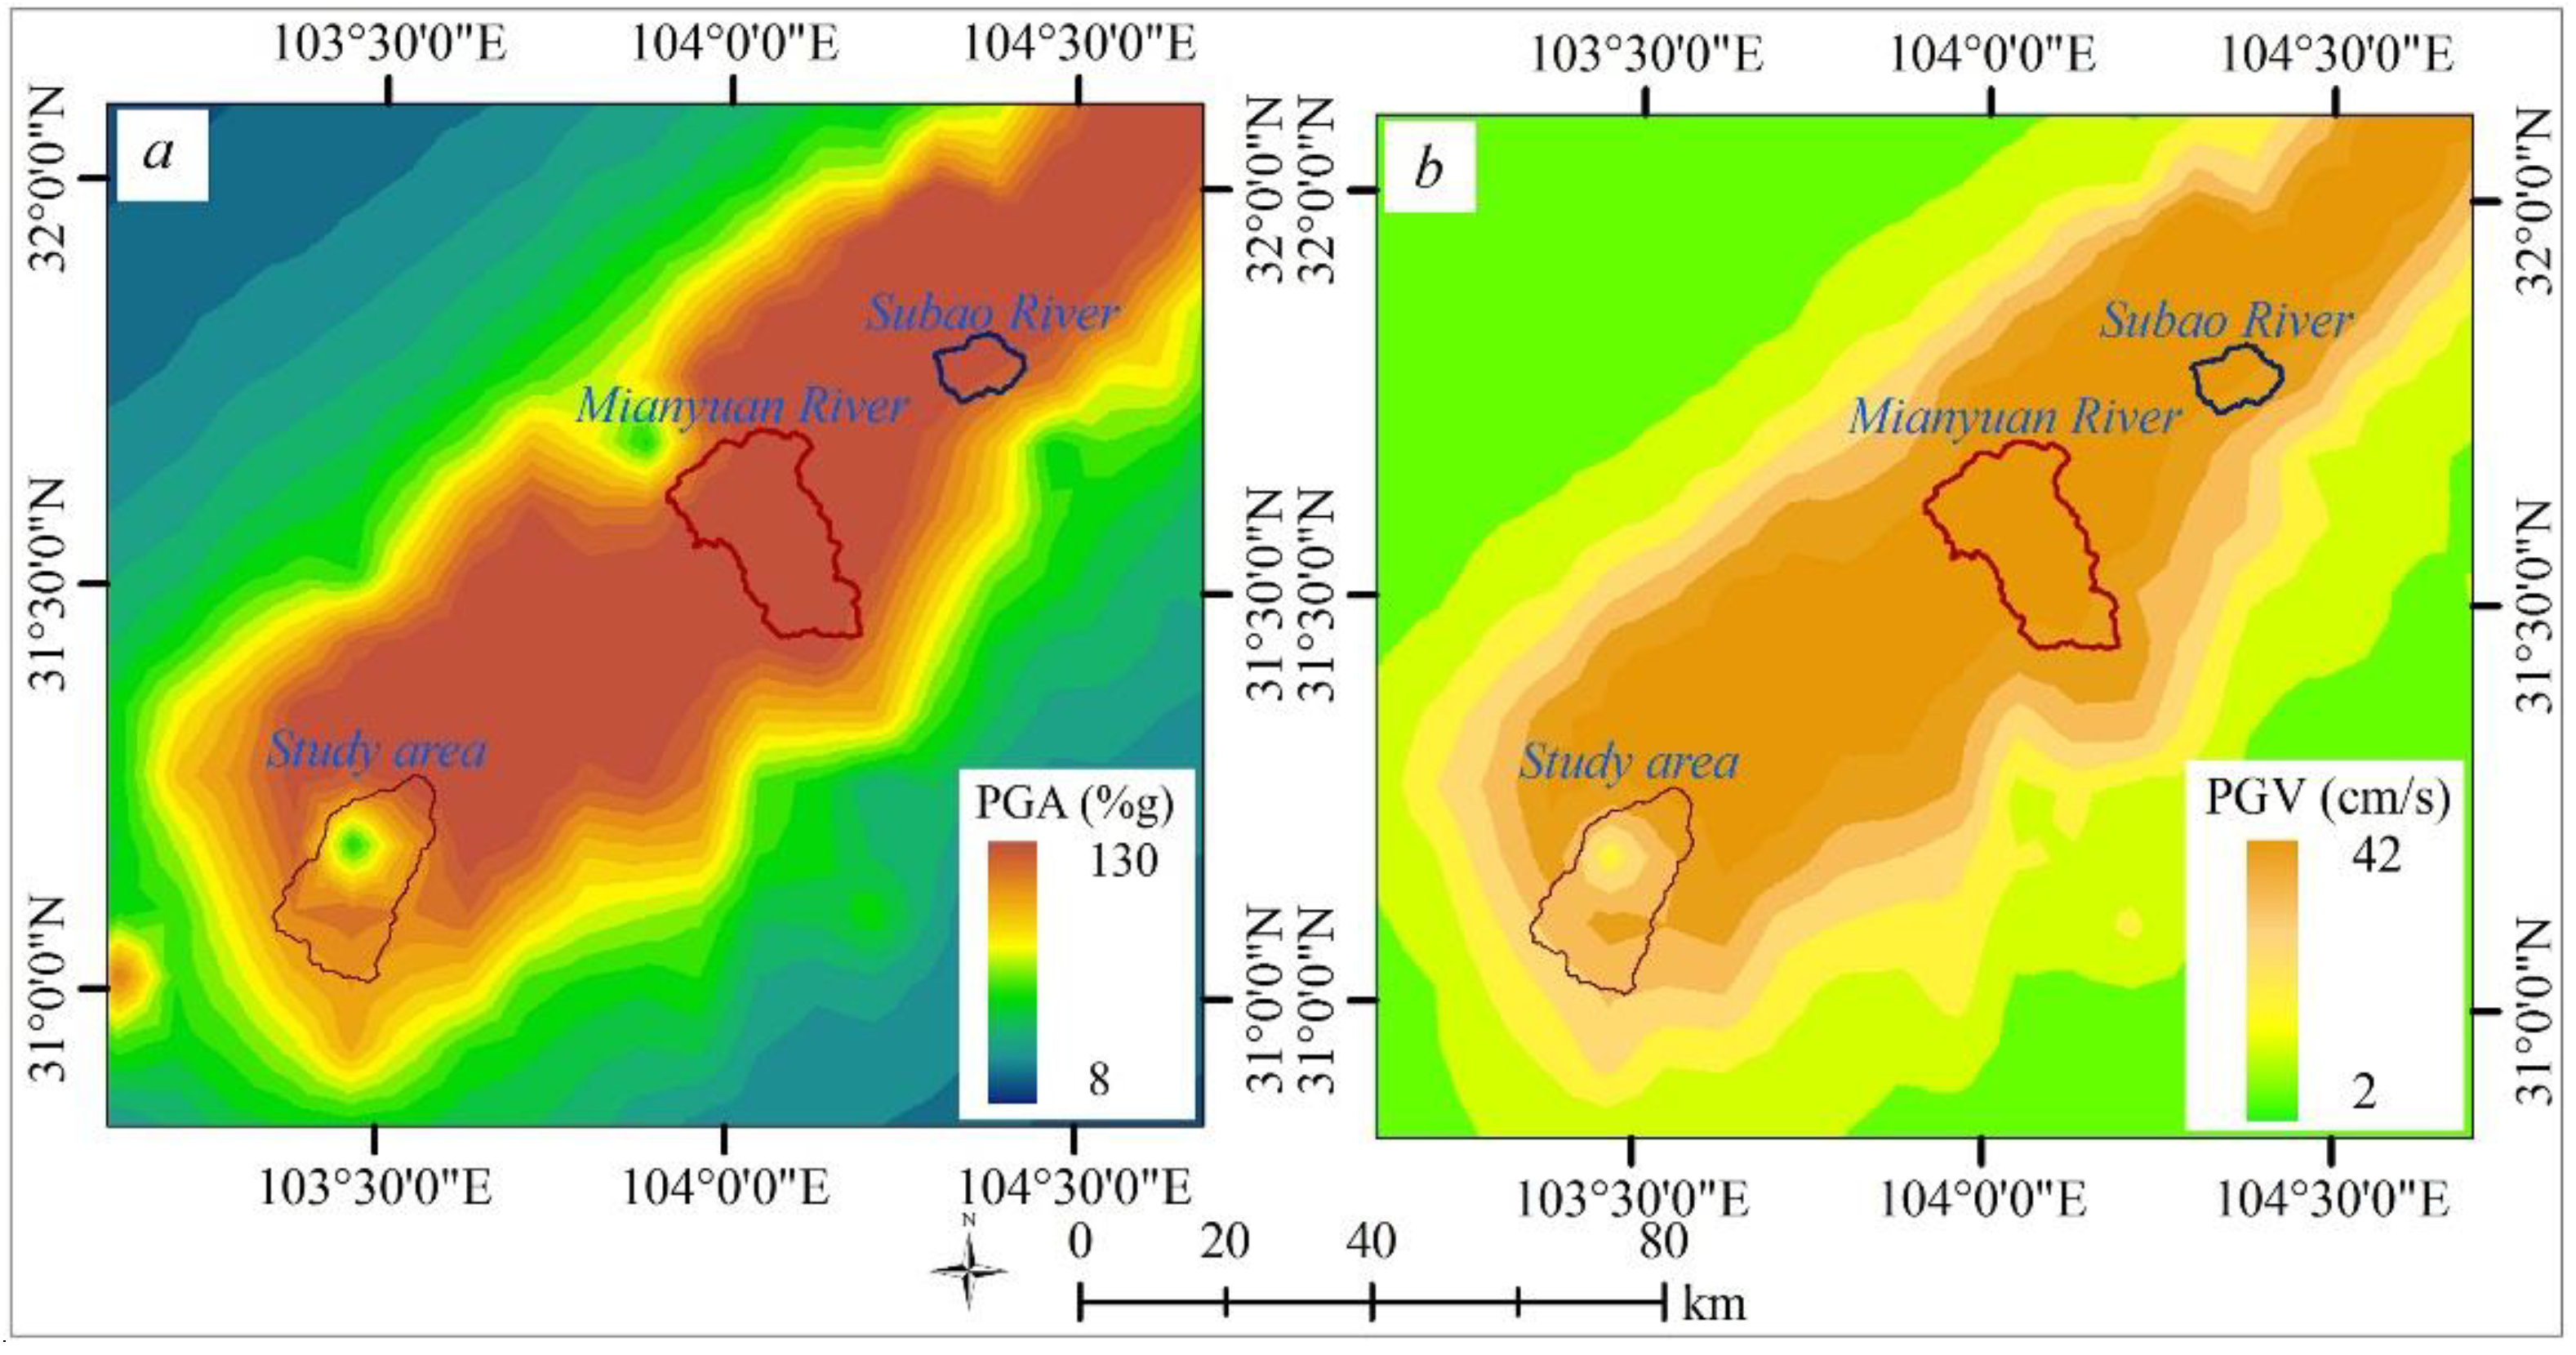
5.1. Shake Map Analysis in the Earthquake-Damaged Vegetation Areas

| PGA Level | Study Area (km2) | Mianyuan River (km2) | Subao River (km2) | ||||||
|---|---|---|---|---|---|---|---|---|---|
| TA | DA | DP (%) | TA | DA | DP (%) | TA | DA | DP (%) | |
| 1: <52 | 26.69 | 14.48 | 54.3 | / | / | / | / | / | / |
| 2: 52~56 | 18.69 | 10.79 | 57.7 | / | / | / | / | / | / |
| 3: 56~60 | 23.62 | 10.22 | 43.3 | / | / | / | / | / | / |
| 4: 60~64 | 27.34 | 9.08 | 33.2 | / | / | / | / | / | / |
| 5: 64~68 | 48.96 | 18.68 | 38.2 | / | / | / | / | / | / |
| 6: 68~72 | 124.31 | 46.73 | 37.6 | 2.62 | 2.24 | 85.5 | 1.44 | 0.04 | 2.6 |
| 7: 72~76 | 61.20 | 25.03 | 40.9 | 8.89 | 4.39 | 49.4 | 16.75 | 1.91 | 11.4 |
| 8: 76~80 | 10.80 | 3.65 | 33.8 | 27.04 | 4.32 | 16.0 | 24.72 | 4.14 | 16.8 |
| 9: 80~84 | 9.36 | 1.91 | 20.4 | 68.50 | 13.50 | 19.7 | 21.45 | 3.91 | 18.2 |
| 10: 84~88 | / | / | / | 305.64 | 76.40 | 25.0 | 8.25 | 0.27 | 3.3 |
| 11: >88 | / | / | / | / | / | / | 0.21 | 0.00 | 1.4 |
5.2. Survival Environments Analysis in the Earthquake-Damaged Vegetation Areas
| Elevation Level (km) | Study Area (km2) | Mianyuan River | Subao River | |||||||||
|---|---|---|---|---|---|---|---|---|---|---|---|---|
| DA | RA | V | p (%) | DA | RA | V | p (%) | DA | RA | V | p (%) | |
| 1: <1.00 | 4.24 | 2.24 | 0.52 | 29.7 | 6.78 | 3.67 | 0.53 | 35.2 | 0.68 | 0.53 | 0.45 | 22.1 |
| 2: 1.00~1.25 | 16.01 | 12.62 | 0.59 | 49.8 | 12.69 | 8.49 | 0.57 | 45.3 | 2.03 | 1.75 | 0.51 | 33.5 |
| 3: 1.25~1.50 | 20.75 | 17.18 | 0.62 | 51.2 | 15.18 | 10.37 | 0.60 | 48.1 | 3.86 | 3.21 | 0.53 | 38.9 |
| 4: 1.50~1.75 | 21.60 | 17.26 | 0.63 | 49.8 | 12.93 | 7.71 | 0.61 | 50.6 | 2.17 | 2.02 | 0.56 | 44.8 |
| 5: 1.75~2.00 | 20.18 | 14.77 | 0.63 | 45.8 | 9.84 | 5.05 | 0.62 | 54.6 | 0.92 | 0.67 | 0.50 | 23.1 |
| 6: 2.00~2.25 | 17.35 | 11.78 | 0.63 | 42.3 | 8.45 | 3.34 | 0.63 | 41.3 | 0.35 | 0.22 | 0.46 | 12.9 |
| 7: 2.25~2.50 | 14.30 | 8.27 | 0.61 | 38.5 | 6.73 | 2.57 | 0.60 | 33.3 | 0.16 | 0.09 | 0.40 | 11.7 |
| 8: 2.50~2.75 | 10.42 | 4.76 | 0.55 | 34.2 | 6.94 | 1.77 | 0.54 | 31.2 | / | / | / | / |
| 9: 2.75~3.00 | 7.88 | 2.68 | 0.50 | 32.1 | 5.29 | 0.70 | 0.49 | 28.1 | / | / | / | / |
| 10: >3.00 | 7.82 | 1.98 | 0.41 | 22.6 | 16.47 | 5.45 | 0.45 | 19.2 | / | / | / | / |
| Slope Level ( °) | Study Area (km2) | Mianyuan River | Subao River | |||||||||
|---|---|---|---|---|---|---|---|---|---|---|---|---|
| DA | RA | V | p (%) | DA | RA | V | p (%) | DA | RA | V | p (%) | |
| 1: < 15 | 4.42 | 1.81 | 0.52 | 7.5 | 2.94 | 1.33 | 0.52 | 10.2 | 0.74 | 0.69 | 0.51 | 12.3 |
| 2: 15~25 | 5.91 | 3.43 | 0.59 | 17.9 | 7.03 | 3.67 | 0.57 | 27.3 | 1.06 | 0.92 | 0.56 | 26.3 |
| 3: 25~35 | 19.04 | 13.33 | 0.62 | 30.5 | 20.54 | 10.00 | 0.58 | 37.5 | 1.89 | 1.68 | 0.58 | 35.6 |
| 4: 35~45 | 55.40 | 39.92 | 0.63 | 42.8 | 34.19 | 18.73 | 0.56 | 48.3 | 3.24 | 2.63 | 0.55 | 43.1 |
| 5: 45~55 | 43.45 | 28.20 | 0.63 | 54.3 | 27.01 | 11.39 | 0.55 | 57.9 | 2.13 | 1.81 | 0.52 | 56.3 |
| 6: > 55 | 12.34 | 6.84 | 0.63 | 63.8 | 9.58 | 3.99 | 0.51 | 75.2 | 1.03 | 0.73 | 0.47 | 67.2 |
5.3. The Validity of the Slope Stability Model
6. Conclusions
Acknowledgments
Author Contributions
Conflicts of Interest
References
- Huang, R.; Li, W. Development and distribution of geohazards triggered by the 5.12 Wenchuan earthquake in China. Sci. China Seri. E Technol. Sci. 2009, 52, 810–819. [Google Scholar] [CrossRef]
- Xu, C.; Xu, X.; Yao, X.; Dai, F. Three (nearly) complete inventories of landslides triggered by the May 12, 2008 Wenchuan mw 7.9 earthquake of China and their spatial distribution statistical analysis. Landslides 2013, 11, 441–461. [Google Scholar] [CrossRef]
- Qi, S.; Xu, Q.; Lan, H.; Zhang, B.; Liu, J. Spatial distribution analysis of landslides triggered by 2008.5.12 Wenchuan earthquake, China. Eng. Geol. 2010, 116, 95–108. [Google Scholar] [CrossRef]
- Cui, P.; Chen, X.; Zhu, Y.; Su, F.; Wei, F.; Han, Y.; Liu, H.; Zhuang, J. The Wenchuan earthquake (May 12, 2008), Sichuan province, China, and resulting geohazards. Nat. Hazards 2009, 56, 19–36. [Google Scholar] [CrossRef]
- Dai, F.C.; Xu, C.; Yao, X.; Xu, L.; Tu, X.B.; Gong, Q.M. Spatial distribution of landslides triggered by the 2008 ms 8.0 Wenchuan earthquake, China. J. Asian Earth Sci. 2011, 40, 883–895. [Google Scholar] [CrossRef]
- Xu, C. Preparation of earthquake-triggered landslide inventory maps using remote sensing and GIS technologies: Principles and case studies. Geosci. Front. 2014. [Google Scholar] [CrossRef]
- Xu, C.; Dai, F.; Xu, X.; Lee, Y.H. Gis-based support vector machine modeling of earthquake-triggered landslide susceptibility in the Jianjiang river watershed, China. Geomorphology 2012, 145–146, 70–80. [Google Scholar] [CrossRef]
- Xu, C.; Xu, X.; Dai, F.; Wu, Z.; He, H.; Shi, F.; Wu, X.; Xu, S. Application of an incomplete landslide inventory, logistic regression model and its validation for landslide susceptibility mapping related to the May 12, 2008 Wenchuan earthquake of China. Nat. Hazards 2013, 68, 883–900. [Google Scholar] [CrossRef]
- Xu, C.; Xu, X.; Yao, Q.; Wang, Y. GIS-based bivariate statistical modelling for earthquake-triggered landslides susceptibility mapping related to the 2008 Wenchuan earthquake, China. Q. J. Eng. Geol. Hydrogeol. 2013, 46, 221–236. [Google Scholar] [CrossRef]
- Cui, P.; Lin, Y.; Chen, C. Destruction of vegetation due to geo-hazards and its environmental impacts in the Wenchuan earthquake areas. Ecol. Eng. 2012, 44, 61–69. [Google Scholar] [CrossRef]
- Zhang, J.; Hull, V.; Huang, J.; Yang, W.; Zhou, S.; Xu, W.; Huang, Y.; Ouyang, Z.; Zhang, H.; Liu, J. Natural recovery and restoration in giant panda habitat after the Wenchuan earthquake. For. Ecol. Manag. 2014, 319, 1–9. [Google Scholar] [CrossRef]
- Bathurst, J.C.; Bovolo, C.I.; Cisneros, F. Modelling the effect of forest cover on shallow landslides at the river basin scale. Ecol. Eng. 2010, 36, 317–327. [Google Scholar] [CrossRef] [Green Version]
- Marston, R.A. Geomorphology and vegetation on hillslopes: Interactions, dependencies, and feedback loops. Geomorphology 2010, 116, 206–217. [Google Scholar] [CrossRef]
- Dahal, R.K.; Hasegawa, S.; Nonomura, A.; Yamanaka, M.; Dhakal, S.; Paudyal, P. Predictive modelling of rainfall-induced landslide hazard in the Lesser Himalaya of Nepal based on weights-of-evidence. Geomorphology 2008, 102, 496–510. [Google Scholar] [CrossRef]
- Kaab, A. Photogrammetry for early recognition of high mountain hazards: New techniques and applications. Phys. Chem. Earth Part B Hydrol. Ocean. Atmos. 2000, 25, 765–770. [Google Scholar] [CrossRef]
- Dai, F.C.; Lee, C.F. Landslide characteristics and slope instability modeling using GIS, Lantau island, Hongkong. Geomorphology 2002, 42, 213–228. [Google Scholar] [CrossRef]
- Gares, P.A.; Sherman, D.J.; Nordstrom, K.F. Geomorphology and natural hazards. Geomorphology 1994, 10, 1–18. [Google Scholar] [CrossRef]
- Zhuang, J.-Q.; Cui, P.; Ge, Y.-G.; He, Y.-P.; Liu, Y.-H.; Guo, X.-J. Probability assessment of river blocking by debris flow associated with the Wenchuan earthquake. Int. J. Remote Sens. 2010, 31, 3465–3478. [Google Scholar] [CrossRef]
- Qiao, G.; Lu, P.; Scaioni, M.; Xu, S.; Tong, X.; Feng, T.; Wu, H.; Chen, W.; Tian, Y.; Wang, W.; et al. Landslide investigation with remote sensing and sensor network: From susceptibility mapping and scaled-down simulation towards in situ sensor network design. Remote Sens. 2013, 5, 4319–4346. [Google Scholar] [CrossRef]
- Scaioni, M. Remote sensing for landslide investigations: From research into practice. Remote Sens. 2013, 5, 5488–5492. [Google Scholar] [CrossRef]
- Tronin, A.A. Satellite remote sensing in seismology. A review. Remote Sens. 2009, 2, 124–150. [Google Scholar] [CrossRef]
- Cui, X.; Gibbes, C.; Southworth, J.; Waylen, P. Using remote sensing to quantify vegetation change and ecological resilience in a semi-arid system. Land 2013, 2, 108–130. [Google Scholar] [CrossRef]
- Li, Z.; Jiao, Q.; Liu, L.; Tang, H.; Liu, T. Monitoring geologic hazards and vegetation recovery in the Wenchuan earthquake region using aerial photography. ISPRS Int. J. Geo Inf. 2014, 3, 368–390. [Google Scholar] [CrossRef]
- Tofani, V.; del Ventisette, C.; Moretti, S.; Casagli, N. Integration of remote sensing techniques for intensity zonation within a landslide area: A case study in the northern Apennines, Italy. Remote Sens. 2014, 6, 907–924. [Google Scholar] [CrossRef]
- Assilzadeh, H.; Levy, J.K.; Wang, X. Landslide catastrophes and disaster risk reduction: A GIS framework for landslide prevention and management. Remote Sens. 2010, 2, 2259–2273. [Google Scholar] [CrossRef]
- Liu, J.G.; Mason, P.J.; Yu, E.; Wu, M.-C.; Tang, C.; Huang, R.; Liu, H. GIS modelling of earthquake damage zones using satellite remote sensing and DEM data. Geomorphology 2012, 139–140, 518–535. [Google Scholar] [CrossRef]
- Gomes, R.; Guimarães, R.; de Carvalho, O.; Fernandes, N.; do Amaral, E. Combining spatial models for shallow landslides and debris-flows prediction. Remote Sens. 2013, 5, 2219–2237. [Google Scholar] [CrossRef]
- Endo, T.; Tsuruta, T. The Effect of the Tree’s Roots Upon the Shear Strength of Soil; 1968 Annual Report of the Hokkaido Branch; Forest Experiment Station: Sapporo, Japan, 1969. [Google Scholar]
- Swanson, F.J.; Swanston, D.N. Complex mass-movement terrains in the western cascade range, Oregon. Rev. Eng. Geol. 1977, 3, 113–124. [Google Scholar]
- Prandini, L.; Guidiini, G.; Bottura, J.; Pançano, W.; Santos, A. Behavior of the vegetation in slope stability: A critical review. Bull. Int. Assoc. Eng. Geol. 1977, 16, 51–55. [Google Scholar] [CrossRef]
- Yang, X.; Chen, L. Using multi-temporal remote sensor imagery to detect earthquake-triggered landslides. Int. J. Appl. Earth Obs. Geoinf. 2010, 12, 487–495. [Google Scholar] [CrossRef]
- Lin, W.-T.; Chou, W.-C.; Lin, C.-Y.; Huang, P.-H.; Tsai, J.-S. Vegetation recovery monitoring and assessment at landslides caused by earthquake in central Taiwan. For. Ecol. Manag. 2005, 210, 55–66. [Google Scholar] [CrossRef]
- USGS. Magnitude 7.9 ShakeMap—EASTERN SICHUAN, CHINA. Available online: http://earthquake.usgs.gov/earthquakes/eqinthenews/2008/us2008ryan/#maps (accessed on 15 October 2014).
- Dai, F.; Lee, C.; Li, J.; Xu, Z. Assessment of landslide susceptibility on the natural terrain of Lantau island, Hongkong. Environ. Geol. 2001, 40, 381–391. [Google Scholar] [CrossRef]
© 2015 by the authors; licensee MDPI, Basel, Switzerland. This article is an open access article distributed under the terms and conditions of the Creative Commons Attribution license (http://creativecommons.org/licenses/by/4.0/).
Share and Cite
Zhang, H.; Chi, T.; Fan, J.; Hu, K.; Peng, L. Spatial Analysis of Wenchuan Earthquake-Damaged Vegetation in the Mountainous Basins and Its Applications. Remote Sens. 2015, 7, 5785-5804. https://doi.org/10.3390/rs70505785
Zhang H, Chi T, Fan J, Hu K, Peng L. Spatial Analysis of Wenchuan Earthquake-Damaged Vegetation in the Mountainous Basins and Its Applications. Remote Sensing. 2015; 7(5):5785-5804. https://doi.org/10.3390/rs70505785
Chicago/Turabian StyleZhang, Huaizhen, Tianhe Chi, Jianrong Fan, Kaiheng Hu, and Ling Peng. 2015. "Spatial Analysis of Wenchuan Earthquake-Damaged Vegetation in the Mountainous Basins and Its Applications" Remote Sensing 7, no. 5: 5785-5804. https://doi.org/10.3390/rs70505785