Article

Comparison and Validation of Long Time Serial Global GEOV1 and Regional Australian MODIS Fractional Vegetation Cover Products Over the Australian Continent

1
Northeast Institute of Geography and Agroecology, Chinese Academy of Sciences, Changchun 130102, China
2
University of Chinese Academy of Sciences, Beijing 100049, China
3
Changchun Jingyuetan Remote Sensing Test Site of Chinese Academy of Sciences, Changchun 130102, China
*
Author to whom correspondence should be addressed.
Remote Sens. 2015, 7(5), 5718-5733; https://doi.org/10.3390/rs70505718
Submission received: 9 December 2014 / Revised: 21 April 2015 / Accepted: 29 April 2015 / Published: 5 May 2015

Abstract

:
Fractional vegetation cover (FVC) is one of the most critical parameters in monitoring vegetation status. Comprehensive assessment of the FVC products is critical for their improvement and use in land surface models. This study investigates the performances of two major long time serial FVC products: GEOV1 and Australian MODIS. The spatial and temporal consistencies of these products were compared during the 2000–2012 period over the main biome types across the Australian continent. Their accuracies were validated by 443 FVC in-situ measurements during the 2011–2012 period. Our results show that there are strong correlations between the GEOV1 and Australian MODIS FVC products over the main Australian continent while they exhibit large differences and uncertainties in the coastal regions covered by dense forests. GEOV1 and Australian MODIS describe similar seasonal variations over the main biome types with differences in magnitude, while Australian MODIS exhibit unstable temporal variations over grasslands and shifted seasonal variations over evergreen broadleaf forests. The GEOV1 and Australian MODIS products overestimate FVC values over the biome types with high vegetation density and underestimate FVC in sparsely vegetated areas and grasslands. Overall, the GEOV1 and Australian MODIS FVC products agree with in-situ FVC values with a RMSE around 0.10 over the Australian continent.

Graphical Abstract

1. Introduction

Fractional vegetation cover (FVC), as first introduced by Deardorff [1], is defined as the percentage of the vertical projected area of vegetation (including leaves, stems and branches) within the total statistical area [2]. It characterizes the horizontal density of live vegetation and vegetation quality [3]. FVC is an important element in vegetation monitoring [4], numerical weather prediction [5], regional and global climate modeling [6] and global change monitoring [7]. Accurate estimation of FVC is important for modeling earth system processes.
Current remote sensing FVC products are summarized in [8] over the regional and global scales. Several FVC data sets have been produced from NOAA/AVHRR including that of [3,5] and [7]. More recently, two global FVC products have been derived from SPOT/VEGETATION: CYCLOPES from 1999 to 2007 [9] and GEOV1/BioPar from December 1998 to May 2014 [10]. Other FVC data sets have been produced for a limited period of time including one derived from Polarization and Directionality of the Earth’s Reflectances (ADEOS/POLDER)during the period 1996–1997, 2003 [4,11]. Although having a limited spatial coverage, Spinning-Enhanced Visible and Infrared Imager (MSG/SEVIRI) sensors deliver operationally in Land-SAF FVC over Africa and Europe for the period of 2006–2013 [12]. European FVC product has been generated from Medium Resolution Imaging Spectrometer (ENVISAT/MERIS) since 2003 [13]. Australian fractional covers of bare soil (BS), photosynthetic vegetation (PV) and non-photosynthetic vegetation (NPV) have been delivered from MODIS/Terra from 2000 to now.
To properly use the FVC products in further studies, the assessment of the accuracies and uncertainties among them is crucial. The Committee Earth Observing Satellite (CEOS) established the Land Product Validation Subgroup (LPV), which was mandated to define standard guidelines and protocols to validate land products. Direct validation, comparing satellite products with in-situ measurements, is restricted by the existing validation data sets, which are limited in time and space for the time-consuming procedures of ground measurements [14]. On the contrary, the comparison of different products contributes to the evaluation of the temporal and spatial consistency among products over a number of representative sites avoiding the need for concurrent ground data sets. The combination of comparison and validation of remote sensing products provides a comprehensive understanding of the FVC products for users and developers, leading to improvement in product accuracy.
Previous comparison and validation activities mainly focus on LAI and FAPAR products at the regional scale or global scale [14,15,16,17,18]. Independent comparison and validation of FVC products are currently limited to few products over relatively short periods of time or limited regions [19,20,21]. Studies indicate that CYCLOPES showed a systematic underestimation of ground data over Europe and Africa [19,21]. The CYCLOPES and GEOV1 FVC products showed consistent temporal variations, with CYCLOPES systematically lower than GEOV1 during the 2003–2005 periods [20]. GEOV1 FVC agreed with the ground measurements, yet there was some dispersion for intermediate values [20]. GEOV1 FVC generally overestimated FVC by up to 0.2 compared with the reference FVC over croplands [22]. A simple comparison with in-situ measurements of six VALERI sites illustrated that MERIS FVC provided a good estimation of FVC with a RMSE of 0.098 over Europe [23]. In general, most of the FVC validation work was coupled with the validation of LAI or FAPAR without extensive and independent investigations [20,24]. Moreover, the FVC validations were mostly carried out in Europe or Africa [19,21]. The accuracies and uncertainties of FVC products in other regions still require validation. Regional scale FVCs have been developed for regional application [25,26]. The Australian MODIS FVC product consists of the fractional covers of three end-member classes: PV, NPV and BS, which are derived from the normalized difference vegetation index (NDVI) and cellulose absorption index (CAI) which is sensitive to dry/woody vegetation matter [26]. FVC products have been used in a number of applications including land-surface processes, climate change, numerical weather predictions, natural resource management and so on [5]. All these application require FVC products with typical target accuracy around 0.05 (RMSE).
The objective of this paper is to evaluate the global GEOV1 and regional Australian MODIS FVC products, across the Australian continent. The spatial variations and the temporal consistencies of GEOV1 and Australian MODIS will be investigated during the 2000–2012 period over a series of homogeneous and representative sites selected based on the GlobeCover 2009 land cover map. The uncertainties of the GEOV1 and Australian MODIS FVC products will be validated using an extensive database of in-situ Australian FVC during the 2011–2012 period.

2. Materials and Methodology

2.1. Data Used in the Study

2.1.1. The GEOV1 FVC and the Australian MODIS FVC Products

The GEOV1 FVC product is available in open access through the GEOV1 web portal (http://www.GEOV1.eu). This product is derived from the SPOT-VEGETATION sensor at 1/112° spatial sampling interval and at 10-day frequency, in a Plate Carr e e projection for the period 1999–May 2014. The GEOV1 FVC algorithm relies on neural network trained to generate the “best estimates” of FVC obtained by scaling the CYCLOPES FVC product [9]. The input data of the neural network are top of canopy normalized reflectances. Studies show that the GEOV1 FVC product presents reliable spatial distribution and smooth temporal profiles over the 32 sites of BELMAIP-2 (Benchmark Land Multisite Analysis and Intercomparison of Products-2) site during the period 2003–2005 [21]. The GEOV1 FVC product shows a very strong linear correlation with the CYCLOPES FVC product and overcomes the significant bias in the CYCLOPES FVC product [21].
The Australian MODIS FVC V3.0.1 product is developed by the Environmental Earth Observation Group, CSIRO land and Water and can be downloaded from http://www-data.wron.csiro.au/rs/MODIS/products/Guerschman_etal_RSE2009/data. The product is derived from the Terra-MODIS satellite data. The FVC was estimated using a linear unmixing approach involving NDVI and CAI. Regression analysis found an alternate index for the CAI in the simple ratio of MODIS bands 7 (~2100 nm) and 6 (~1650 nm) that is sensitive to spectral characteristics of dry/woody vegetation matter in the short-wave infrared (SWIR) spectral region [26]. The NDVI and the simple ratio of MODIS bands 7 and 6 were used to generate fraction cover of PV, NPV and BS from MODIS nadir bidirectional reflectance distribution function-adjusted reflectance data. This methodology was originally developed for the Australian tropical savannas and validated against grass curing measurements.
The main characteristics of the GEOV1 and Australian MODIS FVC products are summarized in Table 1. The spatial variations and the temporal consistencies of the GEOV1 and Australian MODIS FVC were compared during 2000–2012. Validations of the GEOV1 and Australian MODIS products were performed for the period of 2011–2012, which corresponded to the full period of availability of the in-situ FVC. Previous studies suggested comparing remote sensing products at a substantially larger spatial resolution than their native resolutions to reduce potential coregistration errors among products [15,27]. In this study, the FVC data sets were first mosaicked and then resampled to a 0.05° spatial resolution using the mean filter in the Plate Carr e e projection. The FVC data sets were aggregated into a monthly time step using the averaging method for the FVC products have different temporal compositing periods, which enabled the comparisons of the products. The GEOV1 and Australian MODIS FVC data sets with original resolutions were validated by the in-situ measurements.
Table 1. Characteristics of the three remote sensing FVC products under study.
ProductsSensorSpatial, Temporal ResolutionSpace CoverageAlgorithmTime CoverageReference
GEOV1SPOT-VGT1/112°, 10 daysglobalANN trained with CYC products1999–May 2014[10]
Australian MODISTerra-MODIS0.005°,8 daysAustraliaSpectral linear unmixing based on NDVI and CAI2000–now[26]
Note: VGT, ANN, CYC, NDVI and CAI stand for “VEGETATION”, “artificial neural network”, “CYCLOPES”, “Normalized vegetation index”, and “cellulose absorption index” respectively.

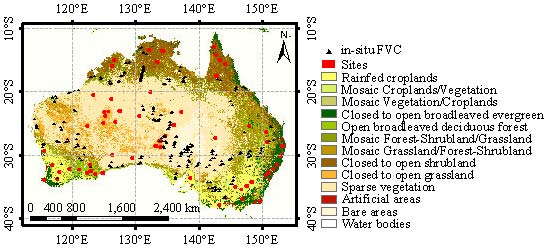
2.1.2. Australian Ground FVC Database

An extensive database of ~400 FVC estimates across Australia was obtained from the Australian Bureau of Agricultural and Resource Economics and Sciences (Figure 1) during the period 2011–2012. The data set consists of estimates of PV, NPV and BS cover at three defined vegetation levels: Ground cover, mid-story vegetation and over-story vegetation. Typical sampling areas were 100 m × 100 m. The presence/absence of PV, NPV or BS along a transect at 1 m intervals was determined for each vegetation level. Exposed cover was the first cover seen when looking down on the transect point and estimated the view seen by the satellite. In this study, we only used the exposed cover of PV. Detailed introductions of the sampling strategy applied were described in [18,28,29].The in-situ exposed cover of PV was used to validate the GEOV1 and Australian MODIS FVC products.

2.2. Methodology

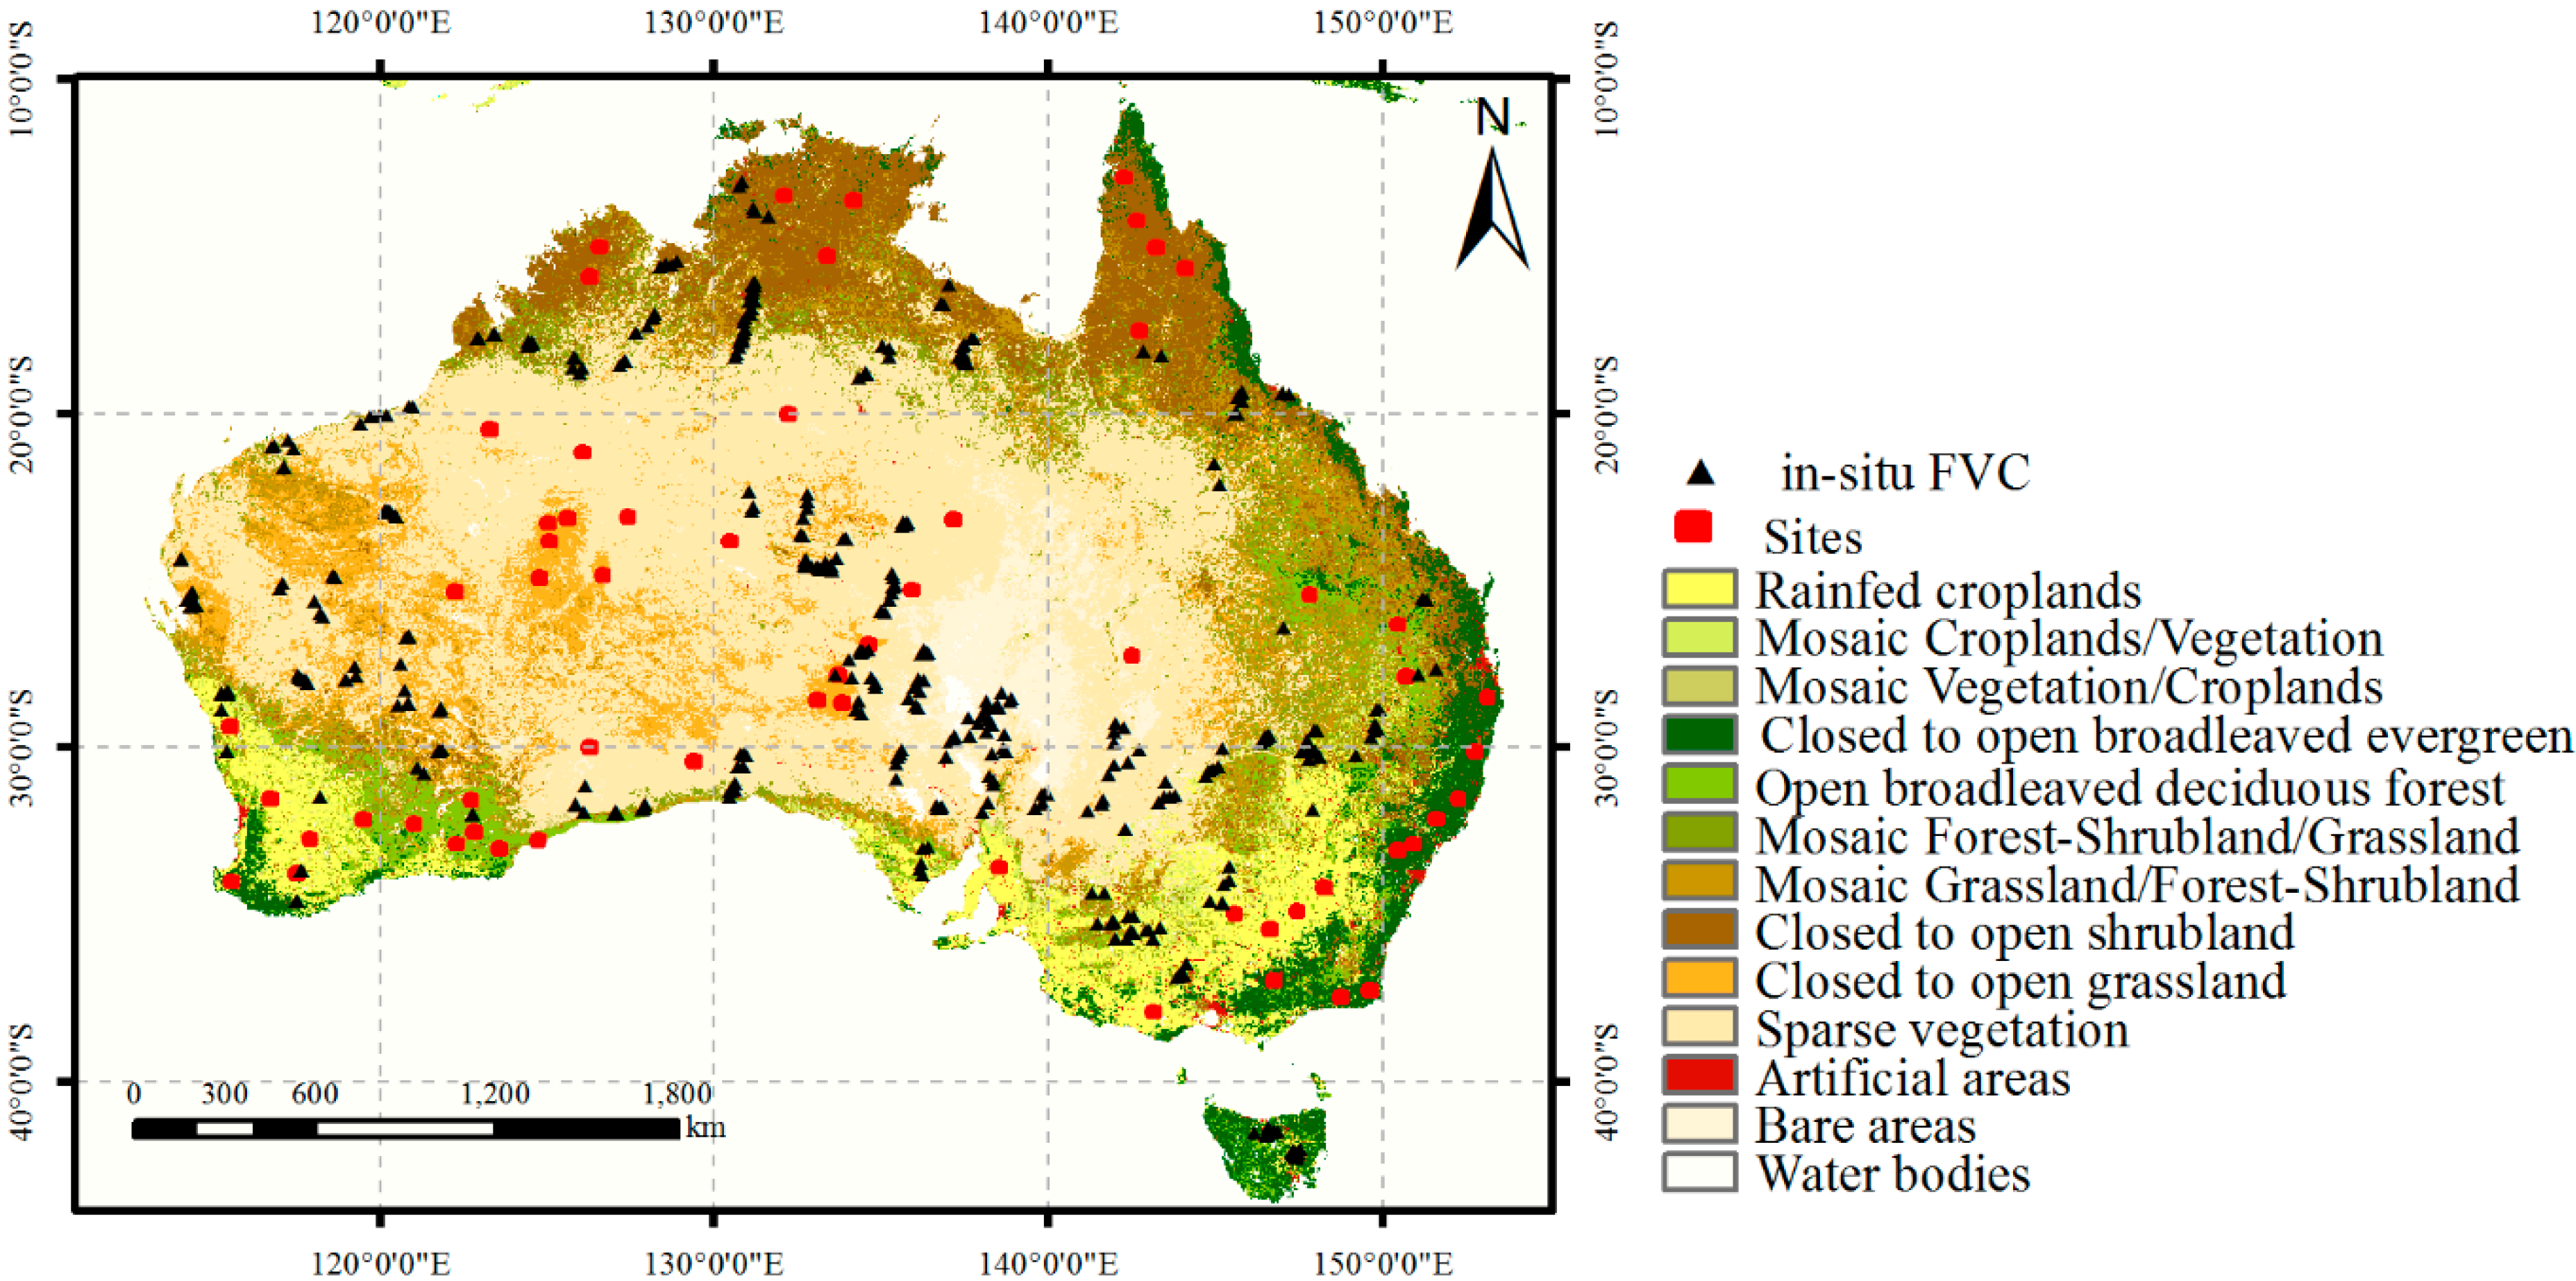
2.2.1. Evaluating Units

The main biome types over the Australian continent are rainfed croplands (RC), closed to open broadleaved evergreen forest (COBEF), open broadleaved deciduous forest (OBDF), closed to open shrubland (COS), closed to open grassland (COG), and sparse vegetation (SV). Six evaluating units corresponding to the above biome types were determined. Each evaluating unit was composed of 10 homogeneous sites which were manually selected based on the Glob Cover 2009 land cover map with a spatial resolution of 0.003° [30] and uniformly distributed over the biome types to represent the regional variability. Each site had an area of 0.15° × 0.15° (Figure 1).The spatial and temporal variations of FVC over Australia were investigated based on these six evaluating units.
Figure 1. Spatial coverage of the evaluating units and in-situ fractional vegetation covers. The base map is the Glob Cover 2009 land cover map.
Remotesensing 07 05718 g001

2.2.2. Comparison Metrics

Three statistical indicators were computed between the GEOV1 FVC product (FVCGEO) and Australian MODIS FVC product (FVCAus) over the common period of 2000–2012. The Pearson correlation coefficient (R), the mean difference (Bias) and the root mean squared error (RMSE) were calculated. The equations for the calculation of the three indicators are as follows [31]:
R = i = 1 n ( F V C A u s ( i ) FVC A u s ¯ ) ( F V C G E O ( i ) FVC G E O ¯ ) i = 1 n ( F V C A u s ( i ) F V C A u s ¯ ) 2 i = 1 n ( F V C G E O ( i ) FVC G E O ¯ ) 2
Bias = FVC Aus FVC GEO ¯
RMSE = ( FVC Aus FVC GEO ) 2 ¯
where the overbar denotes the mean operator, and n is the number of FVC data.

3. Results

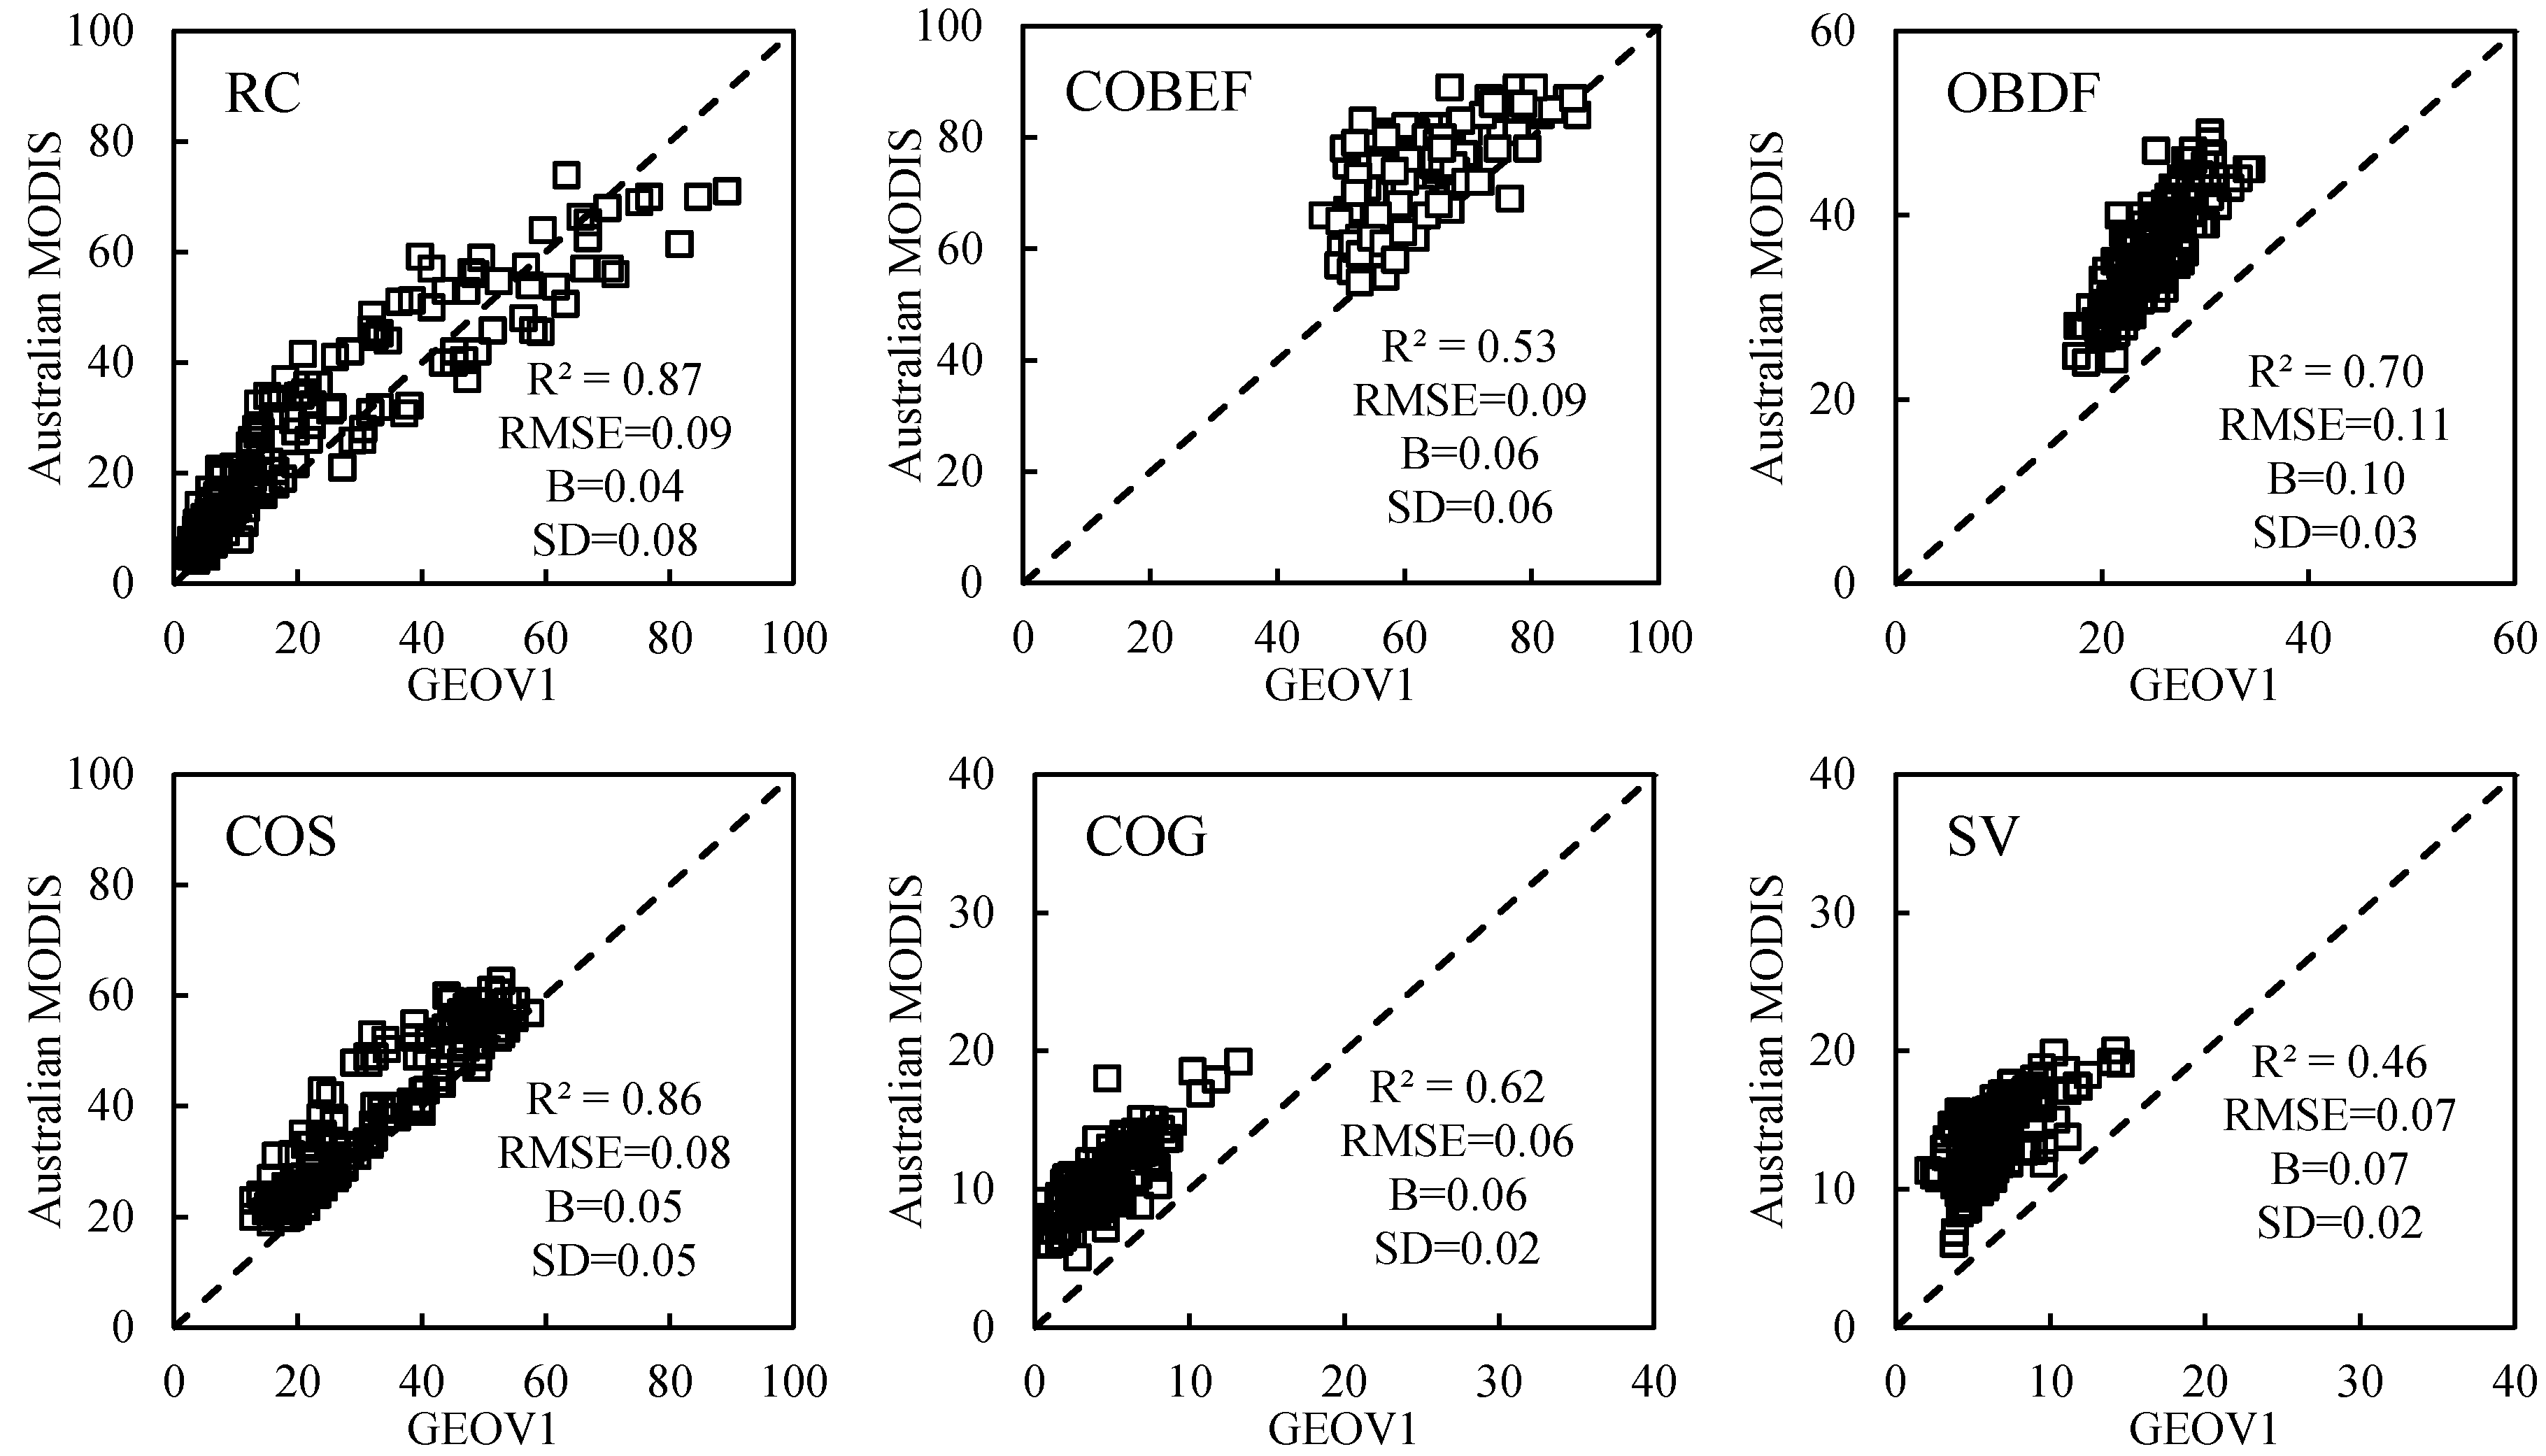
3.1. Spatial Consistency of FVC products

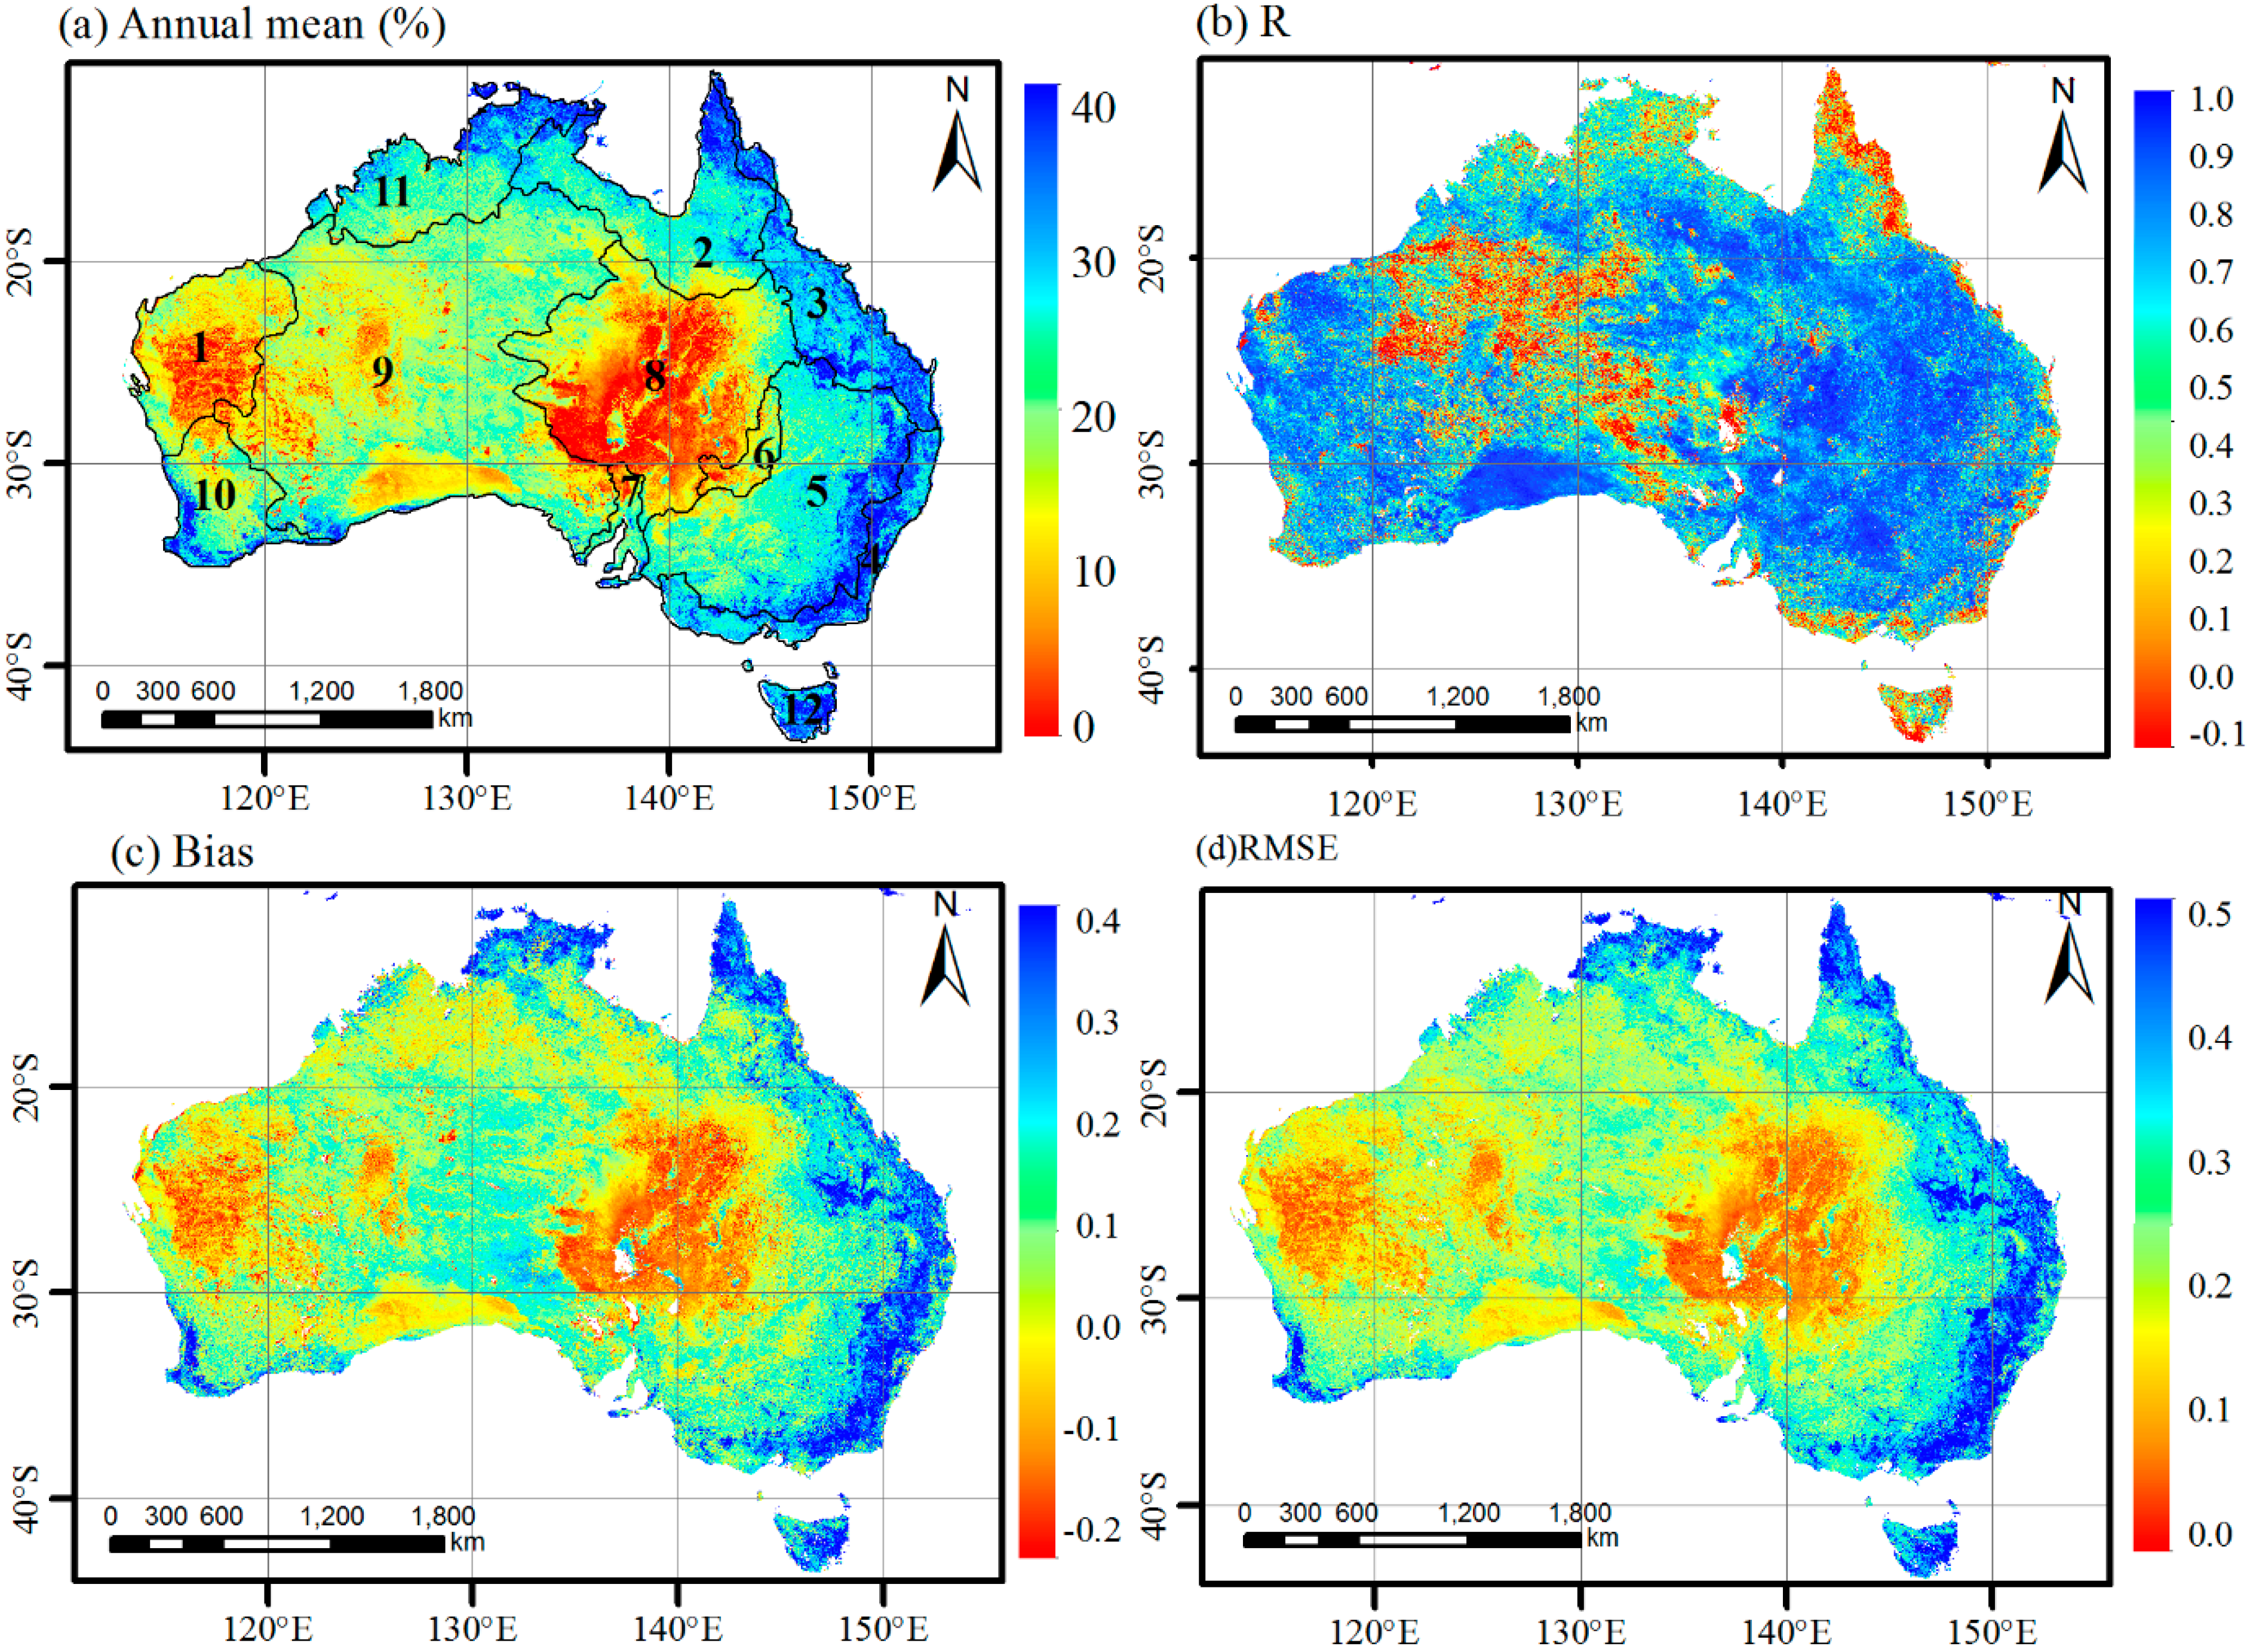
3.1.1. Spatial Variations

Figure 2a shows the annual mean derived from the Australian MODIS FVC product for the period 2000–2012. The features in Figure 2a indicate the Australian drainage divisions. Each division consists of a mixture of individual drainage basins [29].The Australian MODIS FVC shows high values over the North-East Queensland coast, South-East Australian coast and Tasmania where are mainly covered by dense forests and mosaic forest-shrubland/grassland. Low FVC values are observed over the Western Australia coast, Central Australia and Western Plateau which are covered by COG and SV. Medium FVC values are detected over the Northern Australia and Murray-Darling basin. Maps of the calculated statistical indicators (R, bias and RMSE) between GEOV1 and Australian MODIS for the period 2000–2012 are shown in Figure 2b–d. Figure 2b shows that robust positive correlations between GEOV1 and Australian MODIS are found over most of the Australian continent. Weak correlation (R < 0.2) is depicted over the Western Plateau and the eastern coastal area. This is partly because the algorithm of the Australian MODIS FVC product was developed in northern Australia which is mainly covered by medium to high vegetation cover [26]. The spatial distributions of bias and RMSE between GEOV1 and Australian MODIS are similar. Low bias and RMSE values are found in in the Central Australia and Western Plateau drainage basins. Australian MODIS provides much larger FVC estimations than GEOV1 over the northern and eastern coast of Australia. The RMSE between Australian MODIS and GEOV1 is also higher over there than over other regions. Previous study shows that GEOV1 provides lower values over the dense forests with large differences [20].
Figure 2. (a): Annual mean of the Australian MODIS FVC for the period 2000–2012. (bd): the R, bias and RMSE between the GEOV1 FVC and the Australian MODIS FVC for the period 2000–2012. Drainage divisions across Australia: North-East Queensland Coast (3), South-East Australian coast (4), Tasmania (12), Murray-Darling Basin (5), Western Australia coast (1,10), Northern Australia (2, 11), Central Australia (6, 7, 8), and Western Plateau (9).
Remotesensing 07 05718 g002

3.1.2. Biome Types Consistency

The following scatterplots are used to assess the consistencies between the FVC products, which are generated over the six evaluating units, using the mean values of each evaluating unit from the months of the 2000–2012 period, for the main biome types over the Australian continent (Figure 3).
Australian MODIS provides larger FVC estimates than GEOV1 over all the biome types. No significant scattering (low SD) is observed between these FVC products. GEOV1 and Australian MODIS are better correlated over RC and COS with higher R2 values than over other biome types. Relatively low biases are observed between GEOV1 and Australian MODIS (B = 0.04 for RC and 0.05 for COS).Similar agreement is achieved for these two biome types (RMSE = 0.09 for RC and 0.08 for COS).
The comparison between GEOV1 and Australian MODIS provides low agreement over COBEF and OBDF (RMSE = 0.09 for COBEF and RMSE = 0.11 for OBDF) with relatively high biases (B = 0.06 for COBEF and 0.10 for OBDF) mainly coming from the lower GEOV1 FVC values over dense forests [20].
Over COG and SV, the best agreements between GEOV1 and Australian MODIS are reached with the lowest RMSE (RMSE = 0.06 for COG and 0.07 for SV). Australian MODIS shows relatively low correlations with GEOV1 over SV (R2 = 0.46).This may be due to the fact that the Australian MODIS FVC algorithm was proposed over the Australian tropical savanna region, which introduces differences in the FVC estimations over sparsely vegetated areas with substantial sub-pixel heterogeneity [26].
Figure 3. Scatterplots of the two products over the main biome types in Australia for the 2000–2012 period. The terms B and SD represent the bias and the standard deviation of the differences between the FVC retrievals.
Remotesensing 07 05718 g003

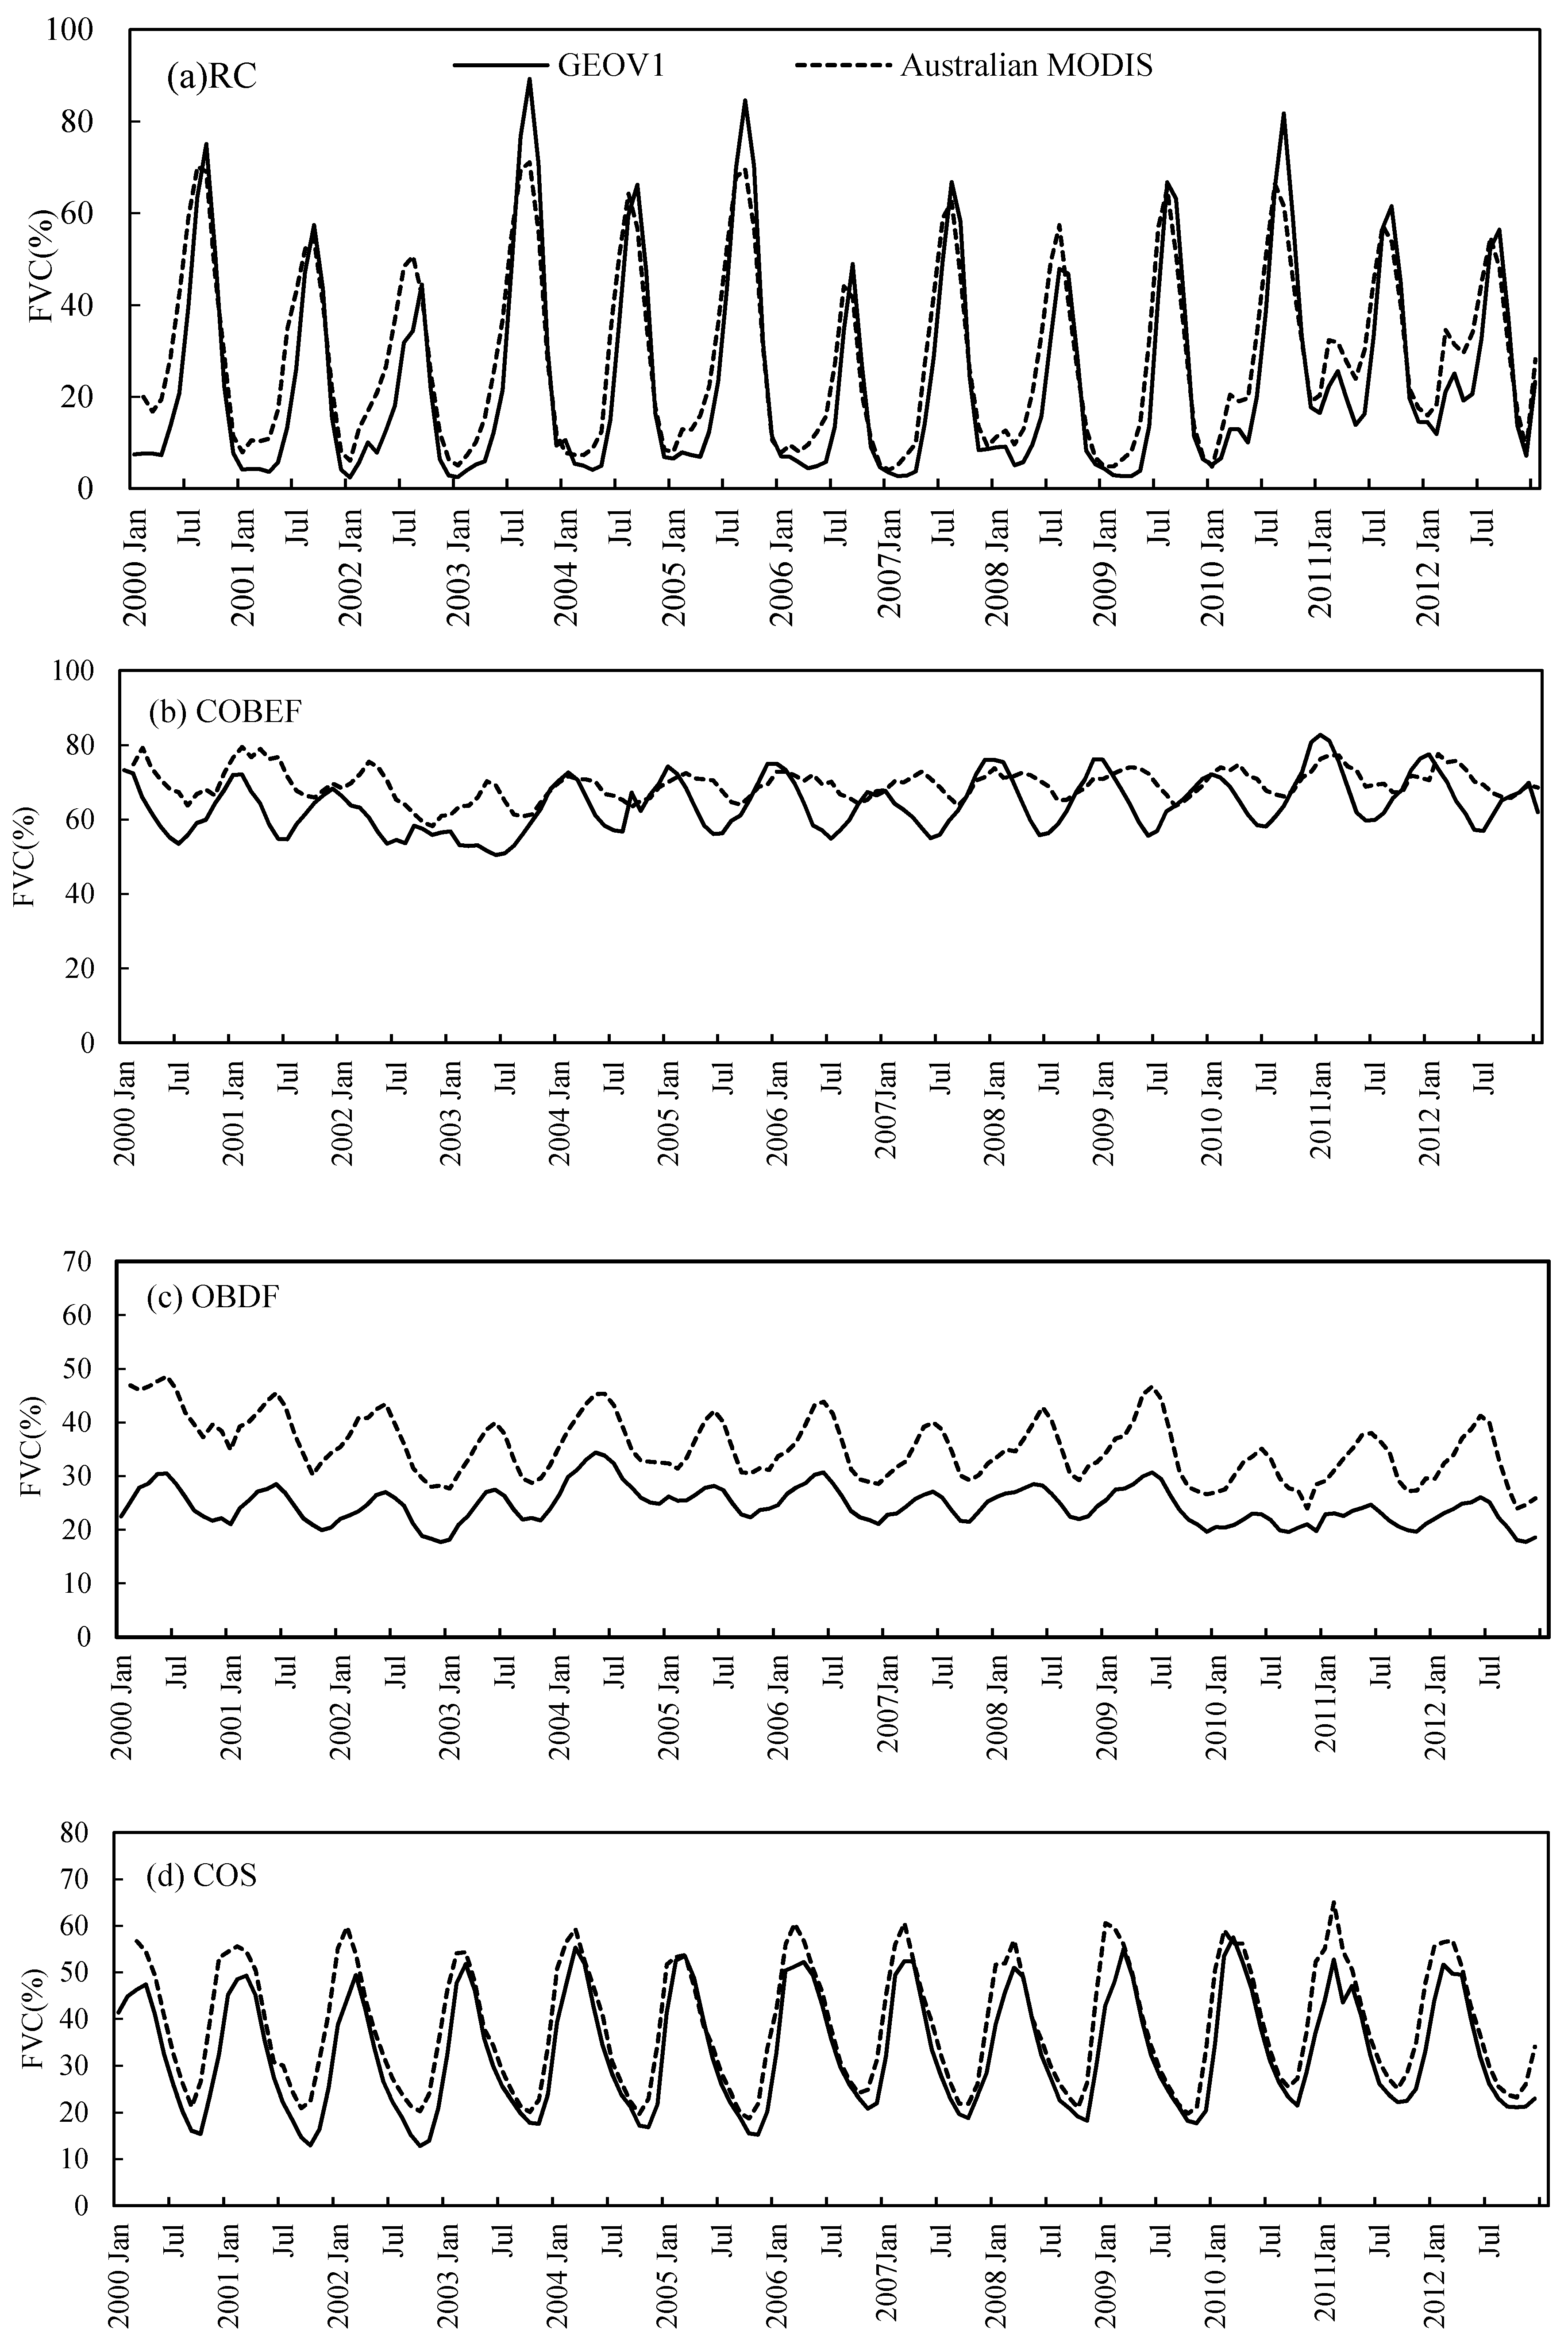
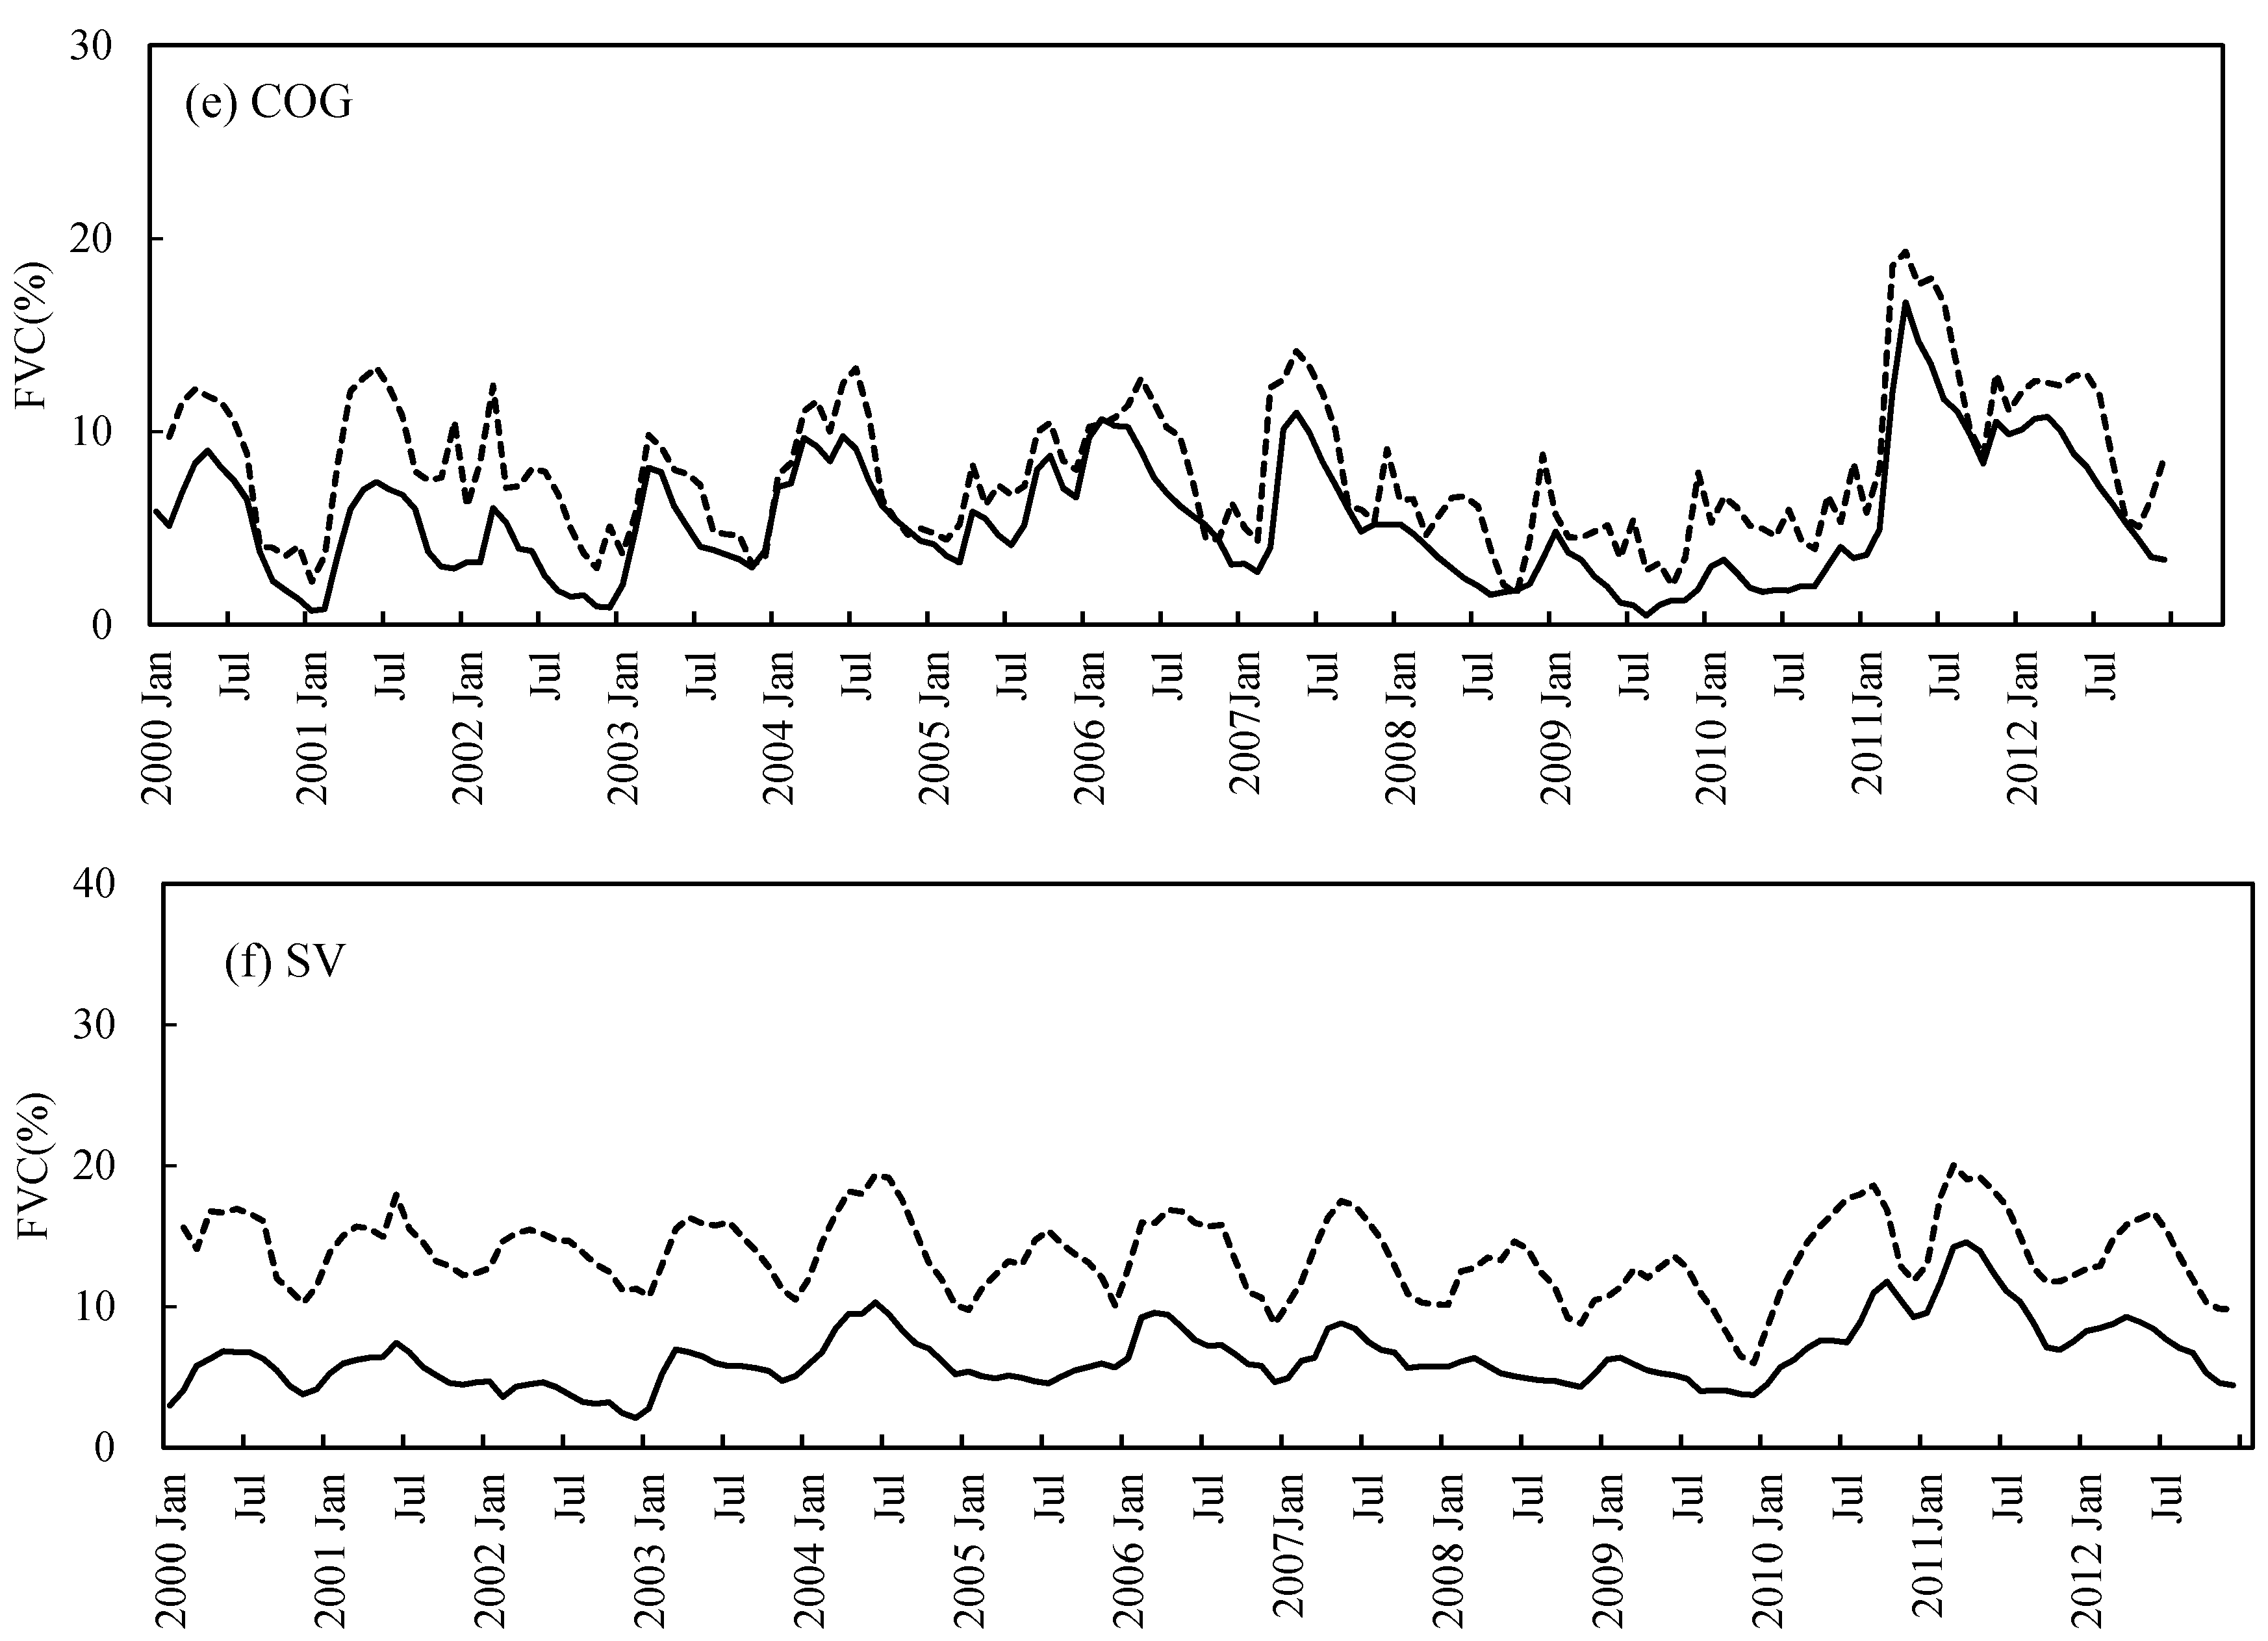
3.2. Temporal Consistency of the Three FVC Products

Figure 4 shows the interannual and seasonal variations of the two FVC products for each biome type over the six evaluating units for the 2000–2012 period.
Figure 4. Interannual and seasonal variations of the GEOV1 and Australian MODIS FVC products over the main biome types of Australia during the 2000–2012 period. (a) rainfed croplands (RC), (b) closed to open broadleaved evergreen forest (COBEF), (c) open broadleaved deciduous forest (OBDF), (d) closed to open shrubland (COS), (e) closed to open grassland (COG), and (f) sparse vegetation (SV).
Remotesensing 07 05718 g004aRemotesensing 07 05718 g004b
Over RC, the GEOV1 and Australian MODIS FVC products show similar seasonal variations, however, with differences in magnitude. The peak values of GEOV1 are higher than Australian MODIS and the valley values are lower than Australian MODIS. The peak values are captured in September for the cultivation of winter crops. These two products properly capture interannual variability. Similar temporal variations are also derived over COS with the FVC values of GEOV1 lower than Australian MODIS. Over the COBEF sites, GEOV1 shows realistic seasonal profiles while the seasonal trajectory derived from the Australian MODIS FVC product is relatively shifted. This is due to that the algorithm for Australian MODIS FVC product may not properly describe the characteristic of evergreen vegetation [26]. Over the OBDF biome type, the Australian MODIS and GEOV1 FVC depict similar seasonal trajectories with much higher values than GEOV1. The largest temporal inconsistencies are observed over COG as compared to other biome types. The Australian MODIS FVC displays very noisy profiles. This is due to the spatial heterogeneity of COG resulting in sub-pixel heterogeneity and multiple scattering. Nonlinear mixing due to multiple scattering produced uncertainties in estimation of FVC [26].Over SV, GEOV1 describes low interannual variations such as no differences of FVC values in 2002, 2005, and 2008, which is possibly due to residual cloud or atmospheric effects.
In summary, these two FVC products generally capture the temporal variations and present seasonal evolutions with higher values in the wet season and lower values in the dry season. The Australian MODIS and GEOV1 FVC show similar seasonal profiles over most biome types. The values of GEOV1 are systematically lower than Australian MODIS.

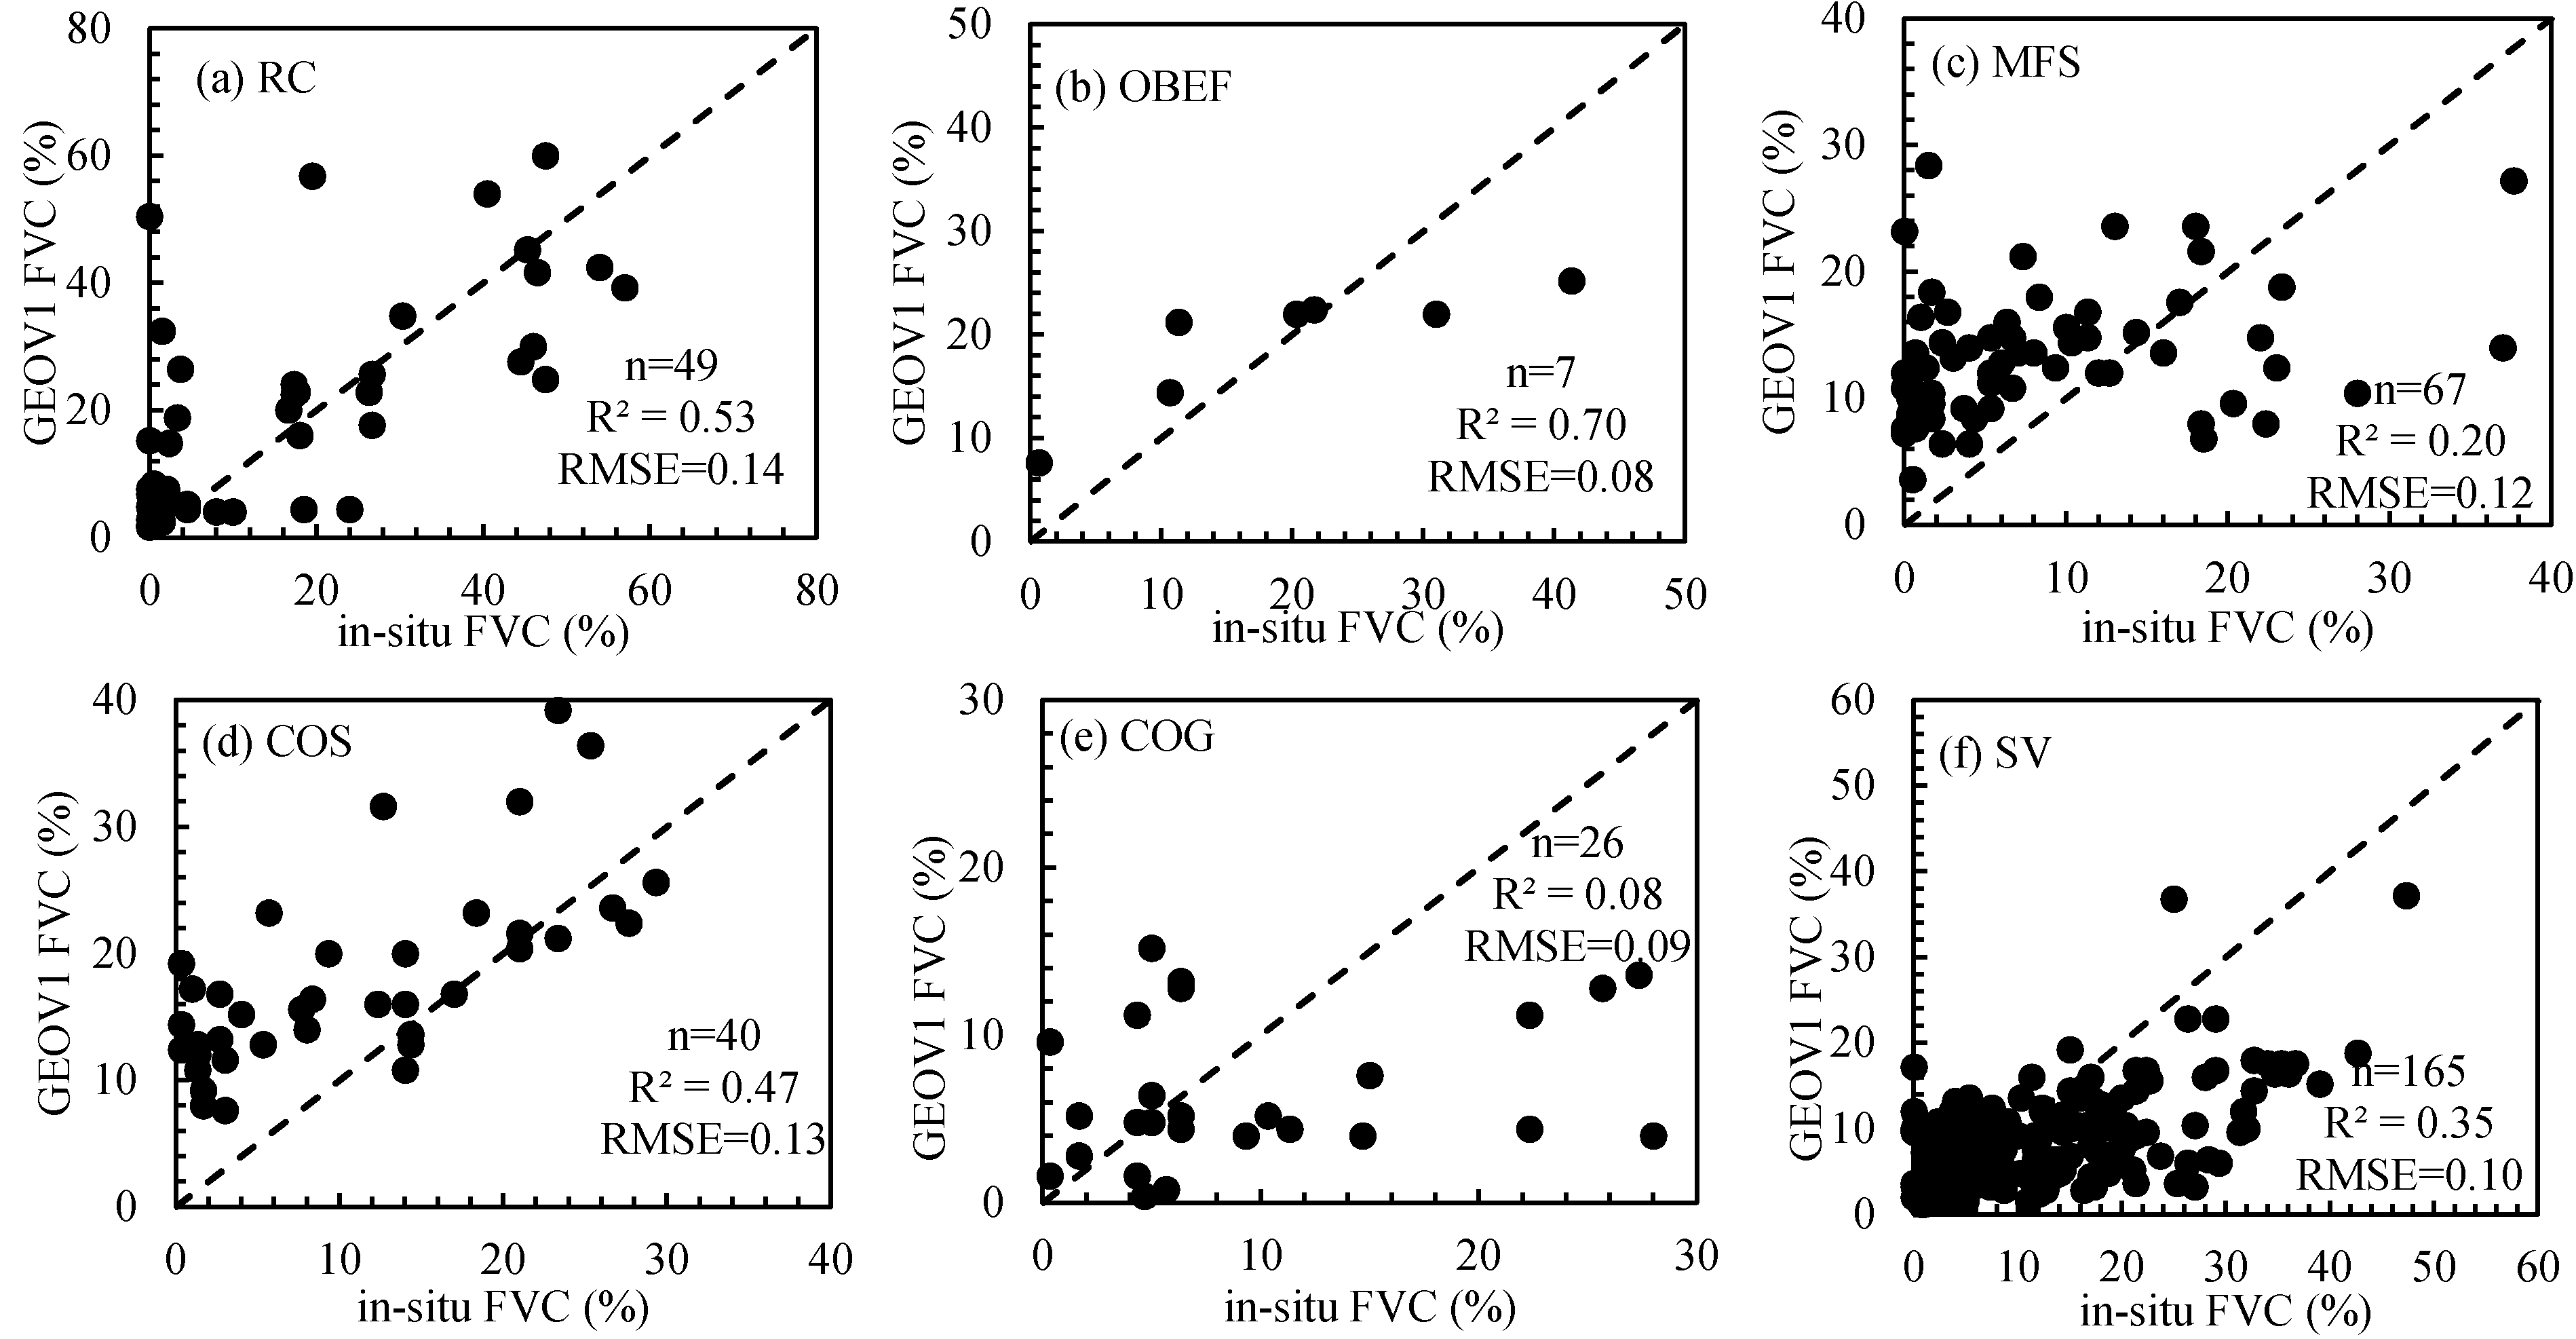
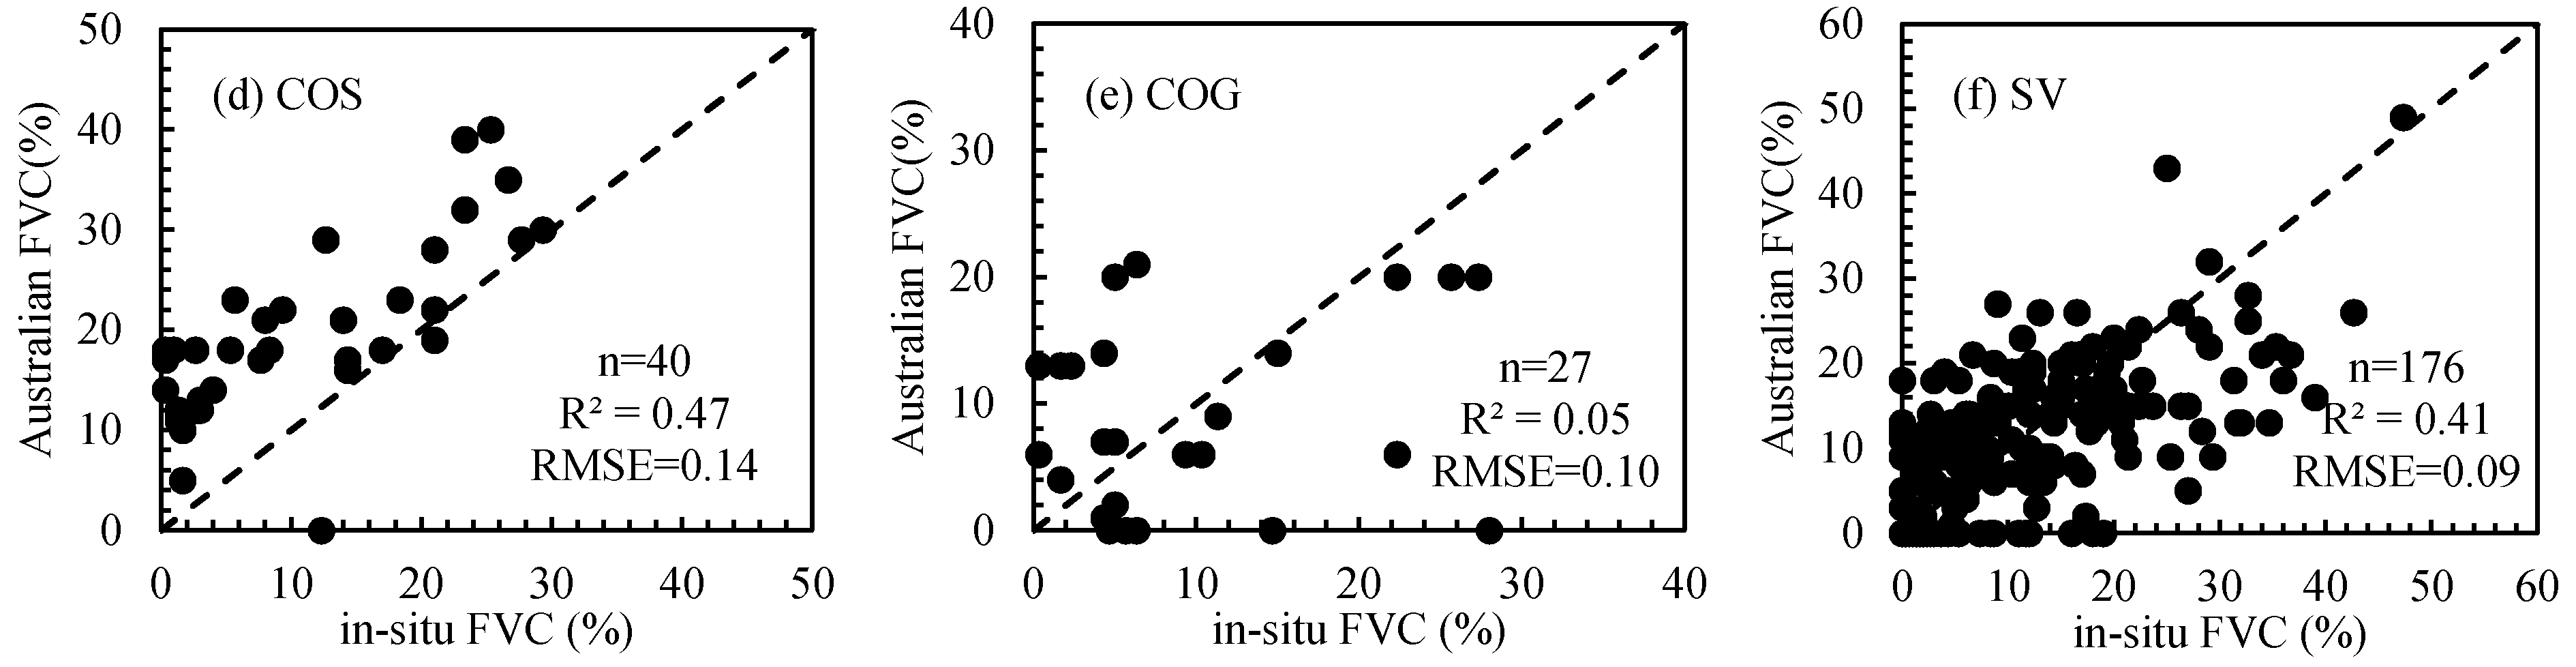
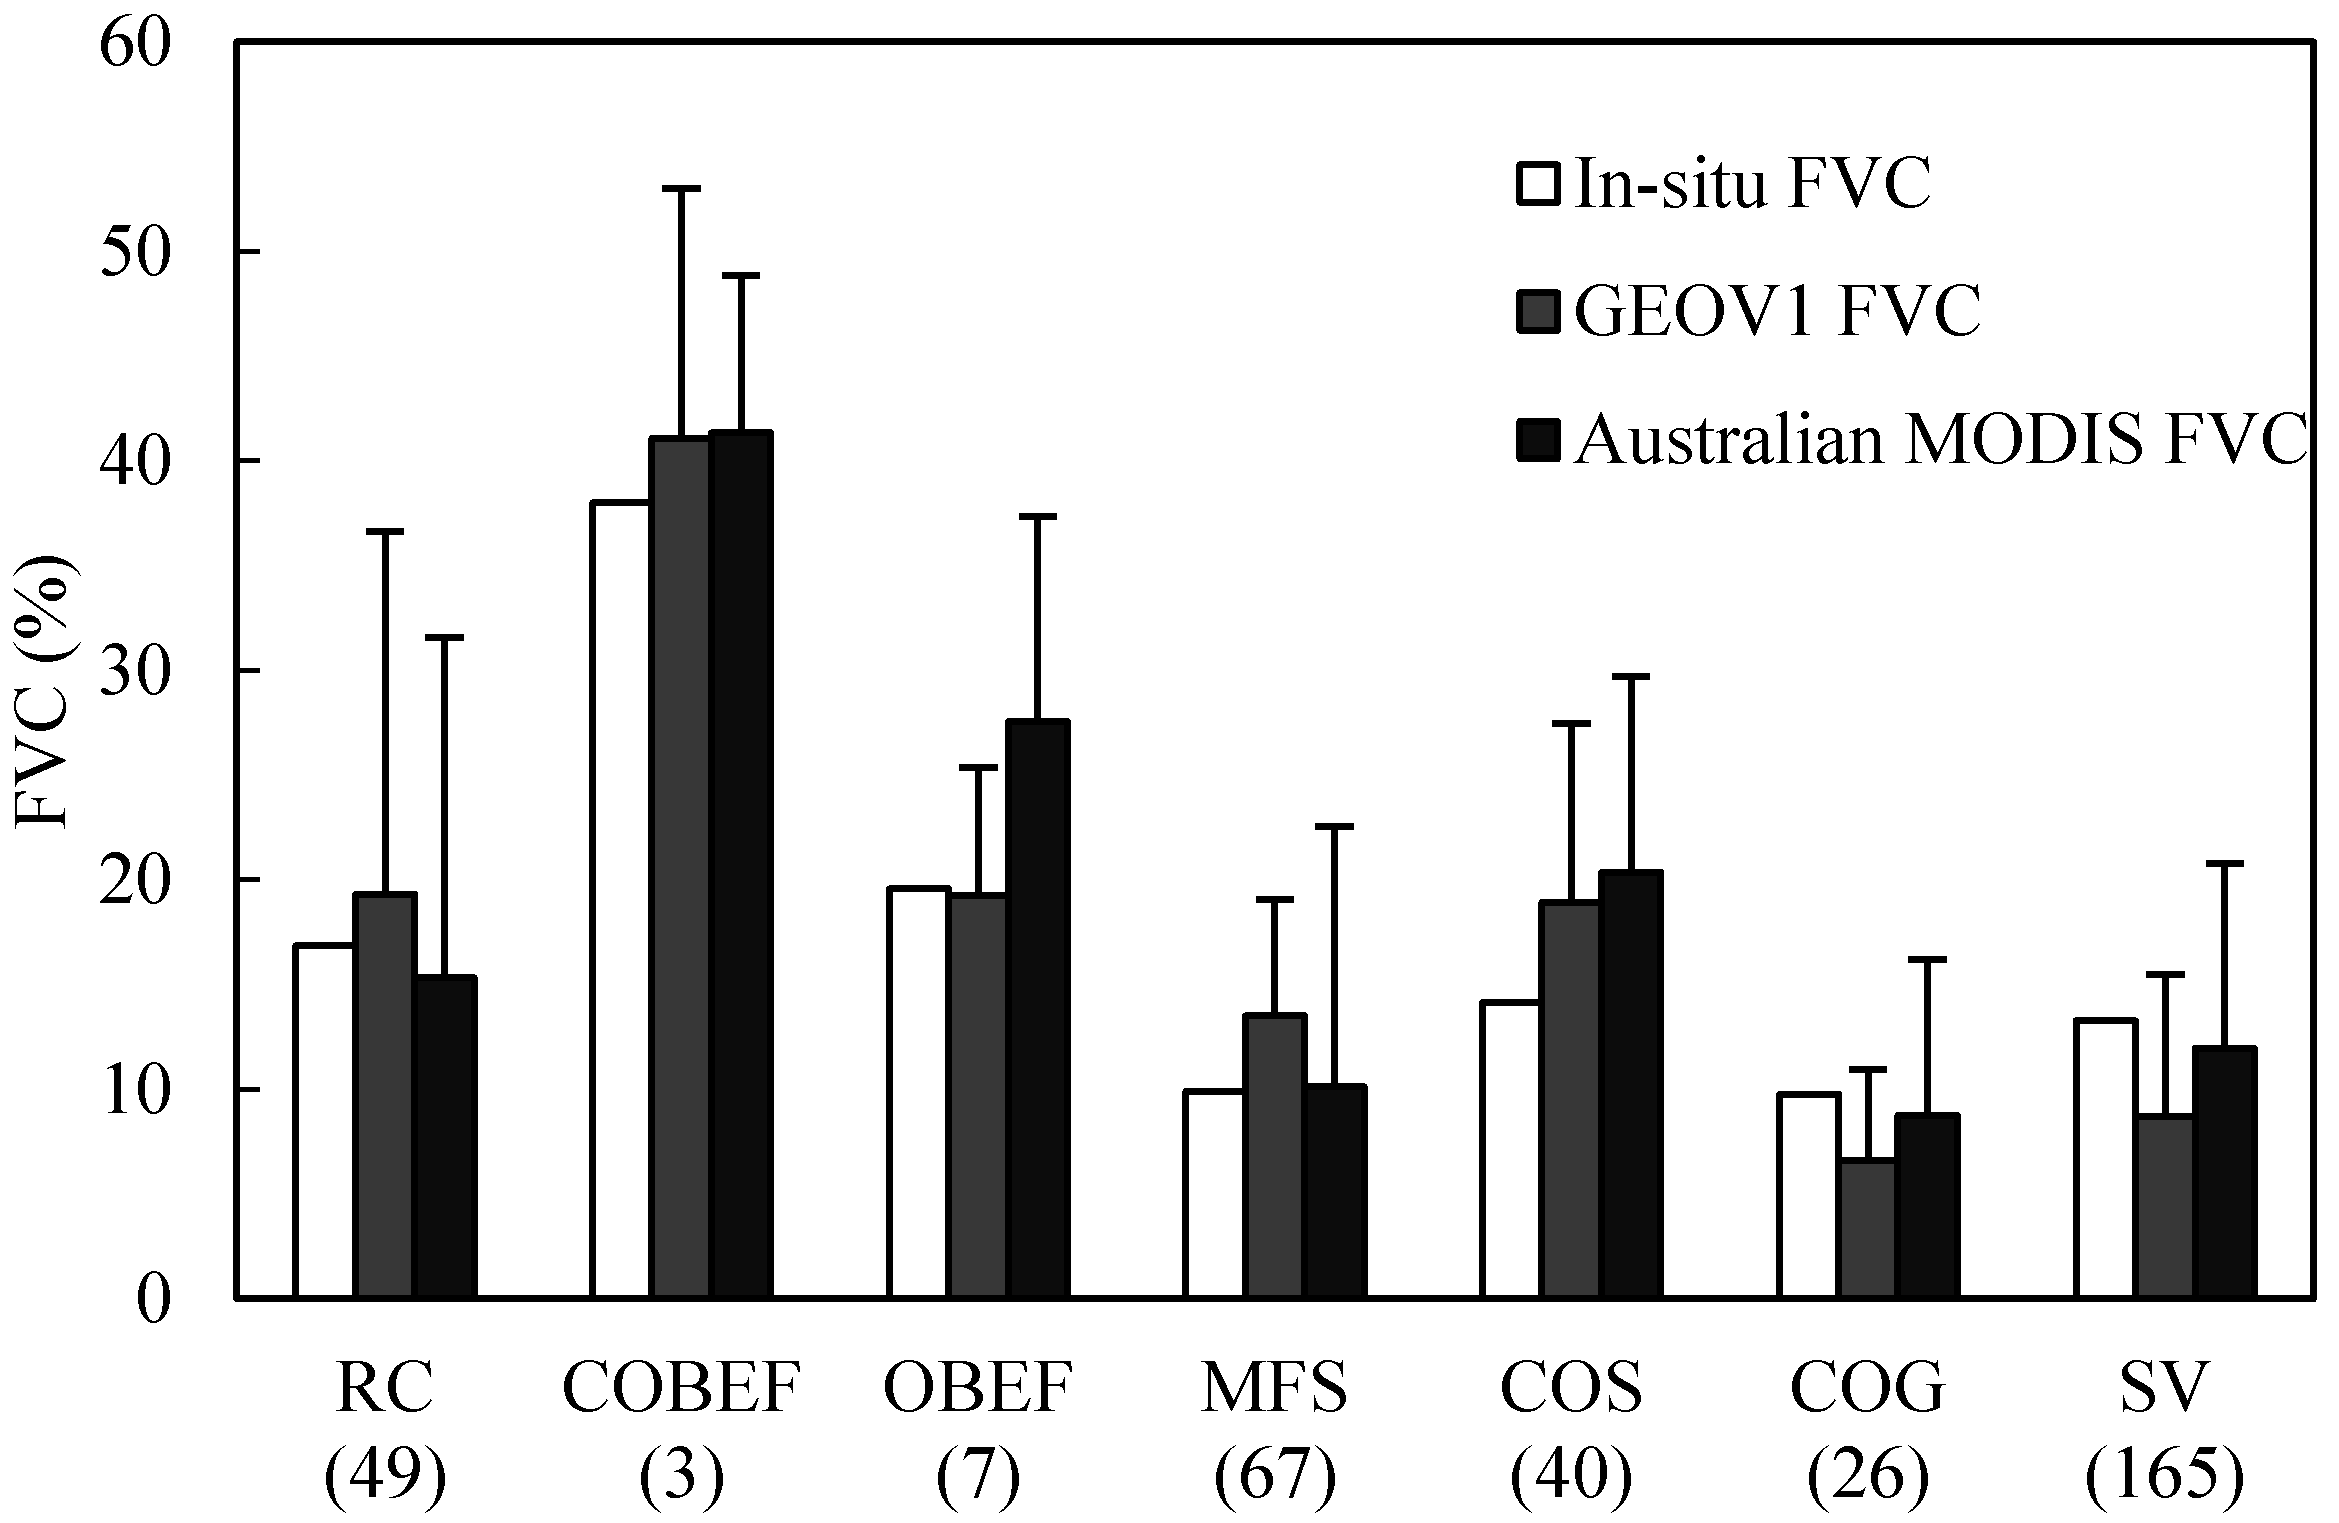
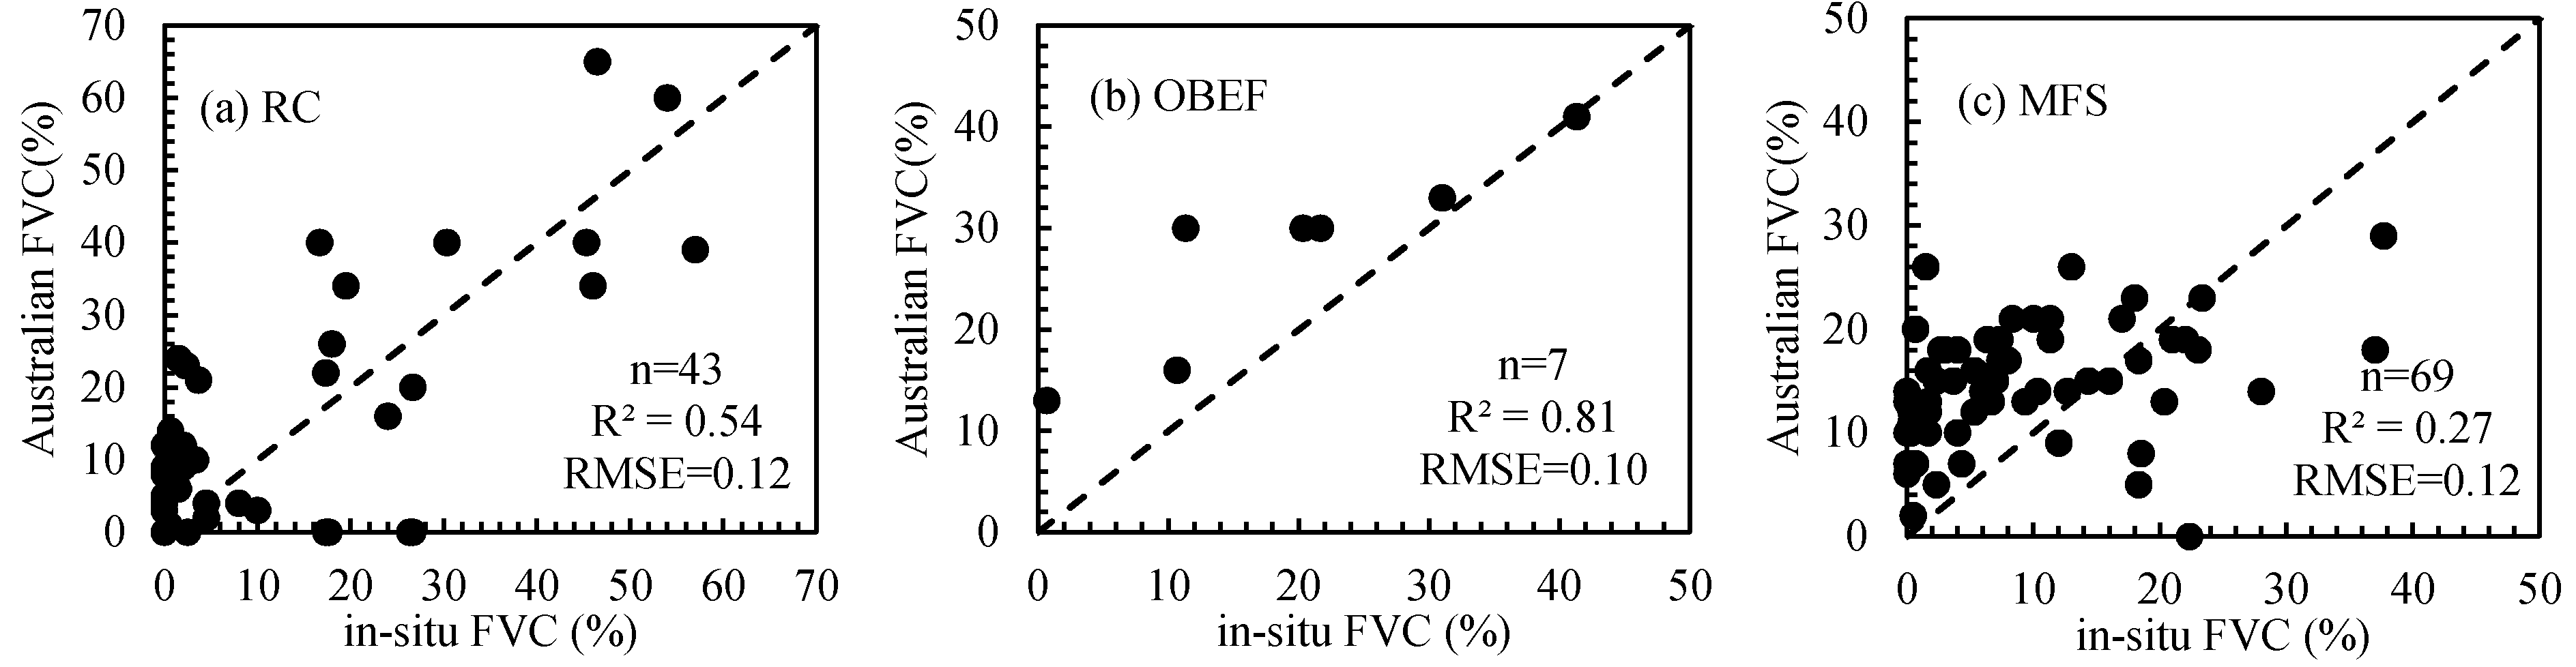
3.3. Direct Validations of GEOV1 and Australian MODIS FVC Products

Ground FVC measurements were distributed in Australia across a wide range of geographical areas. The sampled biome types in the data set included RC, OBDF, MFS (mosaic forest-shrublands), COS, COG, SV. Half of the sampled points are distributed over SV (n = 165). The FVC values in the data set range from 9.76% ± 8.53% for COG to 38% ± 26.42% for COBEF. Vegetation classes with the highest FVC values are in the order of COBEF > OBDF > RC > COS, whereas those with the lowest FVC values are in the order of COG < MFS < SV. Only the GEOV1 and Australian MODIS FVC products are validated by the in-situ data set because the temporal coverage of CYCLOPES FVC product is from 2000–2007. The FVC products with the original spatial resolutions and temporal compositing period that are close to the range of time for the in-situ measurement acquisition were selected and directly compared with the in-situ FVC values. The numbers of validated points are similar for the GEOV1 and Australian MODIS FVC products. Compared with the ground FVC, the Australian MODIS product overestimates the FVC of OBDF and COS biome types (Figure 5). For RC, COG, and SV biome types, the Australian MODIS product estimates lower values than the field values. The Australian MODIS product is more consistent with the field FVC than the GEOV1 product over MFS. The FVC values of the OBDF derived from the GEOV1 FVC product agree well with the field measurements. The GEOV1 FVC product overestimates the FVC values of RC, MFS, and COS while underestimating the values of COG and SV.
Figure 5. Comparison of GEOV1 and Australia FVC mean values with in-situ FVC for each biome types. Error bars represent +1 standard deviation. The number of in-situ observations for each biome is shown in the parenthesis.
Remotesensing 07 05718 g005
The uncertainty of each product is quantified by the RMSE computed against the ground FVC data set. Figure 6 and Figure 7 show scatterplots between FVC products and the ground FVC measurements. Neither product produces ~1:1 relationship with the in-situ FVC. These two products show different degrees of correlations with the in-situ FVC over the six biome types. GEOV1 and Australian MODIS present good agreements with the in-situ FVC over RC, OBDF, and COS with similar R2 and RMSE. For the Australian MODIS, overestimations are observable for OBDF and COS. Over MFS, a low R2 possibly attributes to the spatial heterogeneity of the surface for the existing forests and shrubs. The same uncertainties (RMSE = 0.12) are achieved by GEOV1 and Australian MODIS. Both of the FVC products underestimate FVC for high values. Obvious outliers are observed over COG for GEOV1 and Australian MODIS for the lowest R2 (R2 < 0.1) values are achieved. This could be explained by a poor description of the surface spatial variability and scale effect. GEOV1 achieves the best performance with a RMSE value of 0.08 over OBDF biome type followed closely by Australian MODIS (RMSE = 0.10). The agreement of the Australian MODIS with the ground measurements is better over SV (RMSE = 0.09) than over other biome types. Across all the biome types, GEOV1 and Australian MODIS provide similar agreement with the in-situ data set (R2GEO = 0.38, RMSEGEO = 0.11; R2Aus = 0.35, RMSEAus = 0.10). The overall RMSE of GEOV1 and Australian are about 0.10, which is lower than the expected accuracy 0.05 [19]. The uncertainties in ground measurements, limited number and spatial representativeness of ground measurements also impact the accuracy of the FVC products.
Figure 6. Scatterplots of GEOV1 FVC product with the in-situ FVC for different biome types.(a) rainfed croplands (RC), (b) closed to open broadleaved evergreen forest (COBEF), (c) open broadleaved deciduous forest (OBDF), (d) closed to open shrubland (COS), (e) closed to open grassland (COG), and (f) sparse vegetation (SV).
Remotesensing 07 05718 g006
Figure 7. Scatterplots of the Australian MODIS FVC product with the in-situ FVC for different biome types.(a) rainfed croplands (RC), (b) closed to open broadleaved evergreen forest (COBEF), (c) open broadleaved deciduous forest (OBDF), (d) closed to open shrubland (COS), (e) closed to open grassland (COG), and (f) sparse vegetation (SV).
Remotesensing 07 05718 g007aRemotesensing 07 05718 g007b

4. Discussion

The comparison of global FVC product (the GEOV1 FVC product) with the regional product (the Australian MODIS FVC) showed that these two products display similar spatiotemporal variations over the Australian continent. The Australian MODIS FVC and GEOV1 show large uncertainties over RC and COS. The accuracies of the two FVC products are sensitive to biome types. The reliabilities and accuracies of the FVC products for different biome types need to be intensively validated. The development of FVC algorithm should focus on the sensitivity of the algorithm to vegetation types with emphasis on vegetation density. Studies showed that a change of as much as 100 W∙m−2 in latent heat flux (LE) can occur when varying FVC by 0.2 while keeping all other factors invariant [32,33]. Therefore, accurate FVC product is important for application to land surface models. For GEOV1 and Australian MODIS, the results of validation show that the accuracies ranged from 0.08 to 0.14, lower than the expected target accuracy of 0.05 [19]. High accuracies for the FVC products are necessary for further application. The development and validation of regional FVC products for proper local application should be conducted.
Standard ground measurement is one of the most important steps to the validation of FVC. One of the uncertainties introduced by direct validation is the mismatch of spatial scales. In this study, our results are limited by a possible lack of sampling points in ground measurement and small sampling units. Each field unit measures approximately an extent of 100 m × 100 m, which is much smaller than a pixel of the FVC products (1 km × 1 km). There is a scale effect for the point-to-pixel comparison between the FVC products and the ground measured FVC values [34]. Therefore, higher resolution images (20 m or 30 m) are generally chosen to generate reference maps as a bridge to validate coarse resolution remote sensing products [16,35].This strategy is recommended for further validation of the FVC products [24]. Moreover, the validation data set used in this work was sampled mostly at a single growth stage that did not properly represent the seasonal variability of land surface types. The ground measurements limited the validation of the FVC products at other growing stages. Mu et al. [22] showed that the biases between the GEOV1 and reference FVC was observed from 0.051 to 0.219 in the growing season of corn. Ground sampling over the whole growth period is required for cropland and sparsely vegetated areas since they are temporally more variable than other vegetation classes [36].

5. Conclusion

This study presented the performances of the global GEOV1 and regional Australian MODIS FVC products over the Australian continent. Spatial comparison of GEOV1 and Australian MODIS indicated that robust correlations between GEOV1 and Australian MODIS were found over most of the Australian continent, while high RMSE and biases were recorded in the highly vegetated coastal areas. The analysis of the temporal variations showed that these three FVC products generally captured seasonal evolutions with higher values in the wet season and lower values in the dry season. GEOV1 and Australian MODIS presented similar seasonal variations over most biome types with differences in magnitude. Direct validation using the ground FVC measurements showed that GEOV1 and Australian MODIS present similar accuracies across all the biome types. Both FVC products overestimated FVC over OBDF, COS, and MFS, yet underestimated FVC over COG and SV.
The results of this study indicate that several aspects of the FVC products need to be improved. A higher version of the FVC product is necessary for further application. The accuracy of GEOV1 and the Australian MODIS FVC is around 0.1 lower than the expected accuracy of 0.05. Global algorithms could be supplemented by multiple regional algorithms as currently applied for Australian or multiple biome algorithms considering the sensitivity of FVC algorithms to biome types. A global intensive ground measurement of FVC spanning the growing season among different vegetation types is recommended to improve the validation of the FVC products.

Acknowledgments

This study was supported by National High Technology Research and Development Program of China (2012AA120905). The authors would like to acknowledge the custodians of the field data of fractional vegetation cover, the GEOV1 data portal for access to the SPOT-VEGETATION FVC product: http://www.GEOV1.eu/ and the assistance provided by the GEOV1 helpdesk. The authors also acknowledge the provision of of Australian MODIS FVC product. The Australian MODIS FVC product is provided by the AusCover Facility, Terrestrial Ecosystem Research Network: http://data.auscover.org.au/. The authors sincerely thank the reviewers who provided helpful comments of the manuscript.

Author Contributions

Yanling Ding and Kai Zhao designed the study. Yanling Ding wrote the paper. Xingming Zheng and Tao Jiang provided valuable suggestions for the revision.

Conflicts of Interest

The authors declare no conflict of interest.

References

  1. Deardorff, J. W. Efficient prediction of ground temperature and moisture with inclusion of a layer of vegetation. J. Geophys. Res. 1978, 83, 1889–1903. [Google Scholar] [CrossRef]
  2. Godínez-Alvarez, H.; Herrick, J.E.; Mattocks, M.; Toledo, D.; Van Zee, J. Comparison of three vegetation monitoring methods: Their relative utility for ecological assessment and monitoring. Ecol. Indic. 2009, 9, 1001–1008. [Google Scholar] [CrossRef]
  3. Gutman, G.; Ignatov, A. The derivation of the green vegetation fraction from NOAA/AVHRR data for use in numerical weather prediction models. Int. J. Remote Sens. 1998, 19, 1533–1543. [Google Scholar] [CrossRef]
  4. Baret, F.; Pacholczyk, P.; Lacaze, R. BioPar Product User Manual LAI, FAPAR, FCover from AVHRR-LTDR Data. Availabe online: http://web.vgt.vito.be/documents/BioPar/g2-BP-RP-BP053-ProductUserManual-AVHRR-LTDR-I1.00.pdf (accessed on 12 July 2014).
  5. Zeng, X.B.; Dickinson, R.E.; Walker, A.; Shaikh, M.; DeFries, R.S.; Qi, J.G. Derivation and evaluation of global 1-km fractional vegetation cover data for land modeling. J. Appl. Meteorol. 2000, 39, 826–839. [Google Scholar] [CrossRef]
  6. Avissar, R.; Pielke, R.A. A parameterization of heterogeneous land surfaces for atmospheric numerical models and its impact on regional meteorology. Mon. Weather. Rev. 1989, 117, 2113–2136. [Google Scholar] [CrossRef]
  7. Defries, R.S.; Hansen, M.C.; Townshend, J.R.G. Global continuous fields of vegetation characteristics: A linear mixture model applied to multi-year 8 km AVHRR data. Int. J. Remote Sens. 2000, 21, 1389–1414. [Google Scholar] [CrossRef]
  8. Yan, G.; Mu, X.; Liu, Y. Fractional vegetation cover. In Advanced Remote Sensing; Wang, S.L.L., Ed.; Academic Press: Boston, MA, USA, 2012; pp. 415–438. [Google Scholar]
  9. Baret, F.; Hagolle, O.; Geiger, B.; Bicheron, P.; Miras, B.; Huc, M.; Berthelot, B.; Niño, F.; Weiss, M.; Samain, O.; et al. LAI, FAPAR and FCOVER CYCLOPES global products derived from vegetation. Part1: Principles of the algorithm. Remote Sens. Environ. 2007, 110, 275–286. [Google Scholar] [CrossRef] [Green Version]
  10. Baret, F.; Weiss, M.; Lacaze, R.; Camacho, F.; Makhmara, H.; Pacholcyzk, P.; Smets, B. GEOV1: LAI and FAPAR essential climate variables and FCOVER global time series capitalizing over existing products. Part1: Principles of development and production. Remote Sens. Environ. 2013, 137, 299–309. [Google Scholar] [CrossRef]
  11. Leroy, M.; Deuzé, J.L.; Bréon, F.M.; Hautecoeur, O.; Herman, M.; Buriez, J.C.; Tanré, D.; Bouffiès, S.; Chazette, P.; Roujean, J.L. Retrieval of atmospheric properties and surface bidirectional reflectances over land from POLDER/ADEOS. J. Geophys. Res. 1997, 102, 17023. [Google Scholar] [CrossRef]
  12. García-Haro, F.J.; Camacho-de Coca, F.; Meliá, J.; Martínez, B. Operational derivation of vegetation products in the framework of the LSA SAF project. In Proceedings of 2005 EUMETSAT Meteorological Satellite Conference, Dubrovnik, Croatia, 19–23 September 2005.
  13. Baret, F.; Pavageau, K.; Beal, D.; Weiss, M.; Barthelot, B.; Regner, P. Algorithm Theoretical Basis Document for MERIS Top of Atmosphere Land Products (TOA_VEG). Available online: https://www.researchgate.net/publication/254947377_Algorithm_Theoretical_Basis_Document_for_MERIS_Top_of_Atmosphere_Land_Products_%28TOA_VEG%29 (accessed on 12 June 2014).
  14. Tian, Y.H.; Woodcock, C.E.; Wang, Y.J.; Privette, J.L.; Shabanov, N.V.; Zhou, L.M.; Zhang, Y.; Buermann, W.; Dong, J.R.; Veikkanen, B.; et al. Multiscale analysis and validation of the MODISLAI product I. Uncertainty assessment. Remote Sens. Environ. 2002, 83, 414–430. [Google Scholar] [CrossRef]
  15. Weiss, M.; Baret, F.; Garrigues, S.; Lacaze, R. LAI and fAPAR CYCLOPES global products derived from VEGETATION. Part 2: Validation and comparison with MODIS collection 4 products. Remote Sens. Environ. 2007, 110, 317–331. [Google Scholar] [CrossRef]
  16. Garrigues, S.; Lacaze, R.; Baret, F.; Morisette, J.T.; Weiss, M.; Nickeson, J.E.; Fernandes, R.; Plummer, S.; Shabanov, N.V.; Myneni, R.B.; et al. Validation and intercomparison of global leaf area index products derived from remote sensing data. J. Geophys. Res. 2008, 113, 1–20. [Google Scholar]
  17. Fang, H.L.; Wei, S.S.; Liang, S.L. Validation of MODIS and CYCLOPESLAI products using global field measurement data. Remote Sens. Environ. 2012, 119, 43–54. [Google Scholar] [CrossRef]
  18. Pickett-Heaps, C.A.; Canadell, J.G.; Briggs, P.R.; Gobron, N.; Haverd, V.; Paget, M.J.; Pinty, B.; Raupach, M.R. Evaluation of six satellite-derived fraction of absorbed photosynthetic active radiation (fAPAR) products across the Australian continent. Remote Sens. Environ. 2014, 140, 241–256. [Google Scholar] [CrossRef]
  19. Camacho, F.; Cernicharo, J.; Garcia-Haro, J.; Verger, A.; Melia, J. Consistency assessment of FVC and LAI operational products over Africa. In Proceedings of the 3rd International Symposium on Recent Advances in Quantitative Remote Sensing, Torrent (Valencia), Spain, 27 September–1 October 2010; pp. 694–699.
  20. Camacho, F.; Cernicharo, J.; Lacaze, R.; Baret, F.; Weiss, M. GEOV1: LAI, FAPAR essential climate variables and FCOVER global time series capitalizing over existing products. Part 2: Validation and intercomparison with reference products. Remote Sens. Environ. 2013, 137, 310–329. [Google Scholar] [CrossRef]
  21. Fillol, E.; Baret, F.; Weiss, M.; Dedieu, G.; Demarez, V.; Gouaux, P.; Ducrot, D. Cover fraction estimation from high resolution SPOT HRV & HRG and medium resolution SPOT-VEGETATION sensors: Validation and comparison over Southwest France. Available online: http://postel.obs-mip.fr/IMG/pdf/Fillol-et-al-2006_RAQRS.pdf (accessed on 22 November 2013).
  22. Mu, X.H.; Huang, S.; Ren, H.Z.; Yan, G.J.; Song, W.J.; Ruan, G.Y. Validating GEOV1 fractional vegetation cover derived from coarse-resolution remote sensing images over croplands. IEEE J. Sel. Top. Appl. Earth Obs. Remote Sens. 2014, 8, 439–446. [Google Scholar] [CrossRef]
  23. Bacour, C.; Baret, F.; Béal, D.; Weiss, M.; Pavageau, K. Neural network estimation of LAI, fAPAR, fCOVER and LAI×Cab, from top of canopy MERIS reflectance data: Principles and validation. Remote Sens. Environ. 2006, 105, 313–325. [Google Scholar] [CrossRef]
  24. Baret, F.; Weiss, M.; Allard, D.; Garrigue, S.; Leroym, M.; Jeanjean, H.; Fernandes, R.; Myneni, R.; Privette, J.; Morisette, J.; et al. VALERI: A network of sites and a methodology for the validation of medium spatial resolution land satellite products. Available online: http://w3.avignon.inra.fr/valeri/documents/VALERI-RSESubmitted.pdf (accessed on 6 June 2012).
  25. Guan, K.; Wood, E.F.; Caylor, K.K. Multi-sensor derivation of regional vegetation fractional cover in Africa. Remote Sens. Environ. 2012, 124, 653–665. [Google Scholar] [CrossRef]
  26. Guerschman, J.P.; Hill, M.J.; Renzullo, L.J.; Barrett, D.J.; Marks, A.S.; Botha, E.J. Estimating fractional cover of photosynthetic vegetation, non-photosynthetic vegetation and bare soil in the Australian tropical savanna region upscaling the EO-1 Hyperion and MODIS sensors. Remote Sens. Environ. 2009, 113, 928–945. [Google Scholar] [CrossRef]
  27. Fang, H.L.; Jiang, C.Y.; Li, W.J.; Wei, S.S.; Baret, F.; Chen, J.M.; Garcia-Haro, J.; Liang, S.L.; Liu, R.G.; Myneni, R.B. Characterization and intercomparison of global moderate resolution leaf area index (LAI) products: Analysis of climatologies and theoretical uncertainties. J. Geophys. Res. 2013, 118, 1–20. [Google Scholar]
  28. Muir, J.; Schmidt, M.; Tindall, D.; Trevithick, R.; Scarth, P.; Stewart, J.B. Field Measurement of Fractional Ground Cover: A Technical Handbook Supporting Ground Cover Monitoring for Australia. Available online: http://adl.brs.gov.au/data/warehouse/pe_hbgcm9abll07701/HndbkGrndCovMontring2011_1.0.0_LR.pdf (accessed on 15 May 2014).
  29. National Land and Water Resources Audit. Australian Agriculture Assessment 2001. Available online: http://lwa.gov.au/files/products/national-land-and-water-resources-audit/pr010238/pr010238.pdf (accessed on 29 March 2014).
  30. Arino, O.; Leroy, M.; Ranera, F.; Gross, D.; Bicheron, P.; Nino, F.; Brockman, C.; Defourny, P.; Vancutsem, C.; Achard, F. Globcover: ESA service for global land cover from MERIS. In Proceedings of 2007 IEEE International Geoscience and Remote Sensing Symposium (IGARSS 2007), Barcelona, Spain, 23–28 July 2007; pp. 2412–2415.
  31. Brocca, L.; Hasenauer, S.; Lacava, T.; Melone, F.; Moramarco, T.; Wagner, W.; Dorigo, W.; Matgen, P.; Martinez-Fernandez, J.; Lionres, P.; et al. Soil moisture estimation through ASCAT and AMSR-E sensors: An intercomparison and validation study across Europe. Remote Sens. Environ. 2011, 115, 3390–3408. [Google Scholar] [CrossRef]
  32. Gutmann, E.D.; Small, E.E. A comparison of land surface model soil hydraulic properties estimated by inverse modeling and pedotransfer functions. Water Resour. Res. 2007, 43, 1–13. [Google Scholar] [CrossRef] [PubMed]
  33. Betts, A.K. Assessment of the land surface and boundary layer models in two operational versions of the NCEP Eta model using FIFE data. Mon. Weather. Rev. 1997, 125, 2896–2916. [Google Scholar] [CrossRef]
  34. Chen, J.M.; Pavlic, G.; Brown, L.; Cihlar, J.; Leblanc, S.G.; White, H.P.; Hall, R.J.; Peddle, D.R.; King, D.J.; Trofymow, J.A.; et al. Derivation and validation of Canada-wide coarse-resolution leaf area index maps using high-resolution satellite imagery and ground measurements. Remote Sens. Environ. 2002, 80, 165–184. [Google Scholar] [CrossRef]
  35. Morisette, J.T.; Baret., F.; Privette, J.L.; Myneni, R.B.; Nickeson, J.E.; Garrigues, S.; Shabanov, N.V.; Weiss, M.; Fernandes, R.A.; Leblanc, S.G.; et al. Validation of global moderate-resolution LAI products: A framework proposed within the CEOS land product validation subgroup. IEEE Trans. Geosci. Remote Sens. 2006, 44, 1804–1817. [Google Scholar] [CrossRef]
  36. Garrigues, S.; Allard, D.; Baret, F.; Weiss, M. Quantifying spatial heterogeneity at the landscape scale using variogram models. Remote Sens. Environ. 2006, 103, 81–96. [Google Scholar] [CrossRef]

