
Object-Based Flood Mapping and Affected Rice Field Estimation with Landsat 8 OLI and MODIS Data


Abstract
:
1. Introduction
2. Study Area and Data
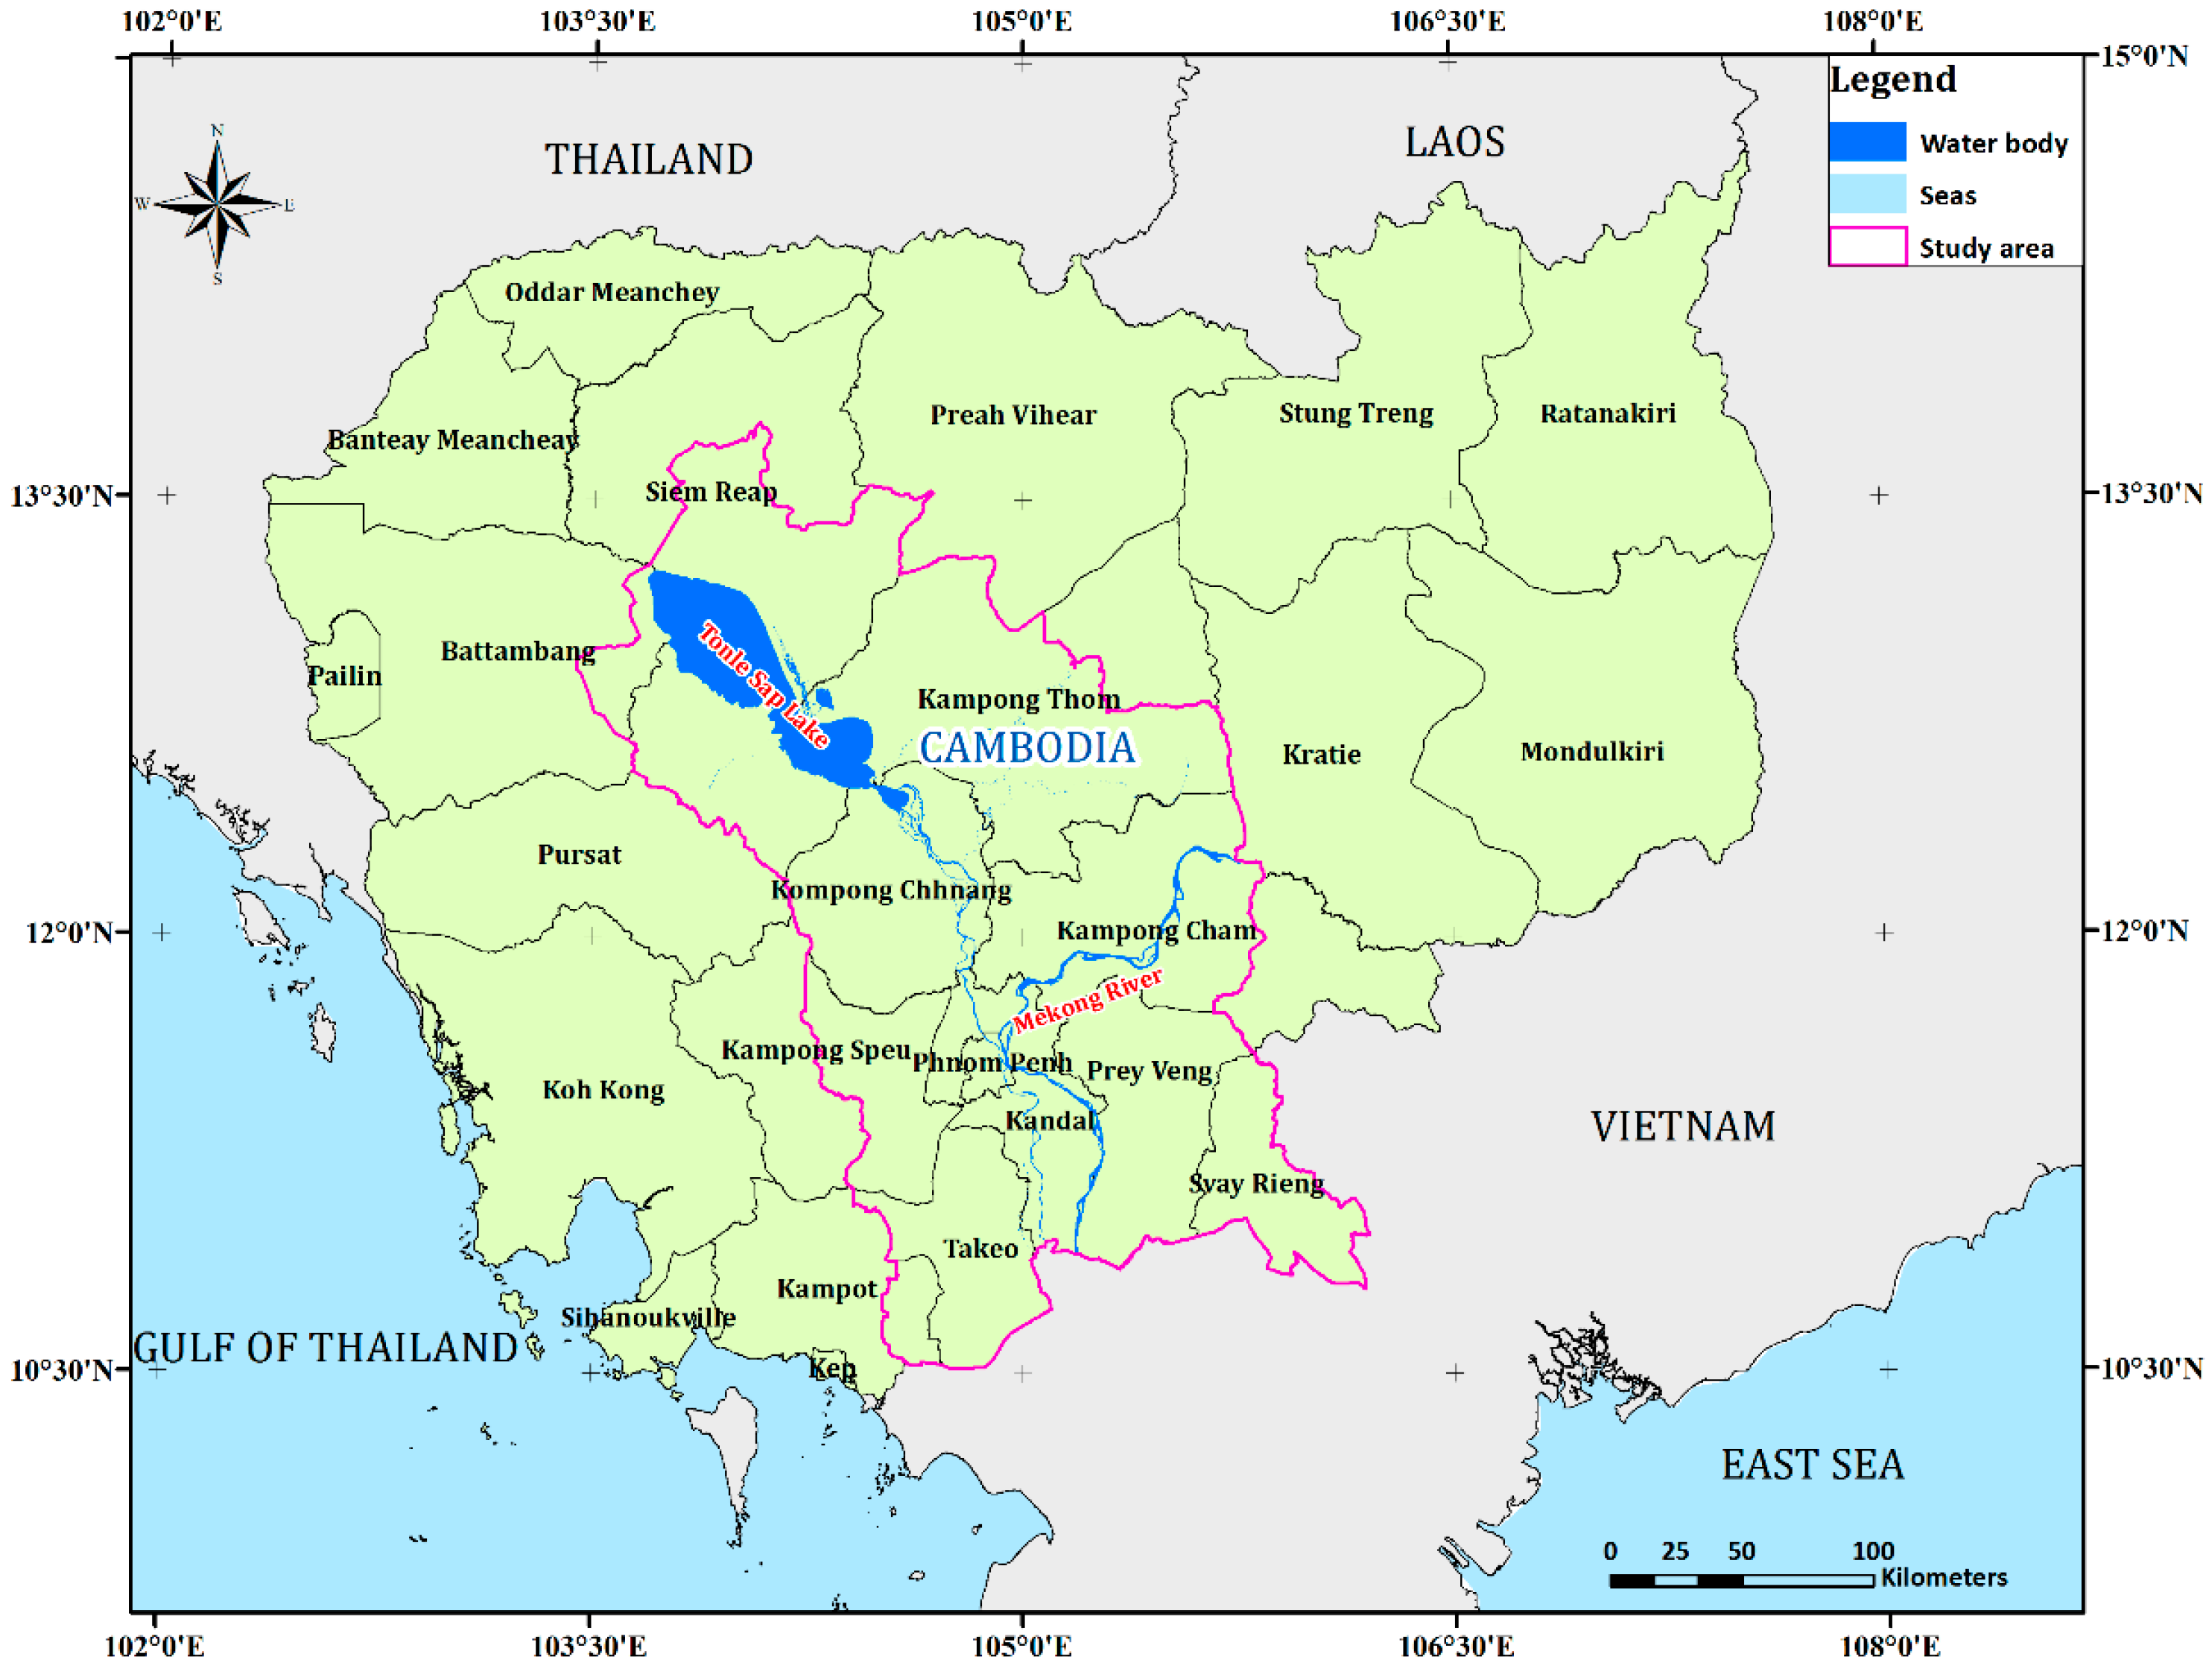
2.1. Study Area
2.2. Data
2.2.1. Landsat 8 OLI Imagery

| No. | Pre-Flood Image | Acquisition Date | Post-Flood Image | Acquisition Date |
|---|---|---|---|---|
| 1 | LC81260512013137LGN01 | 17 May 2013 | LC81260512013297LGN00 | 24 October 2013 |
| 2 | LC81260522013137LGN01 | 17 May 2013 | LC81260522013297LGN00 | 24 October 2013 |
| 3 | LC81260532013137LGN01 | 17 May 2013 | LC81260532013297LGN00 | 24 October 2013 |
| 4 | LC81250522013146LGN00 | 26 May 2013 | LC81270512013304LGN00 | 31 October 2013 |
| 5 | LC81270512013160LGN00 | 9 June 2013 | LC81250522013306LGN00 | 2 November 2013 |
| 6 | LC81270512013176LGN00 | 25 June 2013 | LC81250532013306LGN00 | 2 November 2013 |
| 7 | LC81250522013178LGN01 | 27 June 2013 | -- | -- |
2.2.2. MODIS Vegetation Index Product
2.2.3. Ancillary Data
| No. | Province | Commune | Ratio | Rice Area (ha) |
|---|---|---|---|---|
| 1 | Prey Veng | Preaek Changkran | 30.90 | 238.65 |
| 2 | Prey Veng | Pnov Ti Muoy | 55.48 | 1973.55 |
| 3 | Prey Veng | Rumlech | 89.46 | 2772.24 |
| 4 | Prey Veng | Lve | 49.89 | 866.41 |
| 5 | Prey Veng | Chrey Khmum | 95.61 | 3569.07 |
| 117 | Svay Rieng | Doung | 57.82 | 3200.66 |
| 118 | Svay Rieng | Trapeang Sdau | 76.27 | 4275.11 |
| 119 | Svay Rieng | Angk Prasrae | 84.03 | 2538.65 |
| 120 | Svay Rieng | Chantrei | 75.17 | 2090.40 |
| 196 | Svay Rieng | Thmei | 87.83 | 3502.71 |
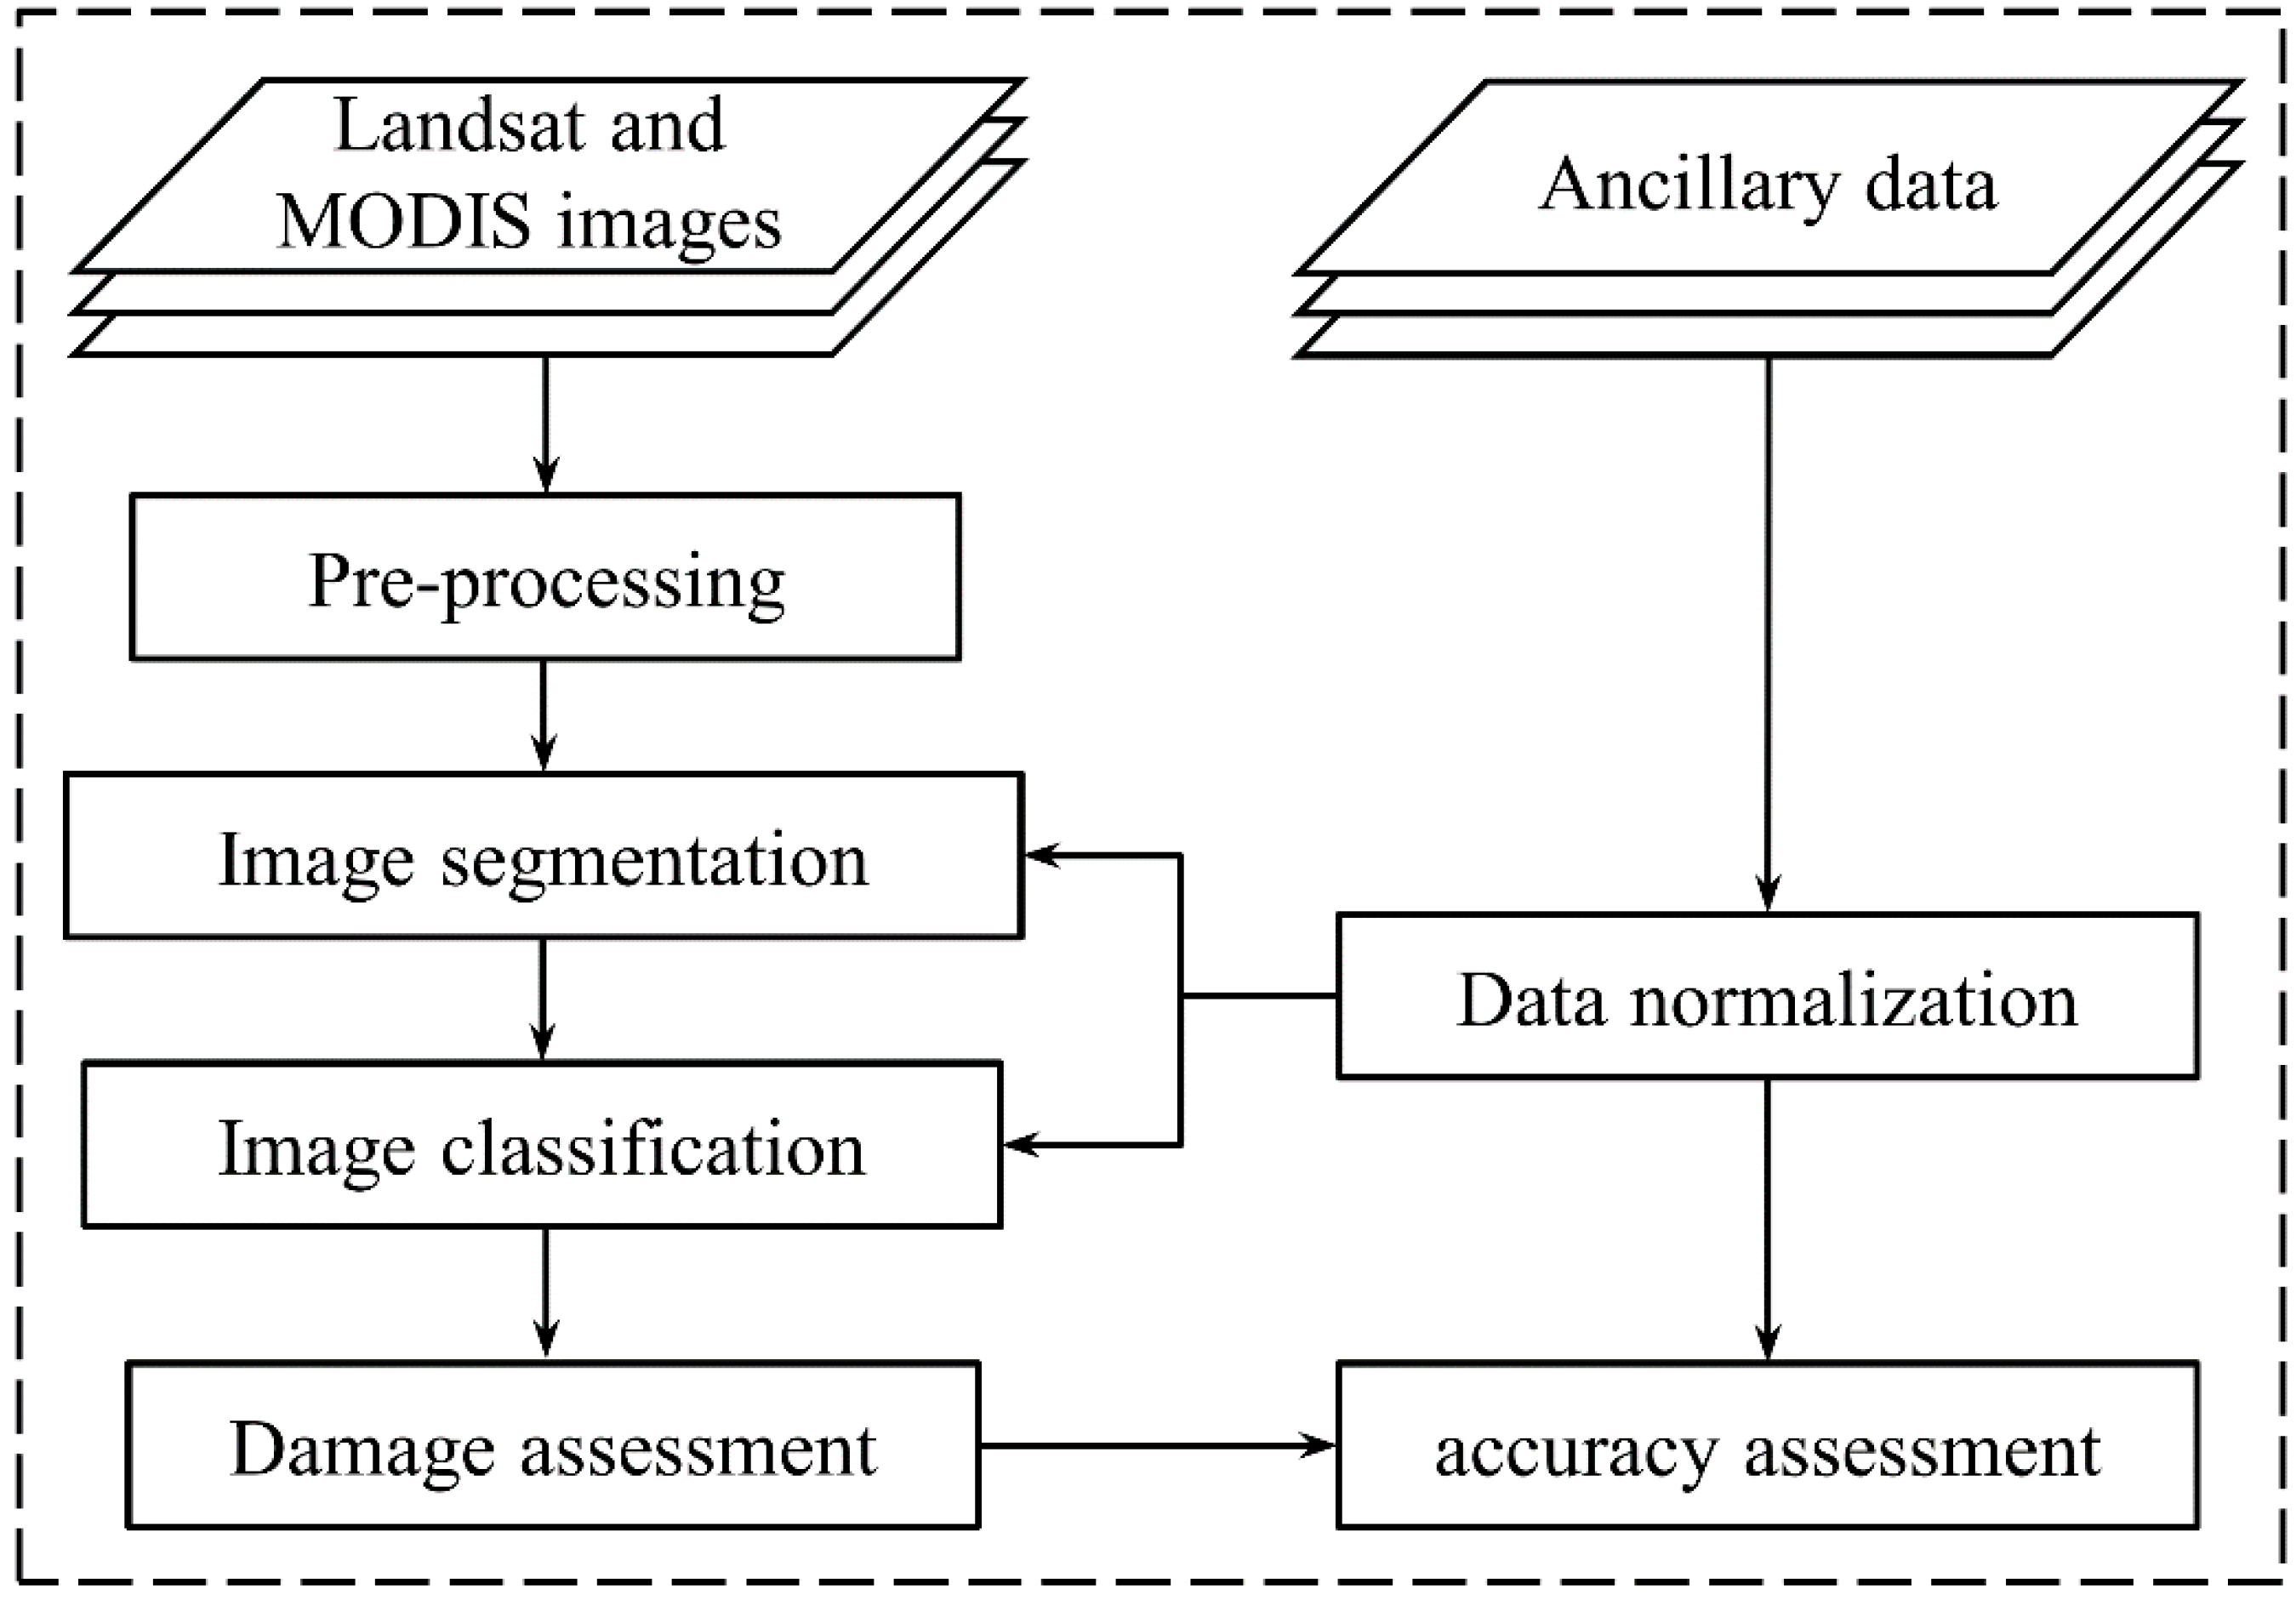
3. Methodology
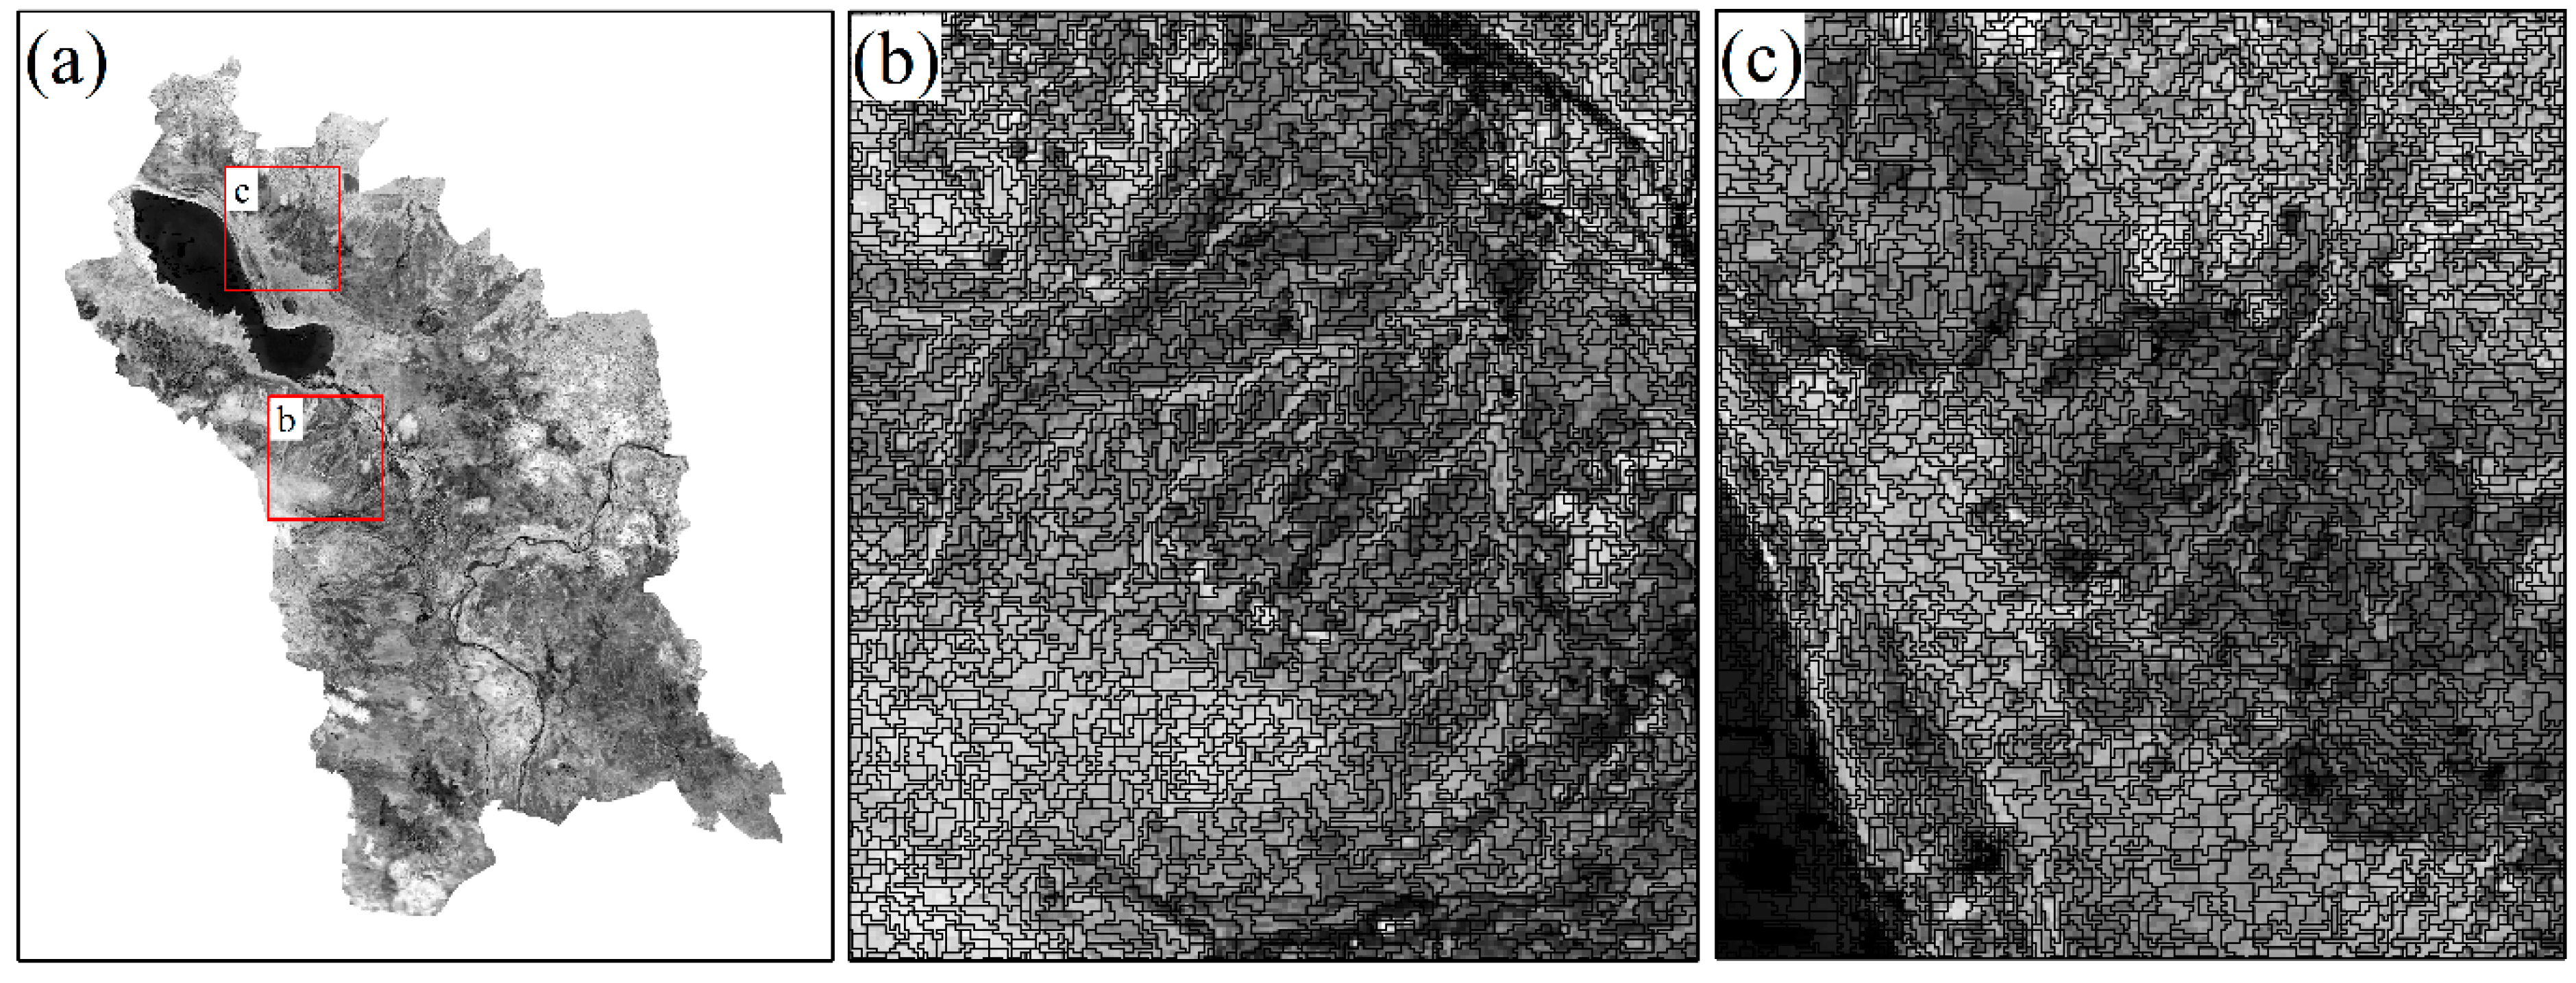
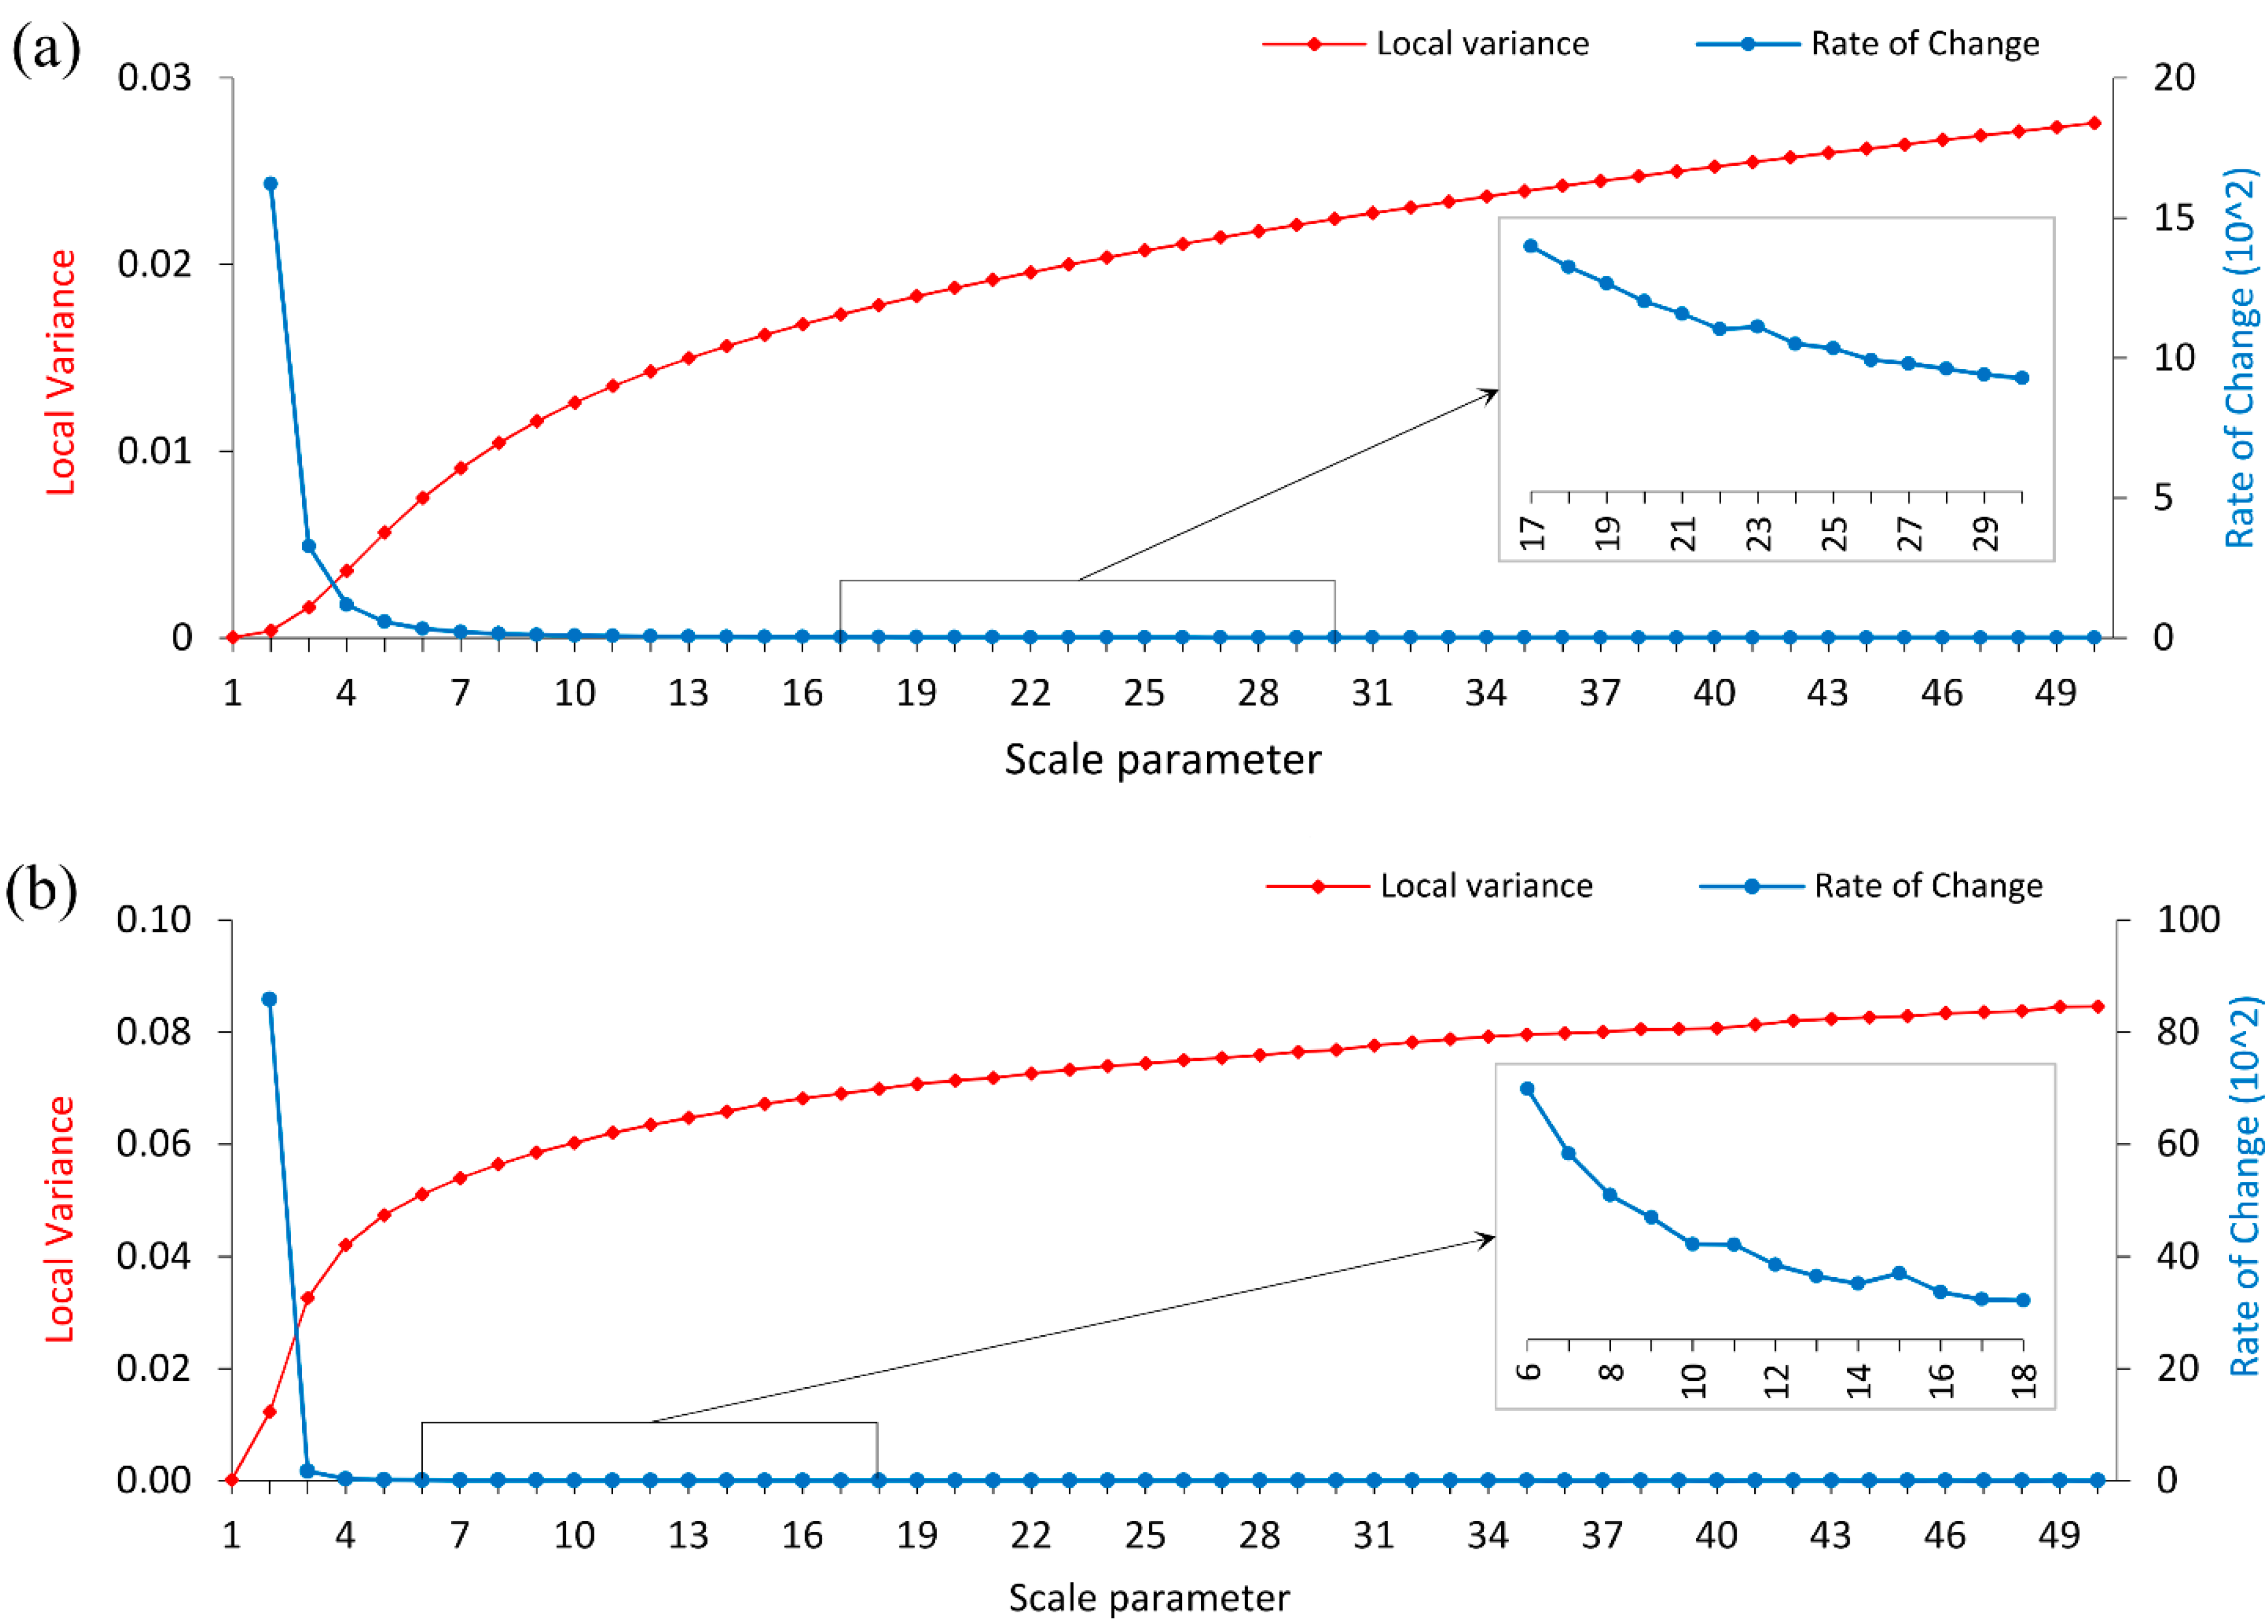
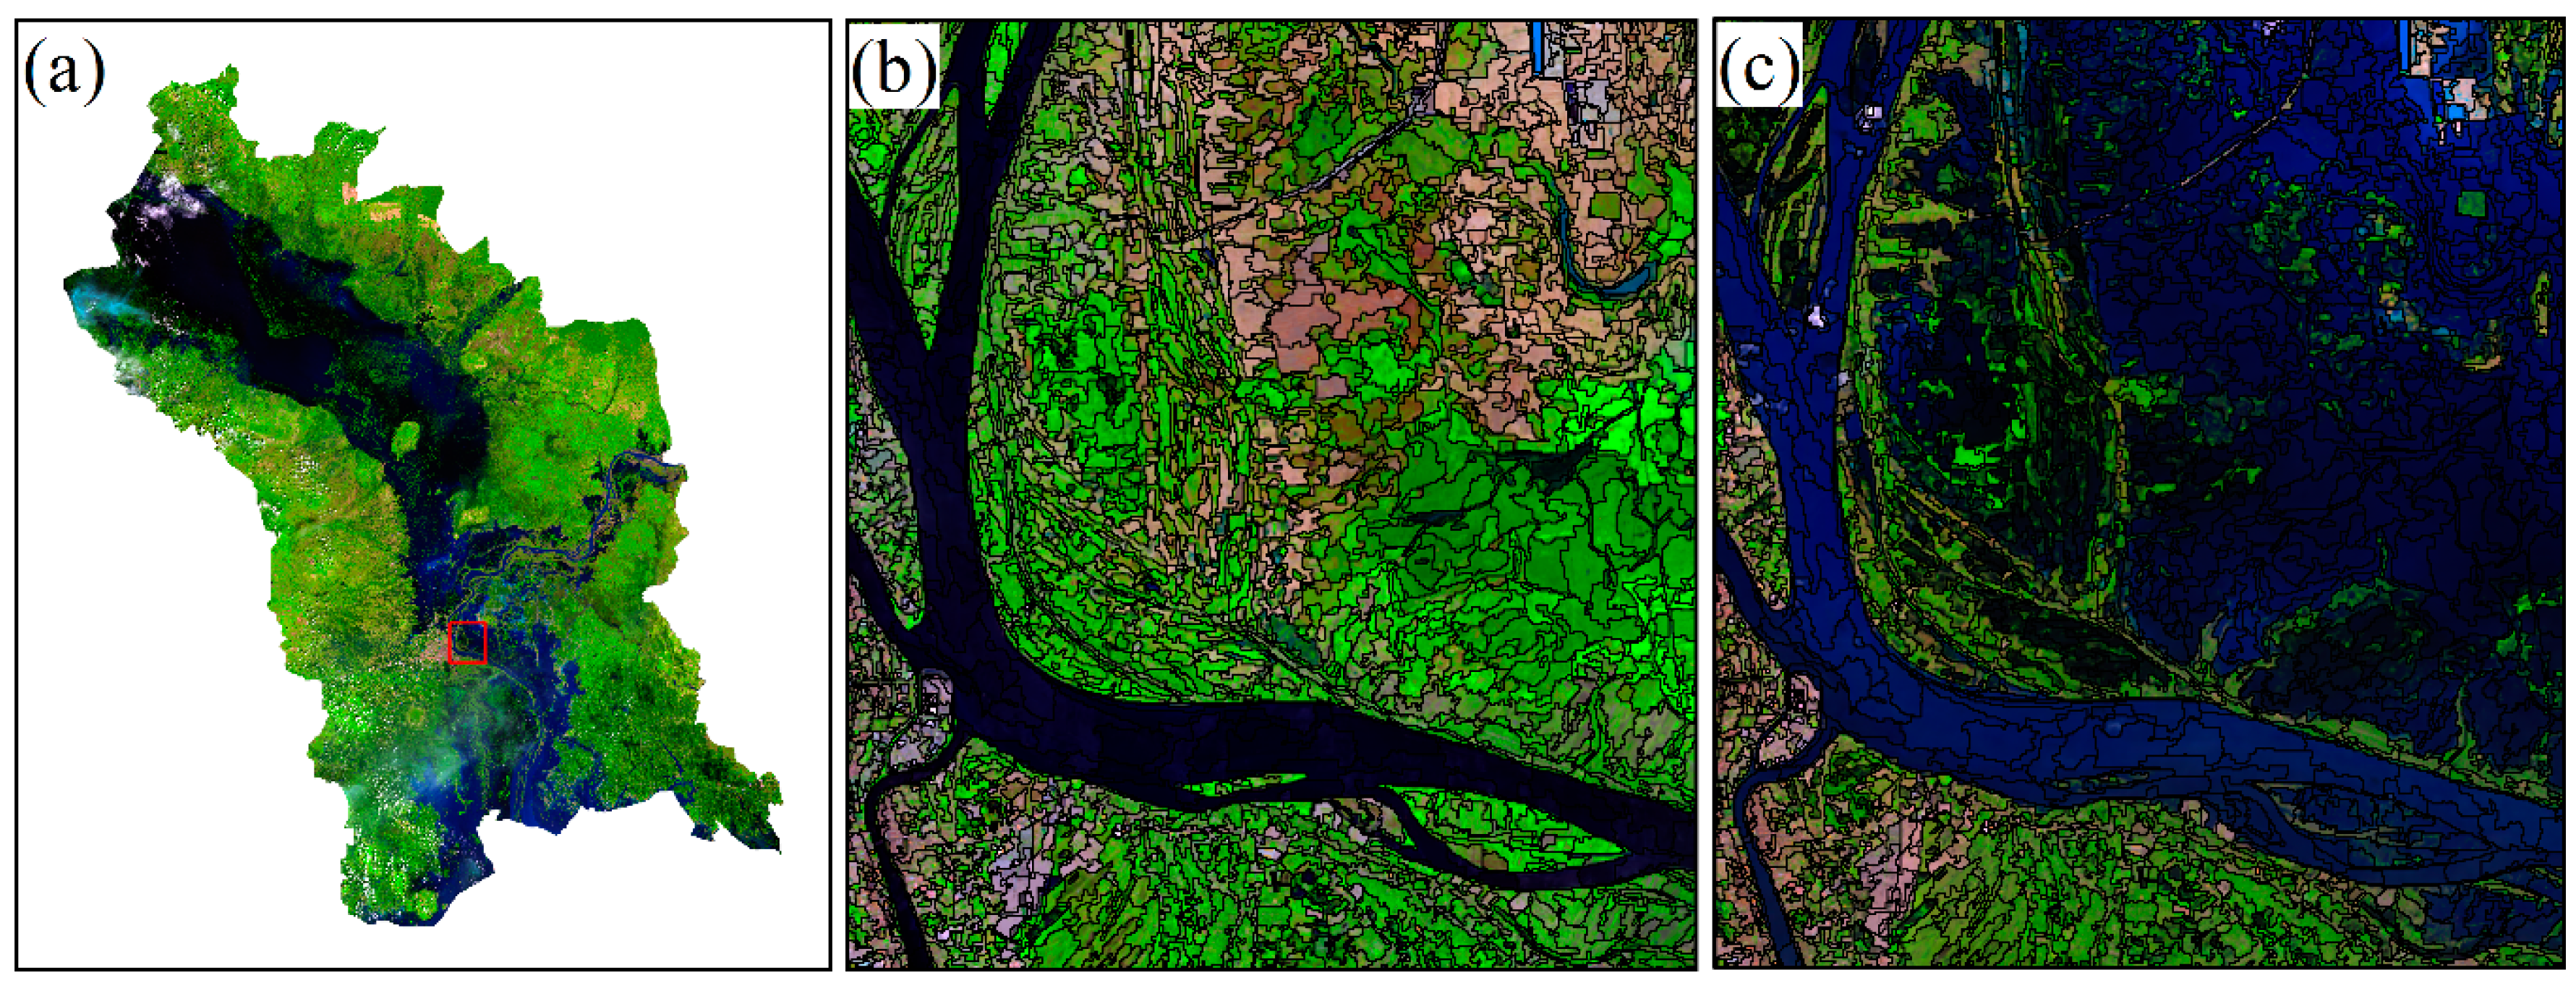
3.1. Image Segmentation
3.2. Image Classification
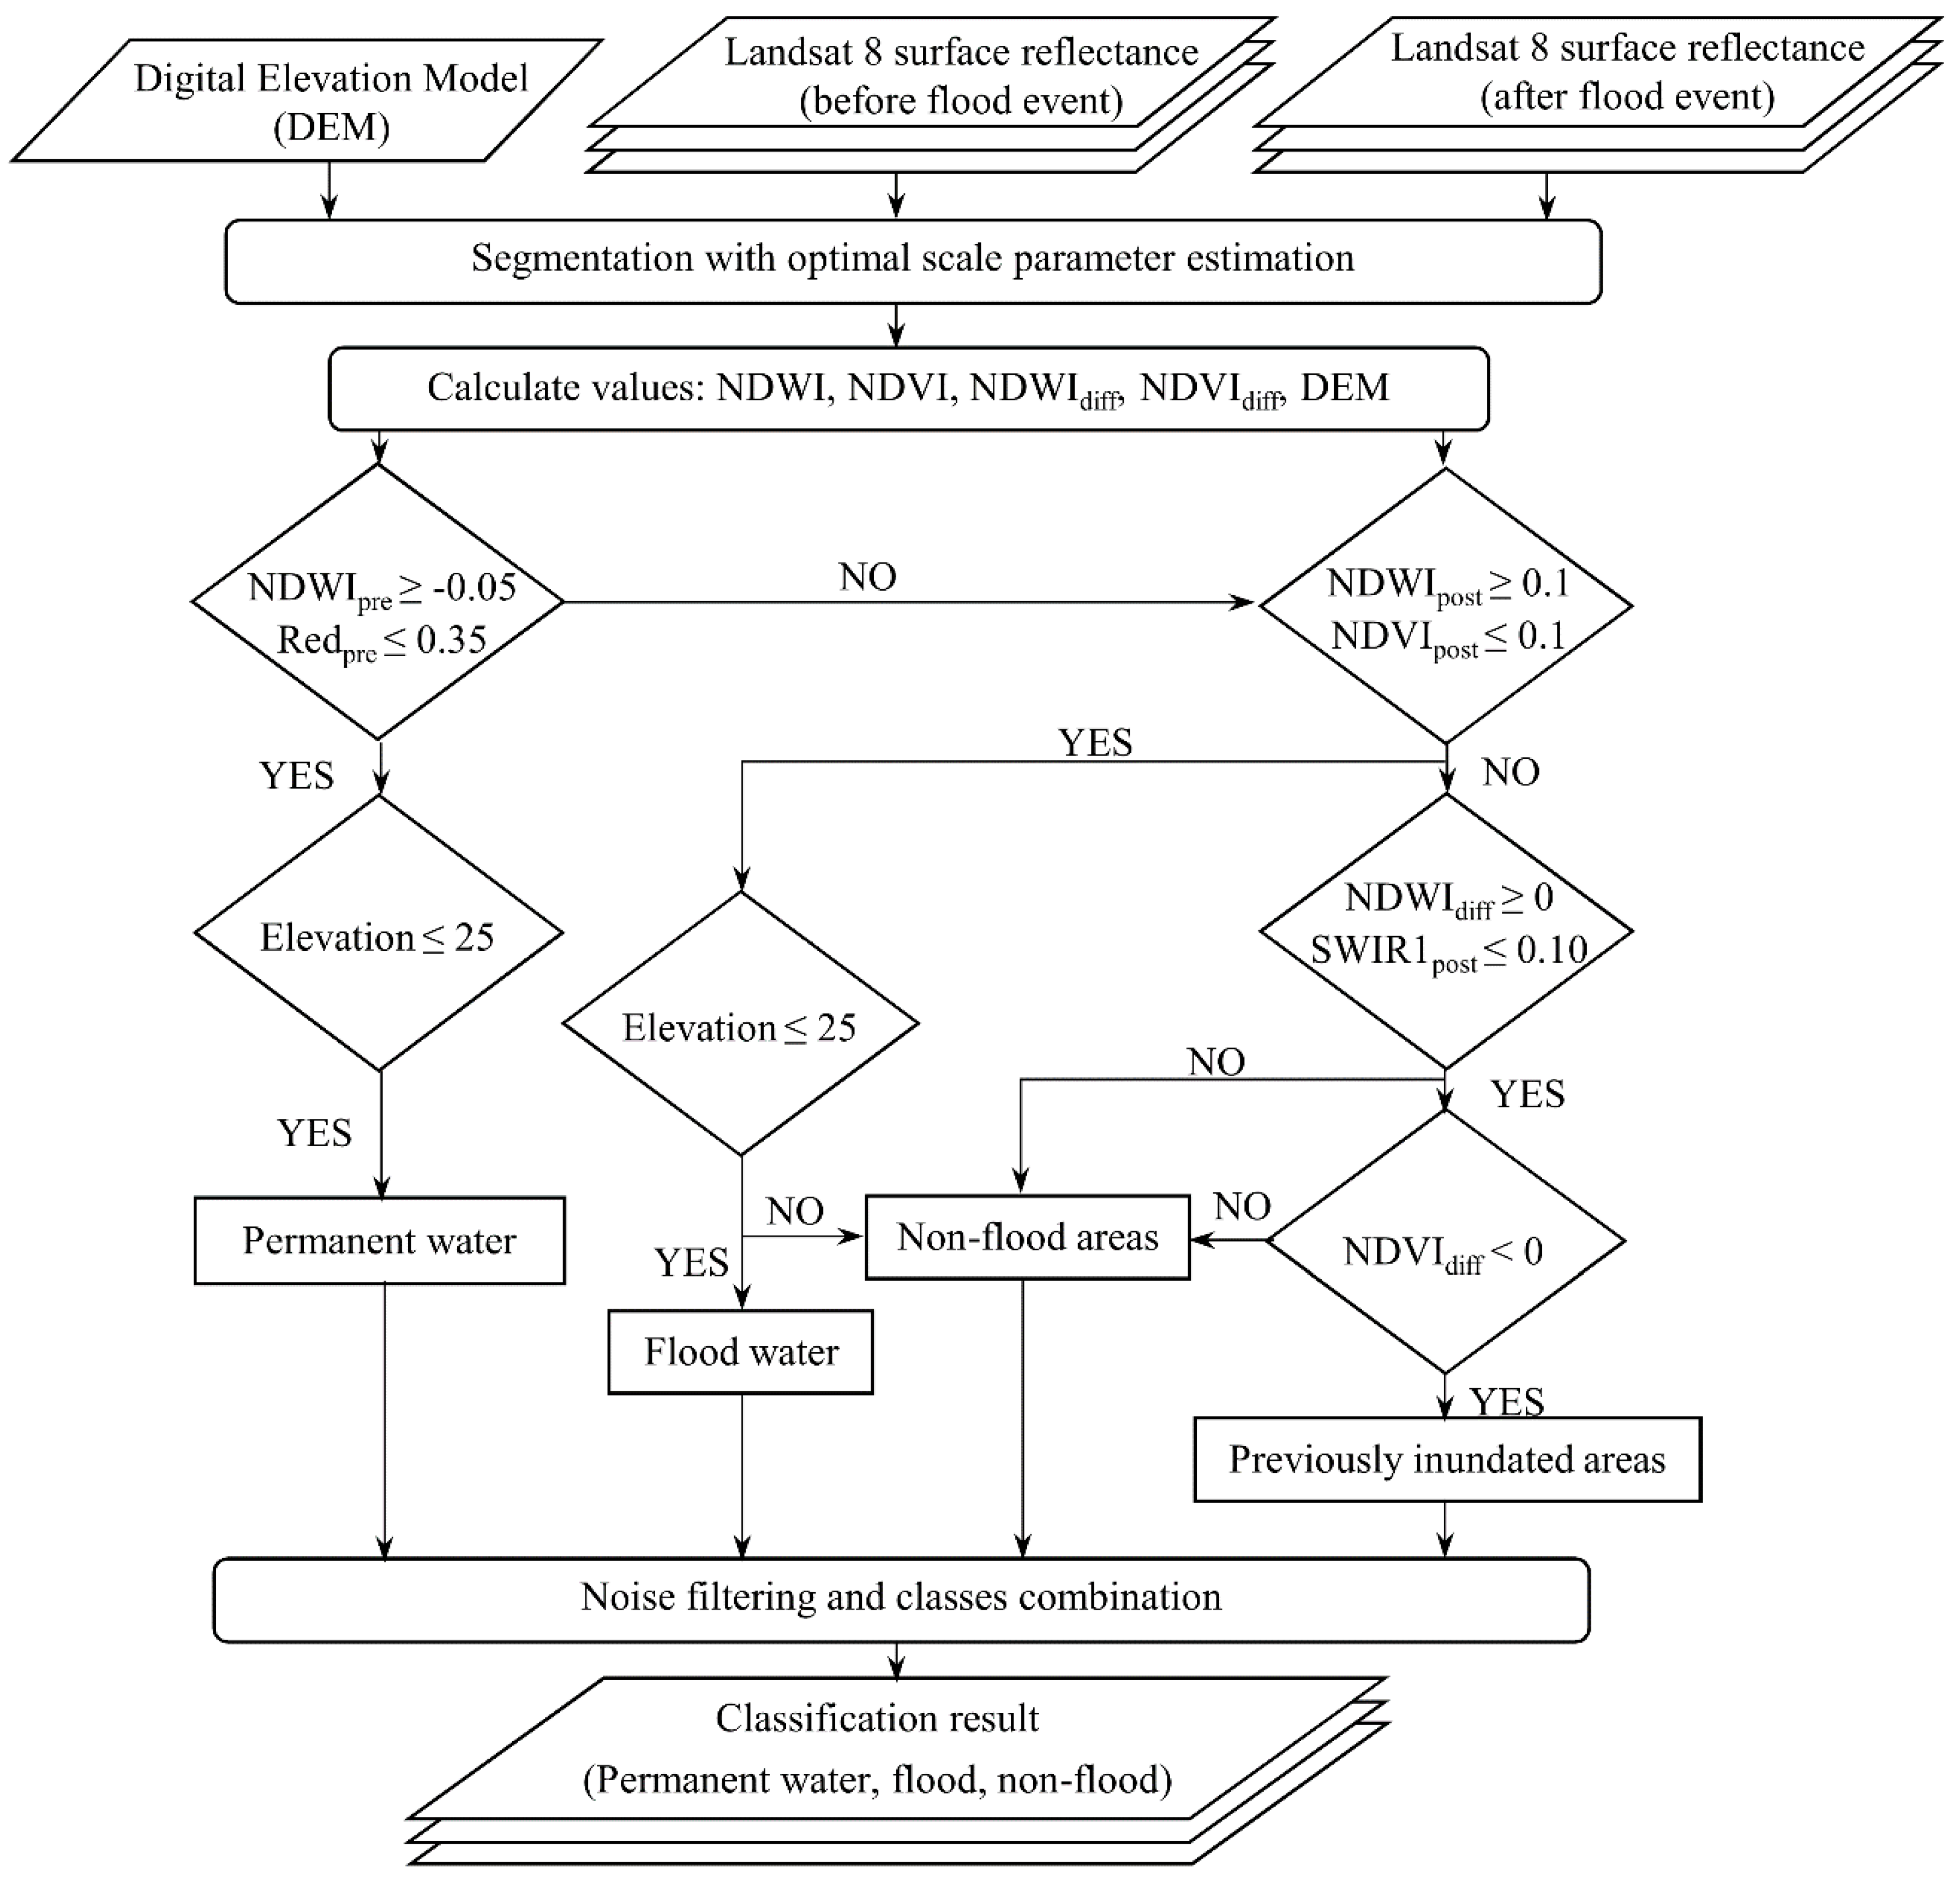
3.2.1. Flood Extent Identification
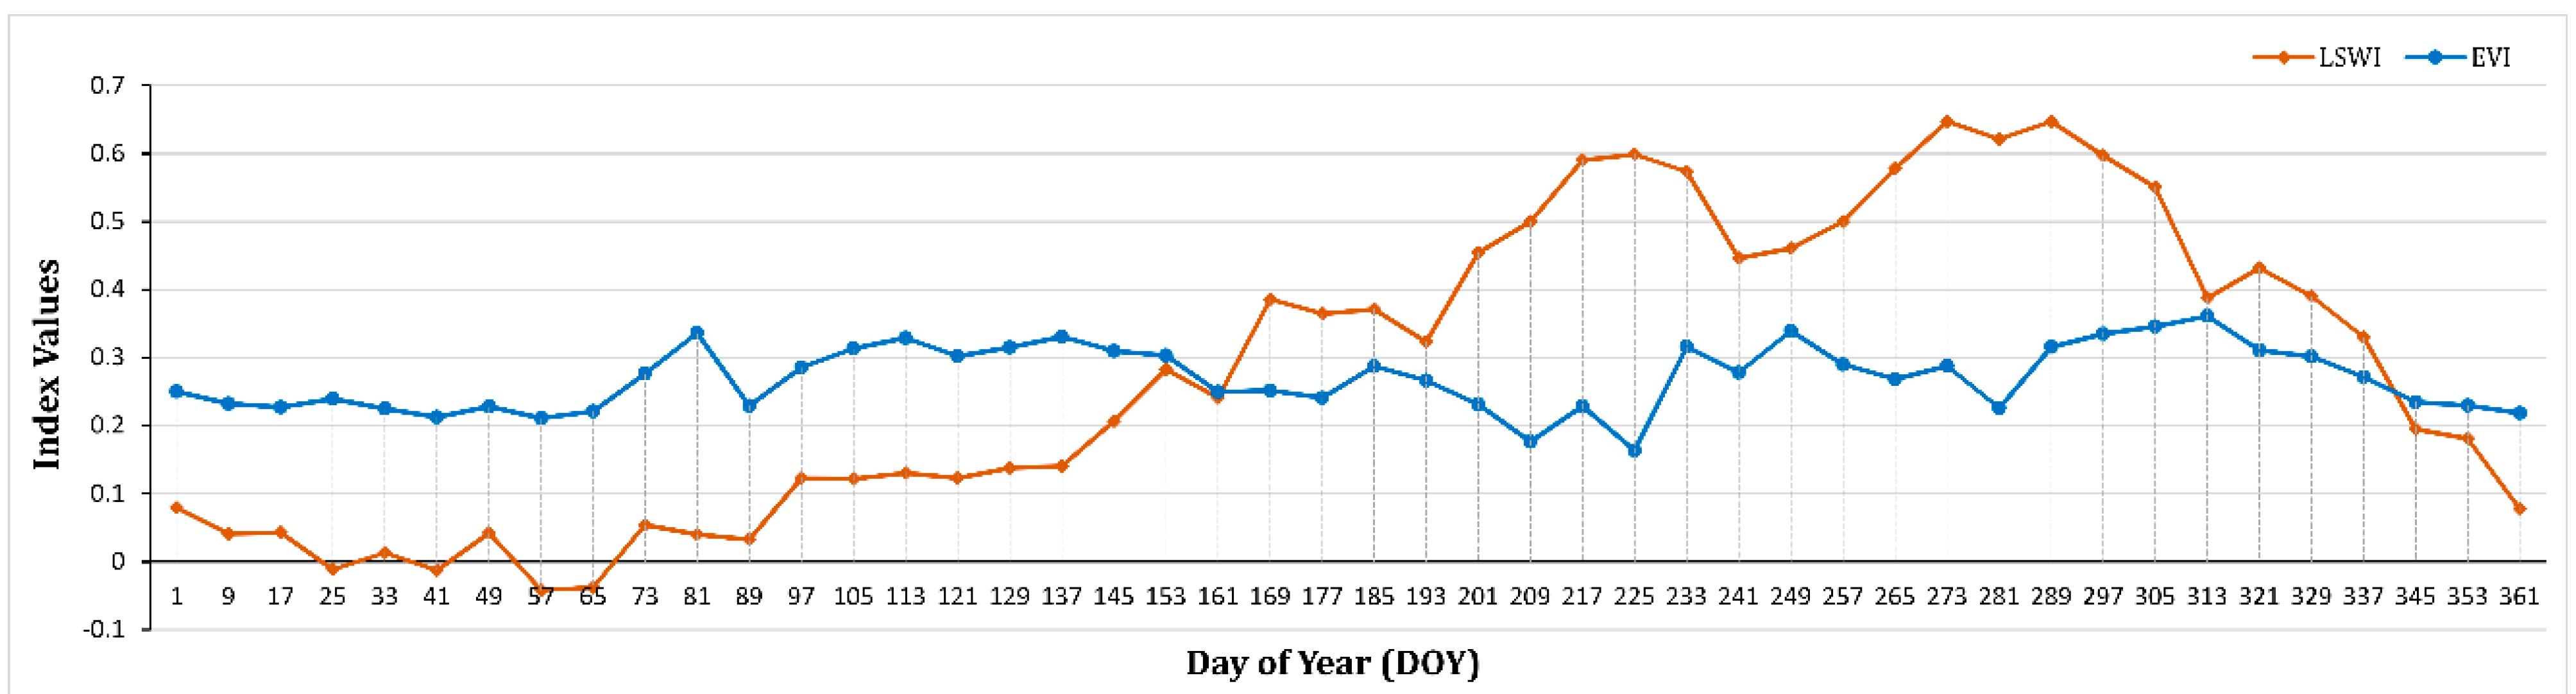
3.2.2. Paddy Rice Detection
3.3. Affected Rice Field Estimation
4. Results and Discussion
4.1. Image Segmentation

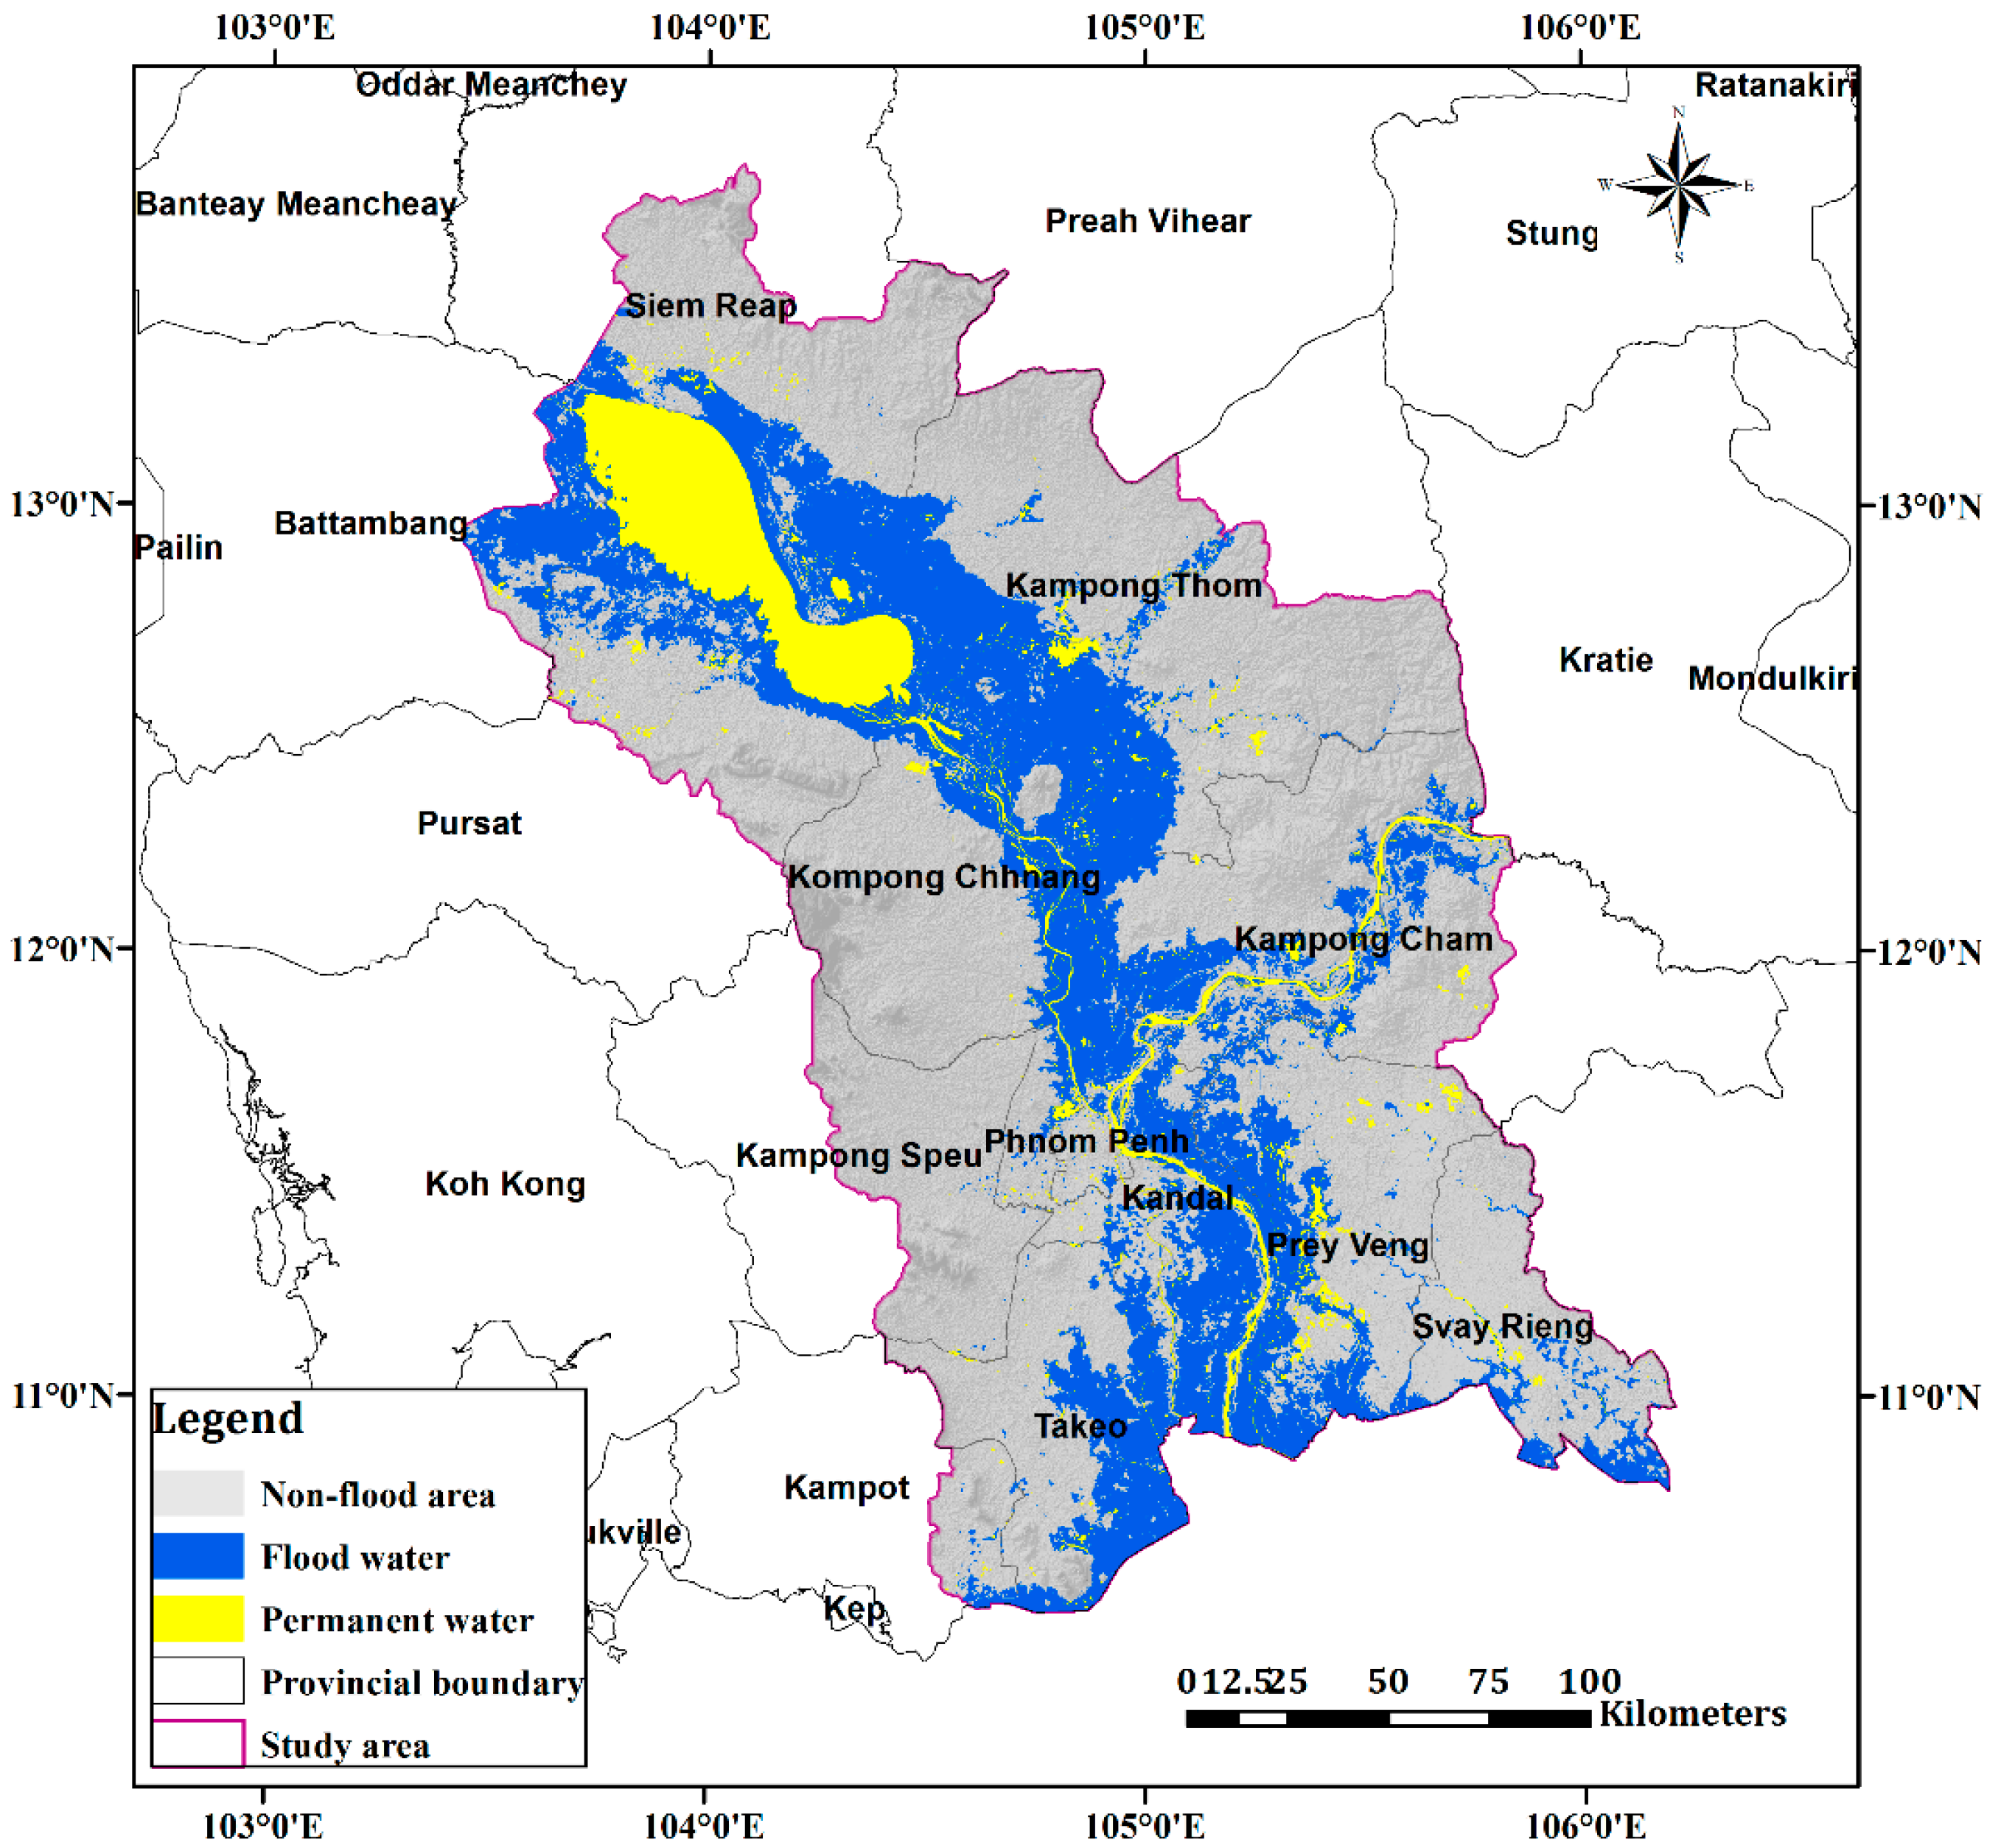
4.2. Flood Extent Map

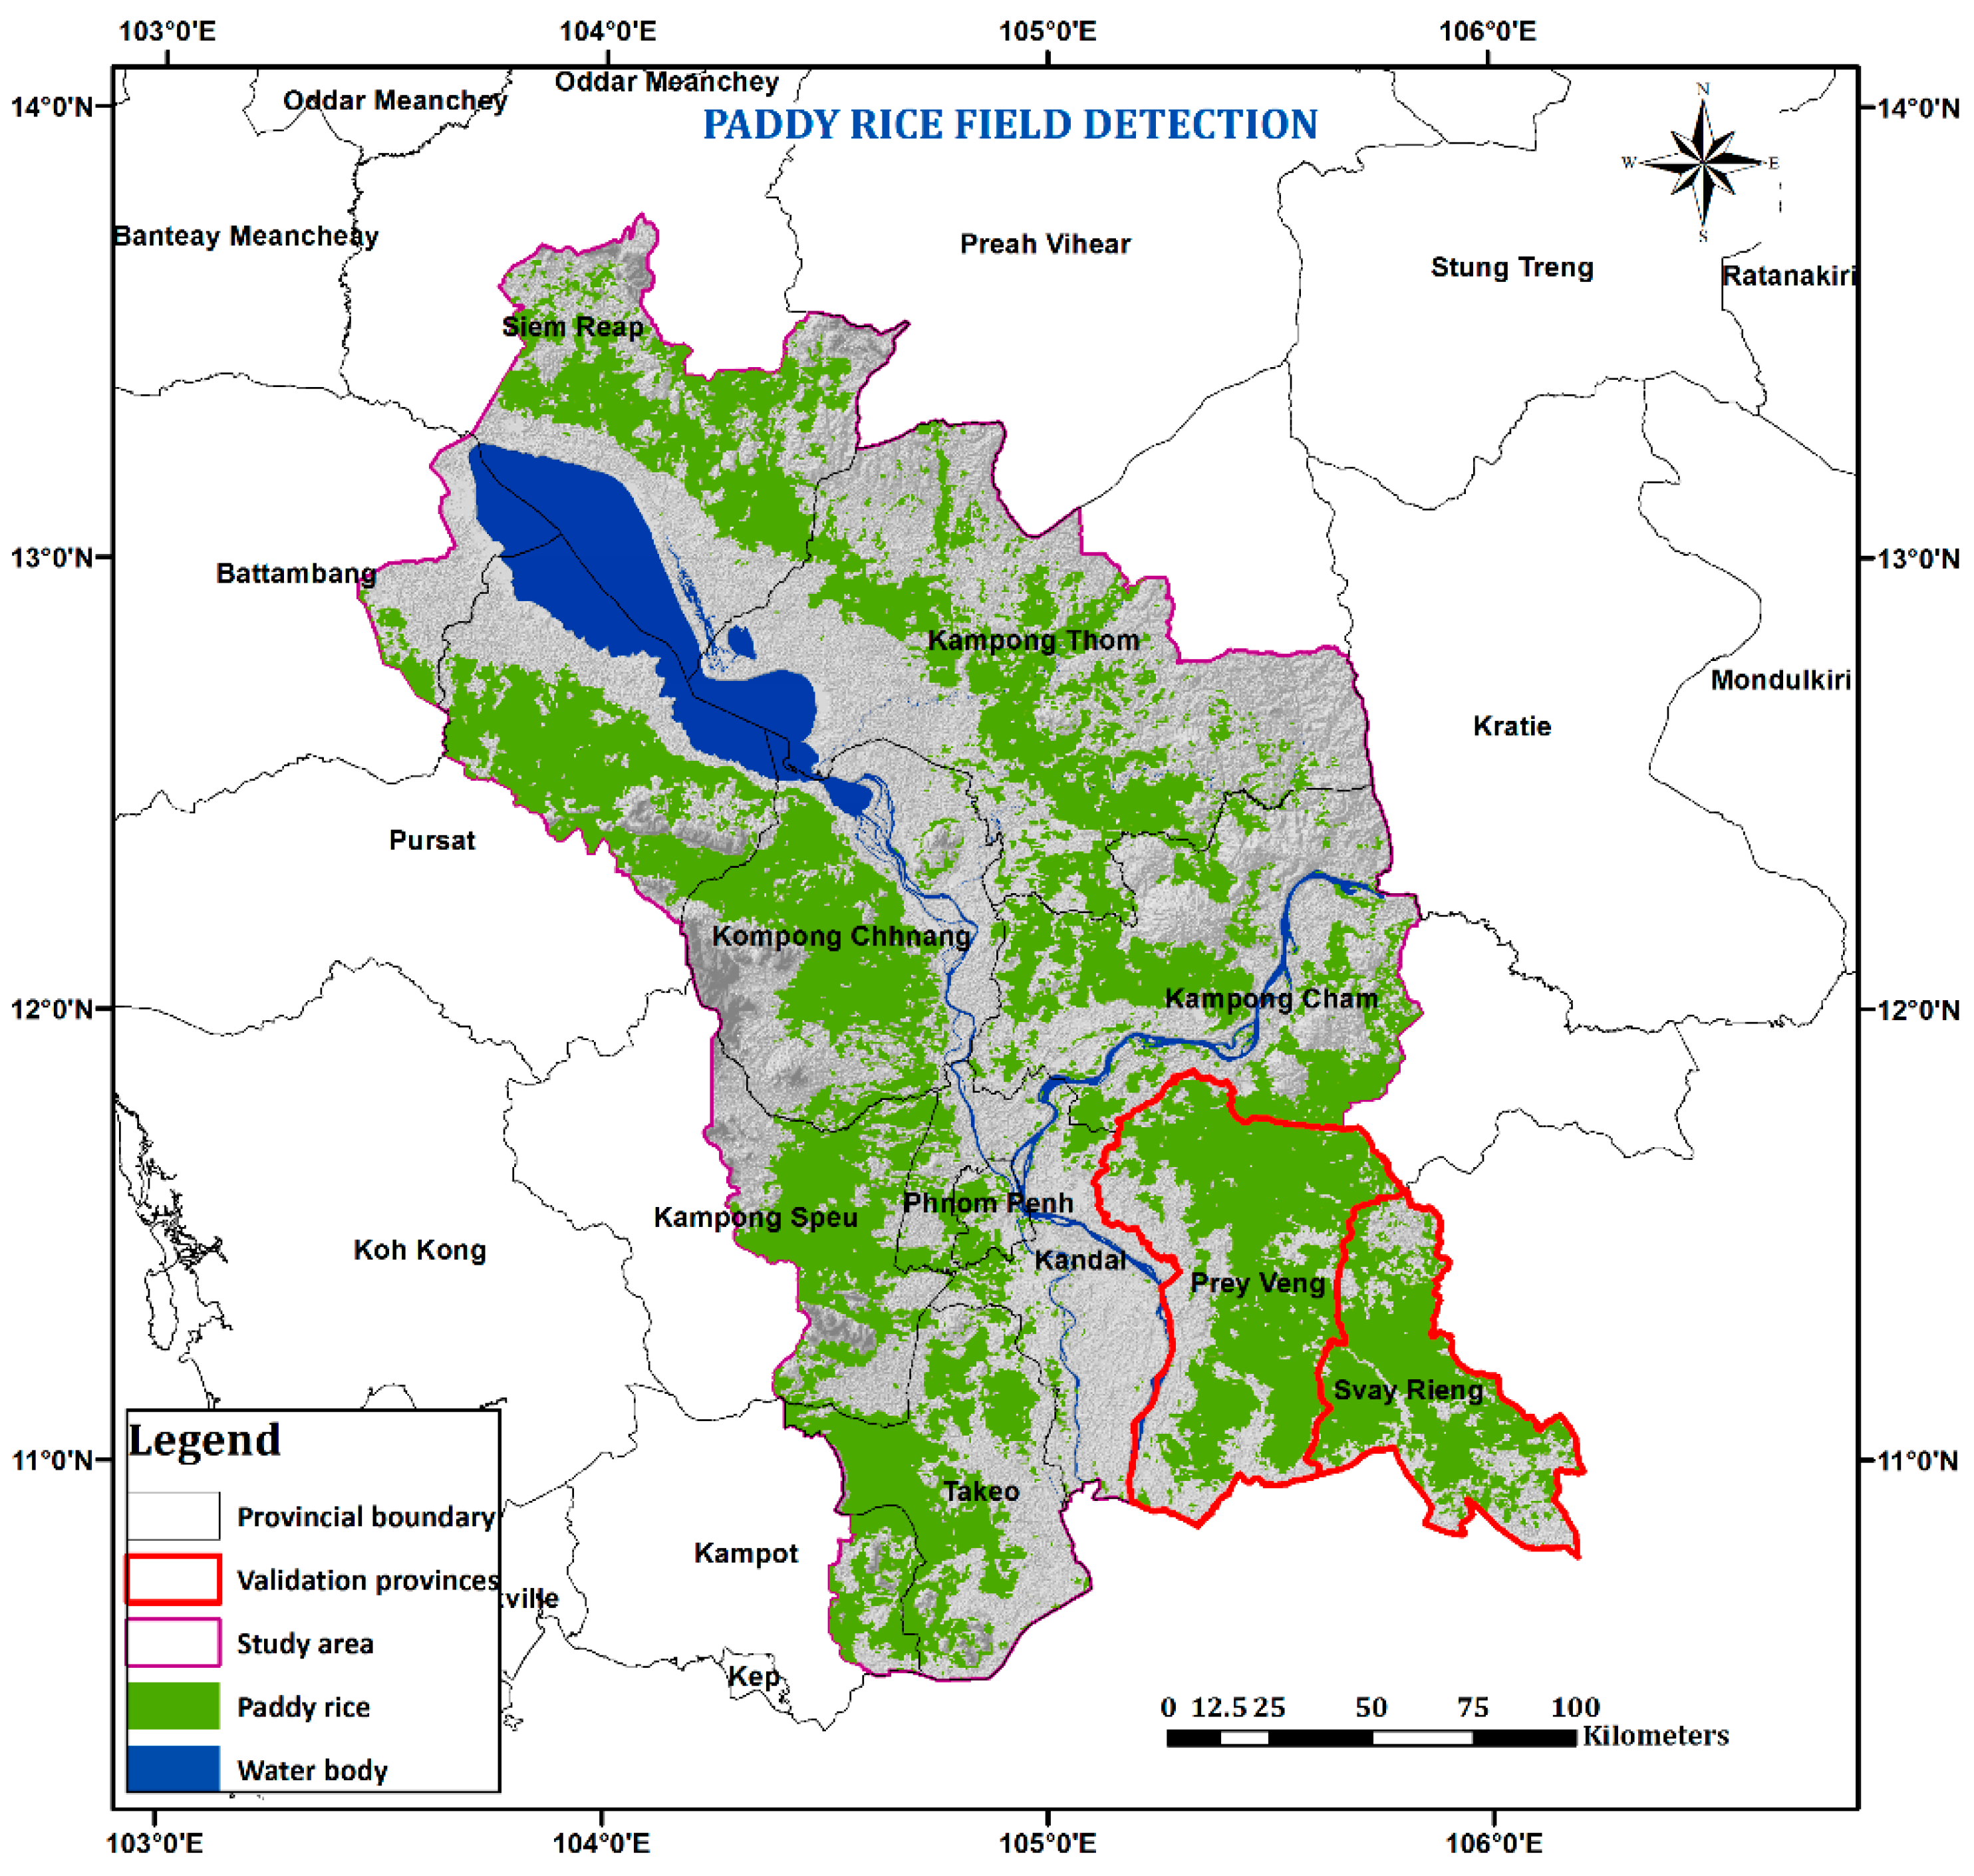
4.3. Paddy Rice Map
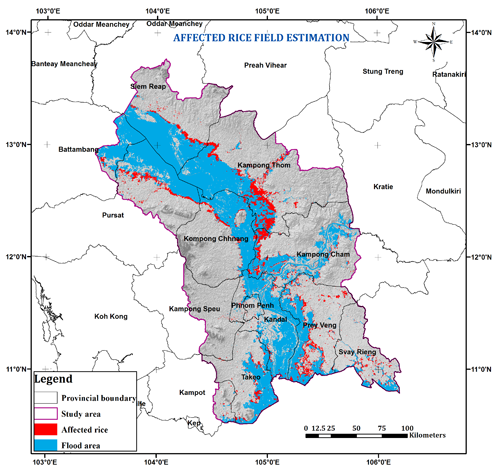
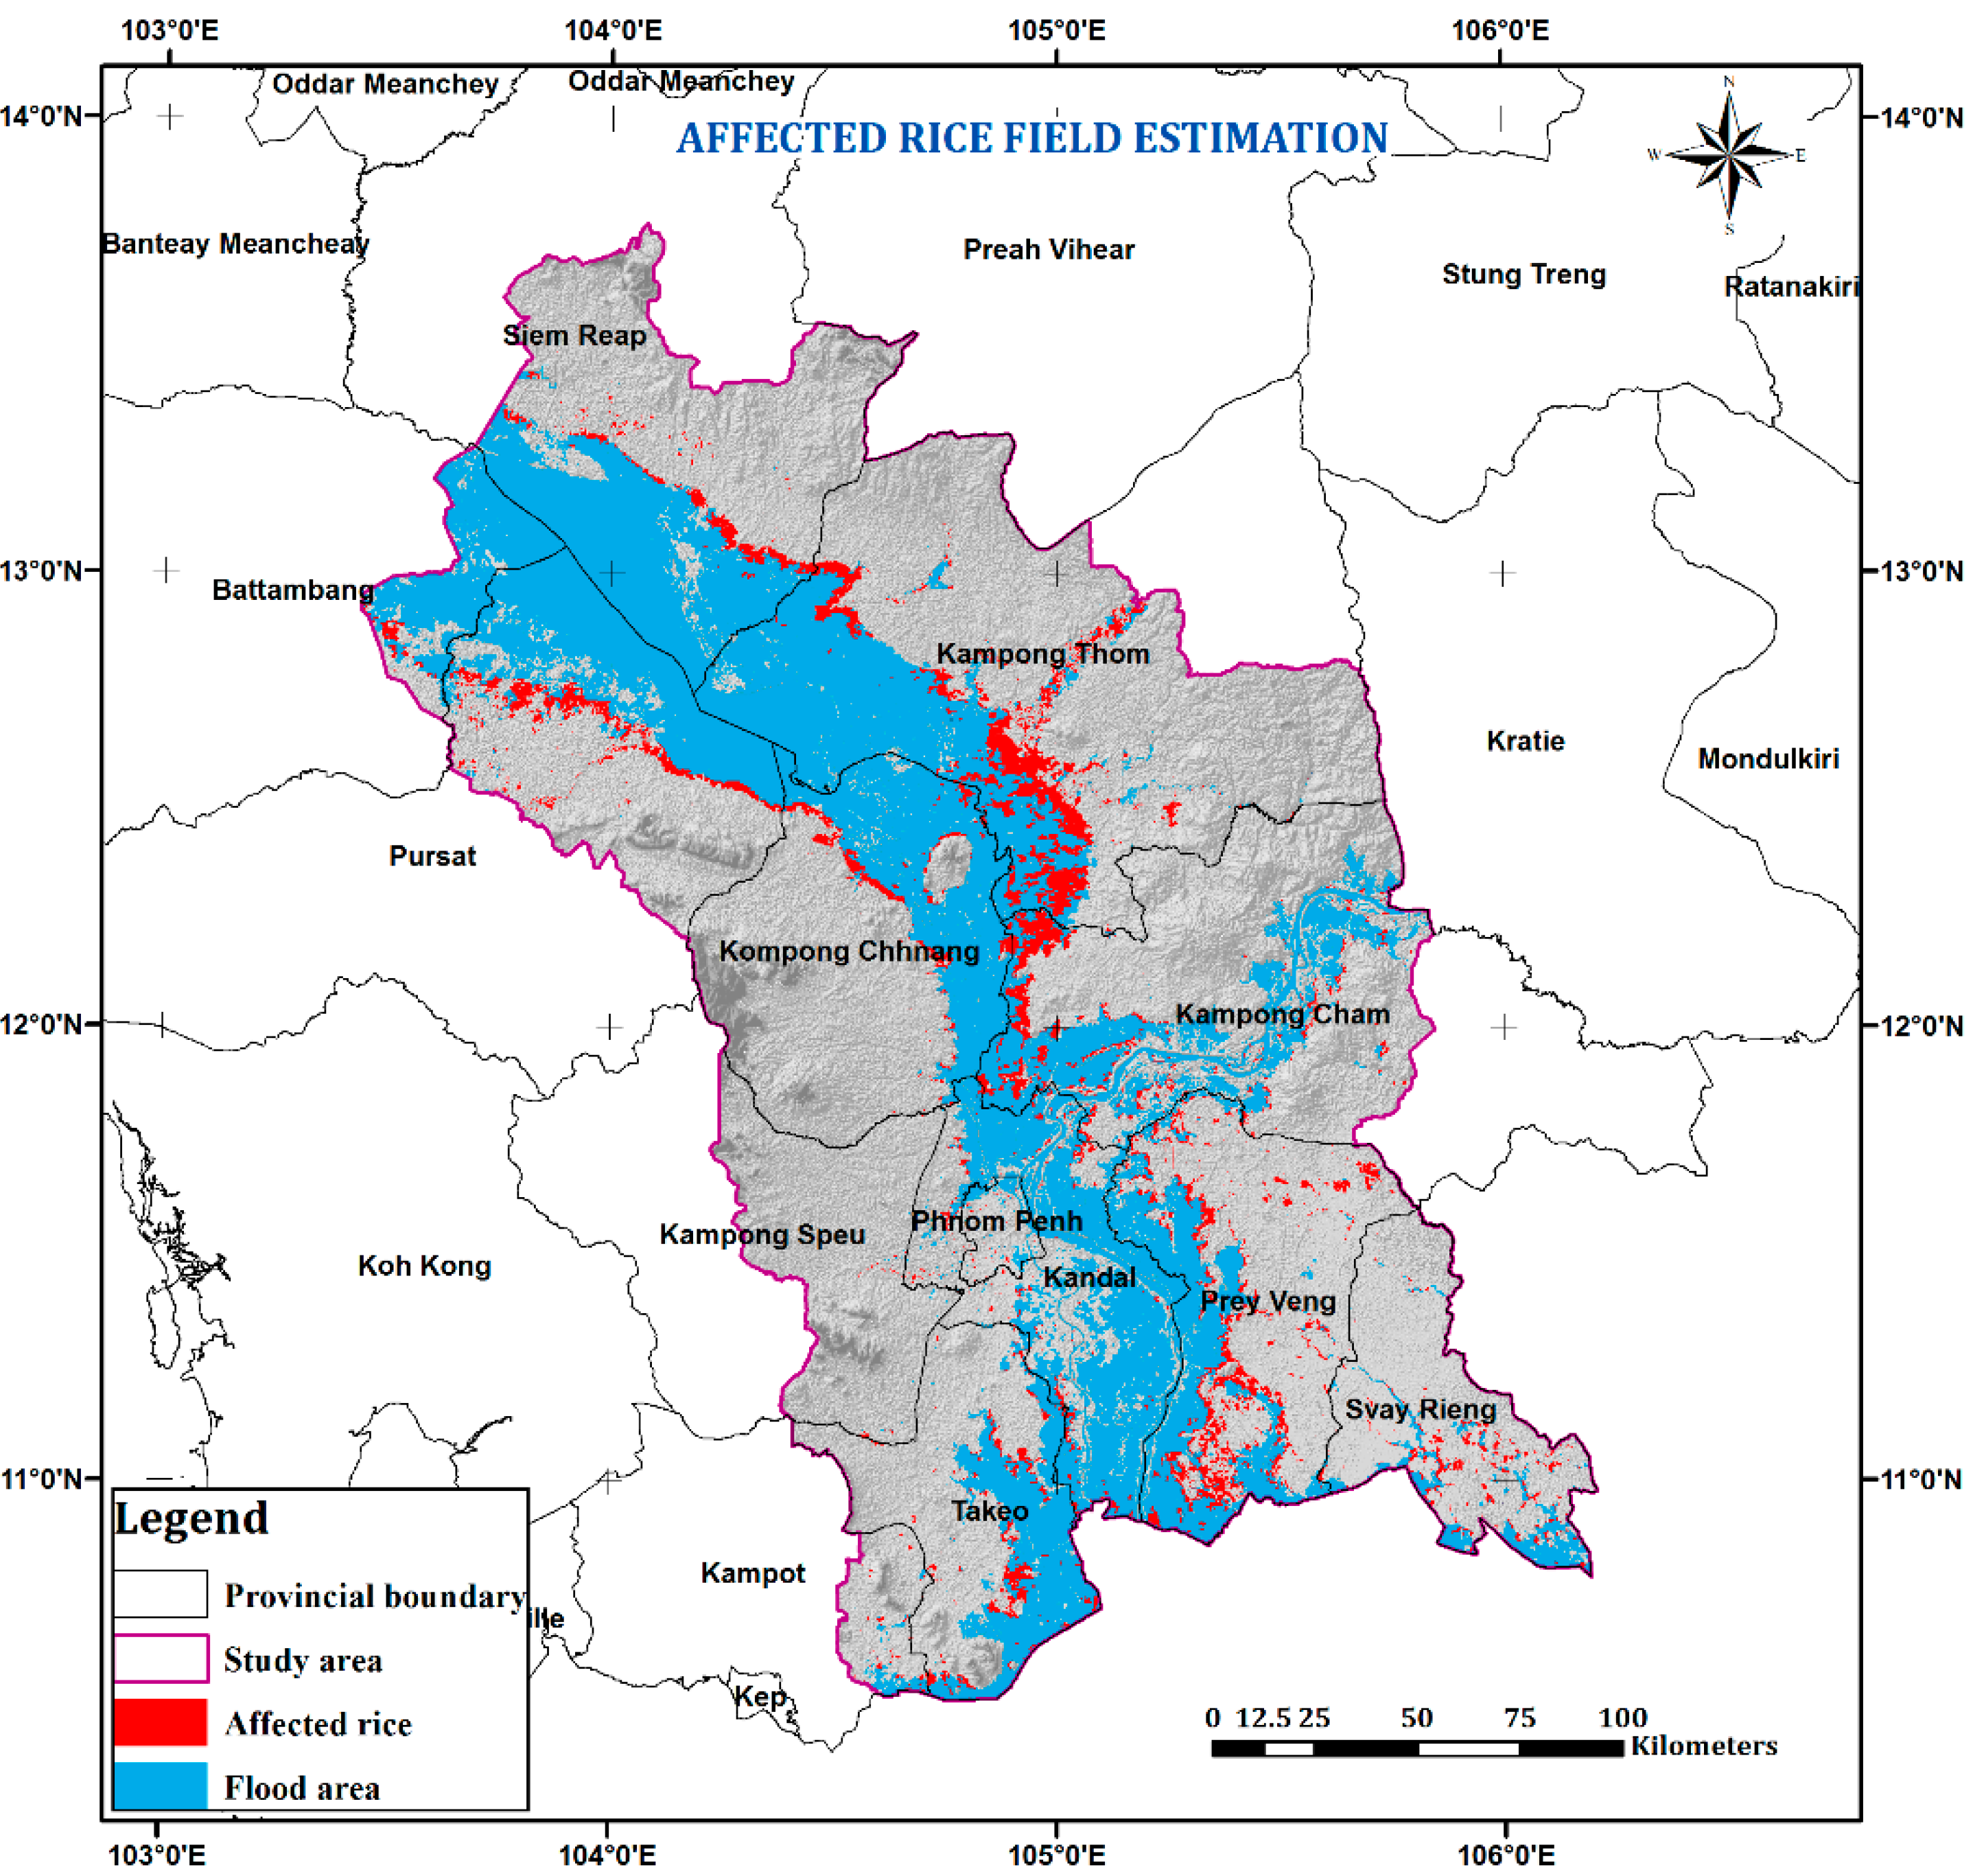
4.4. Affected Rice Field Estimation

4.5. Validation
4.5.1. Validation of Flood Extent Classification
| No. | Province Name | Inundated Area (ha) | Affected Rice Area (ha) |
|---|---|---|---|
| 1 | Battambang | 90,386 | 2834 |
| 2 | Kampong Cham | 170,911 | 31,720 |
| 3 | Kampong Speu | 1016 | 574 |
| 4 | Kampong Thom | 314,528 | 66,503 |
| 5 | Kampot | 6935 | 1523 |
| 6 | Kandaal | 207,940 | 8487 |
| 7 | Kompong Chnang | 173,612 | 14,108 |
| 8 | Kratie | 2 | 0 |
| 9 | Phnom Penh | 6790 | 730 |
| 10 | Prey Veng | 168,081 | 43,180 |
| 11 | Pursat | 177,099 | 23,022 |
| 12 | Siem Reap | 205,871 | 14,251 |
| 13 | Svay Rieng | 40,592 | 11,170 |
| 14 | Takeo | 119,336 | 13,613 |
| Total | 1,683,099 | 231,715 |
| Classified Inundation (pixel) | Reference Data (pixel) | Assessing Criteria | ||||
|---|---|---|---|---|---|---|
| Flood | Non-Flood | PA (%) | UA (%) | OA (%) | Kappa | |
| Compared to Pleiades result | ||||||
| Flood | 130,677 | 4421 | 96.18 | 96.73 | 96.68 | 0.93 |
| Non-flood | 5192 | 149,413 | 97.13 | 96.64 | -- | -- |
| Compared to DMC result | ||||||
| Flood | 12,504,899 | 301,473 | 89.80 | 97.65 | 95.09 | 0.90 |
| Non-flood | 1,418,931 | 20,782,739 | 98.57 | 93.60 | -- | -- |
4.5.2. Validation of Paddy Rice Detection
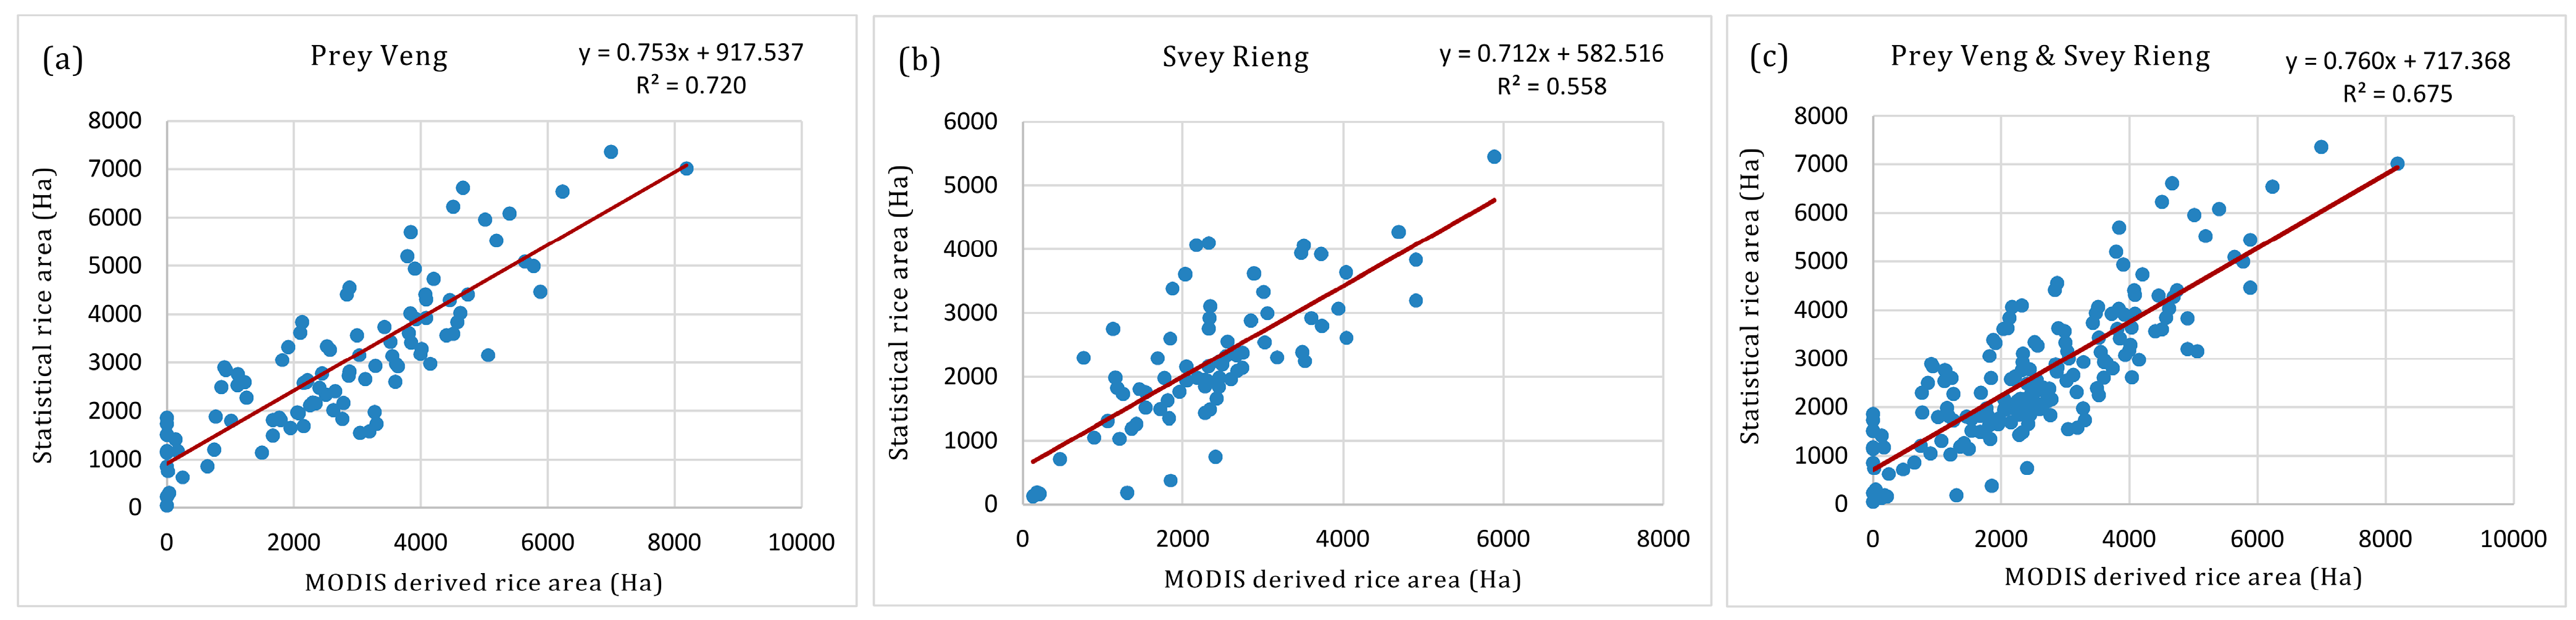
4.5.3. Validation of Affected Rice Estimation
5. Conclusions
Acknowledgments
Author Contributions
Conflicts of Interest
References
- Hall, D.; Bouapao, L. Social Impact Monitoring and Vulnerability Assessment; Regional report; Mekong River Commission: Vientiane, Laos, 2010. [Google Scholar]
- Liou, Y.-A.; Sha, H.-C.; Chen, T.-M.; Wang, T.-S.; Li, Y.-T.; Lai, Y.-C.; Chiang, M.-H.; Lu, L.-T. Assessment of disaster losses in rice paddy field and yield after tsunami induced by the 2011 great east japan earthquake. J. Mar. Sci. Technol. 2012, 20, 618–623. [Google Scholar]
- Hussaina, E.; Urala, S.; Malikb, A.; Shana, J. Mapping Pakistan 2010 floods using remote sensing data. In Proceedings of the ASPRS Annual Conference, Milwaukee, WI, USA, 1–5 May 2011.
- Mallinis, G.; Gitas, I.Z.; Giannakopoulos, V.; Maris, F.; Tsakiri-Strati, M. An object-based approach for flood area delineation in a transboundary area using Envisat ASAR and Landsat TM data. Int. J. Digit. Earth 2011, 6, 1–13. [Google Scholar] [CrossRef]
- Uddin, K.; Gurung, D.R.; Giriraj, A.; Shrestha, B. Application of remote sensing and gis for flood hazard management: A case study from Sindh Province, Pakistan. Am. J. Geogr. Inf. Syst. 2013, 2, 1–5. [Google Scholar]
- Sanyal, J.; Lu, X. Application of remote sensing in flood management with special reference to Monsoon Asia: A review. Nat. Hazards 2004, 33, 283–301. [Google Scholar] [CrossRef]
- Gianinetto, M.; Villa, P.; Lechi, G. Postflood damage evaluation using Landsat TM and ETM+ data integrated with DEM. IEEE Trans. Geosci. Remote Sens. 2006, 44, 236–243. [Google Scholar] [CrossRef]
- Chau, V.N.; Holland, J.; Cassells, S.; Tuohy, M. Using gis to map impacts upon agriculture from extreme floods in Vietnam. Appl. Geogr. 2013, 41, 65–74. [Google Scholar] [CrossRef]
- Oh, M.; Komatsu, S. Characterization of proteins in soybean roots under flooding and drought stresses. J. Proteomics 2014, 114, 161–181. [Google Scholar] [CrossRef] [PubMed]
- Kamal, A.H.M.; Rashid, H.; Sakata, K.; Komatsu, S. Gel-free quantitative proteomic approach to identify cotyledon proteins in soybean under flooding stress. J. Proteomics 2015, 112, 1–13. [Google Scholar] [CrossRef] [PubMed]
- Bhatt, R.M.; Upreti, K.K.; Divya, M.; Bhat, S.; Pavithra, C.; Sadashiva, A. Interspecific grafting to enhance physiological resilience to flooding stress in tomato (solanum lycopersicum l.). Sci. Hortic. 2015, 182, 8–17. [Google Scholar] [CrossRef]
- Sakamoto, T.; van Nguyen, N.; Kotera, A.; Ohno, H.; Ishitsuka, N.; Yokozawa, M. Detecting temporal changes in the extent of annual flooding within the cambodia and the Vietnamese Mekong Delta from modis time-series imagery. Remote Sens. Environ. 2007, 109, 295–313. [Google Scholar] [CrossRef]
- Royal Government of Cambodia. Post-Flood Early Recovery Need Assessment Report; Royal Government of Cambodia Report; Royal Government of Cambodia: Phnom Penh, Cambodia, 2014. [Google Scholar]
- Tapia-Silva, F.-O.; Itzerott, S.; Foerster, S.; Kuhlmann, B.; Kreibich, H. Estimation of flood losses to agricultural crops using remote sensing. Phys. Chem. Earth Parts A/B/C 2011, 36, 253–265. [Google Scholar] [CrossRef]
- Bertin, X.; Li, K.; Roland, A.; Zhang, Y.J.; Breilh, J.F.; Chaumillon, E. A modeling-based analysis of the flooding associated with xynthia, Central Bay of Biscay. Coast. Eng. 2014, 94, 80–89. [Google Scholar] [CrossRef]
- Rogger, M.; Kohl, B.; Pirkl, H.; Viglione, A.; Komma, J.; Kirnbauer, R.; Merz, R.; Blöschl, G. Runoff models and flood frequency statistics for design flood estimation in Austria—Do they tell a consistent story? J. Hydrol. 2012, 456, 30–43. [Google Scholar] [CrossRef]
- Rudari, R.; Gabellani, S.; Delogu, F. A simple model to map areas prone to surface water flooding. Int. J. Disaster Risk Reduct. 2014, 10, 428–441. [Google Scholar] [CrossRef]
- Henry, J.B.; Chastanet, P.; Fellah, K.; Desnos, Y.L. Envisat multi-polarized ASAR data for flood mapping. Int. J. Remote Sens. 2006, 27, 1921–1929. [Google Scholar] [CrossRef]
- Evans, T.L.; Costa, M.; Telmer, K.; Silva, T.S. Using ALOS/PALSAR and RADARSAT-2 to map land cover and seasonal inundation in the Brazilian Pantanal. IEEE J. Sel. Top. Appl. Earth Obs. Remote Sens. 2010, 3, 560–575. [Google Scholar] [CrossRef]
- Oruc, M.; Marangoz, A.; Buyuksalih, G. Comparison of Pixel-based and object-oriented classification approaches using landsat-7 ETM spectral bands. In Proceedings of the ISRPS 2004 Annual Conference, Istabul, Turkey, 19–23 July 2004; pp. 19–23.
- Matinfar, H.; Sarmadian, F.; AlaviPanah, S.; Heck, R. Comparisons of object-oriented and pixel-based classification of land use/land cover types based on Landsat7, ETM+ spectral bands (case study: Arid region of Iran). Am. Eur. J. Agric. Environ. Sci. 2007, 2, 448–456. [Google Scholar]
- Devadas, R.; Denham, R.J.; Pringle, M. Support vector machine classification of object-based data for crop mapping, using multi-temporal landsat imagery. Int. Arch. Photogramm. Remote Sens. Spat. Inf. Sci. 2012, XXXIX-B7, 185–190. [Google Scholar] [CrossRef]
- Heumann, B.W. An object-based classification of mangroves using a hybrid decision tree—Support vector machine approach. Remote Sens. 2011, 3, 2440–2460. [Google Scholar] [CrossRef]
- Dronova, I.; Gong, P.; Wang, L.; Zhong, L. Mapping dynamic cover types in a large seasonally flooded wetland using extended principal component analysis and object-based classification. Remote Sens. Environ. 2015, 158, 193–206. [Google Scholar] [CrossRef]
- Dronova, I.; Gong, P.; Wang, L. Object-based analysis and change detection of major wetland cover types and their classification uncertainty during the low water period at Poyang Lake, China. Remote Sens. Environ. 2011, 115, 3220–3236. [Google Scholar] [CrossRef]
- Frohn, R.; Autrey, B.; Lane, C.; Reif, M. Segmentation and object-oriented classification of wetlands in a Karst Florida landscape using multi-season Landsat-7 ETM+ imagery. Int. J. Remote Sens. 2011, 32, 1471–1489. [Google Scholar] [CrossRef]
- Blaschke, T. Object based image analysis for remote sensing. ISPRS J. Photogramm. Remote Sens. 2010, 65, 2–16. [Google Scholar] [CrossRef]
- Bisquert, M.; Bégué, A.; Deshayes, M. Object-based delineation of homogeneous landscape units at regional scale based on MODIS time series. Int. J. Appl. Earth Obs. Geoinf. 2015, 37, 72–82. [Google Scholar] [CrossRef]
- Thompson, J.A.; Lees, B.G. Applying object-based segmentation in the temporal domain to characterise snow seasonality. ISPRS J. Photogramm. Remote Sens. 2014, 97, 98–110. [Google Scholar] [CrossRef]
- Vintrou, E.; Desbrosse, A.; Bégué, A.; Traoré, S.; Baron, C.; lo Seen, D. Crop area mapping in west Africa using landscape stratification of MODIS time series and comparison with existing global land products. Int. J. Appl. Earth Obs. Geoinf. 2012, 14, 83–93. [Google Scholar] [CrossRef]
- Le Maire, G.; Dupuy, S.; Nouvellon, Y.; Loos, R.A.; Hakamada, R. Mapping short-rotation plantations at regional scale using MODIS time series: Case of eucalypt plantations in Brazil. Remote Sens. Environ. 2014, 152, 136–149. [Google Scholar] [CrossRef]
- Gao, Y.; Mas, J.; Niemeyer, I.; Marpu, P.; Palacio, J. Object-based image analysis for mapping land-cover in a forest area. In Proceedings of the 5th International Symposium: Spatial Data Quality, Enschede, The Netherlands, 13–15 June 2007; pp. 13–15.
- Nesbitt, H.J. Rice Production in Cambodia; International Rice Research Institute: Laguna, Philippines, 1997. [Google Scholar]
- Men, S.; Ram, C.; Edwin, J.; Ouk, M.; Sakhan, S.; Hun, Y.; Pith, K.; Khun, L.; Sidhu, G.; Sin, S. Description of Rice Varieties Released by the Varietal Recommendation Committee of Cambodia (1999–2000); Cambodian Agricultural Research and Development Institute: Phnom Penh, Cambodia, 2001. [Google Scholar]
- Vang, S. Country report on rice cultivation pratice. In Proceedings of the Expert Meeting, Bandkok, Thailand, 2–3 June 2011.
- Knight, E.J.; Kvaran, G. Landsat-8 Operational Land Imager design, characterization and performance. Remote Sens. 2014, 6, 10286–10305. [Google Scholar] [CrossRef]
- Williams, D. Landsat 7 Science Data Users Handbook; NASA: Washington, DC, USA, 2008; Volume 12, p. 2008. [Google Scholar]
- ITT Visual Information Solutions, I.V.I. In Atmospheric Correction Module: Quac and Flaash User’s Guide, Version 4.7; ITT Visual Information Solutions: Boulder, CO, USA, 2009.
- Didan, K.; Huete, A. Modis Vegetation Index Product Series Collection 5 Change Summary; Terrestrial Biophysics and Remote Sensing (TBRS) Laboratory, The University of Arizona: Tucson, AZ, USA, 2006; Volume 29, p. 2006. [Google Scholar]
- Trimble. Ecognition Developer 8.7 User Guide; Trimble Documentation: Munich, Germany, 2011; p. 258. [Google Scholar]
- Happ, P.; Ferreira, R.; Bentes, C.; Costa, G.; Feitosa, R. In Multiresolution Segmentation: A Parallel Approach for High Resolution Image Segmentation in Multicore Architectures. In Proceedings of the 3rd International Conference on Geographic Object-Based Image Analysis, Ghent, Belgium, 29 June–2 July 2010.
- Baatz, M.; Schäpe, A. Multiresolution segmentation: An optimization approach for high quality multi-scale image segmentation. In Angewandte Geographische Informationsverarbeitung XII. Beiträge zum AGIT-Symposium Salzburg 2000; Strobl, J., Blaschke, T., Griesebner, G., Eds.; Wichmann: Heidelberg, Germany, 2000; pp. 12–23. [Google Scholar]
- Gao, Y.; Mas, J.F.; Kerle, N.; Navarrete Pacheco, J.A. Optimal region growing segmentation and its effect on classification accuracy. Int. J. Remote Sens. 2011, 32, 3747–3763. [Google Scholar] [CrossRef]
- Drăguţ, L.; Csillik, O.; Eisank, C.; Tiede, D. Automated parameterisation for multi-scale image segmentation on multiple layers. ISPRS J. Photogr. Remote Sens. 2014, 88, 119–127. [Google Scholar] [CrossRef]
- Drǎguţ, L.; Tiede, D.; Levick, S.R. Esp: A tool to estimate scale parameter for multiresolution image segmentation of remotely sensed data. Int. J. Geogr. Inf. Sci. 2010, 24, 859–871. [Google Scholar] [CrossRef]
- Woodcock, C.E.; Strahler, A.H. The factor of scale in remote sensing. Remote Sens. Environ. 1987, 21, 311–332. [Google Scholar] [CrossRef]
- Peng, D.; Huete, A.R.; Huang, J.; Wang, F.; Sun, H. Detection and estimation of mixed paddy rice cropping patterns with modis data. Int. J. Appl. Earth Obs. Geoinf. 2011, 13, 13–23. [Google Scholar] [CrossRef]
- Xiao, X.; Boles, S.; Liu, J.; Zhuang, D.; Frolking, S.; Li, C.; Salas, W.; Moore III, B. Mapping paddy rice agriculture in southern china using multi-temporal MODIS images. Remote Sens. Environ. 2005, 95, 480–492. [Google Scholar] [CrossRef]
- Walker, J.; de Beurs, K.; Wynne, R.; Gao, F. Evaluation of Landsat and MODIS data fusion products for analysis of dryland forest phenology. Remote Sens. Environ. 2012, 117, 381–393. [Google Scholar] [CrossRef]
- Hilker, T.; Wulder, M.A.; Coops, N.C.; Linke, J.; McDermid, G.; Masek, J.G.; Gao, F.; White, J.C. A new data fusion model for high spatial-and temporal-resolution mapping of forest disturbance based on landsat and modis. Remote Sens. Environ. 2009, 113, 1613–1627. [Google Scholar] [CrossRef]
- Gao, F.; Masek, J.; Schwaller, M.; Hall, F. On the blending of the Landsat and MODIS surface reflectance: Predicting daily landsat surface reflectance. IEEE Trans. Geosci. Remote Sens. 2006, 44, 2207–2218. [Google Scholar] [CrossRef]
© 2015 by the authors; licensee MDPI, Basel, Switzerland. This article is an open access article distributed under the terms and conditions of the Creative Commons Attribution license (http://creativecommons.org/licenses/by/4.0/).
Share and Cite
Dao, P.D.; Liou, Y.-A. Object-Based Flood Mapping and Affected Rice Field Estimation with Landsat 8 OLI and MODIS Data. Remote Sens. 2015, 7, 5077-5097. https://doi.org/10.3390/rs70505077
Dao PD, Liou Y-A. Object-Based Flood Mapping and Affected Rice Field Estimation with Landsat 8 OLI and MODIS Data. Remote Sensing. 2015; 7(5):5077-5097. https://doi.org/10.3390/rs70505077
Chicago/Turabian StyleDao, Phuong D., and Yuei-An Liou. 2015. "Object-Based Flood Mapping and Affected Rice Field Estimation with Landsat 8 OLI and MODIS Data" Remote Sensing 7, no. 5: 5077-5097. https://doi.org/10.3390/rs70505077