Review

What Four Decades of Earth Observation Tell Us about Land Degradation in the Sahel?

1
World Agroforestry Centre-ICRAF-SD6,, United Nations Avenue, Gigiri 00100, Nairobi 30677, Kenya
2
Institute of Geography, University of Bayreuth, Bayreuth 95440, Germany
4
World Agroforestry Centre-ICRAF, East and Central African Office, Gigiri 00100, Nairobi 30677, Kenya
3
Department of Geosciences and Natural Resource Management, University of Copenhagen, Copenhagen 1350, Denmark
*
Author to whom correspondence should be addressed.
Remote Sens. 2015, 7(4), 4048-4067; https://doi.org/10.3390/rs70404048
Submission received: 15 December 2014 / Revised: 24 March 2015 / Accepted: 27 March 2015 / Published: 2 April 2015
(This article belongs to the Special Issue Remote Sensing of Land Degradation in Drylands)

Abstract

:
The assessment of land degradation and the quantification of its effects on land productivity have been both a scientific and political challenge. After four decades of Earth Observation (EO) applications, little agreement has been gained on the magnitude and direction of land degradation in the Sahel. The large number of EO datasets and methods associated with the complex interactions among biophysical and social drivers of ecosystem changes make it difficult to apply aggregated EO indices for these non-linear processes. Hence, while many studies stress that the Sahel is greening, others indicate no trend or browning. The different generations of sensors, the granularity of studies, the study period, the applied indices and the assumptions and/or computational methods impact these trends. Consequently, many uncertainties exist in regression models between rainfall, biomass and various indices that limit the ability of EO science to adequately assess and develop a consistent message on the magnitude of land degradation. We suggest several improvements: (1) harmonize time-series data, (2) promote knowledge networks, (3) improve data-access, (4) fill data gaps, (5) agree on scales and assumptions, (6) set up a denser network of long-term field-surveys and (7) consider local perceptions and social dynamics. To allow multiple perspectives and avoid erroneous interpretations, we underline that EO results should not be interpreted without contextual knowledge.

Graphical Abstract

1. Introduction

Desertification is a complex and multi-faceted phenomenon aggravating poverty that can be seen as both a cause and a consequence of land resource depletion. As reflected in its definition by the United Nations Convention to Combat Desertification (UNCCD) [1], desertification is “land degradation in arid, semi-arid and dry sub-humid areas resulting from various factors, including climate variation and human activities”. In the 1990s, the Global Assessment of Human Induced Soil Degradation (GLASOD) project was the first comprehensive effort to map land degradation globally using standardized criteria [2]. Subsequent studies confirm evidence of land degradation in terms of varying degrees of severity [3]. However, because of massive criticism of the reliability and accuracy of GLASOD, a more recent approach called GLADA (Global Assessment of Land Degradation and Improvement)—within the Food and Agriculture Organization of the United Nations’ (FAO) Land Degradation Assessment in Drylands (LADA) program—mapped land degradation with improved (integrated remote sensing) techniques [4]. The LADA program made important progress in assessing the causes and impacts of land degradation at global, national and local levels, in order to detect hot spots and identify intervention strategies [5]. LADA approaches land degradation as biophysical, social, economic and environmental issues that must be dealt with using a combined geo-informational, scientific and local knowledge tools [6,7].
These programmatic studies showed that the reduction of available agricultural lands in Africa’s drylands is exacerbated by soil fragility and easily degrading lands. A variety of processes are at work, and it is clear from a “convergence of evidence” and consensus among the expert community that large areas in the Sahel are affected [8]. Land degradation—as yet poorly quantified and recognized—is amplified by rapid population growth, increased temperature-driven evaporative demand, and increased rainfall variability [9,10,11,12]. Besides its physical consequences on ecosystems, it induces a wide range of socio-economic threats, including poverty, food insecurity, water shortage, health problems and conflicts [6,13]. Since the adoption of the UNCCD convention, much has been done on various fronts in Africa, including the collaboration of national, sub-regional and regional entities to combat desertification and improve our understanding of the mechanisms and the effects of the phenomenon. However, despite these significant achievements, considerable challenges remain and need of a serious and prompt response.
Many of the obstacles are related to the availability of data and tools that can be used to assess land degradation. Furthermore, current science applies with many contentions, different proxies for biophysical and socio-economic indicators to explain the root causes, driving forces, status, and impacts of and responses to land degradation. Similarly, many controversies exist on replicable methods to assess land degradation, or key indicators of essential variables of processes and state of land in the Sahel [14]. Due to sparse ground observations in African drylands, satellite data have been extensively used to collect evidence of degraded land, particularly within the Driving force-Pressure-State-Impact-Response (DPSIR) framework, which was largely applied to land degradation in drylands, mostly for land cover/land use change and soil moisture [15]. However, Earth Observation (EO) can only provide indicators; a negative or positive trend in vegetation productivity does not necessarily mean widespread and irreversible degradation or an improvement in ecological services as both livelihoods and vegetation greenness depend on many factors. Hence, monitoring and detecting desertification and land degradation in the Sahel using satellite data has become a contentious topic, despite the improvement in data and analytical methods. One of the constraining issues is the agreement among scientists on the most robust methods/indicators for monitoring and assessing land dynamics [16].
During the last four decades, the Sahel was affected by below-normal precipitation with two severe drought periods in 1972–1973 and in 1983–1984 [17,18]. Because of this negative climate trend, many studies prioritized the Sahel “crisis” in terms of productivity loss and land degradation [19]. These negative perceptions have been opposed with recent findings of improved greenness mostly in relation to recent improvement in rainfall. This paper is a synthesis on current remote sensing methods to assess four decades of land degradation studies. From discussion of strength and limits of many approaches, we suggest a number of knowledge gaps that require more research to improve land degradation assessment in the Sahel using EO.

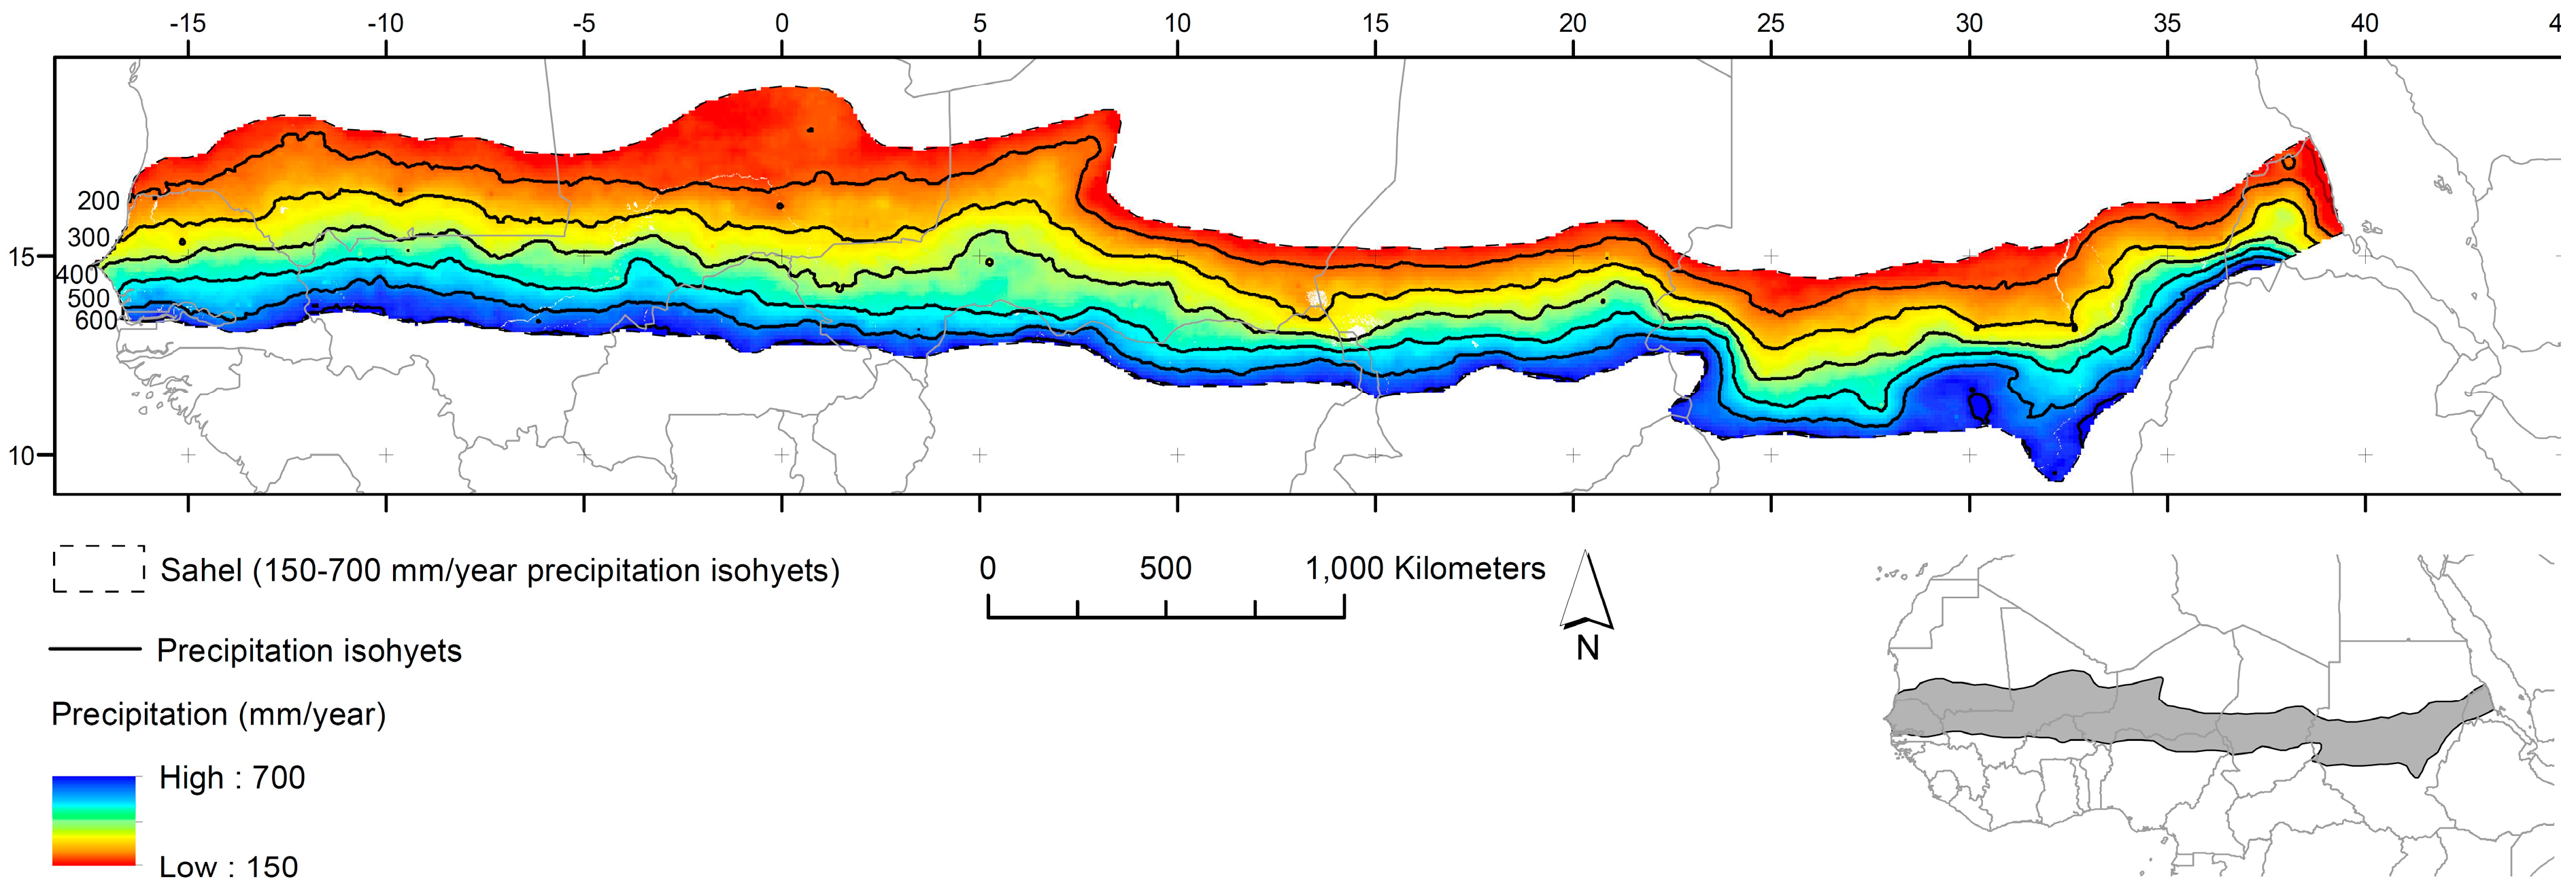
2. The Sahel Context

The Sahel is a wide climatic zone covering arid and semi-arid biomes (Figure 1). The extent of the biomes is largely determined by the progression of the Intertropical Convergence Zone during the West African Monsoon [20]. The core of the West African Sahelian zone (Senegal, Mali, Burkina Faso and Niger are analyzed in this paper) is characterized by a unimodal rainfall regime during boreal summer with annual totals ranging from 200 to 400 mm. Landscapes are dominated by large planes, small temporal water ponds surrounded with evergreen and semi-deciduous dense vegetation cover. Sand dunes and rocky formations cover the remaining lands. The large stretches of plains are mainly used for grazing and subsistence cultivation dominated by dry cereals such as sorghum or millet. Herbaceous cover primarily includes annual grasses and scattered trees dominated by xeric taxa, such as Acacia, Balanites, and Ziziphus [21]. Recent scientific findings suggest a decline in biodiversity and a shift to more arid and drought resilient species [22,23,24], despite increasing greenness associated with recent improved rainfall [25]. Southward, the Sahel-Sudanian zone is characterized by a unimodal rainfall regime during boreal summer with annual average rainfall ranging from 400 to 700 mm. This permits a mosaic of woodland and savanna vegetation with (semi) deciduous trees with evergreen forests bordering perennial water bodies. A significant part of the zone is under cultivation and the remaining pieces of natural vegetation are used for extraction of commodities and grazing [26,27]. Similarly to the Sahelian zone, a decline in species diversity in general and a decrease of gallery forests are regarded as land degradation. In contrast to the Sahel, a dense cover of perennial grasses and trees reflect a structure of less disturbed sites as compared to more arid areas [28].
Traditionally, people in the Sahel relied on the production of livestock and grazing the regions’ nutritious grasslands during and after the rainy season. During the dry season, people migrated southwards in search of forage resources in the Sudanian zone, a movement known as transhumance. More recently, people have settled to practice small-scale rain-fed farming for their livelihood [3]. Recently, due to the rapidly growing population, the changing environment, the spatial and temporal rainfall variability and the global market change, most parts of the Sahel ecosystems can no longer sustain small-scale rain-fed farming, which has locked people into a negative spiral of poverty and degradation [29]. This has resulted in important southward internal mass migrations of farmers and breeders in search of arable lands and grazing areas [30].
According to the United Nations Environment Programme (UNEP), population growth, deforestation, expansion of cropping lands, overgrazing, droughts and little rainfall as well as poor policies have transformed large parts of the Sahel into barren land during the 20th century [26]. Estimations state that 500 million hectares of African land are degraded, including 65% of agricultural land and 30% of the Sahel zone [2,26,31]. These figures have been severely criticized by the scientific community [31,32,33], as little evidence of widespread degradation is given.
Figure 1. Sahel delineation (150–700 mm/year precipitation isohyets) and annual average precipitation (Climate Prediction Center Merged Analysis of Precipitation, CMAP 1982–2010).
Remotesensing 07 04048 g001

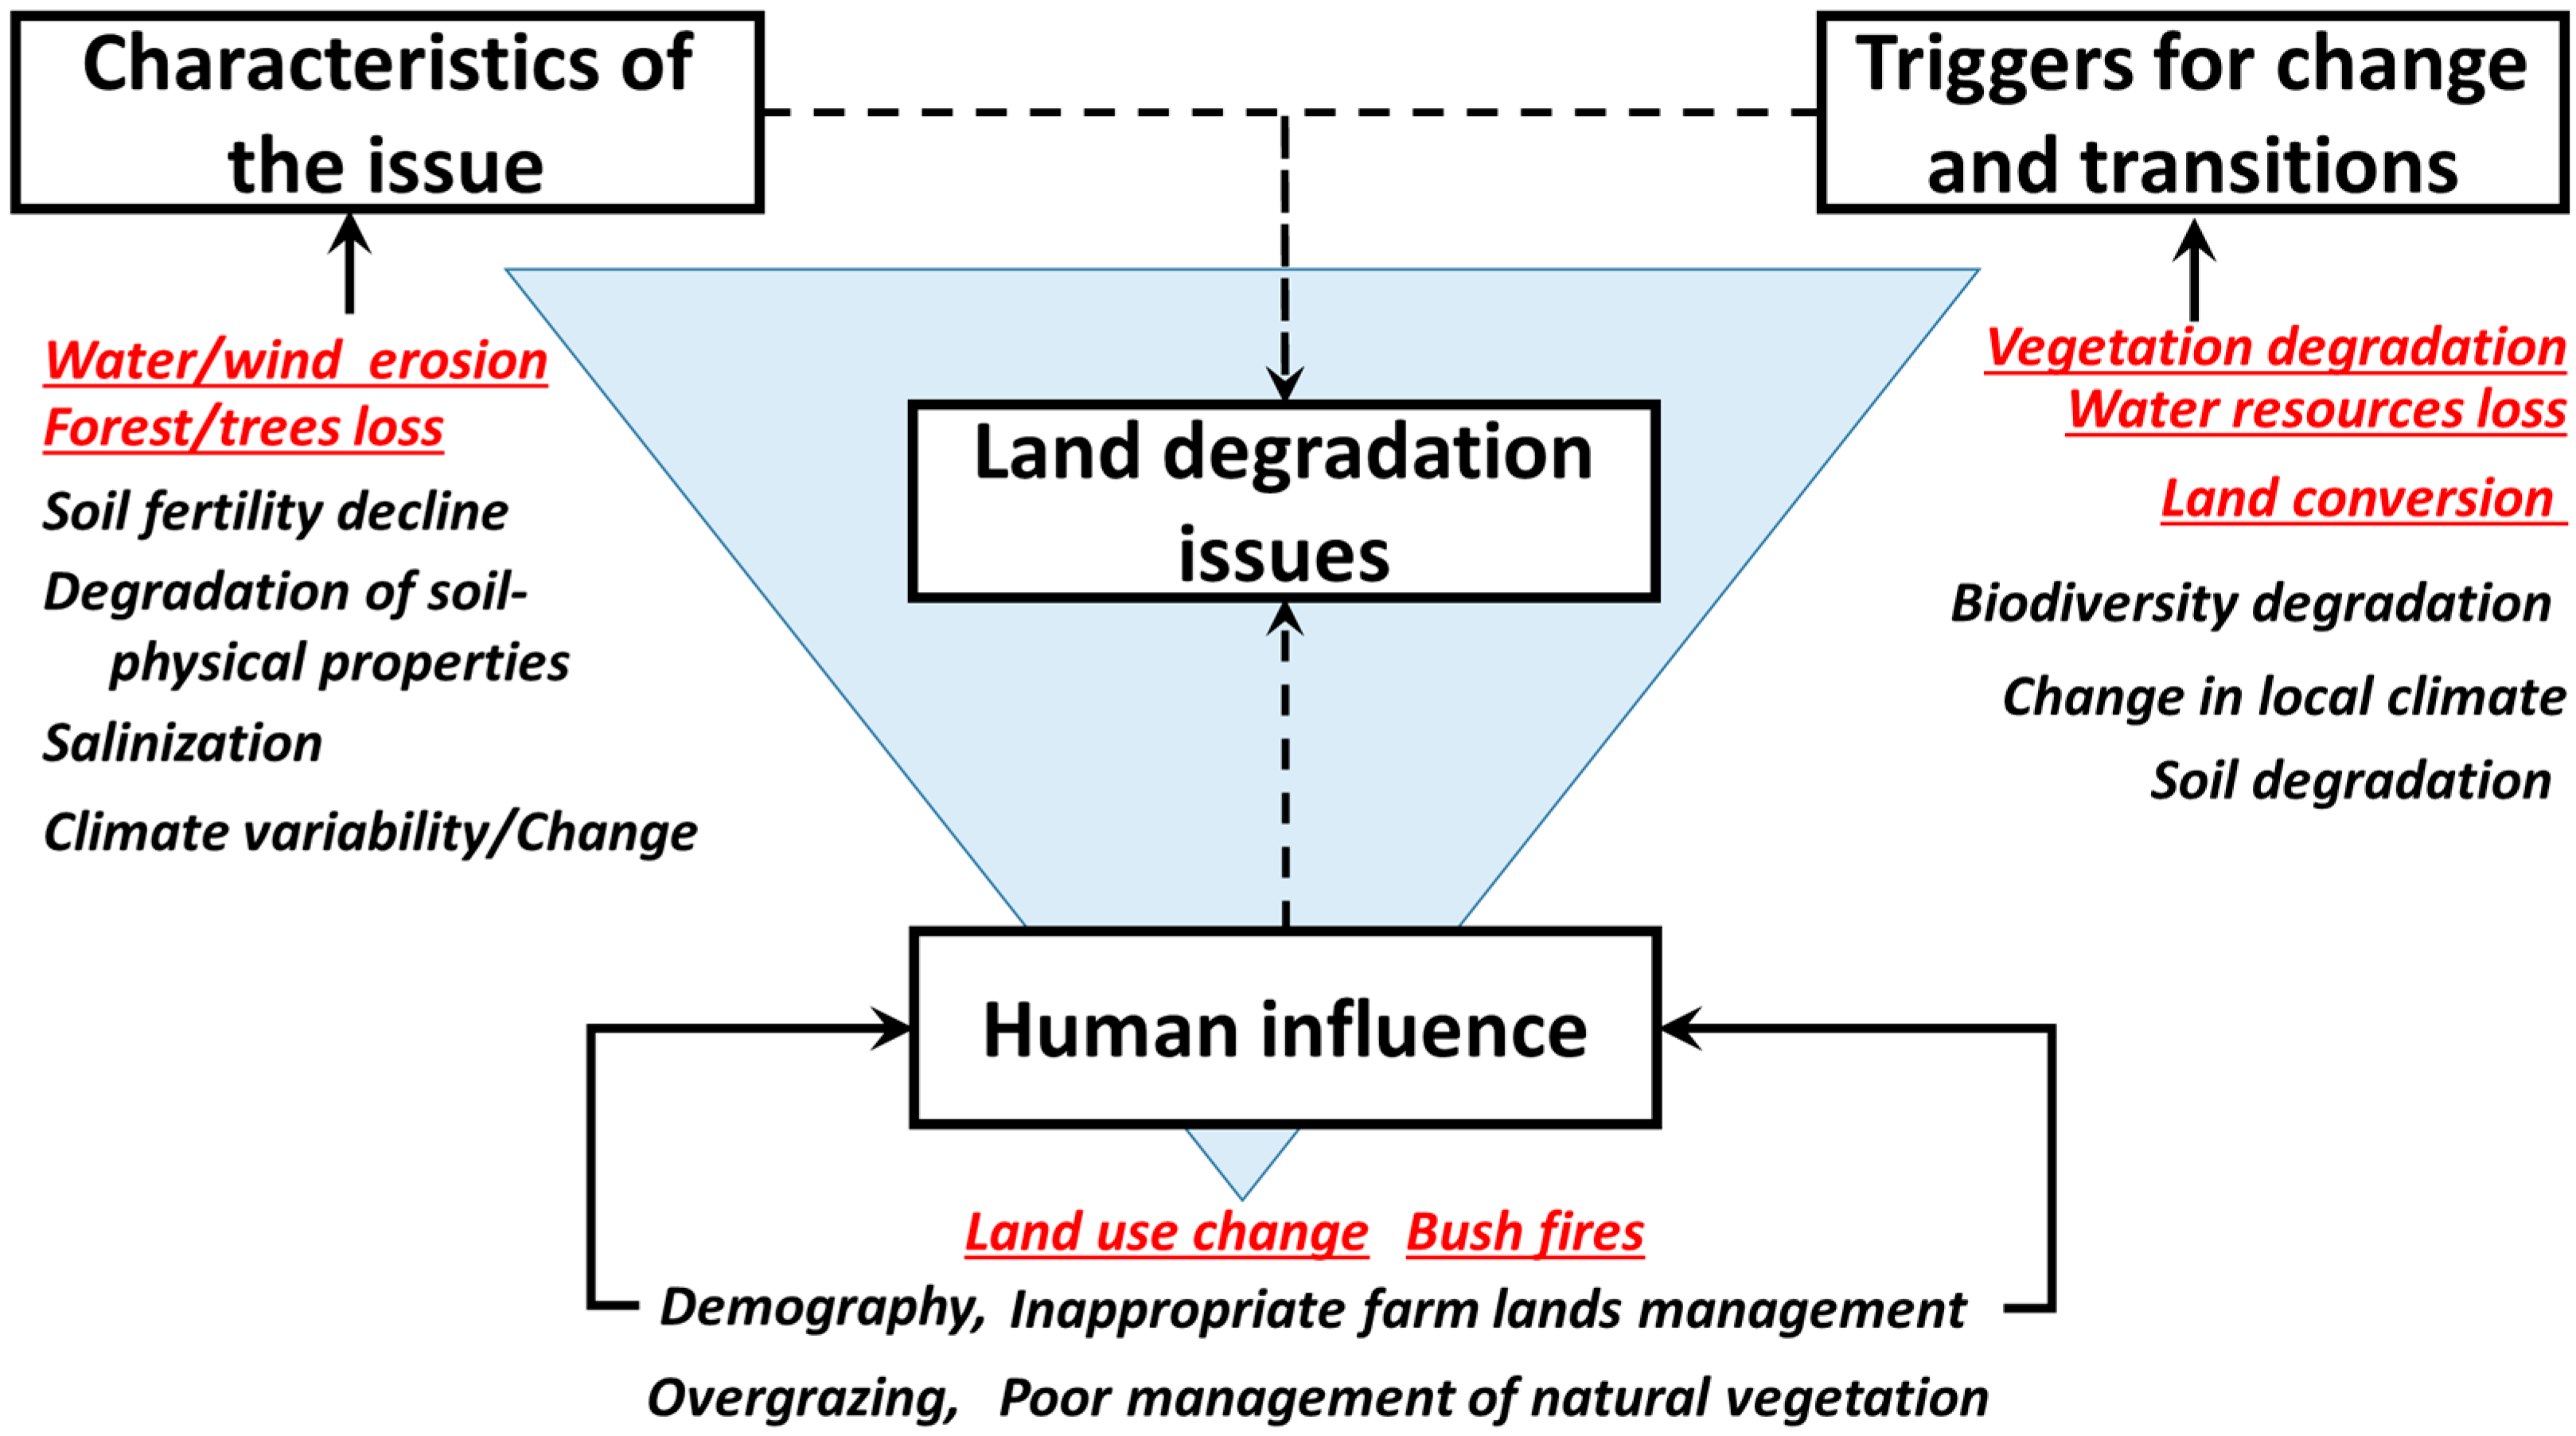
3. Direction and Determinants of Land Degradation

Land degradation mechanisms are related to two main categories of processes, one related to climate change and one associated with local human impact, mostly land use change such as expansion of cultivation, agricultural intensification, overgrazing and overuse of woody vegetation [34]. The land degradation characteristics, triggers and human influence are manifold and interrelated (Figure 2). Some of the indicators of land degradation can be monitored using Earth Observation techniques (Figure 2). The inter-annual variation of land productivity as seen from spatial data is due to two categories of factors: (1) total annual rainfall and (2) land cover types and the additional layer of uncertainty related to remote sensing methods, such as residual radiometric errors [35]. Repeated droughts and low soil productivity have often been cited as major factors of land degradation. There are many other ecological factors (soil type) and human impacts (disturbances such as fires) that can influence these trends (Figure 2). Vegetation indices used to backcast some of the land processes are affected by soil color and texture, grazing pressure, floristic composition, or land use and farming methods [17,34,36]. Studies on crop land expansion concluded that despite population increase, crop land has been stable in many areas, particularly where land availability is a limiting factor or where farmers are able to sustain and diversify their production and avoid field expansion [37]. It is therefore important to advance science towards a better integration of climate and land use related drivers for better reporting on the characteristic spatial patterns of land degradation [34].
To address the complexity behind land degradation processes, Rasmussen et al. [38] used the adaptive cycle heuristic, and showed that traditional pictures of a unidirectional process of land degradation and system collapse in Sahelian agro-pastoral systems is a simplification of more complex realities. They concluded that the Sahelian systems buffer pressures and shocks to some extent. Quantifying these feedback mechanisms remains one of the major challenges in land use system analysis [39]. This was confirmed by several studies [40,41], which showed that inter-annual land cover changes in Africa mostly involve erratic variations in land cover conditions due to inter-annual climatic variability and temporary modifications in seasonality. Signs of land degradation are in essence very diverse (Figure 3) making it difficult to have a simplistic assessment method from spatial data.
Figure 2. Land degradation linkages (* red underlined text indicate the factors that can be monitored using remote sensing indicators).
Remotesensing 07 04048 g002

4. Remote Sensing Based Assessment of Land Degradation Dynamics in the Sahel

4.1. Assessing Degradation

Claims of widespread degradation, i.e., millions of hectares of barren land, could never be confirmed (e.g., [42]) despite a variety of remote sensing data and methods (Figure 4) that were used to document degraded land. Among those are the traditional hydroclimatic variables (evapotranspiration), erosion patterns, soils fertility or species composition. With satellite data, a new set of indicators have been tested and include albedo, Normalized Difference Vegetation Index (NDVI), Rain Use Efficiency (RUE), hyperspectral narrow bands, normalized surface reflectance, brightness temperature, Fraction of Absorbed Photosynthetic Active Radiation (FAPAR), biomass-NPP (Net Primary Production) derivatives, vegetation water content, and land-atmosphere exchanges of carbon (NEE) and energy [40,43]. Relationships among these data are performed to develop deterministic models that improve the assessment of land dynamics.
The most used index is the temporally aggregated NDVI; the ΣNDVI used to indicate a year round aggregation and the iNDVI to denote aggregation over the growing season—have been considered as a suited proxy for vegetation productivity, and thus trends in iNDVI and ΣNDVI might be used as an indicator of changes in vegetation productivity.
Figure 3. Matched satellite images and ground photos of degradation phenomena in the Sahel: (a) Water erosion with gullies. (b) The loss of woody vegetation (red color in RapidEye) caused by poor management and climatic changes induces wind/water erosion of fertile topsoil (bright yellow color) and leaves only stony laterite (dark gray color). (c) Outcropping of hard rocks (black color) caused by soil degradation and forest/tree loss. (d) Clogging of ferruginous soils (white color), loss of topsoil and woody (red) and herb vegetation (gray) caused by overgrazing/trampling. RapidEye composites (bands 5-3-2) (left) and photos (right): (a–c) Mali December 2011, (d) Senegal September 2012.
Remotesensing 07 04048 g003
Several versions of the NOAA-AVHRR (National Oceanic and Atmospheric Administration—Advanced Very High Resolution Radiometer) data have been used to compute global trends of vegetation indices [17]. These various coarse scale products differ in terms of calibration, atmospheric corrections, compositing process and compensation for orbital drifts [17]. The most used products among those are Global Inventory Modeling and Mapping Studies (GIMMS) [44] and Long Term Data Record (LTDR) [45] and now GIMMS-3g datasets. GIMMS-3g is seen as performing better in terms of temporal change analysis and its consistency with the MODIS (Moderate Resolution Imaging Spectroradiometer) NDVI and the archive spans from 1981 to the present [46]. However, in its current version, GIMMS-3g is not without errors in the Sahelian region [47].
Other studies have tried to retrace the evolution of the Sahel using LANDSAT (30 m) archives to examine changes in land cover. Brink and Eva [48], for example, assessed changes in broad land cover classes and showed a 57% increase in agriculture area at the expense of savanna vegetation. They also found a decrease in vegetation cover by 21% over the period 1975–2000, with nearly five million hectares forest and non-forest natural vegetation lost per year. At lower resolution, Budde et al. [49] used NDVI from AVHRR-1 km and SPOT VEGETATION (VGT) to assess land cover performance in Senegal from 1992 to 2001 that showed similar trends in terms of agricultural extension. Using historic and recent aerial photography, Tappan et al. [50] reported a moderate land cover change from 1965 to 2000, a decrease in savanna from 74% to 70% concurring with an expansion of cropland from 17% to 21%. However, at the eco-region scale, they observed rapid change in some areas and relative stability in others revealing differential land dynamic trajectories. These results seem to contradict the recent increase in biomass production particularly in the northern Sahel side.
Some studies reported declines in species diversity and densities of trees. For example, Gonzalez [23] demonstrated with original field data that forest species richness and tree density in the West African Sahel declined in the last half of the 20th century. Average forest species richness in areas of 4 km2 in Northwest Senegal fell from 64 ± 2 species in 1945 to 43 ± 2 species in 1993, while tree density declined from 10 ± 0.3 ha−1 in 1954 to 7.8 ± 0.3 ha−1 in 1989 with direct implications for standing woody biomass. This decline and shift in biodiversity is confirmed by various studies [22,24,28,50]. Herrmann and Tappan [24] found a decline in tree populations, an increase in shrub density, and a decline in species diversity interpreted as a shift towards more arid-tolerant species. Gonzalez et al. [22] found a general decline in tree density and diversity in the western Sahel, which they linked to global climate change. Consequently, these changes have shifted higher diversity and density vegetation zones toward areas of higher rainfall towards the south.
Recent studies suggest more diverse changes in tree cover and species diversity. While Spiekermann et al. [51] found an encroachment of degraded areas (+10%) in the ferruginous Sahel and a general tree cover decline in the sandy Sahel of Mali (−4%) from 1967 to 2011, they also reported a significant increase of tree cover in proximity to village areas, independent from soil type (+10%). However, the studied time frame can be decisive and lead to opposing results. The above studies compared the situation before and after the Sahelian droughts. Several local studies in Senegal and Mali, that compared baseline established during the droughts with the post drought situation show that in many areas tree cover has been increasing since the 1980s [28,47,52,53,54], with leaf biomass of woody species almost doubling at several monitoring sites. This recovery of the tree layer, which is driven by rainfall, is considered an important factor explaining the greening of the Sahel [25,46].
It is easy to assume that the re-greening of the Sahel would have led to a concurrent improvement of ecosystem services and livelihoods. Recent perception studies question the validity of such linear thinking. For example, a study by Herrmann et al. [55] using participatory methods in Senegal showed that local people may still perceive a degradation of their ecological services, despite living in a pixel with apparent greening and positive vegetation trends. This implies that the perceived improvements of ecosystem services are much more than a simple positive greenness trend in satellite data. This again challenges the prevailing assumption that the greening represents a rehabilitation of the vegetation and goes along with positive effects on people’s livelihoods.
Figure 4. The evolution of remote sensing data and methods used in assessing land degradation in the Sahel. LAI (Leaf Area Index); NDVI (Normalized Difference Vegetation Index); PCA (Principal Component Analysis); WUE (Water Use Efficiency).
Remotesensing 07 04048 g004

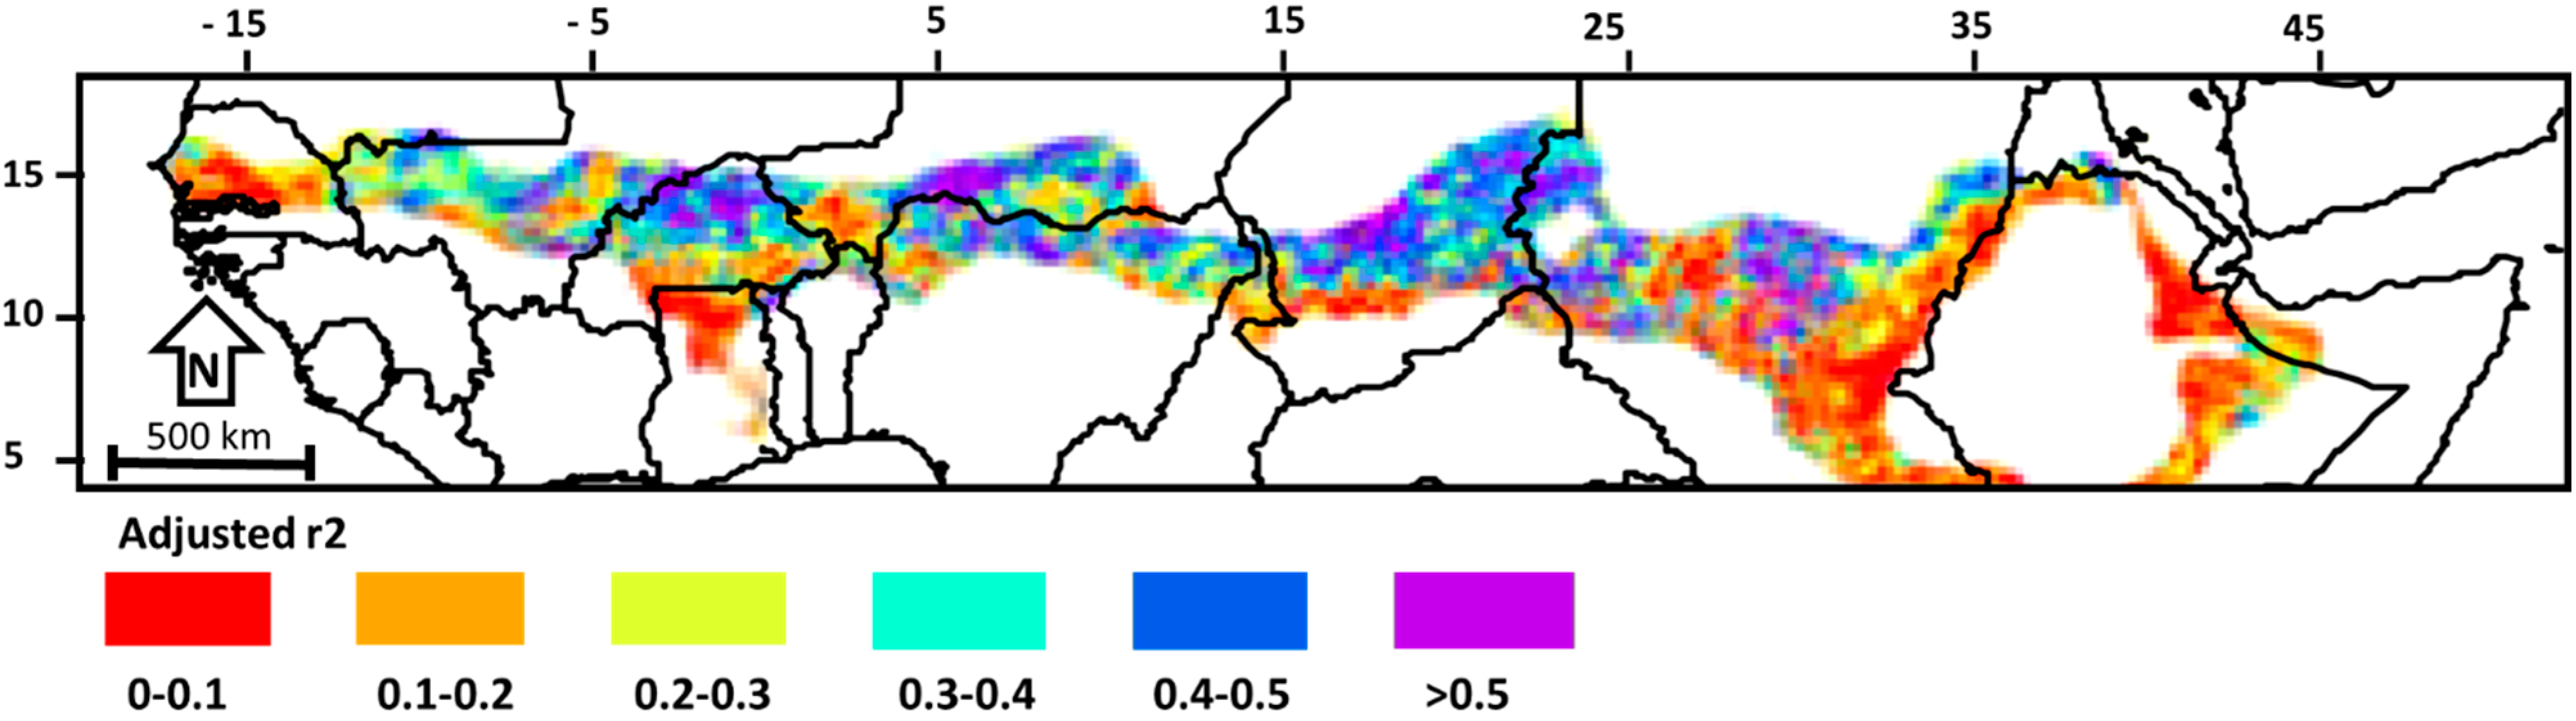
4.2. The Greening Sahel Phenomenon

The entire Sahel was documented by many authors—not all—as having an overall positive trend in the NDVI [35,46,56,57,58]. These studies among others agreed on this re-greening from 1982 to 2012 period and all were based on NOAA-AVHRR products. Recent trends based on higher spatial resolution but shorter-term MODIS data (2000–2013) yielded less univocal conclusions and revealed spatial heterogeneity in trends. Some analyses even showed a browning or no trend over this period [40]. Rasmussen et al. [34] and Brandt et al. [54] found a negative trend in NDVI (MODIS data 2000–2012) in Northern Burkina Faso and the Dogon region in Mali respectively. In the pastoral region of Gourma (Mali), Dardel et al. [17] found a re-greening trend (1984–2011) mostly over sandy soils but not in other pedological units.
The challenges in analyses of the Sahel greening is to document consistently the role of the underlying factors and to attribute the greening to individual or combinations of proposed processes. Despite the appeal to attribute the greening to climate variability, it has been recognized that rainfall alone does not fully explain the observed trends [17,34]—see also regression coefficients in Table 1. These results suggest a role for other human induced factors; yet, distinguishing climate related change from human induced change is a big challenge, because of the limited ground datasets or land cover maps at a regional scale and with a sufficient time depth [35]. The use of models [59,60] to test the relative importance of various factors is also limited by lack of validation data.
Fensholt et al. [61] hypothesized that RUE—the ratio between NPP and rainfall—is a good indicator that highlights the role of factors that are not related to precipitation. Temporal changes in RUE are supposed to reflect degradation—or the reverse—of the vegetation cover, because it reflects changes in the efficiency of the use of rainwater in primary production. Another approach to distinguish rainfall-related variations and trends from human-induced land degradation is the Residual Trend Analysis (RESTREND), which regresses the growth season aggregated NDVI (iNDVI) and accumulated rainfall for each pixel, to analyze trends in the residuals, i.e., the observed NDVI minus the NDVI predicted from rainfall, as a method to detect trends in human impact on vegetation productivity [16]. The weak accuracy of available rainfall datasets (field based and remotely sensed) limits the value of RUE and RESTREND approaches to tease out the impact of non-rainfall related factors [62]. Still, contrasted changes in the landscape’s functioning add another level of complexity when increase in erosion and run-off processes is for example associated with decreasing or stable vegetation cover in some areas (Sahel Paradox) [63].
For a long time, the greening of the Sahel has been attributed to more vigorous growth of the herbaceous vegetation, rather than tree cover [17]. This allegation diverges from recent findings by Brandt et al. [52] who monitored several sites in Senegal in terms of in situ measured herb and tree biomass and species composition over 27 years (1987–2013). They found that herbaceous vegetation productivity is highly variable, with no significant long-term trend as opposed to tree biomass, which increased concurrent with the observed trend in vegetation greenness. Because of this, Brandt et al. [52] postulated that the greening of the Sahel might be caused by an increase in tree cover. This result can be consistent with the trend in ΣNDVI, which is considering beyond growing season greenness. Thus, long-living trees seem to have a higher footprint in long-term ΣNDVI time series as compared to herbs.
For all these reasons, trends in the relationship between the annual NDVI and rainfall may be different depending on the eco-climatic region considered, hence a need to account for internal heterogeneity of the Sahel [64] (see Table 1 and Figure 5). Other factors impact NDVI dynamics, such as the land degradation/restoration or the land use change, both of which being constrained by climate and human activities [35]. Additionally, there are many uncertain relationships between spectral radiance and ecosystem structure and functions that require long-term vegetation ground observations to validate or help interpret satellite observations [17,23,27,47,52].
Most studies used linear least square regression to investigate the temporal trends of the integrated NDVI and rainfall anomalies (z-scores). The correlation between maximum aboveground biomass and any of the environmental variables (NDVI, FAPAR, etc.) is only moderate in many studies (Table 1 and Figure 5), often related to conversion and scale issues. No conclusion can be made about what caused high productivity years unless we explore more the role and importance of species composition, the role of grazing, fires, or herbivory [27,36].
Figure 5. Spatial variation of multiple regression of annual summed GPCP (Global Precipitation Climatology Project) precipitation and annual mean air temperature on annual integrated GIMMS NDVI 1982–2007 (adjusted r2 values) (original data in Fensholt et al., [65]).
Remotesensing 07 04048 g005
Table 1. Correlation coefficients between NDVI, rainfall and biomass in different studies in the Sahel from 1982 to 2013. Different data, scale and periods lead to varying results.
StudyNDVI/
Biomass
NDVI/
Rainfall
NDVI TrendDataPeriodArea
Tagesson et al. [40]-r² = 0.39no trendin situ NDVImax2002–2012Dahra, Senegal
Rasmussen et al. [34]-r² = 0.29-MODIS, NDVI growing season2000–2012Northern Burkina Faso
Dardel et al. [17]r² = 0.59/0.38-0.05/−0.04 units/periodGIMMS3g growing season, herb biomass1984–2011/
1994–2011
Gourma, Mali/Fakara, Niger
Brandt et al. [52]r² = 0.57r² = 0.7836%/periodLTDR/VGT sum, TAMSAT, herb + leaf biomass1987–2013Senegal
Meroni et al. [41]r² = 0.34--VGT FAPAR, herb biomass1998–2013Matam, Senegal
Anyamba et al. [46]-r² = 0.38-GIMMS-3g and various rainfall data sources1983–2012all Sahel
Fensholt et al. [61]-r² = 0.420.046GIMMS3g sum1982–2010all Sahel
Mbow et al. [36]r² = 0.39--in situ NDVI, biomass2006–2010Dahra, Senegal
Fensholt et al. [65]-most pixels r² < 0.5-GIMMS NDVI, GPCP1981–2007all Sahel
Fensholt et al. [66]r² = 0.49/0.37--MODIS C4/C4-5 NPP, biomass2001Dahra, Senegal
Li et al. [67]-r² = 0.89 /0.71/0.73/0.3-GIMMS NDVI1982–1997stepps/ agriculture/savanna/woodland Senegal

5. Data Limitations and Prospects of Remote Sensing Applications for Land Degradation

Being aware of the current state-of-the-art methods and their limitations is the first step to approach methodological challenges. The possibilities and limitations in using remotely-sensed data to assess and monitor land degradation are shown in Table 2. An additional overview is given in Knauer et al. [74]. It is obvious that monitoring techniques are related to vegetation greenness and landscape patterns, whereas biodiversity and livelihoods cannot be directly addressed. The major advantage of satellite images in relation to vegetation change studies is the overview created by the coverage of areas of national or regional scale in a repetitive way that reduce labor-required for repeated vegetation investigations. A comparison of vegetation cover might facilitate interpretation of vegetation changes [68,69] mostly when coarse satellite images are recorded at a high temporal frequency. This is an important factor, as the Sahel covers very dynamic eco-regions with considerable intra- and inter-annual variations.
There are three major drawbacks to gaining information about vegetation change using archived EO data. First, only relatively short time series with approximately 30 years of data are available. In West Africa, this is further complicated by the fact that most time series start just after the last major drought (1983–1984), which makes the first points in the time series extreme. Second, the reflectance in satellite images is made up by the reflectance from the vegetation linked with a reflectance from soil and atmosphere that might be more influential than subtle vegetation changes [70]. And third, until present, the relation between vegetation parameters, apart from photosynthetic activity, and the spectral variation in satellite images is poorly understood.
Recent initiatives that incorporate GIMMS time series (and the new generation GIMMS-3g), LTDR, SPOT-VGT, and MODIS products have shown a great interest in a systematic study of the Sahel vegetation trend over three decades. GIMMS and LTDR have a very coarse spatial resolution (5–8 km) but range back to the beginning of the 1980s, and especially GIMMS has been intensively used for long-term vegetation trend assessments (e.g., [17,46,56,61,71]). MODIS is available since 2000 with 250 m resolution [66] and SPOT VGT since 1998 with 1 km spatial resolution. Studies comparing the datasets indicate a fairly high consistency at regional scale, but discrepancies exist, especially at the local scale [17,47,72]. Linkages with long time series of in situ biomass data imply that observed trends are realistic [17,52], however, whereas degradation is rarely visible at 8 km, MODIS, SPOT VGT and high resolution imagery (Figure 4) clearly identify areas with a reduction of vegetation cover, despite increasing rainfall [49,54,73]. This active degradation is often hidden in GIMMS pixels, not only due to the coarse resolution, but also the processing methods (input reflectance, retrieval algorithms) of the datasets. This is shown by Brandt et al. [47], who identified degraded areas, not captured by GIMMS, using likewise coarse Geoland GEOV1 FAPAR data. Nevertheless, a slightly higher resolution of LTDR NDVI reveals a more detailed spatial pattern of vegetation trends in Mali and Senegal. As all long time series start during a dry period and end in a wet period, areas without positive greenness trend were considered as degraded. These areas were verified by high-resolution imagery and field work, and account for approximately 5% of the study areas [47,54].
However, the overall results have mostly shown that the Sahel is greening, with various controversies between botanists and geographers. Rasmussen et al. [75] stated that, even though with opposing results, most statements are correct because scientists see vegetation from different points of views. Rasmussen et al. [75] recall the biases linked to our acquired knowledge that guides the rationale of each specialist’s research. Moreover, a study by Seaquist et al. [59] supports that herding or grazing does not appreciably affect vegetation dynamics in the region. Either people have not had a significant impact on very coarse scale vegetation dynamics in the Sahel, or the identification of a human “footprint” is precluded by inconsistent or subtle vegetation response to complex socio-environmental interactions.
Additionally, the apparent “greening” of the Sahel, based on NDVI, is itself debated. Some research show that evapotranspiration over much of the Sahel has been declining over the past 30 years [76], which is attributed mostly to temperature-driven increases in atmospheric demand [11]. The latter is backed up by AMMA (African Monsoon Multidisciplinary Research) results that show runoff and groundwater storage over much of the Sahel is increasing. We would expect this response if agricultural land was expanding, because crops have lower evapotranspiration (shorter growing season), higher runoff (lower vegetation cover), and are “greener”.
Table 2. Indicators and limitations to monitor land degradation using Earth Observation data.
Degradation IndicatorExamples of EO ApplicationsData ExampleLimitationsExample Study
Trends in greenness Vegetation greenness time series linear trend analysisAVHRR (GIMMS-3g)Does not distinguish between crops, trees, grass, species; depends mostly on rainfall; driver of change remains unclear; coarse data mixes various processesDardel et al. [17]
Land productivityRain use efficiency, NPPAVHRR, VGT, MODISMixed pixels, unreliable rainfall data, quality of production unknown, translation to biomass highly dependant to environmental conditionsFensholt and Rasmussen [78]
Land use/cover changeHigh resolution post-classification comparisonLandsat, Quickbird, ASTERDynamics and inter/intra-annual variability are hardly captured, no information on speciesMbow et al. [77]
Water use efficiencyEvapotranspirationLTDR (AVHRR)Does not distinguish between species; depends mainly on climate reanalysis (water and energy); driver of change remains unclear; coarse data mixes various processesMarshall et al. [76]
Water resources degradationMedium resolution time series classificationMODIS, LandsatCloud cover over water bodies; misclassifications due to similar spectral propertiesMoser et al. [78]
Wind/water erosion, tree cover lossHigh resolution visual inspectionCorona, Quickbird, RapidEyeQualitative, hard to quantify, little information on speciesTappan et al. [50]

6. Main Research Gaps in Assessing Trends in Land Degradation in the Sahel-Sudan

There is a need for more information on the nature of interactions among drivers of land degradation in the Sahel. Many studies show the importance of long-term rainfall effects on productivity [25], but little on the effects of increased extreme events (drought and floods) and how non-linear changes in climate and human activity have impact on land dynamics. Issues to be addressed include the predictability of thresholds of human-climate dynamics or structural characteristics of changing land architecture [10]. In detail, we identified seven emerging research areas that could be articulated along the list of points below.
  • There are major gaps for well-documented, comparable, time series of key indicators for many ecosystem features that increase the knowledge of the condition and trends on land degradation in the Sahel. This long-term survey data comparison requires a multi-scale and multi-thematic connection of many studies. Recent attempts have been done by Dardel et al. [17] and Brandt et al. [52] to harness long-term connection of satellite observations with field data on vegetation diversity and productivity.
  • After many decades of remote sensing application in the Sahel, capacities are still limited for a rigorous and consistent monitoring of land use and land cover change. The Senegalese Centre de Suivi Ecologique (CSE) and the regional Center of AGRHYMET are among the very few examples of long-term efforts for quantifying land dynamics in the Sahel, because of the limited financial resources; and only then, these analyses are performed on a case study basis. Thus, many ground studies are restricted to few Sahelian countries (Table 1).
  • Because of the scarcity of data—despite the declassification of LANDSAT archives—information on land degradation in drylands is quite poor and limits the ability to assess consistent baseline of the state of land degradation and desertification.
  • There are some gaps on moderate spatial resolution LANDSAT archives. Specifically, no images are available in the USGS archive for the years 1976–1983 and 1989–1998 for the majority of path/rows [79], and these periods correspond with the severe droughts with obvious implication on land degradation. AVHRR data are considerably more abundant, but at a coarse resolution. This highlights the potential to use LANDSAT-AVHRR data fusion techniques (e.g., STAR-FM: Gao et al. [80]) to improve the spatio-temporal quantification of land dynamics.
  • Differentiation of scales of the biophysical studies opposing remote sensing specialists and botanist on the ground lead to many inconsistent messages (degradation/recovery). This is underlined by Rasmussen et al. [75] as apparent contradiction that can affect how land dynamics are perceived in the area and what strategy is needed to be taken to reduce land degradation.
  • Not enough attempts for long-term field based survey of land dynamics have been made, and those are limited to Niger [17], Mali [27,28,81] and Senegal [36,52,72] (Table 1).
  • Local perceptions of land degradation/improvements often disagree with EO analyses [55], and there is a need for more interdisciplinary studies. Remote sensing based analysis of land degradation focuses on using geospatial biophysical data only, while several new socioeconomic geospatial datasets now exist and could be integrated with these data giving a more comprehensive quantification of change [82].

7. Conclusions

The study reveals that multi-scale Earth Observation (EO) analyses does not show until now any clear trend in the process of desertification nor the greening paradigms, as both attempt are simplification of very complex realities. We found that heterogeneity is an issue of scale, and very coarse-scaled vegetation trend analyses reveal a greening Sahel, sometimes with good confidence, while local-scale studies are not uniform, observing greening and degradation at the same time.
The Sahel is known for its high climate variability and this depicts in high variations of Normalized Difference Vegetation Index (NDVI) signal measured by satellite data, making it difficult to interpret in terms of land degradation in a robust and consistent way. It appears from this study that there is no evidence on what the most appropriate EO indices are to be used for land degradation assessment [60,83,84]. Many contentious issues still exist and no clear consensus is achieved on the trend of land productivity, hence land degradation in this region.
Theoretically, Rain Use Efficiency (RUE) can normalize the inter-annual variability in NPP due to rainfall variability, and consequently provide an index of degradation that is independent of the effects of rainfall [35,42,61]. However, the interpretation of RUE requires more information on the topography, soil texture, soil fertility, vegetation type, and management regime, among other factors. A lot of controversies in the use of RUE come from the assumption that Net Primary Production (NPP) has a good correlation with rainfall. However, this condition is weak in most instances, mainly due to data and scale issues. Recently, the “residuals” method has emerged as another way of removing the climate signal from the NDVI time series. The differences between the observed NDVImax and the NDVImax predicted from the regression are used to assess the trend in the residuals then indicate changes in the NDVI response that are not due to climatic effects [16].
We found that the general lack of appropriate field data matching the satellite time series (1980s to present), including detailed land use dynamics information are the main limit of quantitative evaluation of land degradation in the Sahel. Field biomass data collections are scarce and there is a need to take stock of sparse studies that could be a good starting point for documenting biomass and ecological indicators. Also, the ground process leading to tree and grass species composition are not well connected to observations in inter-annual biomass and vegetation productivity variation, thus challenging dryland productivity models based on remote sensing.
Several sources of uncertainty associated with remote sensing products have been identified by Targesson et al. [40] and include sensor noise and degradation, calibration errors, atmospheric perturbations (water vapor, aerosols, clouds, scattering, etc.), retrieval algorithm errors, adjacency effects, scaling issues and anisotropic properties of land surface that depends on viewing/illumination geometry, and can cause substantial bias in remote sensing products (e.g., [85,86]). Therefore, the relationship between NDVI (either integral, average or maximum over a period) and ground-measured vegetation mass is limited by uncertainty in the relationship between NDVI and absorbed radiation, in the conversion of absorbed radiation in net primary production, and in the links between production and end of season biomass [17].
Different trend assessment methods, based on the same time series of satellite vegetation index data are quite inconsistent over time [16] and there is a big avenue of research in that area. Thus, to allow multiple perspectives and avoid erroneous interpretations caused by data quality/scale issues/generalizations, we recommend combining multiple data sources at multiple scales. Furthermore, we underline the relevance of field data and experience, and results achieved by remote sensing techniques should not be interpreted without contextual knowledge.

Acknowledgments

This work has been funded by the BIODEV project implemented in Burkina Faso and Sierra Leone and the CG Research Programme CRP 6.3 and 6.4 on Forest trees and agroforestry/Ecosystem Services. We thank Rasmus Fensholt of Copenhagen University for providing the spatial correlation data used in Figure 5.

Author Contributions

Cheikh Mbow conceived and designed the synthesis structure and content. Martin Brandt and Issa Ouedraogo supplemented the text and Jan De Leeuw and Michael Marshall completed the missing points and adjusted language. All authors contributed equally to writing and editing the paper.

Conflicts of Interest

The authors declare no conflict of interest.

References

  1. UNCCD (UN Convention to Combat Desertification). Elaboration of an International Convention to Combat Desertification in Countries Experiencing Serious Drought and/or Desertification, Particularly in Africa. Available online: http://www.preventionweb.net/files/5650_convunccdeng.pdf (accessed on 15 December 2014).
  2. Oldeman, L.R.; Hakkeling, R.T.A.; Sombroek, W.G. World Map of the Status of Human-Induced Soil Degradation: An Explanatory Note; ISRIC: Wageningen, The Netherlands, 1990. [Google Scholar]
  3. Ickowicz, A.; Ancey, V.; Corniaux, C.; Duteurtre, G.; Poccard-Chappuis, R.; Touré, I.; Vall, E.; Wane, A. Crop-Livestock Production Systems in the Sahel—Increasing Resilience for Adaptation to Climate Change and Preserving Food Security. Available online: http://animalagclimatechange.org/wp-content/uploads/Building_Resilience_for_Adaptation.pdf#page=268 (accessed on 15 December 2014).
  4. Bai, Z.G.; Dent, D.L.; Olsson, L.; Schaepman, M.E. Global Assessment of Land Degradation and Improvement 1: Identification by Remote Sensing. Available online: http://www.isric.org/isric/webdocs/docs/Report%202008_01_GLADA%20international_REV_Nov%202008.pdf (accessed on 15 December 2014).
  5. Nachtergaele, F.O.; Licona-Manzur, C. The Land Degradation Assessment in Drylands (LADA) project: Reflections on indicators for land degradation assessment. In The Future of Drylands; Springer: New York, NY, USA, 2009; pp. 327–348. [Google Scholar]
  6. Reynolds, J.F.; Smith, D.M.S.; Lambin, E.F.; Turner, B.L.; Mortimore, M.; Batterbury, S.P.J.; Downing, T.E.; Dowlatabadi, H.; Fernandez, R.J.; Herrick, J.E.; et al. Global desertification: Building a science for dryland development. Science 2007, 316, 847–851. [Google Scholar] [CrossRef] [PubMed]
  7. Herrmann, S.M.; Hutchinson, C.F. The changing contexts of the desertification debate. J. Arid Environ. 2005, 63, 538–555. [Google Scholar] [CrossRef]
  8. Vlek, P.L.G.; Le, Q.B.; Tamene, L. Assessment of land degradation, its possible causes and threat to food security in Sub-Saharan Africa. In Food Security and Soil Quality; Taylor & Francis: Boca Raton, FL, USA, 2010; pp. 57–86. [Google Scholar]
  9. Riedacker, A. Climate change mitigation measures in the agroforestry sector and biodiversity future. In Proceedings of the Joint Workshop EEE Programme, ITCP, UNESCO-MAB, IIASA, ITCP, Trieste, Italy, 16–17 October 2006.
  10. Seto, K.C.; Reenberg, A. Rethinking Global Land Use in an Urban Era; MIT Press: Cambridge, MA, USA, 2014. [Google Scholar]
  11. Harrison, L.; Michaelsen, J.; Funk, C.; Marshall, M.; Tarnavsky, E.; Brown, M.E.; Husak, G.J. Crop water stress in a warming Sahel: Anticipating impacts with PET projections and a crop water balance model. 2015; Unpublished. [Google Scholar]
  12. Giannini, A.; Salack, S.; Lodoun, T.; Ali, A.; Gaye, A.T.; Ndiaye, O. A unifying view of climate change in the Sahel linking intra-seasonal, interannual and longer time scales. Environ. Res. Lett. 2013, 8. [Google Scholar] [CrossRef]
  13. Rasmussen, K. Land Degradation in the Sahel-Sudan: The Conceptual Basis. Available online: https://tidsskrift.dk/index.php/geografisktidsskrift/article/view/2579/4595 (accessed on 15 December 2014).
  14. Higginbottom, T.P.; Symeonakis, E. Assessing land degradation and desertification using vegetation index data: Current frameworks and future directions. Remote Sens. 2014, 6, 9552–9575. [Google Scholar] [CrossRef]
  15. Food and Agriculture Organization (FAO). Land Degradation Assessment in Drylands (LADA). Available online: http://www.unccd.int/en/programmes/Science/Monitoring-Assessment/Documents/PPT9-LADA%20lessons%20learned.pdf (accessed on 15 December 2014).
  16. Wessels, K.J.; van den Bergh, F.; Scholes, R.J. Limits to detectability of land degradation by trend analysis of vegetation index data. Remote Sens. Environ. 2012, 125, 10–22. [Google Scholar] [CrossRef]
  17. Dardel, C.; Kergoat, L.; Hiernaux, P.; Mougin, E.; Grippa, M.; Tucker, C.J. Re-greening Sahel: 30 Years of remote sensing data and field observations (Mali, Niger). Remote Sens. Environ. 2014, 140, 350–364. [Google Scholar] [CrossRef]
  18. L’Hote, Y.; Mahé, G.; Somé, B.; Triboulet, J.P. Analysis of a Sahelian annual rainfall index from 1896 to 2000; the drought continues. Hydrol. Sci. J. 2002, 47, 563–572. [Google Scholar] [CrossRef]
  19. Dregne, H.E. Land degradation in the drylands. Arid Land Res. Manag. 2002, 16, 99–132. [Google Scholar] [CrossRef]
  20. Vagen, T.-G.; Gumbricht, T. Sahel Atlas of Changing Landscapes: Tracing Trends and Variations in Vegetation Cover and Soil Condition. Available online: http://www.unep.org/dewa/Portals/67/pdf/Sahel_Atlas_lowres.pdf (accessed on 15 December 2014).
  21. Maydell, H.-J.V. Trees and Shrubs of the Sahel: Their Characteristics and Uses; Verlag Josef Margraf: Weikersheim, Germany, 1990. [Google Scholar]
  22. Gonzalez, P.; Tucker, C.J.; Sy, H. Tree density and species decline in the African Sahel attributable to climate. J. Arid Environ. 2012, 78, 55–64. [Google Scholar] [CrossRef]
  23. Gonzalez, P. Desertification and a shift of forest species in the West African Sahel. Clim. Res. 2001, 17, 217–228. [Google Scholar] [CrossRef]
  24. Herrmann, S.M.; Tappan, G.G. Vegetation impoverishment despite greening: A case study from central Senegal. J. Arid Environ. 2013, 90, 55–66. [Google Scholar] [CrossRef]
  25. Huber, S.; Fensholt, R.; Rasmussen, K. Water availability as the driver of vegetation dynamics in the African Sahel from 1982 to 2007. Glob. Planet. Change 2011, 76, 186–195. [Google Scholar] [CrossRef]
  26. Kandji, S.T.; Verchot, L.; Mackensen, J. Climate Change and Variability in the Sahel Region: Impacts and Adaptation Strategies in the Agricultural Sector. Available online: http://www.unep.org/Themes/Freshwater/Documents/pdf/ClimateChangeSahelCombine.pdf (accessed on 15 December 2014).
  27. Hiernaux, P.; Mougin, E.; Diarra, L.; Soumaguel, N.; Lavenu, F.; Tracol, Y.; Diawara, M. Sahelian rangeland response to changes in rainfall over two decades in the Gourma region, Mali. J. Hydrol. 2009, 375, 114–127. [Google Scholar] [CrossRef]
  28. Hiernaux, P.; Diarra, L.; Trichon, V.; Mougin, E.; Soumaguel, N.; Baup, F. Woody plant population dynamics in response to climate changes from 1984 to 2006 in Sahel (Gourma, Mali). J. Hydrol. 2009, 375, 103–113. [Google Scholar] [CrossRef] [Green Version]
  29. Enfors, E.I.; Gordon, L.J.; Peterson, G.D.; Bossio, D. Making Investments in Dryland Development Work: Participatory Scenario Planning in the Makanya Catchment, Tanzania. Available online: http://www.ecologyandsociety.org/vol13/iss2/art42/ (accessed on 15 December 2014).
  30. Ouedraogo, I.; Tigabu, M.; Savadogo, P.; Compaoré, H.; Odén, P.C.; Ouadba, J.M. Land cover change and its relation with population dynamics in Burkina Faso, West Africa. Land Degrad. Dev. 2010, 21, 453–462. [Google Scholar]
  31. Niemeijer, D.; Mazzucato, V. Soil degradation in the West African Sahel. Environment 2002, 44, 20–31. [Google Scholar] [CrossRef]
  32. Tiffen, M.; Mortimore, M. Questioning desertification in dryland sub-Saharan Africa. Nat. Resour. Forum 2002, 26, 218–233. [Google Scholar] [CrossRef]
  33. Warren, A. Land degradation is contextual. Land Degrad. Dev. 2002, 13, 449–459. [Google Scholar] [CrossRef]
  34. Rasmussen, K.; Fensholt, R.; Fog, B.; Rasmussen, L.V.; Yanogo, I. Explaining NDVI trends in northern Burkina Faso. J. Geogr. 2014, 114, 17–24. [Google Scholar]
  35. Bégué, A.; Vintrou, E.; Ruelland, D.; Claden, M.; Dessay, N. Can a 25-year trend in Soudano-Sahelian vegetation dynamics be interpreted in terms of land use change? A remote sensing approach. Glob. Environ. Change 2011, 21, 413–420. [Google Scholar] [CrossRef]
  36. Mbow, C.; Fensholt, R.; Rasmussen, K.; Diop, D. Can vegetation productivity be derived from greenness in a semi-arid environment? Evidence from ground-based measurements. J. Arid Environ. 2013, 97, 56–65. [Google Scholar] [CrossRef]
  37. Van Vliet, N.; Reenberg, A.; Rasmussen, L.V. Scientific documentation of crop land changes in the Sahel: A half empty box of knowledge to support policy? J. Arid Environ. 2013, 95, 1–13. [Google Scholar] [CrossRef]
  38. Rasmussen, L.V.; Rasmussen, K.; Reenberg, A.; Proud, S. A system dynamics approach to land use changes in agro-pastoral systems on the desert margins of Sahel. Agr. Syst. 2012, 107, 56–64. [Google Scholar] [CrossRef]
  39. Rasmussen, L.V.; Reenberg, A. Collapse and recovery in Sahelian Agro-pastoral Systems: Rethinking trajectories of change. Ecol. Soc. 2012, 17. [Google Scholar] [CrossRef]
  40. Tagesson, T.; Fensholt, R.; Guiro, I.; Rasmussen, M.O.; Huber, S.; Mbow, C.; Garcia, M.; Horion, S.; Sandholt, I.; Holm-Rasmussen, B.; et al. Ecosystem properties of semiarid savanna grassland in West Africa and its relationship with environmental variability. Glob. Change Biol. 2014, 21. [Google Scholar] [CrossRef]
  41. Meroni, M.; Rembold, F.; Verstraete, M.M.; Gommes, R.; Schucknecht, A.; Beye, G. Investigating the relationship between the inter-annual variability of satellite-derived vegetation phenology and a proxy of biomass production in the Sahel. Remote Sens. 2014, 6, 5868–5884. [Google Scholar] [CrossRef] [Green Version]
  42. Prince, S.D.; de Colstoun, E.B.; Kravitz, L.L. Evidence from rain-use efficiencies does not indicate extensive Sahelian desertification. Glob. Change Biol. 1998, 4, 359–374. [Google Scholar] [CrossRef]
  43. Mbow, C.; Fensholt, R.; Nielsen, T.T.; Rasmussen, K. Advances in monitoring vegetation and land use dynamics in the Sahel. J. Geogr. 2014, 114, 84–91. [Google Scholar]
  44. Tucker, C.; Pinzon, J.; Brown, M.; Slayback, D.; Pak, E.; Mahoney, R.; Vermote, E.; el Saleous, N. An extended AVHRR 8-km NDVI dataset compatible with MODIS and SPOT vegetation NDVI data. Int. J. Remote Sens. 2005, 26, 4485–4498. [Google Scholar] [CrossRef]
  45. Pedelty, J.; Devadiga, S.; Masuoka, E.; Brown, M.; Pinzon, J.; Tucker, C.; Roy, D.; Ju, J.; Vermote, E.; Prince, S.; et al. Generating a long-term land data record from the AVHRR and MODIS Instruments. In Proceedings of the Geoscience and Remote Sensing Symposium, Barcelona, Spain, 23–28 July 2007.
  46. Anyamba, A.; Tucker, C.J. Analysis of Sahelian vegetation dynamics using NOAA-AVHRR NDVI data from 1981–2003. J. Arid Environ. 2005, 63, 596–614. [Google Scholar] [CrossRef]
  47. Brandt, M.; Verger, A.; Diouf, A.A.; Baret, F.; Samimi, C. Local vegetation trends in the Sahel of mali and Senegal using long time series FAPAR satellite products and field measurement (1982–2010). Remote Sens. 2014, 6, 2408–2434. [Google Scholar] [CrossRef]
  48. Brink, A.B.; Eva, H.D. Monitoring 25 years of land cover change dynamics in Africa: A sample based remote sensing approach. Appl. Geogr. 2009, 29, 501–512. [Google Scholar] [CrossRef]
  49. Budde, M.E.; Tappan, G.; Rowland, J.; Lewis, J.; Tieszen, L.L. Assessing land cover performance in Senegal, West Africa using 1-km integrated NDVI and local variance analysis. J. Arid Environ. 2004, 59, 481–498. [Google Scholar] [CrossRef]
  50. Tappan, G.; Sall, M.; Wood, E.; Cushing, M. Ecoregions and land cover trends in Senegal. J. Arid Environ. 2004, 59, 427–462. [Google Scholar] [CrossRef]
  51. Spiekermann, R.; Brandt, M.; Samimi, C. Woody vegetation and land cover changes in the Sahel of Mali (1967–2011). Int. J. Appl. Earth Obs. Geoinf. 2015, 34, 113–121. [Google Scholar] [CrossRef]
  52. Brandt, M.; Mbow, C.; Diouf, A.A.; Verger, A.; Samimi, C.; Fensholt, R. Ground and satellite based evidence of the biophysical mechanisms behind the greening Sahel. Glob. Change Biol. 2014, 21. [Google Scholar] [CrossRef]
  53. Tarchiani, V.; Vecchia, A.D.; Pini, G.; Laminou, A.M.; Toudjani, Z.; Maman, G. Approches méthodologiques et outils opérationnels pour la gestion des forêts classées en Afrique de l’Ouest: Le cas du Niger. Sci. Chang. Planet. 2008, 19, 261–267. [Google Scholar]
  54. Brandt, M.; Romankiewicz, C.; Spiekermann, R.; Samimi, C. Environmental change in time series—An interdisciplinary study in the Sahel of Mali and Senegal. J. Arid Environ. 2014, 105, 52–63. [Google Scholar] [CrossRef]
  55. Herrmann, S.M.; Sall, I.; Sy, O. People and pixels in the Sahel: A study linking coarse-resolution remote sensing observations to land users’ perceptions of their changing environment in Senegal. Ecol. Soc. 2014, 19. [Google Scholar] [CrossRef]
  56. Herrmann, S.M.; Anyamba, A.; Tucker, C.J. Recent trends in vegetation dynamics in the African Sahel and their relationship to climate. Glob. Environ. Change 2005, 15, 394–404. [Google Scholar] [CrossRef]
  57. Hickler, T.; Eklundh, L.; Seaquist, J.W.; Smith, B.; Ardö, J.; Olsson, L.; Sykes, M.; Sjöström, M. Precipitation controls Sahel greening trend. Geophys. Res. Lett. 2005, 32. [Google Scholar] [CrossRef]
  58. Anyamba, A.; Small, J.L.; Tucker, C.J.; Pak, E.W. Thirty-two years of Sahelian zone growing season non-stationary NDVI3g patterns and trends. Remote Sens. 2014, 6, 3101–3122. [Google Scholar] [CrossRef]
  59. Seaquist, J.W.; Hickler, T.; Eklundh, L.; Ardö, J.; Heumann, B.W. Disentangling the effects of climate and people on Sahel vegetation dynamics. Biogeosciences 2009, 6, 469–477. [Google Scholar] [CrossRef]
  60. Wessels, K.J.; Prince, S.D.; Malherbe, J.; Small, J.; Frost, P.E.; VanZyl, D. Can human-induced land degradation be distinguished from the effects of rainfall variability? A case study in South Africa. J. Arid Environ. 2007, 68, 271–297. [Google Scholar] [CrossRef]
  61. Fensholt, R.; Rasmussen, K.; Kaspersen, P.; Huber, S.; Horion, S.; Swinnen, E. Assessing land degradation/recovery in the African Sahel from long-term earth observation based primary productivity and precipitation relationships. Remote Sens. 2013, 5, 664–686. [Google Scholar] [CrossRef]
  62. Eklund, L.; Romanciewicz, C.; Brandt, M.; Samimi, C.; Doevenspeck, M. Data and methods in the environment-migration nexus: A scale perspective. Popul. Environ. 2015. in revision. [Google Scholar]
  63. Dardel, C.; Kergoat, L.; Hiernaux, P.; Grippa, M.; Mougin, E.; Ciais, P.; Nguyen, C.-C. Rain-use-efficiency: What it tells us about the conflicting Sahel Greening and Sahelian Paradox. Remote Sens. 2014, 6, 3446–3474. [Google Scholar] [CrossRef]
  64. Brandt, M.; Grau, T.; Mbow, C.; Samimi, C. Modeling soil and woody vegetation in the Senegalese Sahel in the context of environmental change. Land 2014, 3, 770–792. [Google Scholar] [CrossRef]
  65. Fensholt, R.; Proud, S.R. Evaluation of earth observation based global long term vegetation trends—Comparing GIMMS and MODIS global NDVI time series. Remote Sens. Environ. 2012, 119, 131–147. [Google Scholar] [CrossRef]
  66. Fensholt, R.; Sandholt, I.; Rasmussen, M.S. Evaluation of MODIS LAI, FAPAR and the relation between FAPAR and NDVI in a semi-arid environment using in situ measurements. Remote Sens. Environ. 2004, 91, 490–507. [Google Scholar] [CrossRef]
  67. Li, J.; Lewis, J.; Rowland, J.; Tappan, G.; Tieszen, L.L. Evaluation of land performance in Senegal using multi-temporal NDVI and rainfall series. J. Arid Environ. 2004, 59, 463–480. [Google Scholar] [CrossRef]
  68. Miehe, S.; Kluge, J.; von Wehrden, H.; Retzer, V. Long-term degradation of Sahelian rangeland detected by 27 years of field study in Senegal. J. Appl. Ecol. 2010, 47, 692–700. [Google Scholar] [CrossRef]
  69. Pelkey, N.W.; Stoner, C.J.; Caro, T.M. Vegetation in Tanzania: Assessing long term trends and effects of protection using satellite imagery. Biol. Conserv. 2000, 94, 297–309. [Google Scholar] [CrossRef]
  70. Treitz, P.; Rogan, J. Remote sensing for mapping and monitoring land-cover and land-use change—An introduction. Prog. Plan. 2004, 61, 269–279. [Google Scholar] [CrossRef]
  71. Fensholt, R.; Rasmussen, K. Analysis of trends in the Sahelian “rain-use efficiency” using GIMMS NDVI, RFE and GPCP rainfall data. Remote Sens. Environ. 2011, 115, 438–451. [Google Scholar] [CrossRef]
  72. Fensholt, R.; Rasmussen, K.; Nielsen, T.T.; Mbow, C. Evaluation of earth observation based long term vegetation trends—Intercomparing NDVI time series trend analysis consistency of Sahel from AVHRR GIMMS, Terra MODIS and SPOT VGT data. Remote Sens. Environ. 2009, 113, 1886–1898. [Google Scholar] [CrossRef]
  73. Martinez, B.; Gilabert, M.A.; García-Haro, F.J.; Faye, A.; Meliá, J. Characterizing land condition variability in Ferlo, Senegal (2001–2009) using multi-temporal 1-km Apparent Green Cover (AGC) SPOT Vegetation data. Glob. Planet. Change 2011, 76, 152–165. [Google Scholar] [CrossRef]
  74. Knauer, K.; Gessner, U.; Dech, S.; Kuenzer, C. Remote sensing of vegetation dynamics in West Africa. Int. J. Remote Sens. 2014, 35, 6357–6396. [Google Scholar] [CrossRef]
  75. Rasmussen, K.; Nielsen, T.T.; Mbow, C.; Wardell, A. Land Degradation in the Sahel: An Apparent Scientific Contradiction. Available online: http://rucforsk.ruc.dk/site/en/publications/land-degradation-in-the-sahel%28d04052f0-1b6b-11dd-a01e-000ea68e967b%29.html (accessed on 15 December 2014).
  76. Marshall, M.; Funk, C.; Michaelsen, J. Examining evapotranspiration trends in Africa. Clim. Dyn. 2012, 38, 1849–1865. [Google Scholar] [CrossRef]
  77. Mbow, C.; Mertz, O.; Diouf, A.; Rasmussen, K.; Reenberg, A. The history of environmental change and adaptation in eastern Saloum-Senegal—Driving forces and perceptions. Glob. Planet. Change 2008, 64, 210–221. [Google Scholar] [CrossRef]
  78. Moser, L.; Voigt, S.; Schoepfer, E.; Palmer, S. Multitemporal wetland monitoring in Sub-Saharan West-Africa using medium resolution optical satellite data. IEEE J. Sel. Top. Appl. Earth Obs. Remote Sens. 2014, 7, 3402–3415. [Google Scholar] [CrossRef]
  79. Roy, D.P.; Ju, J.; Mbow, C.; Frost, P.; Loveland, T. Accessing free Landsat data via the Internet: Africa’s challenge. Remote Sens. Lett. 2010, 1, 111–117. [Google Scholar] [CrossRef]
  80. Gao, F.; Masek, J.; Schwaller, M.; Hall, F. On the blending of the Landsat and MODIS surface reflectance: Predicting daily Landsat surface reflectance. IEEE Trans. Geosci. Remote Sens. 2006, 44, 2207–2218. [Google Scholar] [CrossRef]
  81. Hein, L.; de Ridder, N.; Hiernaux, P.; Leemans, R.; de Wit, A.; Schaepman, M. Desertification in the Sahel: Towards better accounting for ecosystem dynamics in the interpretation of remote sensing images. J. Arid Environ. 2011, 75, 1164–1172. [Google Scholar] [CrossRef]
  82. Marshall, M.T.; Husak, G.J.; Michaelsen, J.; Funk, C.; Pedreros, D.; Adoum, A. Testing a high-resolution satellite interpretation technique for crop area monitoring in developing countries. Int. J. Remote Sens. 2011, 32, 7997–8012. [Google Scholar] [CrossRef]
  83. Prince, S.D.; Wessels, K.J.; Tucker, C.J.; Nicholson, S.E. Desertification in the Sahel: A reinterpretation of a reinterpretation. Glob. Change Biol. 2007, 13, 1308–1313. [Google Scholar] [CrossRef]
  84. Vintrou, E.; Claden, M.; Begue, A.; Ruelland, D. Analysis of 1982–2006 Sudano-Sahelian vegetation dynamics using NOAA-AVHRR NDVI data and normalized rain-use efficiency. In Proceedings of the Geoscience and Remote Sensing Symposium, Cape Town, South Africa, 12–17 July 2009; Volume 4, pp. 833–836.
  85. Eklundh, L.; Jönsson, P.; Kuusk, A. Investigating modelled and observed Terra/MODIS 500-m reflectance data for viewing and illumination effects. Adv. Space Res. 2007, 39, 119–124. [Google Scholar] [CrossRef]
  86. Proud, S.R.; Zhang, Q.; Schaaf, C.; Fensholt, R.; Rasmussen, M.O.; Shisanya, C.; Mutero, W.; Mbow, C.; Anyamba, A.; Pak, E.; et al. The normalization of surface anisotropy effects present in SEVIRI reflectances by using the MODIS BRDF method. IEEE Trans. Geosci. Remote Sens. 2014, 52, 6026–6039. [Google Scholar] [CrossRef]

