
Correction: Tilly, N. et al. Fusion of Plant Height and Vegetation Indices for the Estimation of Barley Biomass. Remote Sens. 2015, 7, 11449–11480


| CSM-Derived Plant Height (m) | Fresh Biomass (g/m²) | Dry Biomass (g/m²) | |||||||||||
|---|---|---|---|---|---|---|---|---|---|---|---|---|---|
| n | min | max | SD | min | max | SD | min | max | SD | ||||
| 2013 | |||||||||||||
| 3 | 12 | 0.22 | 0.01 | 0.39 | 0.13 | 1282.92 | 491.00 | 2172.50 | 473.20 | 168.31 | 52.00 | 272.00 | 56.59 |
| 4 | 12 | 0.47 | 0.24 | 0.71 | 0.17 | 2891.54 | 1560.25 | 4465.50 | 806.12 | 415.31 | 205.00 | 725.00 | 146.02 |
| 5 | 12 | 0.78 | 0.58 | 0.99 | 0.13 | 5070.42 | 2668.75 | 7730.00 | 1561.62 | 883.38 | 434.50 | 1429.25 | 328.93 |
| 6 | 12 | 0.78 | 0.65 | 0.93 | 0.07 | 4631.73 | 2986.25 | 7655.75 | 1193.95 | 1258.88 | 886.75 | 1687.50 | 219.92 |
| Mean pre-anthesis period | 123.27 | 62.93 | 191.57 | 3081.63 | 1573.33 | 4789.33 | 946.98 | 489.00 | |||||
| Mean whole observed period | 138.77 | 77.06 | 220.24 | 42.14 | 3469.15 | 1926.56 | 5505.94 | 1008.72 | |||||
| 2014 | |||||||||||||
| 2 | 36 | 0.17 | 0.12 | 0.25 | 0.03 | 656.28 | 266.25 | 1116.50 | 202.07 | 89.01 | 33.00 | 155.25 | 27.66 |
| 3 | 36 | 0.41 | 0.34 | 0.52 | 0.04 | 2227.08 | 1226.75 | 3236.50 | 531.72 | 289.83 | 165.75 | 417.75 | 66.03 |
| 4 | 36 | 0.63 | 0.53 | 0.70 | 0.04 | 2825.48 | 1643.75 | 4162.00 | 603.19 | 465.49 | 276.62 | 706.65 | 97.89 |
| 5 | 36 | 0.81 | 0.69 | 0.99 | 0.05 | 3185.13 | 2106.50 | 5433.25 | 687.74 | 777.23 | 486.35 | 1271.35 | 156.02 |
| 6 | 36 | 0.78 | 0.66 | 0.99 | 0.05 | 3569.34 | 1994.75 | 6044.00 | 898.59 | 1166.38 | 652.60 | 1876.35 | 276.46 |
| Mean pre-anthesis period | 88.94 | 52.43 | 139.48 | 2223.49 | 1310.81 | 3487.06 | 506.18 | 405.39 | |||||
| Mean whole observed period | 99.71 | 57.90 | 159.94 | 23.72 | 2492.66 | 1447.60 | 3998.45 | 584.66 | |||||
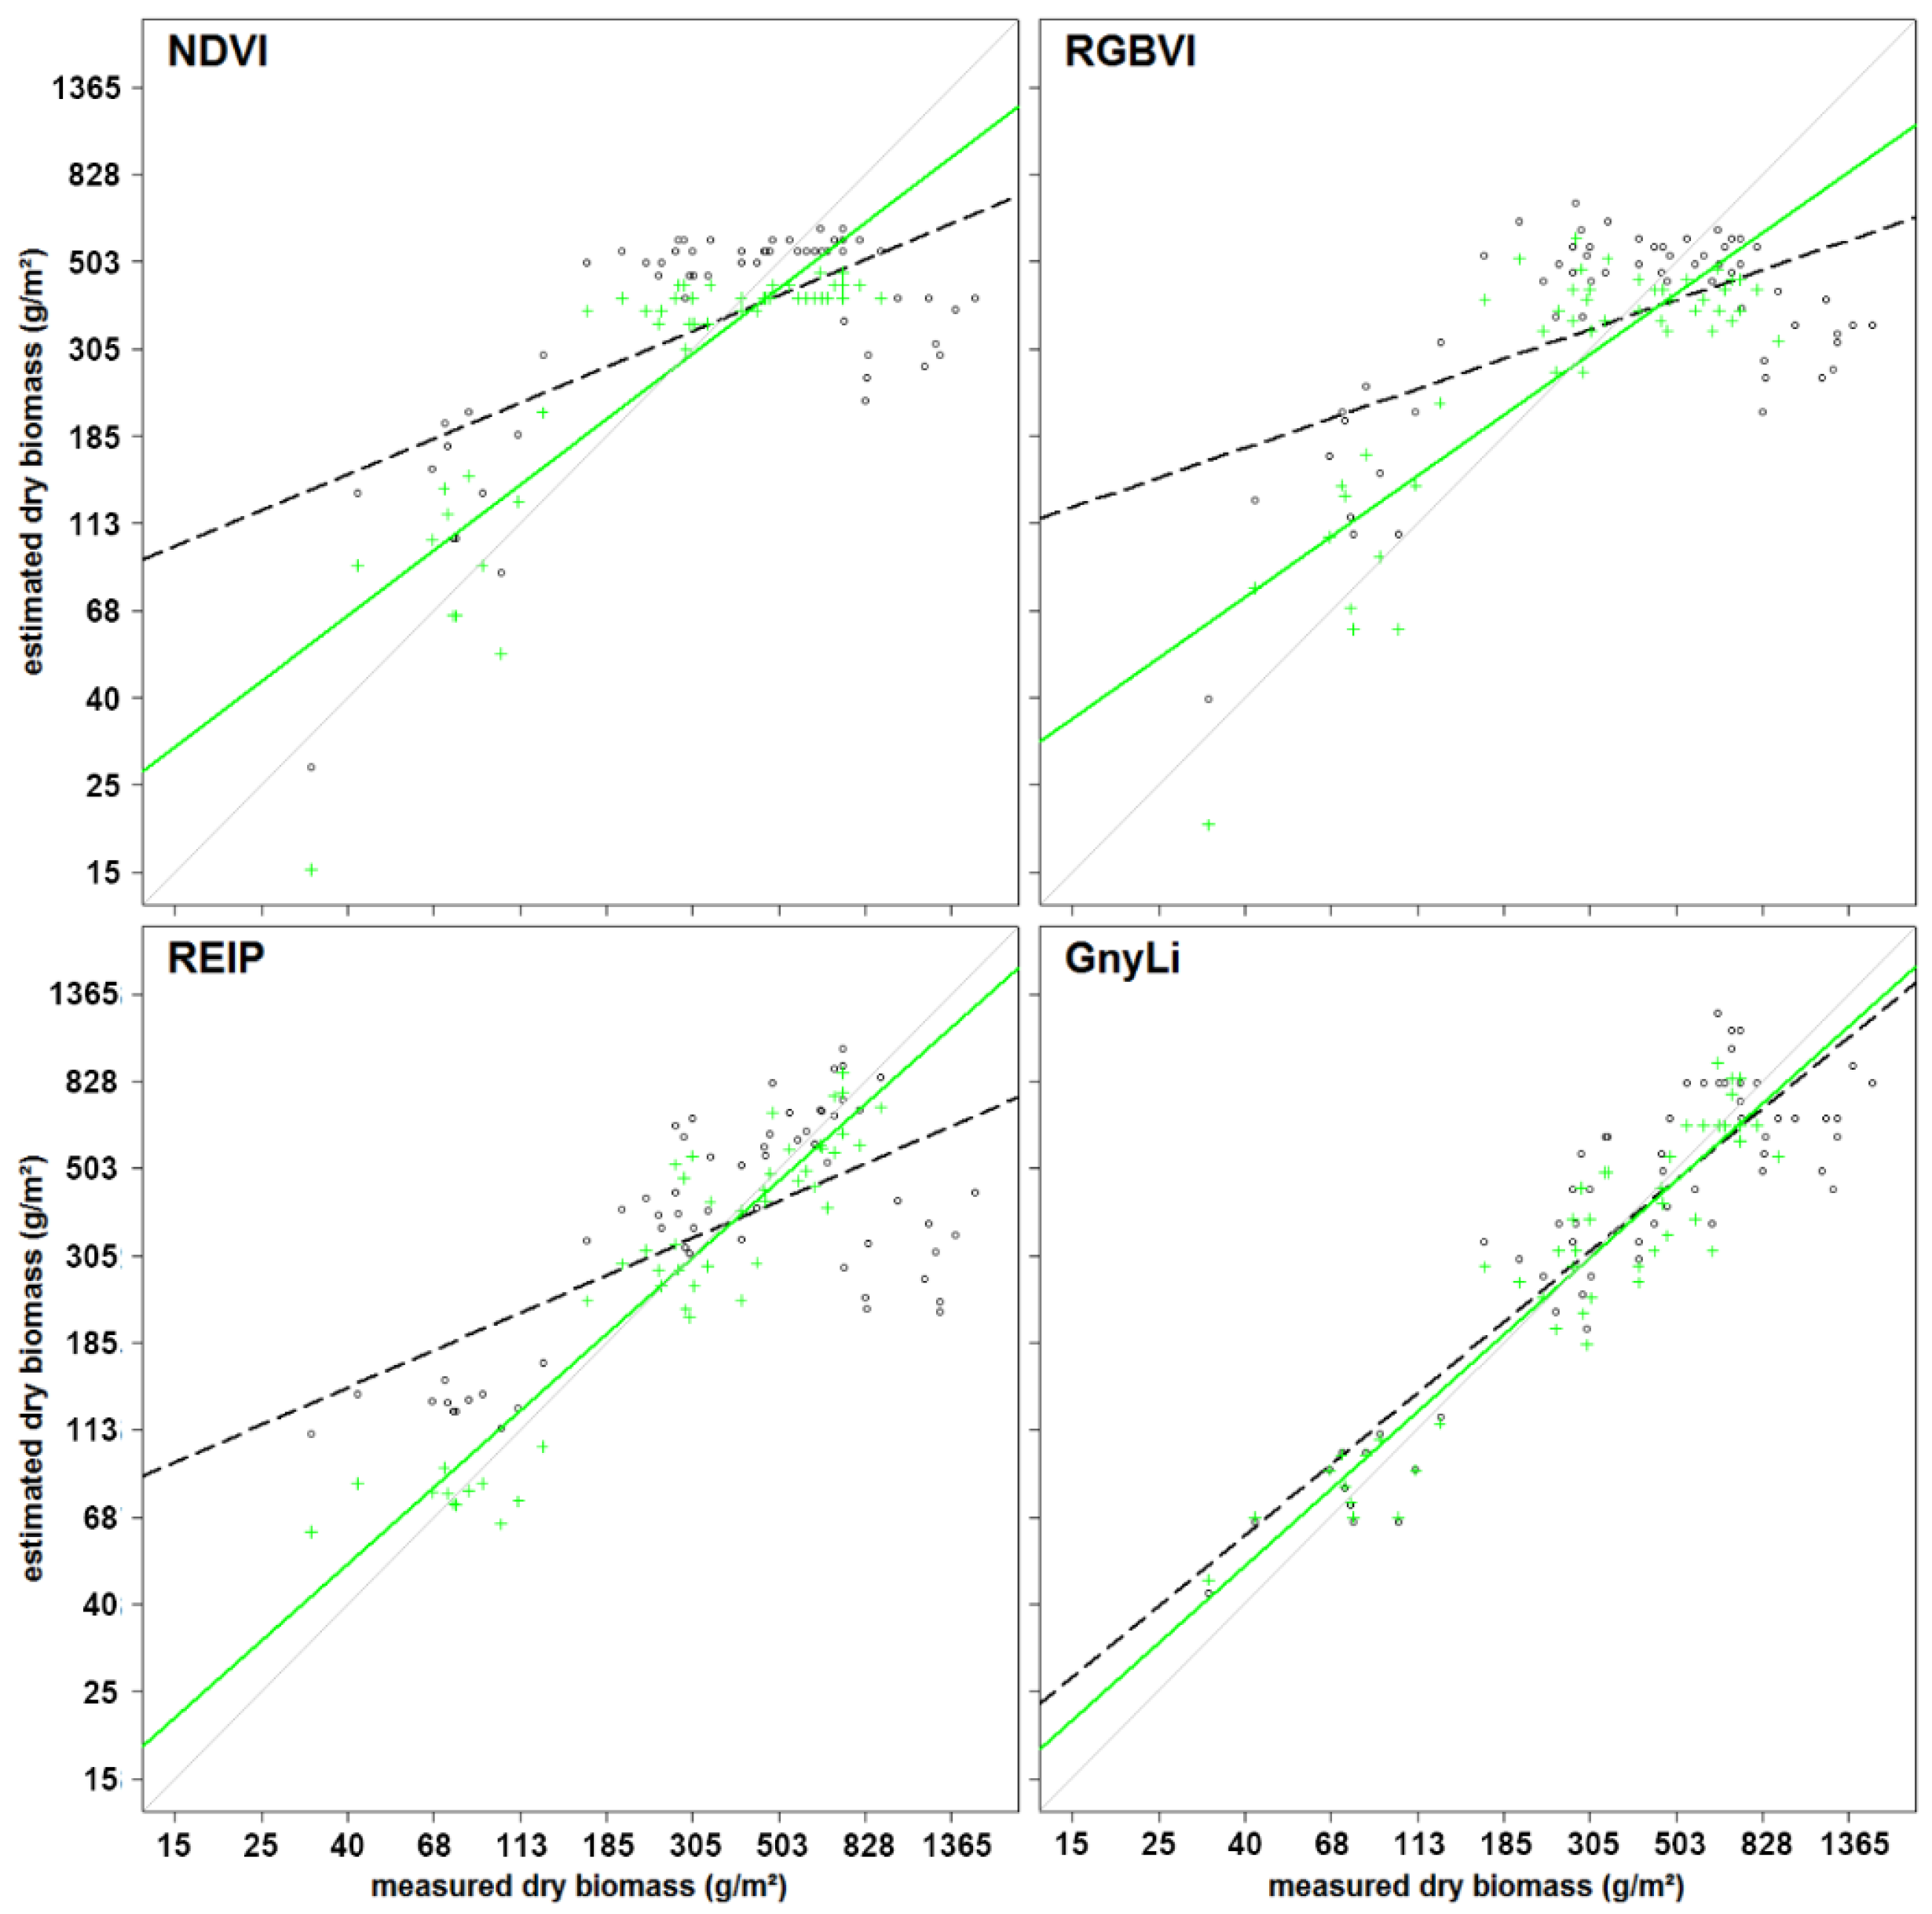
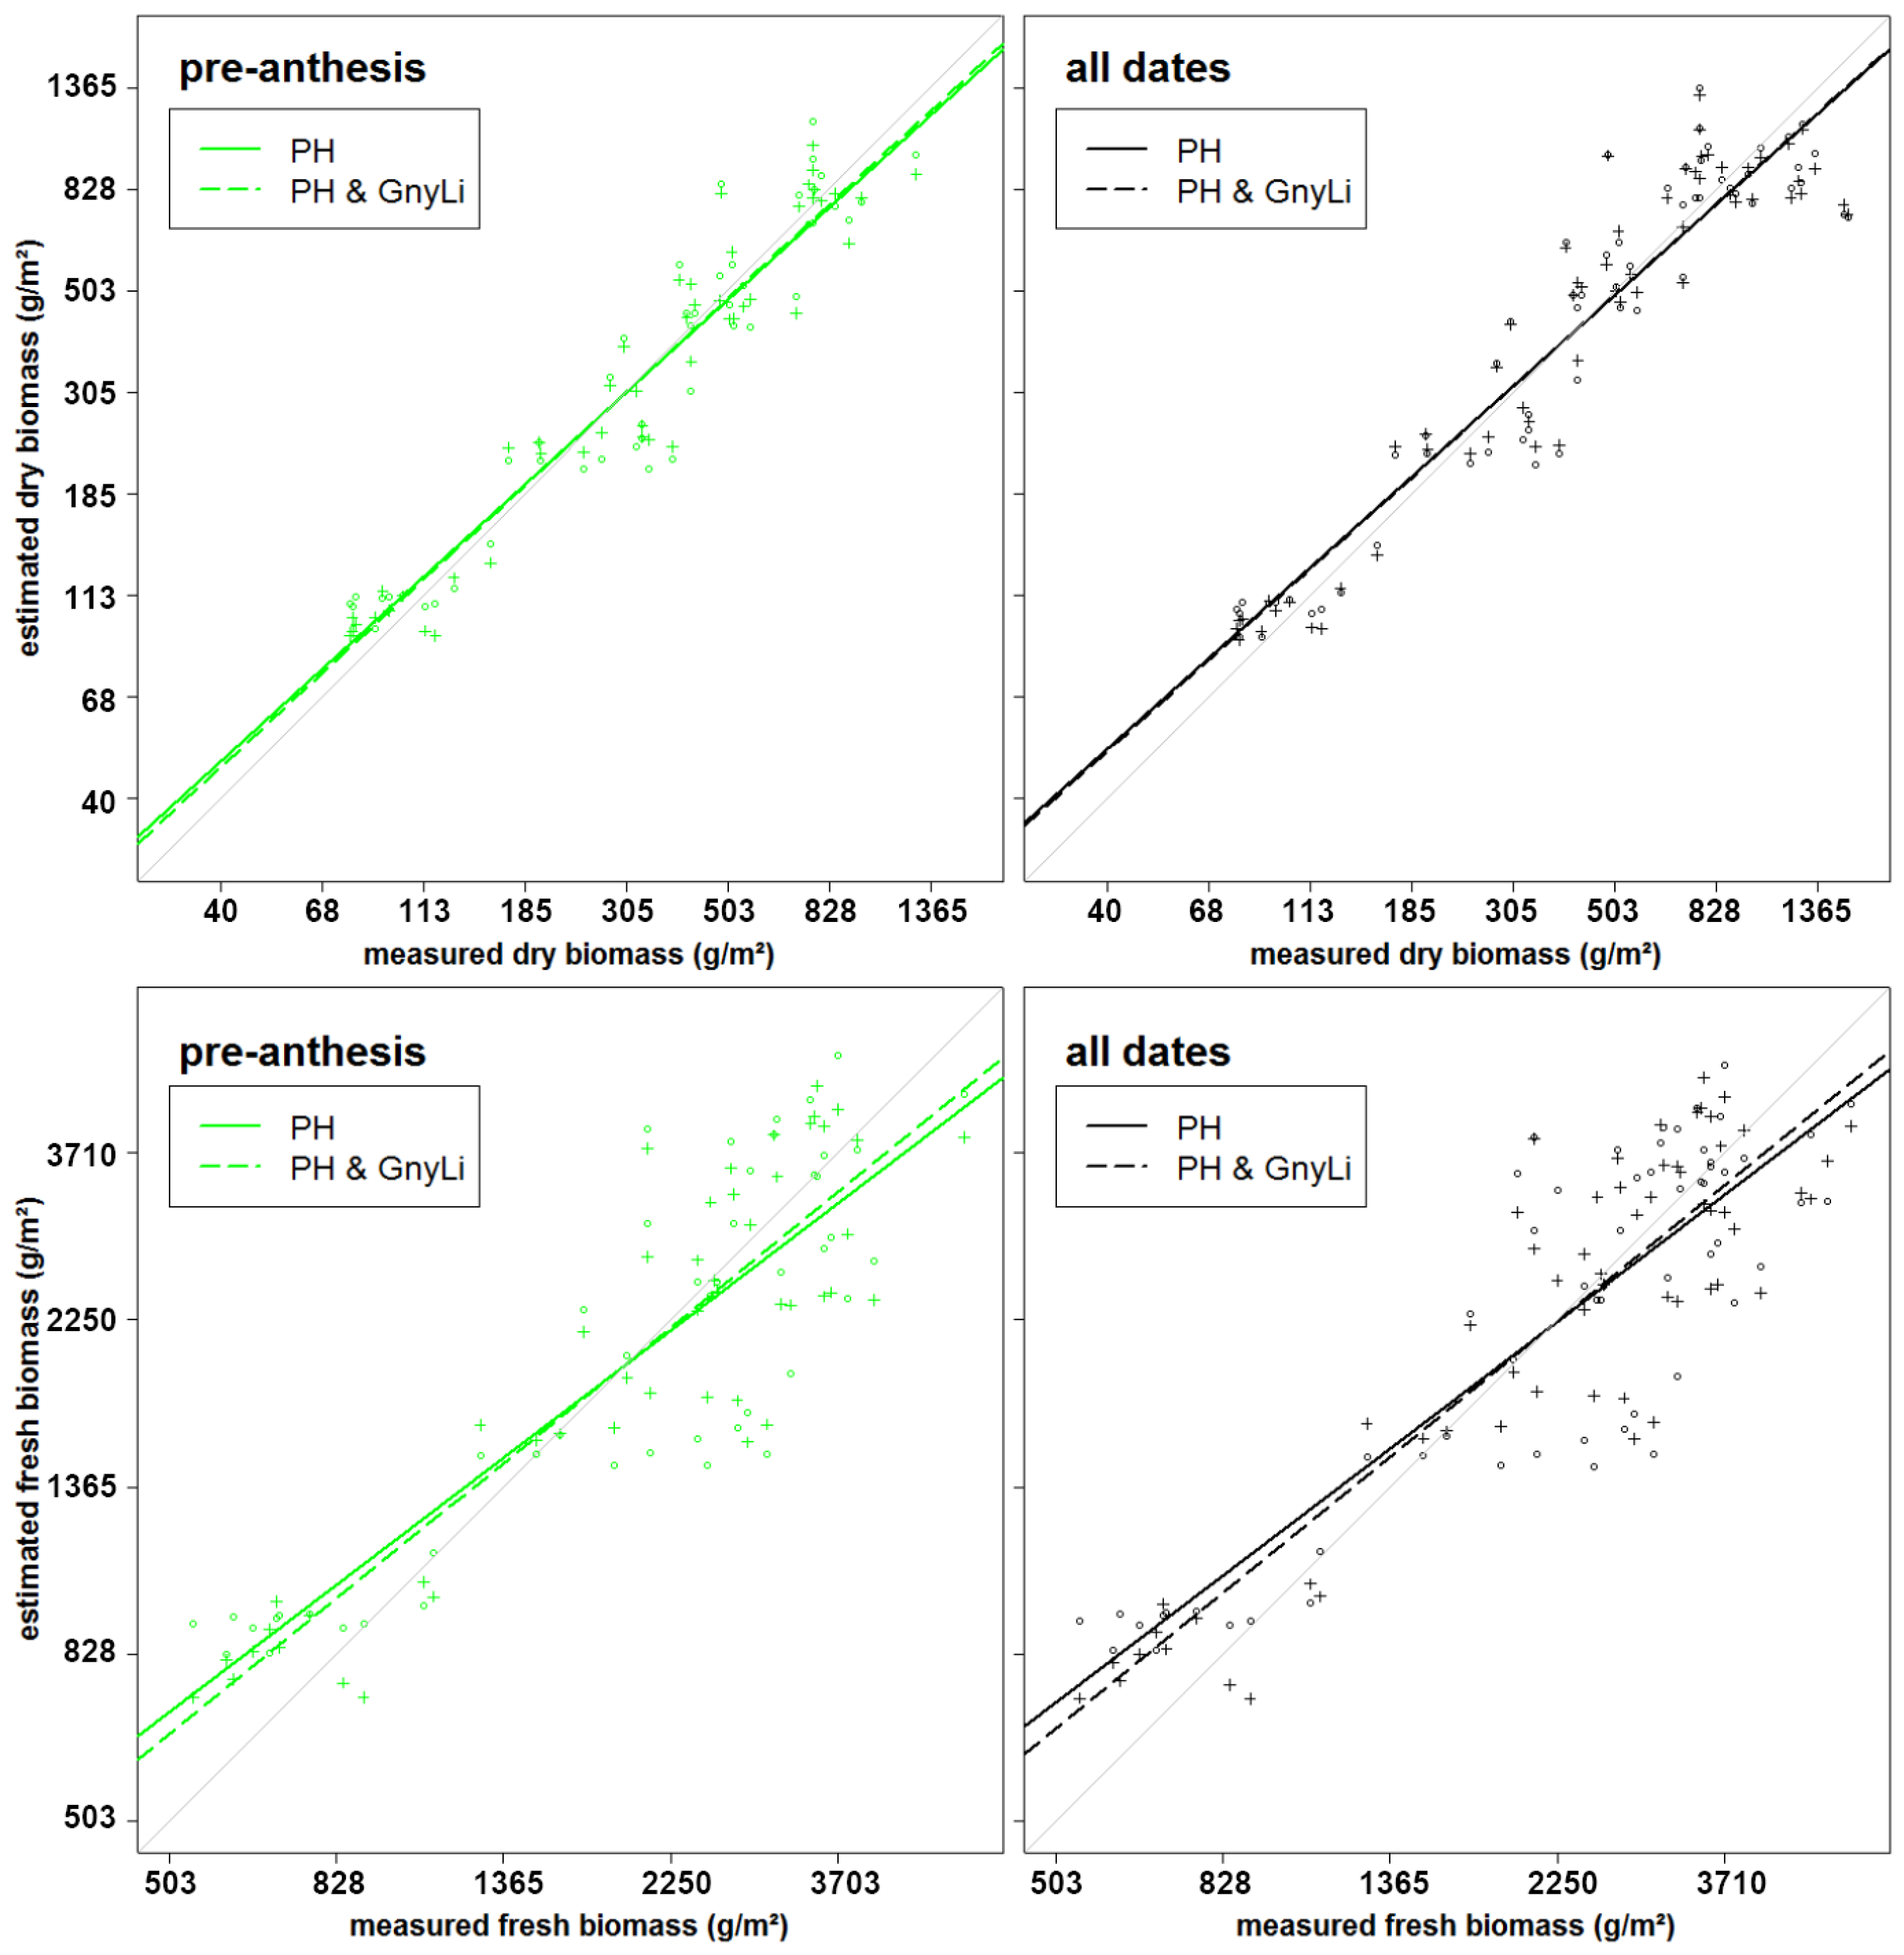
| Bivariate BRMs | Multivariate BRMs | ||||||||||
|---|---|---|---|---|---|---|---|---|---|---|---|
| Whole Period | Pre-Anthesis | Whole Period | Pre-Anthesis | ||||||||
| Estimator | R2 | SEE a | R2 | SEE a | Estimator b | R2 | SEE a | R2 | SEE a | ||
| Dry biomass | Linear | PH | 0.65 | 250.71 | 0.76 | 143.34 | |||||
| GnyLi | 0.52 | 293.80 | 0.68 | 166.75 | GnyLi | 0.65 | 865.76 | 0.77 | 635.30 | ||
| NDVI | 0.07 | 409.44 | 0.34 | 239.09 | NDVI | 0.69 | 537.36 | 0.76 | 518.25 | ||
| NRI | 0.54 | 289.57 | 0.70 | 159.97 | NRI | 0.65 | 876.08 | 0.77 | 621.60 | ||
| RDVI | 0.13 | 396.88 | 0.39 | 230.33 | RDVI | 0.69 | 479.48 | 0.76 | 535.08 | ||
| REIP | 0.12 | 398.08 | 0.58 | 189.95 | REIP | 0.73 | 48353.45 | 0.76 | 6462.41 | ||
| RGBVI | 0.05 | 413.80 | 0.26 | 252.59 | RGBVI | 0.68 | 557.08 | 0.76 | 580.76 | ||
| Exponential | PH | 0.84 | 0.37 | 0.84 | 0.34 | PH | |||||
| GnyLi | 0.80 | 0.42 | 0.85 | 0.32 | GnyLi | 0.86 | 2.43 | 0.88 | 2.14 | ||
| NDVI | 0.30 | 0.77 | 0.61 | 0.53 | NDVI | 0.85 | 2.85 | 0.88 | 3.99 | ||
| NRI | 0.81 | 0.40 | 0.87 | 0.30 | NRI | 0.87 | 2.29 | 0.89 | 1.96 | ||
| RDVI | 0.41 | 0.71 | 0.68 | 0.48 | RDVI | 0.85 | 2.52 | 0.88 | 2.84 | ||
| REIP | 0.37 | 0.73 | 0.77 | 0.40 | REIP | 0.84 | 30.39 | 0.86 | 48.43 | ||
| RGBVI | 0.23 | 0.81 | 0.48 | 0.60 | RGBVI | 0.85 | 2.51 | 0.87 | 2.73 | ||
| Estimator | R2 | SEE a | R2 | SEE a | Estimator b | R2 | SEE a | R2 | SEE a | ||
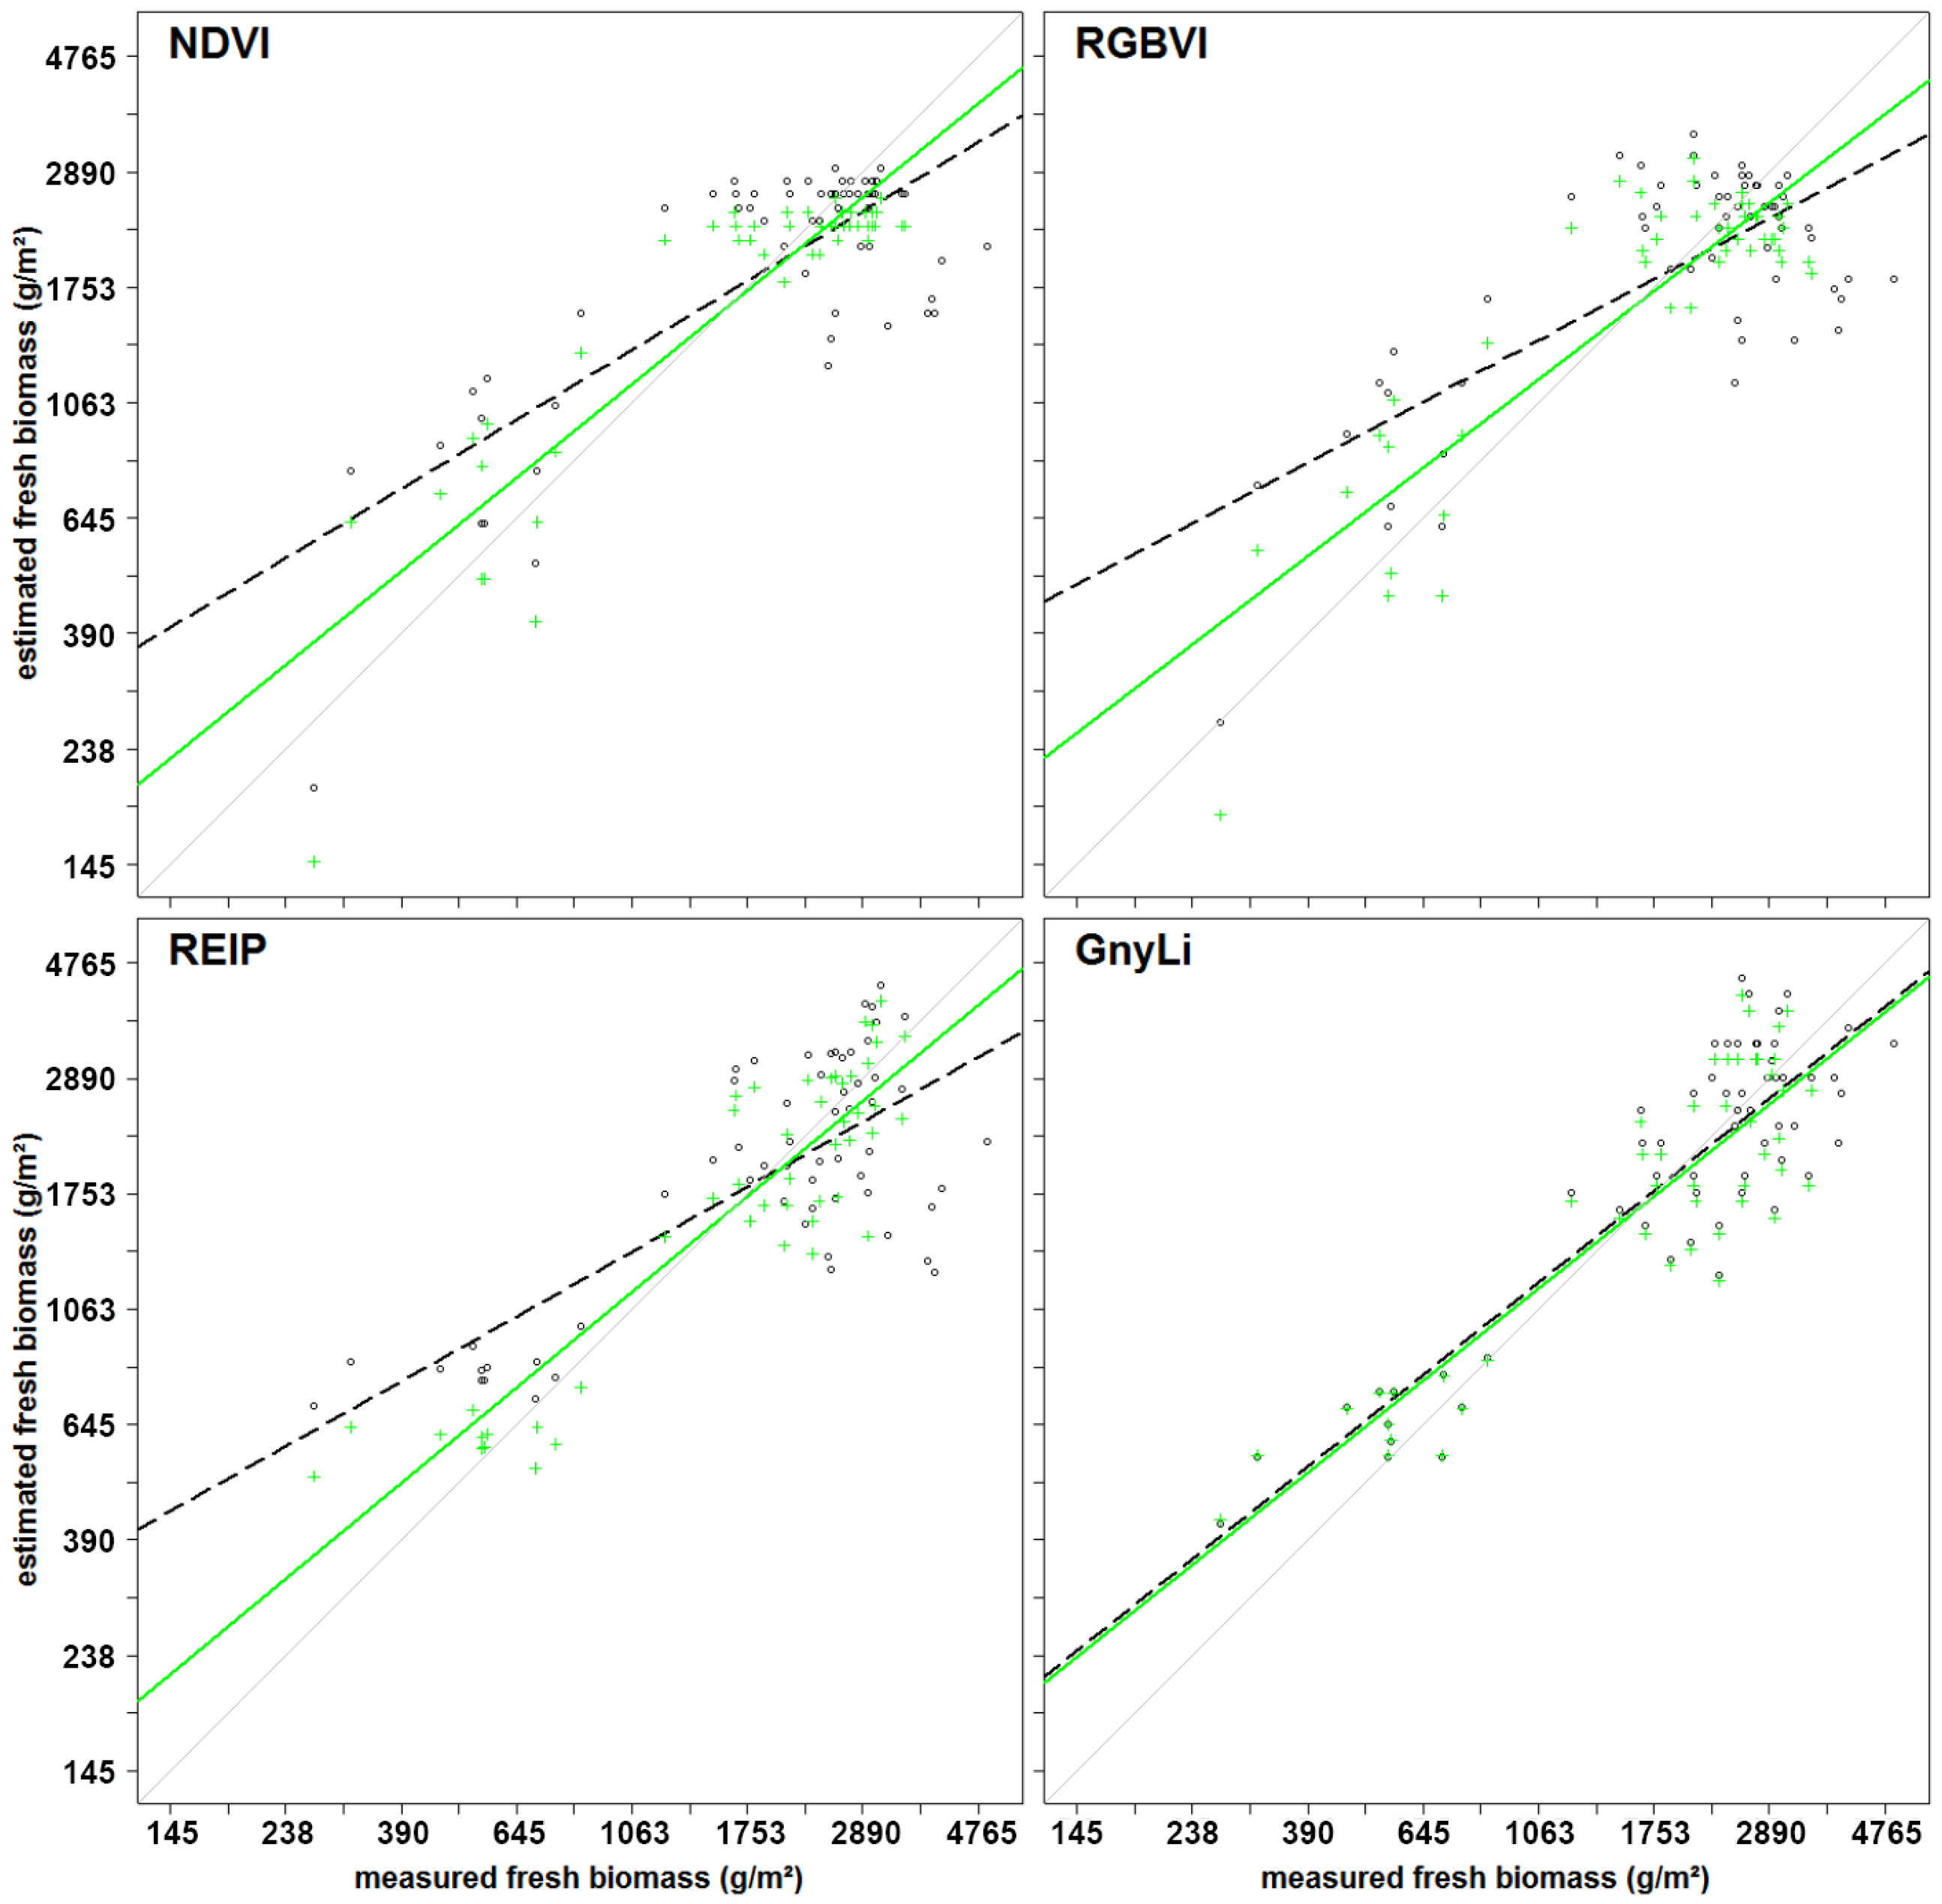
| Fresh biomass | Linear | PH | 0.59 | 901.99 | 0.60 | 843.32 | |||||
| GnyLi | 0.58 | 913.81 | 0.62 | 829.48 | GnyLi | 0.62 | 3295.30 | 0.64 | 2968.91 | ||
| NDVI | 0.25 | 1222.39 | 0.42 | 1022.79 | NDVI | 0.60 | 4561.69 | 0.63 | 5008.60 | ||
| NRI | 0.59 | 909.94 | 0.62 | 821.35 | NRI | 0.62 | 3056.34 | 0.64 | 2718.09 | ||
| RDVI | 0.35 | 1143.49 | 0.50 | 945.26 | RDVI | 0.61 | 3813.94 | 0.64 | 3955.80 | ||
| REIP | 0.30 | 1180.82 | 0.55 | 894.62 | REIP | 0.60 | 14599.87 | 0.63 | 59169.39 | ||
| RGBVI | 0.22 | 1243.84 | 0.37 | 1066.53 | RGBVI | 0.61 | 4007.93 | 0.64 | 3881.46 | ||
| Exponential | PH | 0.70 | 0.37 | 0.68 | 0.39 | PH | |||||
| GnyLi | 0.76 | 0.33 | 0.76 | 0.34 | GnyLi | 0.77 | 1.87 | 0.77 | 1.77 | ||
| NDVI | 0.46 | 0.50 | 0.65 | 0.41 | NDVI | 0.77 | 3.74 | 0.79 | 4.30 | ||
| NRI | 0.77 | 0.33 | 0.77 | 0.33 | NRI | 0.77 | 1.67 | 0.77 | 1.56 | ||
| RDVI | 0.59 | 0.43 | 0.74 | 0.35 | RDVI | 0.79 | 2.69 | 0.82 | 2.89 | ||
| REIP | 0.47 | 0.49 | 0.71 | 0.37 | REIP | 0.72 | 22.27 | 0.74 | 73.05 | ||
| RGBVI | 0.38 | 0.53 | 0.55 | 0.47 | RGBVI | 0.77 | 2.58 | 0.78 | 2.68 | ||
| Bivariate BRMs | Multivariate BRMs | ||||||||||||||
|---|---|---|---|---|---|---|---|---|---|---|---|---|---|---|---|
| Whole Period | Pre-Anthesis | Whole Period | Pre-Anthesis | ||||||||||||
| Estimator | R2 | RMSE a | d | R2 | RMSE a | d | Estimator b | R2 | RMSE a | d | R2 | RMSE a | d | ||
| Dry biomass | Linear | PH | 0.66 | 257.57 | 0.88 | 0.80 | 147.75 | 0.92 | |||||||
| GnyLi | 0.54 | 299.67 | 0.81 | 0.72 | 173.31 | 0.88 | GnyLi | 0.65 | 262.19 | 0.88 | 0.79 | 148.20 | 0.92 | ||
| NDVI | 0.07 | 412.70 | 0.33 | 0.38 | 244.47 | 0.64 | NDVI | 0.71 | 250.35 | 0.89 | 0.80 | 148.32 | 0.92 | ||
| NRI | 0.55 | 295.41 | 0.82 | 0.74 | 166.41 | 0.89 | NRI | 0.66 | 261.77 | 0.88 | 0.80 | 147.67 | 0.92 | ||
| RDVI | 0.13 | 400.36 | 0.44 | 0.41 | 233.53 | 0.71 | RDVI | 0.72 | 247.16 | 0.89 | 0.80 | 148.27 | 0.92 | ||
| REIP | 0.15 | 404.95 | 0.46 | 0.68 | 197.50 | 0.83 | REIP | 0.73 | 228.46 | 0.91 | 0.80 | 147.88 | 0.92 | ||
| RGBVI | 0.04 | 416.42 | 0.26 | 0.28 | 254.41 | 0.58 | RGBVI | 0.70 | 261.30 | 0.88 | 0.80 | 149.33 | 0.92 | ||
| Exponential | PH | 0.85 | 0.39 | 0.95 | 0.85 | 0.36 | 0.95 | ||||||||
| GnyLi | 0.80 | 0.42 | 0.94 | 0.86 | 0.33 | 0.95 | GnyLi | 0.87 | 0.36 | 0.96 | 0.89 | 0.31 | 0.96 | ||
| NDVI | 0.29 | 0.77 | 0.63 | 0.59 | 0.54 | 0.81 | NDVI | 0.85 | 0.38 | 0.95 | 0.87 | 0.30 | 0.96 | ||
| NRI | 0.81 | 0.40 | 0.94 | 0.87 | 0.31 | 0.96 | NRI | 0.87 | 0.36 | 0.96 | 0.89 | 0.29 | 0.96 | ||
| RDVI | 0.40 | 0.71 | 0.73 | 0.66 | 0.48 | 0.87 | RDVI | 0.85 | 0.38 | 0.95 | 0.88 | 0.30 | 0.96 | ||
| REIP | 0.40 | 0.75 | 0.72 | 0.82 | 0.43 | 0.90 | REIP | 0.85 | 0.39 | 0.95 | 0.89 | 0.34 | 0.95 | ||
| RGBVI | 0.22 | 0.82 | 0.55 | 0.48 | 0.62 | 0.75 | RGBVI | 0.85 | 0.38 | 0.95 | 0.86 | 0.31 | 0.96 | ||
| Estimator | R2 | RMSE a | d | R2 | RMSE a | d | Estimator b | R2 | RMSE a | d | R2 | RMSE a | d | ||
| Fresh biomass | Linear | PH | 0.67 | 963.45 | 0.84 | 0.70 | 892.55 | 0.85 | |||||||
| GnyLi | 0.65 | 970.70 | 0.83 | 0.72 | 886.24 | 0.84 | GnyLi | 0.69 | 939.84 | 0.85 | 0.74 | 861.73 | 0.86 | ||
| NDVI | 0.27 | 1254.02 | 0.58 | 0.51 | 1053.83 | 0.70 | NDVI | 0.67 | 952.58 | 0.84 | 0.73 | 862.84 | 0.85 | ||
| NRI | 0.65 | 962.49 | 0.83 | 0.72 | 873.75 | 0.85 | NRI | 0.69 | 938.46 | 0.85 | 0.74 | 857.99 | 0.86 | ||
| RDVI | 0.38 | 1175.32 | 0.67 | 0.59 | 964.42 | 0.77 | RDVI | 0.68 | 943.96 | 0.85 | 0.74 | 841.36 | 0.86 | ||
| REIP | 0.41 | 1244.11 | 0.66 | 0.77 | 951.74 | 0.81 | REIP | 0.67 | 966.67 | 0.84 | 0.77 | 908.74 | 0.84 | ||
| RGBVI | 0.21 | 1260.32 | 0.53 | 0.41 | 1066.26 | 0.67 | RGBVI | 0.66 | 948.90 | 0.85 | 0.71 | 852.97 | 0.86 | ||
| Exponential | PH | 0.73 | 0.40 | 0.89 | 0.71 | 0.42 | 0.88 | ||||||||
| GnyLi | 0.78 | 0.35 | 0.92 | 0.79 | 0.36 | 0.91 | GnyLi | 0.79 | 0.34 | 0.92 | 0.80 | 0.36 | 0.92 | ||
| NDVI | 0.44 | 0.51 | 0.73 | 0.64 | 0.42 | 0.83 | NDVI | 0.78 | 0.34 | 0.92 | 0.79 | 0.34 | 0.92 | ||
| NRI | 0.77 | 0.34 | 0.92 | 0.79 | 0.35 | 0.92 | NRI | 0.79 | 0.34 | 0.92 | 0.79 | 0.35 | 0.92 | ||
| RDVI | 0.57 | 0.44 | 0.82 | 0.73 | 0.36 | 0.89 | RDVI | 0.80 | 0.33 | 0.93 | 0.83 | 0.31 | 0.93 | ||
| REIP | 0.54 | 0.53 | 0.77 | 0.82 | 0.42 | 0.87 | REIP | 0.77 | 0.39 | 0.90 | 0.82 | 0.40 | 0.88 | ||
| RGBVI | 0.36 | 0.54 | 0.68 | 0.53 | 0.47 | 0.78 | RGBVI | 0.76 | 0.34 | 0.92 | 0.76 | 0.34 | 0.92 | ||


Reference
- Tilly, N.; Aasen, H.; Bareth, G. Fusion of Plant Height and Vegetation Indices for the Estimation of Barley Biomass. Remote Sens. 2015, 7, 11449–11480. [Google Scholar] [CrossRef]
© 2015 by the authors; licensee MDPI, Basel, Switzerland. This article is an open access article distributed under the terms and conditions of the Creative Commons by Attribution (CC-BY) license (http://creativecommons.org/licenses/by/4.0/).
Share and Cite
Tilly, N.; Aasen, H.; Bareth, G. Correction: Tilly, N. et al. Fusion of Plant Height and Vegetation Indices for the Estimation of Barley Biomass. Remote Sens. 2015, 7, 11449–11480. Remote Sens. 2015, 7, 17291-17296. https://doi.org/10.3390/rs71215878
Tilly N, Aasen H, Bareth G. Correction: Tilly, N. et al. Fusion of Plant Height and Vegetation Indices for the Estimation of Barley Biomass. Remote Sens. 2015, 7, 11449–11480. Remote Sensing. 2015; 7(12):17291-17296. https://doi.org/10.3390/rs71215878
Chicago/Turabian StyleTilly, Nora, Helge Aasen, and George Bareth. 2015. "Correction: Tilly, N. et al. Fusion of Plant Height and Vegetation Indices for the Estimation of Barley Biomass. Remote Sens. 2015, 7, 11449–11480" Remote Sensing 7, no. 12: 17291-17296. https://doi.org/10.3390/rs71215878