Article

Mapping Rice Seasonality in the Mekong Delta with Multi-Year Envisat ASAR WSM Data

1
Department of Geodesy and Geoinformation, Vienna University of Technology, Gusshausstrasse 27-29, A-1040 Vienna, Austria
2
Department of Photogrammetry and Remote Sensing, Hanoi University of Mining and Geology, Hanoi 10000, Vietnam
3
Department of Remote Sensing, Institute of Geography and Geology, University of Wuerzburg, Oswald-Kuelpe-Weg 86, D-97074 Wuerzburg, Germany
4
German Remote Sensing Data Center (DFD), Earth Observation Center (EOC), German Aerospace Center (DLR), Oberpfaffenhofen, D-82234 Wessling, Germany
*
Author to whom correspondence should be addressed.
Remote Sens. 2015, 7(12), 15868-15893; https://doi.org/10.3390/rs71215808
Submission received: 3 July 2015 / Revised: 10 November 2015 / Accepted: 17 November 2015 / Published: 27 November 2015

Abstract

:
Rice is the most important food crop in Asia, and the timely mapping and monitoring of paddy rice fields subsequently emerged as an important task in the context of food security and modelling of greenhouse gas emissions. Rice growth has a distinct influence on Synthetic Aperture Radar (SAR) backscatter images, and time-series analysis of C-band images has been successfully employed to map rice fields. The poor data availability on regional scales is a major drawback of this method. We devised an approach to classify paddy rice with the use of all available Envisat ASAR WSM (Advanced Synthetic Aperture Radar Wide Swath Mode) data for our study area, the Mekong Delta in Vietnam. We used regression-based incidence angle normalization and temporal averaging to combine acquisitions from multiple tracks and years. A crop phenology-based classifier has been applied to this time series to detect single-, double- and triple-cropped rice areas (one to three harvests per year), as well as dates and lengths of growing seasons. Our classification has an overall accuracy of 85.3% and a kappa coefficient of 0.74 compared to a reference dataset and correlates highly with official rice area statistics at the provincial level (R² of 0.98). SAR-based time-series analysis allows accurate mapping and monitoring of rice areas even under adverse atmospheric conditions.

Graphical Abstract

1. Introduction: Remote Sensing-Based Rice Mapping

Vietnam is the sixth largest producer of paddy rice in the world and second largest exporter of milled rice after Thailand [1]. Rice is the single most important food crop in Vietnam, and rice export contributes a fifth to Vietnam’s GDP [2]. The Mekong Delta—dubbed “Vietnam’s Rice Bowl”—contains the majority of the area designated for rice agriculture. Mapping and monitoring of crop growth is therefore of high importance for food security, as well as economic and ecological planning.
Growth of rice plants is commonly divided into three phases, which consist of a total of ten growth stages. The first phase is the vegetative phase which consists of the germination, seedling, tillering and stem elongation stages. It is followed by the reproductive phase which includes the panicle initiation, heading and flowering stages. Ripening is the final phase with its milk, dough and mature grain stages [3]. These stages coincide with changes in plant morphology that influence the interaction with light and microwaves and thus can be observed with remote sensing data. Multi- or hyper-temporal remote sensing techniques provide valuable information for the mapping of rice and distinguishing rice from other land-cover types by monitoring changes in plant morphology. A review of existing methods for optical and microwave remote sensing of rice areas can be found in Kuenzer and Knauer [4] and Mosleh et al. [5].
Reliable detection of rice-cropping schemes requires analysis of dense time series in order to determine different phenological stages in the growth of the rice plant and distinguish rice from other crops as well as to discriminate between rice-cropping schemes. Authors of optical remote sensing-based rice studies have frequently emphasized the need of using sensors with very high revisit times in order to acquire a sufficient amount of cloud-free observations to create reliable time series [6,7,8,9,10,11,12,13,14,15]. Microwave-based remote sensing techniques, on the other hand, have the advantage of being non-susceptible to cloud cover. Numerous studies have been conducted to assess the potential of active microwave sensors for backscatter characterization in Mekong River Basin [16] and using Synthetic Aperture Radar (SAR) sensors for rice mapping [17,18,19,20,21,22,23]. The first studies of rice mapping with spaceborne SAR sensors have been undertaken with the European Remote Sensing Satellite 1 (ERS-1), showing promising results [20,21,22,24,25,26].
The temporal variation of SAR backscatter, σ°, can be regarded as a function of rice crop growth. The annual variation of σ° from rice is higher than any other agricultural crop, thereby making SAR sensors valuable remote sensing tools for rice-crop mapping and monitoring [19,22]. The theoretical background of the C-band microwave interaction with rice plants has been extensively described by Le Toan et al. [21], who compared the visible backscatter changes in ERS-1 SAR images over two test sites in Japan and Indonesia with backscatter modelled by means of Monte Carlo simulation. They have shown that wave-plant-water interactions are the primary backscatter mechanisms in flooded rice fields, in addition to direct scattering. Scattering from multiple reflections only have negligible contributions. These findings have been reaffirmed by Wang et al. [27], who arrived at the same conclusion when comparing RADARSAT-1 data with Monte Carlo simulation-based HH backscatter models. These modelling efforts can be used to explain the distinct backscatter profile rice-growing areas emit over time. Before rice is sown, paddies are usually flooded for pest and vegetation control. This results in very low backscatter values due to specular reflection on the flat surface. Flooded rice paddies might, however, be influenced by strong winds which cause ripples and waves on the water surface and consequently increase backscatter. Over the course of the vegetative and reproductive phases, backscatter continuously increases until the vegetation growth reaches its maximum at the heading stage. During this time, the phenological development of the rice plant leads to an elongation of stems, increase in plant moisture and leaf area—generally an increase in biomass. This in turn increases the area available for reflection of the radar wave via double-bounce and direct volume scattering leading to an increase in measured backscatter. After the heading stage, plant moisture, leaf area and biomass start to decline, thus leading to a decline in σ° due to the reduction of the aforementioned scattering effects. This temporal backscatter behavior is illustrated in Figure 1 showing the C-band backscatter measurements from Envisat SAR measurements over a triple-cropped rice field in the Mekong Delta.
Figure 1. SAR backscatter behavior in relation to rice-growing stages (adapted from [18], growing stage images from [28]) for triple-cropped rice based on a multi-year ASAR WSM time series.
Remotesensing 07 15808 g001
Basically, two common methods of SAR-based rice mapping have been implemented in multiple study areas using different SAR sensors. In one of the methods, single polarization of backscatter data with high temporal density is utilized to monitor variations of rice plant over its growth phases. In the other method, backscatter observations from different polarizations are compared to each other for determination of rice plant growth phases. While the first method requires data from sensors aboard satellites with a short revisit time, the second one is dependent on sensors with dual- or quad-polarization capabilities. Method selection for SAR-based rice mapping is essentially determined by the data availability and sensor selection.
The backscatter images, acquired by the C-band SAR onboard ERS-1 with a repeat time of 35 days, were used in numerous SAR-based multi-temporal backscatter analyses for rice mapping case studies in Thailand [22], Indonesia [21], Japan [21,23,24], Vietnam [29], Canada [30,31] and India [25,26,32,33]. Methods developed for ERS-1 SAR data have been advanced and successfully transferred to RADARSAT-1 acquisitions at C-band with horizontal co-polarization and a 24-day repeat cycle [19,34,35,36,37,38,39]. Joint analysis of ERS-1/2 and RADARSAT-1 data showed how polarization and incidence angle influence backscatter from paddy rice [40]. Comparative studies showed that C-, L- and X-band can be utilized for the multi-temporal method [41,42]. Rosenqvist [43] highlighted the limits of L-band data since rice planted in slant range direction of the SAR instrument exhibits a dynamic σ° range of more than 20 dB compared to only a few dB if it is planted in azimuth direction caused by directional resonance and attenuation effects. Despite these limitations, rice mapping with L-band has been shown to work in several studies in southeastern China [44,45,46].
The second common method exploits the fact that the vertical structure of the rice plant attenuates vertically polarized waves to a higher degree than horizontally polarized waves [19,21]. The potential of this behavior for rice classification was initially explained by comparison of C-band ERS and RADARSAT-1 data, ground-based X-band measurements, as well as backscatter models [19,21,27,34,47]. Studies by Chen et al. [48], Bouvet et al. [49] and Lam-Dao et al. [17] employed Envisat ASAR data to show that the ratio between HH and VV polarization on multi-temporal datasets can be used to classify rice areas with higher accuracy and less temporal coverage compared to the first method. Polarimetric decomposition of fully polarimetric RADARSAT-2 acquisitions showed promising results regarding not only the binary rice/non-rice classification of images but also the detection of rice’s growth stages [50,51,52]. Rice classification performance of TerraSAR-X (TSX) images over test sites in Spain and the theoretical models behind multi-polarization and X-band-based rice classification have been extensively described by Lopez-Sanchez et al. [53,54,55] as well as for the Mekong Delta [56,57,58]. Studies based on the second method, employing backscatter response from different polarizations, have shown the capability of distinguishing rice from other land cover and detecting its growth stages with less temporal coverage than the single-polarization, multi-temporal method for small study regions. Application of this approach on the regional or continental scale has been hampered by limited coverage of SAR sensors with dual- or quad-polarization capabilities.
SAR-based classification methods belonging to the two aforementioned categories have been proven to accurately map rice-cropping schemes under different growing regimes with a variety of sensors. The multi-temporal, single-polarization method has been applied far more often than the multi-polarization method, which is not an indicator of its superiority but rather highlights the limited availability of data suitable for the second method. Studies investigating the capabilities of the second method often underlined their superior accuracies compared to studies employing the first method.
These methods have been utilized for the Mekong Delta, and the first notable results have been published by Liew et al. [29], who derived backscatter change from ERS-2 time series and classified eight different rice-cropping schemes according to their temporal backscatter behavior. Bouvet et al. [18] were the first to employ the multi-temporal method to produce a map of rice-cropping schemes and areas for the whole Mekong Delta with the use of Envisat ASAR wide swath data. They achieved this by aggregating horizontally polarized SAR time-series classifications from three satellite tracks since temporal coverage for a single track is not dense enough to achieve high classification accuracy. The resulting seasonality map has a reported accuracy of 75.8% compared to a reference dataset created from dual-polarization ASAR data. Efforts by Bouvet et al. [47] and Lam-Dao et al. [17] emphasized the performance of rice mapping with dual-polarization ASAR data in the Mekong Delta while employing a straightforward HH/VV ratio and achieving accuracies of up to 89.8%. Lam-Dao et al. [17,57,58,59] also showed the applicability of this method for X-band TerraSAR-X data as well as predicting crop yield by combining SAR images and survey data. However, limited availability of dual-polarization SAR data prohibited the implementation of this classification approach on a regional scale. Thus far, no study was able to utilize the complete Envisat ASAR archive for the Mekong Delta due to incidence angle effects on rice mapping. The goal of our study is therefore to classify rice areas and determine the seasonality of rice crops in the Mekong Delta by using phenological techniques applied on multi-year Envisat ASAR WSM time series from 2007 to 2011. This study builds upon methods initially developed by Nguyen et al. [60] over the Red River Delta, Vietnam.

2. Study Area: Mekong Delta

The Mekong Delta (MKD), Vietnam’s southernmost region and home to over 18 million inhabitants, covers an area of about 40,000 km2 between 8.5°−11.5°N and 104.5°−106.8°E and consists of 13 provinces, as depicted in Figure 2. Due to its origin by accumulation of alluvial sediments from the Mekong River, the wide flat plain is mostly located below sea level and consists of fertile soils [61] and, like all deltas, it is vulnerable to a number of factors [62,63]. An intricate flood regime influences it, which used to be a single-peak pulse but is expected to change due to upstream regulatory measures [64,65]. Irrigation and flooding of agricultural land is managed by a dense network of channels, dykes and gates.
A distinct dry season lasting from December until May caused by the northwest monsoon followed by a rainy season caused by the southwest monsoon typically lasting from June to December characterize the MKD, which experiences an average of 1800 mm precipitation per year. Large parts of the delta are flooded and covered in a new layer of sediments each rainy season; flood-controlled fields experience this every 3 to 4 years without interrupting the rice-cropping scheme [66].
This constant fertilization is the basis for the agricultural prosperity of the region where 62% of the land is used for agriculture, 15% aquaculture and 6% mangrove and melaleuca forest [67]. Since rice is by far the dominant crop, cultivated on 73.9% of the agricultural land, this region is often referred to as the “rice bowl of Vietnam.” Towards the coast, rice cropland gives way to aquaculture of shrimp and fish as well as residual mangrove forest and hybrid land-use forms combining rice and shrimp farming or mangrove forest and shrimp farming. Aquaculture is the dominant land-use form in the southernmost part of the region and it is increasingly diminishing the remaining mangrove forests [68,69,70,71]. Rice is grown in three distinct cropping seasons called “Đông-Xuân” or “Spring” from November to March, “Hè-Thu” or “Autumn” from April to August, “Thu-Đông” or “Winter” in inland areas from August to December and “Mùa” or “Main wet season” in coastal areas from July to February of the following year resulting in one to three rice harvests per year. Some triple-cropped areas employ a short “Spring−Summer” season between Winter−Spring and Summer−Autumn. Choice of rice variety, cropping scheme and growing season implemented by farmers is highly dependent on the availability of irrigation water and local water management practices leading to a spatially diverse distribution [66].
Figure 2. Planted rice area per province and season averaged for the period of 2007 to 2011 (Source: General statistics Office of Vietnam) (adapted from [18]).
Remotesensing 07 15808 g002

3. Data

The Advanced Synthetic Aperture Radar (ASAR) was a C-band sensor on the Envisat satellite which was launched on 1 March 2002; it had a 35-day repeat cycle and was operated by the European Space Agency (ESA) until April 2012. Multiple orbit paths can be used to observe the same area in a shorter time due to the side-looking nature of the ASAR instrument with different incidence angles ranging from 17° to 42°. For this study, we had access to almost all archived wide swath mode acquisitions from January 2007 through December 2011 that completely or partially cover the Mekong Delta. A total of 121 ASAR WSM HH polarization images at 150 m spatial resolution were available coming from different tracks (about 15 tracks in total): Track 32 (19 images); Track 183 (6 images); Track 304 (11 image); Track 412 (10 images); Track 97 (3 images); Track 147 (10 images); Track 377 (3 images); Track 75 (8 images); Track 490 (6 images); Track 261 (6 images); Track 118 (13 images); Track 219 (4 images), Track 104 (6 images), Track 262 (5 images) and Track 347 (12 images). We used Level-1b ground range-corrected data (ENVISAT.ASA.WSM_1P), which was generated by ESA from Level-0 data using the ScanSAR technique.
Using scenes with partial coverage of our study area leads to an unequal spatial distribution of available data points for the creation of a time series. The amount of available acquisitions ranges from 80 to 113 with an average of 101 as shown in Figure 3a. In our multi-track, multi-year approach we combined the scenes according to their acquisition day of year (DOY) which leads to a time gap ranging from 1 to 16 days between available scenes with an average interval between 1.5 and 2.2 days. The total number of available scenes, averaged number of observations per week of year as well as the distribution of longest interval between the acquisitions are shown in Figure 3a–c, respectively.
Figure 3. (a) Temporal and spatial distribution of available Envisat ASAR WSM scenes. (b) Average number of measurements per week. (c) Largest interval between DOY of ASAR WSM acquisitions from 2007 to 2011.
Remotesensing 07 15808 g003
A land-use map for the 13 provinces in our study area representing the year 2010 at the scale 1:50,000 has been provided by the General Department of Land Administration of Vietnam. The Vietnam Institute of Meteorology, Hydrology and Environment supplied us with a land-use map for the year 2005 at the scale 1:650,000. In addition, rice area statistics for each province have been collected by the General Statistics Office of Vietnam (Figure 2).

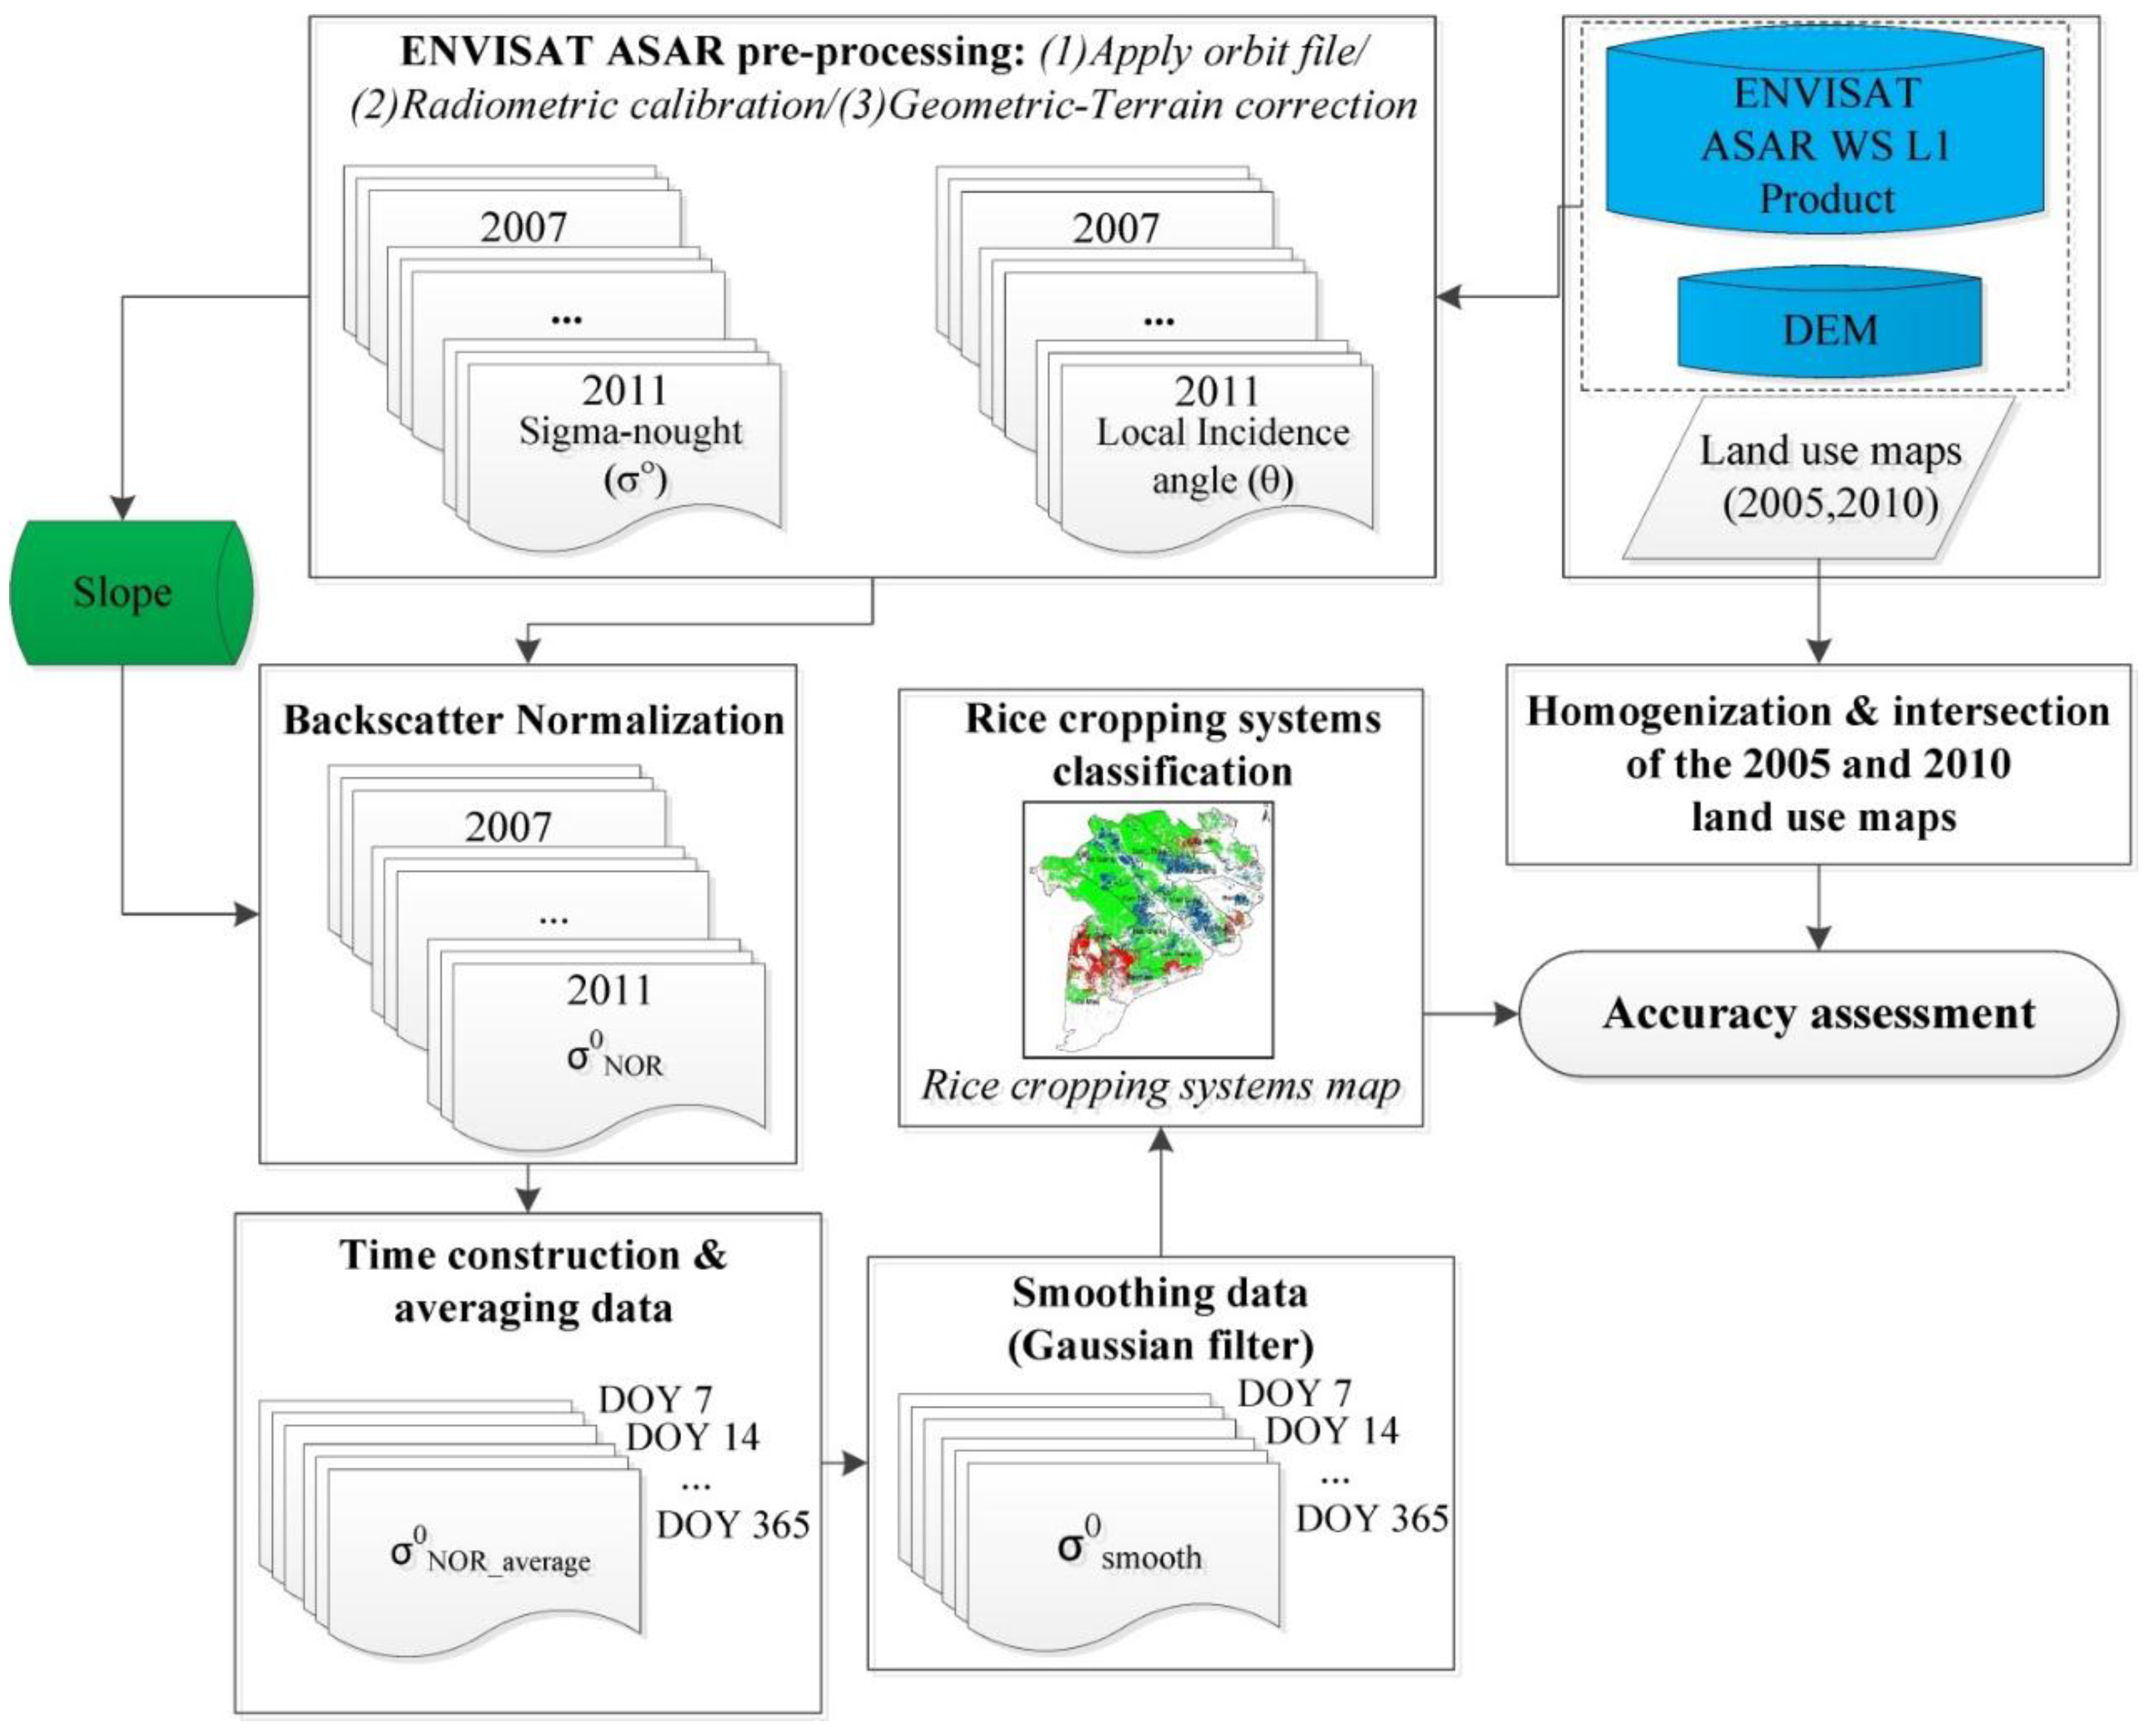
4. Methods and Data Analyses

Considering data availability for our study region, we chose to perform the multi-temporal backscatter analysis method on C-band Envisat ASAR data for rice mapping. We combined several ASAR WS mode acquisitions from multiple tracks to enhance temporal and spatial coverage, which has been also successfully applied in previous ASAR studies [18,72]. All Envisat ASAR WSM scenes were pre-processed using the open source software NEST (Next ESA SAR Toolbox). Pre-processing consisted of geocoding, radiometric calibration and resampling. The geocoding step involved a Range Doppler Terrain correction processing that used the elevation data from the 3 arc-second DEM product from the Shuttle Radar Topography Mission (SRTM) and DORIS orbit state vectors provided by ESA. In this process, data are resampled and geo-coded to a grid of 75 m spacing to preserve the 150 spatial reolution according to the Nyquist sampling therom [72]. The data analysis in this study has been performed in six steps as illustrated in Figure 4: (1) ENVISAT ASAR pre-processing; (2) Backscatter normalization to a reference incidence angle (regression-based approach): σ° ➔ σ°NOR; (3) Time-series compositing and averaging: σ°NOR ➔ σ°NOR_average; (4) Time-series smoothing with a Gaussian moving window filter: σ°NOR_average ➔ σ°smooth; (5) Classification using a knowledge-based decision-tree approach; (6) Accuracy assessment based on the intersection of a 2005 and 2010 land-use map.
Figure 4. ENVISAT ASAR data analysis, rice classification, and validation steps.
Remotesensing 07 15808 g004

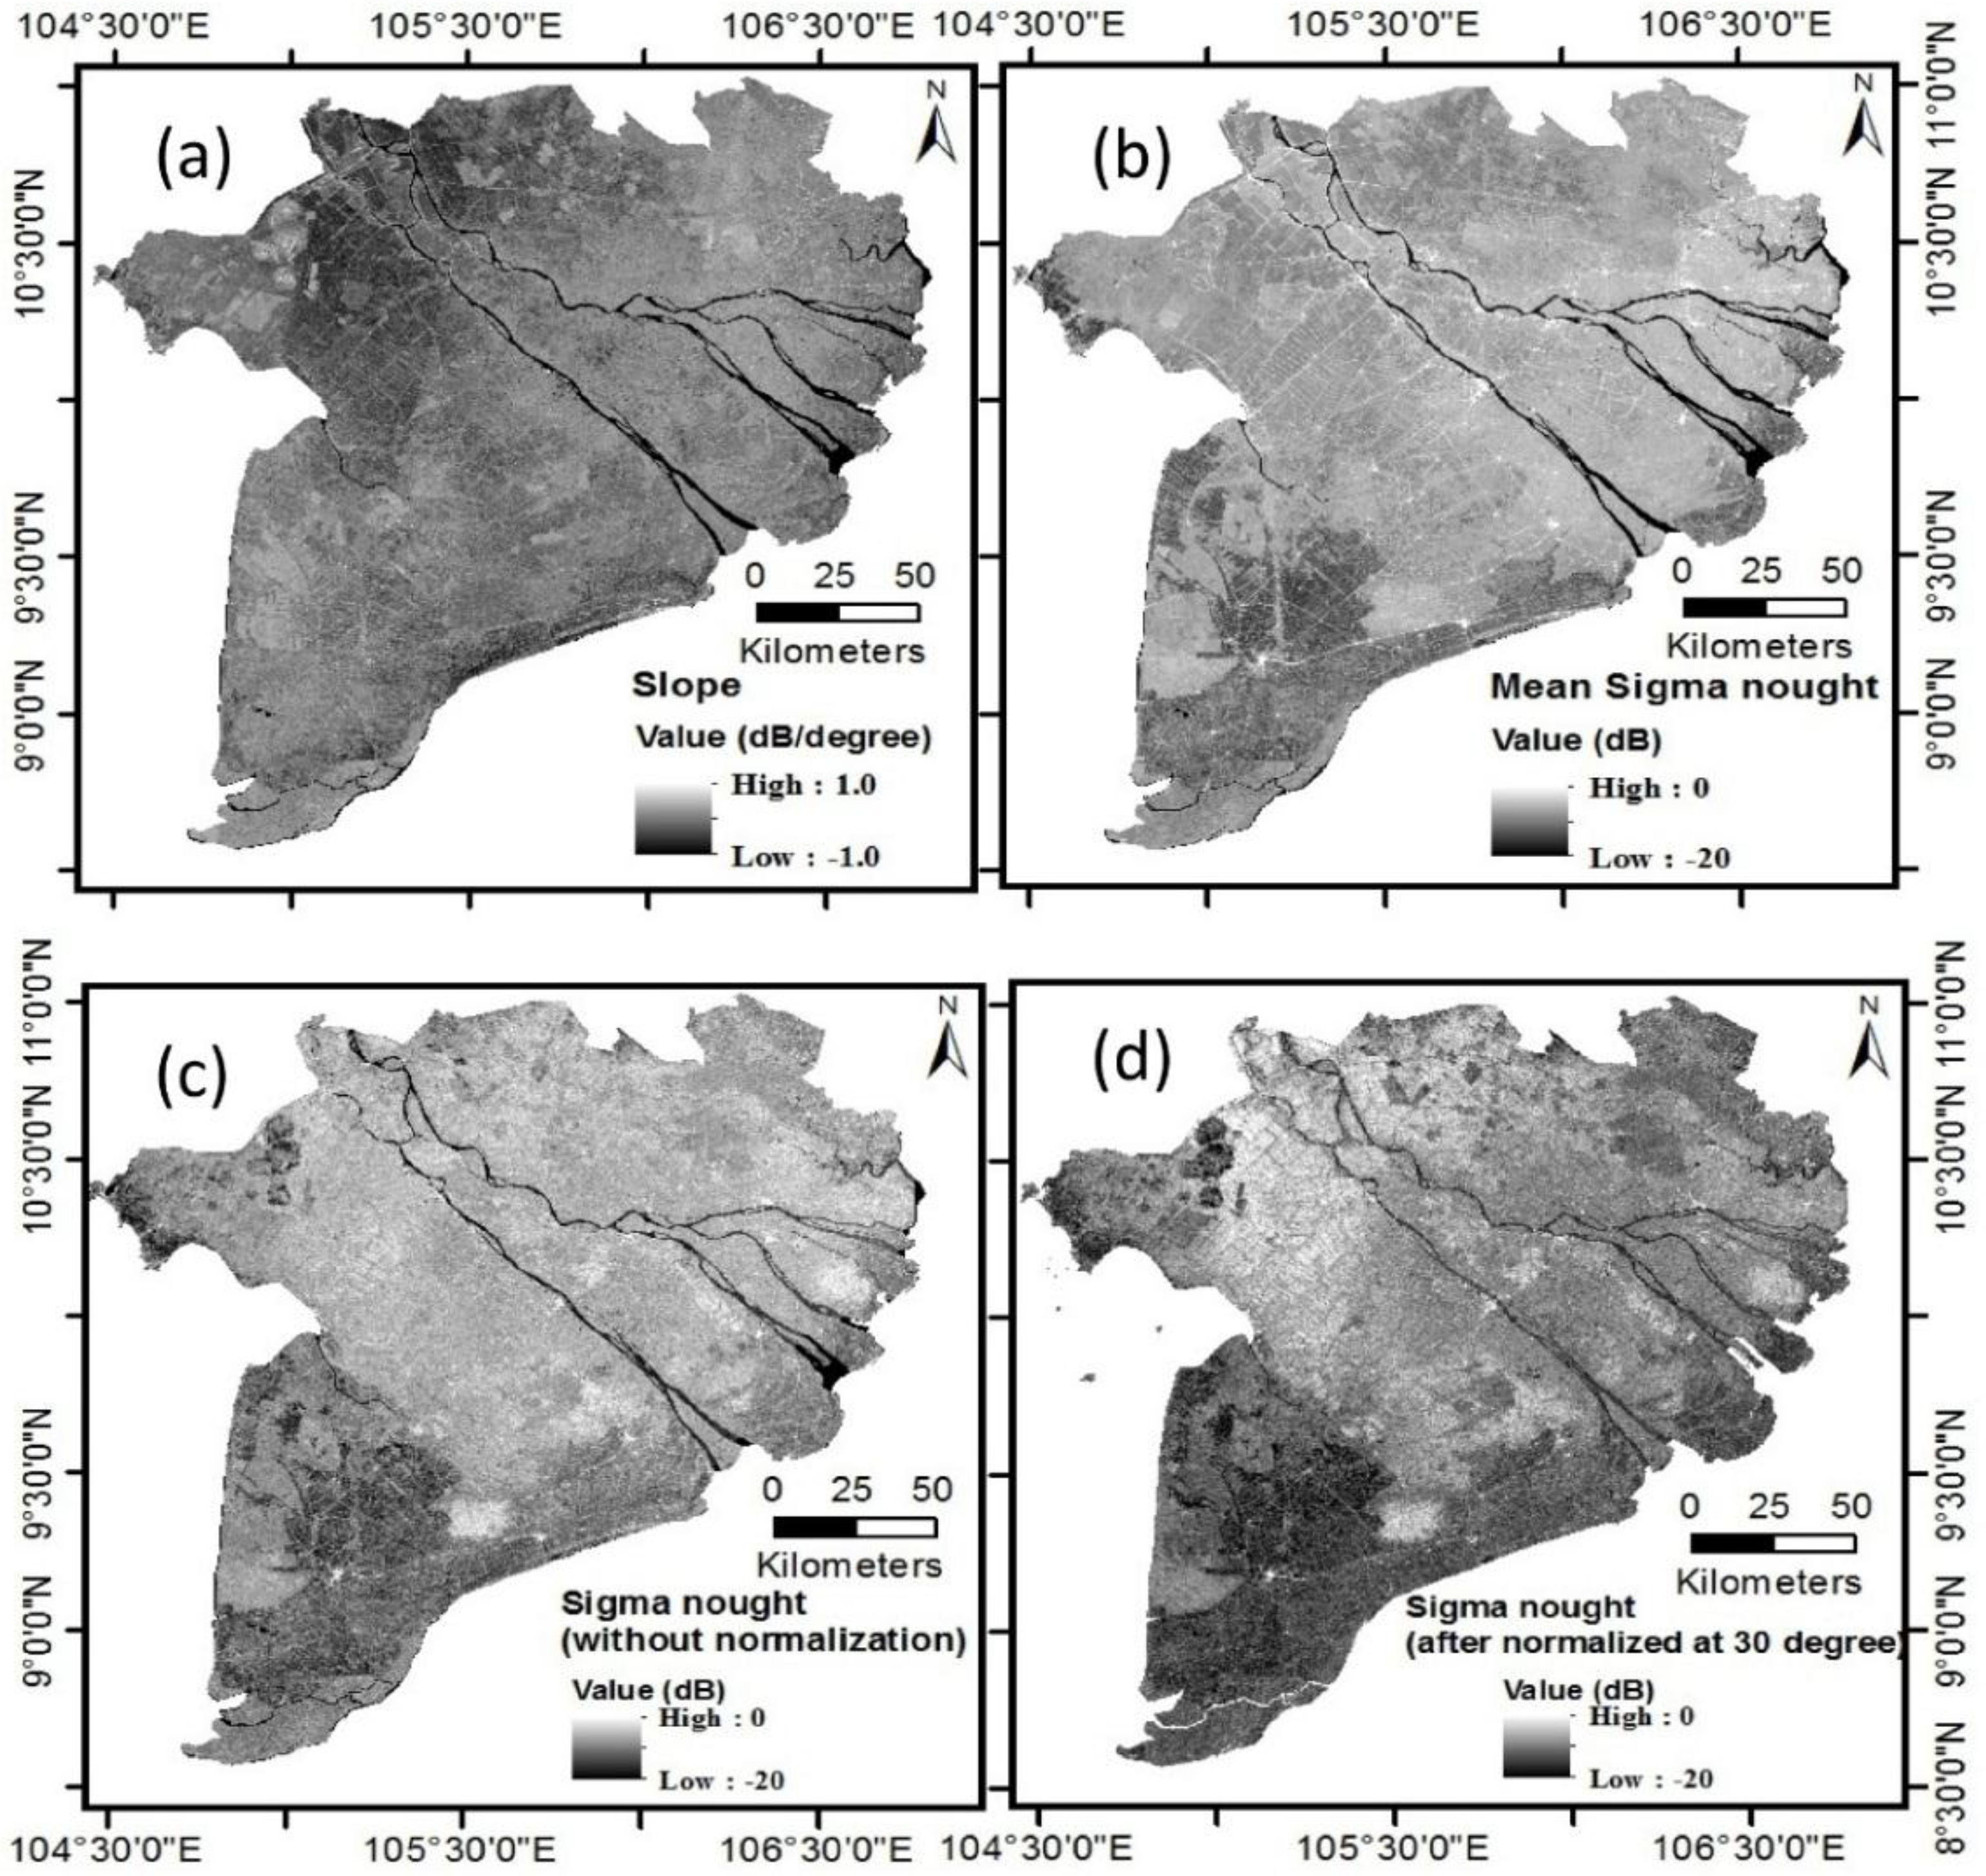
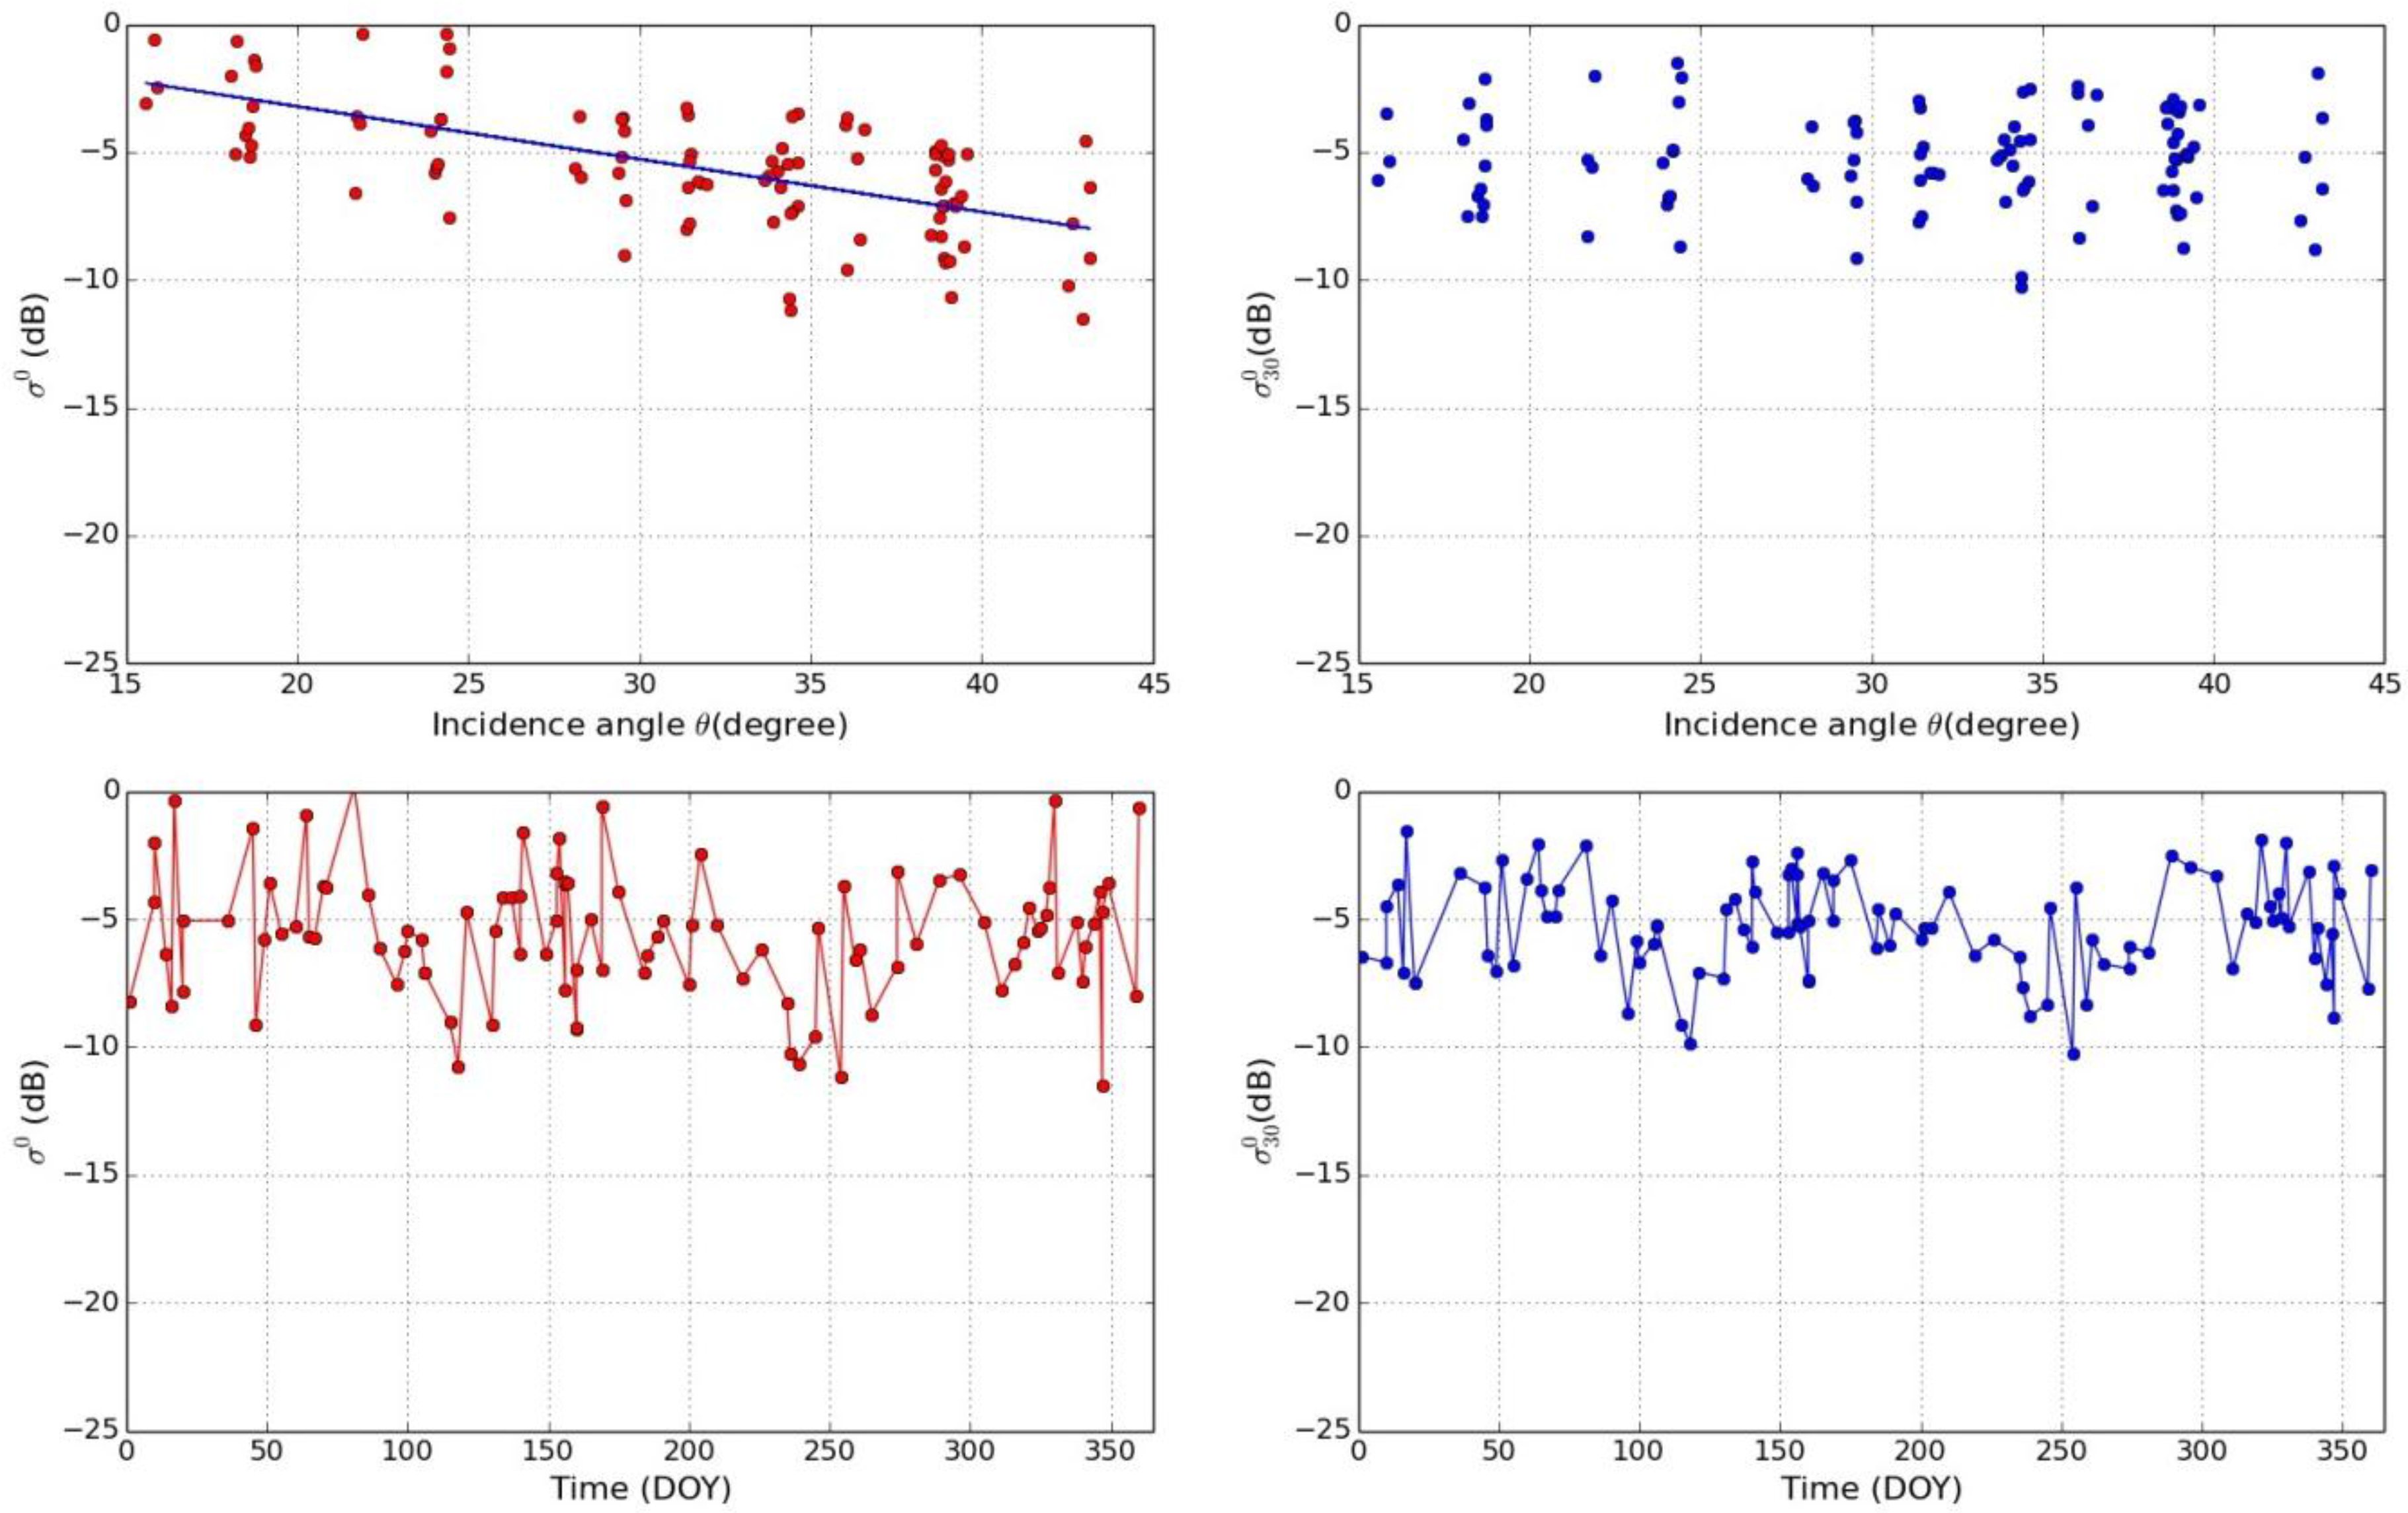
4.1. Incidence Angle Normalization

After pre-processing of the ASAR WSM scenes, the following parameters are obtained for each scene: sigma nought backscatter coefficient (σ°) expressed in decibels, and incidence angle (θ) expressed in degrees. The backscatter is not only influenced by the land cover but also the incidence angle. In order to detect changes in backscatter resulting from a change in surface status or land cover, it is necessary to remove incidence angle dependency of backscatter by normalizing all acquisitions to a common incidence angle. This was achieved by the approach described in [73,74]. In this method, long-term observations are used to model backscatter behavior with respect to incidence angle by performing linear regression analysis.
σ 0 ( θ ) = a + b θ
where the θ is the incidence angle, σ° is the backscatter and b is the slope parameter (gradient) of the regression line. Using the acquired slope parameter of the regression line for each pixel, all preprocessed ASAR WSM scenes were normalized to a reference incidence angle of 30° using the following equation:
σ 0 ( 30 0 ) = σ 0 ( θ 0 ) b ( θ 30 0 )
The normalization of backscatter measurements ensures comparability of scenes for time-series analysis. Figure 5a,b illustrate the slope and the mean of normalized backscatter. In Figure 5c,d a single ASAR WSM scene from 1 March 2007 is depicted before and after the backscatter normalization to 30°. Since the incidence angle could have a significant influence on the backscatter sometimes even larger than the natural backscatter dynamics over time, the normalization of backscatter is essential for time-series analysis (Figure 6). The backscatter behavior with respect to incidence angle varies depending on surface characteristics. For example, the influence of incidence angle on backscatter is higher for bare soil (high gradient, steep regression line) than for densely vegetated areas (low gradient of regression line).
Figure 5. Slope parameter (a), mean backscatter without normalization (b), original backscatter without normalization (c) and backscatter normalized to 30° incidence angle (d) for the Envisat ASAR WSM scene from 1 March 2007.
Remotesensing 07 15808 g005
Figure 6. Time series of backscatter over rice-cropped area (backscatter vs. incidence angle, original backscatter and normalized backscatter).
Remotesensing 07 15808 g006

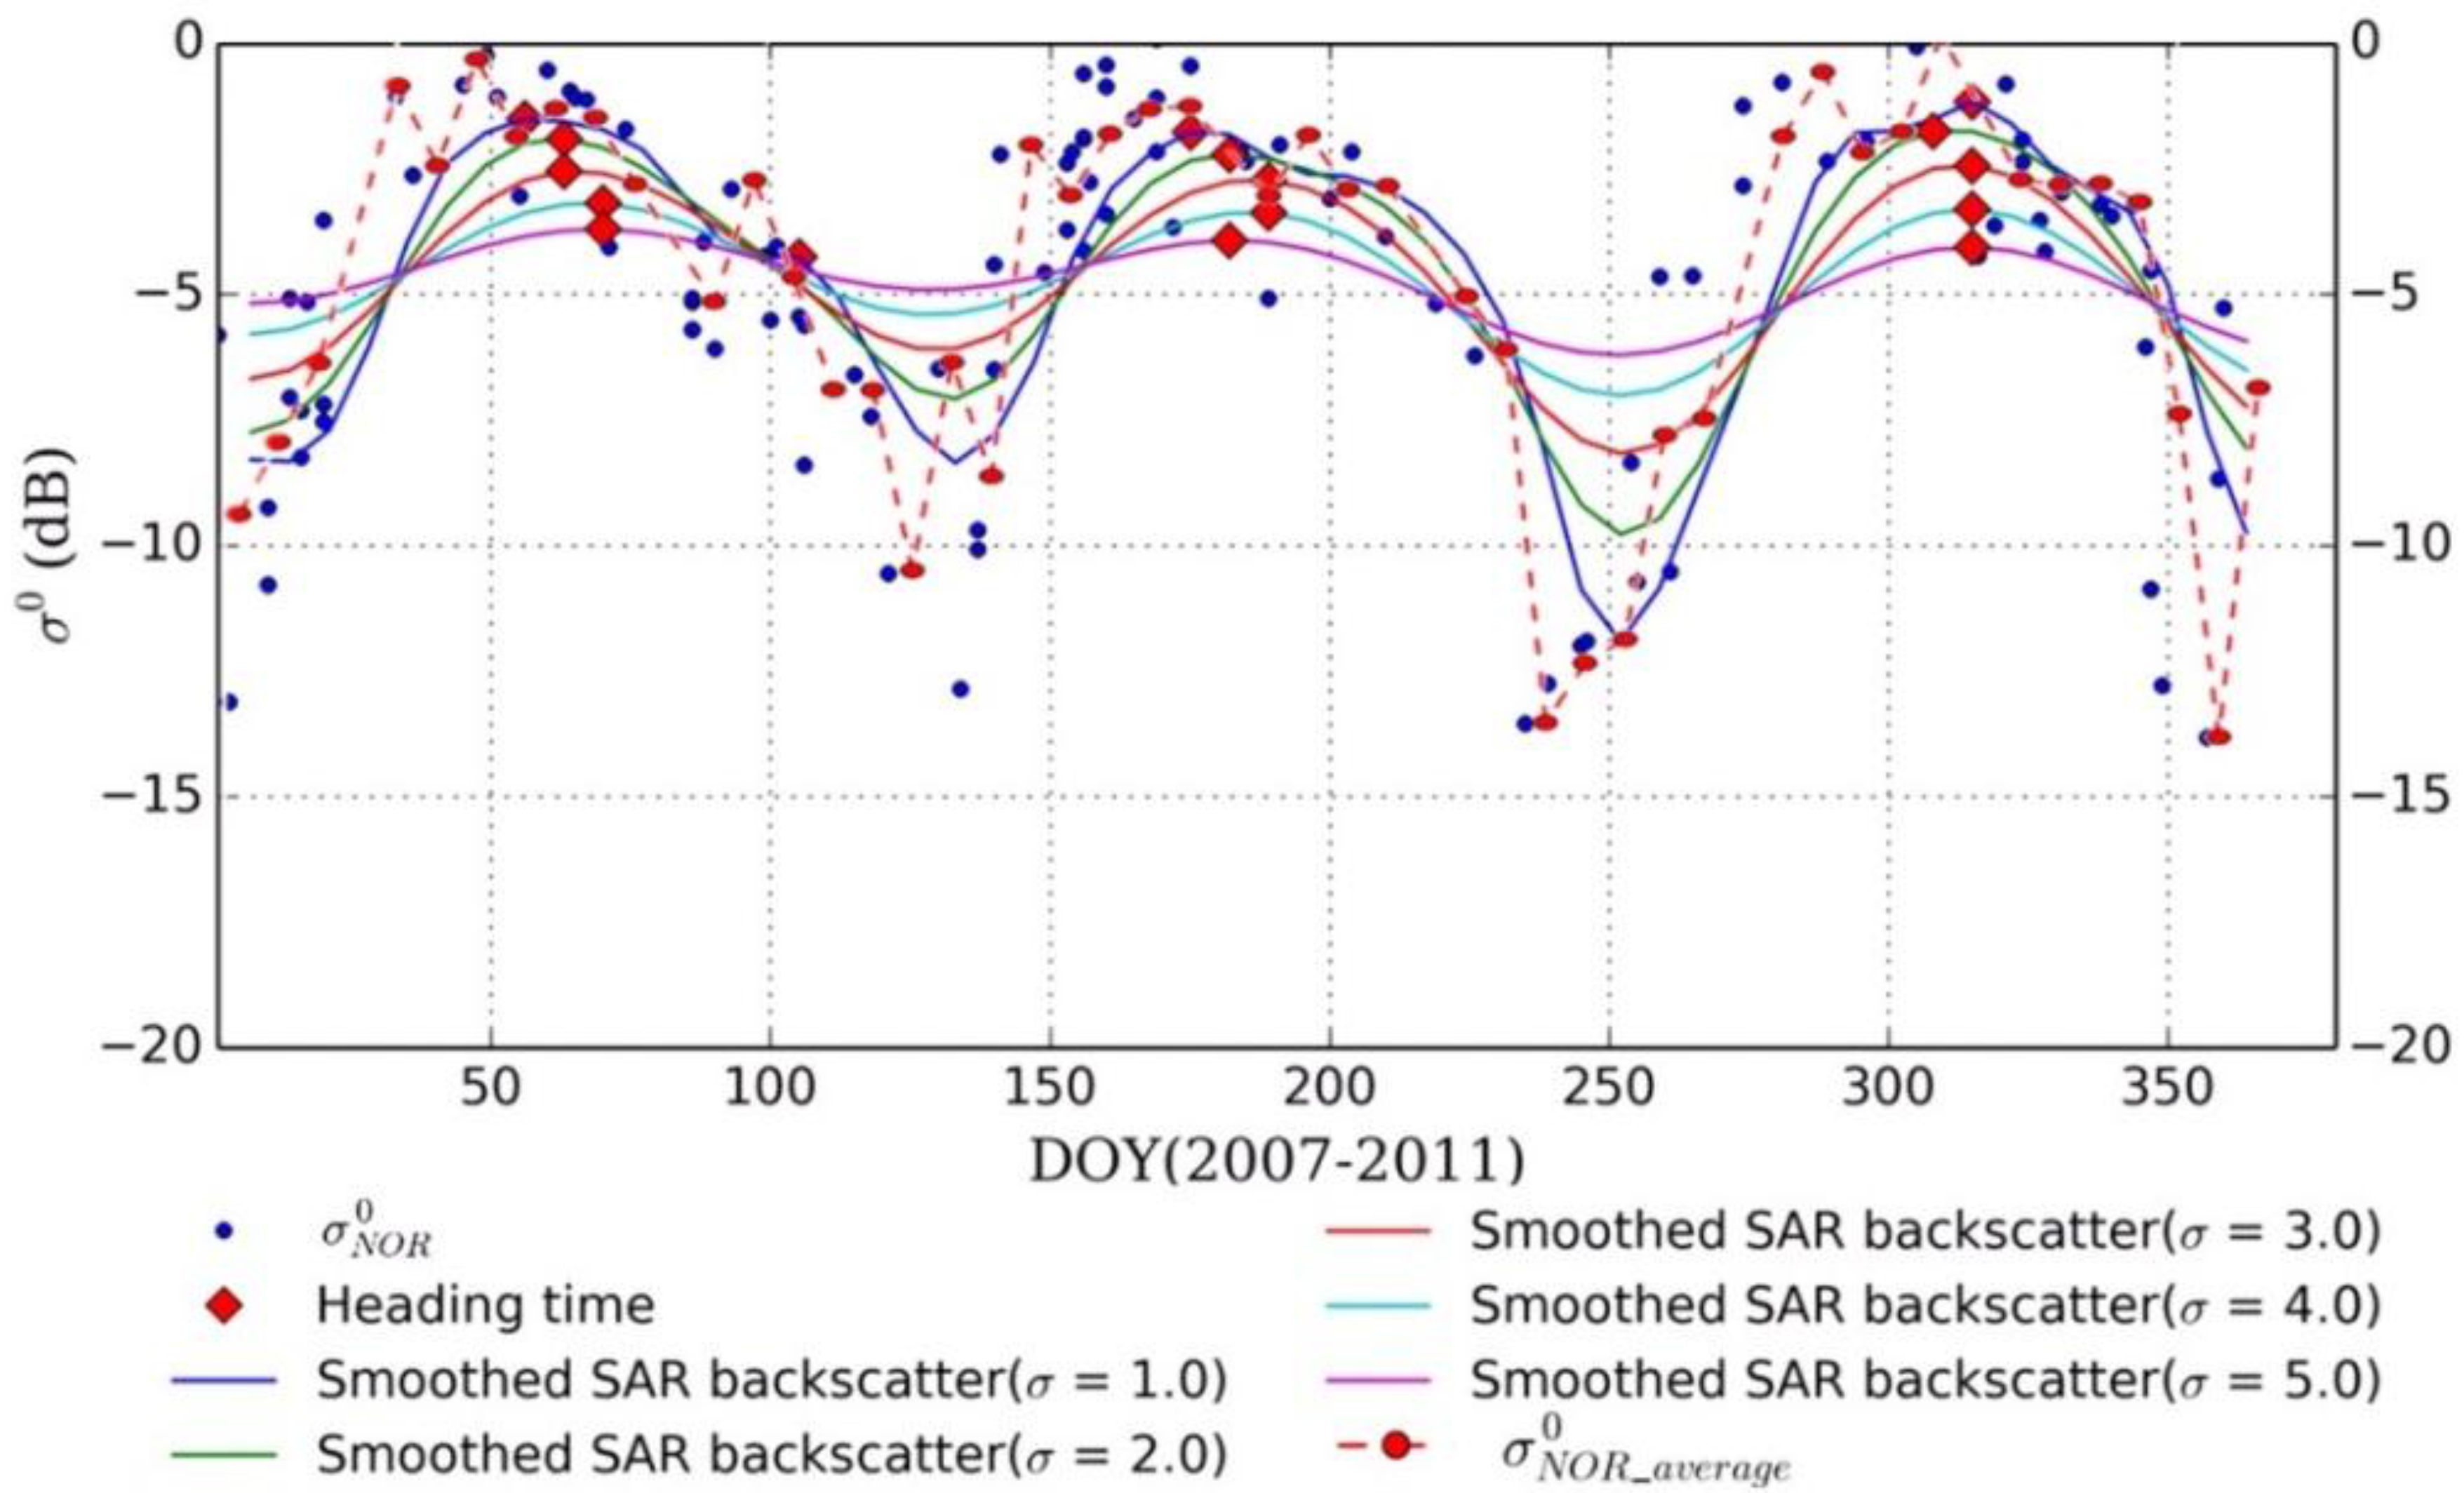
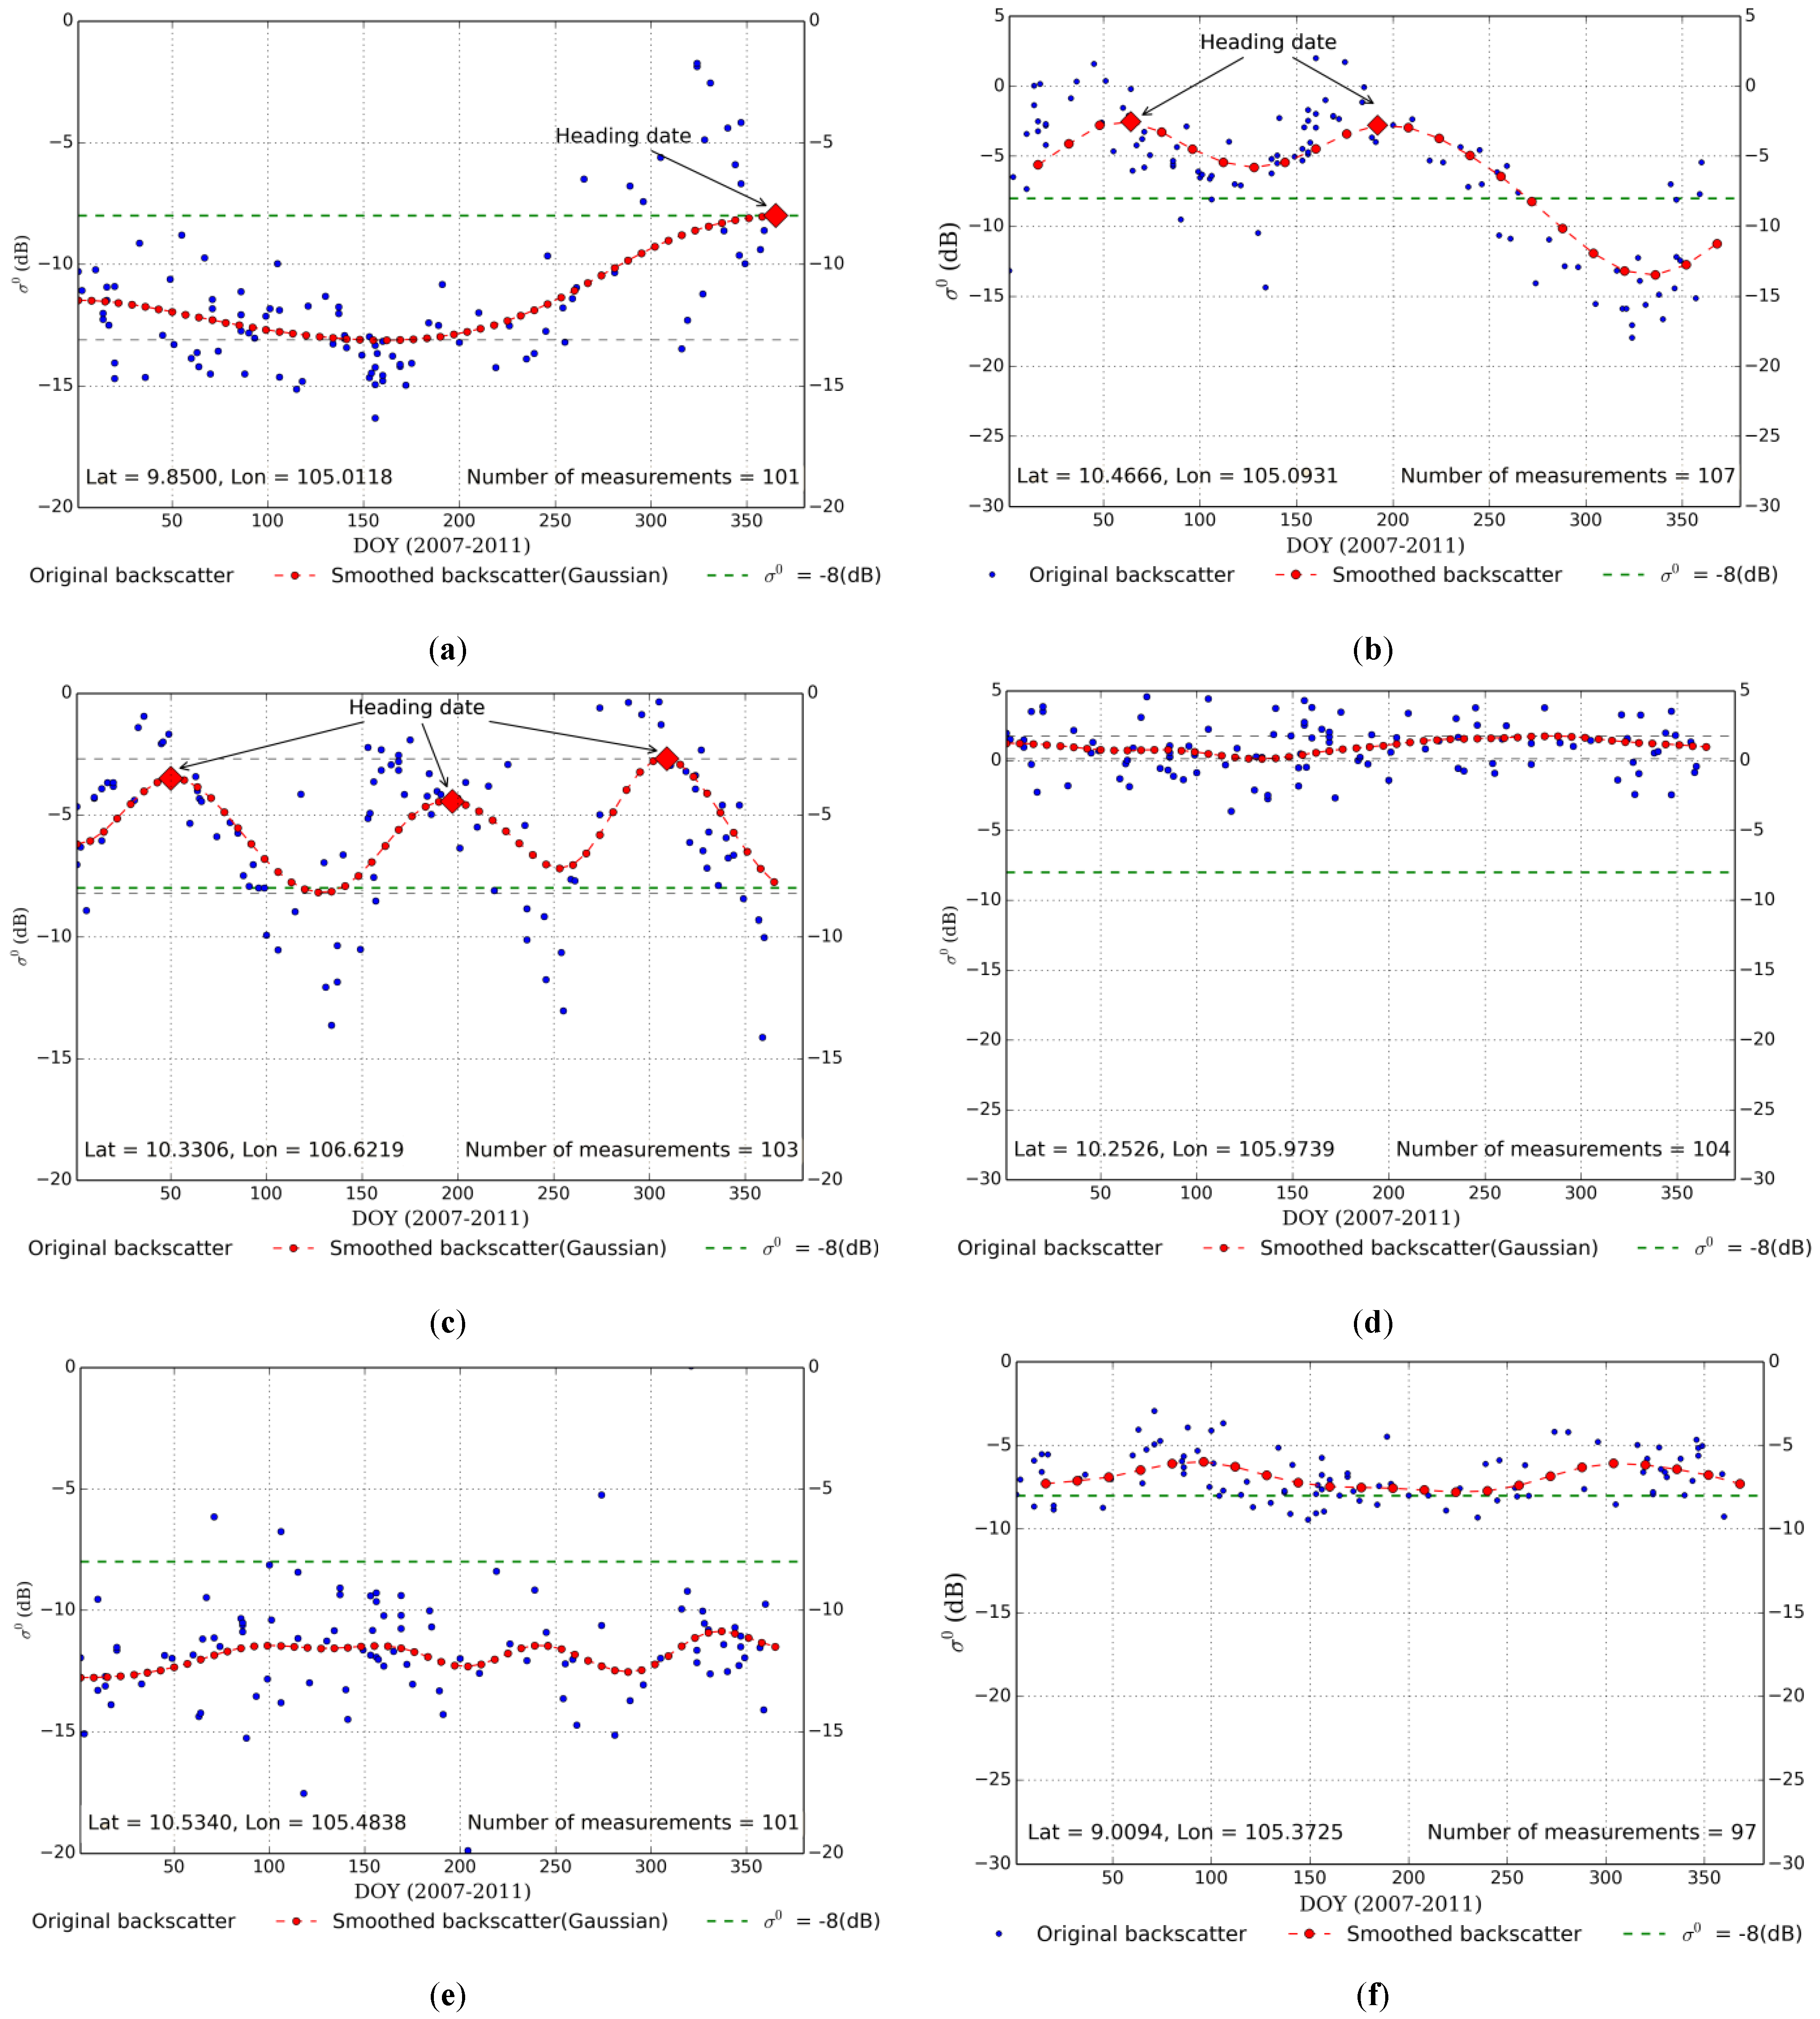
4.2. Time-Series Creation and Filtering

To generate ASAR WSM time-series composite for each day of year from multi-track and multi-year observations, some simplifying assumptions are needed to be made. First, we supposed that the backscatter changes over time exhibited by different rice-cropping schemes remained stable over the observation period. This entails that no changes in the cropping scheme, no change in land cover and no significant alterations in the growing seasons took place during the 2007 to 2011 period. Second, we presumed the distribution and amount of sample points to be sufficient to fulfill the criteria of the Nyquist-Shannon-Kotelnikov sampling theorem [75,76]. The average sampling of ASAR WSM observations is 1.5 to 2 measurements per week with a maximum two-week time gap between observations in some limited periods of the year (see Figure 1 and Figure 3). Therefore, it is supposed that the ASAR WSM weekly sampling (averaging 7-day intervals) is capturing any rice crop variations throughout the year as at least one measurement per week is occurring.
Rice area extent in the Mekong Delta can be regarded as mostly stable based on our long-term in situ knowledge and previous studies also showing regular changes in cropping scheme affect only small areas at the fringes of irrigated triple-crop and rainfed single-crop areas [8]. To create a time series dense enough for rice mapping, we combined Envisat ASAR WSM data from multiple years into one dataset. We did this by considering only the day of acquisition (DOY) and disregarding the year that image was taken in. We created σ°NOR time series that represents the backscatter behavior over the year for the period of 2007 to 2011. The number of observations in our study area ranges from 80 to 113 with a maximum time-gap of 16 days and a mean acquisition interval between 1.5 and 2.2 days. In the next step, we calculated the mean of backscatter over all acquisitions within 7-day intervals and created a single-year time series with 52 data points denoted as σ°NOR_average, which represents the average of backscatter for each week. Averaging was executed to tackle the temporal heterogeneity of the WSM acquisitions while at the same time creating a time series dense enough to capture phenological stages of the rice growth, like transplanting and heading. A 7-day interval was therefore chosen.
The compositing of backscatter measurements has the advantage of reducing the random noise errors inherited in the ASAR WSM data from atmospheric attenuation and speckle noise. On the other hand, it has the disadvantage of introducing noise caused by land-use changes, shifts in the growing seasons, their start and end points, their length as well as changes in the cropping scheme, for example a change from single-cropped rice to double-cropped rice or from double-cropped rice to triple-cropped rice, that could have happened over the five-year period. These kinds of errors are supposed to be of a random nature and therefore have already filtered in the σ°NOR_average time series, thereby resulting in a smoothed backscatter signal available for classification of different rice-cropping schemes. To smooth the σ°NOR_average time series, a Gaussian filter with standard deviation of 3 for the kernel was selected for temporal filtering as it shows satisfying coincidence with the reported number of rice crops, visible as distinct peaks, as well as their approximated heading dates compared to the reference data. An example of different standard deviation kernels is given in Figure 7.
Figure 7. Gaussian window function with different standard deviations compared to the unfiltered, averaged time series and the non-averaged time series.
Remotesensing 07 15808 g007

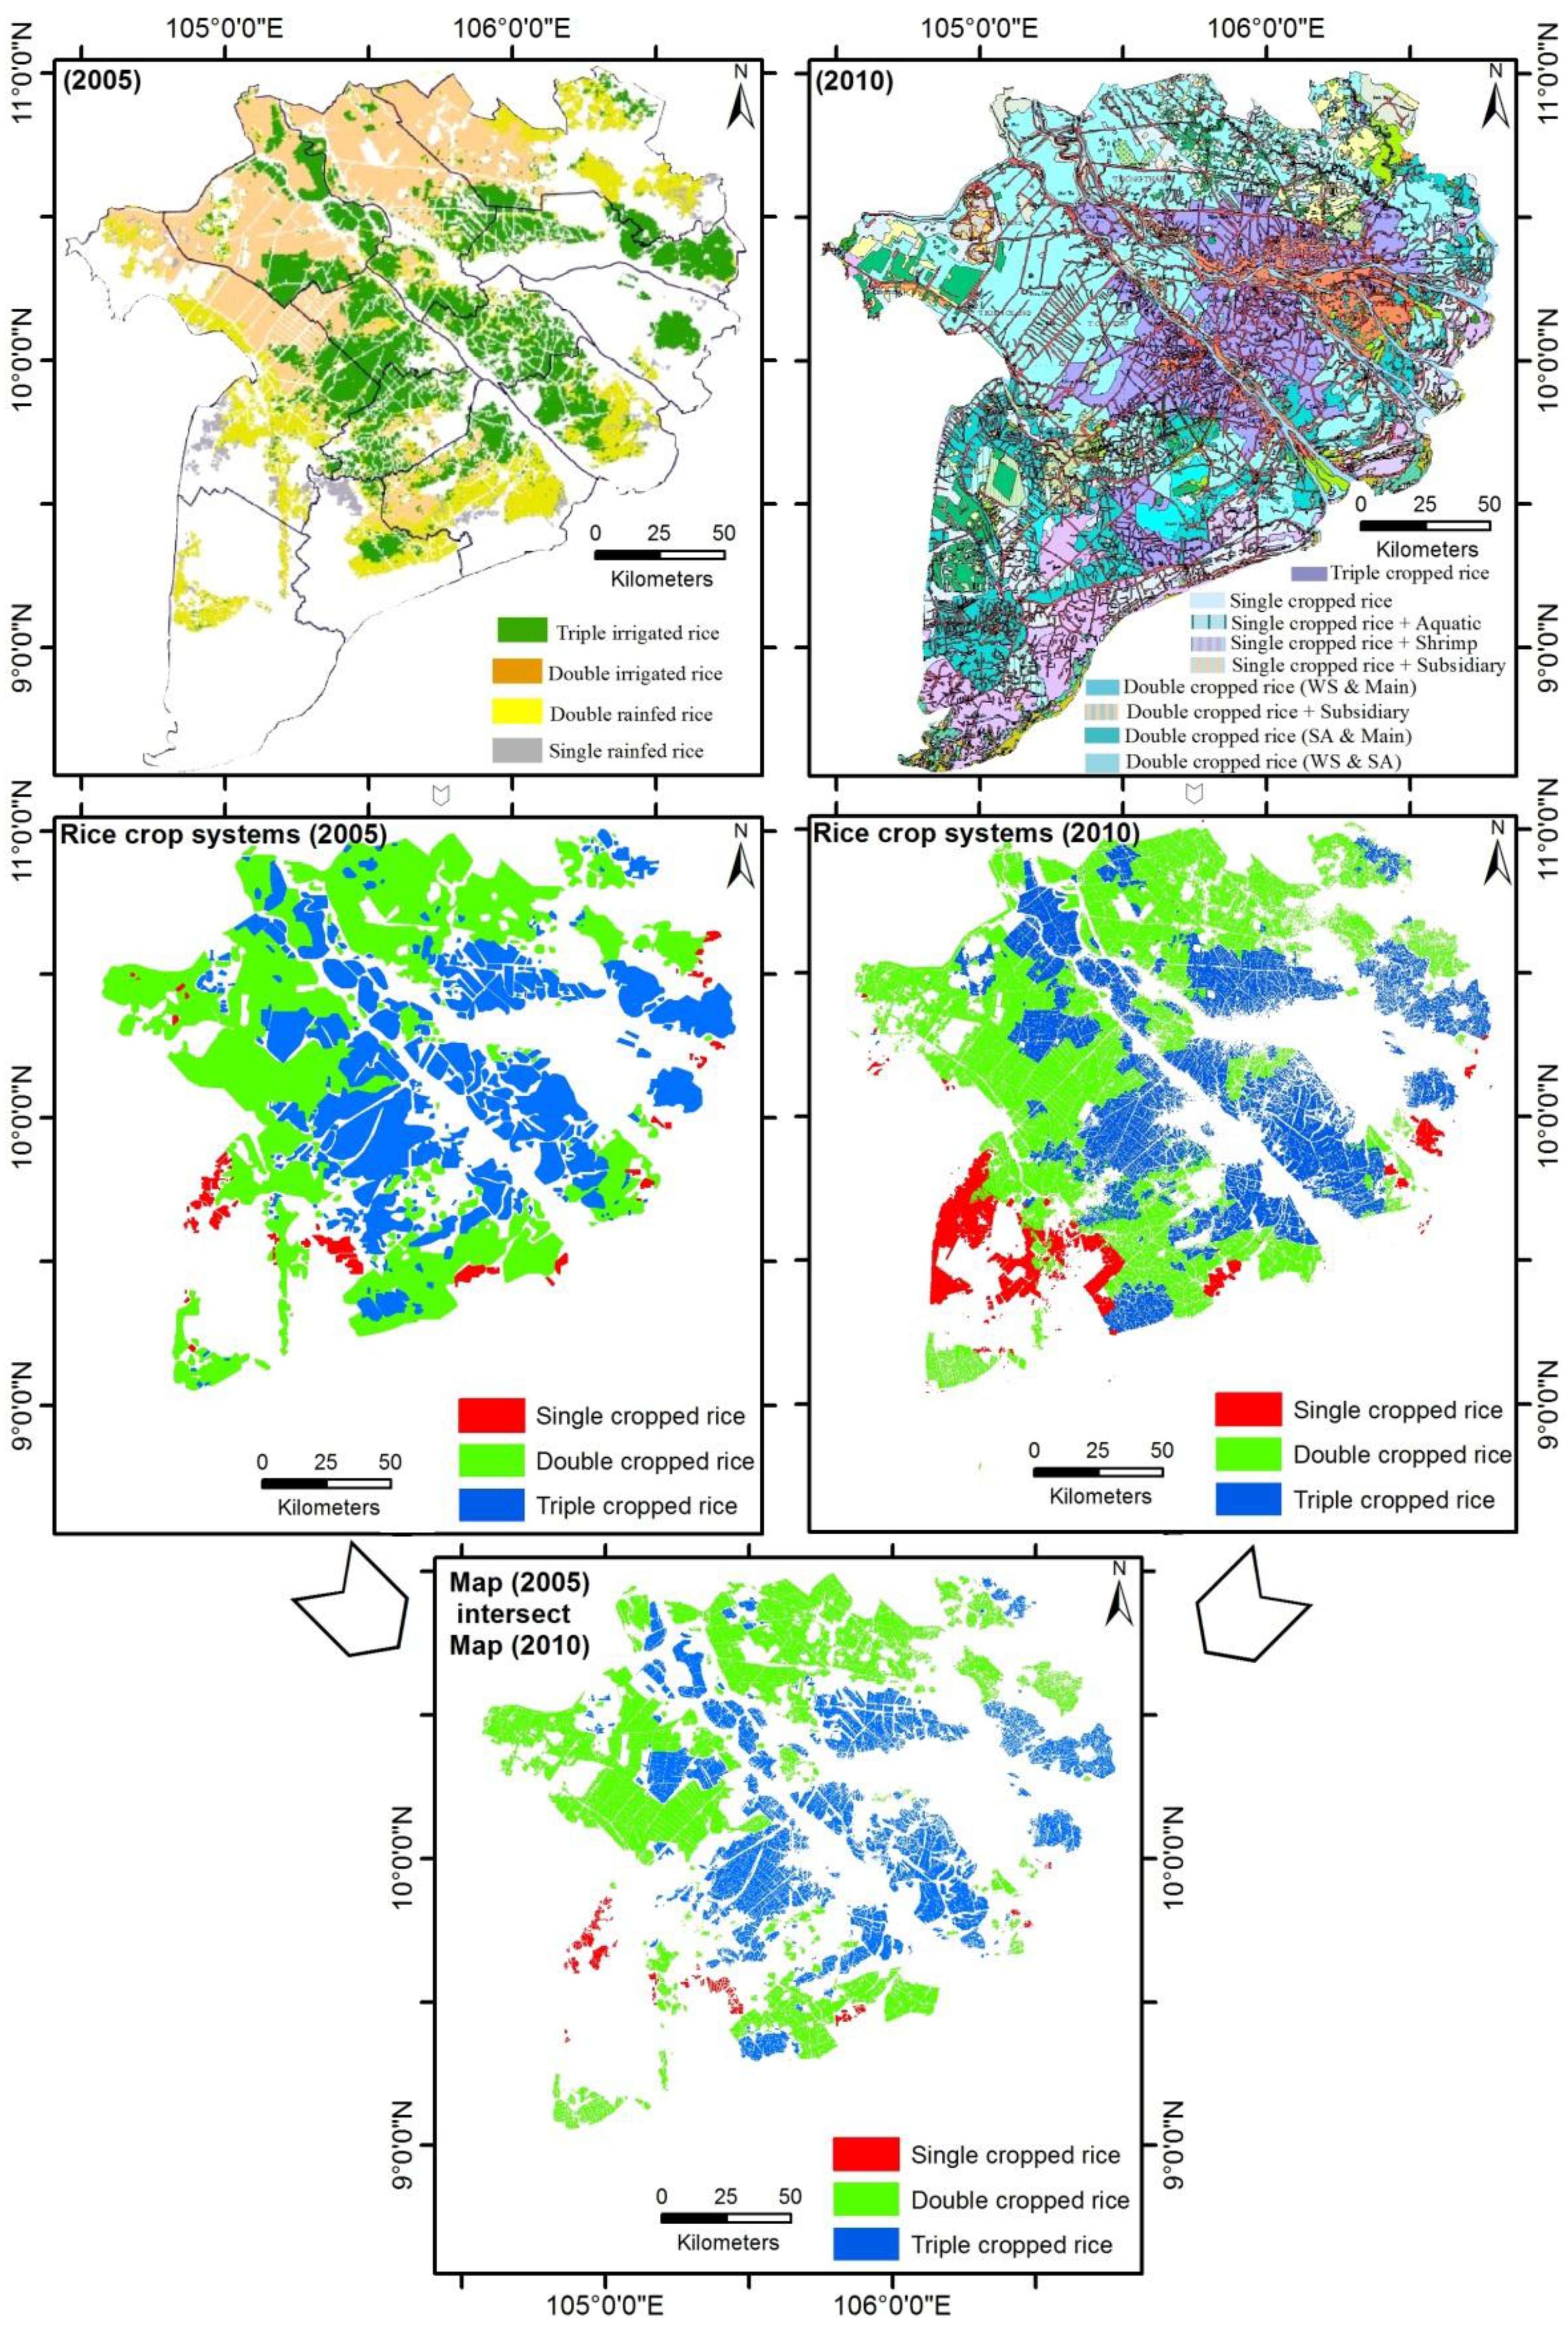
4.3. Reference Dataset

The reference datasets used in this study are the land-use maps from 2005 and 2010 in the Mekong Delta. For simplification, we merged different legends from the land-use maps into single, double and triple cropped-rice classes as shown in Table 1. All remaining classes are considered non-rice-cropping areas.
Furthermore, both reclassified maps were intersected to derive quasi stable rice-cropping areas. In the resulted 2005−2010 map, the areas classified with the same cropping schemes were kept and all other areas were reclassified as non-rice (Figure 8).
Figure 8. Homogenization and intersection of the 2005 and 2010 land-use maps.
Remotesensing 07 15808 g008
Table 1. Land-use map homogenization key.
Land-Use Map 2010Merged LegendLand-Use Map 2005
Triple-cropped riceTriple-cropped riceTriple-irrigated rice
Double-cropped rice + subsidiaryDouble-cropped riceDouble-irrigated rice
Double-cropped rice (WS & SA)
Double-cropped rice (SA & Main)Double rainfed rice
Double-cropped rice (WS & Main)
Single-cropped rice + subsidiarySingle-cropped riceSingle rainfed rice
Single-cropped rice + shrimp
Single-cropped rice + aquatic
Single-cropped rice

4.4. Rice Crop Classification

A straightforward, knowledge-based decision-tree approach was used to discriminate different types of rice-cropping systems. This approach is based on the unique seasonal pattern of rice cropped in the magnitude of SAR backscatter coefficient throughout the growth cycle. Rice crops typically exhibit a temporally varying backscatter signal due to their phenological interaction with the microwave signal. For each location in the study area, the maximum and minimum of the σ°smooth and consequently the amplitude defined as maximum variation of σ°smooth are calculated. In addition, the local min, max, and variation of backscatter for each time interval are calculated. Rice heading dates are distinct peaks in the σ°smooth time series and can be identified by a local maxima algorithm that detects all peaks within the one rice-growing cycle. Figure 9 shows results of the smoothing and backscatter peak detection from six different land-cover types. Additional conditions are applied for the peak detection since a distinct local maxima of the backscatter can also be found in time-series profile of the other land-cover classes as it is shown in Figure 9d–f. In order to distinguish rice from other land-cover classes, three more static thresholds based on the σ°smooth values are empirically defined. The first threshold is set to −8dB for the local maxima, which has to be exceeded for a peak detection corresponding to the rice heading date. The second threshold is set for the minimum amplitude of the backscatter (difference between local minimum and maximum), which has to exceed 2.5 dB. The third threshold is set for the temporal distance between the local maximums. The temporal distance between two local maximums has to be greater than the shortest possible rice-growing cycle which is about 90 days. If all three conditions are met, then the pixel is classified as rice; otherwise it is identified as a non-rice area. The number of detected local maxima in the σ°smooth time series determines the classified rice pixel as single, double or triple-cropped rice area, as can be seen in Figure 9a–c, respectively.
Backscatter is sensitive to roughness, vegetation and soil moisture. The latter two are fluctuating seasonally and therefore are well captured by SAR sensors. Moreover, the phenology patterns (translating and heading time) were well observed over rice-cropped sections in the study area. Therefore, for the next step, the smoothed backscatter time series are used for determination of key seasonality parameters over all rice-growing areas. Building on the methodology developed by Jönsson and Eklundh [77], we defined following phenological parameters:
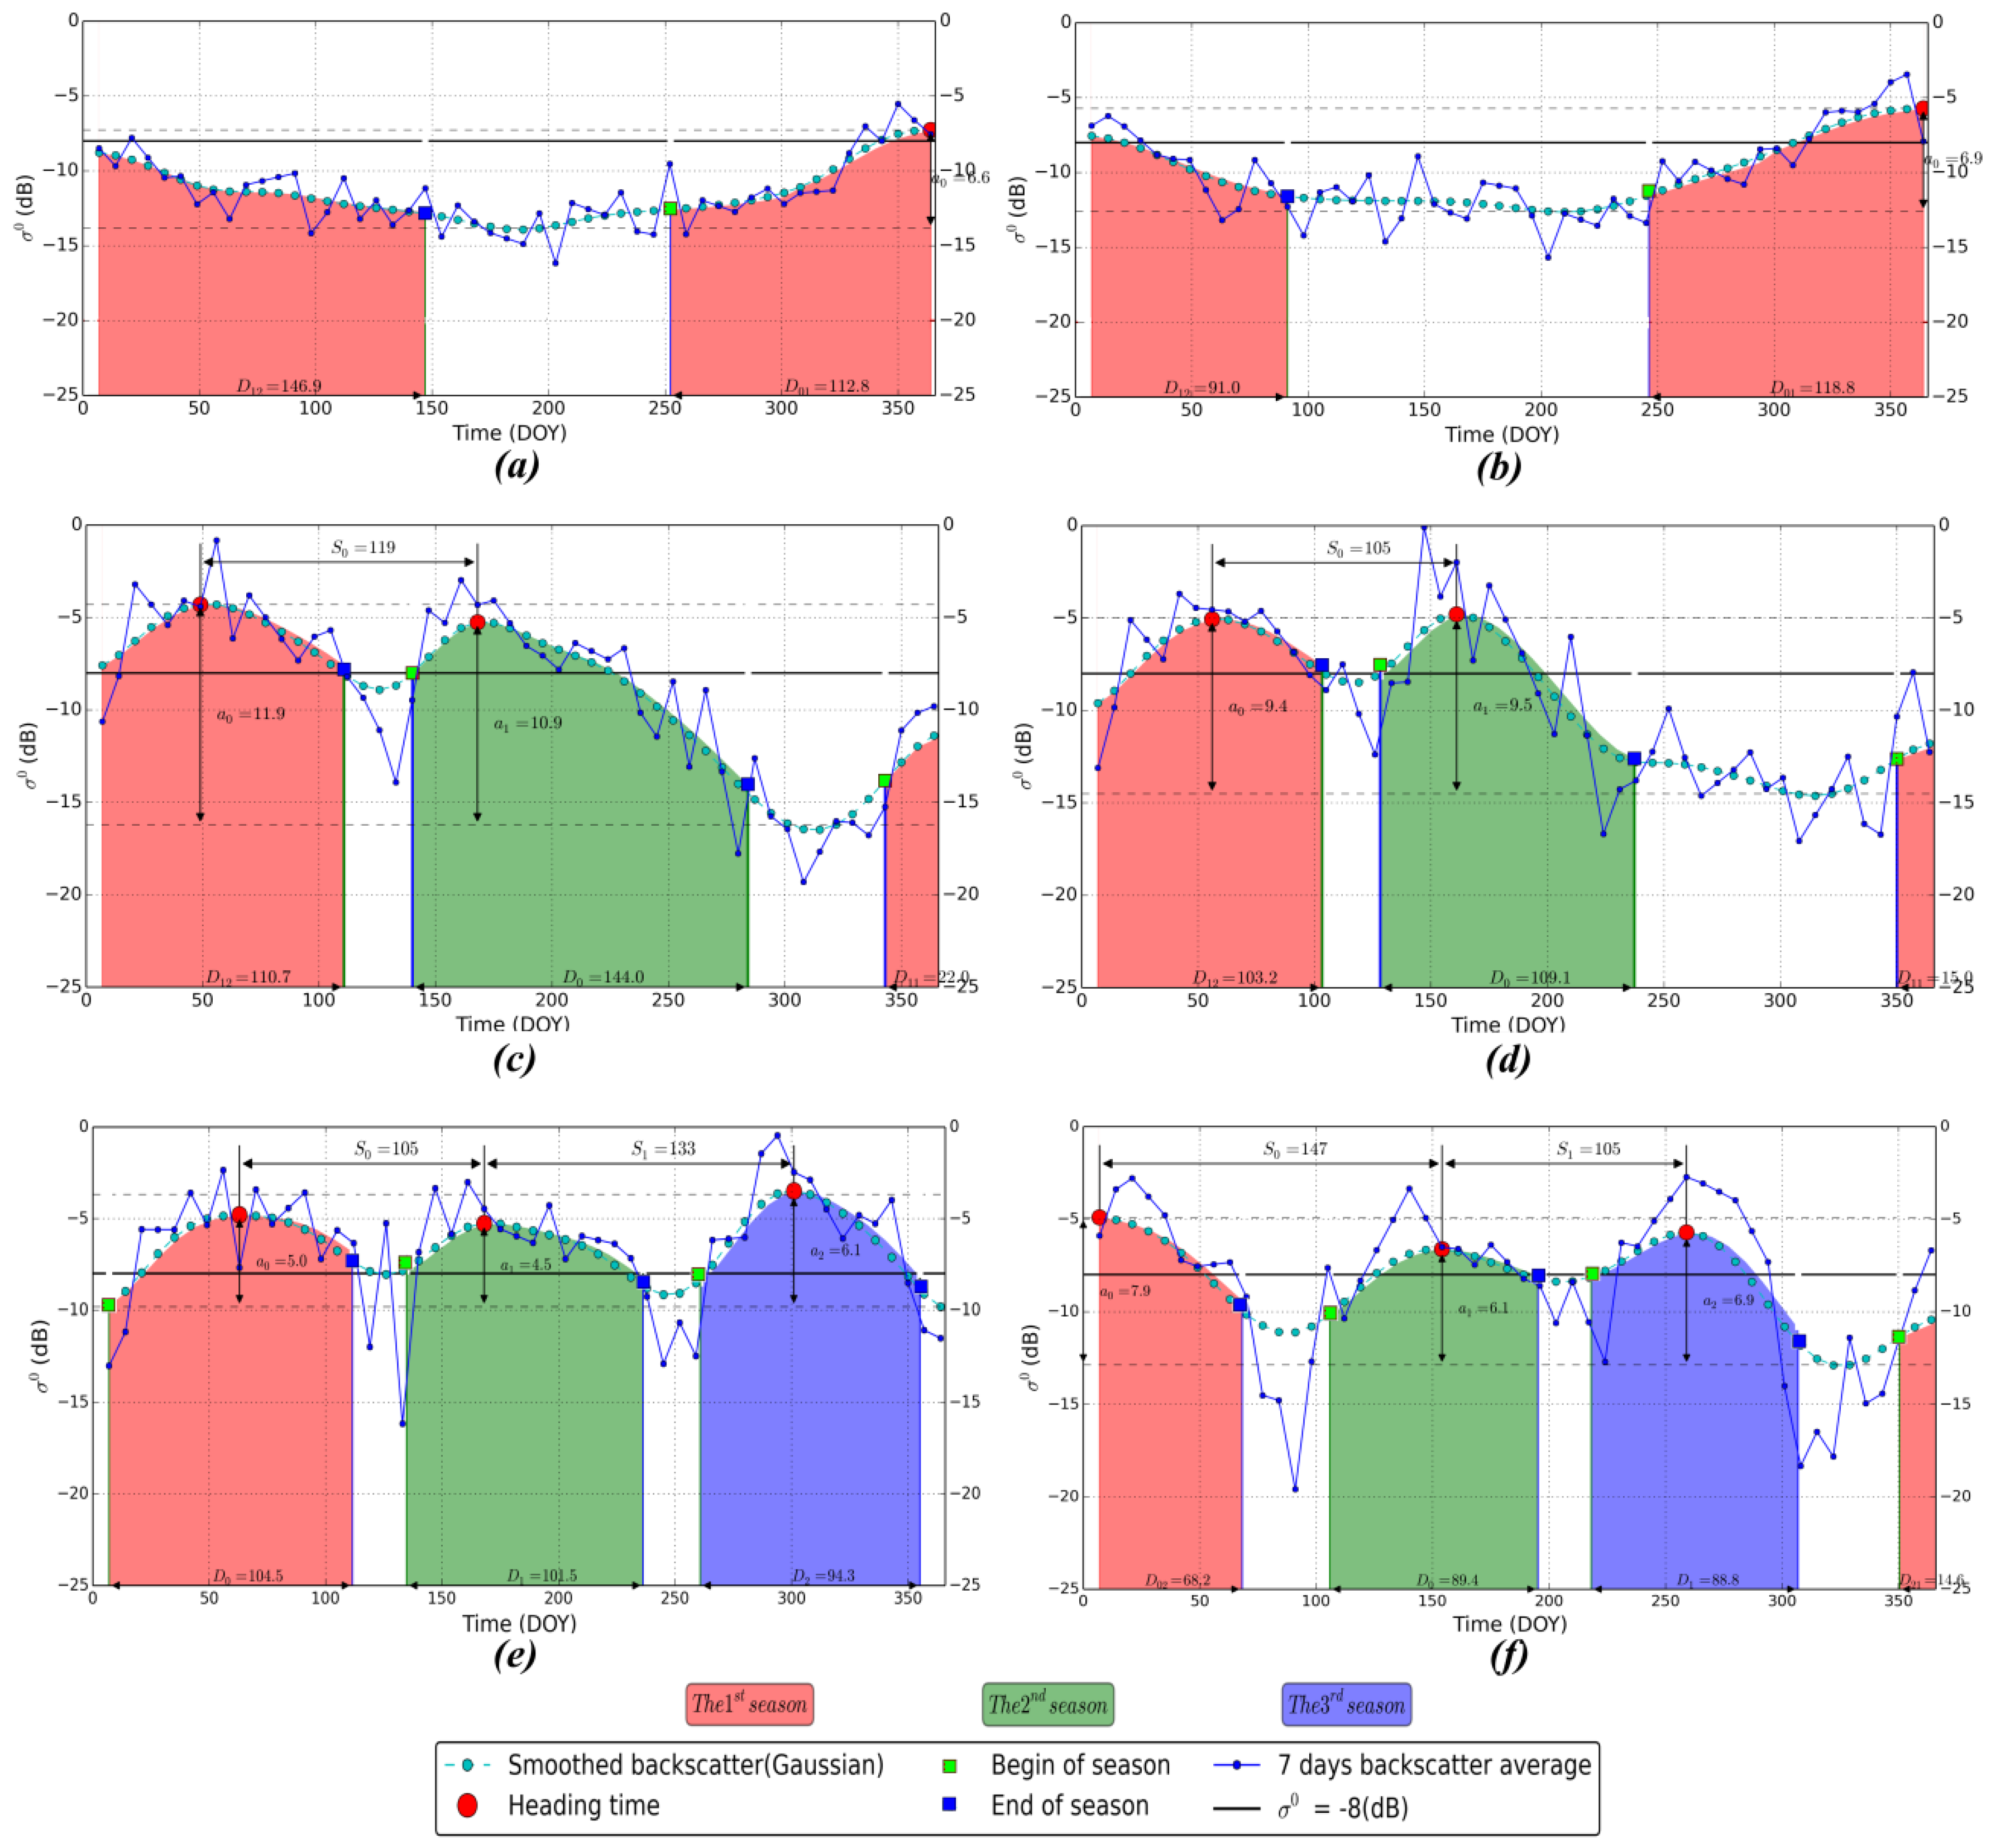
  • Start of Season (SOS) as it can be identified from the inflection point in σ s m o o t h o time series where the second derivative equals 0 and changes from negative to positive.
  • End of Season (EOS) as inflection point in σ s m o o t h o time series where the second derivative equals 0 and changes from positive to negative.
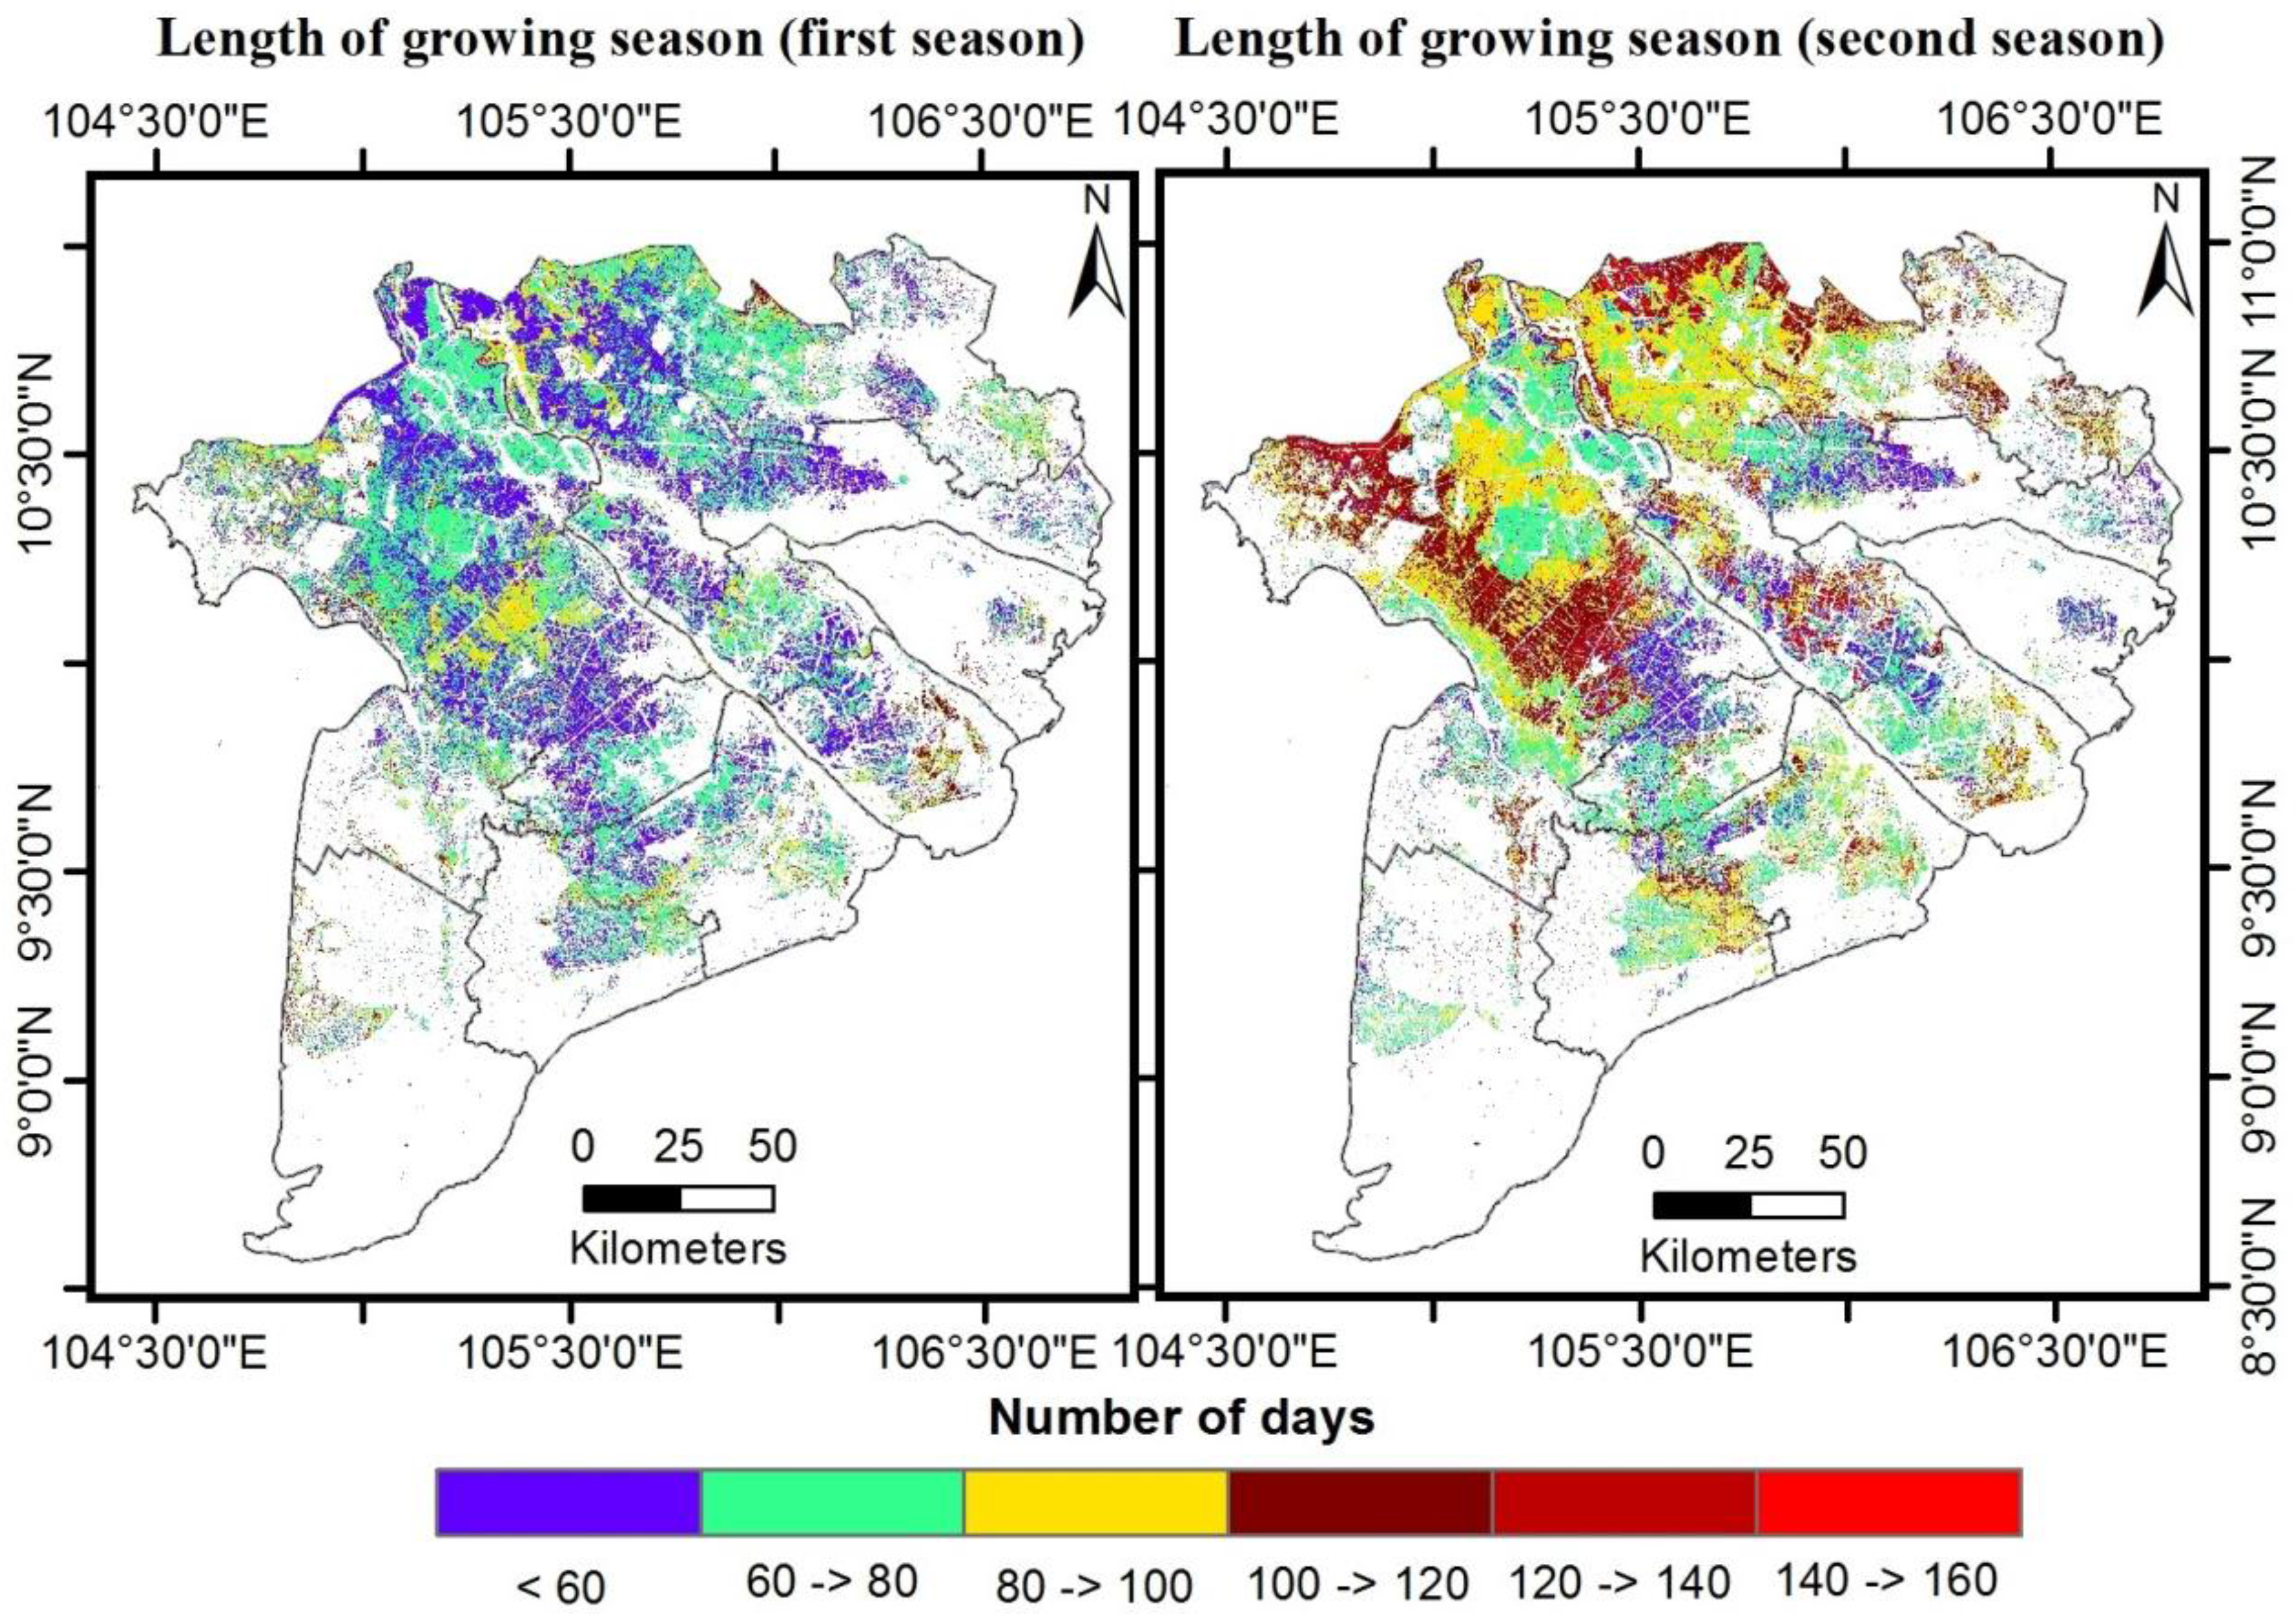
  • Length of Season (LOS) as the difference between start and end of season.
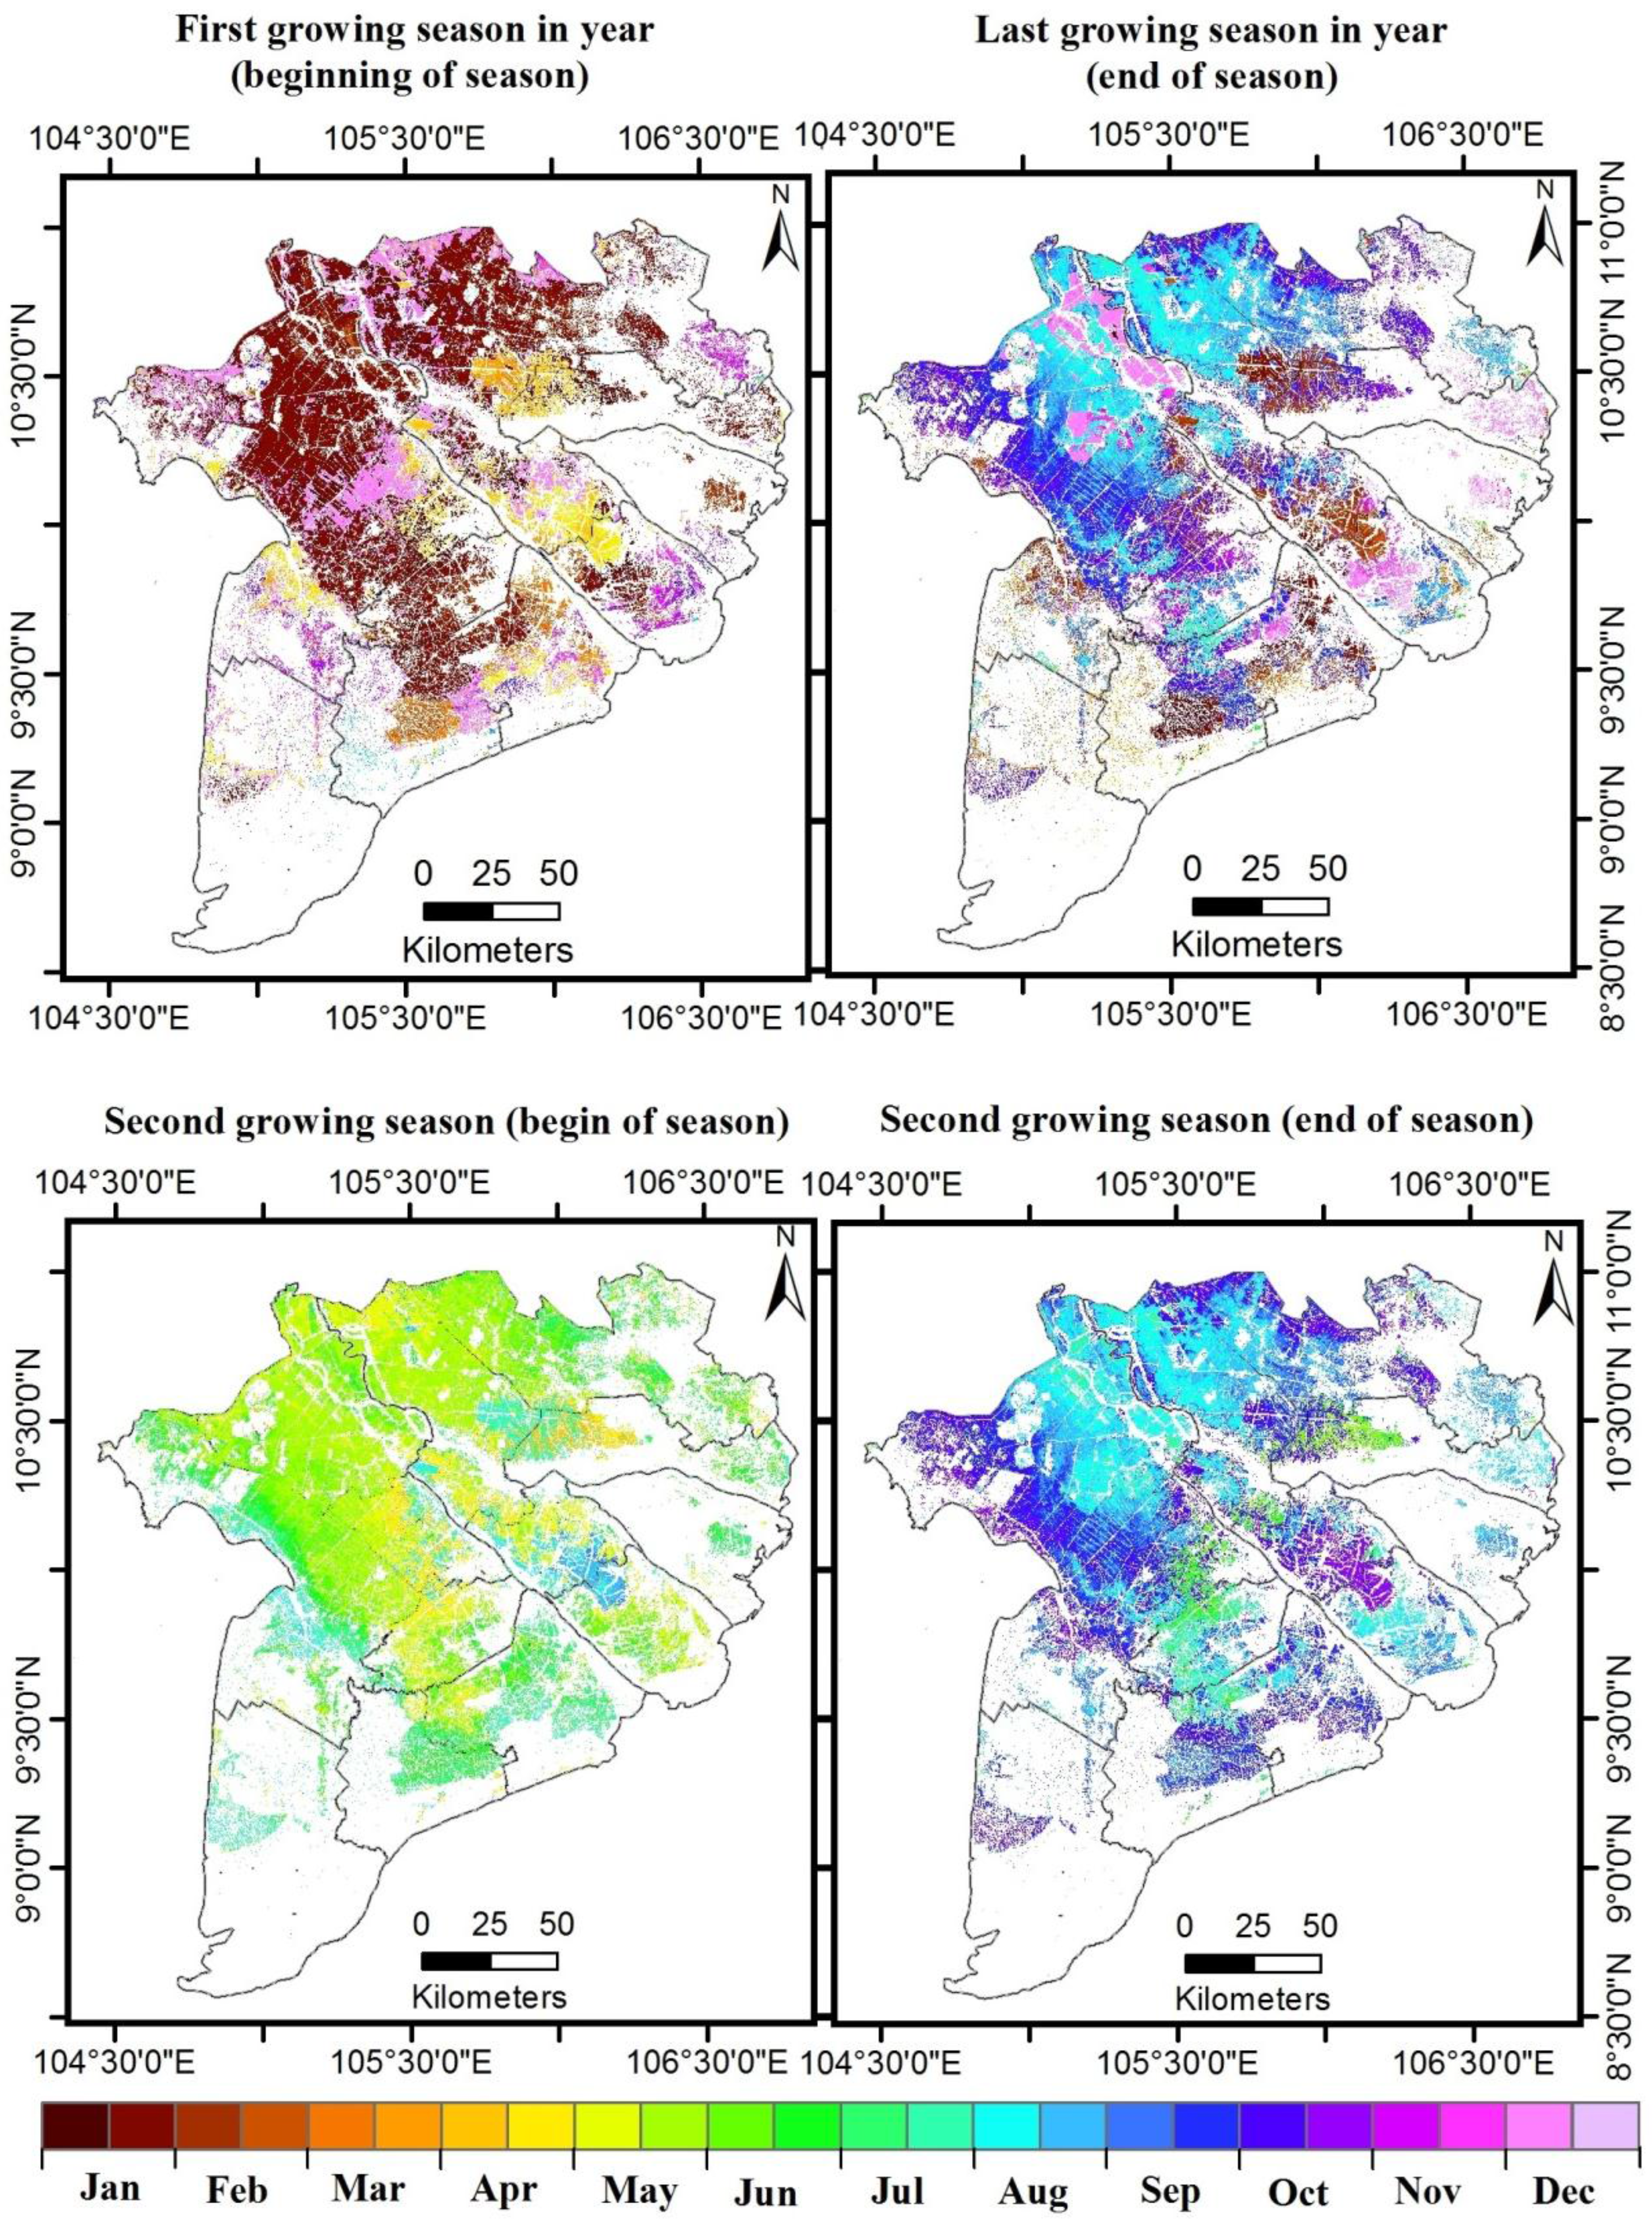
Figure 9. Normalized backscatter time series   σ N O R o compared to the averaged, smoothed time serie   σ s m o o t h o for six different land-cover types. (a) Single-cropped rice. (b) Double-cropped rice. (c) Triple-cropped rice. (d) Urban. (e) Water. (f) Mangrove forest.
Remotesensing 07 15808 g009
This methodology was originally developed for multispectral vegetation indices, which in regard to time series over rice fields show a similar, albeit non-identical behavior as SAR backscatter and are therefore not directly comparable. Examples of single, double and triple rice-cropping schemes that have differing crop calendars and rice varieties of unequal length and therefore different patterns in their seasonality parameters are given in Figure 10. Figure 10a,b show the influence of short- (b) and long- (a) duration rice varieties on backscatter values. Figure 10b is an example of a single-cropped rice + aquaculture field, which explains the prolonged flooding stage compared to Figure 10a.
Figure 10. Retrieval of rice-growing season length for single, double and triple-cropped rice under different crop calendars. (a,b) Single-cropped rice; (c,d) Double-cropped rice; (e,f) Triple-cropped rice.
Remotesensing 07 15808 g010

5. Results

Time-series analysis of Envisat ASAR wide swath data from 2007 through 2011 resulted in a map of the rice-growing areas in the Mekong Delta and their respective cropping schemes shown in Figure 11. Double rice cropping is the dominant rice-cropping scheme in the Mekong Delta. Triple rice cropping is mainly practiced in the central part of the Mekong Delta in the direct vicinity of the Mekong and Bassac Rivers. The northern parts of the delta away from the rivers are primarily double-cropped rice with small and scattered patches of single and triple cropping scheme. Towards the southern coastline of the Mekong Delta, rice fields are sparse, which is especially visible in the southern parts of the Ca Mau, Bac Lieu and Soc Trang provinces. A similar distribution, where rice area levels off toward the cost, is visible at the northwestern tip of the delta in the Kien Giang Province.
Figure 11. Rice crop map for the Mekong Delta derived from Envisat ASAR WSM data from 2007 to 2011.
Remotesensing 07 15808 g011
Seasonality parameters extracted from the time series have been used to produce maps of the temporal distribution of the beginning of the first and second cropping season, end of second and last growing season, displayed in Figure 12, as well as the length of the first and second cropping season which are visible in Figure 13. Most areas that practice two rice crops per year start the first season around January and end the second season anywhere from August to November. Triple crop areas can be divided into two temporal patterns, where the first season either starts in December of the previous year or around April and March. The first group has the end of the third growing season in November or December and the second one around February and March. The majority of second growing seasons start in May and June. Areas with triple cropping and areas at the beginning of the first season in March and April have the start of the second season around August.
Figure 12. Growing season start and end dates in the Mekong Delta derived from Envisat ASAR WSM data from 2007 to 2011.
Remotesensing 07 15808 g012
Length of the first and second growing season is depicted in Figure 13. Most double- and triple-cropped rice areas have a short first growing season below 80 days. For triple-crop schemes the second season is short as well, whereas double crop exhibits a longer second season. The length of the second season of double cropped areas can range from 80 to 140 days. The growing season from SAR point of view could be different than the growing season extracted from NDVI time series. The SAR sensor is sensitive to the vegetation structure and soil moisture rather than the greenness, which is the case with NDVI measurements. In general, NDVI values start to increase earlier than observed in SAR measurements. This is why the SAR-detected growing season in the study region could go below 80 days. For determination of the SOS, EOS, and LOS, all observations from multi-years are considered since not enough measurements from single years are available to map the seasonal variations accurately. This is why the SOS and EOS might not represent the exact transplanting and harvest times in comparison to the values extracted from single-year NDVI time series.
Figure 13. Length of first and second rice-growing season the Mekong Delta derived from Envisat ASAR WSM data from 2007 to 2011.
Remotesensing 07 15808 g013
Accuracy of our classification has been assessed by comparing the classification results to the 2005 and 2010 land-use maps as well as their intersection. The minimum mapping units between the 2005 and 2010 land-cover datasets are not comparable (2010 MMU50k = 4 ha and 2005 MMU650k = 169 ha). Therefore, we extracted the sample points for each dataset by means of a regular grid with 500 m spacing where the sample point is extracted from the cell’s center as depicted in Figure 14. Confusion matrices for all three reference datasets are presented in Table 2. We can report an overall classification accuracy of 85.3% (kappa coefficient 0.74) compared to the 2005–2010 intersection map, 77.2% (kappa coefficient 0.62) compared to the 2010 land-use map and 70.3% (kappa coefficient 0.52) compared to the 2005 land-use map.
Figure 14. Sampling procedure with a regular 500 m grid from the 2010 land-use map.
Remotesensing 07 15808 g014
Table 2. Confusion matrices of the accuracy assessment.
Land Use Map 2005-2010 Intersect
ClassSCDCTCNon-RiceTotalProducer Accuracy
ASARSC6959742561335720.7%
DC2021,9803544200127,54579.8%
TC2129012,12186814,28184.9%
non-rice1492905308664,47470,61491.3%
total86626,27218,75569,904115,797
user accuracy80.3%83.7%64.6%92.2%
Land Use Map 2010
ClassSCDCTCNon-RiceTotalProducer Accuracy
ASARSC2864264364371704133.7%
DC25230,1557261625843,92668.7%
TC36264315,906297221,55773.8%
non-rice9346120555875,76388,73585.7%
total359239,18228,76189,364160,899
user accuracy66.0%77.0%55.3%84.8%
Land Use Map 2005
ClassSCDCTCNon-RiceTotalProducer Accuracy
ASARSC1234614204199606720.3%
DC23429,6457639654444,06267.3%
TC30421314,697334622,28665.9%
non-rice71410,01110,71268,81690,25376.3%
total221244,48328,76182,905162,668
user accuracy55.9%66.6%44.4%83.0%
Comparing the rice area from our classification with the rice acreage data (the mean values of the statistical yearly acreages over the 2007–2011 periods) provided by Vietnam’s General Statistics Office yielded a correlation coefficient (R²) of 0.98 with a root mean square error (RMSE) of 19,664 ha per province (Table 3).
Table 3. Average planted area of rice by province (in ha) for all seasons in five-year period (2007−2011) from the statistical database and from the WSM data.
Province NameWSM data (× 103 ha)Statistical Database ( × 103 ha)Δ (× 103 ha)Δ2 (× 106 ha)
LongAn507.4489.617.8316.84
TienGiang210.4247.1−36.71346.89
BenTre68.281.5−13.3176.89
TraVinh240.5237.43.19.61
VinhLong198.2184.214.0196.00
DongThap538.0468.535.41253.16
AnGiang633.9610.323.6556.96
KienGiang722.6694.727.9778.41
CanTho233.3228.15.227.04
HauGiang210.0214.0−4.016.00
SocTrang351.9355.8−3.915.21
BacLieu187.9171.216.7278.89
CaMau146.6139.27.454.76

6. Discussion

An annual SAR backscatter time series was reconstructed from Envisat ASAR data spanning five years with a novel method. The combination of acquisitions from multiple years was necessary since the inclusion of multiple tracks alone does not meet the temporal density required for reliable time-series analysis. Inclusion of scenes with partial coverage increased the temporal coverage with the drawback of unequal spatial distribution. This temporal and spatial heterogeneous dataset required a robust approach to combination and filtering in order to create a time-series representative for the study period. Homogenization of the ASAR wide swath acquisitions was executed by averaging the available data over the temporal domain, where the averaged value is calculated from all available observations for each pixel over 7 (see Figure 4) and normalizing them to a common incidence angle. Incidence angle normalization was performed following an approach described by Pathe et al. [73]. In their study, the authors assumed that the influence of vegetation growth and seasonality on backscatter is smaller than that of soil moisture given that the linear model used to normalize the incidence angle is fitted to enough scenes. We transfer this approach to rice areas that are proven to have a high influence on backscatter. We postulate that the influence of rice growth on backscatter change in a time series is the main contributing factor; rice areas and growth seasons in the Mekong Delta are temporally stable enough to employ this normalization approach. Our results show that these assumptions have been correct and the incidence angle normalization can be used to combine multiple Envisat ASAR WSM tracks into a single time series. This novel approach allowed us to include a greater number of SAR scenes than any of the previous studies for the MKD.
Our algorithm produced a time series that represents the smoothed average of the SAR backscatter over five years, thus enabling us to evaluate the dominant rice-growing areas, cropping schemes and seasonality parameters for our study period. Any change in rice crop patterns and growing seasons happening in the 2007 to 2011 period is likely to be a source of error when we compare our classification to reference data representing a single year and we acknowledge that errors caused by dynamic shifts in rice-cropping patterns and seasonality will be present in our results. This is visible by comparing the users’ accuracies for the 2010 and 2005 reference with the quasi stable areas of the 2005−2010 intersection. User accuracy compared to the 2005 land-use map is 66.6% for double-cropped rice but 83.7% when regarding areas that are double cropped in the 2005−2010 intersection. For all classes, the user accuracy is higher when we compare our classification to the quasi stable areas of the 2005−2010 intersection reference. On the one hand, this highlights a limitation in our method which relies on temporal averaging and smoothing to create an ASAR time series. On the other hand, it also underlines the temporal dynamics in rice-cropping schemes and other land-cover changes in the Mekong Delta. Most classification errors can be attributed to this dynamic but cannot be completely assessed due to the lack of a reference dataset covering the complete 2007 to 2011 period. We suspect that these dynamic changes are also one of the error sources contributing to the low producer accuracy of the single-cropped class compared to the 2005−2010 intersection. Single-cropped, rainfed rice is increasingly diminished in favor of more profitable shrimp and fish farming [8,66,78] and could thusly be misclassified when such a change occurred during our study period. In addition, this cropping scheme is less widely distributed and spatially homogeneous than double or triple crop rice and might therefore be underrepresented in the 2005 land-use map which is based on moderate resolution data. Triple-cropped rice shows relatively low user accuracy compared to the 2005−2010 intersection. We suspect the error source for this in our time-series creation methodology. If an area is triple cropped throughout the study period but with slight shifts in heading and sowing dates, our temporal averaging and smoothing approach is unlikely to produce the discernible heading dates necessary for the decision-tree classifier to detect rice areas.
We found good agreement in the spatial distribution of single, double and triple rice-cropping schemes compared to previous studies in the Mekong Delta that reported cropping scheme maps with accuracies similar to our product [6,8,49,66,77]. The major driving force behind a farmer’s choice of cropping scheme is the availability and management of water [66]. The central parts of the delta are close to two large rivers and have a dense system of dykes and channels that allow flood management. Kuenzer et al. [63] already pointed out that the level of flood management coincides highly with the employed rice-cropping scheme. This abundance of water combined with the ability to manage the flooding enables the cultivation of two or three rice crops per year. Son et al. [8] found that triple cropping increased by about 12% at the expense of double cropping under irrigated conditions for the 2007 to 2011 period. The method we employed has limited ability to show these changes since it detects the dominant cropping scheme over the studied time period. We therefore have to assume that some classification errors in the central Mekong Delta between double- and triple-cropping occurred. These, however, do not influence the accuracy of total rice area, which has been reported as stable over time [8]. Moreover, the rice area of our product correlates highly with governmental statistics at the provincial level. Away from the rivers, the flooding is less managed and rice tends to be double cropped under rainfed conditions. Triple cropping is not employed in these regions due to a lack of water during the dry season. Rainfed single cropping is mostly practiced in coastal areas under less than ideal growing conditions induced by salinity intrusion. These areas experience a shift away from rice towards more profitable shrimp and combined rice and shrimp farming [8,66,77]. Our methodology is unsatisfactory in detecting changes in land cover and we can only report the dominant land cover. We therefore have to assume these changes to be a source of commission and omission errors between classes as well as between rice and non-rice areas.
Length of flooding influences whether double cropping is performed with two short or a short followed by a long season, visible from the length of the second season in Figure 14. It is likely that the short-long double-cropping areas grow different rice varieties each year for the second season with different growth period lengths depending on water availability, pest control and market prices. In unfavorable conditions, farmers are more likely to plant resilient rice varieties with longer growing periods [66]. These diverse cropping practices have likely been averaged out by our algorithm. Classification of growing season length and the respective start and end points is most accurate for areas with stable cropping practices and otherwise shows the average for 2007 through 2011. Triple cropping is executed with three short growing seasons in the Winter−Spring, Summer−Autumn and Autumn−Winter periods in order to manage three whole crops throughout a year. Our classification shows significant differences in the beginning of the first season for triple-cropped areas. This, to some extent, might be attributed to our algorithm. Depending on the heading date, either the Winter−Spring or Spring−Summer crop is detected as the first crop of the year. Nonetheless, this reveals that even under the same cropping scheme and comparable environmental conditions, a shift of more than a month for the heading dates is possible. This variation is also exhibited by single- and double-cropping rice areas, proving to be one of the major challenges of rice classification in the Mekong Delta.
Mixed pixel effects caused by the spatial resolution of wide swath mode data are a source for commission errors. While single rice fields usually have a size of 1−2 ha they tend to be aggregated to larger rice area clusters in our study area. Fields inside these clusters are bound by small dykes, dams, roads, non-rice vegetation and other land cover smaller than the geometric resolution of our SAR data. Since these elements cannot be detected in ASAR WSM images, they will lead to an overestimation of the total rice area by virtue of commission errors. A reverse effect of omission errors does not hold true since there are no small rice fields located inside larger areas of other land cover. This effect is likely to be small or cancelled out by omission or other error sources since the comparison of our estimated rice area with official statistics showed good correlation, albeit with a small overestimation of rice area.

7. Conclusions

Our study presents a novel approach to rice mapping by combining multi-year and multi-track SAR wide swath acquisitions into a normalized time series which can be used to observe the temporal backscatter dynamics over paddy rice fields. Effects of differing incidence angles and temporal density of acquisitions have been tackled by temporal averaging and incidence angle normalization based on statistical methods. Classification was performed with a rice crop phenology decision-tree classifier based on previous studies. This novel approach to combining Envisat ASAR WSM data led to a significant increase in temporal density by using all available observations compared to previous studies that employed narrow swath multi-polarization data or only detected the temporal change within single tracks.
We used the method to map rice areas and cropping schemes in the Mekong Delta for the 2005 to 2011 period based on all available ASAR WSM acquisitions. Compared to 2005 and 2010 land-use maps, we can report an overall accuracy of 85.3% with a kappa coefficient of 0.74. Our data is highly correlated with official rice area statistics (R² of 0.98). A disadvantage of our method is that no yearly rice maps of the Mekong Delta can be produced based on Envisat ASAR data which would allow the detection of dynamic changes in rice area and seasonality. This is less a limitation of the method, however, and more a reflection of a lack in the availability of suitable SAR data. Sentinel-1 has the ability to cover our study area with a repeat cycle of 12 days and could be used for timely rice mapping and seasonality detection in the Mekong Delta. Our method of backscatter time-series creation from multiple-tracks with incidence angle normalization to enhance temporal and spatial coverage should be transferable to Sentinel-1 data. We tested this approach in the Mekong Delta but it should be applicable to paddy rice areas worldwide demonstrating a distinct temporal backscatter change. Previous studies and theoretical models have shown that this holds true for all rice fields that are flooded before direct seeding or transplantation of rice seedlings.

Acknowledgments

This work was partially supported by the Austrian Research Promotion Agency (FFG) through “Preparing for the Initial Services of the Earth Observation Data Centre for Water Resources Monitoring” and WetMon projects with project numbers 836786 and 848001, respectively, and the German Ministry of Education and Research (BMBF) through the DeltAdapt project. The authors would also like to thank VIED (Vietnam International Education Development) and OeAD (Österreichischer Austauschdienst) support during the studying period.

Author Contributions

Duy Ba Nguyen, Wolfgang Wagner and Vahid Naeimi conceived and designed the study. The algorithm was developed by Duy Ba Nguyen and the experiments were implemented by Duy Ba Nguyen with guiding comments by Kersten Clauss and Claudia Kuenzer. SAR data pre-processing and geophysical parameters retrieval were performed by Vahid Naeimi and Senmao Cao. Duy Ba Nguyen wrote a first draft version of the manuscript and produced all graphics. Kersten Clauss and Claudia Kuenzer analyzed and interpreted the preliminary results, suggested detailed improvements, and had a major contribution in the writing of the results, discussions and conclusion sections. All authors provided assistance in editing and organizing the manuscript.

Conflicts of Interest

The authors declare no conflict of interest.

References

  1. FAOSTAT Paddy Rice Production 2013. Available online: http://faostat3.fao.org/ (accessed on 3 July 2015).
  2. General Statistics Office of Vietnam. Statistical Yearbook of Vietnam 2014; Statistical Publishing House: Hanoi, Vietnam, 2014. [Google Scholar]
  3. De Datta, S. Principles and Practices of Rice Production; Wiley: New York, NY, USA, 1981. [Google Scholar]
  4. Kuenzer, C.; Knauer, K. Remote sensing of rice crop areas. Int. J. Remote Sens. 2013, 34, 2101–2139. [Google Scholar] [CrossRef]
  5. Mosleh, M.K.; Hassan, Q.K.; Chowdhury, E.H. Application of remote sensors in mapping rice area and forecasting its production: A review. Sensors 2015, 15, 769–791. [Google Scholar] [CrossRef] [PubMed]
  6. Xiao, X.; Boles, S.; Frolking, S.; Li, C.; Babu, J.Y.; Salas, W.; Moore, B. Mapping paddy rice agriculture in South and Southeast Asia using multi-temporal MODIS images. Remote Sens. Environ. 2006, 100, 95–113. [Google Scholar] [CrossRef]
  7. Chen, C.F.; Son, N.T.; Chang, L.Y.; Chen, C.R. Classification of rice cropping systems by empirical mode decomposition and linear mixture model for time-series MODIS 250 m NDVI data in the Mekong Delta, Vietnam. Int. J. Remote Sens. 2011, 32, 5115–5134. [Google Scholar] [CrossRef]
  8. Son, N.T.; Chen, C.F.; Chen, C.R.; Duc, H.N.; Chang, L.Y. A phenology-based classification of time-series MODIS data for rice crop monitoring in Mekong Delta, Vietnam. Remote Sens. 2014, 6, 135–156. [Google Scholar] [CrossRef]
  9. Xiao, X.; Boles, S.; Liu, J.; Zhuang, D.; Frolking, S.; Li, C.; Salas, W.; Moore, B. Mapping paddy rice agriculture in southern China using multi-temporal MODIS images. Remote Sens. Environ. 2005, 95, 480–492. [Google Scholar] [CrossRef]
  10. Peng, D.; Huete, A.R.; Huang, J.; Wang, F.; Sun, H. Detection and estimation of mixed paddy rice cropping patterns with MODIS data. Int. J. Appl. Earth Obs. Geoinf. 2011, 13, 13–23. [Google Scholar] [CrossRef]
  11. Sakamoto, T.; Yokozawa, M.; Toritani, H.; Shibayama, M.; Ishitsuka, N.; Ohno, H. A crop phenology detection method using time-series MODIS data. Remote Sens. Environ. 2005, 96, 366–374. [Google Scholar] [CrossRef]
  12. Chen, C.F.; Son, N.T.; Chang, L.Y. Monitoring of rice cropping intensity in the upper Mekong Delta, Vietnam using time-series MODIS data. Adv. Space Res. 2012, 49, 292–301. [Google Scholar] [CrossRef]
  13. Dong, J.; Xiao, X.; Kou, W.; Qin, Y.; Zhang, G.; Li, L.; Jin, C.; Zhou, Y.; Wang, J.; Biradar, C.; et al. Tracking the dynamics of paddy rice planting area in 1986–2010 through time series Landsat images and phenology-based algorithms. Remote Sens. Environ. 2015, 160, 99–113. [Google Scholar] [CrossRef]
  14. Xiao, X.; Boles, S.; Frolking, S.; Salas, W.; Moore, B.; Li, C.; He, L.; Zhao, R. Observation of flooding and rice transplanting of paddy rice fields at the site to landscape scales in China using VEGETATION sensor data. Int. J. Remote Sens. 2002, 23, 3009–3022. [Google Scholar] [CrossRef]
  15. Leinenkugel, P.; Kuenzer, C.; Oppelt, N.; Dech, S. Characterisation of land surface phenology and land cover based on moderate resolution satellite data in cloud prone areas—A novel product for the Mekong Basin. Remote Sens. Environ. 2013, 136, 180–198. [Google Scholar] [CrossRef]
  16. Naeimi, V.; Leinenkugel, P.; Sabel, D.; Wagner, W.; Apel, H.; Kuenzer, C. Evaluation of soil moisture retrieval from the ERS and Metop scatterometers in the lower Mekong Basin. Remote Sens. 2013, 5, 1603–1623. [Google Scholar] [CrossRef] [Green Version]
  17. Lam-Dao, N.; le Toan, T.; Apan, A.; Bouvet, A.; Young, F.; Le-Van, T. Effects of changing rice cultural practices on C-band synthetic aperture radar backscatter using Envisat advanced synthetic aperture radar data in the Mekong River Delta. J. Appl. Remote Sens. 2009, 3, 1–17. [Google Scholar]
  18. Bouvet, A.; le Toan, T. Use of ENVISAT/ASAR wide-swath data for timely rice fields mapping in the Mekong River Delta. Remote Sens. Environ. 2011, 115, 1090–1101. [Google Scholar] [CrossRef] [Green Version]
  19. Ribbes, F.; le Toan, T. Rice field mapping and monitoring with RADARSAT data. Int. J. Remote Sens. 1999, 20, 745–765. [Google Scholar] [CrossRef]
  20. Ribbes, F.; le Toan, T. Use of ERS-1 SAR data for ricefield mapping and rice crop parameters retrieval. In Proceedings of the Geoscience and Remote Sensing Symposium, Lincoln, NE, USA, 27–31 May 1996; pp. 1983–1985.
  21. Le Toan, T.; Ribbes, F.; Floury, N.; Fujita, M.; Kurosu, T.; Wang, L.F.; Floury, N.; Ding, K.H.; Kong, J.A.; Fujita, M.; Kurosu, T. Rice crop mapping and monitoring using ERS-1 data based on experiment and modeling results. IEEE Trans. Geosci. Remote Sens. 1997, 35, 41–56. [Google Scholar] [CrossRef]
  22. Aschbacher, J.; Pongsrihadulchai, A.; Karnchanasutham, S.; Rodprom, C.; Paudyal, D.R.R.; le Toan, T. Assessment of ERS-1 SAR data for rice crop mapping and monitoring. In Proceedings of the Geoscience and Remote Sensing Symposium, Firenze, Italy, 10–14 July 1995.
  23. Kurosu, T.; Fujita, M.; Chiba, K. Monitoring of rice crop growth from space using the ERS-1 C-band SAR. IEEE Trans. Geosci. Remote Sens. 1995, 33, 1092–1096. [Google Scholar] [CrossRef]
  24. Kurosu, T.; Fujita, M.; Chiba, K. The identification of rice fields using multi-temporal ERS-1 C band SAR data. Int. J. Remote Sens. 1997, 18, 2953–2965. [Google Scholar] [CrossRef]
  25. Patel, N.K.; Medhavy, T.T.; Patnaik, C.; Hussain, A. Multi temporal ERS-1 SAR data for identification of rice crop. J. Indian Soc. Remote Sens. 1995, 23, 33–39. [Google Scholar] [CrossRef]
  26. Chakraborty, M.; Panigrahy, S.; Sharma, S.A. Discrimination of rice crop grown under different cultural practices using temporal ERS-1 synthetic aperture radar data. ISPRS J. Photogramm. Remote Sens. 1997, 52, 183–191. [Google Scholar] [CrossRef]
  27. Wang, L.F.; Kong, J.A.; Ding, K.H.; le Toan, T.; Ribbes, F.; Floury, N. Electromagnetic scattering model for rice canopy based on Monte Carlo simulation. Prog. Electromagn. Res. 2005, 52, 153–171. [Google Scholar] [CrossRef]
  28. IRRI Knowledgebank. Available online: http://www.knowledgebank.irri.org/ (accessed on 3 July 2015).
  29. Liew, S.C.; Kam, S.P.; Tuong, T.P.; Chen, P.; Minh, V.Q.; Lim, H. Application of multitemporal ERS-2 synthetic aperture radar in delineating rice cropping systems in the Mekong River Delta, Vietnam. IEEE Trans. Geosci. Remote Sens. 1998, 36, 1412–1420. [Google Scholar] [CrossRef]
  30. McNairn, H.; Brisco, B. The application of C-band polarimetric SAR for agriculture: A review. Can. J. Remote Sens. 2004, 30, 525–542. [Google Scholar] [CrossRef]
  31. Jia, M.; Tong, L.; Chen, Y.; Wang, Y.; Zhang, Y. Rice biomass retrieval from multitemporal ground-based scatterometer data and RADARSAT-2 images using neural networks. J. Appl. Remote Sens. 2013. [Google Scholar] [CrossRef]
  32. Panigrahy, S.; Chakraborty, M.; Sharma, S.A.; Kundu, N.; Ghose, S.C.; Pal, M. Early estimation of rice area using temporal ERS-1 synthetic aperture radar data a case study for the Howrah and Hughly districts of West Bengal, India. Int. J. Remote Sens. 1997, 18, 1827–1833. [Google Scholar] [CrossRef]
  33. Premalatha, M.; Nageswara Rao, P.P. Crop acreage estimation using ERS-1 SAR data. J. Indian Soc. Remote Sens. 1994, 22, 139–147. [Google Scholar] [CrossRef]
  34. Shao, Y.; Fan, X.; Liu, H.; Xiao, J.; Ross, S.; Brisco, B.; Brown, R.; Staples, G. Rice monitoring and production estimation using multitemporal RADARSAT. Remote Sens. Environ. 2001, 76, 310–325. [Google Scholar] [CrossRef]
  35. Panigrahy, S.; Manjunath, K.R.; Chakraborty, M.; Kundu, N.; Parihar, J.S. Evaluation of RADARSAT Standard Beam data for identification of potato and rice crops in India. ISPRS J. Photogramm. Remote Sens. 1999, 54, 254–262. [Google Scholar] [CrossRef]
  36. Chakraborty, M.; Manjunath, K.R.; Panigrahy, S.; Kundu, N.; Parihar, J.S. Rice crop parameter retrieval using multi-temporal, multi-incidence angle Radarsat SAR data. ISPRS J. Photogramm. Remote Sens. 2005, 59, 310–322. [Google Scholar] [CrossRef]
  37. Li, Y.; Liao, Q.; Li, X.; Liao, S.; Chi, G.; Peng, S. Towards an operational system for regional-scale rice yield estimation using a time-series of Radarsat ScanSAR images. Int. J. Remote Sens. 2003, 24, 4207–4220. [Google Scholar] [CrossRef]
  38. Choudhury, I.; Chakraborty, M. SAR signature investigation of rice crop using RADARSAT data. Int. J. Remote Sens. 2006, 27, 519–534. [Google Scholar] [CrossRef]
  39. Yun, S.; Cuizhen, W.; Xiangtao, F.; Hao, L. Estimation of rice growth status using RADARSAT data. In Proceedings of the IEEE International Geoscience and Remote Sensing, Singapore, 3–8 August 1997; pp. 1430–1432.
  40. Liew, S.C.; Chen, P.; Kam, S.P.; Tuong, T.P.; Minh, V.Q.; Lim, H. Rice crops monitoring in the Mekong river delta using combined ERS and RADARSAT synthetic aperture radar. In Proceedings of the Geoscience and Remote Sensing Symposium, Seattle, WA, USA, 6–10 July 1998; pp. 2746–2748.
  41. Inoue, Y.; Kurosu, T.; Maeno, H.; Uratsuka, S.; Kozu, T.; Dabrowska-Zielinska, K.; Qi, J. Season-long daily measurements of multifrequency (Ka, Ku, X, C, and L) and full-polarization backscatter signatures over paddy rice field and their relationship with biological variables. Remote Sens. Environ. 2002, 81, 194–204. [Google Scholar] [CrossRef]
  42. Suga, Y.; Konishi, T. Rice crop monitoring using X, C and L band SAR data. Proc. SPIE 2008. [Google Scholar] [CrossRef]
  43. Rosenqvist, A. Temporal and spatial characteristics of irrigated rice in JERS-1 L-band SAR data. Int. J. Remote Sens. 1999, 20, 1567–1587. [Google Scholar] [CrossRef]
  44. Zhang, Y.; Wang, C.; Wu, J.; Qi, J.; Salas, W. Mapping paddy rice with multitemporal ALOS/PALSAR imagery in southeast China. Int. J. Remote Sens. 2009, 30, 6301–6315. [Google Scholar] [CrossRef]
  45. Wang, C.; Wu, J.; Zhang, Y.; Pan, G.; Qi, J.; Salas, W.A. Characterizing L-band scattering of paddy rice in southeast China with radiative transfer model and multitemporal ALOS/PALSAR imagery. IEEE Trans. Geosci. Remote Sens. 2009, 47, 988–998. [Google Scholar] [CrossRef]
  46. Ling, F.; Li, Z.; Chen, E.; Tian, X.; Bai, L.; Wang, F. RICE areas mapping using ALOS PALSAR FBD data considering the Bragg scattering in L-band SAR images of rice fields. In Proceedings of the Geoscience and Remote Sensing Symposium, Honolulu, HI, USA, 25–30 July 2010; pp. 1461–1464.
  47. Le Toan, T.; Laur, H.; Mougin, E.; Lopes, A. Multitemporal and dual-polarization observations of agricultural vegetation covers by X-band SAR images. IEEE Trans. Geosci. Remote Sens. 1989, 27, 709–718. [Google Scholar] [CrossRef]
  48. Chen, E.X.; Li, Z.Y.; Tan, B.X.; Pang, Y.; Tian, X.; Li, B.B. Supervised wishart classifier for rice mapping using multi-temporal envisat asar aps data. In Proceedings of the Envisat Symposium, Montreux, Switzerland, 23–27 April 2007; pp. 2–7.
  49. Bouvet, A.; le Toan, T.; Lam-Dao, N. Monitoring of the Rice Cropping System in the Mekong Delta Using ENVISAT/ASAR Dual Polarization Data. IEEE Trans. Geosci. Remote Sens. 2009, 47, 517–526. [Google Scholar] [CrossRef] [Green Version]
  50. Wu, F.; Wang, C.; Zhang, H.; Zhang, B.; Tang, Y. Rice crop monitoring in South China with RADARSAT-2 quad-polarization SAR Data. IEEE Geosci. Remote Sens. Lett. 2011, 8, 196–200. [Google Scholar] [CrossRef]
  51. Li, K.; Brisco, B.; Yun, S.; Touzi, R. Polarimetric decomposition with RADARSAT-2 for rice mapping and monitoring. Can. J. Remote Sens. 2012, 38, 169–179. [Google Scholar] [CrossRef]
  52. Yonezawa, C.; Negishi, M.; Azuma, K.; Watanabe, M.; Ishitsuka, N.; Ogawa, S.; Saito, G. Growth monitoring and classification of rice fields using multitemporal RADARSAT-2 full-polarimetric data. Int. J. Remote Sens. 2012, 33, 5696–5711. [Google Scholar] [CrossRef]
  53. Lopez-Sanchez, J.M.; Ballester-Berman, J.D.; Hajnsek, I. First results of rice monitoring practices in Spain by means of time series of TerraSAR-X dual-pol images. IEEE J. Sel. Top. Appl. Earth Obs. Remote Sens. 2011, 4, 412–422. [Google Scholar] [CrossRef]
  54. Lopez-Sanchez, J.M.; Vicente-Guijalba, F.; Ballester-Berman, J.D.; Cloude, S.R. Polarimetric response of rice fields at C-band: Analysis and phenology retrieval. IEEE Trans. Geosci. Remote Sens. 2014, 52, 2977–2993. [Google Scholar] [CrossRef]
  55. Lopez-Sanchez, J.M.; Ballester-Berman, J.D.; Hajnsek, I. Rice monitoring in Spain by means of time series of TerraSAR-X dual-pol images. In Proceedings of the International Workshop on Applications of Polarimetry and Polarimetric Interferometry (Pol-InSAR), Frascati, Italy, 26–30 January 2009.
  56. Gebhardt, S.; Huth, J.; Nguyen, L.D.; Roth, A.; Kuenzer, C. A comparison of TerraSAR-X Quadpol backscattering with RapidEye multispectral vegetation indices over rice fields in the Mekong Delta, Vietnam. Int. J. Remote Sens. 2012, 33, 7644–7661. [Google Scholar] [CrossRef]
  57. Lam-Dao, N.; le Toan, T.; Hoang-Phi, P. Rice crop monitoring in the Mekong Delta, Vietnam, using radar remote sensing data. In Proceedings of the Asian Conference on Remote Sensing, Bali, Indonesia, 20–24 October 2013.
  58. Lam-Dao, N.; Hoang-Phi, P.; Huth, J.; Cao-Van, P. Estimation of the rice yield in the Mekong Delta using SAR dual polarisation data. In Proceedings of the Asian Conference on Remote Sensing, Taipei, Taiwan, 3–7 October2011.
  59. Xie, L.; Zhang, H.; Wu, F.; Wang, C.; Zhang, B. Capability of rice mapping using hybridpolarimetric SAR data. IEEE J. Sel. Top. Appl. Earth Obs. Remote Sens. 2015, 8, 3812–3822. [Google Scholar] [CrossRef]
  60. Nguyen, D.; Wagner, W.; Naeimi, V.; Cao, S. Rice-planted area extraction by time series analysis of ENVISAT ASAR WS data using a phenology-based classification approach: A case study for Red River Delta, Vietnam. In Proceedings of the International Archives Photogrammetry, Remote Sensing and Spatial Information Science, Berlin, Germany, 11–15 May 2015.
  61. Apel, H.; Hung, N.N.; Long, T.T.; Tri, V.K. Flood Hydraulics and Suspended Sediment Transport in the Plain of Reeds, Mekong Delta; Springer Netherlands: Dordrecht, The Netherlands, 2012. [Google Scholar]
  62. Wolters, M.L.; Kuenzer, C. Vulnerability assessments of coastal river deltas—Categorization and review. J. Coast. Conserv. 2015, 19, 345–368. [Google Scholar] [CrossRef]
  63. Renaud, F.G.; Syvitski, J.P.; Sebesvari, Z.; Werners, S.E.; Kremer, H.; Kuenzer, C.; Ramesh, R.; Jeuken, A.; Friedrich, J. Tipping from the Holocene to the Anthropocene: How threatened are major world deltas? Curr. Opin. Environ. Sustain. 2013, 5, 644–654. [Google Scholar] [CrossRef]
  64. Kuenzer, C.; Guo, H.; Huth, J.; Leinenkugel, P.; Li, X.; Dech, S. Flood mapping and flood dynamics of the mekong delta: ENVISAT-ASAR-WSM based time series analyses. Remote Sens. 2013, 5, 687–715. [Google Scholar] [CrossRef] [Green Version]
  65. Kuenzer, C.; Campbell, I.; Roch, M.; Leinenkugel, P.; Tuan, V.Q.; Dech, S. Understanding the impact of hydropower developments in the context of upstream–downstream relations in the Mekong river basin. Sustain. Sci. 2013, 8, 565–584. [Google Scholar] [CrossRef]
  66. Nguyen, T.T.H.; de Bie, C.A.J.M.; Ali, A.; Smaling, E.M.A.; Chu, T.H. Mapping the irrigated rice cropping patterns of the Mekong delta, Vietnam, through hyper-temporal SPOT NDVI image analysis. Int. J. Remote Sens. 2012, 33, 415–434. [Google Scholar] [CrossRef]
  67. General Statistics Office of Vietnam. Results of the 2011 Rural, Agricultural and Fishery Census; Statistical Publishing House: Hanoi, Vietnam, 2012. [Google Scholar]
  68. Kuenzer, C.; Bluemel, A.; Gebhardt, S.; Quoc, T.V.; Dech, S. Remote sensing of mangrove ecosystems: A review. Remote Sens. 2011, 3, 878–928. [Google Scholar] [CrossRef]
  69. Thu, P.M.; Populus, J. Status and changes of mangrove forest in Mekong Delta: Case study in Tra Vinh, Vietnam. Estuar. Coast. Shelf Sci. 2007, 71, 98–109. [Google Scholar] [CrossRef]
  70. Ha, T.T.T.; van Dijk, H.; Bush, S.R. Mangrove conservation or shrimp farmer’s livelihood? The devolution of forest management and benefit sharing in the Mekong Delta, Vietnam. Ocean Coast. Manag. 2012, 69, 185–193. [Google Scholar] [CrossRef]
  71. Quoc Vo, T.; Kuenzer, C.; Oppelt, N. How remote sensing supports mangrove ecosystem service valuation: A case study in Ca Mau province, Vietnam. Ecosyst. Serv. 2015, 14, 67–75. [Google Scholar] [CrossRef]
  72. Loew, A.; Ludwig, R.; Mauser, W. Derivation of surface soil moisture from ENVISAT ASAR wide swath and image mode data in agricultural areas. IEEE Trans. Geosci. Remote Sens. 2006, 44, 889–898. [Google Scholar] [CrossRef]
  73. Wagner, W.; Lemoine, G.; Rott, H. A method for estimating soil moisture from ERS scatterometer and soil data. Remote Sens. Environ. 1999, 70, 191–207. [Google Scholar] [CrossRef]
  74. Pathe, C.; Wagner, W.; Sabel, D.; Doubkova, M.; Basara, J.B. Using ENVISAT ASAR global mode data for surface soil moisture retrieval over Oklahoma, USA. IEEE Trans. Geosci. Remote Sens. 2009, 47, 468–480. [Google Scholar] [CrossRef]
  75. Nyquist, H. Certain topics in telegraph transmission theory. Trans. Am. Inst. Electr. Eng. 1928, 47, 617–644. [Google Scholar] [CrossRef]
  76. Shannon, C.E. Communication in the presence of noise. Proc. IEEE 1998, 86, 447–457. [Google Scholar] [CrossRef]
  77. Jönsson, P.; Eklundh, L. Seasonality extraction by function fitting to time-series of satellite sensor data. IEEE Trans. Geosci. Remote Sens. 2002, 40, 1824–1832. [Google Scholar] [CrossRef]
  78. Sakamoto, T.; van Nguyen, N.; Ohno, H.; Ishitsuka, N.; Yokozawa, M. Spatio-temporal distribution of rice phenology and cropping systems in the Mekong Delta with special reference to the seasonal water flow of the Mekong and Bassac rivers. Remote Sens. Environ. 2006, 100, 1–16. [Google Scholar] [CrossRef]

