Article

An Algorithm for Burned Area Detection in the Brazilian Cerrado Using 4 µm MODIS Imagery

by
Renata Libonati
1,*,
Carlos C. DaCamara
2,†,
Alberto W. Setzer
3,†,
Fabiano Morelli
3 and
Arturo E. Melchiori
3
1
Departamento de Meteorologia, Universidade Federal do Rio de Janeiro, Rio de Janeiro 21941-916, Brazil
2
Instituto Dom Luiz, Faculdade de Ciências, Universidade de Lisboa, Lisboa 1749-016, Portugal
3
Instituto Nacional de Pesquisas Espaciais, São José dos Campos 12227-010, Brazil
*
Author to whom correspondence should be addressed.
These authors contributed equally to this work.
Remote Sens. 2015, 7(11), 15782-15803; https://doi.org/10.3390/rs71115782
Submission received: 14 September 2015 / Revised: 4 November 2015 / Accepted: 16 November 2015 / Published: 24 November 2015

Abstract

:
The Brazilian Cerrado is significantly affected by anthropic fires every year, which makes the region an important source of pyrogenic emissions. This study aims at generating improved 1 km monthly burned area maps for Cerrado based on remote-sensed information. The algorithm relies on a burn-sensitive vegetation index based on MODIS daily values of near and middle infrared reflectance and makes use of active fire detection from multiple sensors. Validation is performed using reference burned area (BA) maps derived from Landsat imagery. Results are also compared with MODIS standard BA products. A monthly BA database for the Brazilian Cerrado is generated covering the period 2005–2014. Estimated value of BA is 1.3 times larger than the value derived from reference data, making the product suitable for applications in fire emission studies and ecosystem management. As expected the intra and inter-annual variability of estimated BA over the Brazilian Cerrado is in agreement with the regime of precipitation. This work represents the first step towards setting up a regional database of BA for Brazil to be developed in the framework of BrFLAS, an R and D project in the areas of fire emissions and ecosystem management planning.

Graphical Abstract

1. Introduction

The global atmospheric concentrations of carbon dioxide, methane, and nitrous oxide have increased to levels unprecedented in at least 800,000 years [1]. Although fossil fuel emissions play a primary role in the increase, emissions from changes in land use, such as deforestation and vegetation fires cannot be disregarded. In Brazil, the primary source of greenhouse gases, as well as of aerosols and trace gases, has been the conversion of natural vegetation to pasture and agriculture using fire practices [2]. Furthermore, lower moisture conditions enable the use of fire as a tool for land management during the dry season [3]. However, fire frequently spreads without control, becoming a major concern due to vast areas of tropical evergreen forest affected [4]. A comprehensive description of the use of fire in Brazil may be found in [5].
In such context, the interactions between climatic conditions and anthropogenic activities had a major role on the fire regime in the Brazilian Amazonia and Cerrado over the last two decades. The intensive drought events that have struck the region are to be added to the economic pressure to convert Amazon forest and Cerrado into crop fields and cattle pasture [6]. For instance, compared to the previous year, the extreme dry year of 2010 was characterized by an increase of 100% in the number of fire pixels detected by just one polar orbiting satellite (information online at http://www.cptec.inpe.br/queimadas).
Taking into account the historical scenario of fire disturbances in Brazil, an increase of fire occurrences and intensity are to be expected in this region under climate change associated with the enhanced greenhouse effect. Several studies have shown that climate change has the potential to increase fire occurrence, size, and intensity associated with drier and warmer climates in several regions around the world [7,8,9,10,11,12]. In particular, a stronger vulnerability of Brazilian ecosystems (mainly Amazonia) to fire due to global warming and land use changes has been predicted, suggesting a dramatic increase in wildfire frequency and intensity, as well as in the total area burned, with a longer period of severe fire occurrences [13,14,15,16,17,18]. The observed and expected increases in the incidence, extent, and severity of uncontrolled burning have led to calls for international environmental policies regarding fire [19]. Such concerns strongly point to the need for reliable fire information for policymakers, scientists, and resource managers. Several studies have been carried out using remote sensing imagery for burned land mapping, and special attention has been devoted to mapping burned areas using remote sensing at the global scale [20,21,22,23,24]. However, as pointed out by several authors [23,24,25,26] there are still large disagreements (around two orders of magnitude) in the quantification of biomass burning among products, in terms of both annual extent and location of the areas burnt. This is partly due to the fact that development of an accurate algorithm to detect surface changes caused by fire at the global scale is still hampered by the complexity, diversity, and very large number of biomes involved. The abovementioned limitations of burned area (BA) estimations at the global scale can be reduced with the development of regional algorithms which take into account local characteristics such as vegetation type, soil, and climate and where validation and calibration exercises are less complex to implement.
Despite the explicit vulnerability to fire of Brazilian ecosystems. Together with the unequivocal need for reliable fire information, to the best of our knowledge studies focusing on the problem of long-term BA detection in Brazilian ecosystems were limited to those of [27]. Increasing efforts are being spent to control deforestation processes and monitor anthropic vegetation fires in Brazil. As a result from an initiative between Brazil and Portugal, the Brazilian Fire-Land-Atmosphere System (BrFLAS) Project aims at improving the scientific and technical knowledge regarding vegetation fires in Brazil, specifically, by assessing both areal and severity extent, estimating atmospheric emissions and transport, establishing relations to observed past conditions, and inferring possible implications by taking as reference future climate scenarios.
This work presents the basis and discusses the results of an automated algorithm to detect monthly burned areas based on Moderate Resolution Imaging Spectroradiometer (MODIS) remote sensing data. The developed methodology is validated over a selected study area in the Brazilian Cerrado against reference data derived from higher resolution data from Landsat. Results are further compared with MODIS standard burned area products. Finally, a monthly burned area database for the Brazilian Cerrado covering the period 2005–2014 is generated using the algorithm developed and an assessment is made on the relationship between the intra- and inter-annual variability of BA and the precipitation regime. This feasibility study paves the way for the forthcoming BrFLAS project where the algorithm developed will be further refined and applied to all Brazilian biomes.

2. Data and Methods

2.1. Data

Calibration BA data consists of top-of-the-atmosphere (TOA) values of middle-infrared (MIR) radiance, near-infrared (NIR) reflectance, and thermal-infrared (TIR) brightness temperature, as acquired by the MODIS instrument onboard Terra and Aqua satellites. Data were extracted from the Terra/Aqua MODIS Level 1B 1 km V5 product, MOD021/MYD021 (MCST, 2006), and correspond to channels 2 (NIR, centered at 0.858 μm), 20 (MIR, centered at 3.785 μm), and 31 (TIR, centered at 11.017 μm). Geolocation data, as well as land/sea mask and solar and view angle information for each MODIS 1 km sample, were obtained from the MODIS Geolocation product (MOD03 and MYOD03). MODIS direct broadcast data were obtained from the Image Generation Division (DGI) of the Brazilian Institute for Space Research (INPE). Information about active fires relies on fire detection algorithms produced by INPE using direct broadcast data from GOES, NOAA-AVHRR, MSG/SEVIRI, Aqua/MODIS and Terra/MODIS satellites, with the exception of TRMM and ATSR, which are off-the-shelves fire products.
The process of validation requires ground data of solid quality that are seldom available over large areas and for long periods of time. Validation was therefore performed by comparing results obtained with reference BA data derived from Landsat 5 TM 30 m imagery over Jalapão, Tocantins (Figure 1), which lies within Landsat path/row 221/67. The Landsat validation scene was the subject of a meticulously, lengthy (two years) and expensive manual work complemented by field trips. The BA reference dataset was derived using a semi-automatic algorithm [28]. The semi-automatic process used to map burned areas in Landsat imagery uses a multi-temporal approach where thresholds are applied to the change rate of both NDVI and NBRL (Normalized Burn Ratio Long SWIR Variation) spectral indices. The algorithm computes and filters the rate of change in NDVI and NBRL, as derived from two consecutive images. The spatial coincidence of a marked change in both NDVI and NBRL is taken as an indication of a burning episode in the period elapsed between the dates of the pair of images analyzed. Input images are accepted only with cloud cover up to 10%, and the maximum allowed time span between consecutive scenes is one month. Table 1 shows dates of Landsat images that were used to derive reference maps.
Figure 1. Validation site of Jalapão in the state of Tocantins. The Cerrado biome is delimited in gray.
Remotesensing 07 15782 g001
Table 1. Dates of Landsat images that were used to derive reference maps of burned scars.
YearMayJunJulyAugustSeptemberOctober
20057th, 23rd8th, 24th9th
200623rd8th, 24th26th11th, 27th28th
200726th27th13th, 29th14th, 30th15th1st
200813th15th, 31st16th17th
20092nd3rd, 19th
20103rd, 19th5th6th, 22nd7th, 23rd
Precipitation data integrate the Tropical Rainfall Measuring Mission (TRMM) dataset and correspond to monthly surface precipitation as derived from the TRMM 3B31 product [29] covering the period from 2005 to 2013. 2014 was not used since the TRMM orbit started to decline in mid-2014.
The study region analyzed herein covers about 187 km × 187 km and lies within Landsat path/row 221/67. The region belongs to the Cerrado biome and has been increasingly affected by anthropogenic fire in recent years. The region is covered by a mosaic of savannas with varying tree density, ranging from open grassland to dense savanna. Some denser savannas and woodlands occur occasionally [30].
Results were further compared with those from the two MODIS BA standard products, namely the MCD45A1 Burned Area Product [31] and MCD64A1 Direct Broadcast Monthly Burned Area Product [32]. Both BA products were downloaded from the University of Maryland FTP site and then mosaicked and reprojected using the MODIS Reprojection Tool.
MCD45A1 is a monthly Level 3 gridded 500 m product containing per-pixel burning and quality information and tile-level metadata. Data were restricted to confidence levels 1–4, since level 5 detections should not be used in any quantitative analysis because of the low accuracy of BA detection when fire is due to agricultural practices.
MCD64A1 is globally available on a monthly basis back to August 2000 at 500 m resolution. The MCD64A1 Direct Broadcast Monthly Burned Area Product is currently used in the framework of the Global Fire Emissions Database (GFED) initiative and will replace MCD45A1 in the upcoming MODIS Collection 6. Among the five data layers from MCD64A1, only the Burn Date was used in our study, as this product does not have flags containing confidence levels.
The different temporal resolutions of the MCD45 (daily), MCD64 (daily), and the proposed algorithm (monthly) imply reconciling the three data sets with the periods covered by the Landsat reference data. For each year and according to Table 1, the following periods were considered for validation: 2005 (July and August), 2006 (June, July, August and September), 2007 (June, July and August), 2008 (July), 2009 (July, August), 2010 (June, July, August and September), hereafter referred to as 2005 (JA), 2006 (JJAS), 2007 (JJA), 2008 (J), 2009 (JA), and 2010 (JJAS).

2.2. Description of the Algorithm

Several studies have shown that use of MIR reflectance is especially appropriate for BA detection [33,34,35,36]. On one hand, the MIR domain is virtually unaffected by smoke, allowing for almost undisturbed surface observation, including under extreme biomass burning conditions [36]. On the other hand, the MIR domain contributes to solving certain ambiguities between burned and unburned surfaces which may occur, for example, in the visible (VIS) and short-wave infrared (SWIR), especially between 2.0 and 2.5 μm [37].
A new constraint in the NIR/MIR space was found by [36], similar to the soil line in the RED/NIR space. Introduced by [38], the soil line concept consists of a linear relationship between NIR and R reflectance of bare soil that has greatly contributed to the design of robust vegetation indices that are insensitive to the soil background while remaining responsive to vegetation [39]. The NIR/MIR constraint has in turn opened new perspectives in the line of the development of optical vegetation indices, namely for BA discrimination. For instance, [36] have developed a burn-sensitive vegetation index that is defined in a transformed NIR/MIR space. The transformed space is framed by coordinates ξ and η, respectively defined as the difference between NIR and MIR, and as the distance in NIR-MIR space to a point of coordinates (NIR0 = 0.05, MIR0 = 0.24). Coordinates of this ideally totally burnt pixel are given by estimates of the minimum (maximum) reflectance of burned vegetation in the NIR (MIR) bands. Two indices, V and W, are then designed in the transformed space (ξ, η) in such a way that vegetated pixels tend to be aligned along V = 1, with burned pixels being located close to the origin, followed (with increasing values of W) by dry/stressed vegetation and then by green vegetation (Figure 2). For each pair of values of NIR and MIR, values of W were estimated based on tabulated values derived according to the procedure described in [36]. Tables of V and W are available from the authors.
Figure 2. Contours of W (thick lines) and V (thin lines) in the η/ξ space. Light gray dots denote MODIS pixels from Cerrado. Selected pixels corresponding to burned surfaces, soil/dry vegetation, vegetation, clouds and water are, respectively, highlighted in black, brown, green, dark gray and blue.
Remotesensing 07 15782 g002

2.2.1. First Step: Pre-Processing

Values of MIR reflectance were retrieved from MODIS channel 20 radiances by applying the methodology developed by [40] to daytime imagery and using TIR (MODIS channel 31) brightness temperature as a surrogate for land surface temperature. Following [36], all images acquired at solar zenith angles (SZA) greater than 55° were rejected. When Terra and Aqua images were both available for the same day, the image selected was the one with the lowest SZA. Images with view zenith angles (VZA) greater than 45° were also rejected in order to prevent large distortions in pixel size. Pixels associated to water bodies were also masked using the land/sea mask from the MODIS Geolocation product.
Burned surfaces tend to have values of W close to zero, especially shortly after the fire event, whereas green vegetation tends to be characterized by higher values of W (about 0.3). Intermediate values of W generally correspond to vegetation of small density and/or to exposed soil in the background. Clouds and cloud shadows are often associated to high values of W (greater than 0.4) and pixels associated to these values were flagged and therefore rejected.

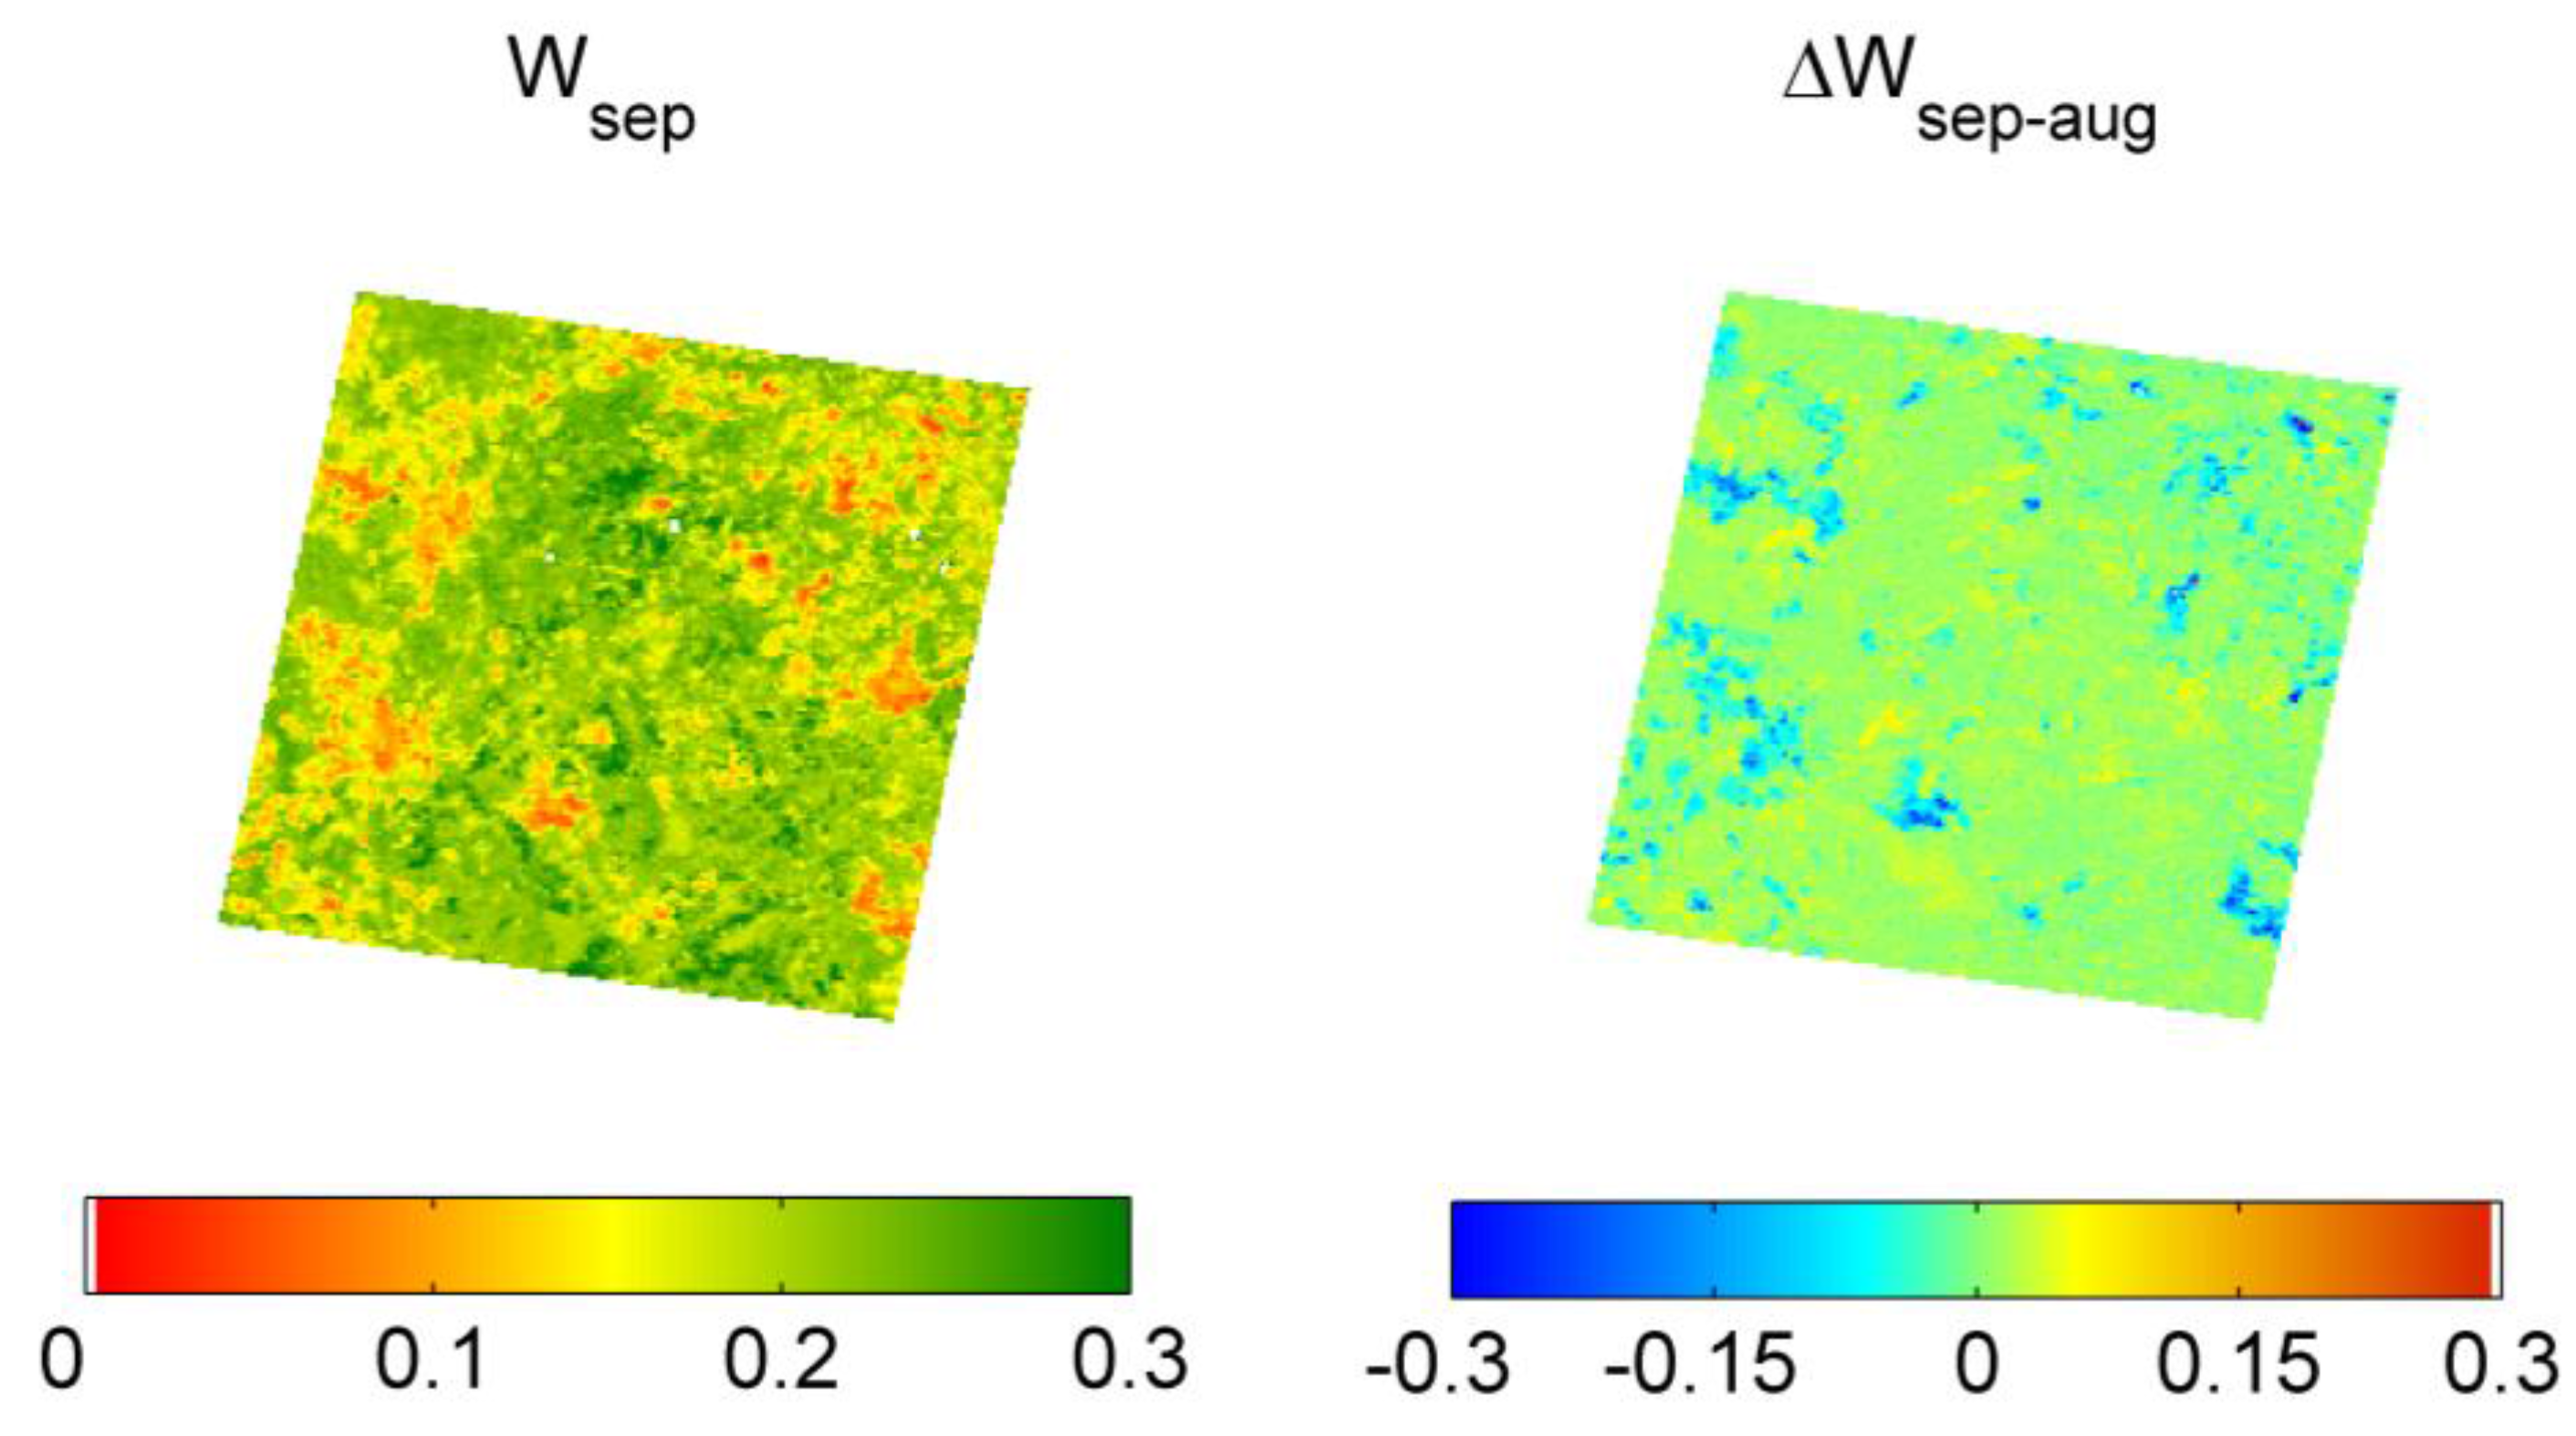
2.2.2. Second Step: Temporal Composites

Multi-temporal image compositing is an operational way to mitigate the gap of information about the land surface due to the presence of cloudy pixels, which is especially common in the tropics [41]. Compositing also contributes to reduce the daily reflectance variability and residual atmospheric effects [42]. Compositing techniques have been therefore widely used for BA detection [41,43,44,45]. Following these approaches, monthly minimum composites of W were computed, with the chosen span of one month.

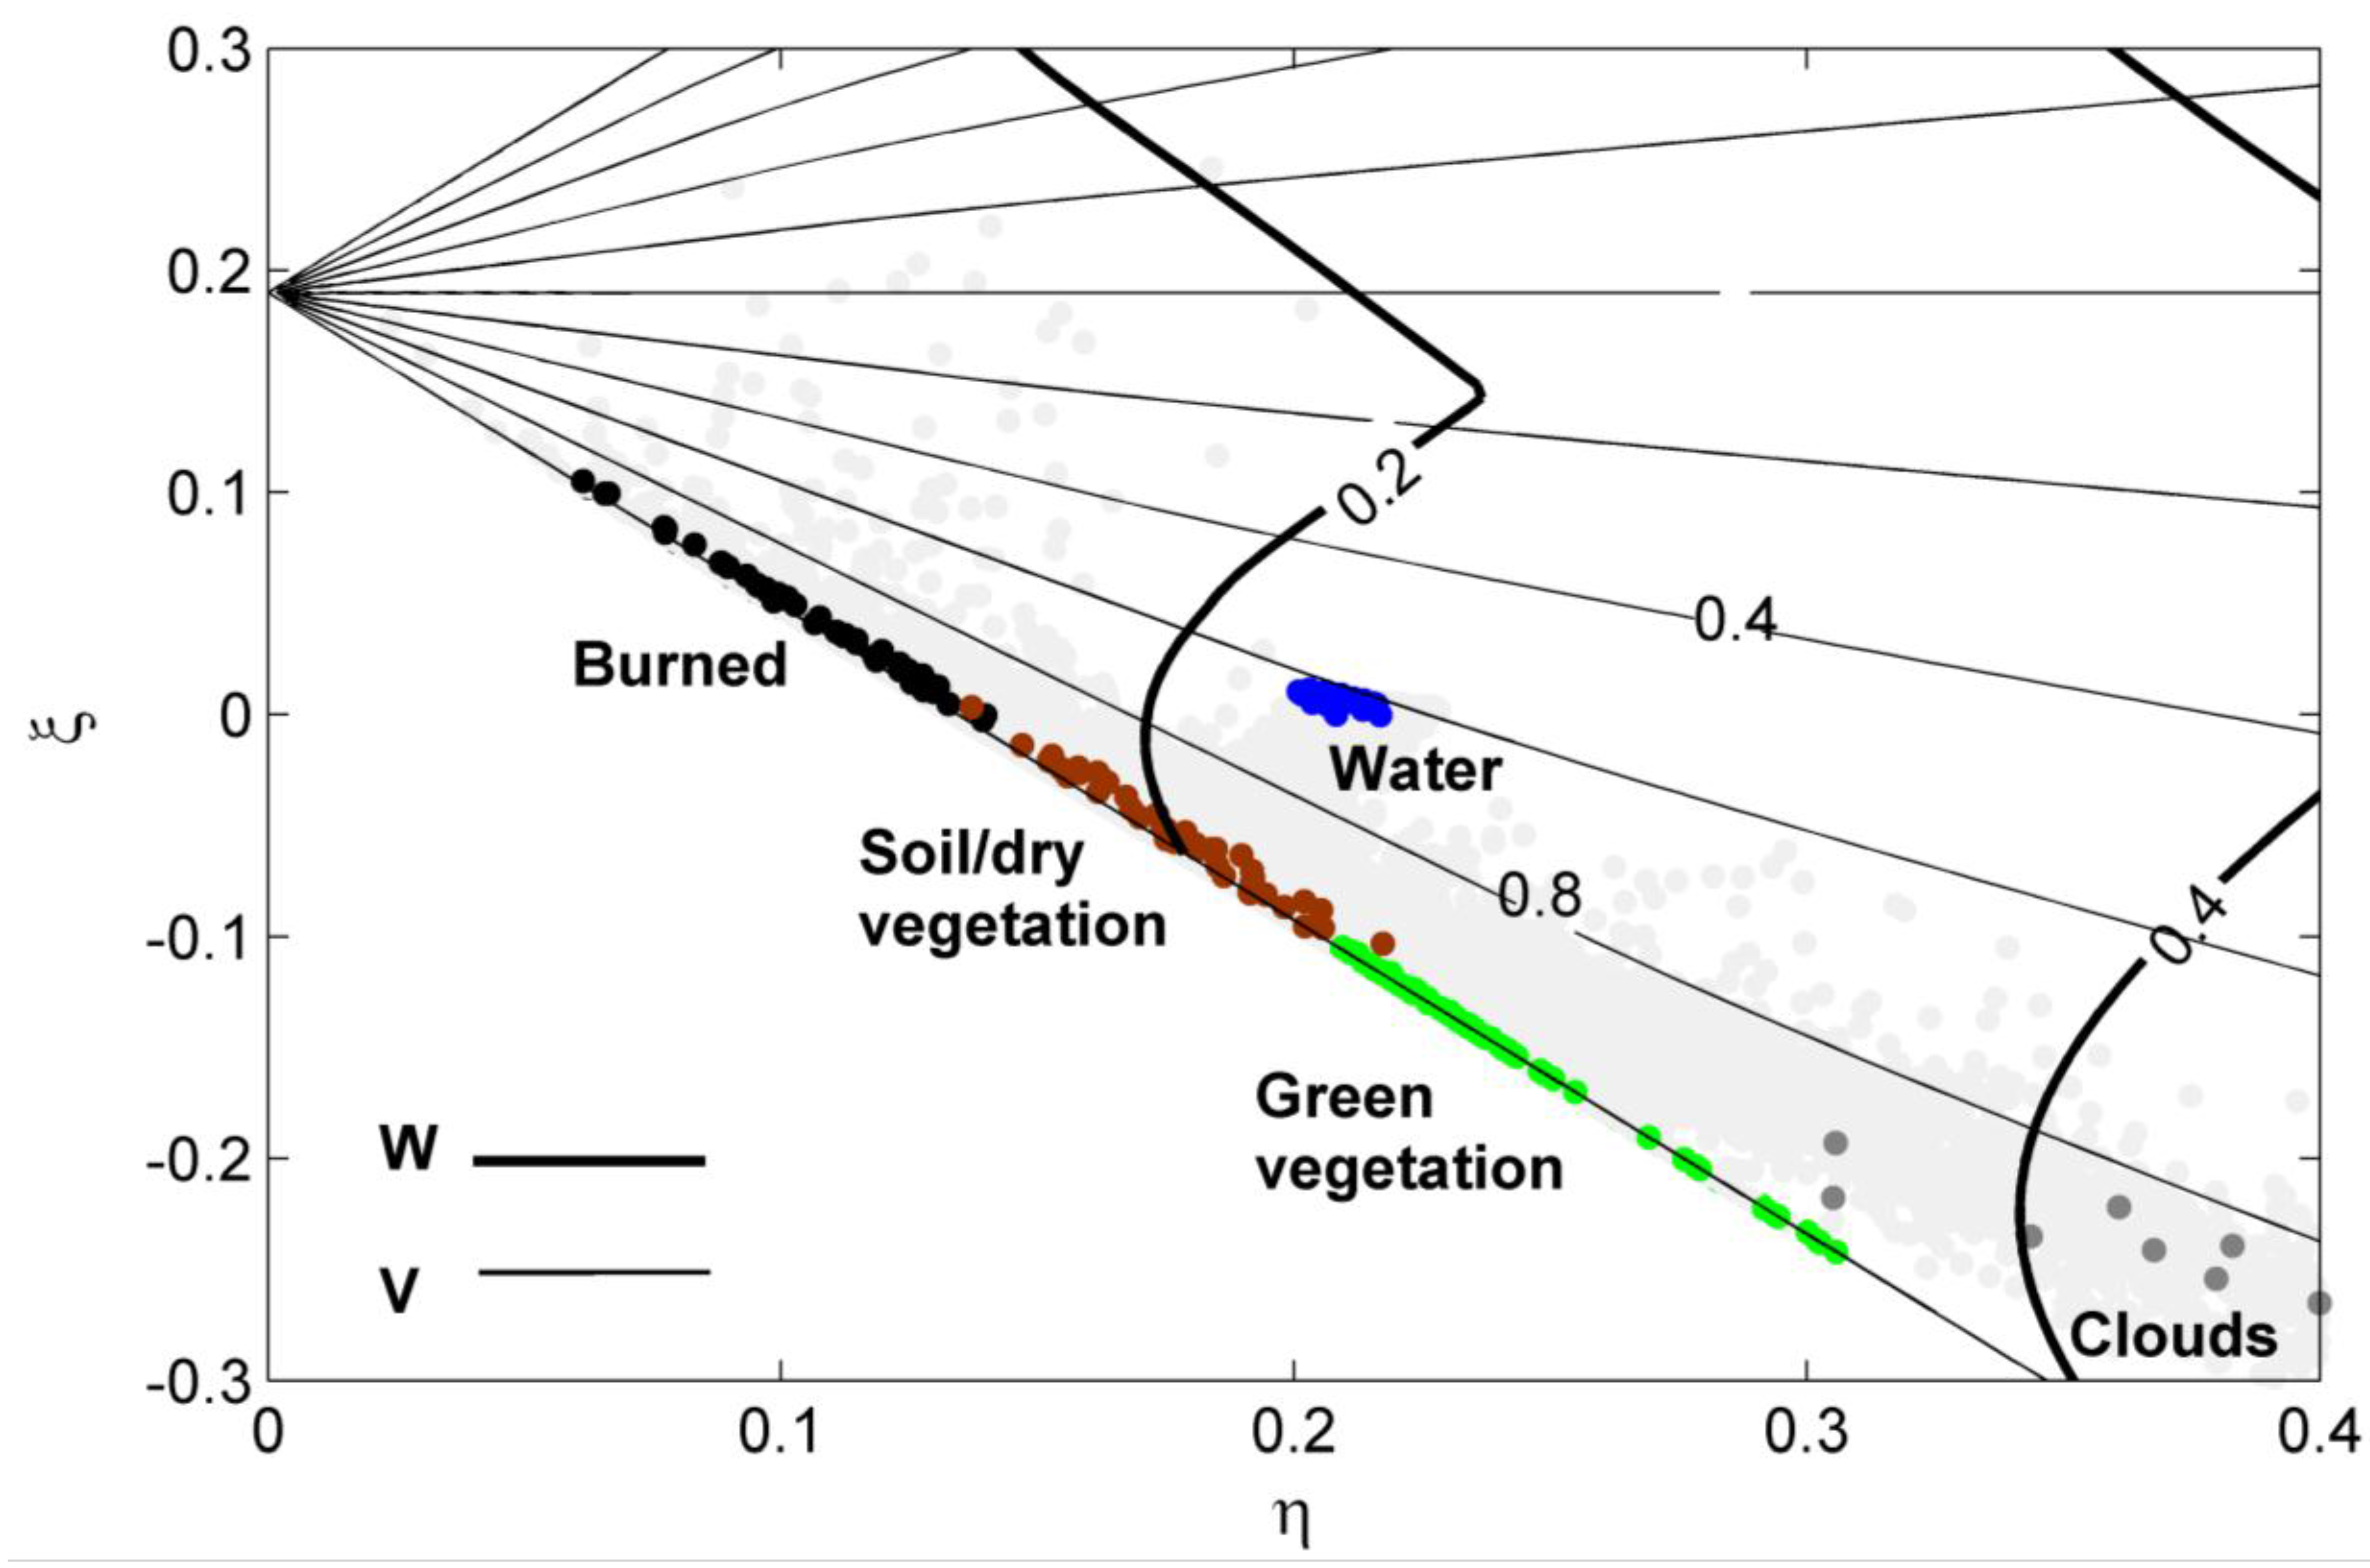
2.2.3. Third Step: Selection of Burned Pixels (Stage I)

Identification of pixels of burned areas is performed in two stages. In Stage I, the analysis is restricted to pixels in a 3 × 3 pixel matrix buffer zones centered in pixels where active fires were identified during the compositing period. Active fires are extracted from the INPE database containing fire pixels from GOES, NOAA, MSG, TRMM, ATSR, Aqua and Terra satellites. The buffer is assumed as an area of influence of the identified active fires, taking into account that hotspot data have different spatial resolutions (e.g., 4 km for GOES, 3 km for MSG/SEVIRI and 1 km for Terra/MODIS at nadir).
As pointed out by [32], algorithms aiming at BA detection based on active fire detection [46,47,48,49,50] may fail to identify burned areas due to active fire omissions either because of the time of satellite overpass or due to obscuration by clouds, smoke and vegetation. Schroeder et al. [51] have quantified the impact of cloud obscuration for GOES active fires in the Brazilian Amazonia, showing active fires omissions around 15% due to cloud cover. When assessing fire continuity over time and space, Schroeder et al. [52] suggest the integration of multiple datasets in order to reduce the uncertainties in fire counts when derived using a single system. Giglio et al. [24] also pointed out that BA detection may benefit from the fusion of multi-sensor active fire observations. Defining the buffer zone using hot spots from a variety of sensors has the advantage, therefore, of widening both the spatial and the temporal coverages with subsequent reduction of active fire omissions leading to a more accurate definition of buffer zones where burned pixels may be identified by the algorithm.
Next, in Stage I, pixels in the 3 × 3 matrix buffer are classified as burned areas when there is a change in W between monthly composites induced by a fire event.
Let W1 and W2 be the values of W for a given pixel in two successive monthly composites. This pixel is considered as burned if the following conditions are all fulfilled:
  • the pixel belongs to a 3 × 3 pixel buffer matrix;
  • W2 ≤ 0.16; and
  • ΔW = W2 − W1 ≤ 0.
Estimates of thresholds of W2 and ΔW were obtained by applying classification trees using observed values of W2 and ΔW for burned and unburned pixels in a sample of around 25,000 MODIS pixels. Details may be found in [36].
Figure 3 shows maps of W for September 2005 composite (left) and of ΔW for differences of W composites between September and August (right) over the study region of Jalapão (Figure 1). It may be noted that areas affected by fire present values of W well below the prescribed threshold of 0.16 together with negatives values of ΔW.

2.2.4. Fourth Step: Selection of Burned Pixels (Stage II)

Stage II identifies pixels that although presenting less intense signals in either W or ΔW are likely to be in burned areas because of their vicinity to pixels already classified as burned. The weaker radiometric signal may be due to partial burning or to low fire intensity. The procedure consists in the following steps:
  • Let all pixels classified as burnt pixels in stage I be considered as seed points;
  • For each seed point, let N be the total number of seed points inside a grid of 5 × 5 pixels centered at the considered seed point; in case N ≥ 3, let Ŵ and δW be the mean and the mean absolute deviation of seed points within the grid. Let W* be the value of W for a pixel inside the grid that is not a seed point; this pixel is then classified as a burned area pixel and considered as a new seed point if the two following conditions are fulfilled:
    • ΔW* = W* 2 − W* 1 ≤ 0;
    • W* ≤ Ŵ + (δW).
  • Step II is recursively performed until no new seed points are generated.
  • The burned area is obtained by summing up all identified burned area pixels.
Figure 3. Maps of W for September 2010 composite (left) and of ΔW between September and August composites (right) over the study region shown in Figure 1.
Remotesensing 07 15782 g003

2.3. Validation Procedure

The quality of a given thematic map derived from remote sensing is usually assessed based on a systematic comparison with other maps also derived from remote sensing. The quality assessment is usually performed based on verification measures as derived from contingency tables (Table 2) [53]. The following five verification measures were used:
The overall accuracy (OA), defined as the fraction of correctly classified pixels, either as burned or unburned:
OA = a + d a + b + c + d
The omission error (OE), defined as the fraction of burned pixels in the reference map that were not classified as such in the BA product:
OE = c a + c
The commission error (CE), defined as the fraction of pixels classified as burned in the BA product that are unburned pixels in the reference map:
CE = b a + b
The bias (B), defined as the ratio of the number of pixels classified as burned in the BA product to the number of burned pixels in the reference map:
B = a + b a + c
The Dice coefficient (DC) that is a measure of similarity between the classifier and the reference map in terms of the number of common burned pixels:
D C = 2 a 2 a + b + c
Whereas OA reflects the agreement between the BA product and the reference map (i.e., the accuracy of the classification), OE and CE provide information about the reliability and discrimination power of the developed classifier. An unbiased classification exhibits a value of bias equal to one, whereas a bias greater (less) than one indicates the events were over (under) classified. Ranging between 0 and 1, DC measures the overlap fraction of pixels classified as burned to those truly burned in the reference map.
Table 2. Contingency table for the dichotomous case of pixels classified as burned vs. unburned over a given study region.
Reference Map
BurnedUnburned
BA ProductBurnedaba + b
Unburnedcdc + d
a + cb + da + b + c + d
Traditional contingency tables assume that each pixel belongs to a single class; however, several studies [54,55,56] have shown that use of pure pixel approaches is a common source of error in the accuracy assessment of remote sensing products, since reference maps generally have higher resolution than the map being tested. As shown by [57], the problems posed by mixed pixels may be circumvented by using fuzzy theory, which allows each pixel to belong to multiple classes with different degrees of membership. In the present work, the agreement/disagreement between the TM reference data (30 m resolution) and coarser BA products are computed taking into account the proportion of BA from reference data within the product pixel, following the approach developed by [58]. For instance, if a pixel is classified as burned area by the BA product and has 60% of BA from reference data, it will have a proportion of 0.6 as true burned and 0.4 as commission error, as opposed to a weight of 1 as true burned and 0 as commission error that would be assigned following the traditional approach. This kind of approach takes into account the real proportion of reference burned pixel within the product pixel. The same rationale has been followed in recent studies [59,60] when validating algorithms for global BA.
The procedure is exemplified in Figure 4, where the 30 m reference scars from Landsat over Jalapão in 2005 (JA) and the corresponding percentages for 1 km MODIS pixels are shown. A zoom of the area is also presented, superimposed by the vectors of the scars as derived from Landsat reference maps.
Figure 4. Medium resolution reference scars (Jalapão region, year 2005 (JA)), represented by black lines and respective percentages of burned areas for MODIS pixels of 1 km, where red pixels denote percentages below 25%, blue pixels between 25% and 50%, green pixels between 50% and 75%, and yellow above 75%. Small panel: zoom of the area, superimposed by the vectors of the scars as derived from Landsat reference maps (black lines).
Remotesensing 07 15782 g004

3. Results and Discussion

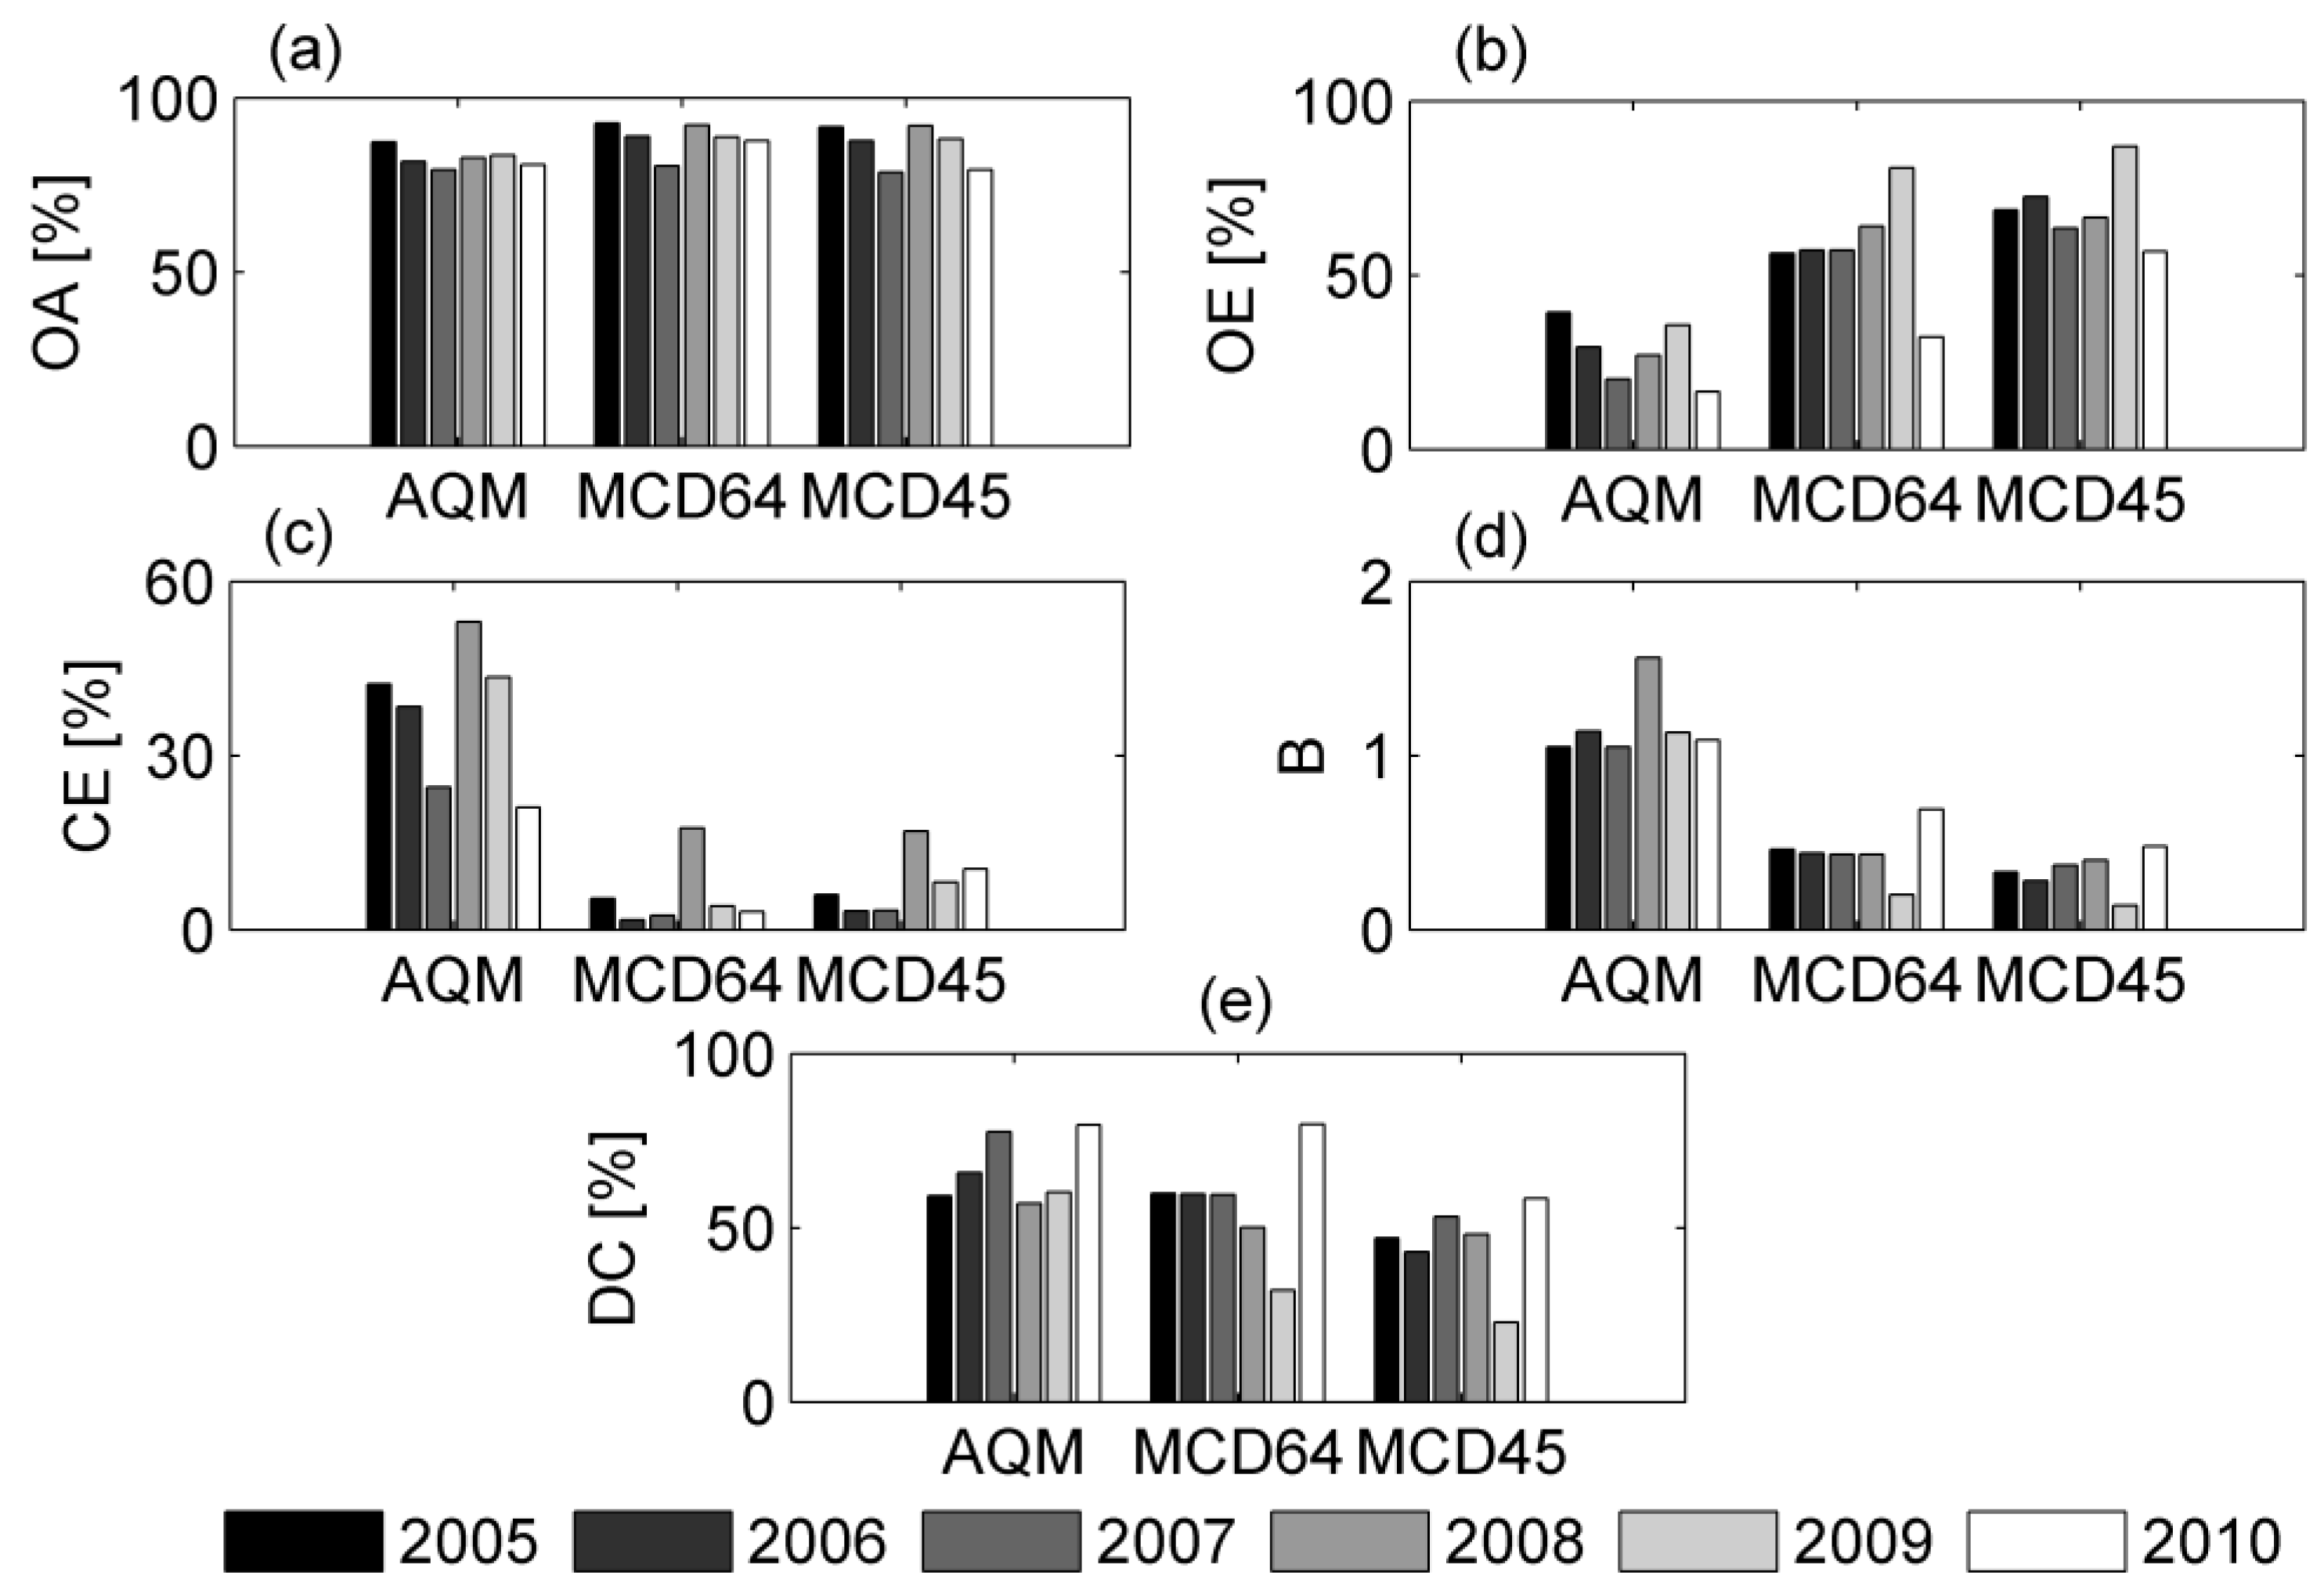
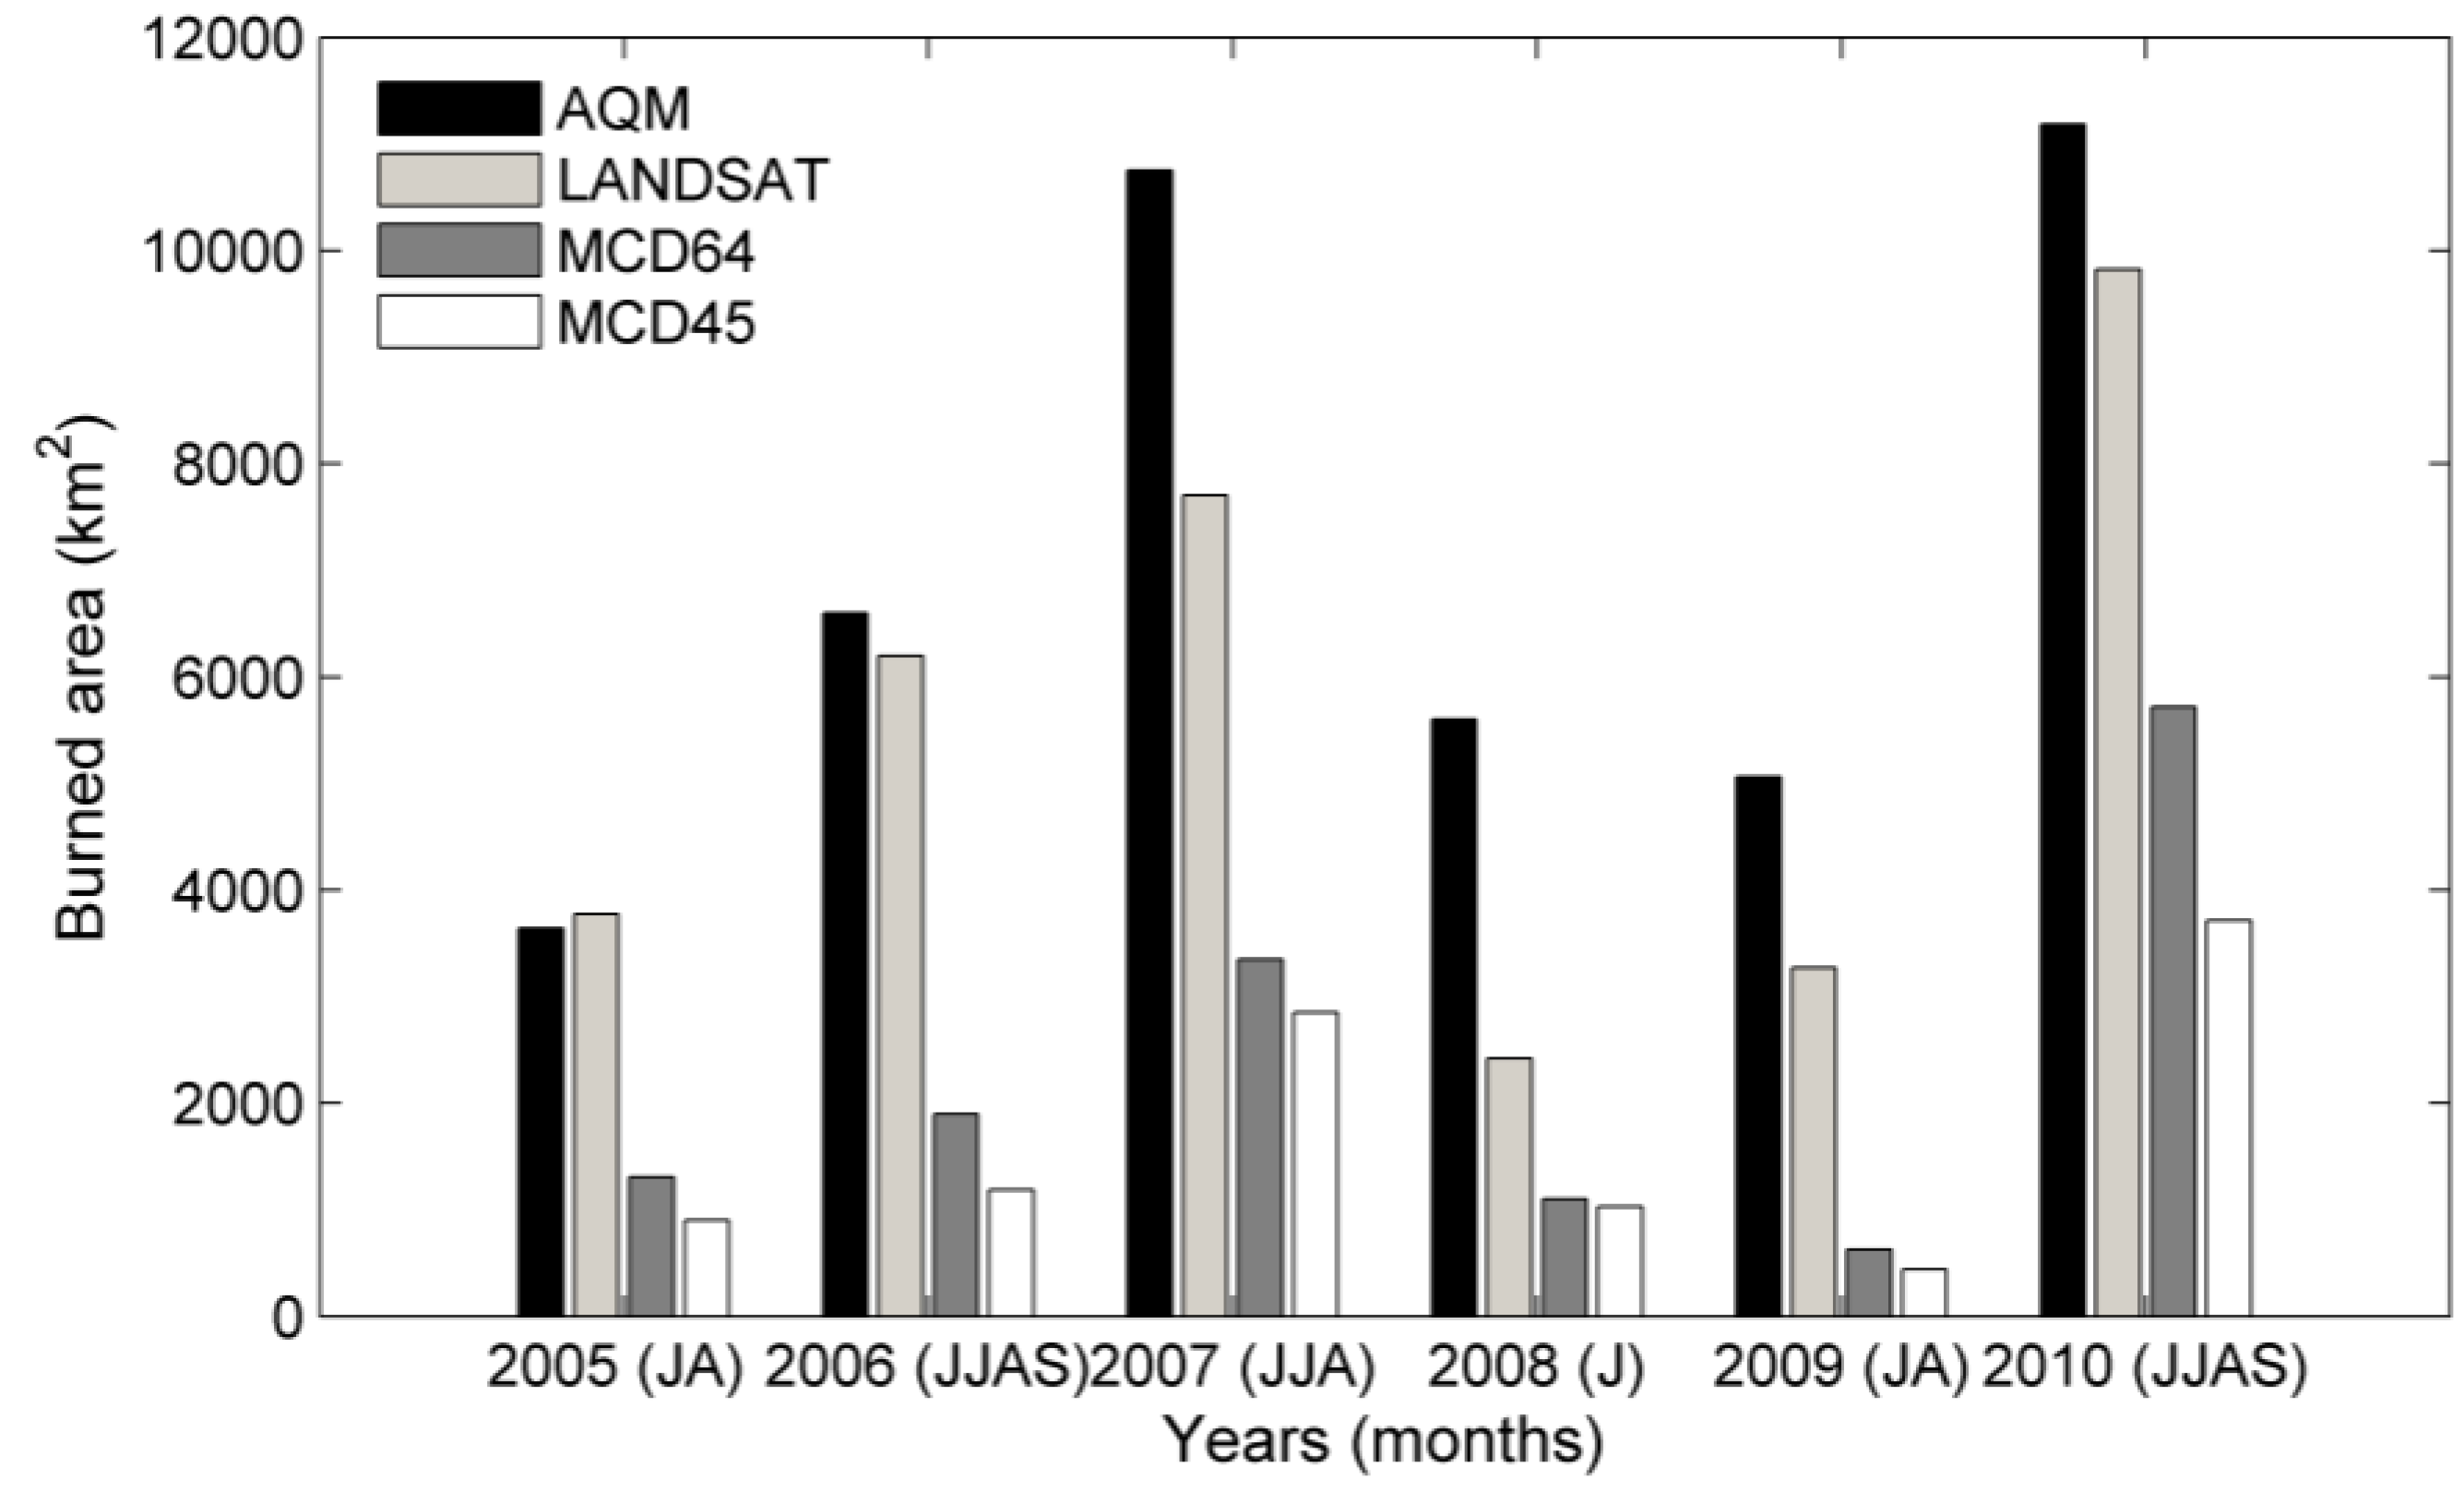
3.1. Accuracy Assessment
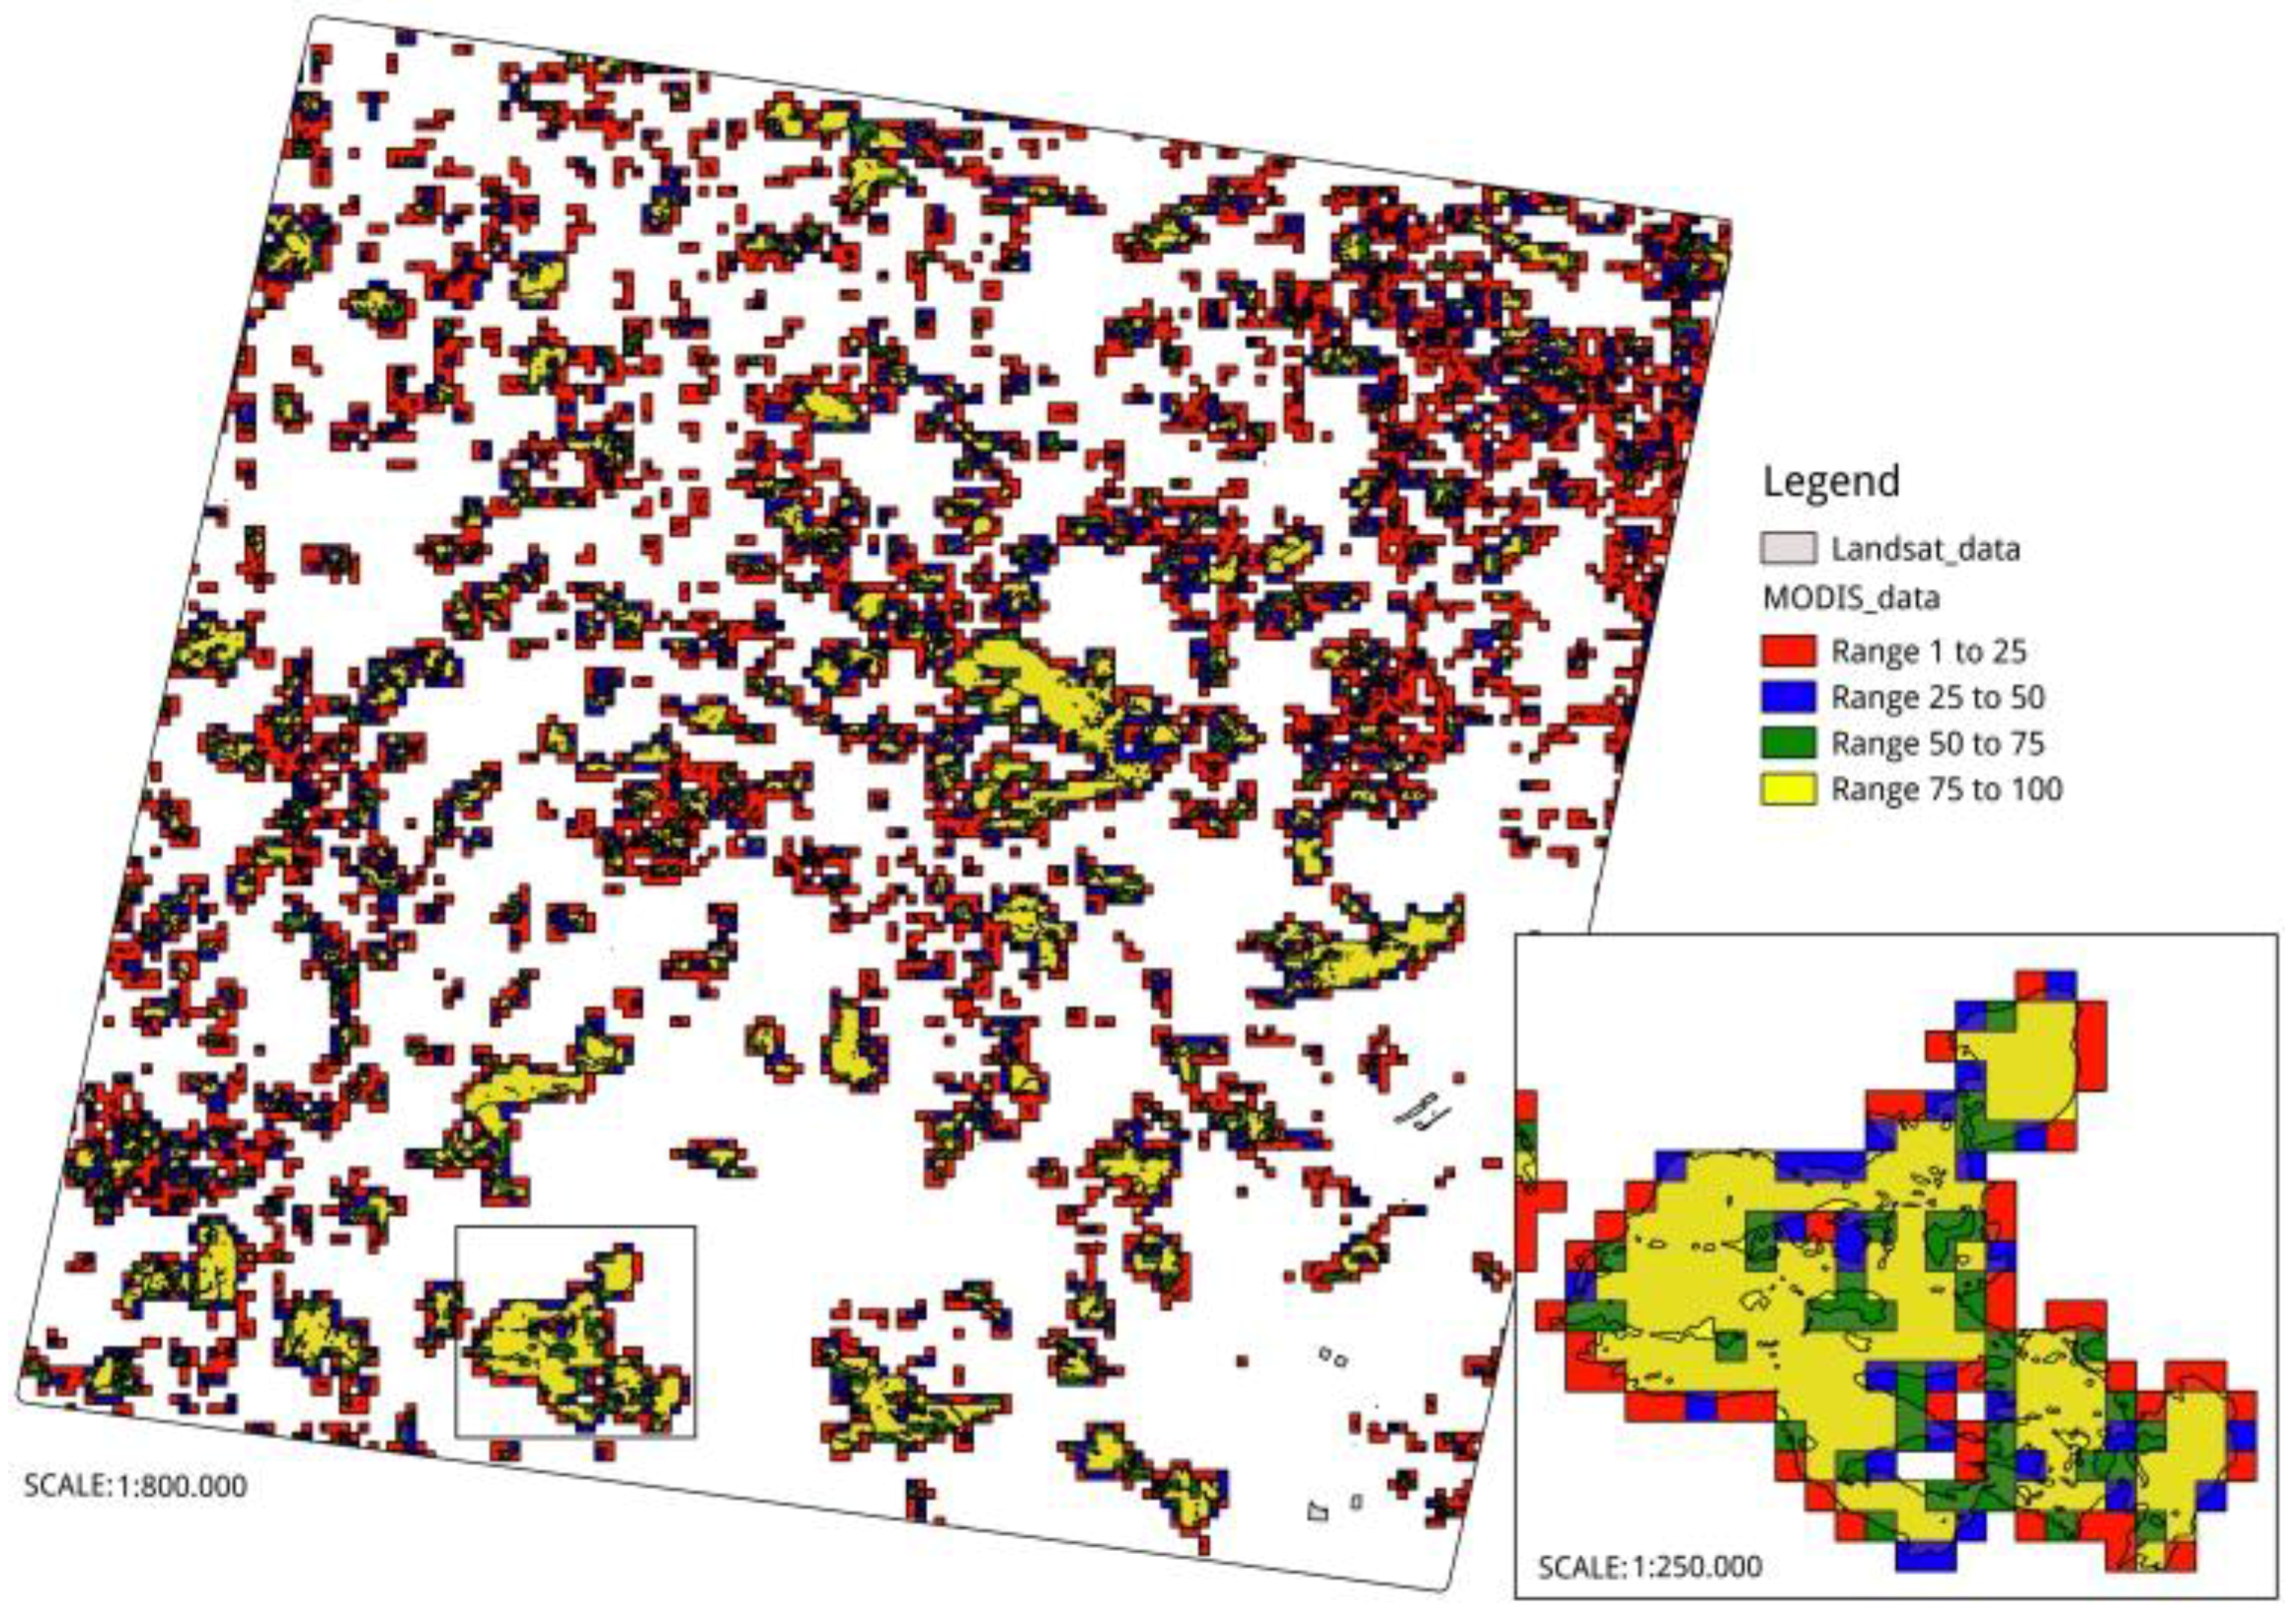
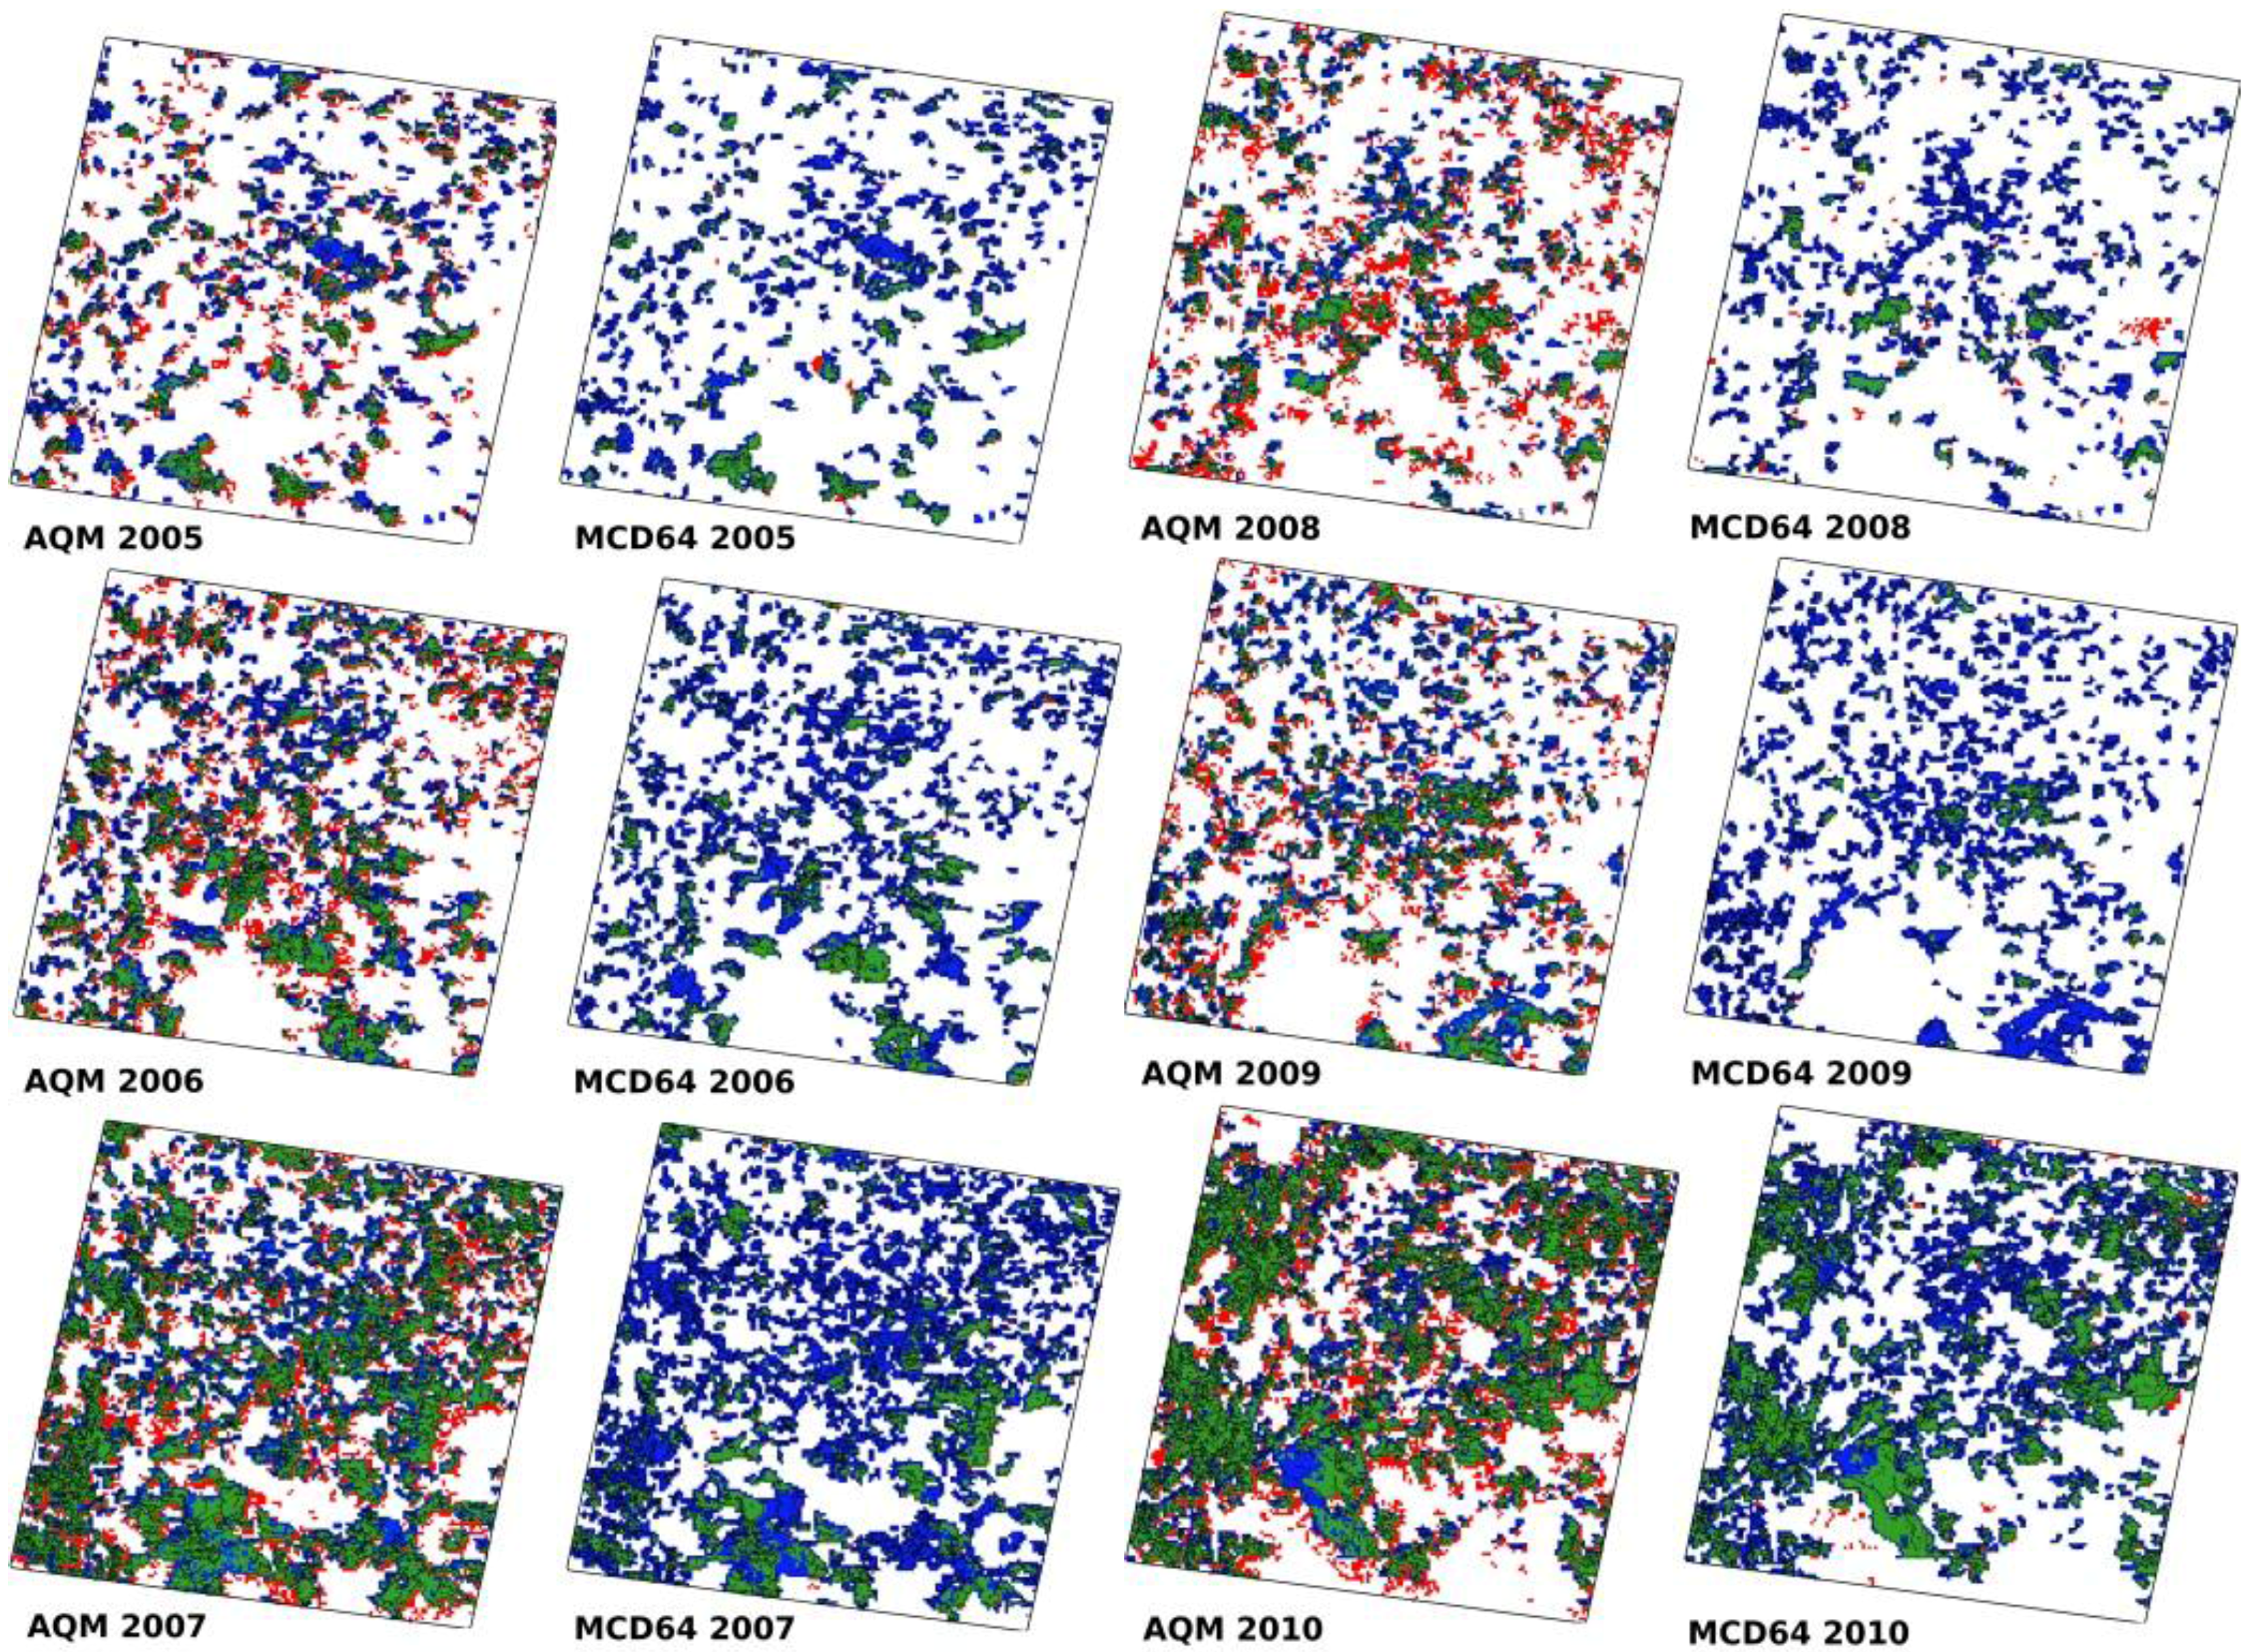
The results of above-described algorithm, hereafter referred to as AQM (from “área queimada”, meaning burned area in Portuguese), were compared with the ones of MCD64A1 and MCD45A1 products. Figure 5 presents the four verification measures derived from the contingency tables of the three BA products over the study area and period. In general, the overall accuracy (OA) for MCD64A1 and MCD45A1 BA products is slightly higher than for AQM, the maximum and minimum values being observed in 2005 and 2008 periods, respectively for the three products (Figure 5a). It should be noted, however, that OA satisfies the principle of equivalence of the events [61], giving equal credit for burned and unburned classes. This property is not always desirable, particularly in the case of BA detection studies where the burned event is more relevant than the non-occurrence event (unburned event).
Both MCD64A1 and MCD45A1 products present high values of OE (Figure 5b) and very low values of CE (Figure 5c). Values of OE for MCD45A1 are always larger than the corresponding ones for MCD64A1, and the same is true in the case of CE, except in 2008 when MCD64A1 is slightly larger. The AQM product presents a rather high value of CE together with a clear reduction of OE. The minimum value of OE is consistently observed in 2010 for all products and a similar consistency is observed for the maximum value of CE that is recorded in 2008. The maximum value of OE is observed in 2005 for AQM and in 2009 for MCD64A1 and MCD45A1 products, whereas the minimum value of CE is again observed in 2010 for AQM and in 2006 for both MODIS standard BA products.
Figure 5. Verification measures from contingency tables (OA(a); OE(b); CE(c); B(d); DC(e)) for AQM and MCD64A1 and MCD45A1 versus the TM reference map over Jalapão for 2005 (JA), 2006 (JJAS), 2007 (JJA), 2008 (J), 2009 (JA), and 2010 (JJAS).
Remotesensing 07 15782 g005
The high values of OE and very low values of CE reached by MODIS standard products translate into values of B significantly lower than one (Figure 5d). An opposite behavior is shown by the AQM product, where the high (low) values of CE (OE) from AQM result in a slight tendency for overestimation (values of B slightly larger than one), the exception being 2008 where B reaches 1.56. The tendency for underestimation by the MODIS standard BA products is particularly true in 2009 where B is as low as 0.20 and 0.14 for MCD64A1 and MCD45A1; an opposite behavior is found in 2010 when values of B reach maxima of 0.69 and 0.48 for MCD64A1 and MCD45A1, respectively.
The AQM product presents higher values of DC than MCD64A1 in four out of six years, namely in 2006 (66% vs. 60%), 2007 (78% vs. 60%), 2008 (57% vs. 50%) and 2009 (60% vs. 32%); for the remaining two years the DC for AQM is just 1% below that for MCD64A1 (59% vs. 60% in 2005 and 79% vs. 80% in 2010). The MCD45A1 product presents very low values of DC, below 50% in four of the years, the two exceptions being 2007 (53%) and 2010 (58%). These results indicate that, compared to MCD64A1 and especially to MCD45A1, the AQM product tends to present a higher mean overlap between pixels classified as burned ones by AQM and those classified as burned in the reference map.

3.2. Spatial Errors

Table 3 provides the number of hits, omission errors, and commission errors obtained when comparing AQM and MCD64A1 and MCD45A1 versus reference maps of burned scars derived from Landsat TM over Jalapão in the study period. A hit (omission) is defined as a pixel identified as burned (not burned) by the considered algorithm and where the fraction of burned pixels in the reference map is greater than 0; a commission is in turn defined as a pixel identified as burned by the considered algorithm but where the fraction of burned pixels in the reference map is 0. Each scar is defined as a contiguous set of pixels with positive fractions of burned pixels in the reference map; for each scar a boundary is defined as the set of pixels with a null fraction of burned pixels in the reference map and immediately outside the scar.
Table 3. Number of hits, omission errors, and commission errors when comparing AQM and MCD64A1 and MCD45A1 versus TM reference maps over Jalapão during the study period. For hits and omissions, each cell also presents the fractions of low burned pixels (L), i.e., with less than 50% burned area in the Landsat reference map and of highly burned pixels (H), i.e., with more than 50% burned, whereas for commissions each cell also presents the fractions of pixels located in the border of scars (∂S) or out of both scars and borders (O).
HitsOmissionsCommissions
AQM28,255
L = 44%; H = 56%
23,637
L = 65%; H = 35%
14,581
O = 58%; ∂S = 42%
MCD64A113425
L = 22%; H = 78%
38467
L = 65%; H = 35%
579
O = 58%; ∂S = 42%
MCD45A19332
L = 24%; H = 76%
42560
L = 60%; H = 40%
786
O = 52%; ∂S = 48%
As expected, for all three products, especially MCD64 and MCD45, the majority of hits is associated to highly burned pixels, i.e., those with more than 50% burned area in the reference map; however, the AQM product is able to correctly identify as burned area 44% of the pixels with less than one half of burned area, an amount that is about the double of that in either MCD64A1 (22%) or MCD45A1 (24%). In turn, and also as expected, for the three algorithms the majority of omissions is associated to pixels with less than 50% of burned area in the reference map.
The large number of commission errors by AQM contrasts with the low number in the two MODIS standard products; however, 42% of commission errors in AQM are associated to occurrences in pixels located along the borders of the scars, a feature that is clearly visible in Figure 6 whose maps presents hits, omission and commission errors for AQM and MCD64A1 over Jalapão for the six validation periods. These results suggest that a substantial fraction of commission errors in AQM are not “false alarms” in the strict sense, but as an overestimate of the size of the real scars. This problem is likely to be associated to errors in geo-referencing of MODIS images that propagate into the multi-image composites.
A better insight into the characteristics of AQM may be obtained by analyzing the number of hits, omission errors and commission errors on a yearly basis and relating the results with the corresponding fractions of total number of scars and of total burned area for three classes of scar sizes as derived from Landsat data. As shown in Table 4, for all periods analyzed, the area of study is characterized by high frequency (85%–90%) of small scars (<100 ha) that account for a small percentage (8%–19%) of the total BA. Large scars (>1000 ha) are rare (1%–2%) but account for a large amount (34%–64%) of the total BA. As opposed to regions where large scars are predominant, low resolution sensors tend to underestimate BA in regions where burned scars are small and fragmented. A large number of omission errors are, therefore, to be expected in all three analyzed products but, as already pointed out, the AQM is able to identify a larger fraction of partially burned pixels. Conversely, as pointed out by [62], small and irregular unburned areas within large burned patches may lead to an increase in commission errors, particularly for high-sensitivity algorithms.
Figure 6. Maps showing pixels where truly burned areas were detected (green), together with omission (blue) and commission (red) errors. TM reference scars (black lines) are superimposed. Results are from AQM and MCD64A1 over Jalapão and for 2005 (JA), 2006 (JJAS), 2007 (JJA), 2008 (J), 2009 (JA) and 2010 (JJAS).
Remotesensing 07 15782 g006
However, the relative contributions of these three classes of scars drastically change from year to year; in the two years with the largest number of burned pixels (2007 and 2010), the large scars represent only 2% of the total number of scars but account for substantially more than half of the total burned area (58% and 64%), whereas in the two years with the lowest number of burned pixels (2008 and 2005) large scars just represent 1% of the total number and account for substantially less than half of the burned area (34% and 46%). These differences strongly reflect in the location of commission errors by AQM; in the two years with large number of burned pixels (2007 and 2010) commission errors mostly locate in the boundaries (80% and 70%) whereas in the two years with low number of pixels (2008 and 2005) commission errors mostly locate in pixels outside scars and borders (87% and 88%). In the case of hits and omissions, the contrast between years with high and low number of pixels is weaker when comparing the distributions between high and low burned pixels.
Table 4. As in Table 3 but for AQM and on an annual basis from 2005 to 2010 together with the distribution of scars by number and by associated burned area according to the respective size: small (lower than 100 ha), medium (between 100 and 1000 ha) and large (greater than 1000 ha). Years are sorted by increasing the number of total burned pixels as given by adding the number of hits and omissions. It is worth noting that the smaller burn scar size mapped in the Landsat images is 0.09 ha.
AQMHitsOmissionsCommissionsDistribution of Scars According to Size
by Numberby Burned Area
2008 (J)2621
L = 54%; H = 46%
2769
L = 71%; H = 29%
2980
O = 87%; ∂S = 13%
Small = 85%
Medium = 13%
Large = 1%
Small = 17%
Medium = 49%
Large = 34%
2005 (JA)2102
L = 49%; H = 51%
3459
L = 65%; H = 35%
1539
O = 88%; ∂S = 12%
Small = 90%
Medium = 9%
Large = 1%
Small = 16%
Medium = 38%
Large = 46%
2009 (JA)2863
L = 53%; H = 47%
4427
L = 70%; H = 30%
2201
O = 66%; ∂S = 34%
Small = 89%
Medium = 10%
Large = 1%
Small = 17%
Medium = 43%
Large = 40%
2006 (JJAS)4066
L = 48%; H = 52%
4324
L = 65%; H = 35%
2530
O = 71%; ∂S = 29%
Small = 89%
Medium = 10%
Large = 1%
Small = 19%
Medium = 39%
Large = 42%
2010 (JJAS)8484
L = 38%; H = 62%
3833
L = 59%; H = 41%
2697
O = 30%; ∂S = 70%
Small = 87%
Medium = 11%
Large = 2%
Small = 8%
Medium = 27%
Large = 64%
2007 (JJA)8119
L = 41%; H = 59%
4825
L = 60%; H = 40%
2634
O = 20%; ∂S = 80%
Small = 86%
Medium = 12%
Large = 2%
Small = 11%
Medium = 31%
Large = 58%

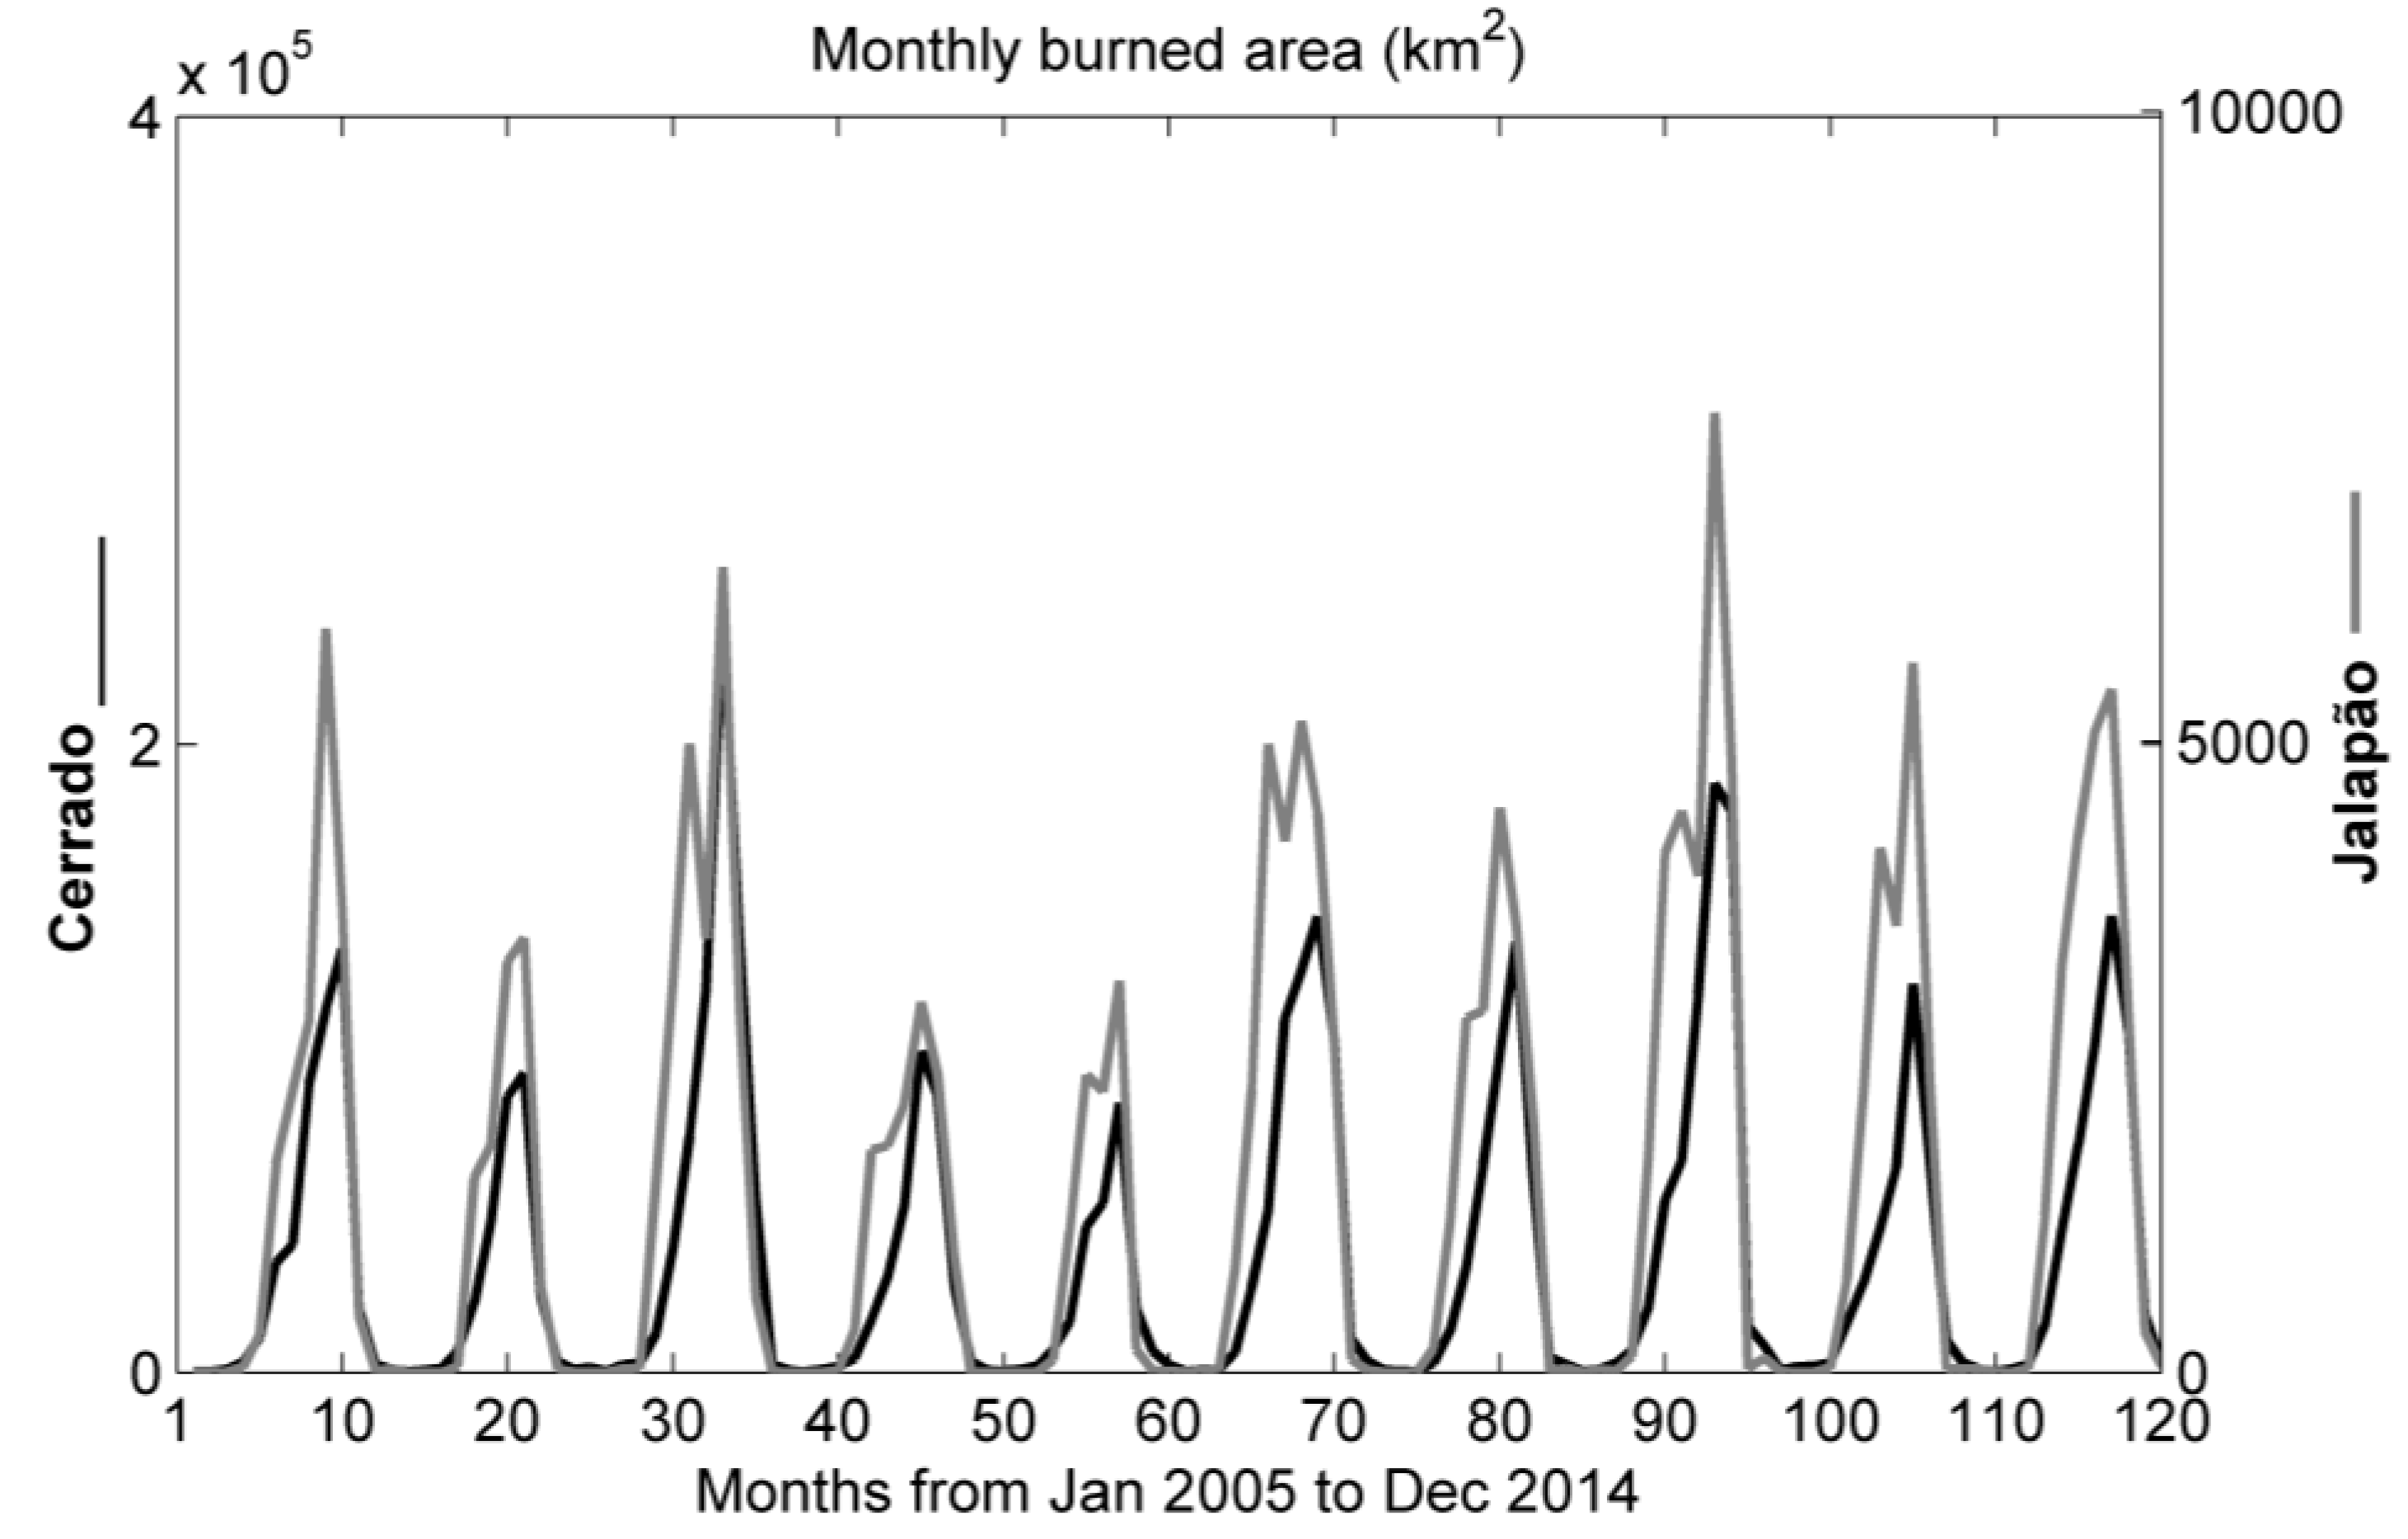
3.3. Temporal Errors

An assessment was finally made of the implications of the different approaches in the estimation of the inter-annual variability of BA over the study region. Figure 7 displays the histogram representing the total amount of annual BA for Jalapão as derived for the six validation periods from AQM, MCD64A1, MCD45A1 and the TM reference maps. While all four BA products show similar temporal behavior, there are significant differences regarding the magnitude of the amount of burned area. On average, the MCD64A1 and MCD45A1 provide BA estimates of 2334 km2 and 1686 km2, amounts that are 2.4 and 3.3 times smaller than the reference value of 5532 km2 from TM. The AQM product provides an estimate of 7139 km2, which is 1.3 times larger than the reference. Especially for 2005 (JA), 2006 (JJAS) and 2010 (JJAS) AQM presents very similar burned area totals compared to the reference.
The AQM algorithm was applied over Brazilian Cerrado and a cartographic database of monthly burned area with 1 km resolution was generated covering the 10-year period 2005–2014. The statistical representativeness of the validation area in Jalapão was assessed by comparing the monthly time series of total burned area over Brazilian Cerrado and over Jalapão. Figure 8 presents the Cerrado and Jalapão time series of total monthly burned areas for the 10-year period. The two time series present very close behavior which translates into the value of 0.68 for the correlation between the two deseasonalized time series. Deseasonalization was performed by subtracting to each month value the mean of that month and then dividing by the respective standard deviation.
Figure 7. Histogram representing the results of BA for the Jalapão region comparing AQM, MCD45, MCD64, and the TM reference maps for the years (months) studied.
Remotesensing 07 15782 g007
Figure 8. Monthly burned area (km2) for the 10-year period over Cerrado (black curve) and Jalapão (gray curve).
Remotesensing 07 15782 g008

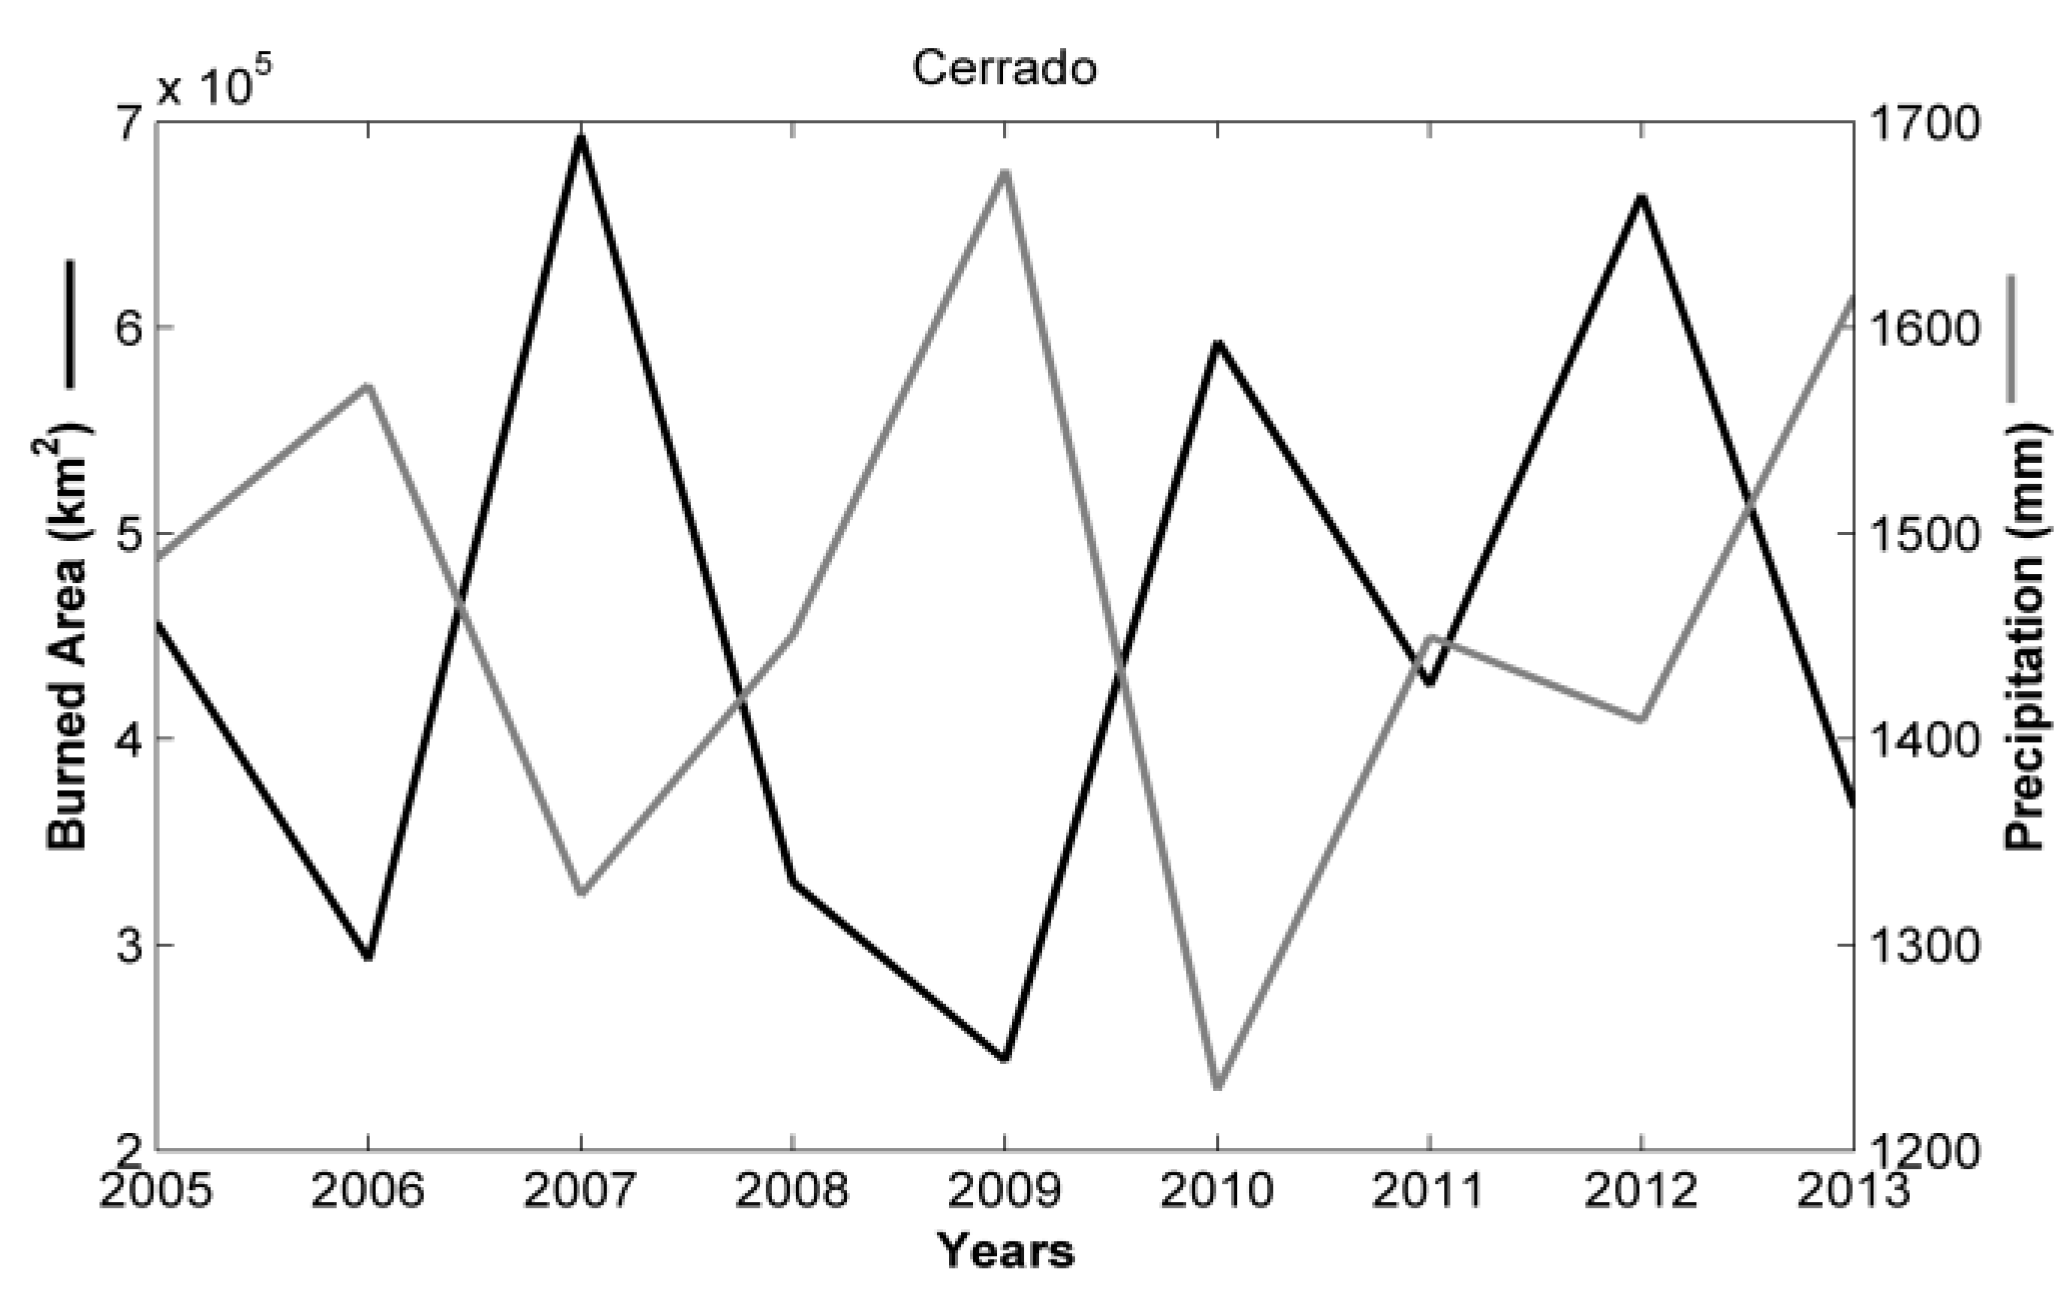
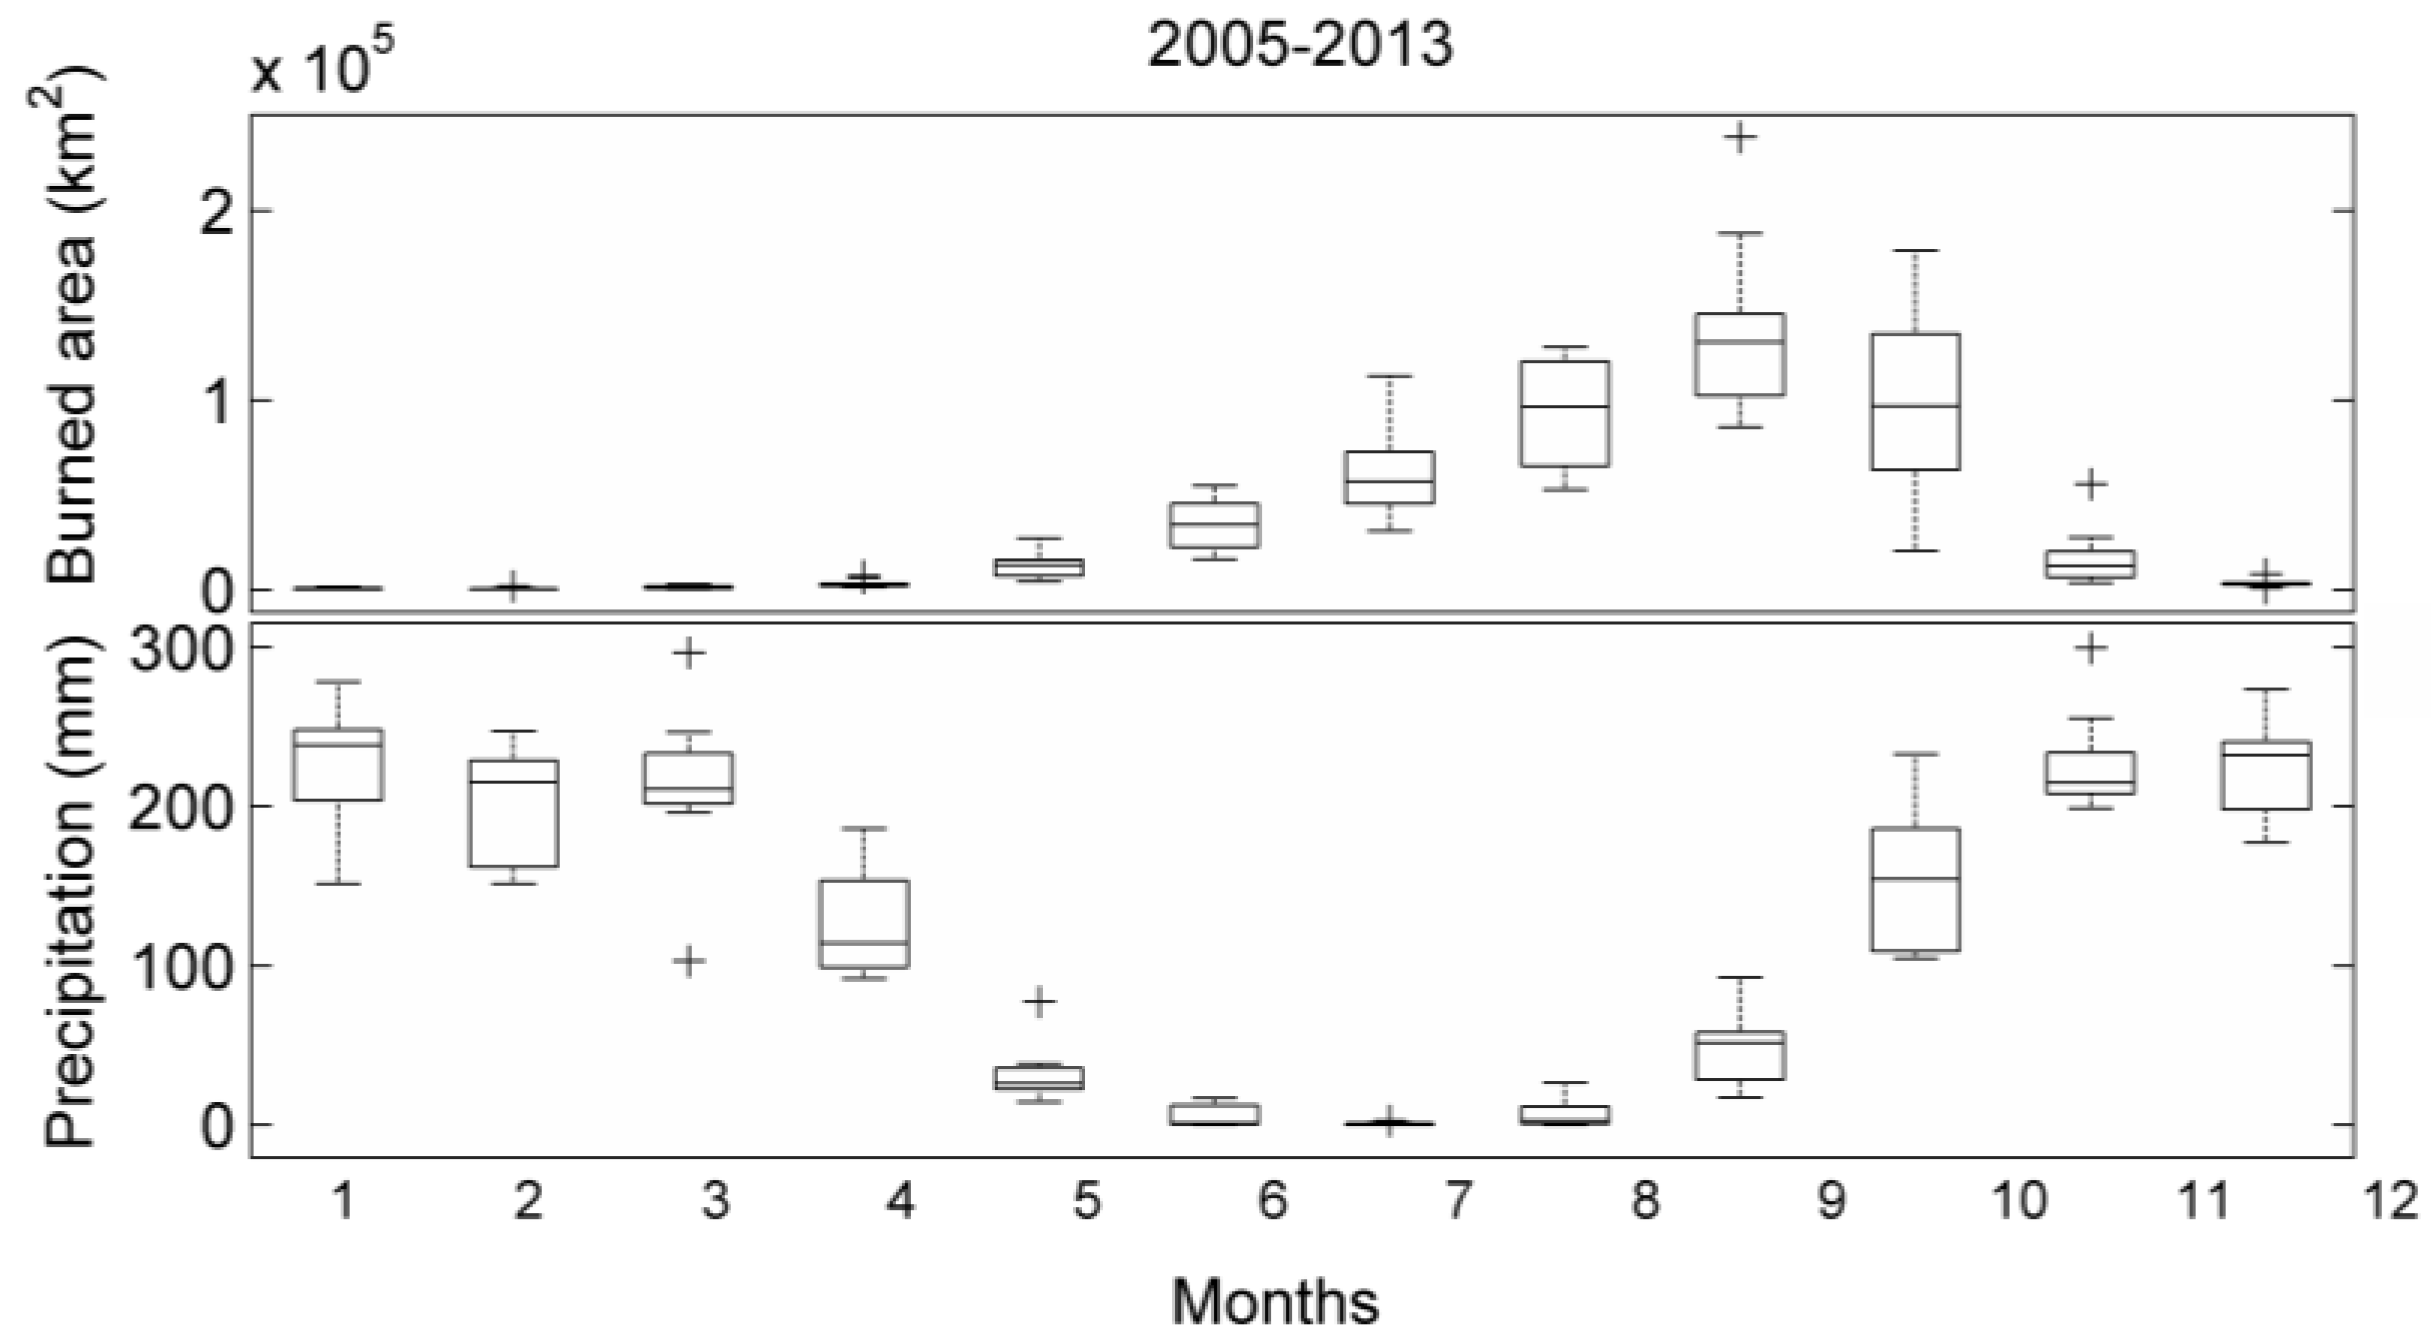
3.4. Climatic Drivers

As shown in Figure 9, the intra-annual variability of BA over Cerrado is closely related to the inter-annual regime of precipitation. There is a marked dry season from May to September, characterized by very low precipitation amounts. During the same period, there is a steady displacement towards higher values of the distribution of monthly values of BA. This displacement is in agreement with the increase in severity of doughtiness of the surface. It is worth mentioning that, despite the major role played by climate conditions, the human factor has also a prominent role on fire dynamics in this region and cannot be disregarded.
Figure 9. Boxplots of monthly values of BA (upper panel) and precipitation (lower panel) for 2005–2013. On each box, the central mark is the median, the edges of the box are the 25th and 75th percentiles and the whiskers delimit the extreme values.
Remotesensing 07 15782 g009
As expected the inter-annual variability of burned area in Cerrado is also closely related to the inter-annual variability of precipitation. This is clearly shown in Figure 10 that presents time series of annual amounts of burned area (solid curve) and of precipitation (dotted curve) during 2005–2013. The three years with largest annual amounts of BA (2007, 2010, and 2012) are those with the lowest amounts of annual precipitation. The correlation between the two time series is −0.82, a value that is significant at the 1% level.
Figure 10. Inter-annual variability of burned area (black curve) and precipitation (gray curve) during the nine-year period (2005 to 2013) over Cerrado.
Remotesensing 07 15782 g010

4. Conclusions

The aim of this work was to contribute to the assessment of vegetation fires in Brazilian Cerrado, namely by providing improved monthly maps of burned area (BA) based on remote-sensed information together with estimates of the areal extent and temporal evolution of fire scars. The procedure relies on AQM, an algorithm that integrates daily information of NIR/MIR reflectances from MODIS 1 km imagery with active fire observations from multiple sensors. Results obtained were validated against 30 m spatial resolution Landsat imagery over Jalapão, Brazil. Intercomparison with two MODIS standard products, MCD64A1 and MCD45A1, was also carried out.
Estimates of BA over Jalapão from AQM, MCD45, and MCD64 products present similar inter-annual variability but marked differences among the magnitude of the estimates of total BA. On average, MCD64A1 and MCD45A1 provide underestimation (2.4 to 3.3 times smaller) of the total BA, whereas the estimated value of BA by AQM over the area and periods of validation is 1.3 times larger than the value derived from 30 m resolution imagery, making the product useful for applications in fire emission studies and ecosystem management. As expected the intra- and inter-annual variability of estimated BA over the Brazilian Cerrado is in close agreement with the regime of precipitation. The relationship between the spatio-temporal variability of burned area and climatic drivers is worth being analyzed in future studies.
Since the study area is characterized by a high frequency (85%–90%) of small scars (< 100 ha), a large number of omission errors is expected due to the coarse resolution of the BA products (500 m for MCD64A1 and MCD45A1, and 1 km for AQM). However the AQM product presents a reduced number of omission errors (below 40% in all cases) than the two MODIS standard products (greater than 60% in almost all cases analyzed). The two MODIS standard products appear as conservative in the sense that a low level of false alarms (below 10%) is attained with high occurrences of omission cases. The AQM product in turn has larger commission errors (20% to 40%) with a large fraction of those (more than 40%) occurring at the borders of the scars and may therefore not be strictly viewed as false alarms. The AQM product also presents balanced values of omission and commission errors, a feature that meets the point of view expressed by several users that answered the questionnaire designed by [63] who consider as acceptable a given level of omission and commission error as long as they are both similar. The AQM product presents higher similarity with the reference map in terms of the number of common burned pixels (77%) compared to the NASA products (60%) for the Cerrado region. Differences in results from the three products may be traced back to differences among the respective algorithms. Both MCD45 and MCD64 products rely on global algorithms whereas AQM is based on a regional algorithm, calibrated for Brazilian biomes. The MCD45 product does not make use of information about fire activity and detection of BA is based on changes in values of reflectance. The MCD64 product takes advantage of information about hotspots as detected by the MODIS instrument and uses a burn-sensitive vegetation index based on short-wave infrared (SWIR) channels together with a measure of temporal texture. The AQM product makes use of active fire observations from multiple sensors and relies on a burn-sensitive vegetation index based on MIR and NIR reflectance.
The AQM algorithm was used to generate a monthly BA database for the Brazilian Cerrado at 1 km resolution covering the period 2005–2014. The database will be extended to all biomes of Brazil in the framework of project BrFLAS. Additional validation sites in different biomes will be highly valuable to find realistic accuracy assessments of the algorithm for those conditions. For this purpose, more reference data sets are being developed at INPE using Landsat imagery.
In order to have a longer time series for analysis, the AQM algorithm will be refined and applied to MODIS data since 2000 to the present. Conversion of the MODIS AQM to NPP-VIIRS imagery with 375 m resolution is also under way, since this new sensor has the same spatial resolution for visible and thermal channels, a feature that is expected to improve the AQM results.
Under the scope of project BrFLAS, the database will be used to (1) estimate aerosol and gas emissions; (2) address the interactions between climatic and ecological drivers of fire activity; (3) develop short-term predictive models concerning fire risk dynamics at the regional level; and (4) understand and forecast future fire regimes under a variety of climate change scenarios, keeping in mind the inherent uncertainties related to an incomplete representation of physical, chemical, biological, and societal processes.
A major consequence of this work will be the operational implementation of its results in INPE’s existing operational fire system, improving the overall quality of its products and benefiting a wide range of users, comprising government agencies, research groups, ecologists, fire managers, and NGOs.

Acknowledgments

We are grateful to the following for financial support: São Paulo Research Foundation (FAPESP), grant 2010/19712-2, Brazil’s National Research Council, CNPq, grant PQ-309765/2011-0, the German Technical Cooperation Agency through the Project “Prevention, Control and Monitoring of Bushfires in the Cerrado”, EUMETSAT Satellite Application Facility for Land Surface Analysis Project (LSA SAF) and FAPESP/FCT Project Brazilian Fire-Land-Atmosphere System (BrFLAS), 2015/01389-4. The authors are thankful to MSc Silvia de Jesus and to B.Sc. Pietro Cândido for providing the Jalapão reference scars.

Author Contributions

All authors contributed equally to this work. Renata Libonati developed the MODIS algorithm and performed the validation approach. Renata Libonati and Carlos C. DaCamara established the methodology for the validation section and compiled the manuscript. Fabiano Morelli is responsible for the pre-processing step of MODIS images and contributed to the interpretation of the results. Emiliano A. Melchiori derived and provided the Landsat validation data. Alberto W. Setzer initiated the project, reviewed the paper and contributed to the interpretation of the results.

Conflicts of Interest

The authors declare no conflict of interest.

References

  1. Stocker, T.; Qin, D.; Plattner, G.; Tignor, M.; Allen, S.; Boschung, J.; Nauels, A.; Xia, Y.; Bex, V.; Midgley, P. IPCC 2013: Climate Change 2013: The Physical Science Basis, Proceedings of the Contribution of Working Group I to the Fifth Assessment Report of the Intergovernmental Panel on Climate Change, Stockholm, Sweden, 23–26 September 2013; Cambridge University Press: Cambridge, UK; New York, NY, USA, 2014; pp. 213–214.
  2. MCTI—Ministério Para Ciência, Tecnologia e Inovação (2013) Estimativas Anuais de Emissões de Gases de Efeito Estufa no Brasil. MCTI, Brasília. Available online: http://www.mct.gov.br/upd_blob/0226/226591.pdf (accessed on 14 September 2015).
  3. Pereira, J.M.C.; Setzer, A.W. Spectral characteristics of fire scars in Landsat-5 TM images of Amazônia. Int. J. Remote Sens. 1993, 14, 2061–2078. [Google Scholar] [CrossRef]
  4. Setzer, A.W.; Pereira, M.C.P. Amazonia biomass burnings in 1987 and an estimate of their tropospheric emissions. Ambio 1991, 20, 19–22. [Google Scholar]
  5. Pivello, V. The use of fire in the Cerrado and Amazonian rainforests of Brazil: Past and present. Fire Ecol. 2011, 7, 24–39. [Google Scholar] [CrossRef]
  6. Nepstad, D.C.; Stickler, C.M.; Soares-Filho, B.; Merry, F. Interactions among Amazon land use, forests and climate: Prospects for a near-term forest tipping point. Philos. Trans. R. Soc. 2008, 363, 1737–1746. [Google Scholar] [CrossRef] [PubMed]
  7. Nepstad, D.C.; Verssimo, A.; Alencar, A.; Nobre, C.; Lima, E.; Lefebvre, P.; Schlesinger, P.; Potter, C.; Moutinho, P.; Mendoza, E.; et al. Large scale improverishment of Amazonian forests by logging and fire. Nature 1999, 398, 505–508. [Google Scholar] [CrossRef]
  8. Gillet, N.P.; Weaver, A.J.; Zwiers, F.W.; Flannigan, M.D. Detecting the effect of climate change on Canadian forest fires. Geophys. Res. Lett. 2004, 31, 1–4. [Google Scholar] [CrossRef]
  9. Westerling, A.L.; Hidalgo, H.G.; Cayan, D.R.; Swetnam, T. Warming and earlier spring increases western US forest wildfire activity. Science 2006, 313, 940–943. [Google Scholar] [CrossRef] [PubMed]
  10. Flannigan, M.D.; Krawchuk, M.A.; Groot, W.J.; Wotton, B.M.; Gowman, L.M. Implications of changing climate for global wildland fire. Int. J. Wildland Fire 2009, 18, 483–507. [Google Scholar] [CrossRef]
  11. Aldersley, A.; Murray, S.J.; Cornell, S.E. Global and regional analysis of climate and human drivers of wild-fire. Sci. Total Environ. 2011, 409, 3472–3481. [Google Scholar] [CrossRef] [PubMed]
  12. Pereira, M.G.; Calado, T.J.; DaCamara, C.C.; Calheiros, T. Effects of regional climate change on rural fires in Portugal. Clim. Res. 2013, 57, 187–200. [Google Scholar] [CrossRef]
  13. Hoffman, W.A.; Schroeder, W.; Jackson, R.B. Regional feed-backs among fire, climate, and tropical deforestation. J. Geophys. Res. 2003, 108. [Google Scholar] [CrossRef]
  14. Cardoso, M.F.; Hurtt, G.C.; Moore, B.; Nobre, C.A.; Prins, E. Projecting future fire activity in Amazonia. Glob. Chang. Biol. 2003, 9, 656–669. [Google Scholar] [CrossRef]
  15. Hutyra, L.R.; Munger, J.W.; Nobre, C.A.; Saleska, S.R.; Vieira, S.A.; Wofsy, S.C. Climatic variability and vegetation vulnerability in Amazonia. Geophys. Res. Lett. 2005, 32. [Google Scholar] [CrossRef]
  16. Scholze, M.; Knorr, W.; Arnell, N.W.; Prentice, C. A climate-change risk analysis for world ecosystems. Proc. Natl. Acad. Sci. USA 2006, 103, 13116–13120. [Google Scholar] [CrossRef] [PubMed]
  17. Li, W.; Fu, R.; Dickinson, R.E. Rainfall and its seasonality over the Amazon in the 21st century as assessed by the coupled models for the IPCC AR4. J. Geophys. Res. 2006, 111. [Google Scholar] [CrossRef]
  18. Liu, Y.; Stanturf, J.; Goodrick, S. Trends in global wildfire potential in a changing climate. For. Ecol. Manag. 2010, 259, 685–697. [Google Scholar] [CrossRef]
  19. Stocks, B.J.; Goldammer, J.G.; Frost, P.G.H.; Cahoon, D.R. Towards the development of an informed global policy on vegetation fires: What role for remote sensing? In Global and Regional Vegetation Fire Monitoring from Space: Planning a Coordinated International Effort; Ahern, F., Goldammer, J.G., Justice, C.O., Eds.; SPB Academic Publishing BV: Hague, The Netherlands, 2001; pp. 35–46. [Google Scholar]
  20. Plummer, S.; Arino, O.; Simon, M.; Steffen, W. Establishing an earth observation product service for the terrestrial carbon community: The GLOBCARBON initiative. Mitig. Adapt. Strateg. Glob. Chang. 2006, 11, 97–111. [Google Scholar] [CrossRef]
  21. Roy, D.P.; Boschetti, L.; Justice, C.O.; Ju, J. The Collection 5MODIS burned area product: Global evaluation by comparison with the MODIS active fire product. Remote Sens. Environ. 2008, 112, 3690–3707. [Google Scholar] [CrossRef]
  22. Tansey, K.; Gregoire, J.M.; Defourny, P.; Leigh, R.; Pekel, J.F.O.; van Bogaert, E.; Bartholome, E. A new, global, multi-annual (2000–2007) burnt area product at 1 km resolution. Geophys. Res. Lett. 2008, 35. [Google Scholar] [CrossRef]
  23. Giglio, L.; van der Werf, G.R.; Randerson, J.T.; Collatz, G.J.; Kasibhatla, P.S. Global estimation of burned area using MODIS active fire observations. Atmos. Chem. Phys. 2006, 6, 957–974. [Google Scholar] [CrossRef]
  24. Giglio, L.; Randerson, J.T.; van der Werf, G.R.; Kasibhatla, P.S.; Collatz, G.J.; Morton, D.C.; DeFries, R.S. Assessing variability and long-term trends in burned area by merging multiple satellite fire products. Biogeosciences 2010, 7, 1171–1186. [Google Scholar] [CrossRef]
  25. Boschetti, L.; Eva, H.D.; Brivio, P.A.; Grégoire, J.M. Lessons to be learned from the comparison of the three satellite-derived biomass burning products. Geophys. Res. Lett. 2004, 31. [Google Scholar] [CrossRef]
  26. Chang, D.; Song, Y. Comparison of L3JRC and MODIS global burned area products from 2000 to 2007. J. Geophys. Res. 2009, 114. [Google Scholar] [CrossRef]
  27. Setzer, A.; Morelli, F.; Lombardi, R. Estimativa quinzenal de áreas queimadas nas imagens MODIS do INPE. In O Sensor MODIS e suas Aplicações Ambientais no Brasil; Rudorff, B.F.T., Shimabukuro, Y.E., Ceballos, J.C., Eds.; Bookimage: S.J.Campos, Brazil, 2007; pp. 403–417. [Google Scholar]
  28. Melchiori, E.A.; Setzer, A.W.; Morelli, F.; Libonati, R.; Candido, P.; Jesus, S.A. Landsat-Tm/Oli algorithm for burned areas in the Brazilian Cerrado—Preliminary results. In Proceedings of VII International Conference on Forest Fire Research, Coimbra, Portugal, 17–20 November 2014.
  29. Haddad, Z.S.; Smith, E.A.; Kummerow, C.D.; Iguchi, T.; Farrar, M.R.; Durden, S.L.; Alves, M.; Olson, W.S. The TRMM “Day-1” radar/radiometer combined rain-profiling algorithm. J. Meteorol. Soc. 1997, 75, 799–809. [Google Scholar]
  30. Silva, J.F.; Farin, M.R.; Felfili, J.M.; Klink, C.A. Spatial heterogeneity, land use and conservation in the cerrado region of Brazil. J. Biogeogr. 2006, 33, 536–548. [Google Scholar] [CrossRef]
  31. Roy, D.P.; Jin, Y.; Lewis, P.E.; Justice, C.O. Prototyping a global algorithm for systematic fire-affected area mapping using MODIS time series data. Remote Sens. Environ. 2005, 97, 137–162. [Google Scholar] [CrossRef]
  32. Giglio, L.; Loboda, T.; Roy, D.P.; Quayle, B.; Justice, C.O. An active-fi re based burned area mapping algorithm for the MODIS sensor. Remote Sens. Environ. 2009, 113, 408–420. [Google Scholar] [CrossRef]
  33. Barbosa, P.M.; Gregoire, J.-M.; Pereira, J.M.C. An algorithm for extracting burned areas from time series of AVHRR GAC data applied at a continental scale. Remote Sens. Environ. 1999, 69, 253–263. [Google Scholar] [CrossRef]
  34. Pereira, J.M.C. A comparative evaluation of NOAA/AVHRR vegetation indexes for burned surface detection and mapping. IEEE Trans. Geosci. Remote Sens. 1999, 37, 217–226. [Google Scholar] [CrossRef]
  35. Libonati, R.; DaCamara, C.C.; Pereira, J.M.C.; Peres, L.F. Retrieving middle infrared reflectance for burned area mapping in tropical environments using MODIS. Remote Sens. Environ. 2010, 114, 831–843. [Google Scholar] [CrossRef]
  36. Libonati, R.; DaCamara, C.C.; Pereira, J.M.C.; Peres, L.F. On a new coordinate system for improved discrimination of vegetation and burned areas using MIR/NIR information. Remote Sens. Environ. 2011, 114, 831–843. [Google Scholar] [CrossRef]
  37. França, H.; Setzer, A.W. AVHRR analysis of savanna site through a fire season in Brazil. Int. J. Remote Sens. 2001, 22, 2449–2461. [Google Scholar] [CrossRef]
  38. Richardson, A.J.; Wiegand, C.L. Distinguishing vegetation from soil background information. Photogramm. Eng. Remote Sens. 1997, 43, 1541–1552. [Google Scholar]
  39. Pinty, B.; Lavergne, T.; Widlowski, J.-L.; Gobron, N.; Verstraete, M.M. On the need to observe vegetation canopies in the near-infrared to estimate visible light absorption. Remote Sens. Environ. 2008, 113, 10–23. [Google Scholar] [CrossRef]
  40. Kaufman, Y.J.; Remer, L. Detection of forests using mid-IR reflectance: An application for aerosol studies. IEEE Trans. Geosci. Remote Sens. 1994, 32, 672–683. [Google Scholar] [CrossRef]
  41. Sousa, A.M.O.; Pereira, J.M.C.; Silva, J.M.N. Evaluating the performance of multitemporal image compositing algorithms for burned area analysis. Int. J. Remote Sens. 2003, 24, 1219–1236. [Google Scholar] [CrossRef]
  42. Holben, B.N. Characteristics of maximum-value composite images from temporal AVHRR data. Int. J. Remote Sens. 1986, 7, 1417–1437. [Google Scholar] [CrossRef]
  43. Barbosa, P.M.; Pereira, J.M.C.; Gregoire, J.-M. Compositing criteria for burned area assessment using multitemporal low resolution satellite data. Remote Sens. Environ. 1998, 65, 38–49. [Google Scholar] [CrossRef]
  44. Stroppiana, D.; Tansey, K.; Gregoire, J-M.; Pereira, J.M.C. An algorithm for mapping burnt areas in Australia using SPOT-VEGETATION data. IEEE Trans. Geosci. Remote Sens. 2003, 41, 907–909. [Google Scholar] [CrossRef]
  45. Chuvieco, E.; Englefield, P.; Trischenko, A.; Lio, Y. Generation of long time series of burn area maps of the boreal forest from NOAA-AVHRR composite data. Int. J. Remote Sens. 2008, 23, 5103–5110. [Google Scholar] [CrossRef]
  46. Roy, D.P.; Giglio, L.; Kendall, J.D.; Justice, C.O. Multi-temporal active-fire based burn scar detection algorithm. Int. J. Remote Sens. 1999, 20, 1031–1038. [Google Scholar] [CrossRef]
  47. Fraser, R.H.; Li, Z.; Cihlar, J. Hotspot and NDVI differencing synergy (HANDS): A new technique for burned area mapping over boreal forest. Remote Sens. Environ. 2000, 74, 362–376. [Google Scholar] [CrossRef]
  48. Pu, R.; Gong, P.; Li, Z.; Scarborough, J. A dynamic algorithm for wildfire mapping with NOAA/AVHRR data. Int. J. Wildland Fire 2004, 13, 275–285. [Google Scholar] [CrossRef]
  49. George, C.; Rowland, C.; Gerard, F.; Balzter, H. Retrospective mapping of burnt areas in Central Siberia using a modification of the normalized difference water index. Remote Sens. Environ. 2006, 104, 346–359. [Google Scholar] [CrossRef]
  50. Loboda, T.; O’Neal, K.J.; Csiszar, I. Regionally adaptable dNBR-based algorithm for burned area mapping from MODIS data. Remote Sens. Environ. 2007, 109, 429–442. [Google Scholar] [CrossRef]
  51. Schroeder, W.; Csiszar, I.; Morisette, J. Quantifying the impact of cloud obscuration on remote sensing of active fires in the Brazilian Amazon. Remote Sens. Environ. 2008, 112, 456–470. [Google Scholar] [CrossRef]
  52. Schroeder, W.; Morisette, J.; Csiszar, I.; Giglio, L.; Morton, D.; Justice, C.O. Characterizing vegetation fire dynamics in Brazil through multisatellite data: Common trends and practical issues. Earth Interact. 2005, 9, 1–26. [Google Scholar] [CrossRef]
  53. Story, M.; Congalton, R.G. Accuracy assessment: A user’s perspective. Photogramm. Eng. Remote Sens. 1986, 52, 397–399. [Google Scholar]
  54. Gong, P.; Howarth, P.J. The use of structural information for improving land-cover classification accuracies at the rural-urban fringe. Photogramm. Eng. Remote Sens. 1990, 56, 67–73. [Google Scholar]
  55. Karaska, M.A.; Huguenin, R.L.; van Blaricom, D.; Savitsky, B. Subpixel classification of cypress and tupelo trees in TM imagery. In Proceedings of the 1995 ACSM/ASPRS Annual Convention and Exposition, Charlotte, NC, USA, 27 February–2 March 1995; pp. 856–865.
  56. Foody, G.M. Approaches for the production and evaluation of fuzzy land cover classications from remotely-sensed data. Int. J. Remote Sens. 1996, 17, 1317–1340. [Google Scholar] [CrossRef]
  57. Binaghi, E.; Brivio, P.A.; Ghezzi, P.; Rampini, A. A fuzzy set-based accuracy assessment of soft classification. Pattern Recognit. Lett. 1999, 20, 935–948. [Google Scholar] [CrossRef]
  58. Boschetti, L.; Flasse, S.P.; Brivio, P.A. Analysis of the conflict between omission and commission in low spatial resolution dichotomic thematic products: The pareto boundary. Remote Sens. Environ. 2004, 91, 280–292. [Google Scholar] [CrossRef]
  59. Padilla, M.; Stehman, S.V.; Litago, J.; Chuvieco, E. Assessing the temporal stability of the accuracy of a time series of burned area products. Remote Sens. 2014, 6, 2050–2068. [Google Scholar] [CrossRef]
  60. Tsela, P.; Wessels, K.; Botai, J.; Archibald, S.; Swanepoel, D.; Steenkanp, K.; Frost, P. Validation of the tow standard MODIS satellite burned area products and an Empirically-derived merged product in South Africa. Remote Sens. 2014, 6, 1275–1293. [Google Scholar] [CrossRef]
  61. Wilks, D. Statistical Methods in the Atmospheric Sciences, 2nd ed.; Academic Press: Waltham, MA, USA, 2006; p. 627. [Google Scholar]
  62. Padilla, M.; Stehman, S.V.; Ramo, R.; Corti, D.; Hantson, S.; Olive, P.; Alonso-Canas, I.; Bradley, A.V.; Tansey, K.; Mota, B.; et al. Comparing the accuracies of remote sensing global burned area products using stratified random sampling and estimation. Remote Sens. Environ. 2015, 160, 114–121. [Google Scholar] [CrossRef]
  63. Mouillot, F.; Schultz, M.G.; Yue, C.; Cadule, P.; Tansey, K.; Ciais, P.; Chuvieco, C. Ten years of global burned area products from spaceborne remote sensing—A review: Analysis of user needs and recommendations for future developments. Int. J. Appl. Earth Obs. Geoinf. 2014, 26, 64–79. [Google Scholar] [CrossRef]

