Article

Use of MODIS Images to Quantify the Radiation and Energy Balances in the Brazilian Pantanal

by
Antônio H. de C. Teixeira
1,*,
Carlos R. Padovani
2,
Ricardo G. Andrade
1,
Janice F. Leivas
1,
Daniel De C. Victoria
1 and
Sergio Galdino
2
1
Embrapa Satellite Monitoring, Campinas, 13070-115 SP, Brazil
2
Embrapa Pantanal, Corumbá, 79320-900 MS, Brazil
*
Author to whom correspondence should be addressed.
Remote Sens. 2015, 7(11), 14597-14619; https://doi.org/10.3390/rs71114597
Submission received: 28 August 2015 / Revised: 21 October 2015 / Accepted: 29 October 2015 / Published: 4 November 2015
(This article belongs to the Special Issue Remote Sensing of Solar Surface Radiation)

Abstract

:
MODIS images during the year 2012 were used for modelling of the radiation and energy balance components with the application of the SAFER algorithm (Simple Algorithm for Evapotranspiration Retrieving) in the Brazilian Pantanal area. Pixels from the main sub-regions of Barão de Melgaço (BR), Paiaguás (PA) and Nhecolândia (NH) were extracted in order to process microclimatic comparisons. In general, the net radiation (Rn) relied much more on the global solar radiation (RG) levels than on water conditions and ecosystem types, in accordance with the low Rn standard deviation values. The fraction of the available energy used as latent heat flux (λE) were, on average, 65, 50 and 49% for the BR, PA and NH sub-regions, respectively. Horizontal heat advection, identified by the negative values of sensible heat flux (H), made several pixels with λE values higher than those for Rn in the middle of the year. Taking the evaporative fraction (Ef) as a surface moisture indicator, the Tree-Lined Savanna (TLS) was considered the moister ecosystem class, with 58% of the available energy being used as λE, while the driest one was the modified ecosystem Anthropogenic Changes (AC), presenting a λE/Rn fraction of 0.46. According to the spatial and temporal consistencies, and after comparisons with other previous point and large-scale studies, the SAFER algorithm proved to have sensibility to quantify and compare the large-scale radiation and energy balance components in the different ecosystems of the Brazilian Pantanal. The algorithm is useful for monitoring the energy exchange dynamics among the different terrestrial and aquatic ecosystem types throughout the seasons of the year.

Graphical Abstract

1. Introduction

Wetlands cover 6% of the Earth’s land surface and have been noted for their ecologic importance [1]. Growing populations have converted large wetland areas to cropland in order to satisfy the increasing demand of food production [2]. These land use changes have a large impact on hydrologic processes, affecting the energy and water balances [3].
The Brazilian Pantanal is one of the largest continuous wetlands on the Earth. Its area is approximately 160,000 km2, with 65% and 35% of its territory located in the Mato Grosso do Sul and Mato Grosso Brazilian states, respectively [4]. The Paraguay River and its tributaries often form extensive flooded areas. Due to the low slope in the North-South and East-West direction, the water flowing in the headwaters takes four months or more to cross the whole Pantanal [5].
According to Silva [6], differences in water volumes, altitudes and declivities, soil permeability and vegetation types are responsible for the diversity of the Brazilian Pantanal ecosystems. However, over the past three decades, they have been severely harmed by human activities, including land-use changes, with evident socioeconomic and environmental impacts. Flooding regime is the most important ecological factor, determining the ecosystem dynamics [7]. Floods typically occur between November and February while the dry period extends from July to August [8]. Thus, the use of tools to quantify large-scale energy exchanges between the vegetation and the lower atmosphere is highly relevant, as these exchanges can affect many weather and climate aspects [9,10].
Energy exchanges in wetlands have gained notoriety due to the dynamics and importance of these areas for regional and local climates. After taking into account all the radiation balance components, the net radiation, Rn, is the difference between incoming and outgoing radiation of both short and long wavelengths. Rn is partitioned into the latent (λE), sensible (H) and ground (G) heat fluxes [11]. Other energy terms, such as heat stored or released in the canopies, or the energy used in metabolic activities, are, in general, not considered. These last terms account only for a small fraction of the daily Rn and can be neglected in environmental studies [12].
The energy balance acquirements in the Brazilian Pantanal have been mostly done by using point measurements [13,14,15,16]. However, difficulty in measuring their components from mixed ecosystems highlighted the use of remote sensing by satellite images [12,17,18,19,20]. Several algorithms utilizing remote sensing to quantify the energy partition have been developed, presenting advantages and disadvantages. SEBAL (Surface Energy Balance Algorithm for Land) elaborated by Bastiaanssen et al. [21], S-SEBI (Surface Energy Balance Index), by Roerink et al. [22]; and SEBS (Surface Energy Balance System) by Su [23], are some of the examples. SEBAL was calibrated and validated with simultaneous field and Landsat satellite measurements, demonstrating a good performance in Northeast Brazil [24] and being also applied successfully in the Brazilian Pantanal with a MODIS image during the driest period of the year [25]. However, the greatest difficulty for its application during large-scale homogeneous wet conditions is the absence of zero λE for the required dry pixel in the algorithm. The algorithm requires a dry pixel in the scene to neglect λE and find H solving the energy balance equation in that pixel. Teixeira et al. [12] have reported that during the rainy season, natural vegetation can present λE rates even higher than those for irrigated crops.
For operational purposes, the use of the Penman-Monteith (PM) equation has been suggested for applying remotely sensed vegetation indices, such as the Normalized Difference Vegetation Index (NDVI) and the Enhanced Vegetation Index (EVI), together with weather data [10,26]. The PM equation was also highlighted by the use of the crop coefficient (Kc) approach [27] and by the model named Mapping Evapotranspiration with High Resolution and Internalized Calibration—METRIC [28]. Considering the simplicity of application, the SAFER (Simple Algorithm for Evapotranspiration Retrieving) algorithm, based on the modelled ratio of actual (ET) to reference (ET0) evapotranspiration, has been developed and validated in Brazil. Field data from four flux stations together with both Landsat and MODIS images were used, involving irrigated crops and natural vegetation under strong contrasting thermohydrological and surface cover conditions over several years [12,29].
Despite extensive literature describing the theoretical mechanisms of turbulent transport above and within crop canopies, fewer large-scale studies have examined these mechanisms within landscapes composed by mixed terrestrial and aquatic ecosystems in the Brazilian Pantanal. From the knowledge of the authors, the only attempt with this purpose was made by Andrade et al. [25], but considering an old ecosystem classification and just one MODIS image during the driest period of the year and one agrometeorological station for the whole region. Therefore, further investigations into this topic is of great importance for advancing the understanding and ability to model land surface–atmosphere interactions under different thermohydrological conditions. These studies can assist in forecasting large-scale effects of climate and land use changes on the water balance, which influences the moisture conditions of the terrestrial and aquatic ecosystems [30].
The objective of the study is to apply the SAFER algorithm by using 16-day period MODIS (Moderate Resolution Imaging Spectroradiometer) reflectance products from the polar-orbiting Terra satellite, together with a net of agro-meteorological stations. This was done in order to quantify the dynamics of the radiation and energy balance components on a large scale during the year 2012 in the Brazilian Pantanal. Firstly, the whole area is considered and, secondly, the sub-regions Barão do Melgaço (BR), Paiaguás (PA), Nhecolândia (NH) are taken to analyze the energy exchanges between their ecosystems and the lower atmosphere. These sub-regions are chosen because they are very much affected by flood events with intense variations in the North-South and East-West directions.

2. Material and Methods

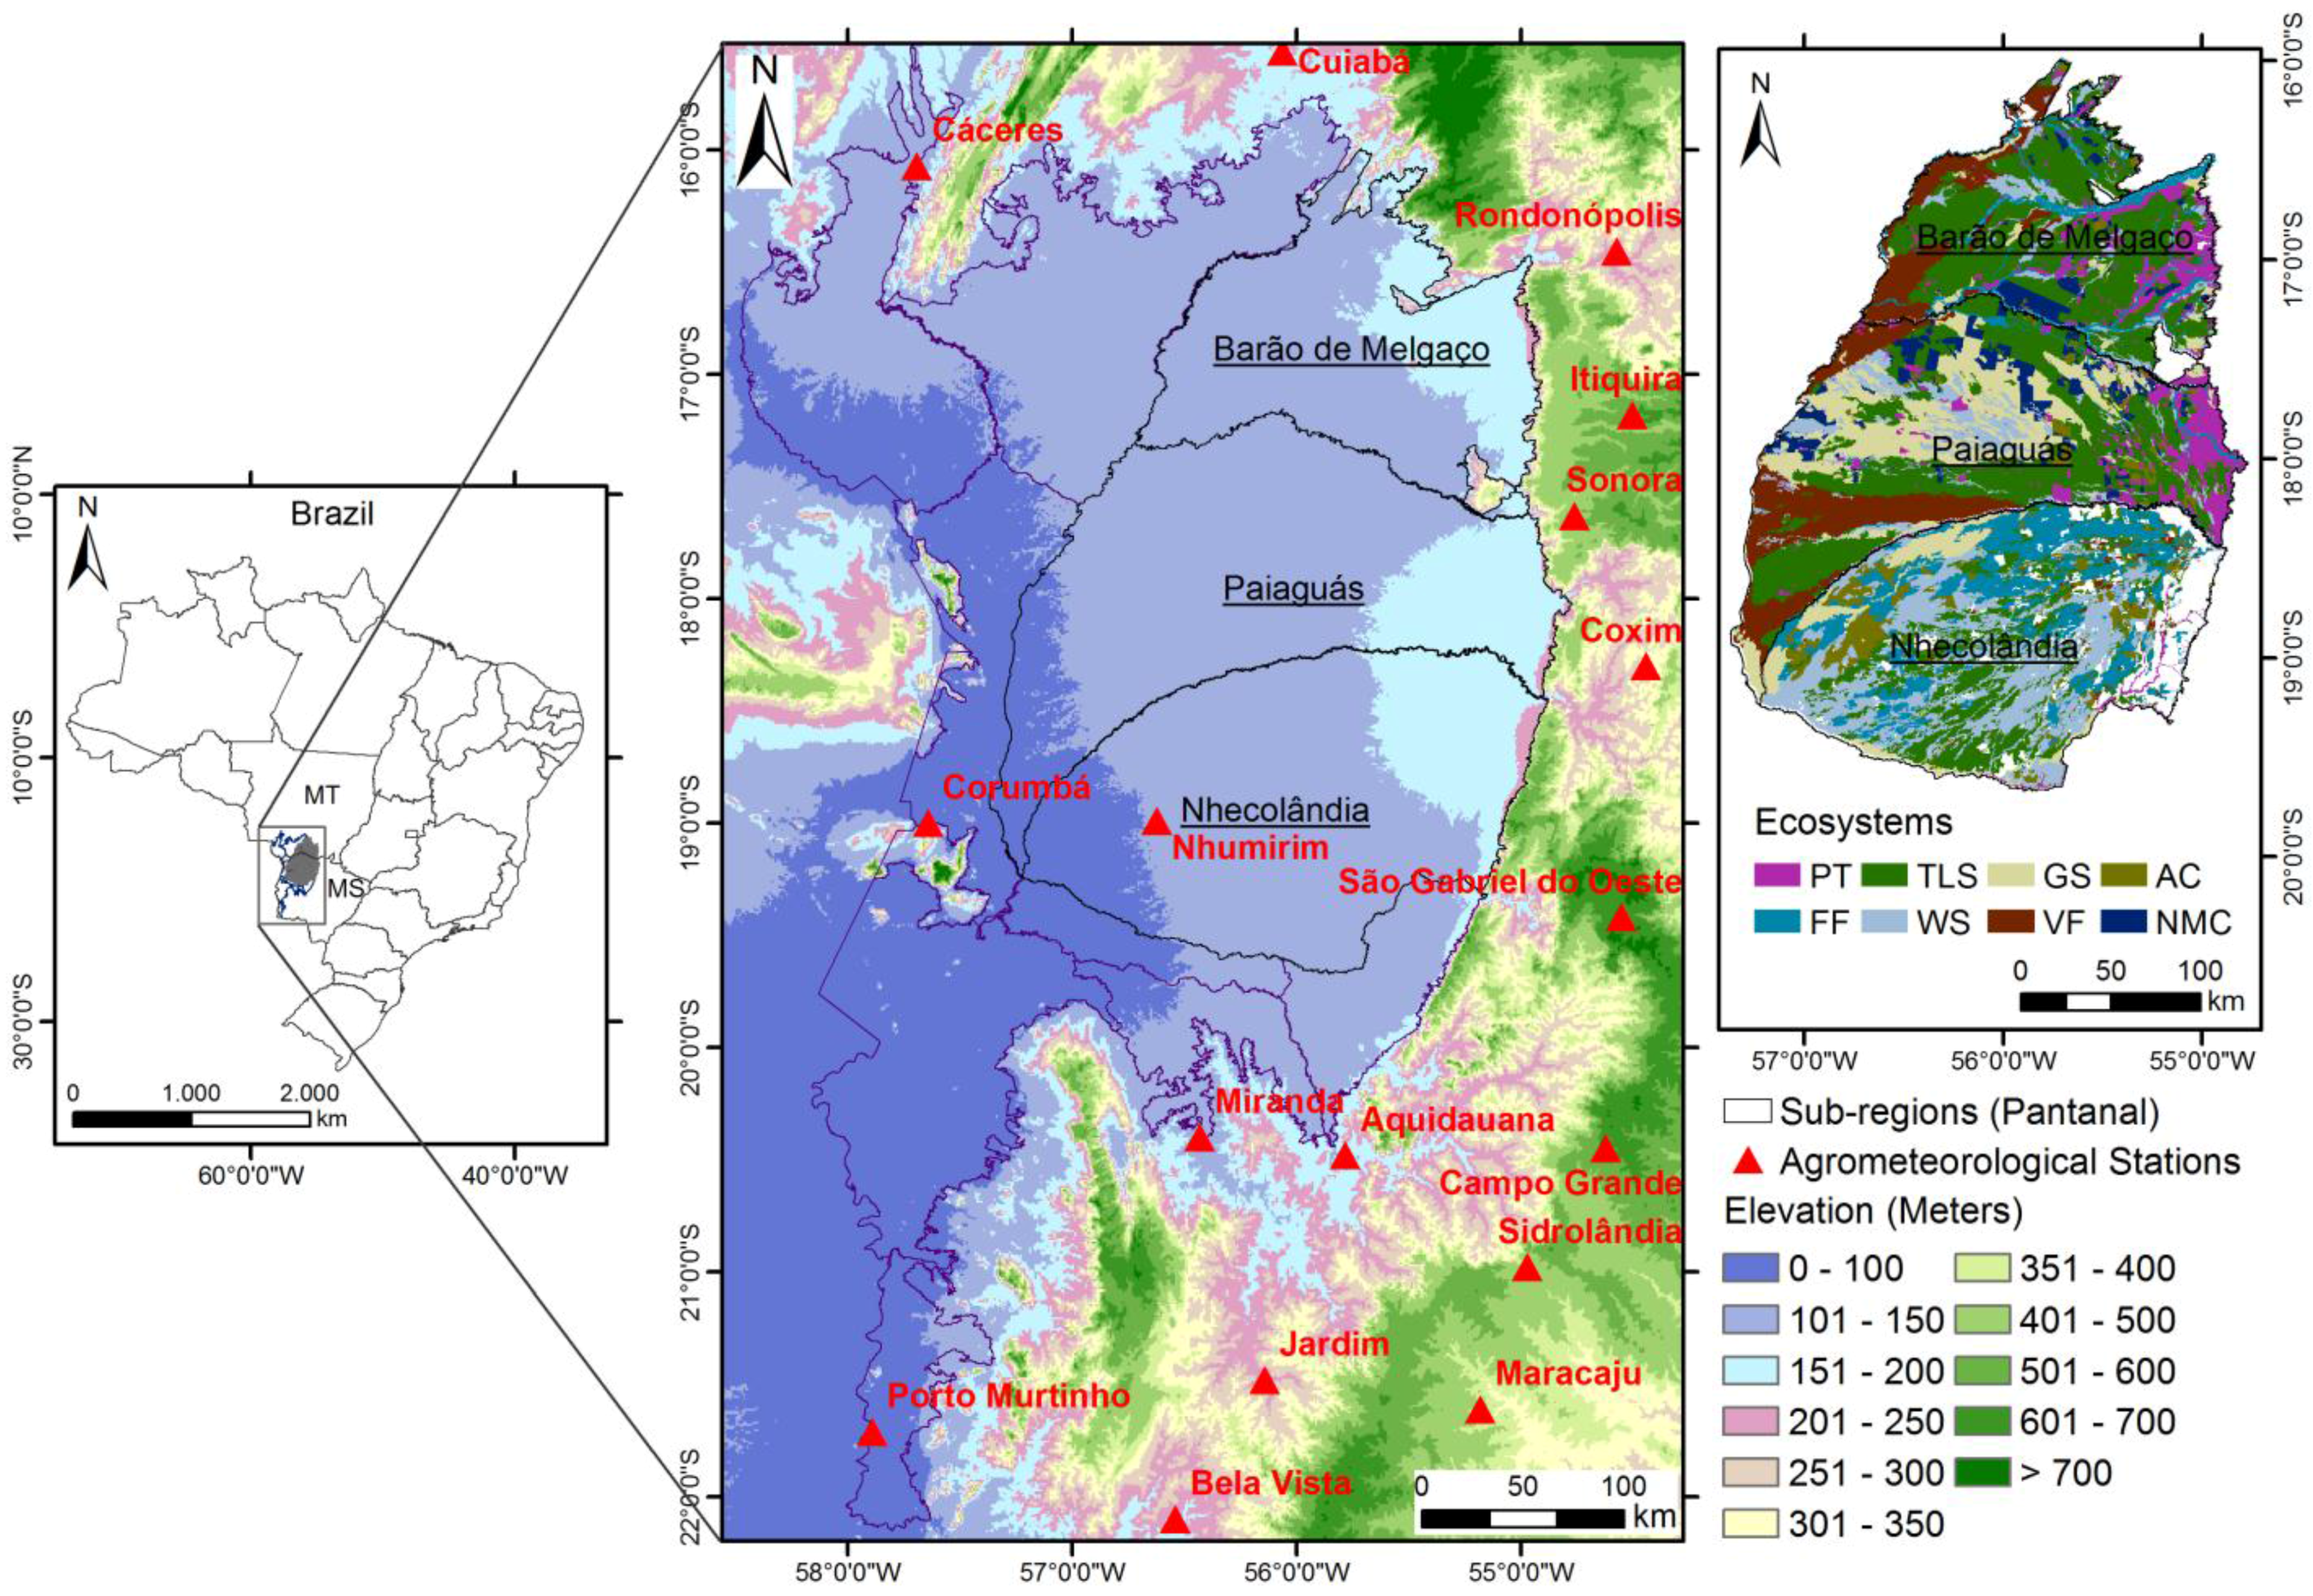
2.1. Brazilian Pantanal Characteristics

Figure 1 shows the location of the Pantanal in the Mato Grosso and Mato Grosso do Sul Brazilian states, the agro-meteorological stations used from the National Meteorological Institute (INMET) and the ecosystems inside the Barão de Melgaço (BR), Nhecolândia (NH) and Paiaguás (PA) sub-regions classifyed according to Embrapa Pantanal, SOS Pantanal Institute, WWF-Brazil [5].
Figure 1. Location of the Pantanal in the Mato Grosso (MT) and Mato Grosso do Sul states (MS), Brazil, the agrometeorological stations and the ecosystems inside the Barão de Melgaço (BR), Nhecolândia (NH) and Paiaguás (PA) sub-regions. PT: Pasture; FF: Forest Formations; TLS: Tree-Lined Savanna; WS: Woody Savanna; GS: Grassy Savanna; FV: Fluvial Influenced Vegetation; AC: Anthropogenic Changes; NMC: Natural/Management Changes.
Remotesensing 07 14597 g001
The Brazilian Pantanal is located in the Alto Paraguay river basin, in the central-western part of South America, with latitudes ranging between 14°–22°N and 53°–59°S. The climate is hot and humid during the summer, and dry in winter. Daily air temperature varies according to topography, on an annual time-scale, at around 26 °C in the low-altitude areas, and 23 °C in the few plateaus. Rainfall totals are, on average, 1500 mm·yr−1. Soils are mostly sandy, supporting mainly native pastures and/or introduced ones.
The region is mostly an alluvial plain influenced by the rivers that drain the basin, comprising of four major biomes: Amazon, Cerrado, Chaco and Atlantic Forest. Eleven sub-regions are identified, each one with its own soil, vegetation and microclimate characteristics: Cáceres, Poconé, Barão de Melgaço, Paraguay, Paiaguás, Nhecolândia, Abobral, Aquidauana, Miranda, Nabileque and Porto Murtinho [5].
Following the Embrapa Pantanal, SOS Pantanal Institute, WWF-Brazil [5] land classification, the ecosystems considered for the large-scale energy partition analyses inside the BR, NH and PA sub-regions were Pasture (PT), Forest Formations (FF), Tree-Lined Savanna (TLS), Woody Savanna (WS), Grassy Savanna (GS), Fluvial Influenced Vegetation (FV), Anthropogenic Changes (AC) and Natural/Management Changes (NMC).

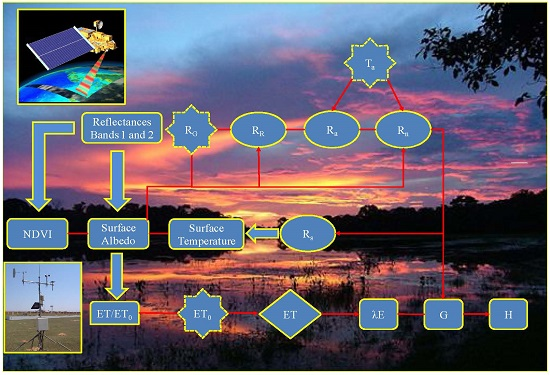
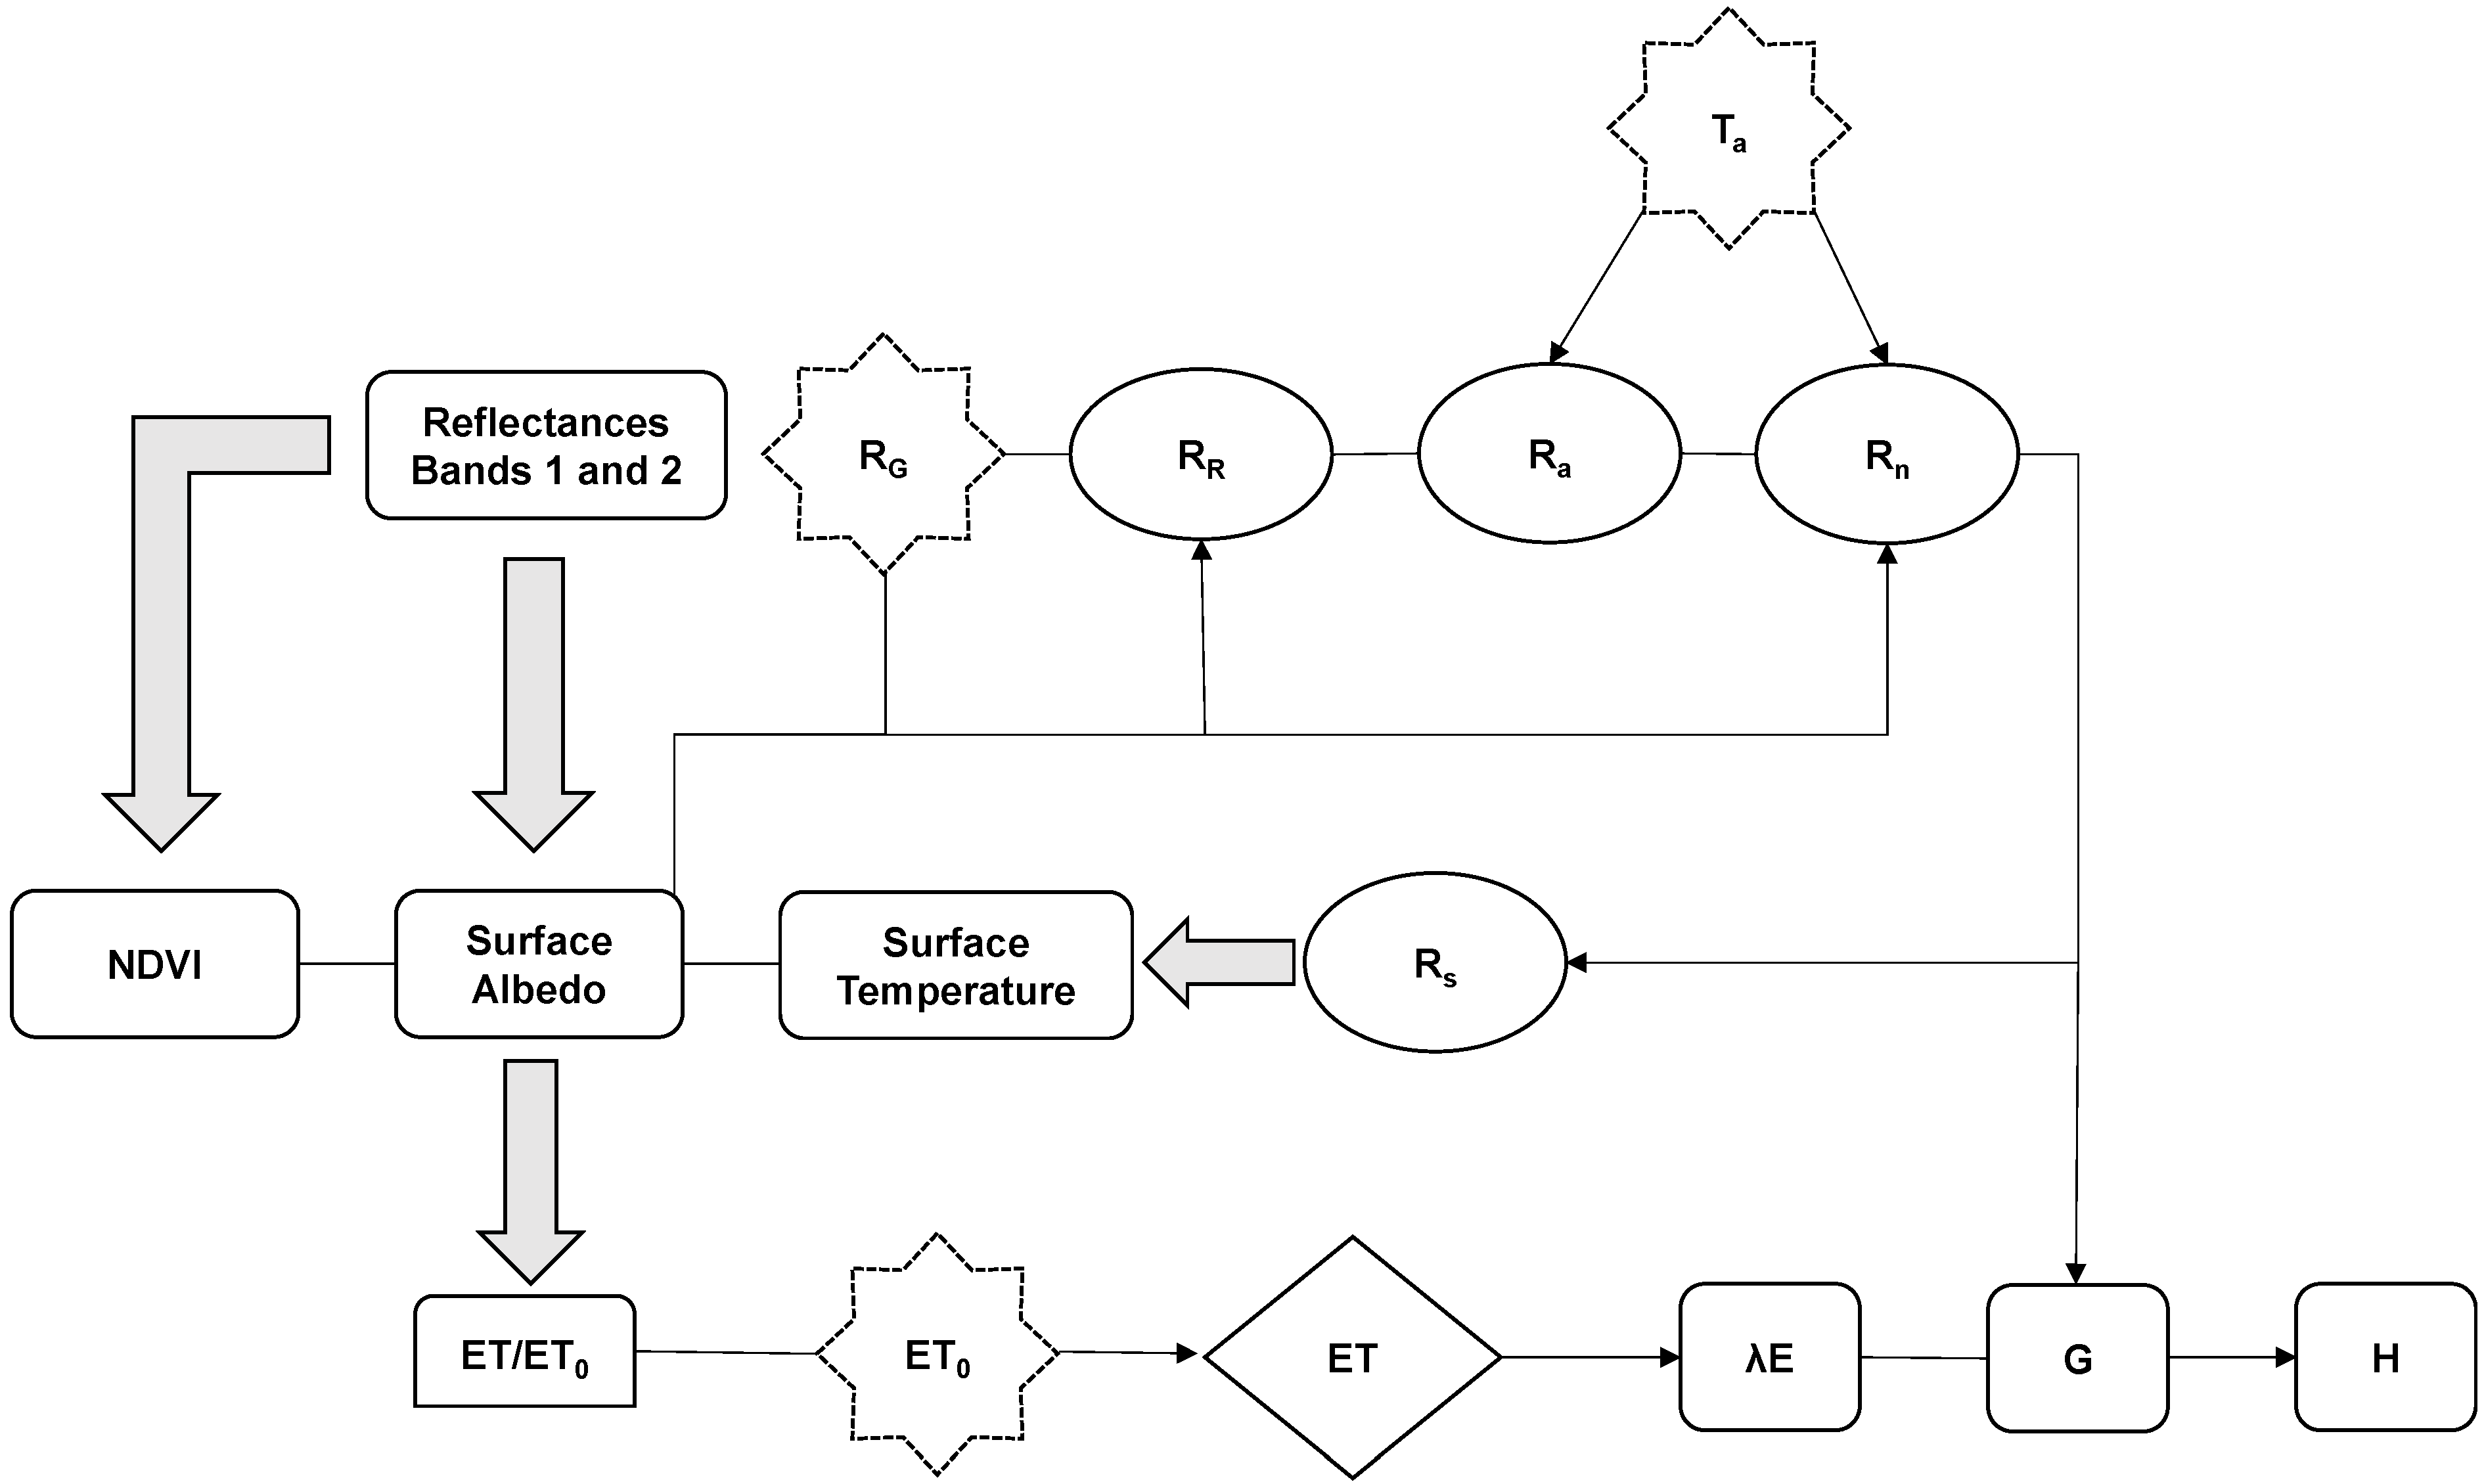
2.2. Modelling the Large-Scale Radiation and Energy Balance Components

The weather data inputs were from 20 agrometeorological stations (red triangle in Figure 1) from the National Meteorological Institute (INMET). Incident global solar radiation (RG), air temperature (Ta), relative humidity (RH) and wind speed (u) were used to calculate ET0 by the Penman-Monteith method [11]. RG, Ta and ET0 were averaged for the 16-day composing periods of the MODIS reflectance products (spatial resolution of 250 m) and interpolated by using the moving average method creating grids with the same spatial resolution of the satellite images.
This upscaling process was done to have grids representing the average weather conditions for the time-scale of the satellite composing images, making the SAFER algorithm operationally suitable for the whole year. A similar up-scaling process was done by Cleugh et al. [10] to monitor large-scale evapotranspiration in Australia. The surface temperature product was not used because with a lower spatial resolution (1 km), there was too much cloud contamination during the year for the whole Pantanal area. Instead, the surface temperature (TS) was retrieved by residue in the radiation balance.
Cleugh et al. [10] pointed out that the use of instantaneous measurements of the radiometric surface temperature to calculate time-averaged fluxes led to errors. They emphasized uncertainties in models which use the MODIS 8-day that is a composite of once-daily overpass at ~ 10:30 h local time. In this case, the radiometric temperature is determined under a view angle at the satellite overpass time, using emissivities based on vegetation classes using a 1-km grid that differs from that of the MODIS pixel location.
Figure 2 shows the flowchart of the steps for modelling the radiation and energy balances throughout SAFER application to MODIS images without the thermal band.
Figure 2. Flow-chart for the radiation and energy balances components throughout application of the SAFER (Simple Algorithm for Evapotranspiration Retrieving) algorithm to MODIS images without their thermal bands.
Remotesensing 07 14597 g002
The parameterizations involved in Figure 2 were done in Brazil with simultaneous satellite and field measurements, under strong contrasting agro-ecosystems and thermohydrological conditions throughout different years [12,31]. In addition, acquiring TS as residue in the radiation balance gives mutual compensation, reducing possible errors in this model input parameter, and as in the upward and downward longwave fluxes, they are self-canceling. Moreover, a correction factor is applied to ET/ET0 ratio to take into account the atmospheric demand for the current study, in relation to the original modeling conditions.
SAFER model was elaborated and validated with Landsat images [29], when it was called PM2. Later, it was also calibrated and validated with MODIS images in the same original modelling study region [32]. Field data used for these validations involved irrigated crops and natural vegetation (Caatinga) from 2001–2007, being described in detail in Teixeira et al. [31]. Table grapes were drip irrigated and conducted by an overhead trellis system. Wine grapes conducted by a vertical trellis system and mango orchard were micro sprinkler irrigated. The experimental period for Caatinga involved different species and rainfall conditions above and below the local long-term value. Thus, with all these strongly contrasting conditions and the consistency assessments in the current paper, one expects sufficient accuracy to obtain the input parameters to achieve dynamic analyses of the radiation and energy balances for the different ecosystems inside the Brazilian Pantanal.
According to Figure 2, the reflectances for the bands 1 (α1) and 2 (α2) were extracted from the MOD13Q1 product, which provides cloud-free temporal composed images, at 16-day periods, totalling 23 images for each band in the year 2012.
For the surface albedo (α0) calculation, the following equation was applied [33]:
α 0 = a + b α 1 + c α 2
where a, b and c are regression coefficients, considered as 0.08, 0.41, 0.14, obtained with different Brazilian vegetation types and thermohydrological conditions [12,32].
Surface temperature (TS) was estimated as a residual in the daily radiation balance [34,35]:
T S = R G α 0 R G + ε A σ T a 4 R n ε S σ 4
where RG and Ta are, respectively, the daily values of incident global solar radiation and air average temperature measured at the agro-meteorological stations; Rn is the daily net radiation; ɛA and ɛS are respectively the atmospheric and surface emissivities; and σ is the Stefan-Boltzmann constant (5.67 × 10⁻⁸ W·m−2·K−4).
The radiation balance parameters ɛA and ɛS were calculated as follows [12,29,34,35]:
ε A = a A ( ln τ ) b A
ε S = a S ln NDVI + b S
where τ is the short-wave atmospheric transmissivity calculated as the ratio of RG to the incident solar radiation at the top of the atmosphere; NDVI is the Normalized Difference Vegetation Index; and aA, bA, aS and bS are regression coefficients 0.94, 0.10, 0.06 and 1.00, respectively.
The regression coefficients of Equation (3) in the current study are between those obtained for Idaho (aA = 0.85 and bA = 0.09; [36]) and for Egypt (aA = 1.08 and bA = 0.26; [21]). The original coefficients of Equation (4) are aS = 0.047 and bS = 1.009 [21], being slightly different from those for Brazil. However, even with these small differences under contrasting environmental conditions, estimate errors for these emissivities in the Brazilian Pantanal are self-cancelled in the accounting of the upward and downward radiation balance components.
NDVI is an indicator related to the land cover obtained from the MODIS images as follows:
NDVI = α 2 α 1 α 2 + α 1
where and α1 and α2 represent the reflectances over the ranges of wavelengths in the near infrared (NIR) and red (RED) regions of the solar spectrum, respectively.
The long-wave atmospheric radiation (RLa) was calculated by applying the Stefan-Boltzmann low:
R L a = σ ε A T a 4
Rn was obtained through the equation of Slob [12,34,35]:
R n = ( 1 α 0 ) R G a L τ
where the regression coefficient aL was spatially distributed through its relationship with Ta:
a L = c T a d
and c and d are regression coefficients found to be 6.99 and 39.93 [24,31]. A constant value of aL = 110 was applied by [21] without considering the thermal spatial differences.
Having estimated the reflected solar radiation (RR) as the product of RG by α0, the surface long-wave radiation (RLs) was acquired as residue in the radiation balance equation:
R R = α 0 R G
R L s = R G R R + R a R n
With the SAFER algorithm, the ratio of actual (ET) to the reference (ET0) evapotranspiration was modelled at the satellite overpass time [12]:
ET E T 0 mod el = { exp [ a sf + b sf ( T S α 0 NDVI ) ] } E T 0 year 5
where asf and bsf are the regression coefficients 1.8 and −0.008 [12], respectively. The correction factor (ET0year/5) was applied for calibration, being ET0year the Pantanal’s daily ET0 grid for 2012, and 5 mm·d−1 is the corresponding annual value during the original modelling [34]. Teixeira [29] has demonstrated that there are no significant differences between the daily and satellite overpass values of the ET/ET0 ratio.
The daily grids of ET0 from the agrometeorological station (red triangles in Figure 1) were multiplied by the images as given in Equation (11), giving the large-scale daily ET pixel values [12]:
ET = ( ET E T 0 model ) E T 0
Equation (11) did not work for water bodies, i.e., when NDVI < 0. Thus, as in the Pantanal, sometimes several areas are mixtures of land and water, and because of floods, in the SAFER algorithm, the equilibrium evapotranspiration concept [37] was used under these conditions, and λE retrieved from the conditional functions applied to the NDVI values as:
λ E = s ( R n G ) s + γ
where s is the slope of the curve relating saturation water vapor pressure to air temperature, G is the ground heat flux and γ is the psychometric constant.
Equation (12) is limited only by the available energy, when moisture availability is not constrained [37], being very useful in the Brazilian Pantanal where there are several aquatic and terrestrial mixed ecosystems.
For G, the equation derived by [29] was used:
G R n = a G exp ( b G α 0 )
where aG and bG (3.98; −25.47) are the regression coefficients.
The sensible heat flux (H) was then estimated as residue in the energy balance equation [35]:
H = R n λ E G
As the equations for Rn, λE and G were validated with field measurements under strong moisture and soil cover conditions [31], it is expected that Equation (15) is reliable for H estimations after acquiring all the other energy balance components.
For considerations of the ecosystem moisture conditions, the evaporative fraction (Ef) [12] was taken as:
E f = λ E R n G

3. Results and Discussion

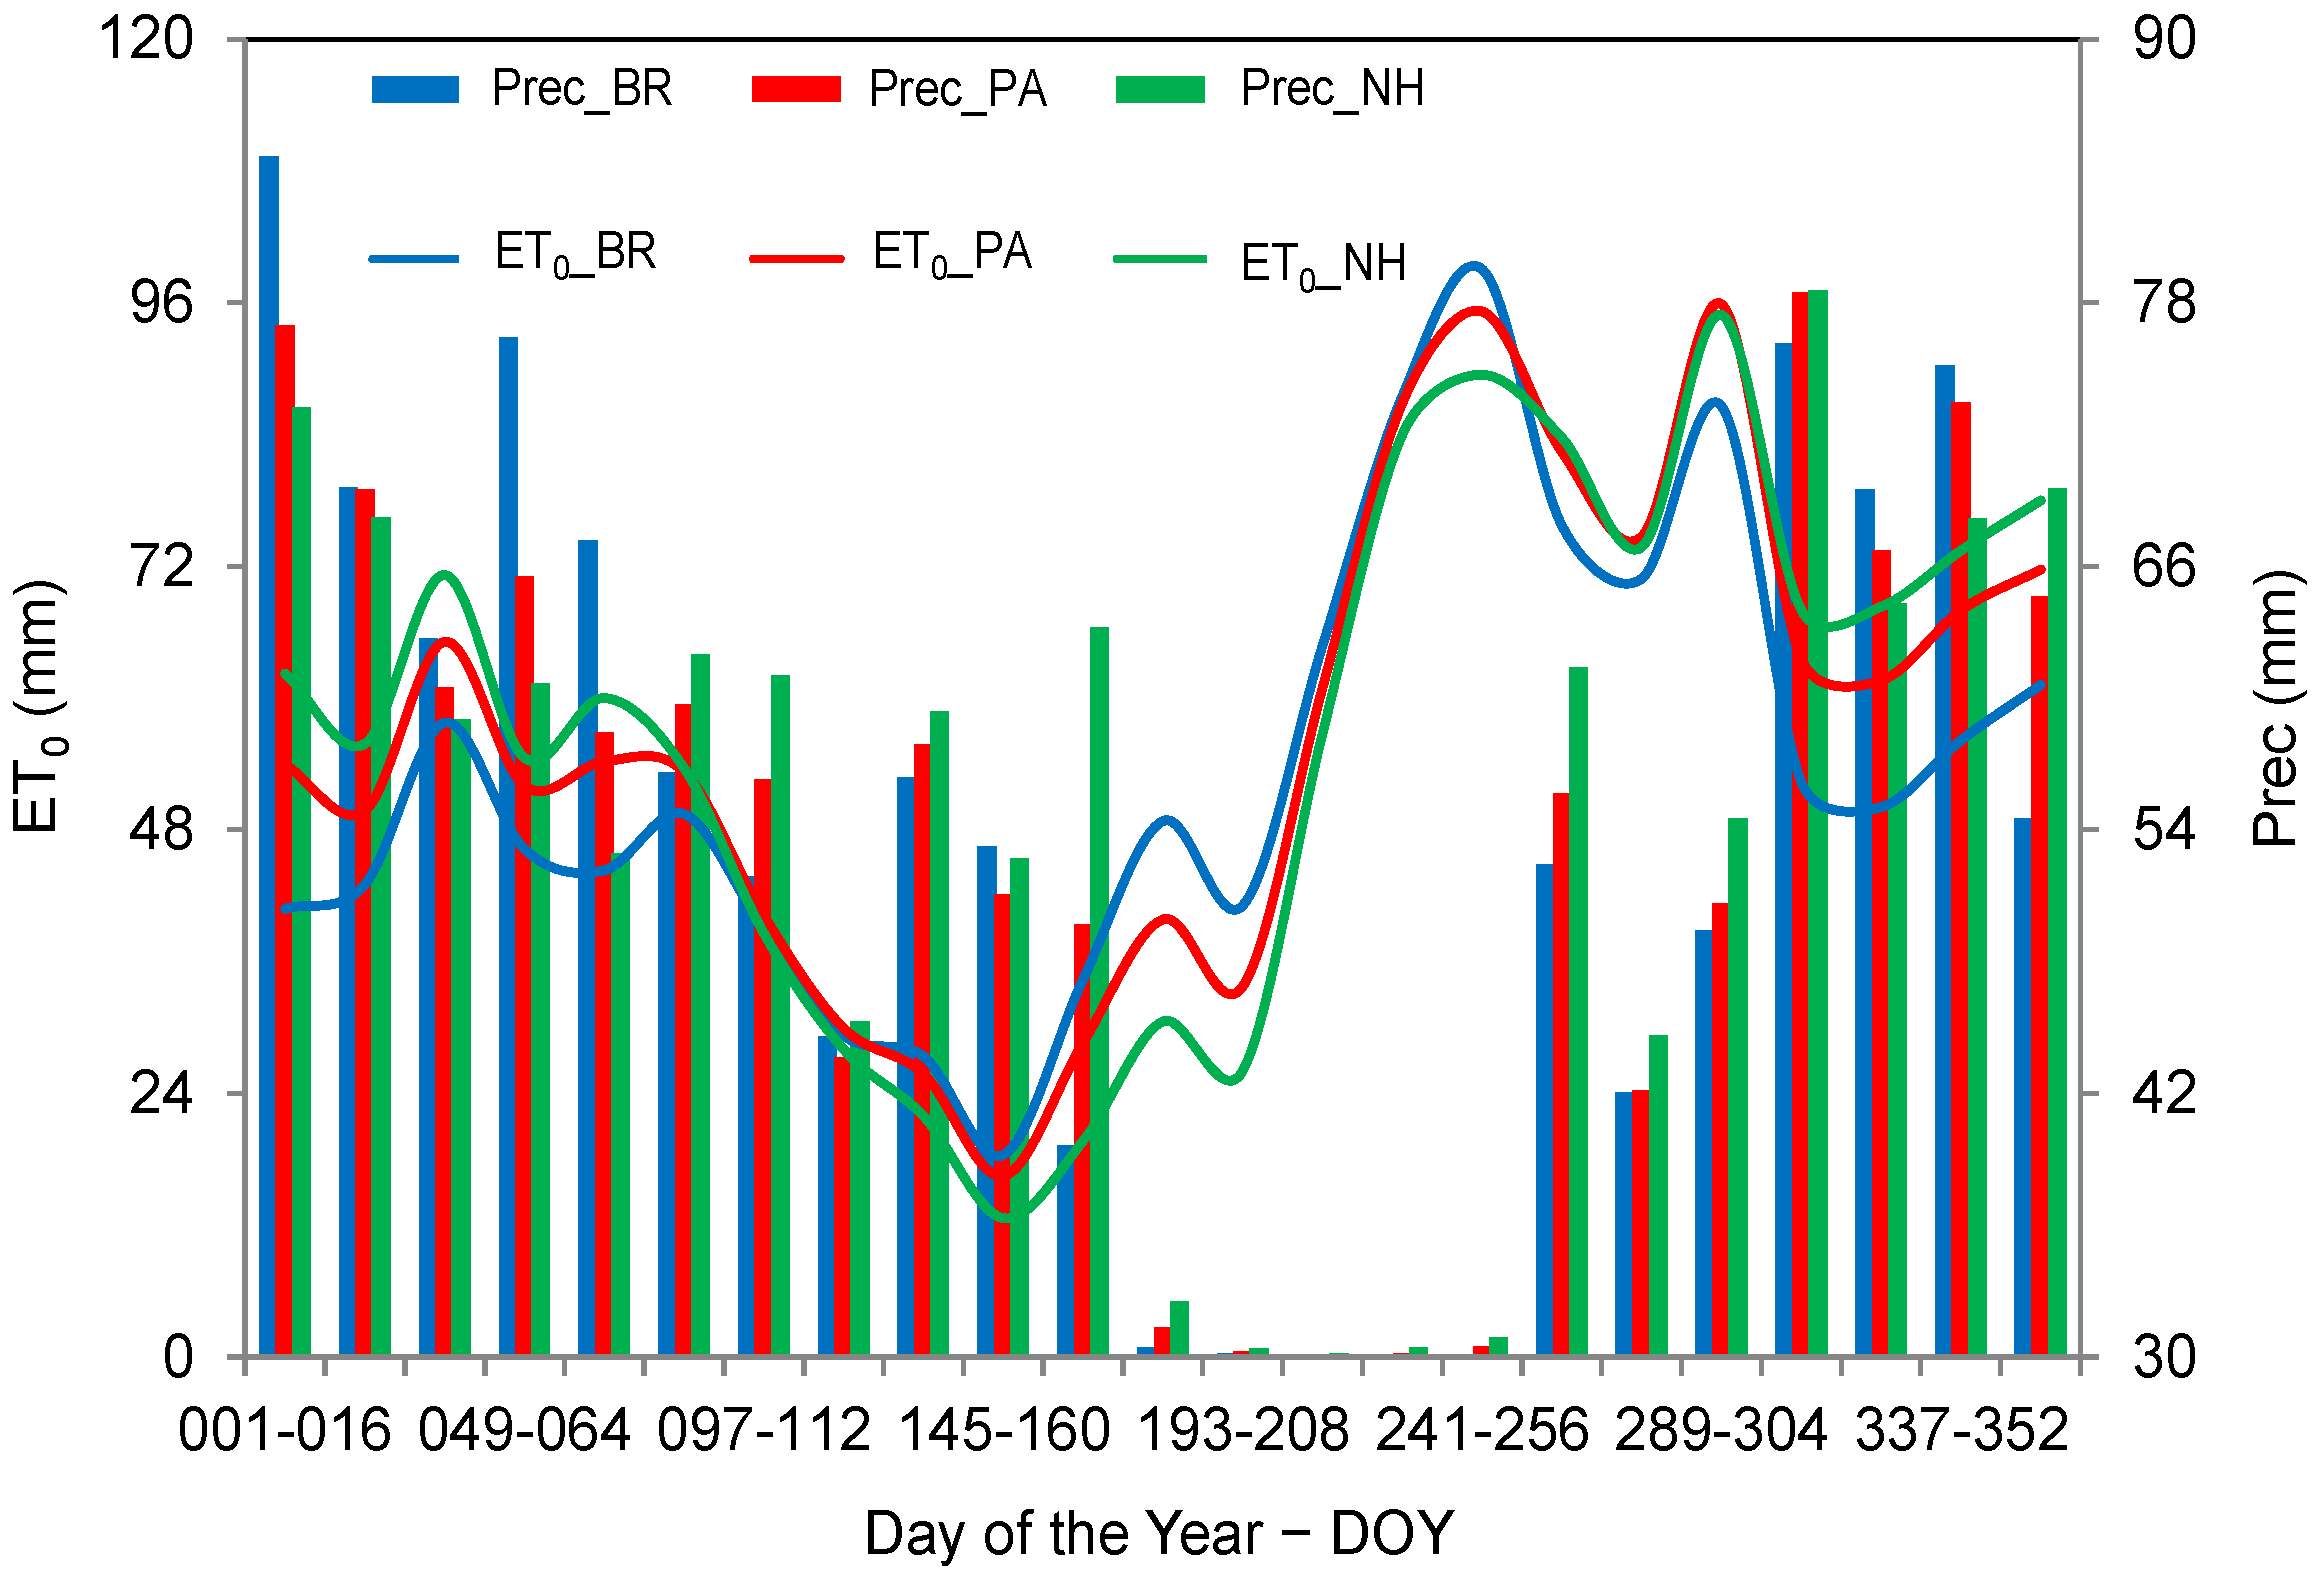
3.1. Weather Drivers

Weather conditions were first analyzed because they affect the radiation and energy balances. Figure 3 presents the trends for the totals of precipitation (Prec) and reference evapotranspiration (ET0) resulting from the interpolation processes. The values are pixel averages for the BR, PA and NH sub-regions during the year 2012, considering the composed 16-day period MODIS images, in terms of Day of the Year (DOY).
Concerning Prec, one can see rainfall concentrations between January and April (DOY 001–096), and from October to December (DOY 305–366). Even after the normal rainy season in the region (end of March), unusual precipitations occurred between DOY 129 and 160, which affected the energy partition at the beginning of the climatically driest period. The NH sub-region presented the highest Prec values, with annual total of 1130 mm·yr−1, whereas BR and PA sub-regions had the smaller ones, around 1085 mm·yr−1.
Figure 3. Climatic water balance for the composed 16-day period MODIS images throughout the year 2012 in the Pantanal sub-regions of Barão de Melgaço (BR), Paiaguás (PA) and Nhecolândia (NH): pixel averages for the totals of precipitation (Prec) and reference evapotranspiration (ET0) were used.
Remotesensing 07 14597 g003
Regarding ET0, significant differences were observed throughout the year in all three Pantanal sub-regions. The period with the lowest atmospheric demand (i.e., lower ET0) coincided with the end of the rainy season. After, there was a continuous increase in the ET0 values, which together with the unusual high Prec, contributed to raising water fluxes at the beginning of the climatically driest period of the year. The BR sub-region presented the lowest atmospheric demand, with ET0 annual value of around 1302 mm·yr−1, while for both PA and NH sub-regions, the annual average was 1342 mm·yr−1. The Prec values represented 81% (PA sub-region) to 84% (BR and NH sub-regions) of the ET0 ones.

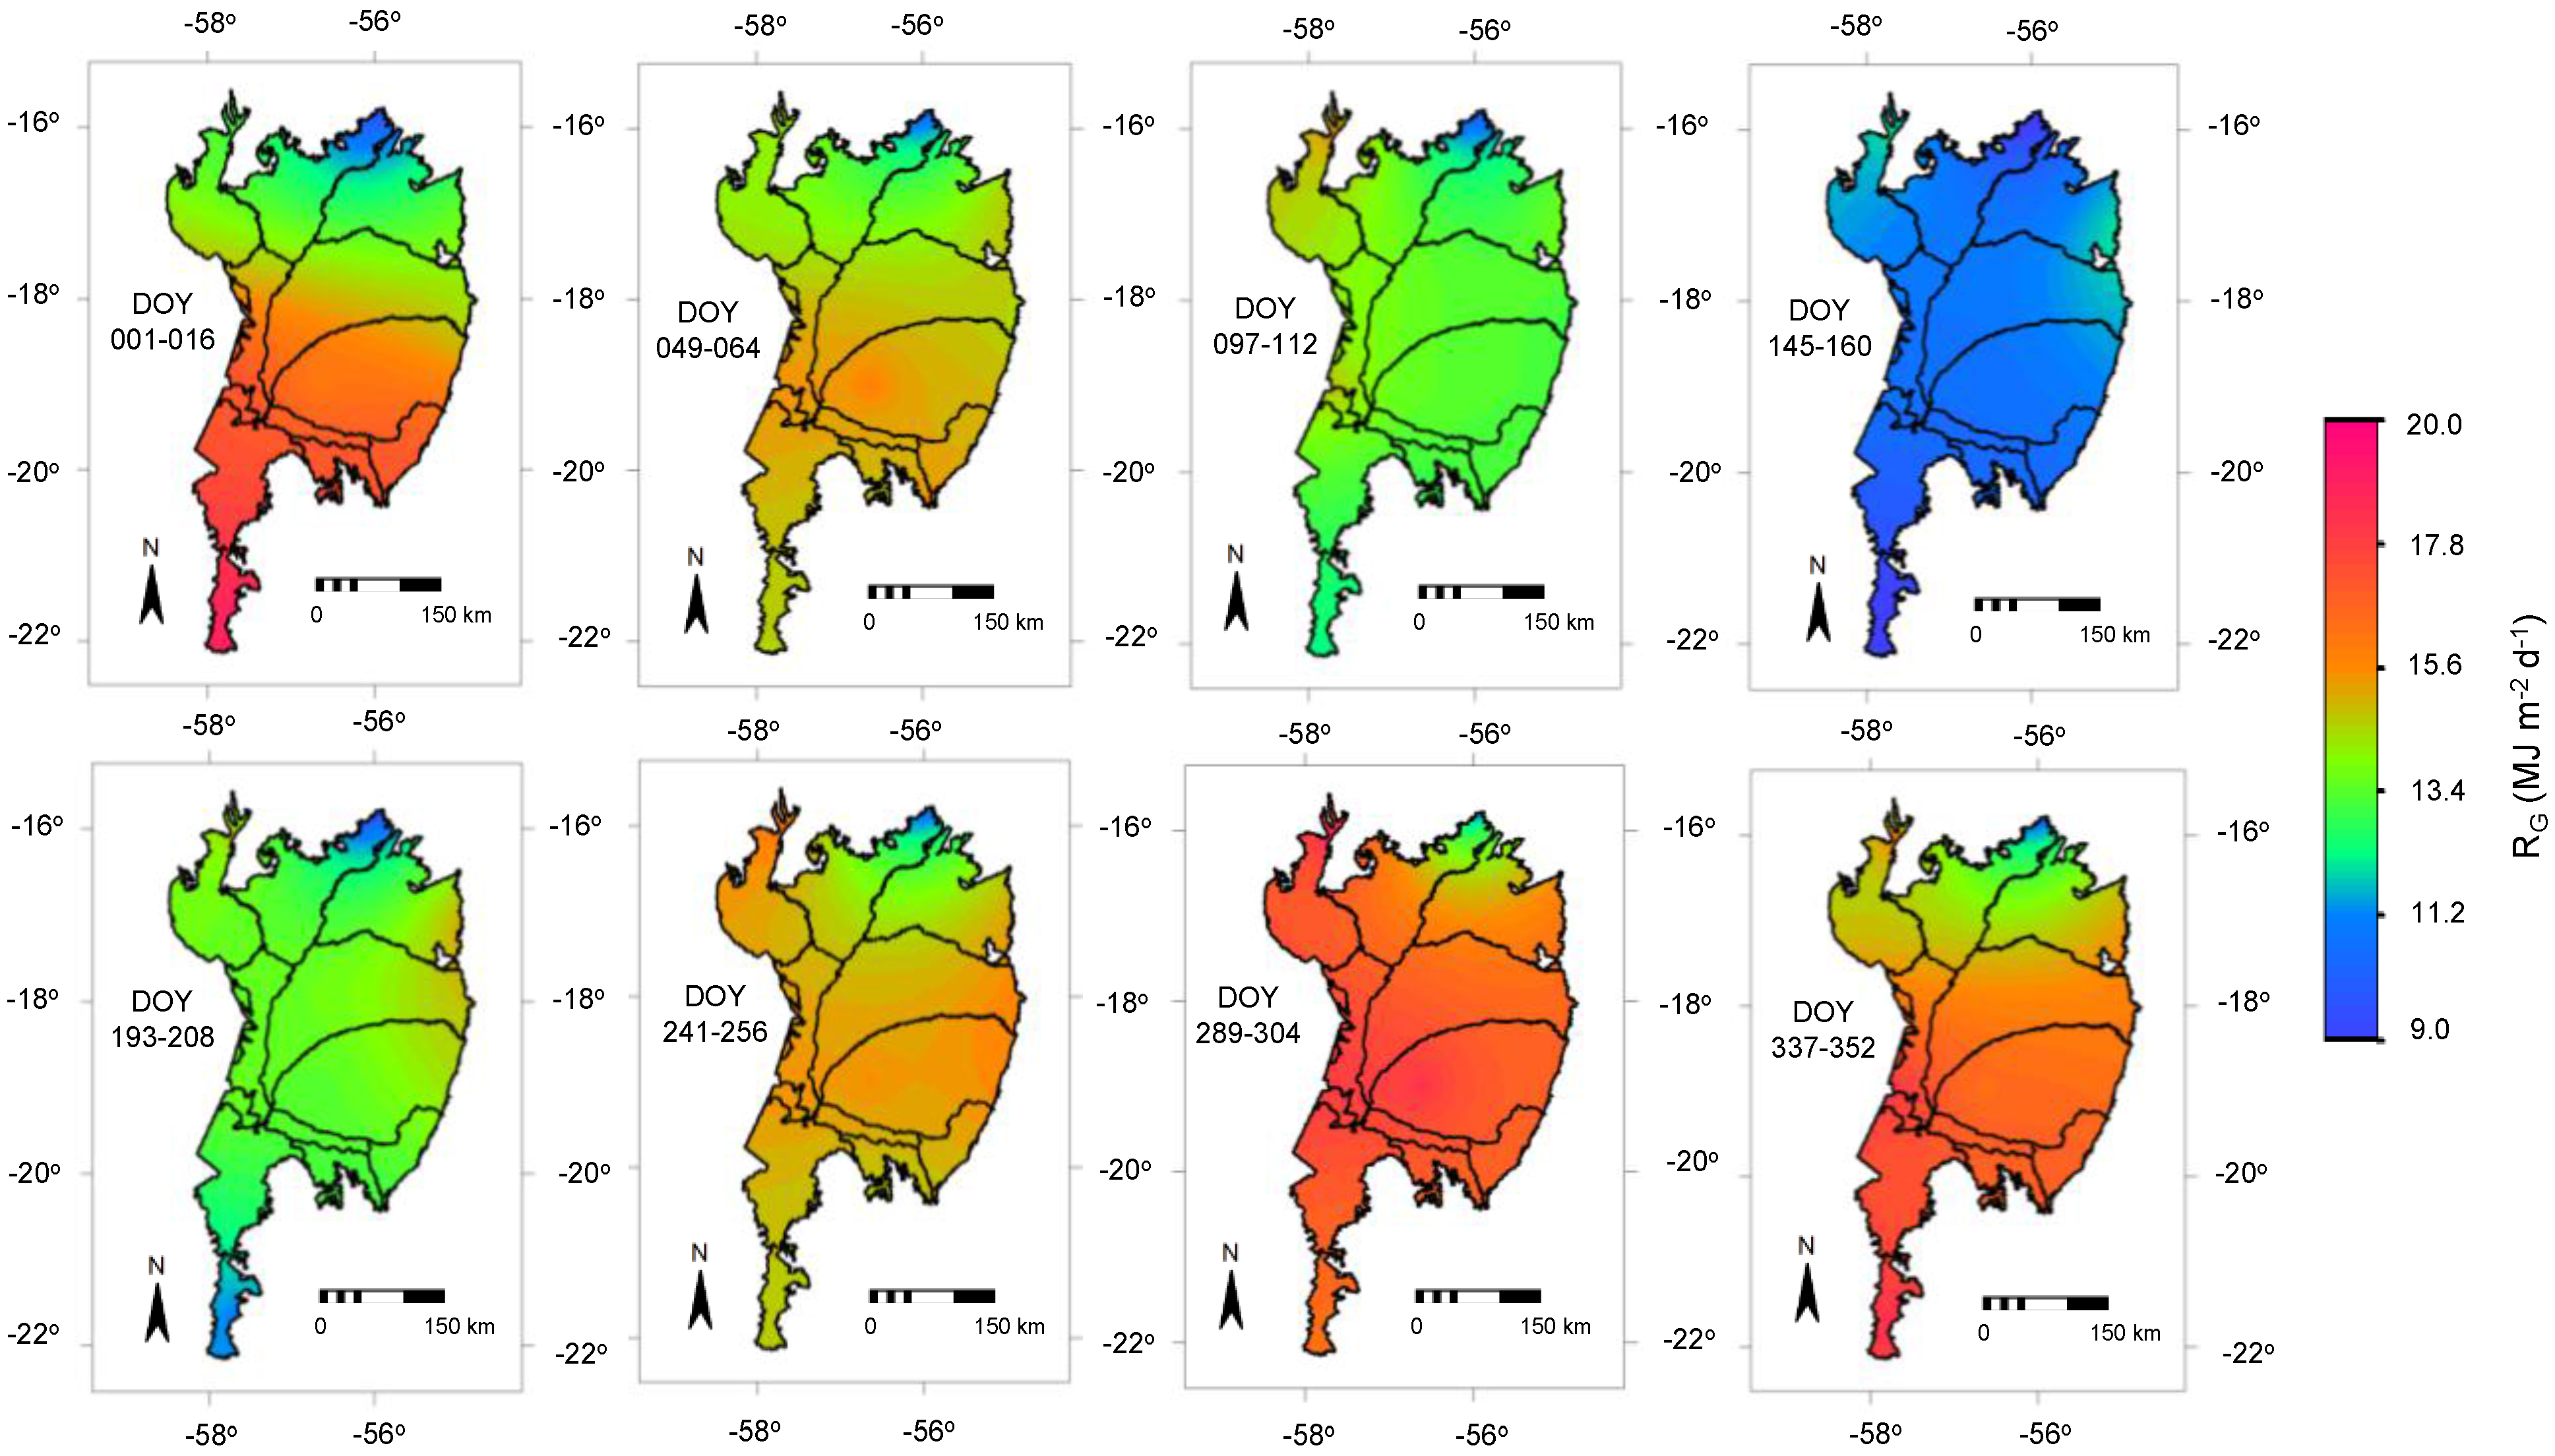
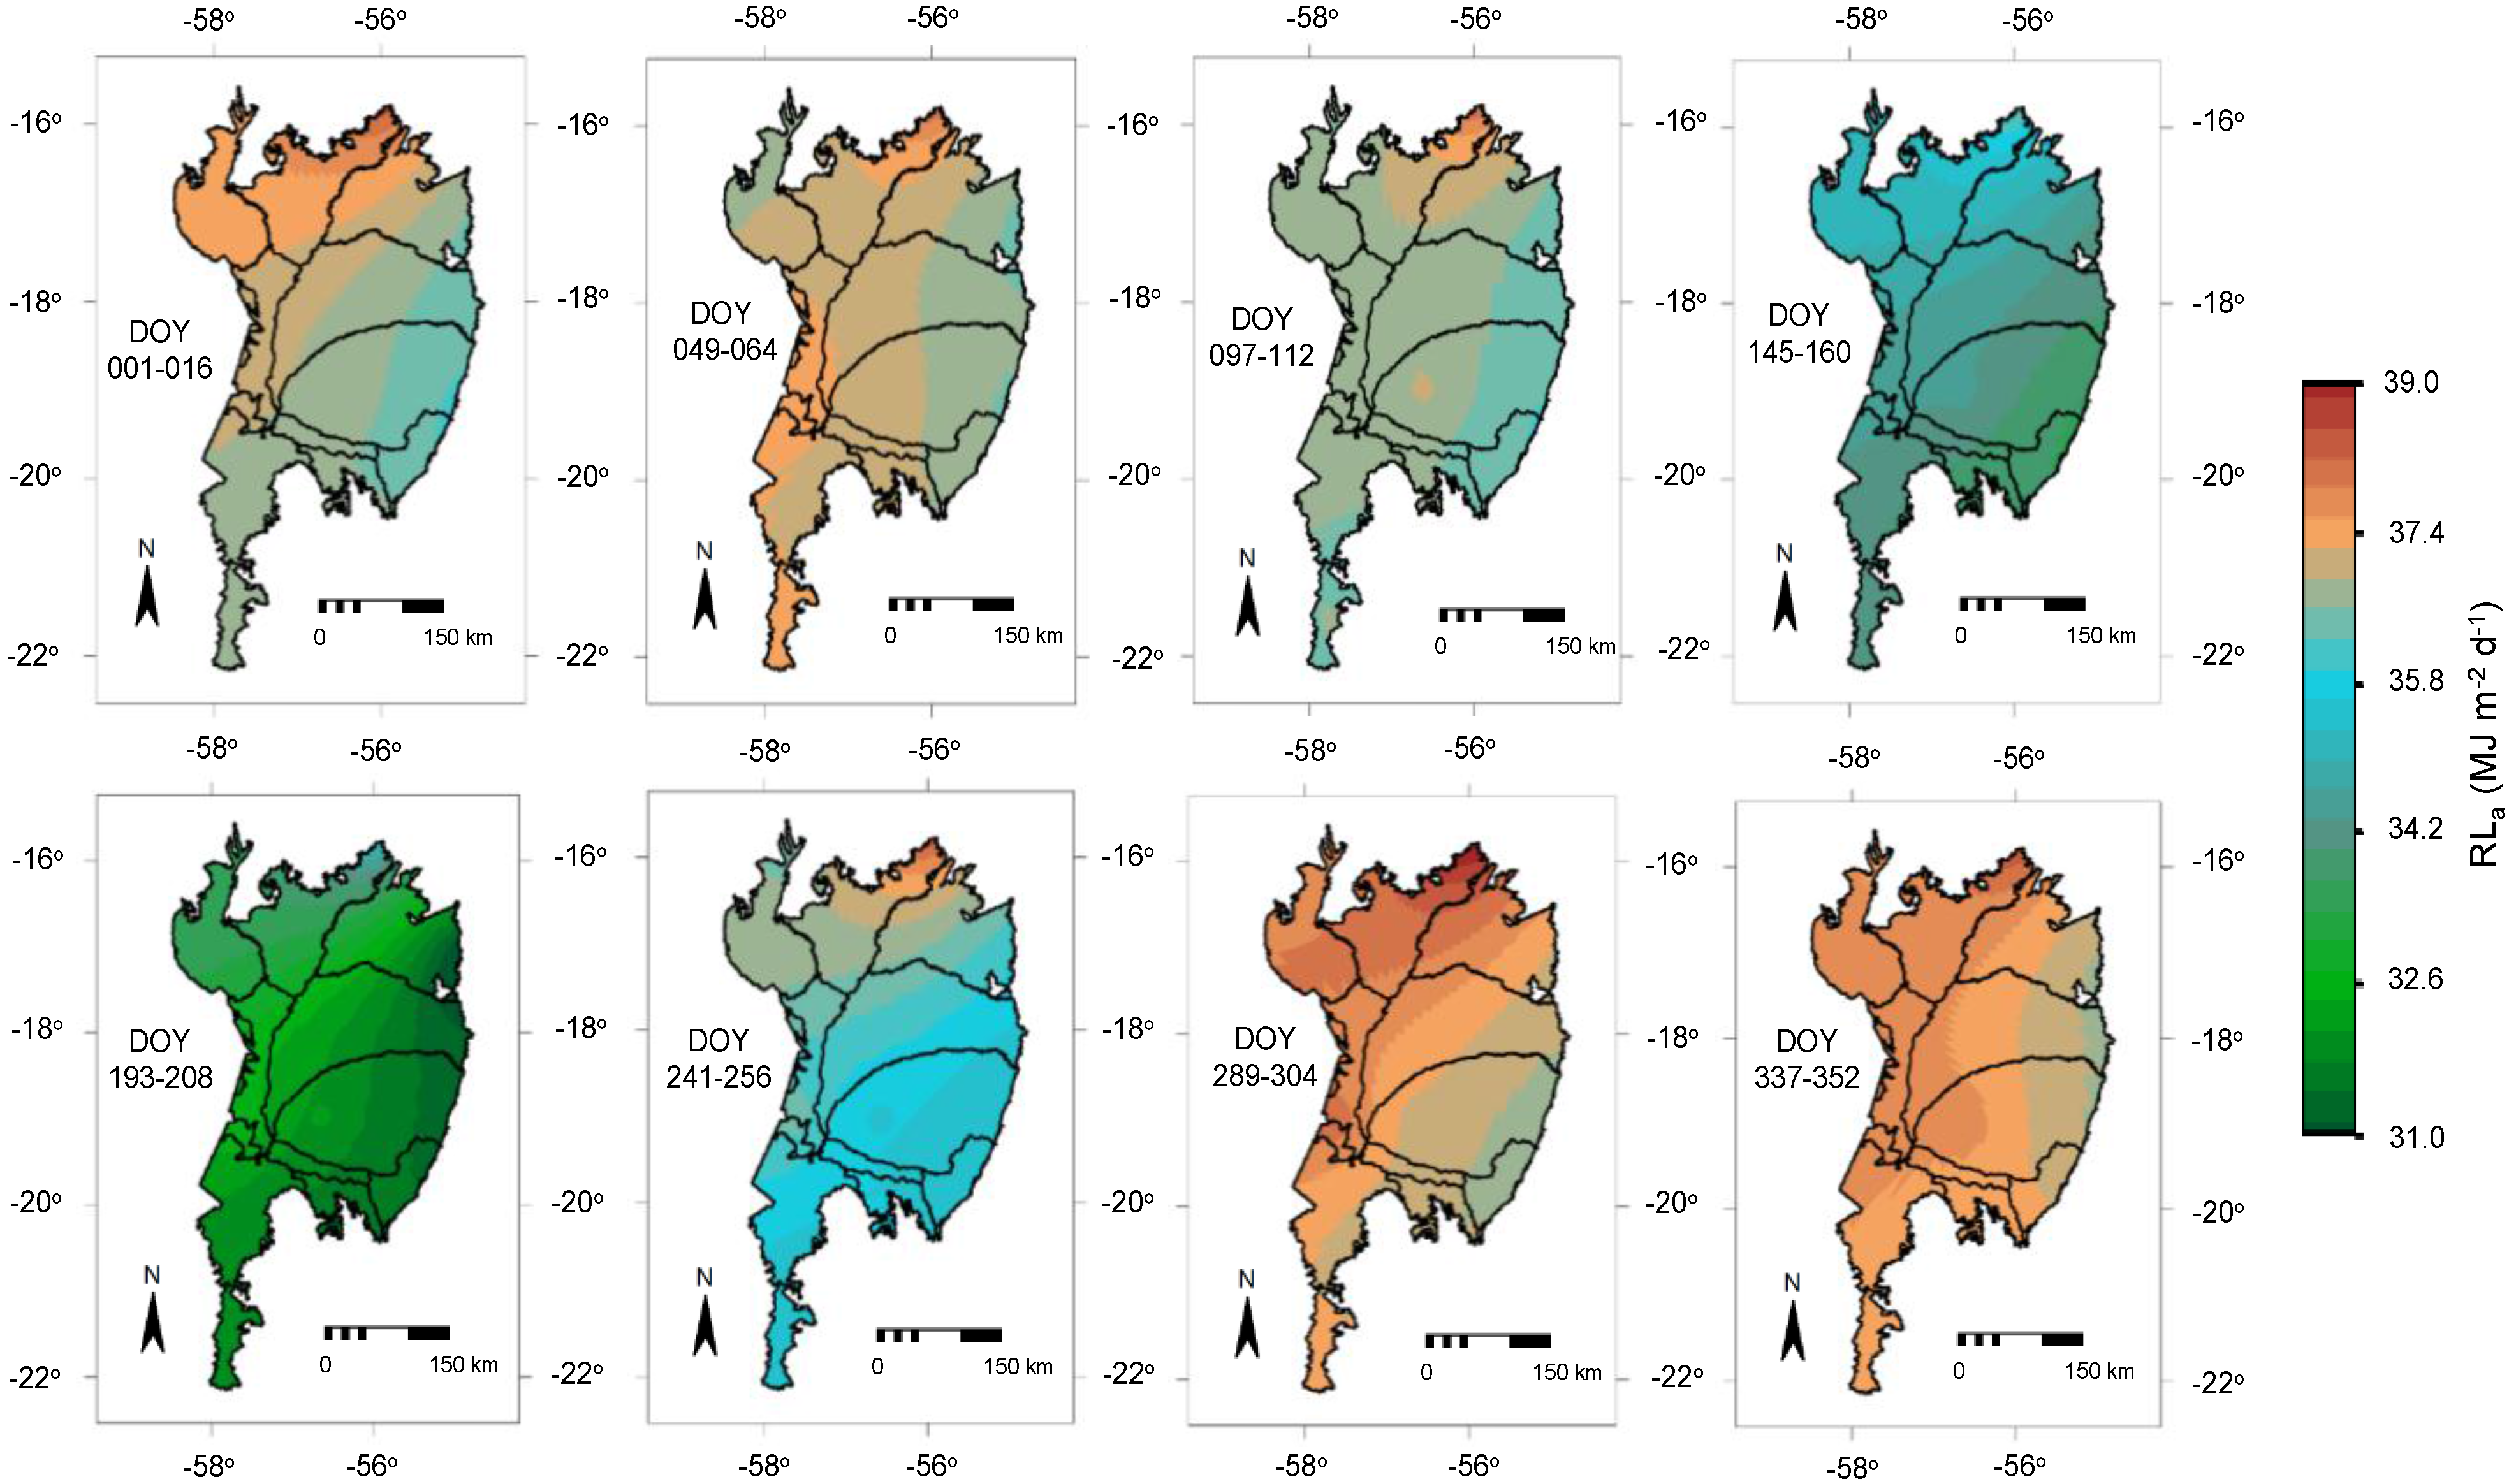
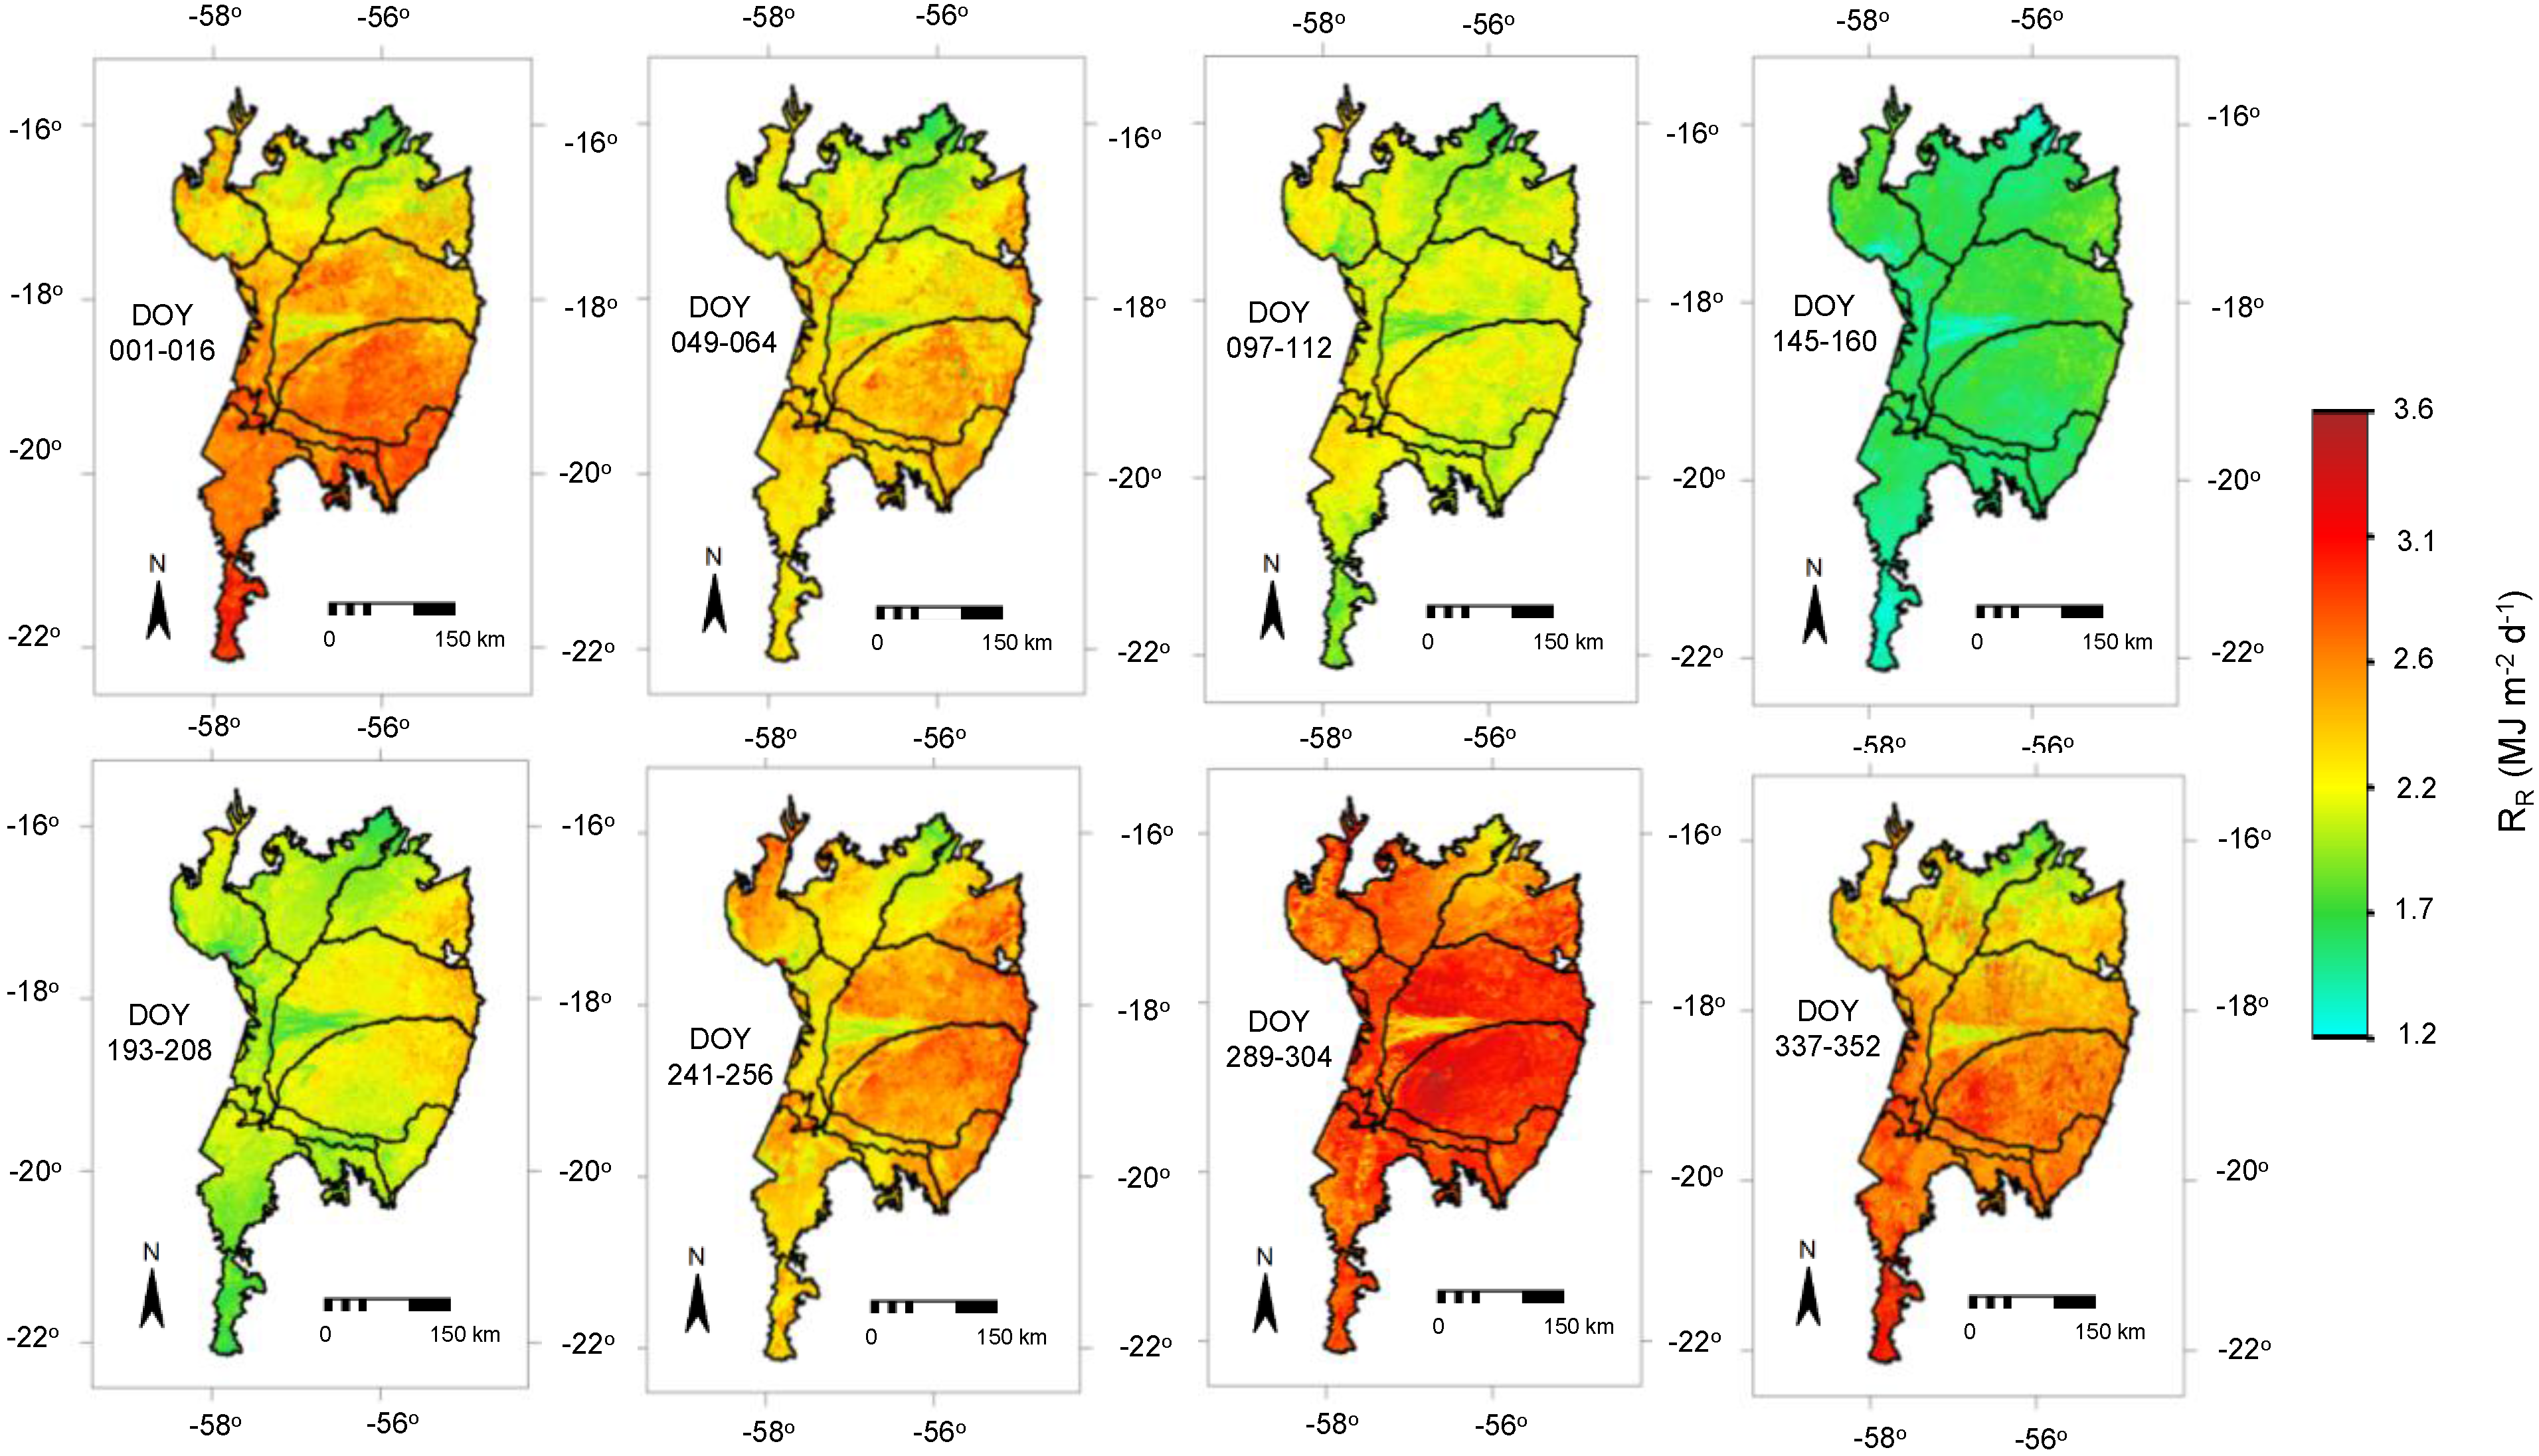
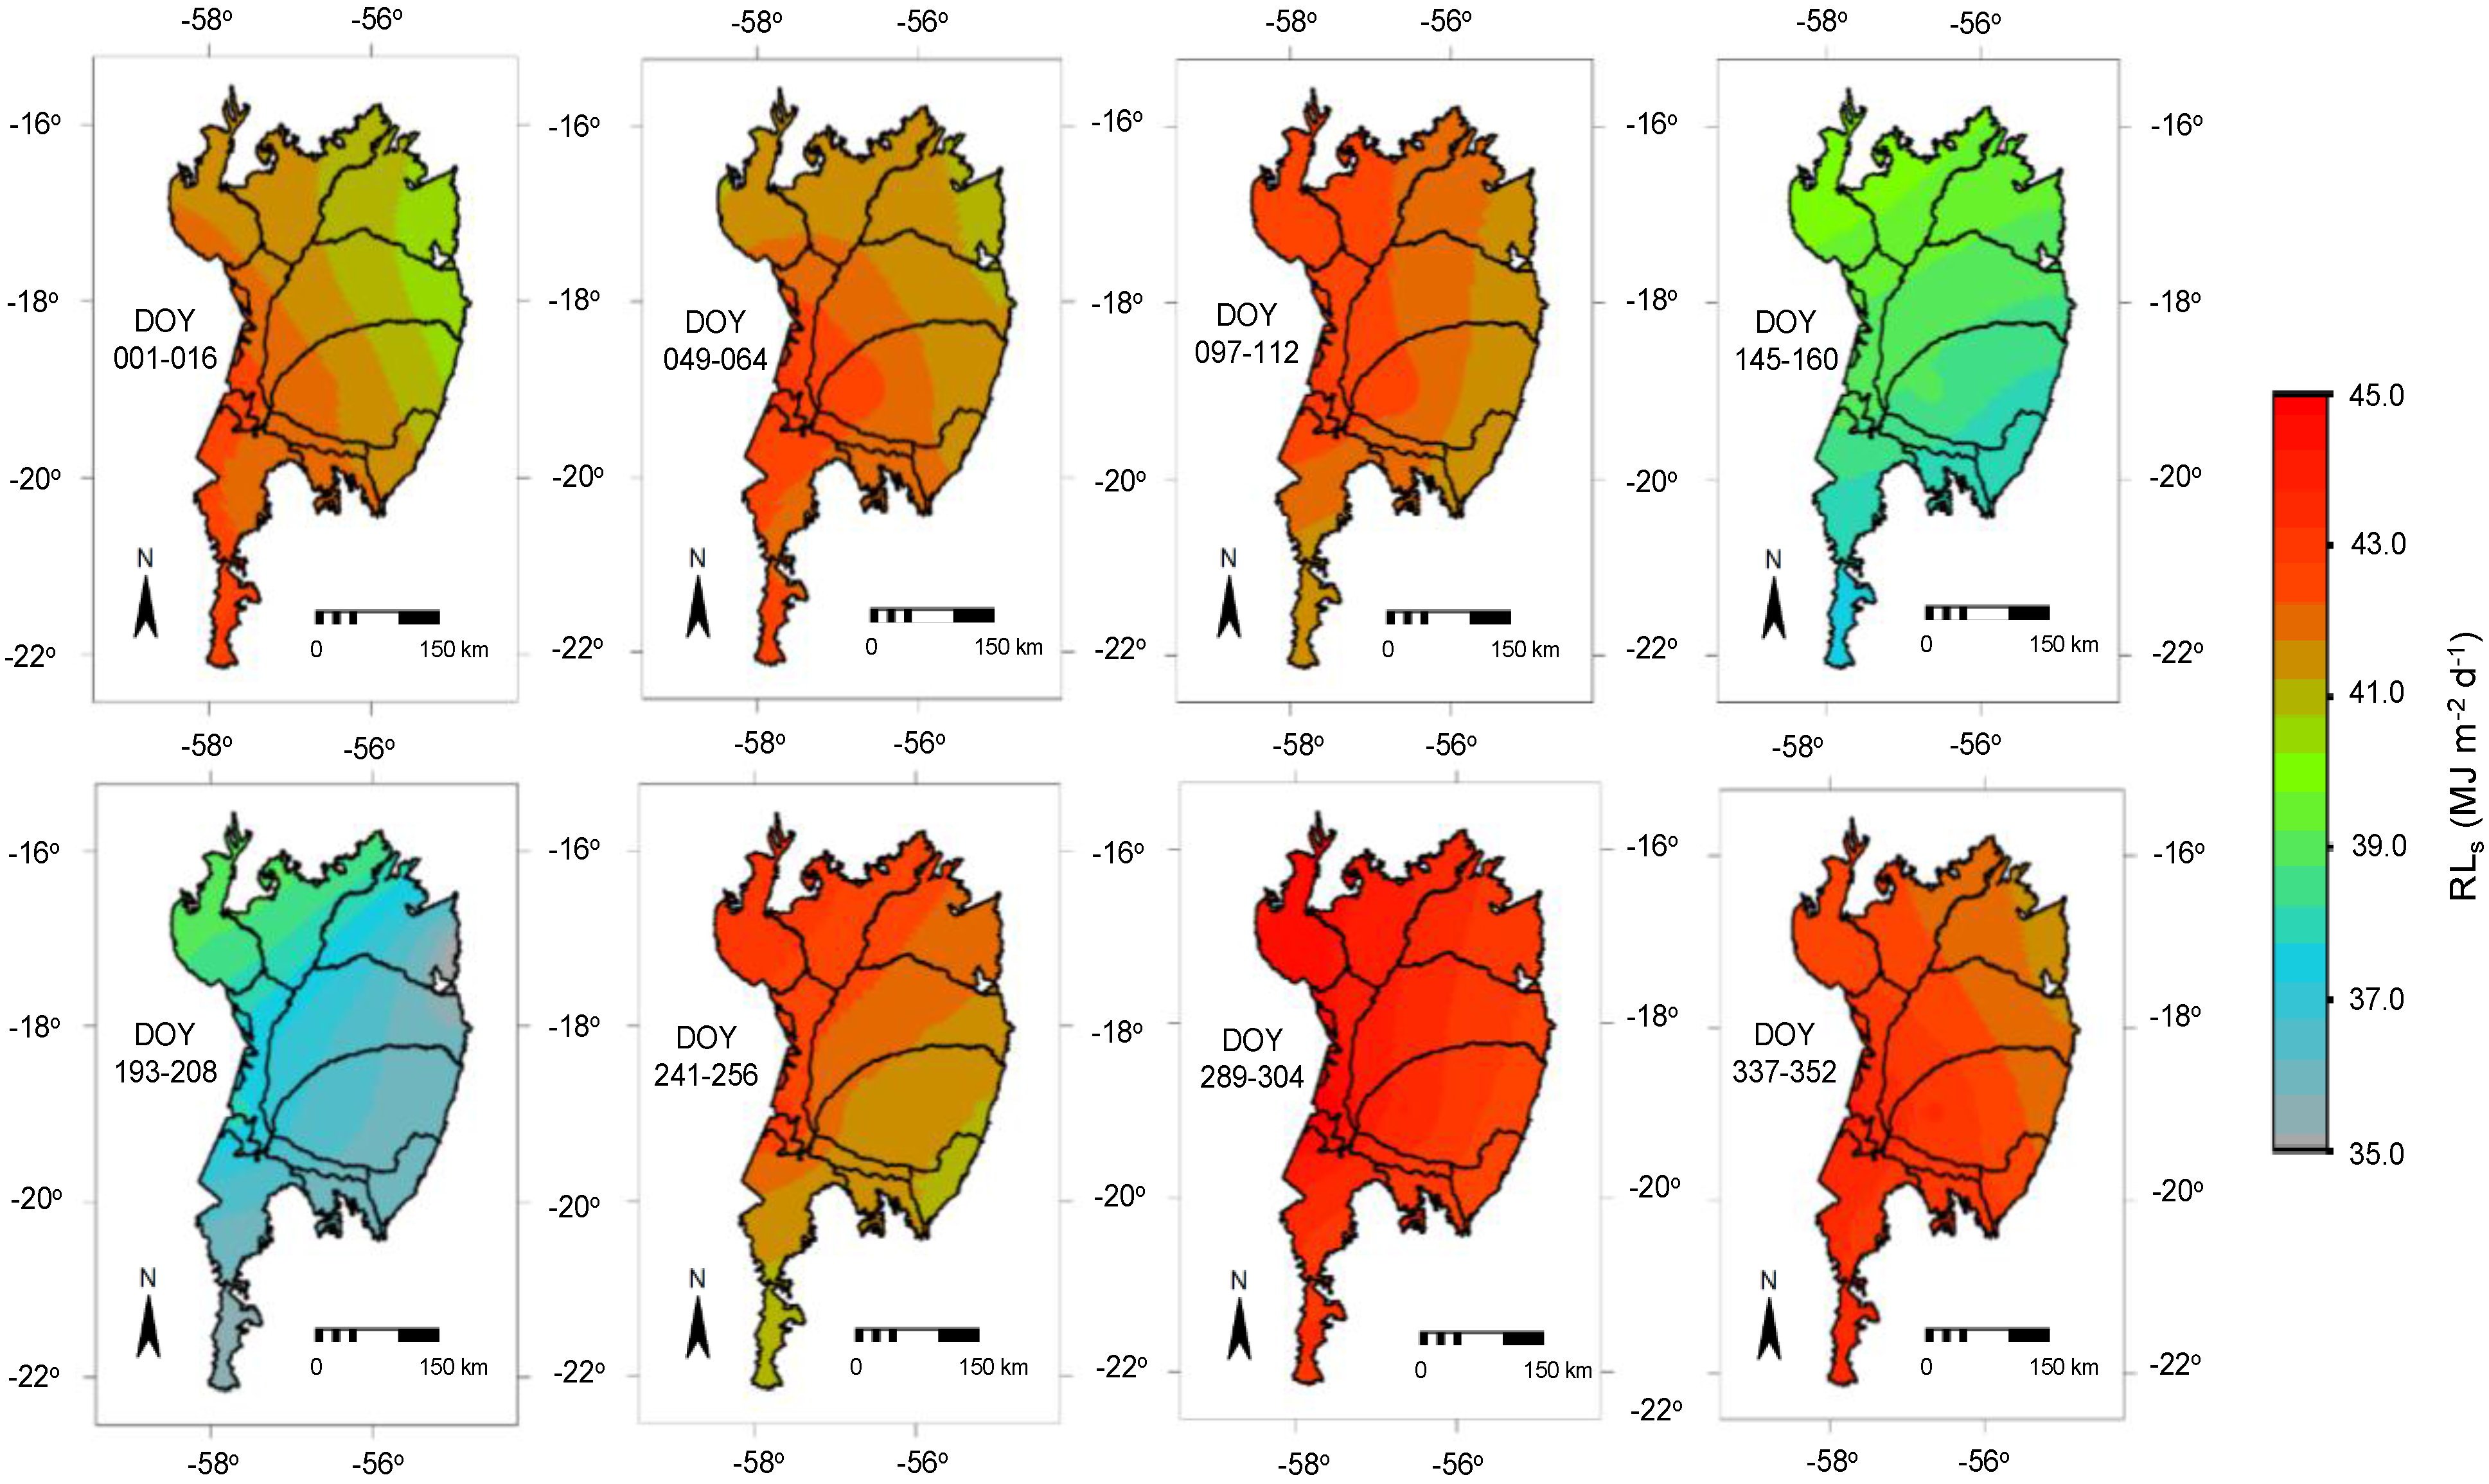
3.2. Large-Scale Radiation Balance

As 23 images are too many for showing each radiation and energy balance parameter in the paper, and considering that for the composed 16-day MODIS periods some of them are similar in terms of the thermohydrological and ecosystem conditions, we selected eight to represent the dynamic of the energy exchanges during the year 2012.
Figure 4 shows the spatial distribution of the incident global solar radiation (RG) daily averages for some the selected 16-day period MODIS images, during 2012, in terms of Day of the Year (DOY), in the Brazilian Pantanal.
RG, considered the radiation (directly or indirectly) from the sun, integrated over all wavelengths in the shortwave interval, presented temporal and spatial variations. The highest pixel values occurred at the end of the year, after the second half of October (DOY 289–304), mainly in the Pantanal southeastern areas, while the smallest ones were during the period from May to June (DOY 145–160).
Figure 5 presents the spatial distribution of the reflected solar radiation (RR) daily averages for some of the selected 16-day period MODIS images, in terms of Day of the Year (DOY), during 2012, in the Brazilian Pantanal.
Figure 4. Daily averages of the incident global solar radiation, RG, for the selected 16-day period MODIS images, during the year 2012, in the Brazilian Pantanal. DOY = Day of the Year.
Remotesensing 07 14597 g004
Figure 5. Daily averages of the reflected solar radiation, RR, for the selected 16-day period MODIS images, during the year 2012, in the Brazilian Pantanal. DOY = Day of the Year.
Remotesensing 07 14597 g005
RR followed RG, representing 14%–19% (surface albedo, α0) of its values, despite having higher spatial variations when compared to RG, and according to moisture conditions and ecosystem characteristics. Monteith and Unsworth [38] have reported higher α0 values, between 0.15 and 0.26, for tropical natural vegetation, possibly because of different surface moisture conditions and background reflectivity. However, those found in the current study were similar to some of previously reported ones for the Brazilian Pantanal, between 0.11 and 0.17 during the driest conditions of the year [25] and for other humid tropical regions around the word [39,40,41]. These similarities confirm the validity of Equation (1) applied to MODIS images for the Pantanal ecosystems.
A dark land surface absorbs more RG, and has a higher Rn than a bright one. The α0 seasonal variations in the Brazilian Pantanal is mainly due to surface covers, which in turn are dependent on the rainfall and flood regimes. More spatial variation occurred during the rainy season when the leaves were alternatively wet and dry due to water interception, with the values from woody branches lower than those from the green leaves. Several experiments yielded a linear relationship between α0 and surface moisture [12,29,35,42,43,44].
The Pantanal ecosystems convert the absorbed solar radiation into heat energy, which is transferred as longwave radiation from their surfaces to the lower atmosphere.
Figure 6 presents the spatial distribution of the emitted surface long-wave radiation (RLs) daily values, for the selected 16-day period MODIS images, in terms of Day of the Year (DOY), during 2012, in the Brazilian Pantanal.
Figure 6. Daily averages of the emitted surface long-wave radiation, RLs, for the selected 16-day period MODIS images, during the year 2012, in the Brazilian Pantanal. DOY = Day of the Year.
Remotesensing 07 14597 g006
RLs is absorbed by the atmosphere or lost into space. In general, it presented temporal and spatial variations in the Brazilian Pantanal, according to the solar radiation levels, but having less dependence on the ecosystem type and surface moisture conditions than in the case of RR. Part of RLs finds its way back to the surfaces.
Figure 7 presents the spatial distribution of the emitted atmospheric long-wave radiation (RLa) daily values, for the selected 16-day period MODIS images, in terms of Day of the Year (DOY), during 2012, in the Brazilian Pantanal.
Figure 7. Daily averages of the emitted atmospheric long-wave radiation, RLa, for the selected 16-day period MODIS images, during the year 2012, in the Brazilian Pantanal. DOY = Day of the Year.
Remotesensing 07 14597 g007
The pixels with the largest downward and upward longwave energy fluxes happened at the end of the year (from DOY 289 on) mainly in the northwestern part of the Pantanal. RLa is dependent on Ta, concentration of carbon dioxide, water vapor and ozone. RLs values were always higher than those of RLa (10–19% higher), then, the net longwave radiation in the Brazilian Pantanal represented an energy loss from the ecosystems to the lower atmosphere.
The quarterly and annual averages for all radiation balance components, together with their standard deviations in the BR, PA and NH Pantanal sub-regions, during the year 2012, are presented in Table 1.
The quarterly period with the highest radiation fluxes in the three Pantanal sub-regions was from September to December. However, according to the standard deviation (SD) values, the largest spatial variations throughout the year occurred in the BR sub-region, except for RLs, for which the major SD was in the PA sub-region.
Both the highest RG and RR levels happened in the NH sub-region, while for RLa and RLs, they were, respectively, in the BR and PA sub-regions. RG average fractions reflected by the surface (RR), the surface albedo (α0), ranged from 0.16–0.17. Suzuki et al. [30], from Bowen ratio measurements, found average α0 values for natural vegetation of 0.14 ± 0.04 to 0.15 ± 0.01 in wetlands located in northern Namibia, during respectively the wet and dry seasons, comparable with the results for the ecosystems in the Brazilian Pantanal.
Regarding the long-wave radiation balance, RLs was, on average, 13% higher than RLa in the BR sub-region, while in the PA and NH sub-regions, this percentage was 14%, and between May and August, RLs was approximately 15% larger than RLa.
Table 1. Quarterly and annual averages for the radiation balance components during the year 2012 in the Pantanal sub-regions of Barão do Melgaço (BR), Nhecolândia (NH) and Paiaguás (PA): incident global solar radiation (RG), reflected solar radiation (RR); emitted atmospheric long-wave radiation (RLa); and emitted surface long-wave radiation (RLs).
Quarterly/YearRG(MJ·m−2·d−1)RR (MJ·m−2·d−1)RLa (MJ·m−2·d−1)RLs (MJ·m−2·d−1)
Barão de Melgaço (BR)
January–April13.52 ± 0.582.16 ± 0.4536.65 ± 0.2741.11 ± 0.18
May–August13.03 ± 0.662.04 ± 0.2034.32 ± 0.5839.27 ± 0.51
September–December14.36 ± 0.572.32 ± 0.2437.50 ± 0.2842.18 ± 0.19
Year13.61 ± 0.602.17 ± 0.3036.10 ± 0.38 40.79 ± 0.30
Paiaguás (PA)
January–April14.56 ± 0.39 2.31 ± 0.21 36.48 ± 0.20 41.36 ± 0.37
May–August13.45 ± 0.382.09 ± 0.19 33.98 ± 0.3839.15 ± 0.43
September–December15.32 ± 0.442.53 ± 0.2737.26 ± 0.2342.41 ± 0.35
Year14.40 ± 0.402.30 ± 0.22 35.85 ± 0.2740.91 ± 0.39
Nhecolândia (NH)
January–April15.11 ± 0.292.44 ± 0.1836.30 ± 0.2041.36 ± 0.35
May–August13.38 ± 0.322.12 ± 0.1633.74 ± 0.2938.87 ± 0.31
September–December15.91 ± 0.272.67 ± 0.24 37.03 ± 0.22 42.34 ± 0.35
Year14.75 ± 0.292.40 ± 0.1935.63 ± 0.2340.79 ± 0.33

3.3. Large-Scale Energy Balance
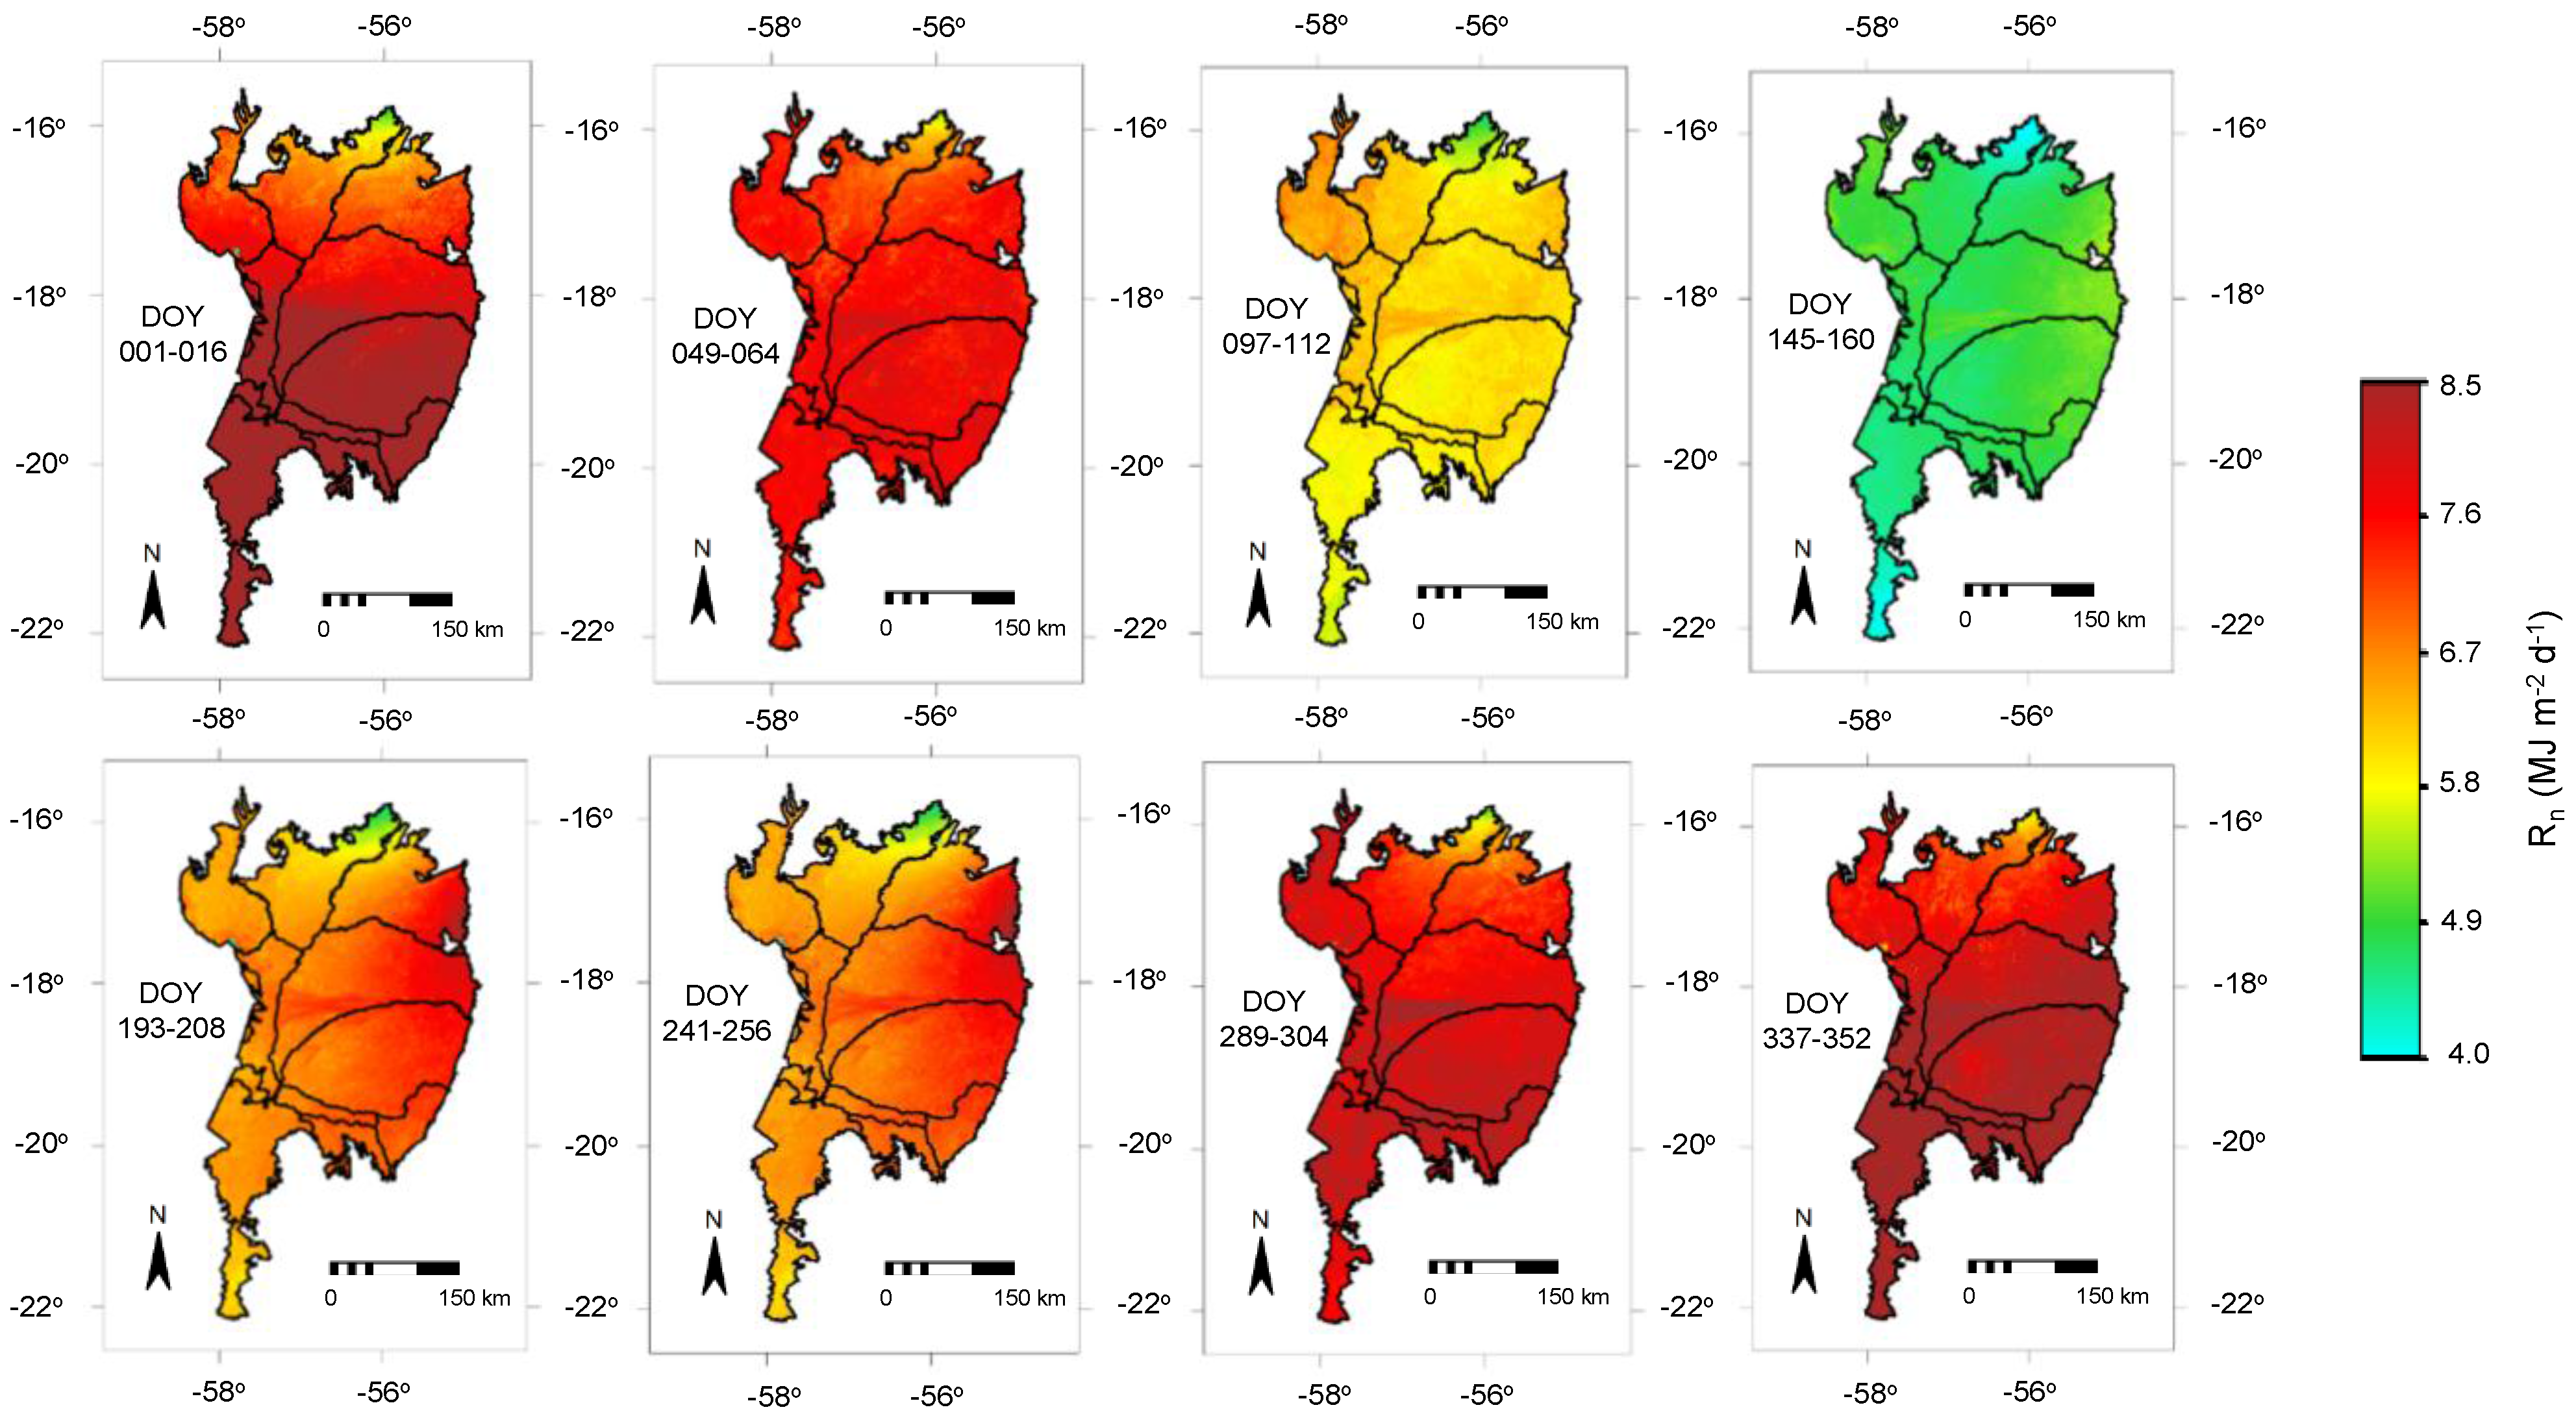
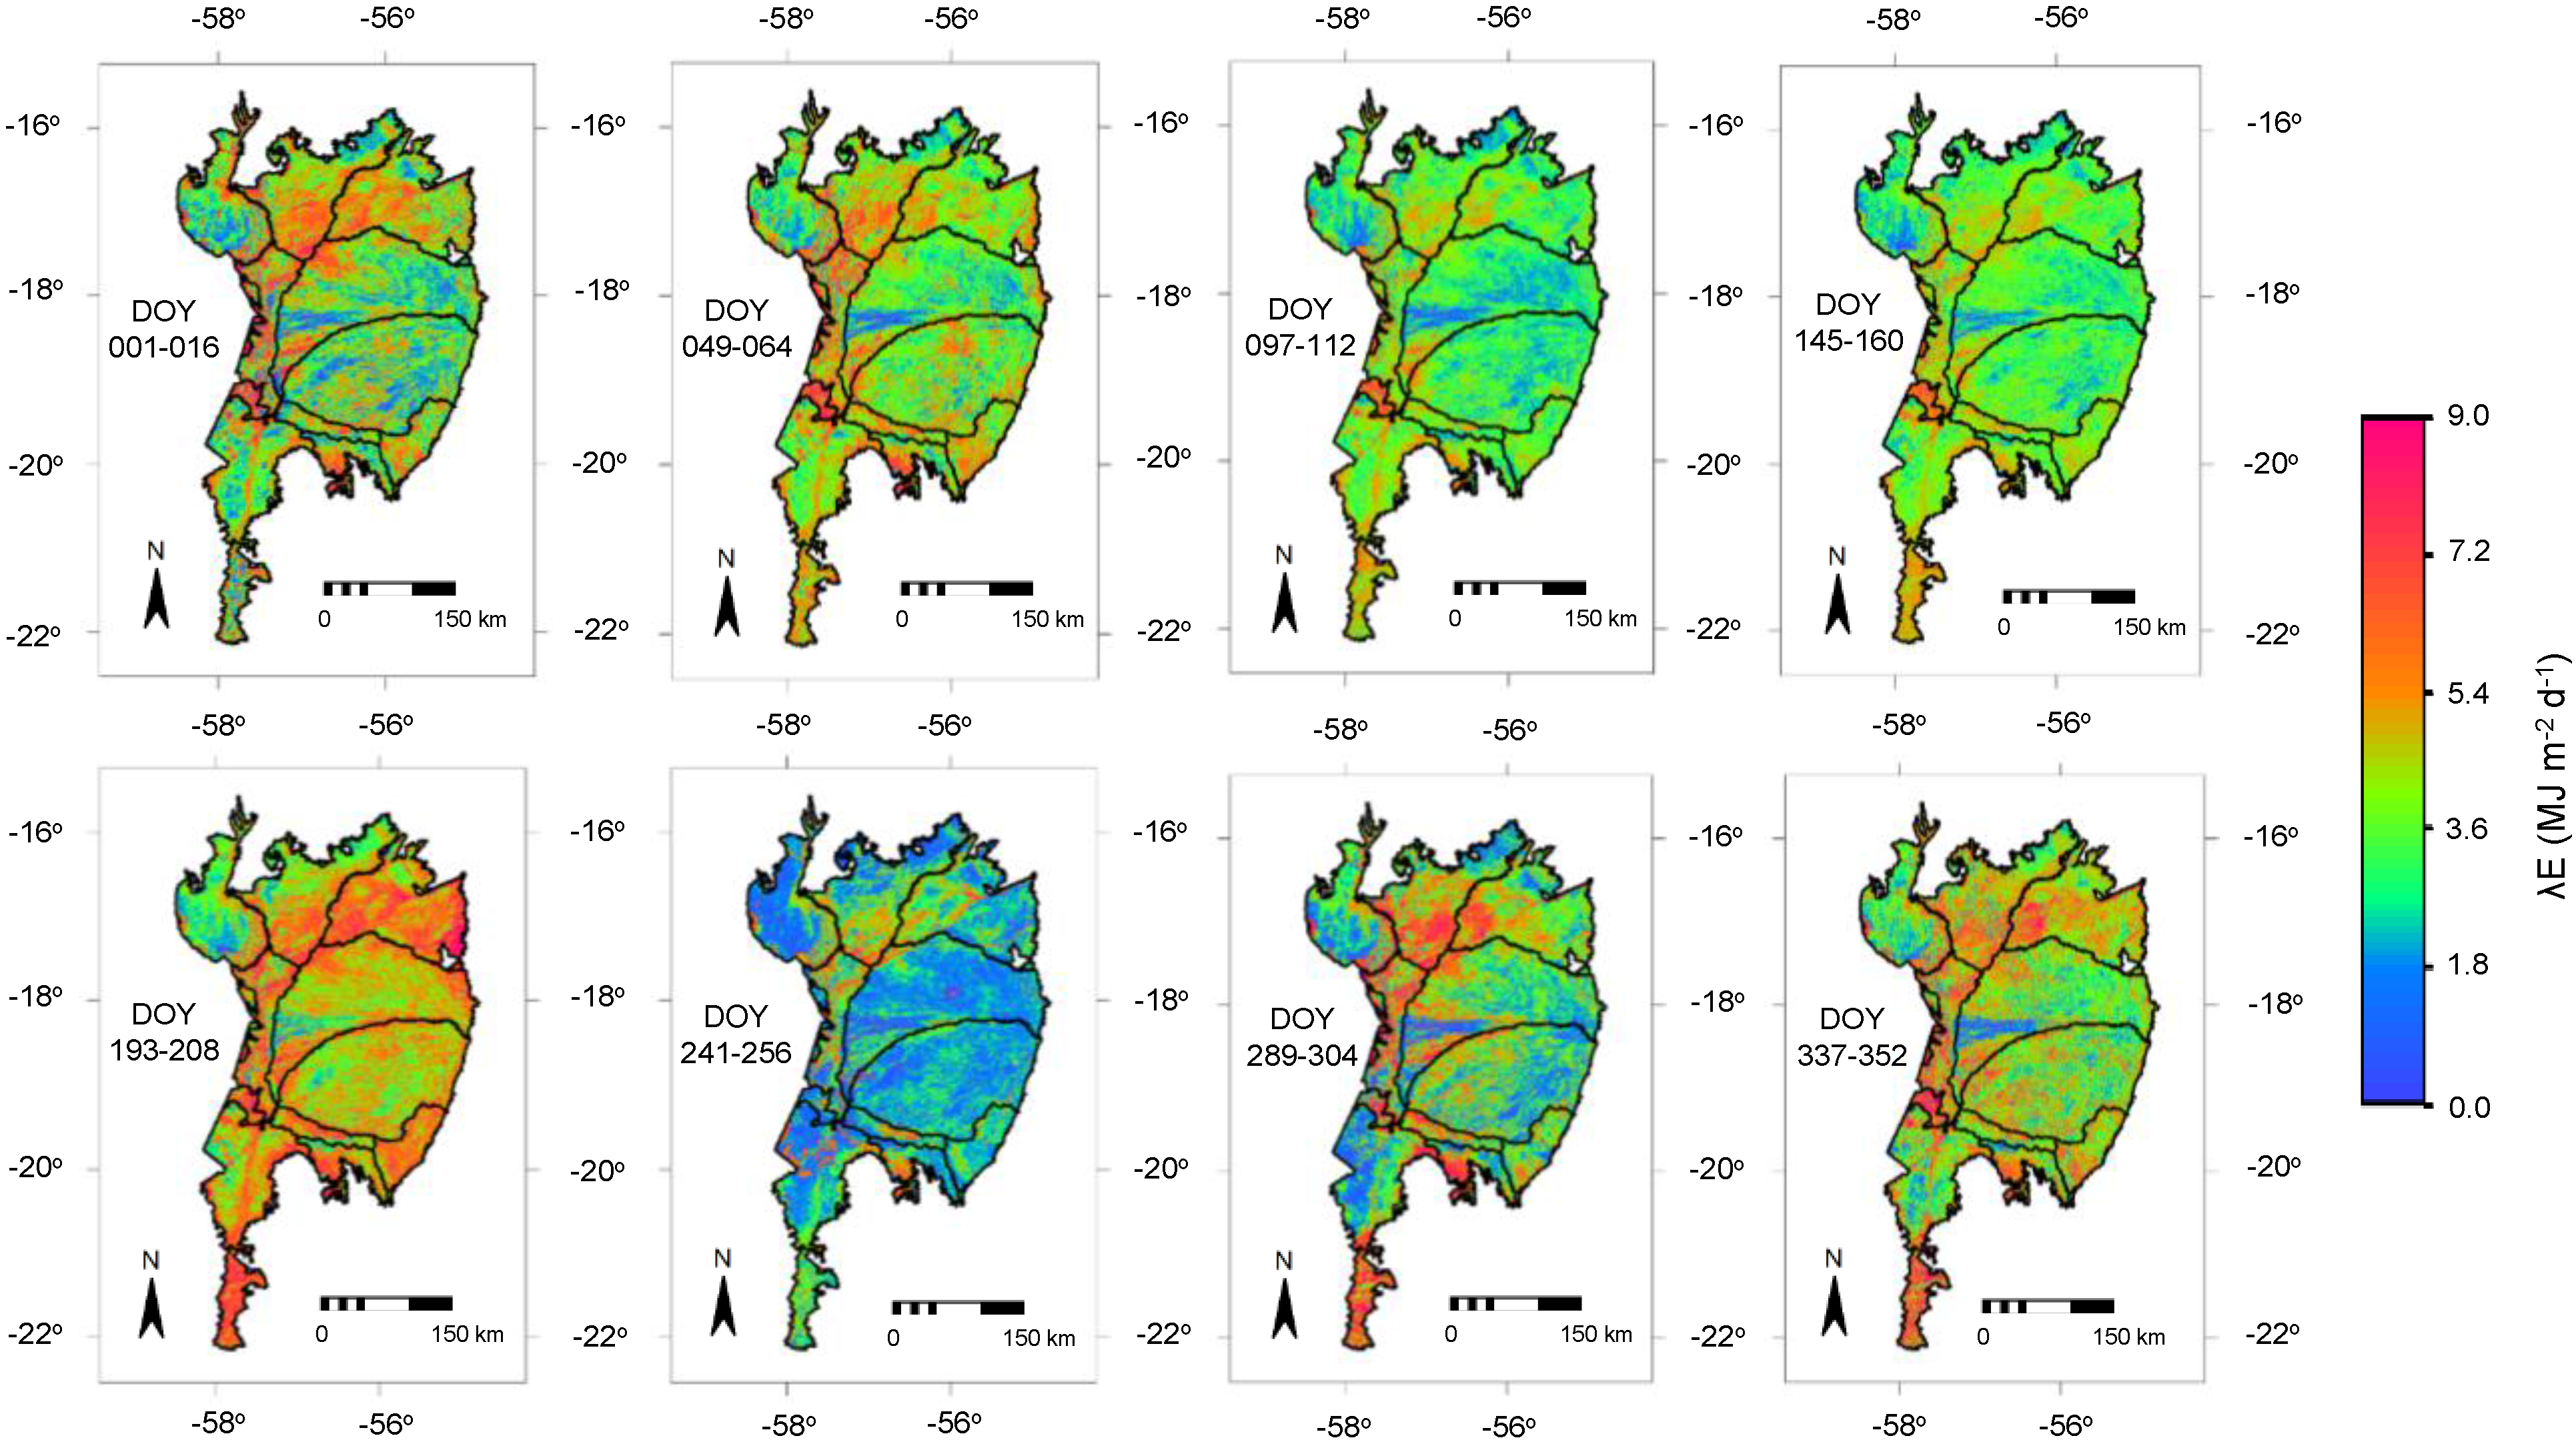
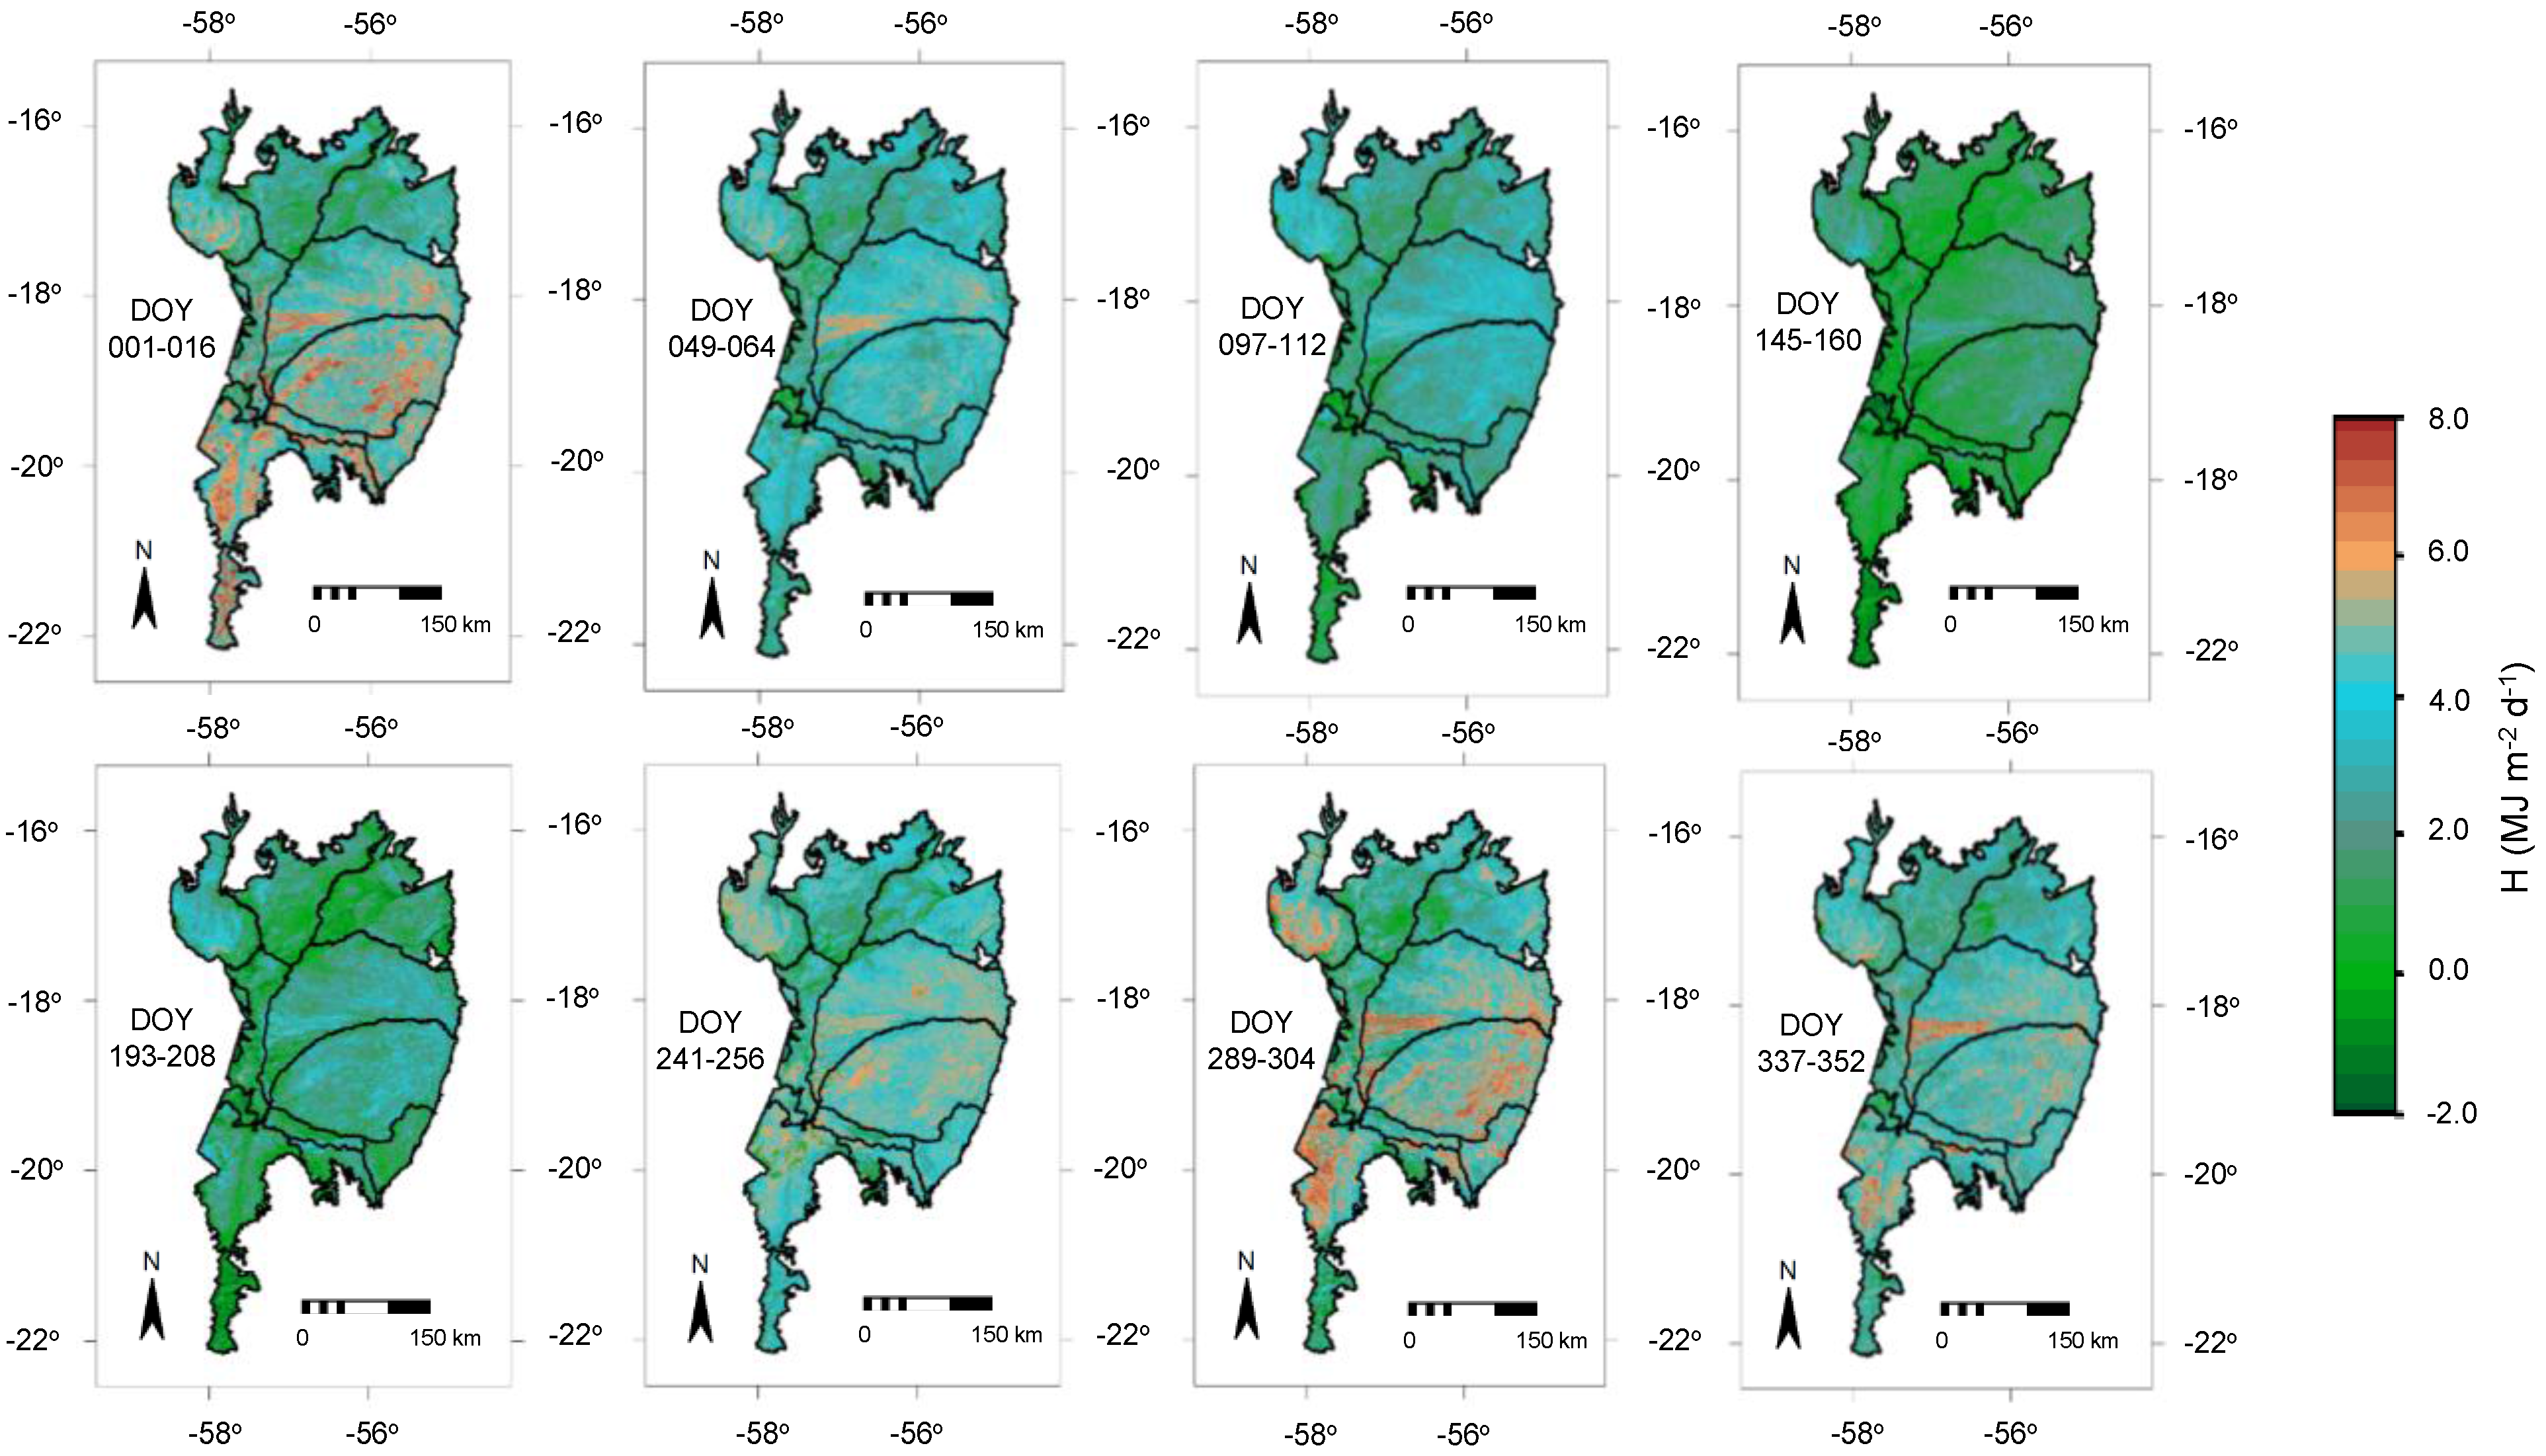
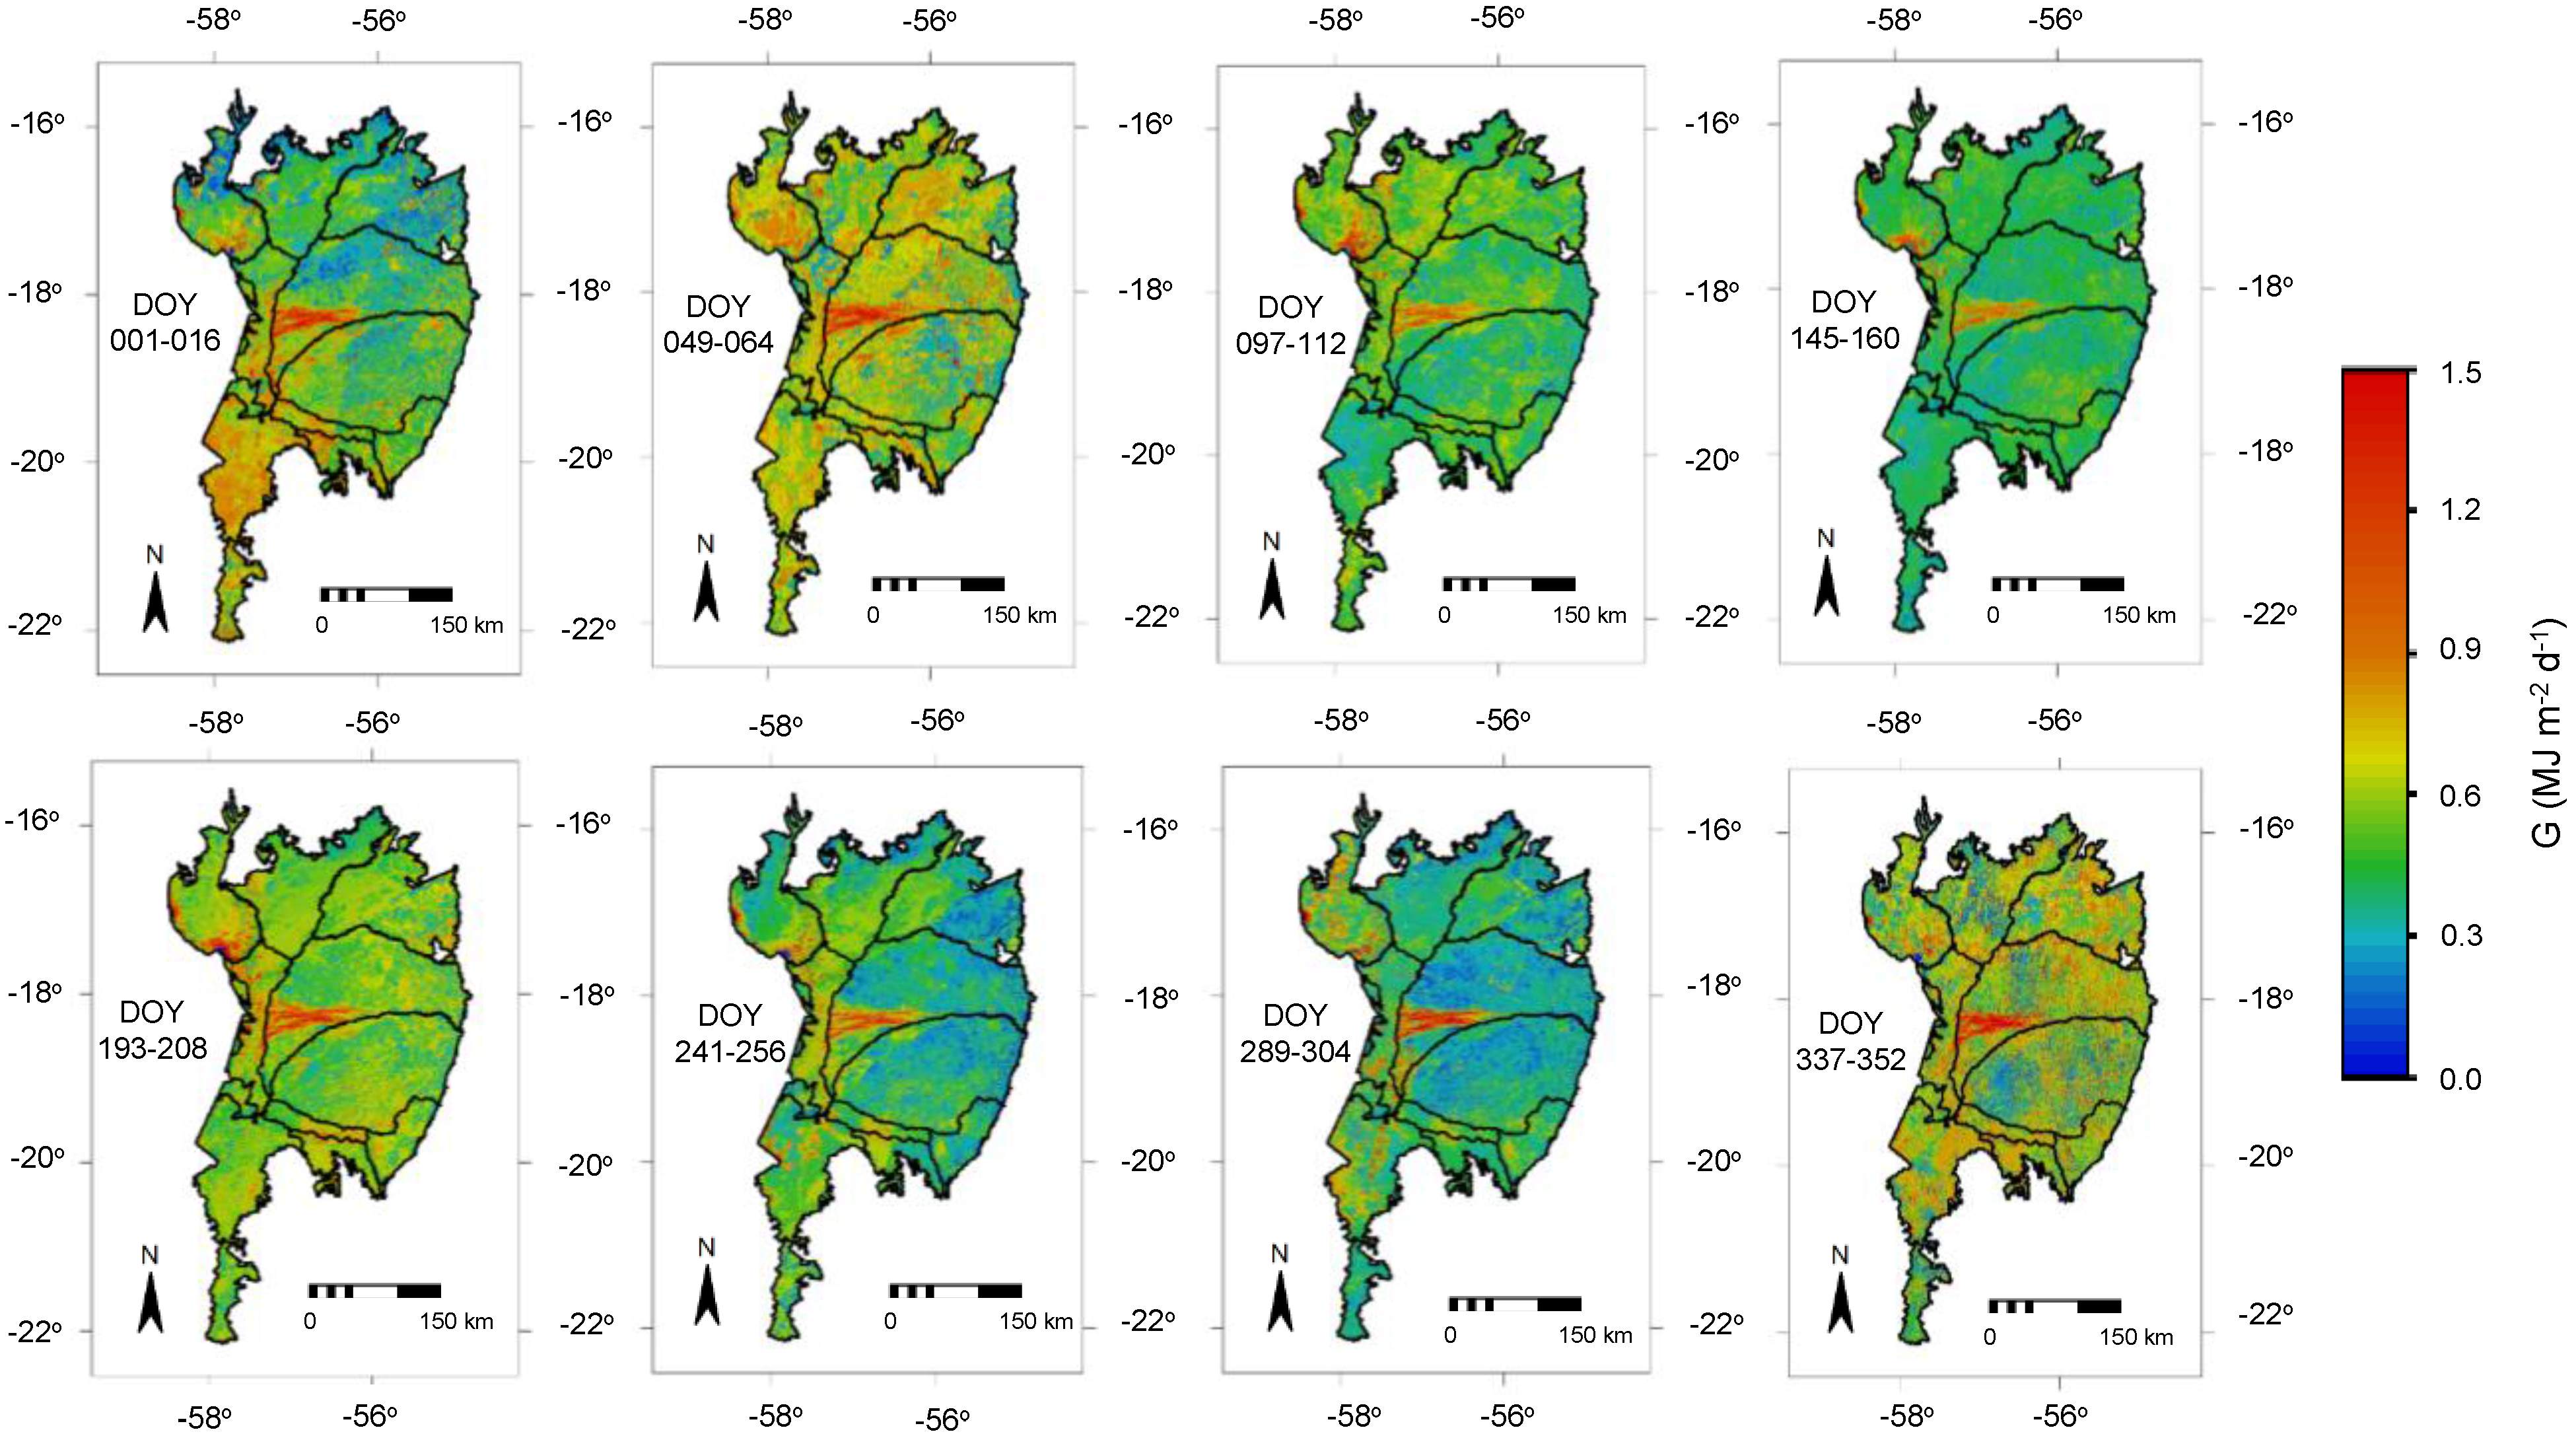
Figure 8 shows the spatial distribution of the net radiation (Rn) daily averages for some of the selected 16-day period MODIS images in terms of Day of the Year (DOY), during 2012, in the Brazilian Pantanal.
Rn values depended more on the RG levels than on the water and vegetation conditions, with an Rn/RG fraction around 0.50, similarly to values found in Australian wetlands by Hughes et al. [45]. Teixeira et al. [31] reported Rn ranging from 46% to 55% in different agro-ecosystems involving irrigated crops and natural vegetation in the Brazilian Northeast. The highest Rn spatial variations in the Brazilian Pantanal, with SD above 0.40 MJ·m−2·d−1, occurred during the rainy season (DOY 001–112). Andrade et al. [25] found Rn daily values above 7.0 MJ·m−2·d−1 for the Brazilian Pantanal wettest areas and water bodies in August 2012, similarly to the results for DOY 241–256 of the current study (see Figure 8), which supports the applicability of Equation (7).
For consideration of the water and vegetation conditions in the mixed ecosystems of the Brazilian Pantanal, the latent (λE), sensible (H) and ground (G) heat fluxes were pixel-by-pixel determined.
Figure 9 presents the spatial distribution of the latent heat flux (λE) daily values for the selected 16-day period MODIS images, in terms of Day of the Year (DOY), during 2012, in the Brazilian Pantanal.
Figure 8. Daily averages of net radiation, Rn, for the selected 16-day period MODIS images, during the year 2012, in the Brazilian Pantanal. DOY = Day of the Year.
Remotesensing 07 14597 g008
Figure 9. Daily averages of latent heat flux, λE, for the selected 16-day period MODIS images, during the year 2012 in the Brazilian Pantanal. DOY = Day of the Year.
Remotesensing 07 14597 g009
Through the λE spatial variations, distinctions can be clearly seen among the mixed ecosystems, according to the time of year. Values above 6.0 MJ·m−2·d−1 (reddish color) occurred more frequently between January and March (DOY 001–097) and from October to December (DOY 289–366). As a result of unusual precipitations from May to June (DOY 129–176), high λE values were also observed at this time of year, when heavy rains combined with the large atmospheric demand (see Figure 3) increased the water vapor transfer rates. During an energy balance experiment in a Brazilian Pantanal area covered with Vochysiadivergens species, Sanches et al. [14] found average λE values from 6.0 to 10.0 MJ·m−2·d−1 during the dry and wet seasons of the year, respectively, similar to some pixels of Figure 9.
Figure 10 presents the spatial distribution of the sensible heat flux (H) average daily values for the selected 16-day period MODIS images in terms of Day of the Year (DOY), during 2012, in the Brazilian Pantanal.
Figure 10. Daily averages of sensible heat flux, H, for the selected 16-day period MODIS images, during the year 2012, in the Brazilian Pantanal. DOY = Day of the Year.
Remotesensing 07 14597 g010
Similarly to λE, through the H values, it is also easy to identify different partitions of the available energy into heat fluxes according to the ecosystem types and surface moisture conditions. In this case, the smallest H rates corresponded to the highest rates of water vapour transfer, happening mainly after the rainy season, from May to July (DOY 145–208). The largest ones were from August to October (DOY 241–304). Negative H (dark green color) indicated heat advection from the warmer and drier areas to those colder and moister, reaching to −2.0 MJ·m−2·d−1 on some occasions in the middle of the year. The daily ranges for the period of DOY 241–256 (August–September) were reported by Andrade et al. [25] during the dry conditions of August 2012. These last authors found H values above 4.0 MJ·m−2·d−1 in the Pantanal Savanna areas.
Figure 11 presents the spatial distribution of the ground heat flux (G) daily average values for the selected 16-day period MODIS images in terms of Day of the Year (DOY), during 2012, in the Brazilian Pantanal.
G was another energy balance parameter that also presented spatial and temporal differences according to the Pantanal ecosystem types. In this case, besides the seasons of the year and vegetation, its pixel daily values were also influenced by the surface moisture conditions. Some areas presented high positive G daily values reaching around 1.5 MJ·m−2·d−1, unlike in the semi-arid regions of Brazil, where, in most cases, they approached zero on the daily scale [12].
The quarterly and annual averages of the energy balance components, together with their standard deviations (SD) for the Pantanal sub-regions BR, PA and NH during the year 2012, are presented in Table 2.
Figure 11. Daily averages of ground heat flux, G, for the selected 16-day period MODIS images, during the year 2012, in the Brazilian Pantanal. DOY = Day of the Year.
Remotesensing 07 14597 g011
The quarterly period with the highest available energy (Rn − G) in the analyzed three sub-regions was September to December. According to the SD values, the largest Rn spatial variation occurred from May to August in the BR sub-region, while for G, this was from September to December in the PA sub-region. Sanches et al. [14], through field measurements in the Brazilian Pantanal, reported Rn daily averages values from 8.0 to 12.5 MJ·m−2·d−1 on Vochysiadivergens ecosystems, higher than those shown in Table 2. However, Andrade et al. [25] from MODIS measurements found Rn average daily values of 7.8 MJ·m−2·d−1 in August.
The largest λE magnitudes occurred in the first quarterly period, in the PA and NH sub-regions; however, they happened in the second quarter for the BR sub-region. The latter sub-region presented the highest rates of water vapor transfer to the atmosphere; however, the biggest λE spatial variation was for the PA sub-region from September to December. The fraction of Rn used as λE ranged from 0.40 in the last quarterly period of the NH sub-region to 0.69 in the second quarter of the BR sub-region. These results indicated that soon after the rainy period, moisture in the root zone in this last sub-region was high and the microclimatic conditions favored ET compared to the other examined sub-regions.
The λE values from Table 2 are within the range reported by Suzuki et al. [30], who found, from Bowen ratio measurements, a range between 1.7 ± 0.7 and 6.1 ± 3.7 in natural vegetation of wetlands, for respectively the dry and wet seasons in northern Namibia. In addition, Andrade et al. [25], from MODIS measurements in the Brazilian Pantanal, reported λE daily averages between 3.2 and 5.9 MJ·m−2·d−1 in August 2012, involving the average ranges from May to August in all analysed sub-regions of the current study.
Table 2. Quarterly and annual averages of the energy balance components during the year 2012 for the Pantanal sub-regions of Barão do Melgaço (BR), Nhecolândia (NH) and Paiaguás (PA): net radiation (Rn), latent heat flux (λE); sensible heat flux (H) and ground heat flux (G).
Quarter/YearRn (MJ·m−2·d−1)λE (MJ·m−2·d−1)H (MJ·m−2·d−1)G (MJ·m−2·d−1)
Barão de Melgaço (BR)
January–April6.90 ± 0.344.04 ± 1.062.36 ± 1.050.50 ± 0.16
May–August6.04 ± 0.454.14 ± 1.211.43 ± 0.950.48 ± 0.12
September–December7.37 ± 0.363.82 ± 1.312.77 ± 1.280.46 ± 0.17
Year6.74 ± 0.384.00 ± 1.192.16 ± 1.080.48 ± 0.15
Paiaguás (PA)
January–April7.37 ± 0.303.41 ± 1.283.39 ± 1.230.57 ± 0.25
May–August6.18 ± 0.333.26 ± 1.082.42 ± 0.960.51 ± 0.19
September–December7.64 ± 0.353.15 ± 1.413.97 ± 1.390.52 ± 0.29
Year7.04 ± 0.333.27 ± 1.253.23 ± 1.180.52 ± 0.24
Nhecolândia (NH)
January–April7.61 ± 0.233.51 ± 1.113.57 ± 1.100.53 ± 0.18
May–August6.13 ± 0.283.13 ± 0.932.55 ± 0.890.46 ± 0.13
September–December7.93 ± 0.283.18 ± 1.234.27 ± 1.230.48 ± 0.20
Year7.19 ± 0.263.28 ± 1.083.43 ± 1.070.49 ± 0.17
The highest H values occurred during the third quarterly period in the NH sub-region, when it represented, on average, 54% of Rn. In the second quarter of the year, the BR sub-region presented the lowest H/Rn average of 0.24. Considering the annual scale, the NH sub-region was the driest one, with H representing around 47% of Rn, while the moister conditions of the BR sub-region resulted in an H/Rn of 0.33 for the same time-scale. Sanches et al. [14] found comparable H values of 2.2 and 2.7 MJ·m−2·d−1 for respectively the dry and wet seasons from micrometeorological measurements over Vochysiadivergens in the Brazilian Pantanal.
Despite recorded G values reaching as much as 1.5 MJ·m−2·d−1 as shown in Figure 11 for some the Brazilian Pantanal areas, as in the case of the FV ecosystem (see Figure 1 and Figure 11), annual averages were low, with fractions G/Rn ranging from 7% to 8%, without sub-region distinctions in this time-scale (see Table 2).
Galeano et al. [16], across Bowen ratio measurements, reported the energy partition during the dry season of a pasture located in the Brazilian Pantanal, as 60% of Rn used as λE, 30% as H and 10% as G, similar to the values found for the BR sub-region in the current study, during the quarterly period May to August.
Despite not having simultaneous field and satellite measurements for validations during the year 2012, the similarities of the current results with those from the literature provide confidence for the application of the SAFER algorithm to MODIS images without the thermal band in the Brazilian Pantanal, assuring a spatial resolution of 250 m for all radiation and energy balance components. However, in using these measurements in future work, new calibrations and validations can improve the accuracy of this pioneering study for the monitoring of energy exchanges of the different aquatic and terrestrial ecosystems.

3.4. Ecosystem Energy Partitions

The daily average values and standard deviations of the energy balance components for the main Brazilian Pantanal ecosystems in the year 2012, inside the BR, PA and NH sub-regions, are presented in Table 3. The ecosystems are classified according to Embrapa Pantanal, SOS Pantanal Institute, WWF-Brazil [5].
Table 3. Daily averages of the energy balance components in the year 2012 for each ecosystem class in the sub-regions of Barão do Melgaço (BR), Paiaguás (PA) and Nhecolândia (NH) of the Brazilian Pantanal: net radiation (Rn), latent heat flux (λE); sensible heat flux (H), ground heat flux (G), and evaporative fraction (Ef).
ClassesRn (MJ·m−2·d−1)λE (MJ·m−2·d−1)H (MJ·m−2·d−1)G (MJ·m−2·d−1)Ef (-)
PT7.02 ± 0.323.62 ± 0.882.81 ± 0.930.59 ± 0.110.56
FF7.08 ± 0.293.61 ± 0.972.83 ± 1.090.64 ± 0.110.56
TLS6.93 ± 0.333.64 ± 0.902.64 ± 1.000.65 ± 0.110.58
WS7.08 ± 0.283.23 ± 0.943.22 ± 1.050.63 ± 0.120.50
GS6.97 ± 0.223.39 ± 0.852.94 ± 0.860.64 ± 0.110.54
FV6.92 ± 0.463.43 ± 1.492.67 ± 1.590.82 ± 0.210.56
AC7.04 ± 0.262.99 ± 0.753.48 ± 0.820.57 ± 0.100.46
NMC6.81 ± 0.243.23 ± 0.693.02 ± 0.760.56 ± 0.090.52
Note: PT, FF, TLS, WS, GS, FV, AC and NMC mean, respectively, the ecosystems: Pasture, Forest Formations, Tree-Lined Savanna, Woody Savanna, Grassy Savanna, Fluvial Influenced Vegetation, Anthropogenic Changes and Natural/Management Changes.
The highest ecosystem Rn values were for the FF and WS ecosystems, while NMC presented the lowest ones. However, all classes presented Rn around 7.0 MJ·m−2·d−1, therefore, with no significant differences among them. In the case of λE, the highest and the lowest fluxes were respectively for the TLS and AC ecosystems, corresponding inversely to the smallest and the largest H. Analysing Figure 1 and Table 2 and Table 3, it can be noticed that the higher λE values in the BR sub-region are due to a larger concentration of the TLS ecosystem. This last ecosystem class provides greater water fluxes from the vegetated surface to the lower atmosphere. This aspect is relevant for large-scale water balances under the actual joint effects of climate and land use changes. From micrometeorological measurements in grasses and ipês in the Brazilian Pantanal, Oliveira et al. [13] found average daily H values of 3.0 MJ·m−2·d−1, similar to those for several ecosystems from Table 3.
Regarding G, the contrasts among the ecosystems are more visible because of the extremes values of the NMC and FV classes, representing a 50% difference in their annual averages. According to Figure 1 and Table 2 and Table 3, it is possible to deduce that the higher G values found for the PA sub-region were due to a larger FV ecosystem area.
The biggest spatial variations for all the energy balance components, in accordance with the SD values, are for the FV ecosystem, with emphasis on H, with its SD representing 60% of its average on the annual time-scale. According to Moraes et al. [46], the year 2012 was considered unusual in the Pantanal since 2000, with declines in water levels in many rivers, leading to further reductions of the flooded areas—around 75%—which may have contributed to the high SD values in the energy balance components for the FV ecosystem. Curado et al. [15] confirm the effects of dry and wet seasons on the energy exchanges as a consequence of year-by-year water levels fluctuations.
The evaporative fraction (Ef) presented in Table 3 and calculated by Equation (16) can be used as a surface moisture indicator for the Pantanal ecosystems. The moister one was TLS, with 58% of the available energy being used as λE (i.e., Ef = 0.58), while the driest was the modified ecosystem AC, with Ef of 0.46. These results indicate that changes in the vegetation cover in the Brazilian Pantanal caused by humankind should affect water fluxes from the vegetated surfaces to the lower atmosphere by up to 12%.

4. Conclusions

The joint use of MODIS and agrometeorological data allowed quantifications and analyses of the large-scale radiation and energy balance components in the Brazilian Pantanal.
The net radiation (Rn) was more dependent on the incident global solar radiation (RG) than on the surface characteristics of both the natural and modified ecosystems. It has been demonstrated that, with available daily weather data, latent (λE), sensitive (H) and ground (G) heat fluxes can be estimated on this time-scale by using only the reflectances in the red and near infrared bands of the MODIS sensor. This is done by first modeling the ratio of the actual (ET) to the reference (ET0) evapotranspiration at the satellite overpass time.
Extracting the sub-regions BR, PA and NH from the whole Brazilian Pantanal, the highest λE values were observed for the BR sub-region, while the largest H ones were for the NH sub-region. The higher λE values in the BR sub-region are due to a higher concentration of the TLS ecosystem. Regarding G, the biggest fluxes were for the PA sub-region, due to a larger area with the FV ecosystem class.
Considering the predominant ecosystems in the three examined sub-regions of the Brazilian Pantanal, the highest λE values were found in the TLS class, while the largest H ones were for the AC ecosystem. On some occasions, heat advection from the drier and warmer areas to those moister and colder were established in the middle of the year, through negative H values and λE higher than Rn.
Contrarily to some previous Brazilian papers, in which G is often ignored on a daily time-scale, the limits in its values in the current study revealed a 50% difference between the ecosystems with the highest rates, FV, and that with the lowest ones, NMC.
By using the evaporative fraction (Ef) as a surface moisture indicator, the moistest ecosystem was TLS, with 58% of the available energy (Rn − G) being used as λE, while the driest one was the modified ecosystem AC, with this fraction being 46%.
The SAFER algorithm, used in this study with simple calibration, proved to have sufficient sensitivity to detect the energy exchange dynamics in the Brazilian Pantanal, contributing to the monitoring of environmental changes under the fragile conditions of its different ecosystems. In future work, with the availability of simultaneous field and MODIS measurements, additional local calibrations and validations could improve the accuracy of the model for these dynamic studies.

Acknowledgments

To the National Institute of Meteorology (INMET), for providing the weather data.

Author Contributions

Antônio H. de C. Teixeira: Main author. Who wrote the large part of the paper and responsible for the model applications.
Carlos R. Padovani: Responsible for the land cover classification.
Ricardo G. Andrade: Helped the image processing.
Janice F. Leivas: Helped the image processing, weather data interpolation and model applications.
Daniel de C. Victoria: Helped MODIS acquisition and processing.
Sergio Galdino: Helped land cover classification.

Conflicts of Interest

The authors declare that are not any personal circumstances or interest that may be perceived as inappropriately influencing the representation or interpretation of our reported research results.

References

  1. UNESCO. Ramsar: Convention on Wetlands of International Importance Especially as Waterfowl Habitat 1971. Available online: http://portal.unesco.org/en/ev.php-URL_ID=15398&URL_DO=DO_TOPIC&URL_SECTION=201.html (accessed on 15 July 2015).
  2. Verhoeven, J.T.A.; Setter, T.L. Agricultural use of wetlands: Opportunities and limitations. Ann. Bot. 2010, 105, 155–163. [Google Scholar] [CrossRef] [PubMed]
  3. Goulden, M.L.; Litvak, M.; Miller, S.D. Factors that control Typha marsh evapotranspiration. Aquatic Botany 2007, 86, 97–106. [Google Scholar] [CrossRef]
  4. Junk, W.J.; Cunha, C.N.; Wantzen, K.M.; Petermann, P.; Strüssmann, C.; Marques, M.I.; Adis, J. Biodiversity and its conservation in the Pantanal of Mato Grosso, Brazil. Aquat. Sci. 2006, 68, 278–309. [Google Scholar] [CrossRef]
  5. Embrapa Pantanal, SOS Pantanal Institute, WWF-Brazil. Monitoramento das alterações da cobertura vegetal e uso da terra na bacia do alto rio Paraguai—Porção Brasileira( período de análise: 2010 a 2012); Embrapa Pantanal: Brasília, Brasil, 2014. [Google Scholar]
  6. Silva, M.H.S. Caracterização Pedomorfológica e Compreensão dos Processos pedogenéticos dos solos da Lagoa Salitrada: Pantanal de Nhecolândia. Master’s Thesis, Dissertação de Mestrado, Universidade Federal do Mato Grosso do Sul (UFMS/CPAQ), Aquidauana, Mato Grosso do Sul, Brazil, 2007. [Google Scholar]
  7. Adami, M.; Freitas, R.M.; Padovani, C.R.; Shimabukuro, Y.E.; Moreira, M.A. Estudo da dinâmica espaço-temporal do bioma Pantanal por meio de imagens MODIS. Pesquisa Agropecuária Brasileira 2008, 43, 1371–1378. [Google Scholar] [CrossRef]
  8. Bispo, R.C.; Petrini, M.A.; Lamparelli, R.A.C.; Rocha, J.V. Supervised classification applied to vegetation in the Barão de Melgaço municipality (Mato Grosso state, Brazil), using MODIS imagery. Geografia 2013, 38, 9–23. [Google Scholar]
  9. Zhang, Y.; Kadota, T.; Ohata, T.; Oyunbaatar, D. Environmental controls on evapotranspiration from sparse grassland in Mongolia. Hydrol. Process. 2007, 21, 2016–2027. [Google Scholar] [CrossRef]
  10. Cleugh, H.A.; Leuning, R.; Mu, Q.; Running, S.W. Regional evaporation estimates from flux tower and MODIS satellite data. Remote Sens. Environ. 2007, 106, 285–304. [Google Scholar] [CrossRef]
  11. Allen, R.G.; Pereira, L.S.; Raes, D.; Smith, M. Crop Evapotranspiration: Guidelines for Computing Crop Water Requirements; Food and Agriculture Organization of the United Nations: Rome, Italy, 1998. [Google Scholar]
  12. Teixeira, A.H. de C.; Hernandez, F.B.T.; Lopes, H.L.; Scherer-Warren, M.; Bassoi, L.H. A comparative study of techniques for modeling the spatiotemporal distribution of heat and moisture fluxes in different agroecosystems in Brazil. In Remote Sensing of Energy Fluxes and Soil Moisture Content, 1st ed.; Petropoulos, G.P., Ed.; CRC Press, Taylor and Francis Group: Boca Raton, FL, USA, 2014; pp. 169–191. [Google Scholar]
  13. Oliveira, M.B.L.; Von Randaw, C.; Manzi, A.O.; Alvalá, R.C. dos S.; Sá, L.D. de A.; Leitão, M.V.B.R.; de Souza, A. Fluxos turbulentos de energia sobre o Pantanal sul mato-grossense. Revista Brasileira de Meteorologia 2006, 21, 159–165. [Google Scholar]
  14. Sanches, L.; Vourlits, G.L.; Alves, M. de C.; Pinto-Júnior, O.B.; Nogueira, J. de S. Seasonal patterns of evapotranspiration for a Vochysiadivergens forest in the Brazilian Pantanal. Wetlands 2011, 31, 1211–1225. [Google Scholar] [CrossRef]
  15. Curado, L.F.A.; Nogueira, J. de S.; Sanches, L.; Biudes, M.S.; Rodrigues, T.R. Interannual variability of energy flux in atmospheric instability at Pantanal of Mato Grosso-Brazil. Atmos. Clim. Sci. 2012, 2, 518–524. [Google Scholar]
  16. Galeano, D.C.; Biudes, M.S.; Danelichen, V.H. de M.; Fabian, F.A.; Souza, M.C. Energy balance in a pasture in the Pantanal. J. Biotechnol. Biodivers. 2013, 4, 2179–4874. [Google Scholar]
  17. Miralles, D.G.; Holmes, T.R.H.; De Jeu, R.A.M.; Gash, J.H.; Meesters, A.G.C.A.; Dolman, A.J. Global land-surface evaporation estimated from satellite-based observations. Hydrol. Earth Syst. Sci. 2011, 15, 453–469. [Google Scholar] [CrossRef]
  18. Anderson, M.C.; Kustas, W.P.; Alfieri, J.G.; Gao, F.; Hain, C. Mapping daily evapotranspiration at Landsat spatial scales during BEAREX'08 field campaign. Adv. Water Resour. 2012, 50, 162–177. [Google Scholar] [CrossRef]
  19. Pôças, I.; Cunha, M.; Pereira, L.S.; Allen, R.G. Using remote sensing energy balance and evapotranspiration to characterize montane landscape vegetation with focus on grass and pasture lands. Int. J. Appl. Earth Obs. Geoinf. 2013, 21, 159–172. [Google Scholar] [CrossRef]
  20. Majumdar, T.J.; Brattacharyya, R.; Chattejee, S. On the utilization of ENVISAT AATSR data for geological/hydrological applications. Acta Astron. 2007, 60, 899–905. [Google Scholar] [CrossRef]
  21. Bastiaansssen, W.G.M.; Menenti, M.; Feddes, R.A.; Roerink, G.J.; Holtslag, A.A.M. A remote sensing surface energy balance algorithm for land (SEBAL) 1. Formulation. J. Hydrol. 1998, 212–213, 198–212. [Google Scholar] [CrossRef]
  22. Roerink, G.J.; Su, Z.; Menenti, M. S-SEBI: A simple remote sensing algorithm to estimate the surface energy balance. Phys. Chem. Earth 2000, 25, 147–157. [Google Scholar] [CrossRef]
  23. Su, Z. The Surface Energy Balance System (SEBS) for estimation of turbulent heat fluxes. Hydrol. Earth Syst. Sci. 2002, 6, 85–99. [Google Scholar] [CrossRef]
  24. Teixeira, A.H. de C.; Bastiaanssen, W.G.M.; Ahmad, M.D.; Bos, M.G. Reviewing SEBAL input parameters for assessing evapotranspiration and water productivity for the Low-Middle São Francisco River basin, Brazil Part A: Calibration and validation. Agric. For. Meteorol. 2009, 149, 462–476. [Google Scholar] [CrossRef] [Green Version]
  25. Andrade, R.G.; Sediyama, G.C.; da Paz, A.R.; Lima, E. de P.; Facco, A.G. Geotecnologias aplicadas à avaliação de parâmetros biofísicos do Pantanal. Pesquisa Agropecuária Brasileira 2012, 47, 1227–1234. [Google Scholar] [CrossRef]
  26. Nagler, P.L.; Glenn, E.P.; Nguyen, U.; Scott, R.L.; Doody, T. Estimating riparian and agricultural actual evapotranspiration by reference evapotranspiration and MODIS enhanced vegetation index. Remote Sens. 2013, 5, 3849–3871. [Google Scholar] [CrossRef]
  27. Kamble, B.; Kilic, A.; Hubard, K. Estimating crop coefficients using remote sensing-based vegetation index. Remote Sens. 2013, 5, 1588–1602. [Google Scholar] [CrossRef]
  28. Allen, R.G.; Tasumi, M.; Morse, A.; Trezza, R.; Wright, J.L.; Bastiaanssen, W.G.M.; Kramber, W.; Lorite, I.; Robison, C.W. Satellite-based energy balance for mapping evapotranspiration with internalized calibration (METRIC)—Applications. J. Irrig. Drain. Eng. 2007, 133, 395–406. [Google Scholar] [CrossRef]
  29. Teixeira, A.H. de C. Determining regional actual evapotranspiration of irrigated and natural vegetation in the São Francisco river basin (Brazil) using remote sensing and Penman-Monteith equation. Remote Sens. 2010, 2, 1287–1319. [Google Scholar] [CrossRef]
  30. Suzuki, T.; Takeshi Ohta, T.; Hiyama, T.; Izumi, Y.; Mwandemele, O.; Iijima, M. Effects of the introduction of rice on evapotranspiration in seasonal wetlands. Hydrol. Process. 2014, 28, 4780–4794. [Google Scholar] [CrossRef]
  31. Teixeira, A.H. de C.; Bastiaanssen, W.G.M.; Ahmad, M.D.; Bos, M.G.; Moura, M.S.B. Analysis of energy fluxes and vegetation-atmosphere parameters in irrigated and natural ecosystems of semi-arid Brazil. J. Hydrol. 2008, 362, 110–127. [Google Scholar] [CrossRef]
  32. Teixeira, A.H. de C.; Scherer-Warren, M.; Hernandez, F.B.T.; Andrade, R.G.; Leivas, J.F. Large-scale water productivity assessments with MODIS images in a changing semi-arid environment: A Brazilian case study. Remote Sens. 2013, 11, 5783–5804. [Google Scholar]
  33. Valiente, J.A.; Nunez, M.; Lopez-Baeza, E.; Moreno, J.F. Narrow-band to broad-band conversion for Meteosat visible channel and broad-band albedo using both AVHRR-1 and -2 channels. Int. J. Remote Sens. 1995, 16, 1147–1166. [Google Scholar] [CrossRef]
  34. Teixeira, A.H. de C.; Victoria, D. de C.; Andrade, R.G.; Leivas, J.F.; Bolfe, E.L.; Cruz, C.R. Coupling MODIS images and agrometeorological data for agricultural water productivity analyses in the Mato Grosso state, Brazil. Proc. SPIE 2014. [Google Scholar] [CrossRef]
  35. Teixeira, A.H. de C.; Hernandez, F.B.T.; Andrade, R.G.; Leivas, J.F.; Bolfe, E.L. Energy balance with Landsat images in irrigated central pivots with corn crop in the São Paulo State, Brazil. Proc. SPIE 2014. [Google Scholar] [CrossRef]
  36. Allen, R.G.; Hartogensis, O.; de Bruin, H.A.R. Long-Wave Radiation over Alfafa During the RAPID Field Campaign in Southern Idaho; Research Report; Univ. of Idaho: Kimberly, ID, USA, 2000. [Google Scholar]
  37. Raupasch, M.R. Combination theory and equilibrium evaporation. Quart. J. R. Meteorol. Soc. 2001, 127, 1149–1181. [Google Scholar] [CrossRef]
  38. Monteith, J.L.; Unsworth, M.H. Principles of Environmental Physics; Arnold: London, UK, 1990. [Google Scholar]
  39. Oguntoyinbo, J.S. Reflection coefficient of natural vegetation, crops and urban surfaces in Nigeria. Quart. J. R. Meteorol. Soc. 1970, 96, 430–441. [Google Scholar] [CrossRef]
  40. Pinker, R.T.; Thompson, O.E.; Eck, T.F. The albedo of a tropical evergreen forest. Quart. J. R. Meteorol. Soc. 1980, 106, 551–558. [Google Scholar] [CrossRef]
  41. Shuttleworth, W.J. Evaporation from Amazonian rain forest. Proc. R. Soc. Lond. B, Biol. Sci. 1988, 233, 321–346. [Google Scholar] [CrossRef]
  42. Lobell, D.B.; Asner, G.P. Moisture effects on soil reflectance. Soil Sci. Soc. Am. J. 2002, 66, 722–727. [Google Scholar] [CrossRef]
  43. Van Dijk, A.I.J.M.; Bruijnzeel, L.A.; Schellekens, J. Micrometeorology and water use of mixed crops in upland West Java, Indonesia. Agric. For. Meteorol. 2004, 124, 31–49. [Google Scholar] [CrossRef]
  44. Li, S.-G.; Eugster, W.; Asanuma, J.; Kotani, A.; Davaa, G.; Oyunbaatar, D.; Sugita, M. Energy partitioning and its biophysical controls above a grazing steppe in central Mongolia. Agric. For. Meteorol. 2006, 137, 89–106. [Google Scholar] [CrossRef]
  45. Hughes, C.E.; Kalma, J.D.; Binning, P.; Willgoose, G.R.; Vertzonis, M. Estimating evapotranspiration for a temperate salt marsh Newcastle, Australia. Hydrol. Process. 2001, 15, 957–975. [Google Scholar] [CrossRef]
  46. Moraes, E.C.; Pereira, G.; Cardoso, F. da S. Evaluation of reduction of Pantanal wetlands in 2012. Geografia 2013, 38, 81–93. [Google Scholar]

