Article

The Performances of MODIS-GPP and -ET Products in China and Their Sensitivity to Input Data (FPAR/LAI)

1
Key Laboratory of Land Surface Pattern and Simulation, Institute of Geographic Sciences and Natural Resources Research, Chinese Academy of Sciences, Beijing 100101, China
2
University of Chinese Academy of Sciences, Beijing 100049, China
*
Author to whom correspondence should be addressed.
Remote Sens. 2015, 7(1), 135-152; https://doi.org/10.3390/rs70100135
Submission received: 8 October 2014 / Accepted: 15 December 2014 / Published: 24 December 2014

Abstract

:
The aims are to validate and assess the performances of MODIS gross primary production (MODIS-GPP) and evapotranspiration (MODIS-ET) products in China’s different land cover types and their sensitivity to remote sensing input data. In this study, MODIS-GPP and -ET are evaluated using flux derived/measured data from eight sites of ChinaFLUX. Results show that MODIS-GPP generally underestimates GPP (R2 is 0.58, bias is −6.7 gC/m2/8-day and RMSE is 19.4 gC/m2/8-day) at all sites and MODIS-ET overestimates ET (R2 is 0.36, bias is 6 mm/8-day and RMSE is 11 mm/8-day) when comparing with derived GPP and measured ET, respectively. For evergreen forests, MODIS-GPP gives a poor performance with R2 varying from 0.03 to 0.44; in contrast, MODIS-ET provides more reliable results. In croplands, MODIS-GPP can explain 80% of GPP variance, but it overestimates flux derived GPP in non-growing season and underestimates flux derived GPP in growing season; similar overestimations also presented in MODIS-ET. For grasslands and mixed forests, MODIS-GPP and -ET perform good estimating accuracy. By designing four experimental groups and taking GPP simulation as an example, we suggest that the maximum light use efficiency of croplands should be optimized, and the differences of meteorological data have little impact on GPP estimation, whereas remote sensing leaf area index/fraction of photo-synthetically active radiation (LAI/FPAR) can greatly affect GPP/ET estimations for all land cover types. Thus, accurate remote sensing parameters are important for achieving reliable estimations.

1. Introduction

The evaluation of terrestrial ecosystem carbon and water dynamic is a key issue in global climate change research [1,2]. Gross primary production (GPP) and evapotranspiration (ET) can provide useful information for water and soil resource management, global carbon-water cycle analysis and environmental change monitoring. To understand the mechanisms of climate change and improve the prediction of possible future climate change, we require accurate quantifications of carbon and water processes in terrestrial vegetation [3]. The mechanism of GPP and ET variations have been successfully interpreted in several studies [4,5]. However, substantial differences of GPP and ET are observed among estimated results from different models, which prevent us from fully understanding global carbon-water cycle. Therefore, the uncertainties of estimated GPP and ET still need to be addressed at global and regional scales.
Satellite image offers a series of time-continuous vegetation and ecosystem observation data. Based on a combination of satellite data and ground measurements, several remote sensing methods are proposed to estimate GPP and ET. In the past decades, the spatial and temporal patterns of GPP and ET were explained by exploiting their good correlations with normalized differential vegetation index (NDVI), enhanced vegetation index (EVI), land surface temperature (LST), leaf area index (LAI) and the fraction of photo-synthetically active radiation absorbed by plant canopies (FPAR) [6]. Many remote sensing GPP and ET models presented better estimating accuracy at regional scale, such as the GPP models: the temperature and greenness (TG) model [7], the greenness and radiation (GR) model [2] and vegetation photosynthesis model (VPM) [8], etc. and the ET models: surface energy balance algorithm for land (SEBAL) [9] and air/surface temperature-vegetation index (T-VI) [10,11], etc. Compared with the above models, the main advantages of MODIS-GPP (MOD17A2) and -ET (MOD16A2) are that they provide continuous global GPP and ET products and these products can be freely shared. Scientists can use the model results to compare with the MODIS products [12,13]. MODIS-GPP and -ET have been widely validated against measurements from AmeriFlux, Fluxnet-Canada and EuroFlux [14,15,16,17], but many observation sites are still not included around the world. Therefore, many validation studies have been carried out in other regions [17], so the performances of MODIS-GPP and -ET estimate in China still need to be validated.
The MODIS-GPP and -ET algorithms employ meteorological measurements, LOOKUP tables based on land cover types and remote sensing data. In many studies, the uncertainties of weather data for model simulations have always been controversial [16,17]. Since meteorological measurements are often not available at the same spatial scale as the remote sensing data, they can introduce substantial errors into carbon-water exchange simulations [7,18], for example, the downscaling question about coarse resolution metrological data. Turner et al. [16] has discussed about the uncertainties of meteorological data used for driving MODIS algorithms, but little has been conducted on further exploring the impact of uncertainties of remote sensing data on simulations [17]. Compared with the meteorological data, does the quality of remote sensing data have more influence for estimating results of remote sensing model? Therefore, it is necessary to assess the sensitivity of MODIS-GPP and -ET to remote sensing input data. In addition, assessing uncertainties of GPP and ET models is useful for improving the model accuracy.
Eddy covariance technique provides the best approach for measuring net CO2 exchange and hydrothermal fluxes at the ecosystem scale that can be used for GPP and ET calculation. Many studies have confirmed that flux observation data at a long time scale provided favorable information for validation of GPP and ET models [19]. In this study, we used observations at eight sites of ChinaFLUX to evaluate the accuracy of MODIS-GPP and -ET. The objectives of the study are: (1) to assess the differences of MODIS-GPP and -ET with flux observations, respectively; (2) to analyze the performances of MODIS-GPP and -ET in different land cover types over China; and (3) to analyze the impacts of meteorological data and remote sensing input data on the model results.

2. Data and Methods

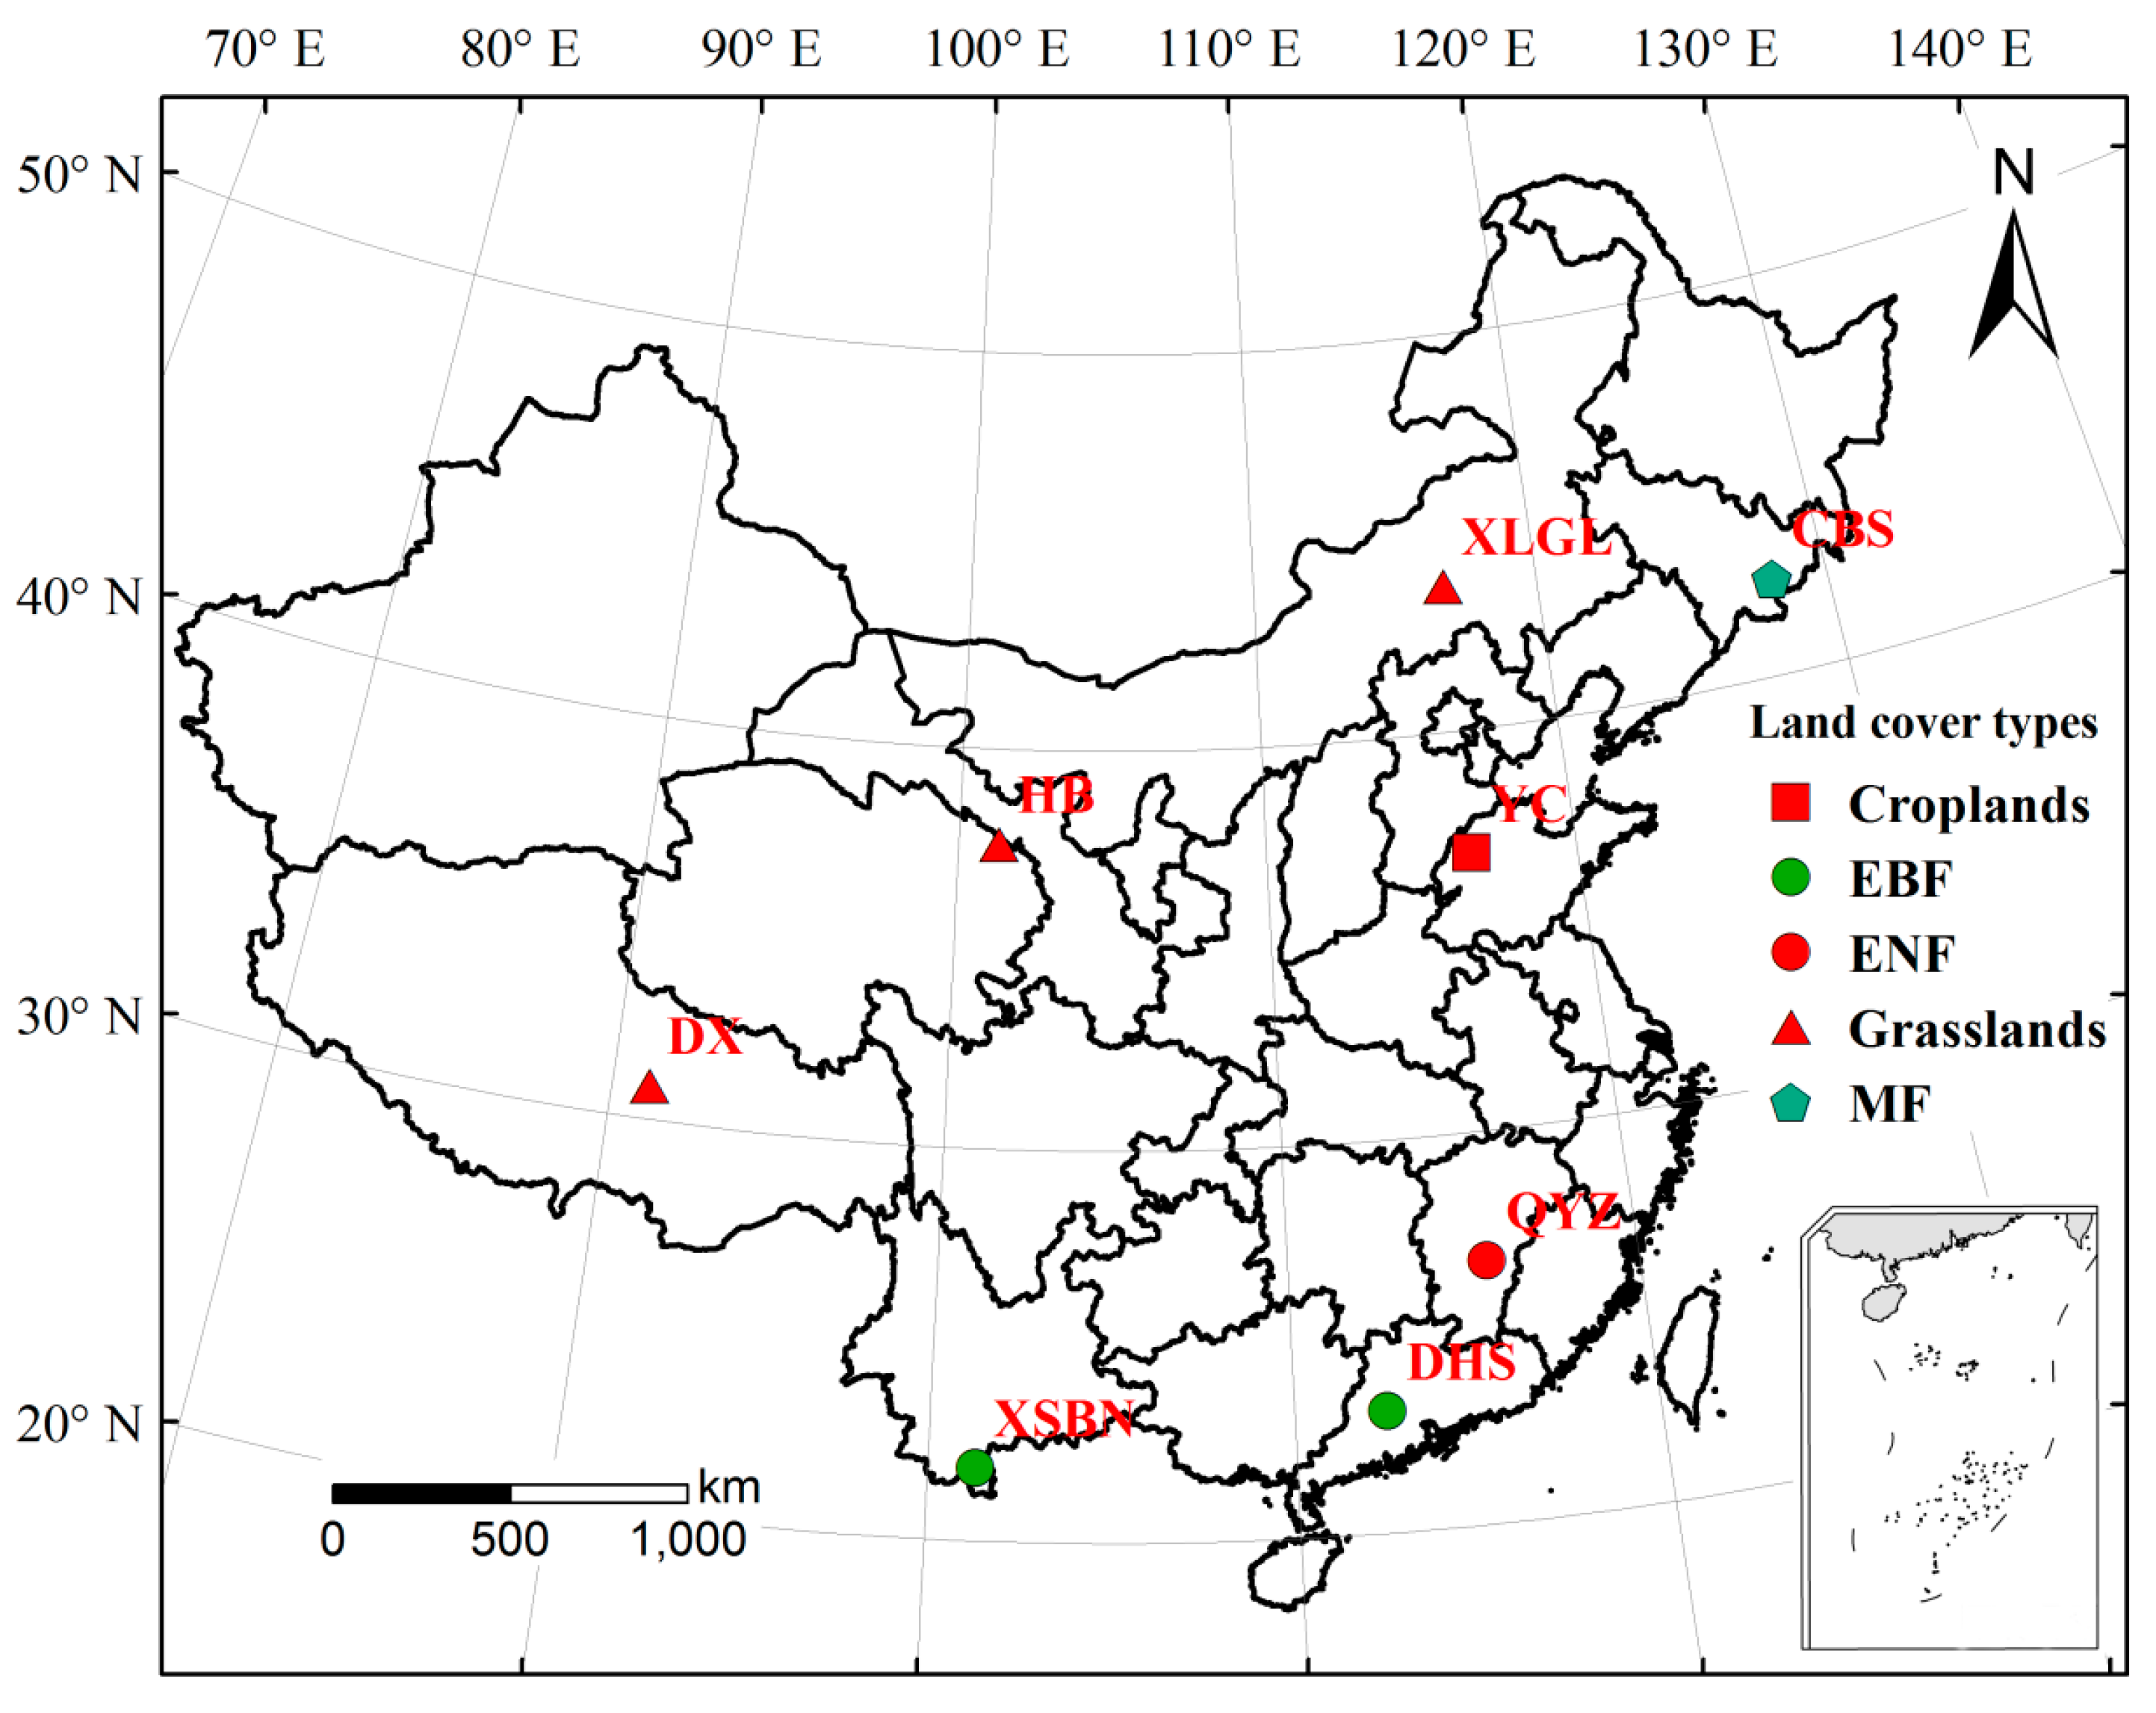
2.1. Study Sites and Flux Measurements

The flux observed net ecosystem exchange (NEE), ecosystem respiration (Re), ET and meteorological data in the period of 2003–2005 were acquired from ChinaFLUX website [20]. The daily data were produced by summing the filled half-hourly values [20,21]. More information about original observed half-hour values is available in Yu et al. [20] and Gao et al. [12]. Gross ecosystem exchange (GEE) is then derived by subtracting Re from NEE as: GEE = NEE − Re. Then, the negative GEE is equal to GPP (GPP = −GEE), and flux derived GPP values are presented in the unit of gC/m2/d. In this study, eight sites include five different land cover types, such as croplands (Yucheng croplands site (YC) in Shandong province), grasslands (Xilinguole grasslands site (XLGL) in Inner Mongolia autonomous region, Haibei grasslands site (HB) in Qinghai province and Dangxiong grasslands site (DX) in Tibet autonomous region), mixed forests (Changbaishan forests site (CBS) in Jilin province), evergreen needleleaf forests (Qianyanzhou forests site (QYZ) in Jiangxi province) and evergreen broadleaf forests (Dinghushan forests site (DHS) in Guangdong province and Xishuangbanna forests site (XSBN) in Yunnan province). A brief description of these sites is presented in Table 1 and Figure 1. For consistency with the time interval of eight-day composite of MODIS-GPP and -ET, we also aggregated the eight-day GPP and ET from the site measurements based on daily values.

2.2. Remote Sensing Data

In this study, all remote sensing data during the period from 2003 to 2005 are eight-day composites at 1-km resolution. MODIS-GPP and -ET datasets were downloaded from Numerical Terradynamic Simulation Group including MOD17 [22] and MOD16 [15] products. GPP products were calculated as follows:
GPP= ε max ×f( T min )×f( VPD )×FPAR×S W rad ×0.45
where ε max is the maximum light use efficiency obtained from LOOKUP table on the basis of land cover types [22]. The attenuation scalars f( T min ) and f( VPD ) are simple linear regression functions of daily minimum temperature (Tmin) and vapor pressure deficit (VPD). Values of Tmin, VPD and SWrad were obtained from the Data Assimilation Office (DAO) dataset. ET products were calculated using Penman-Monteith (PM) equation [23] as follows:
λE= ×A+ ρ a × C p ×( e s e a )/ r a +γ×( 1+ r s / r a )
where λE is the latent heat flux and λ is the latent heat of evaporation; ∆ is the slope of saturation vapor pressure curve; A is available energy partitioned among sensible heat, latent heat and heat fluxes on land surface; ρ a is the mean air density at constant pressure; C p is the specific heat of the air; e s e a is the vapor pressure deficit of the air; r a and r s are the surface and aerodynamic resistances, respectively; γ is the psychrometric constant. In ET products algorithm, ET is calculated as the sum of soil evaporation and plant evapotranspiration. More information about each detailed algorithm is available in Mu et al. [15].
Table 1. Brief descriptions of flux sites in this study. MF: Mixed forests; EBF: Evergreen broadleaf forests; ENF: Evergreen needleleaf forests.
Sites (Abbreviation)Lat(°N)Lon(°E)Data RangeLand Cover
Changbaishan forests site (CBS)42.40128.102003–2005MF
Dinghushan forests site (DHS)23.17112.532003–2005EBF
Qianyanzhou forests site (QYZ)26.75115.672003–2005ENF
Xishuangbanna forests site (XSBN)21.90101.272003–2005EBF
Yucheng croplands site (YC)36.95116.602003–2005Croplands
Haibei grasslands site (HB)37.62101.322003–2005Grasslands
Xilinguole grasslands site (XLGL)43.63116.702003–2004Grasslands
Dangxiong grasslands site (DX)30.8391.122003–2004Grasslands
Figure 1. Spatial distributions of the eight sites in this study. MF: Mixed forests; EBF: Evergreen broadleaf forests; ENF: Evergreen needleleaf forests.
Remotesensing 07 00135 g001
LAI/FPAR (MOD15 products) data were downloaded from Land Processes Distributed Active Archive Center [6]. GLASS-LAI data were obtained from the Center for Global Change Data Processing and Analysis of Beijing Normal University [24,25]. The GLASS-LAI retrieval algorithm employs general regression neural networks (GRNNs) to generate a long time-series of global LAI data [24,26]. GRNNs are trained by fused LAI from MODIS and CYCLOPES and the reprocessed MODIS reflectance of the BELMANIP sites during 2001–2003 [25]. The intercomparison of GLASS-LAI and other products, including MODIS, indicates that the quality of GLASS-LAI data has been greatly improved [26]. The 3 × 3 homogenous pixels (3 × 3 km) around the center of flux towers were extracted for analyses in this study. For missing data owing to bad-quality, linear interpolation and adjacent values are used for gap-filling.

2.3. The Experimental Design

To differentiate the impacts of climatic factors and LAI/FPAR on GPP/ET estimations, we design four experimental groups and take GPP as an example: (1) the original MODIS-GPP products; (2) using in-site meteorology data, MODIS-FPAR and maximum light use efficiency in MOD17 LOOKUP table to estimate GPP (GPP_MOD); (3) using in-site meteorology data, GLASS-FPAR (FPAR = 1 − (exp(−K*GLASS − LAI)) [16], K is set as 0.5 [27].) and maximum light use efficiency in MOD17 LOOKUP table to estimate GPP (GPP_GLA); (4) using in-site meteorology data, GLASS-FPAR and optimized maximum light use efficiency [28] to estimate GPP (GPP_GLA2).

2.4. Analyses

Three indices, including bias, RMSE and R2, were used to comprehensively evaluate the accuracy of MODIS-GPP and -ET in different land cover types over China. Bias can show the deviation between simulations and measurements. RMSE is the index reflecting the difference between overall samples. R2 is the similarity index between samples or fitting degree index between simulations and measurements. They can well evaluate the error of data.

3. Results

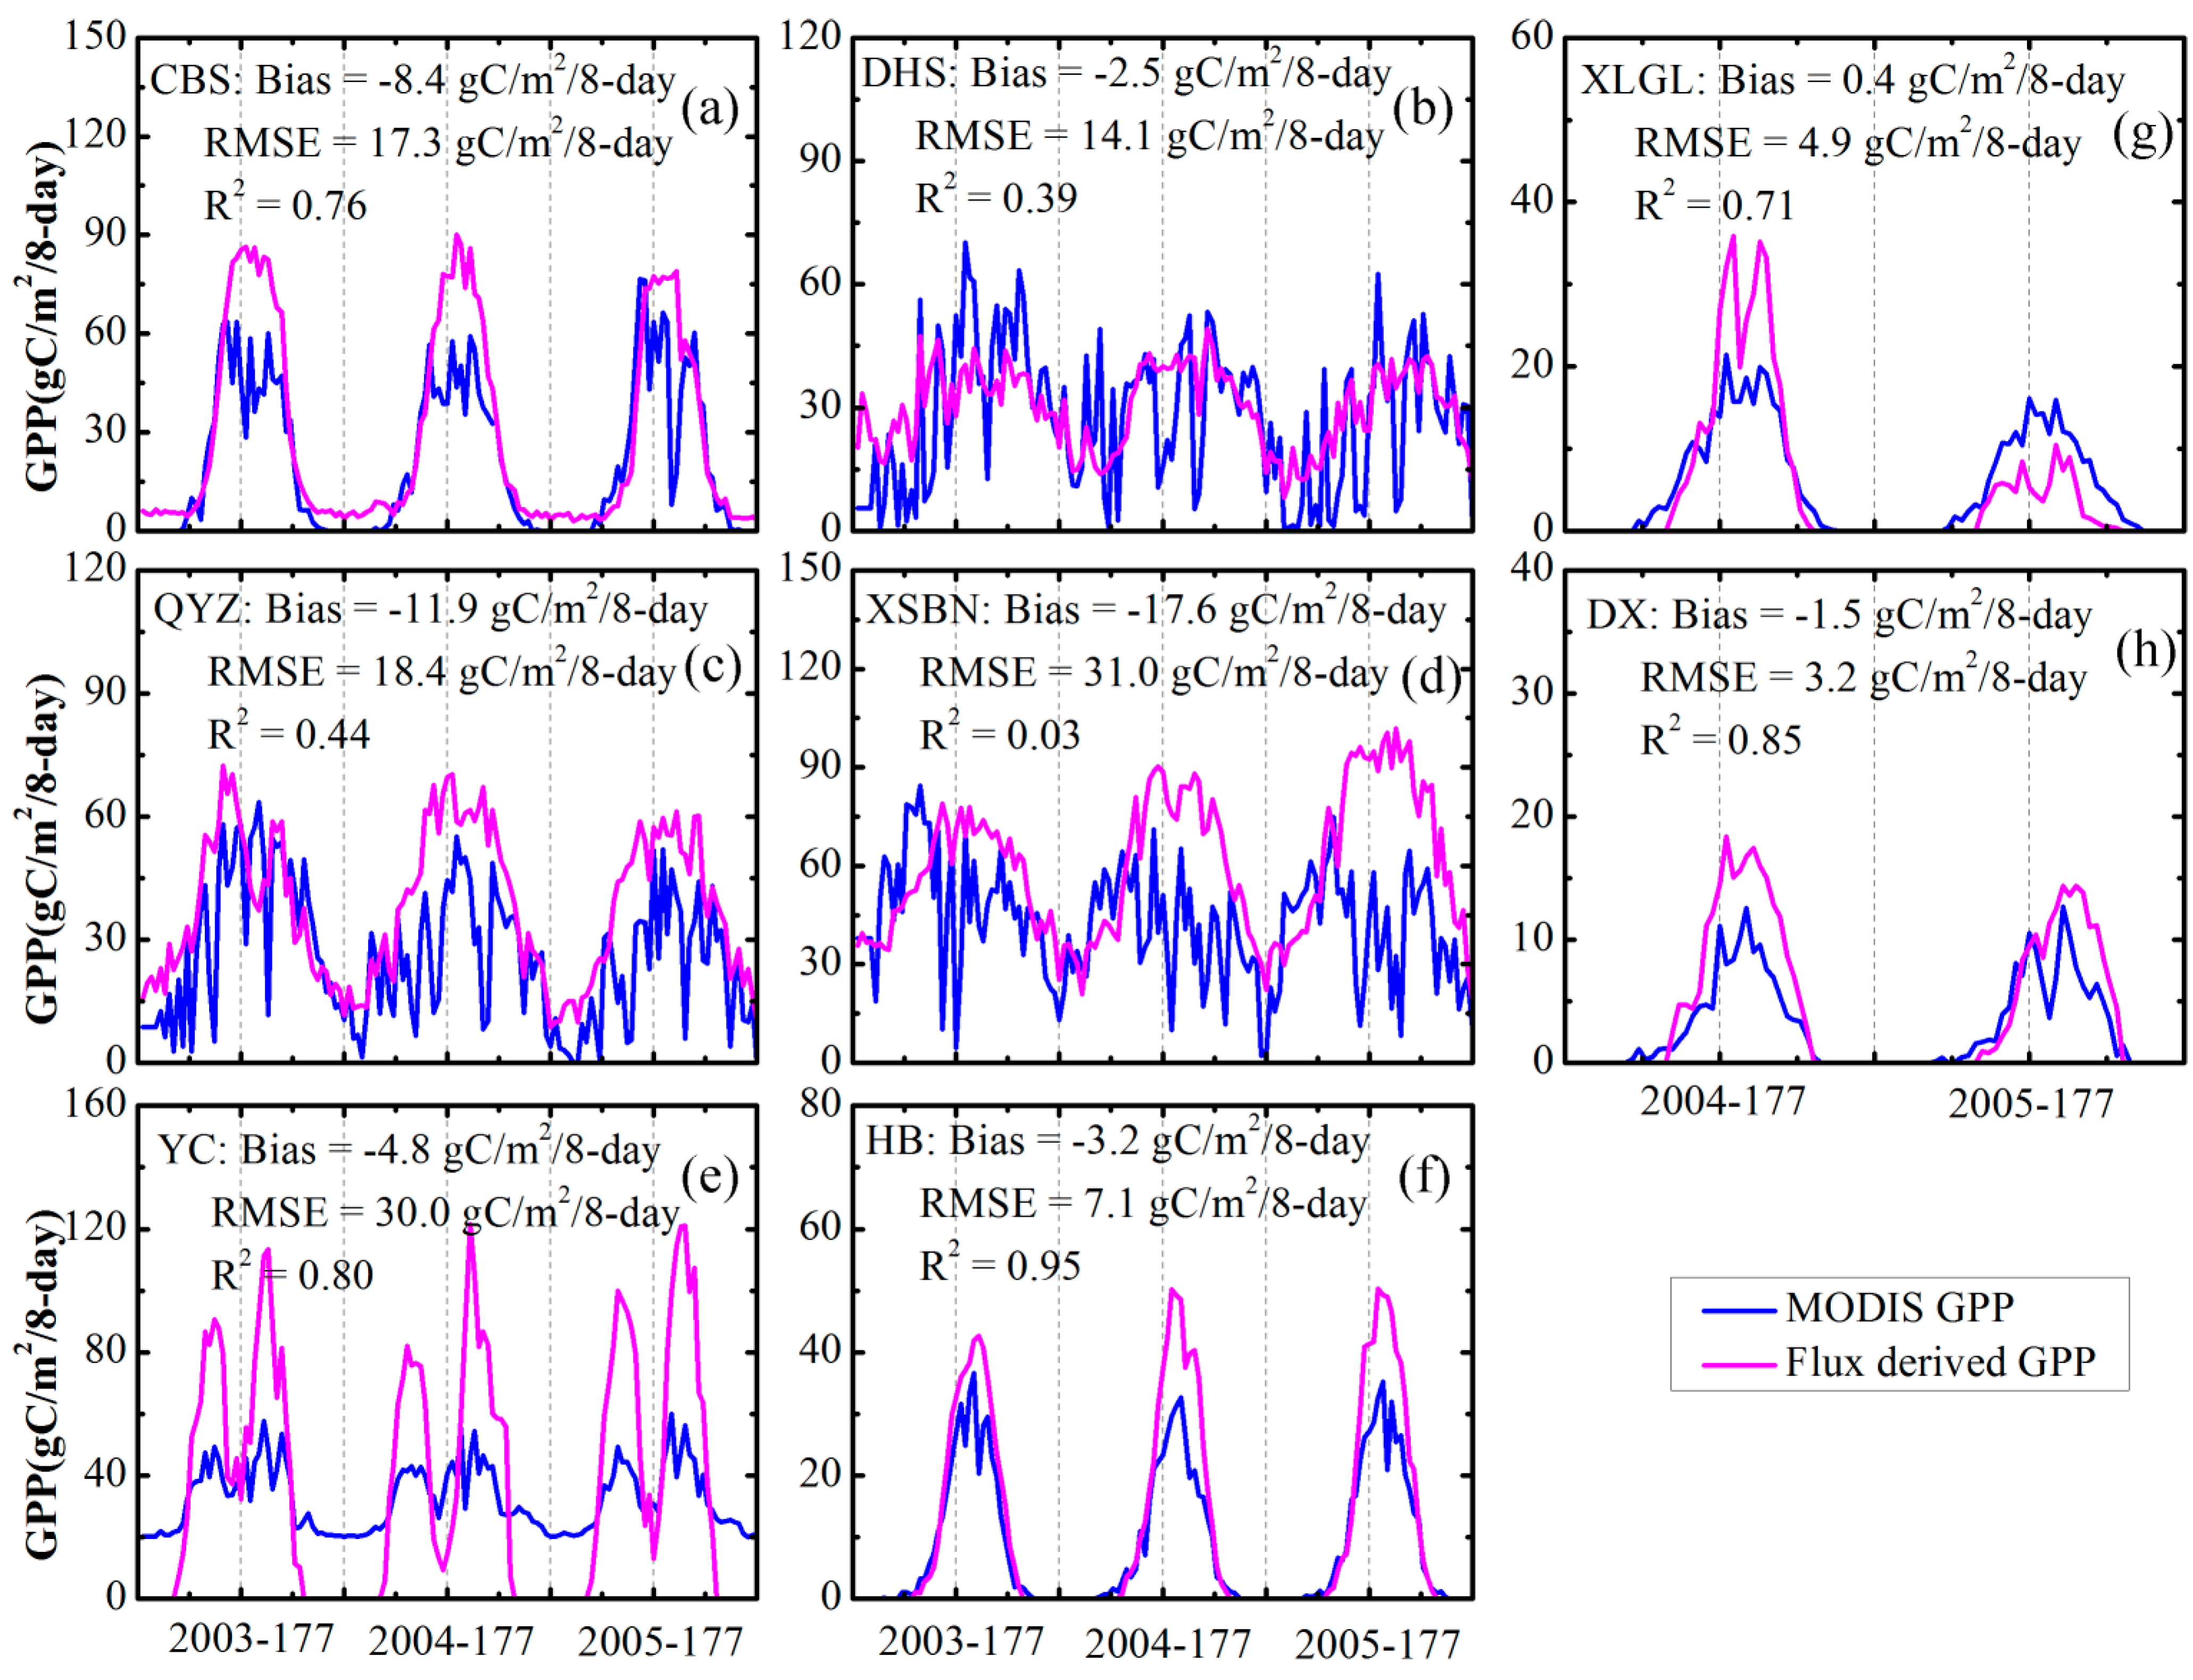
3.1. Comparison of MODIS-GPP and Flux Derived GPP

As shown in Figure 2, MODIS-GPP generally shows seasonal dynamics in different land cover types. For mixed forests (Figure 2a), croplands (Figure 2e) and grasslands (Figure 2f–h), MODIS-GPP presents a high R2 (>0.5) with flux derived GPP. MODIS-GPP of evergreen forests (Figure 2b–d) shows a worse quality than that of the above land cover types with R2 lower than 0.5. For evergreen broadleaf forests (Figure 2b,d), MODIS-GPP has the worst quality with R2 in a range of 0.03–0.44, bias from −2.5 gC/m2/8-day to −17.6 gC/m2/8-day and RMSE from 14.1 gC/m2/8-day to 31.0 gC/m2/8-day. Bias in forests is greater than that in other land cover types. Also, RMSE of MODIS-GPP in forests (Figure 2a–d) and croplands (Figure 2e) are greater than that in grasslands (Figure 2f–h). MODIS-GPP underestimates flux derived GPP during the vigorous growth period in alpine meadow (Figure 2f,h), suggesting that temperature limitation may be a key factor influencing the estimating uncertainty. Additionally, the underestimation of FPAR might also cause the underestimation of estimated GPP. For croplands (Figure 2e), although it has higher R2 (0.80) and smaller bias (−4.8 gC/m2/8-day), measured GPP is still underestimated by MODIS-GPP in growing season and overestimated in non-growing season (Figure 2e), leading to a greater RMSE (30.0 gC/m2/8-day). At CBS site, MODIS-GPP can well show the seasonal change of flux derived GPP with R2 of 0.76, bias of −8.4 gC/m2/8-day and RMSE of 17.3 gC/m2/8-day. For evergreen forests (Figure 2b–d), MODIS-GPP has very large fluctuation for each eight-day, resulting in greater RMSE of MODIS-GPP product.
Figure 2. Comparison between the flux derived GPP (site name_derived) and MODIS-GPP (site name_MODIS) for all sites, pink solid line and blue solid line represent the flux derived GPP and MODIS-GPP, respectively. (a) in mixed forests site; (b) in evergreen broadleaf forests site; (c) in evergreen needleleaf forests site; (d) in evergreen broadleaf forests site; (e) in croplands; (f,g,h) in grasslands site. (DOY: Day of year).
Remotesensing 07 00135 g002

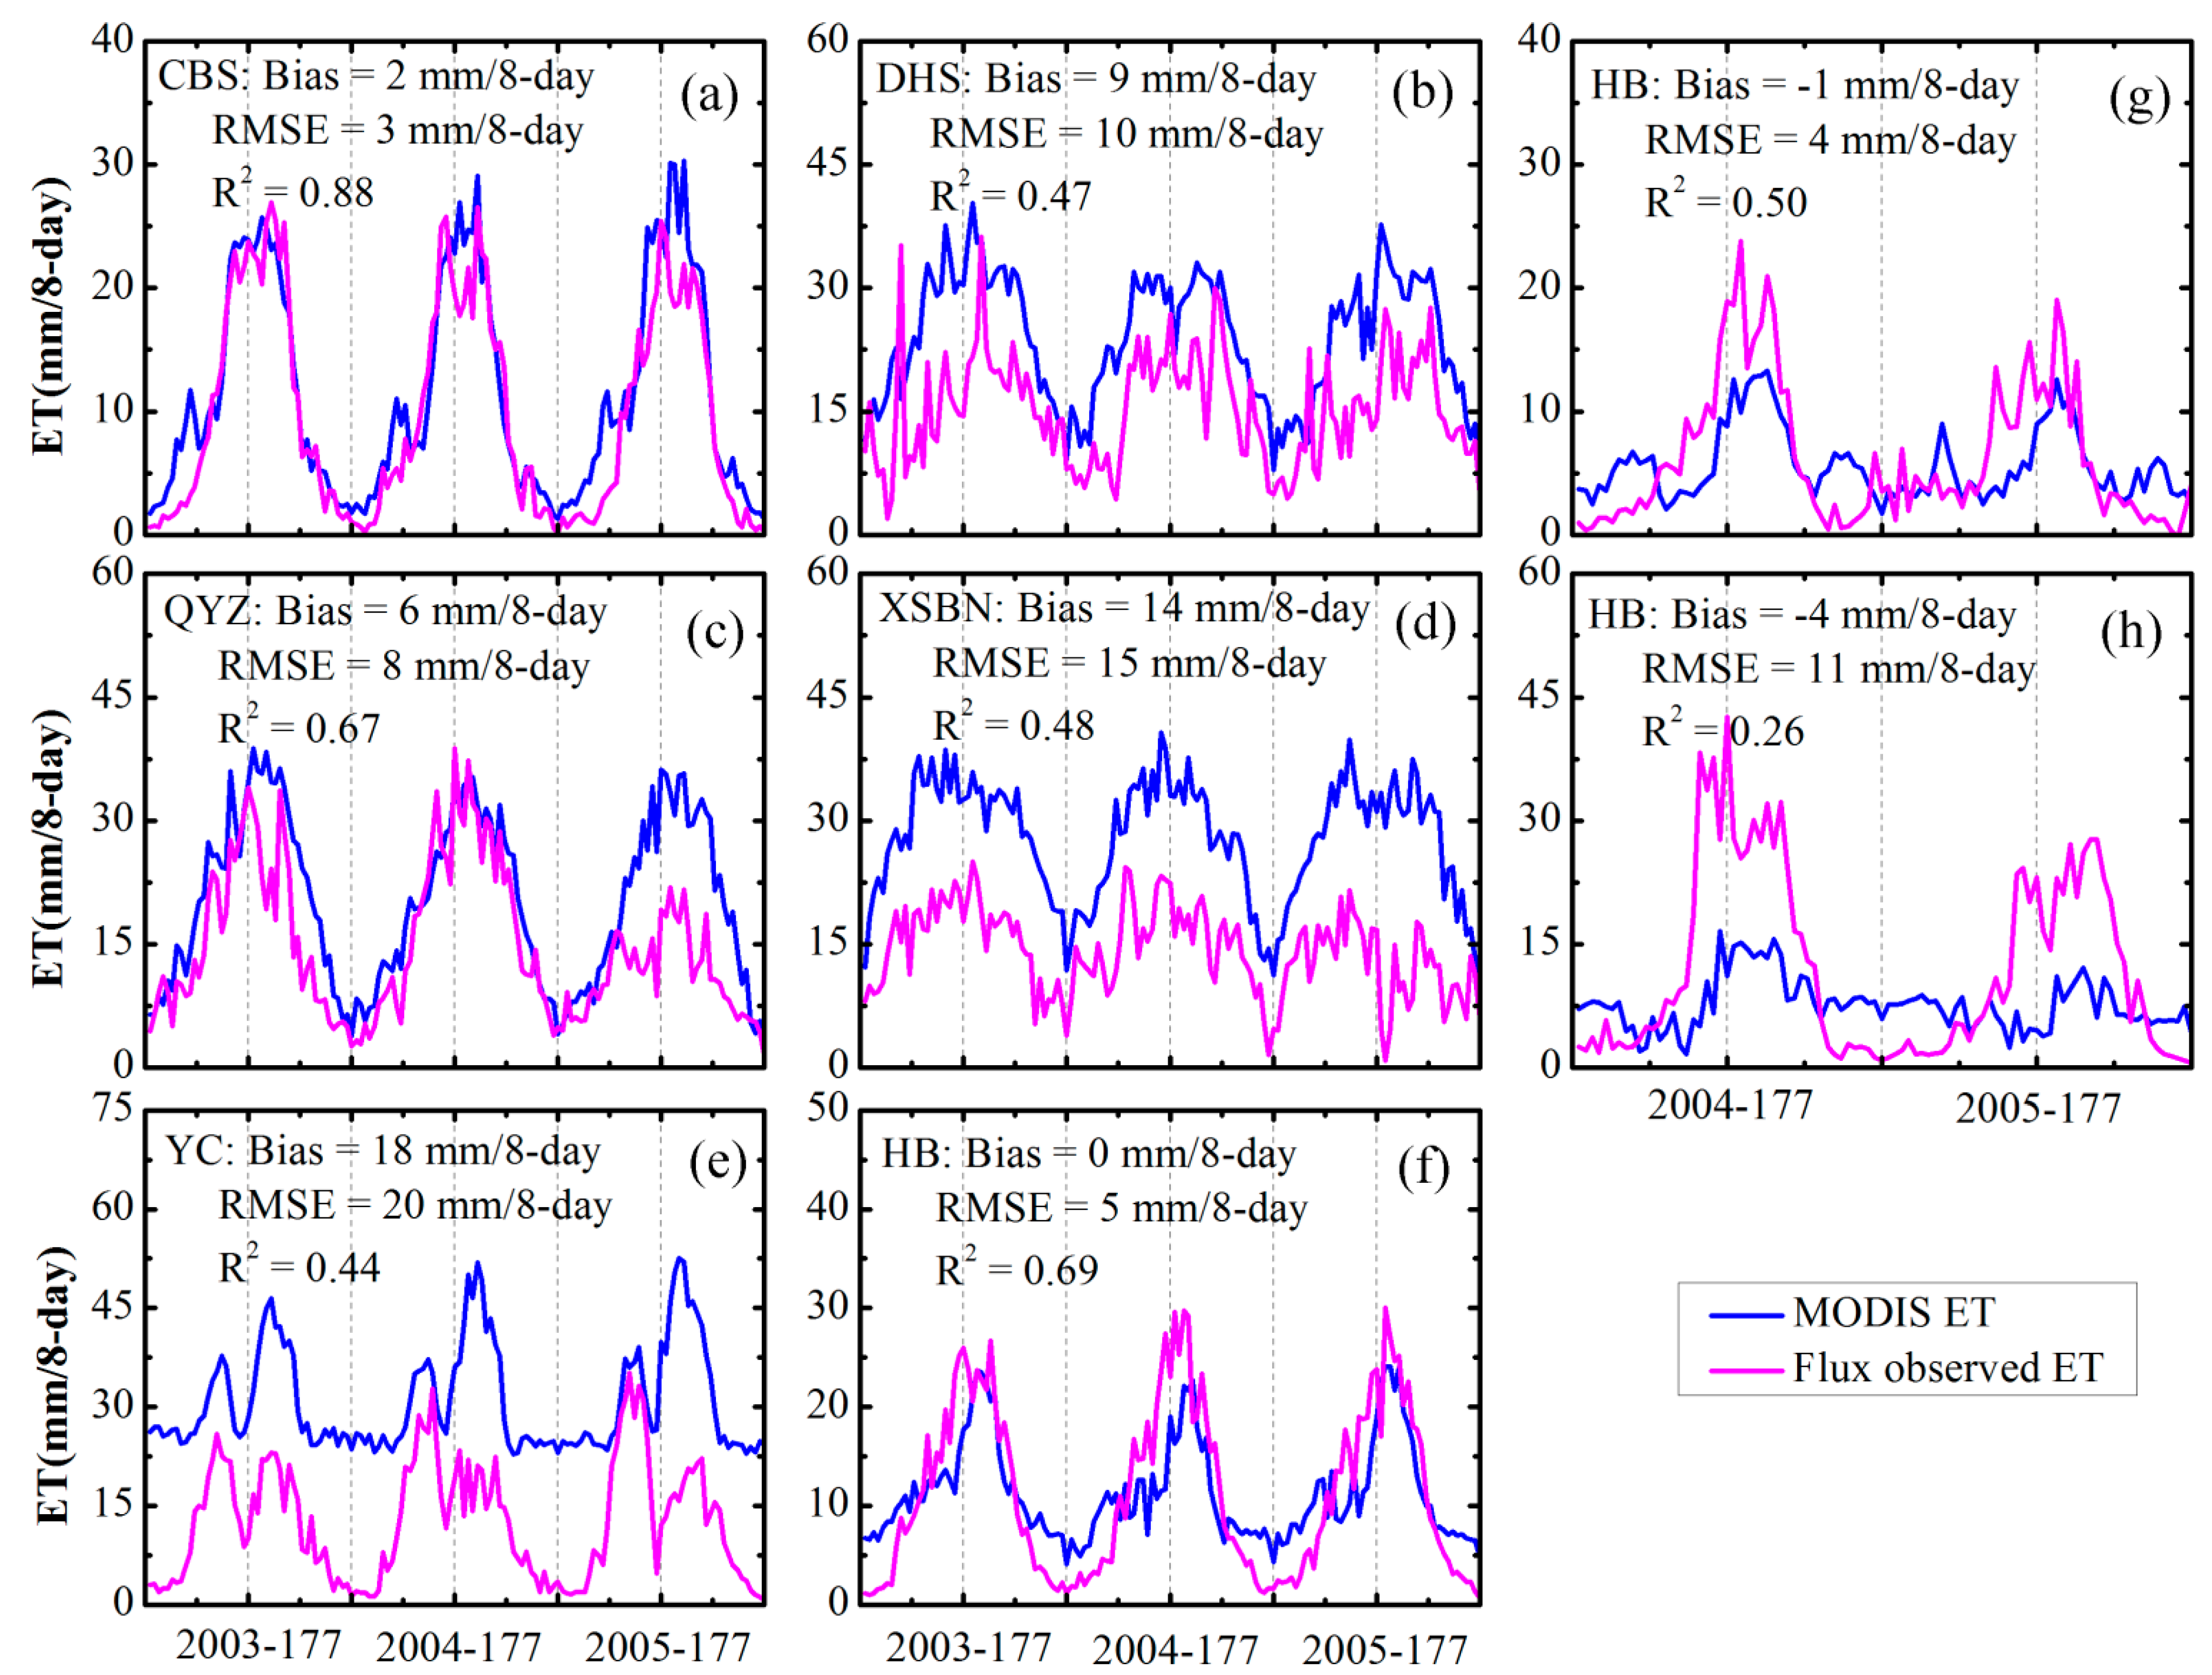
3.2. Comparison of MODIS-ET and Flux Measurements

Generally, MODIS-ET shows a good seasonal dynamic for each site (Figure 3). For mixed forests (Figure 3a), evergreen needleleaf forests (Figure 3c) and alpine grasslands (Figure 3f), MODIS-ET shows higher R2 (>0.5) with flux measured ET. MODIS-ET products at mixed forests site (Figure 3a) have very good fitting accuracy with flux measured ET (R2 = 0.88). MODIS-ET products in evergreen broadleaf forests (Figure 3b,d), croplands (Figure 3e) and temperate grasslands (Figure 3g) show relative higher R2 (slightly lower than 0.5) with flux measured ET. MODIS-ET in alpine meadow site (Figure 3h) shows the lowest fitting degree with flux measured ET (R2 = 0.26). We also analyzed bias and RMSE in different land cover types. Bias in croplands (Figure 3e) is far greater than that in other land cover types with bias of 18 mm/8-day. Evergreen broadleaf forests (Figure 3b,d) also have very high bias (from 9 mm/8-day to 14 mm/8-day). RMSE (from 10 mm/8-day to 20 mm/8-day) of evergreen broadleaf forests (Figure 3b,d), croplands (Figure 3e) and alpine grasslands (Figure 3h) are greater than the RMSE of other land cover types. For alpine grasslands (Figure 3f,h), measured ET is underestimated by MODIS-ET in the growing season and overestimated in non-growing season. For croplands (Figure 3e), MODIS-ET greatly overestimates the whole period of measured ET, thus causing greater RMSE (20 mm/8-day) and bias (18 mm/8-day).
Figure 3. Comparison between the flux observed ET and MODIS-ET for all sites, pink solid line and blue solid line represent the flux observation ET and MODIS-ET, respectively. (DOY: Day of year). (a) in mixed forests site; (b) in evergreen broadleaf forests site; (c) in evergreen needleleaf forests site; (d) in evergreen broadleaf forests site (e) in croplands; (f,g,h) in grasslands site.
Remotesensing 07 00135 g003

3.3. The Sensitivity of Estimates to Climate Factors and LAI/FPAR Data

Through the comparison of the experiment (1) and (2), we can isolate the impact of climate cause on GPP. Table 2 shows that bias, RMSE and R2 between (1) and (2) present similar values, implying that DAO data may be similar to site flux meteorological data. By comparing flux meteorological data with DAO meteorological data, Turner et al. [16] indicated that meteorological data generally performed good agreement for VPD and minimum temperature, but a high bias for DAO PAR. However, the results in YC reveal a high bias. A linear regression method is applied to MODIS-GPP (x) and GPP_MOD (y): y = 0.95x − 18.29 (R2 = 0.91, p < 0.001). The intercept value indicates this high bias. The noise existed in the forced data may result in this high bias when calculating MODIS-GPP products. Zhang et al. [29] pointed out that the annual MODIS-GPP only accounted for 1/5–1/3 for croplands, because the key parameter, maximum light use efficiency, was underestimated for croplands. When using flux measurements and optimized maximum light use efficiency to calculate GPP, they found that the MODIS-GPP algorithm significantly improved the accuracy of GPP estimations. Therefore, Case 1 shows that the differences of climate factors may have little impact on GPP estimation.
Table 2. Comparison between the flux derived GPP and (1) the original MODIS-GPP products; (2) using in-site meteorology data, MOD17 maximum light use efficiency and MODIS-FPAR to estimate GPP (GPP_MOD); (3) using in-site meteorology data, MOD17 maximum light use efficiency and GLASS-FPAR to estimate GPP (GPP_GLA); and (4) using in-site meteorology data, optimized maximum light use efficiency and GLASS-FPAR to estimate GPP (GPP_GLA2) for each site, respectively. Where, CBS in mixed forests site; DHS and XSBN in evergreen broadleaf forests site; QYZ in evergreen needleleaf forests site; YC in croplands; HB, XLGL and DX in grasslands site.
CBSDHSQYZXSBNYCHBXLGLDX
Bias(1)−8.4−2.5−11.9−17.6−4.8−3.20.4−1.5
RMSE(1)17.314.118.431.030.07.14.93.2
R2(1)0.760.390.440.020.800.950.710.85
Bias(2)−8.5−0.7−15.7−17.3−24.8−1.60.9−0.5
RMSE(2)17.415.220.231.438.75.74.82.1
R2(2)0.750.420.480.000.790.940.720.89
Bias(3)−5.711.1−11.3−11.2−24.7−1.00.3−0.4
RMSE(3)11.315.312.922.938.03.94.11.7
R2(3)0.900.710.880.160.850.980.790.92
Bias(4)−4.7−7.7−13.4−33.63.12.01.80.6
RMSE(4)10.89.415.039.015.23.44.62.1
R2(4)0.900.710.880.160.850.980.790.92
Through comparing the experiment (2) with (3), we can explain the impact of LAI/FPAR on GPP, since (2) and (3) have the same meteorological data but the different FPAR. Table 2 shows that GPP_GLA has lower bias and RMSE and a higher R2 than GPP_MOD. By substituting MODIS-FPAR with GLASS-FPAR in MODIS-GPP algorithm, it results in improving the accuracies of GPP estimations because of using the higher quality of GLASS-LAI/FPAR. The accuracies of GPP estimations improve by 2% for DHS to 43% for QYZ. Thus, accurate remote sensing parameters are important for achieving reliable estimations. The errors of MODIS-GPP/ET products are mainly caused by inaccuracy of LAI/FPAR.
By comparison of the experiment (3) and (4), the MOD17 maximum light use efficiency is comparable with the optimized value based on flux observed calibration, especially in mixed forests, evergreen needleleaf forests and grasslands. Their bias and RMSE do not significantly change. For croplands, the bias significantly decreases from −24.7 gC/m2/8-day to 3.1 gC/m2/8-day and RMSE significantly decreases from 38.0 gC/m2/8-day to 15.2 gC/m2/8-day. Croplands generally have strong management, such as irrigation and fertilization, which significantly affect photosynthesis capacity, thus the maximum light use efficiency may have a large variation in different regions.

4. Discussion

4.1. The Representativeness of Sites and Results

In this study, the flux observed or derived data of eight sites were used for examining the performances of MODIS-GPP and ET products. The eight sites of ChinaFLUX were selected to represent major ecosystem and climate types in China [20]. Four forests sites (CBS, DHS, QYZ and XSBN) locate in the eastern part of China and they are affected by monsoon climate. Among them, CBS, QYZ and DHS are distributed along the North-South Transect of Eastern China. Three grasslands sites (XLGL, HB and DX) spanned from Daxinganling Mountain Range in the northeast to the Tibetan Plateau in the southwest along the Temperate-Alpine Rangeland Transect. CBS and XLGL sites are distributed along the North East Chinese Transect, which is a bridge between forests transect and grasslands transect. A cropland site (YC) is located in the North China Plain in which the dominant land cover is irrigated croplands of double-cropping winter wheat and summer maize. All eight sites are critical in regulating climatic change on the Eurasian continent and the selection of all sites is a trade-off between micrometeorological criteria and ecological considerations [20]. Given the above-mentioned sites representativeness, the flux observed data of eight sites may well represent the net ecosystem exchanges of CO2, H2O and heat in major ecosystems.
Ideally, GPP validating sites should cover as many as land cover types and climate regimes as possible. However, limited available filed dataset generally cannot meet the requirement of validation. In this study, the flux towers are located across China from 20°N to 45°N and represent five land cover types: mixed forest, evergreen needleleaf forests, evergreen broadleaf forests, grasslands and croplands. This study shows MODIS-GPP underestimates flux derived GPP with R2 of 0.58, bias of −6.7 gC/m2/8-day and RMSE of 19.4 gC/m2/8-day for all sites. Compared with results of Zhao et al. [17], we find that MODIS-GPP has a better performance in USA (R2 is about 0.70 and relative error is 19%) than in China. In their validation, the land cover types mainly include deciduous broadleaf forests, evergreen needleleaf forests, mixed forests, shrublands and grasslands across North America from the middle latitude to the polar region. The differences of land cove types in both regions can potentially affect the validation results. In addition, we find that the MODIS-GPP accuracy for evergreen broadleaf forests (Figure 2b,d) is the worst among all land cover types, suggesting that the performances in evergreen broadleaf forests have yet to be further optimized.
Mu et al. [15] indicated that bias significantly increased by 24.1%, RMSE also slightly increased, but the correlation coefficients of the measured ET with estimated ET decreased to 0.58 (R2 is about 0.34) across 46 towers, when they utilized the DAO meteorological data to run the improved ET algorithm in America. Their validated results are close to our results that present that MODIS-ET usually overestimates the observed ET with R2 of 0.36, bias of 6 mm/8-day and RMSE of 11 mm/8-day for all eight sites.

4.2. Impact of Maximum Light Use Efficiency on GPP Estimate

The maximum light use efficiency is one of most important parameter in light use efficiency model to affect the GPP estimates. Zhang et al. [29] suggested that an important reason for underestimated GPP in croplands was that the maximum light use efficiency was underestimated. Using the optimized maximum light use efficiency (17.66 gC/MJ/8-day) replacing MOD17 algorithm recommended value (5.44 gC/MJ/8-day), Liu et al. [28] found RMSE decreased from 80.87% to 48.43% and bias changed from 4.83 gC/m2/8-day to 2.85 gC/m2/8-day when estimating GPP, indicating that adjusting the MOD17 maximum light use efficiency is necessary for the GPP estimate of croplands. The maximum light use efficiency of EBF is also underestimated in MOD17 algorithm except that in croplands. But for MF, ENF and grasslands, the maximum light use efficiency values in MOD17 algorithm were close to the optimized values. In addition, this study suggested that optimized maximum light use efficiency was effective for reducing the bias and RMSE between estimated GPP and flux derived GPP (Table 2), owing to that it changed the magnitude of GPP value, however, only optimized maximum light use efficiency did not change the R2 of estimated GPP with flux derived GPP.

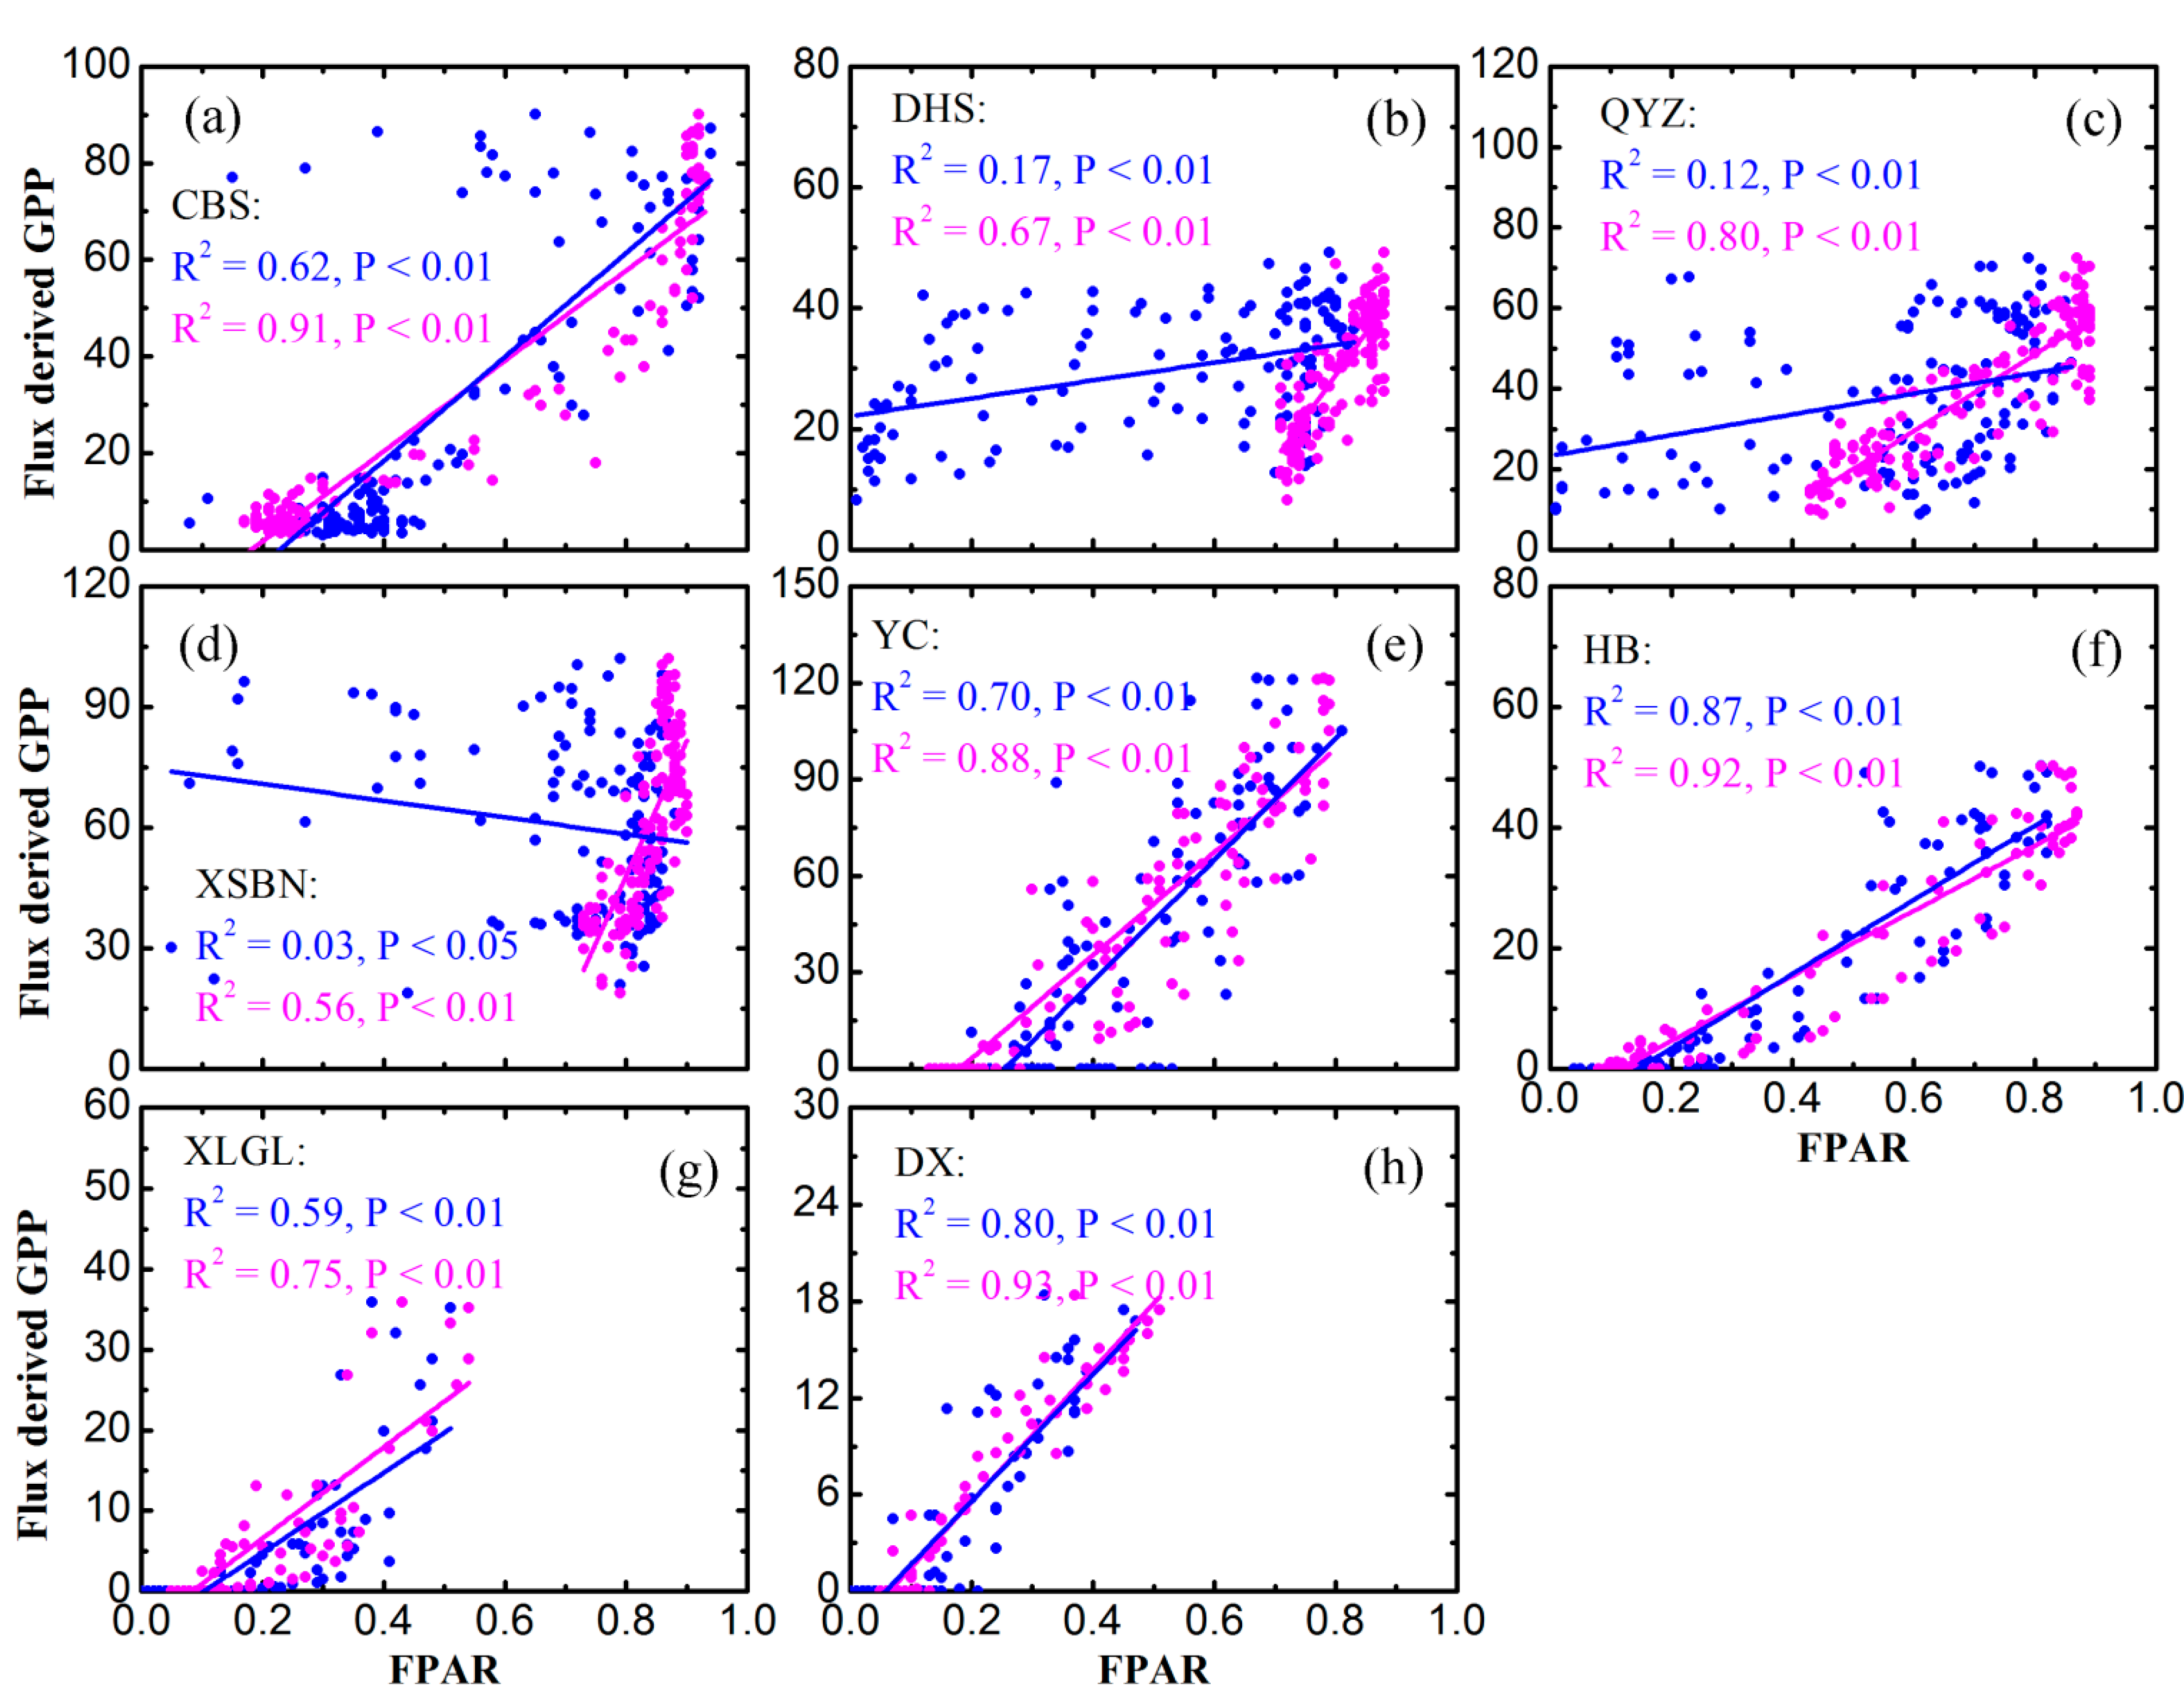
4.3. Impact of Different Remote Sensing FPAR on GPP

As an “internal” factor, FPAR can potentially determine a very important part in remote sensing-based GPP model and directly related to the primary mechanism of the canopy photosynthetic process [30]. In MODIS-GPP algorithm, light, temperature, and water are just the “external” environmental stresses, which will limit maximum light use efficiency, while FPAR as remote sensing forcing data can determinate the seasonal change of GPP through adjusting PAR absorbed by the vegetation.
In experiment (3), after we replaced MODIS-FPAR with GLASS-FPAR, R2 values between estimated GPP and flux derived GPP increased by 0.16 (XSBN) ~0.40 (QYZ), implying that the error of MODIS-FPAR significantly affects estimated GPP in experiment (2). By comparing MODIS-FPAR with GLASS-FPAR, the results show R2 values for evergreen forests (DHS, QYZ and XSBN) are lower than 0.16 and RMSE values are greater than 0.23 (Table 3). In contrast, R2 values of MODIS-FPAR and GLASS-FPAR in grasslands (HB, XLGL and DX) are more than 0.80, and RMSE and bias are close to 0. Therefore, the accuracy of estimated GPP using MODIS-FPAR is comparable with that using GLASS-FPAR. Generally, the estimated GPP based on GLASS-FPAR more approaches flux derived GPP. For mixed forests and croplands, MODIS-FPAR also gives a good performance with higher R2 and lower bias. Thus, when using GLASS-FPAR to calculate GPP, the result only performed a little improvement compared with estimating GPP based on MODIS-FPAR.
Table 3. Comparison between MODIS-FPAR and GLASS-FPAR. Where, CBS in mixed forests site; DHS and XSBN in evergreen broadleaf forests site; QYZ in evergreen needleleaf forests site; YC in croplands; HB, XLGL and DX in grasslands site.
CBSDHSQYZXSBNYCHBXLGLDX
Bias0.01−0.28−0.12−0.120.040.000.030.00
RMSE0.170.380.260.230.130.070.060.06
R20.710.060.160.010.720.960.880.80
As shown in Figure 4, the flux derived GPP fluctuation is consistent with that of FPAR during the vigorous growth period in CBS, especially for GLASS-FPAR (R2 = 0.91). It can be concluded that the differences between MODIS-GPP and flux derived GPP are mainly caused by MODIS-FPAR during these period (Figure 4a). In subtropical regions, clouds can often impact satellite observations. Therefore, FPAR appears very large fluctuation for each eight-day in subtropical evergreen forests. Although the fluctuation of MODIS-FPAR has been processed by temporal filtering method in MODIS-GPP algorithm [17], our study finds that the impact of contamination MODIS-FPAR on GPP still exists. Statistical analysis suggests that such MODIS-FPAR fluctuation leads to MODIS-GPP fluctuation and then results in the large bias and RMSE of MODIS-GPP compared with flux derived GPP. In Figure 4b–d, the relationship between flux derived GPP and GLASS-FPAR gives higher R2 ranging from 0.56 to 0.80, however, R2 of flux derived GPP and MODIS-GPP only ranges from 0.03 to 0.17. Our results also reveal that MODIS-FPAR/GLASS-LAI in evergreen forests (Figure 4b,d) showed a saturation phenomenon with most values centralized in the range from 0.8 to 0.9. In the non-growing season, MODIS-FPAR is greater than 0.2 in croplands (Figure 4e); while it is generally lower than 0.1 in grasslands (Figure 4f–h). As MODIS-FPAR in croplands can explain 70% variations for flux derived GPP, the overestimation in non-growing season and underestimation in growing season of MODIS-GPP compared with the flux derived GPP can basically attributed to MODIS-FPAR error which was overestimated/underestimated by remote sensing data in corresponding seasons. GLASS-FPAR explains 88% variations for flux derived GPP in croplands. Thus, when using a better accuracy GLASS-FPAR to estimate GPP, R2 increased from 0.80 to 0.85. For grasslands (Figure 4f–h), MODIS-FPAR and flux derived GPP has a higher R2 and shows a consistent variation in the vigorous growth period. Through these analyses at site scale, it shows that improving the accuracy of FPAR is essential for GPP estimations.
FPAR shows a very high correlation with flux derived GPP, which can be explained biophysically with observations that larger canopy and longer growing season allow vegetation to absorb more PAR and assimilate more carbon [31]. In turn, as more carbon transformed to GPP, more carbon will be assigned to leaf production, which caused larger FPAR and it can maintain the balance by absorbing more PAR. If other factors, such as light, temperature and water, are not restricted, change of FPAR should explain more variations of GPP. Furthermore, it is also observed that FPAR can well capture the dynamics of interannual GPP, but the deviation is larger in the short term which may be caused by short-term stress effect due to light, temperature, water, etc. By analyzing the correlations between MODIS-NDVI, -EVI, -LAI and -FPAR products with short-term and annual flux measured GPP, Hashimoto et al. [31] pointed out that EVI was useful for the analysis of short-term variation in site-estimated GPP. The relationship between EVI and GPP has also been widely used in classic remote sensing GPP models [2,7,8]. EVI may display better short-term variation of GPP than FPAR and thus could potentially improve the accuracy of MODIS-GPP. MODIS-FPAR is derived from MODIS-LAI/FPAR algorithm (a complex three-dimensional radiative transfer model with LOOKUP table inversions per biome type [32]), differing form the early method of empirical relationships between values of LAI/FPAR and NDVI, but MODIS-FPAR is linearly proportional to NDVI [32]. Like NDVI, MODIS-FPAR is sensitive to canopy background variations and saturates in areas with dense tree canopy (i.e., Figure 4), while EVI is developed to optimize the canopy background information with improved sensitivity in high biomass areas and improved vegetation monitoring through a decoupling of the canopy background signal and a reduction in atmosphere influences [2,33,34,35].
Figure 4. Relationship between flux derived GPP (with gC/m2/8-day) and GLASS-FPAR (pink)/MODIS-FPAR (blue) for each site. (a) in mixed forests site; (b) in evergreen broadleaf forests site; (c) in evergreen needleleaf forests site; (d) in evergreen broadleaf forests site; (e) in croplands site; (f,g,h) in grasslands site.
Remotesensing 07 00135 g004

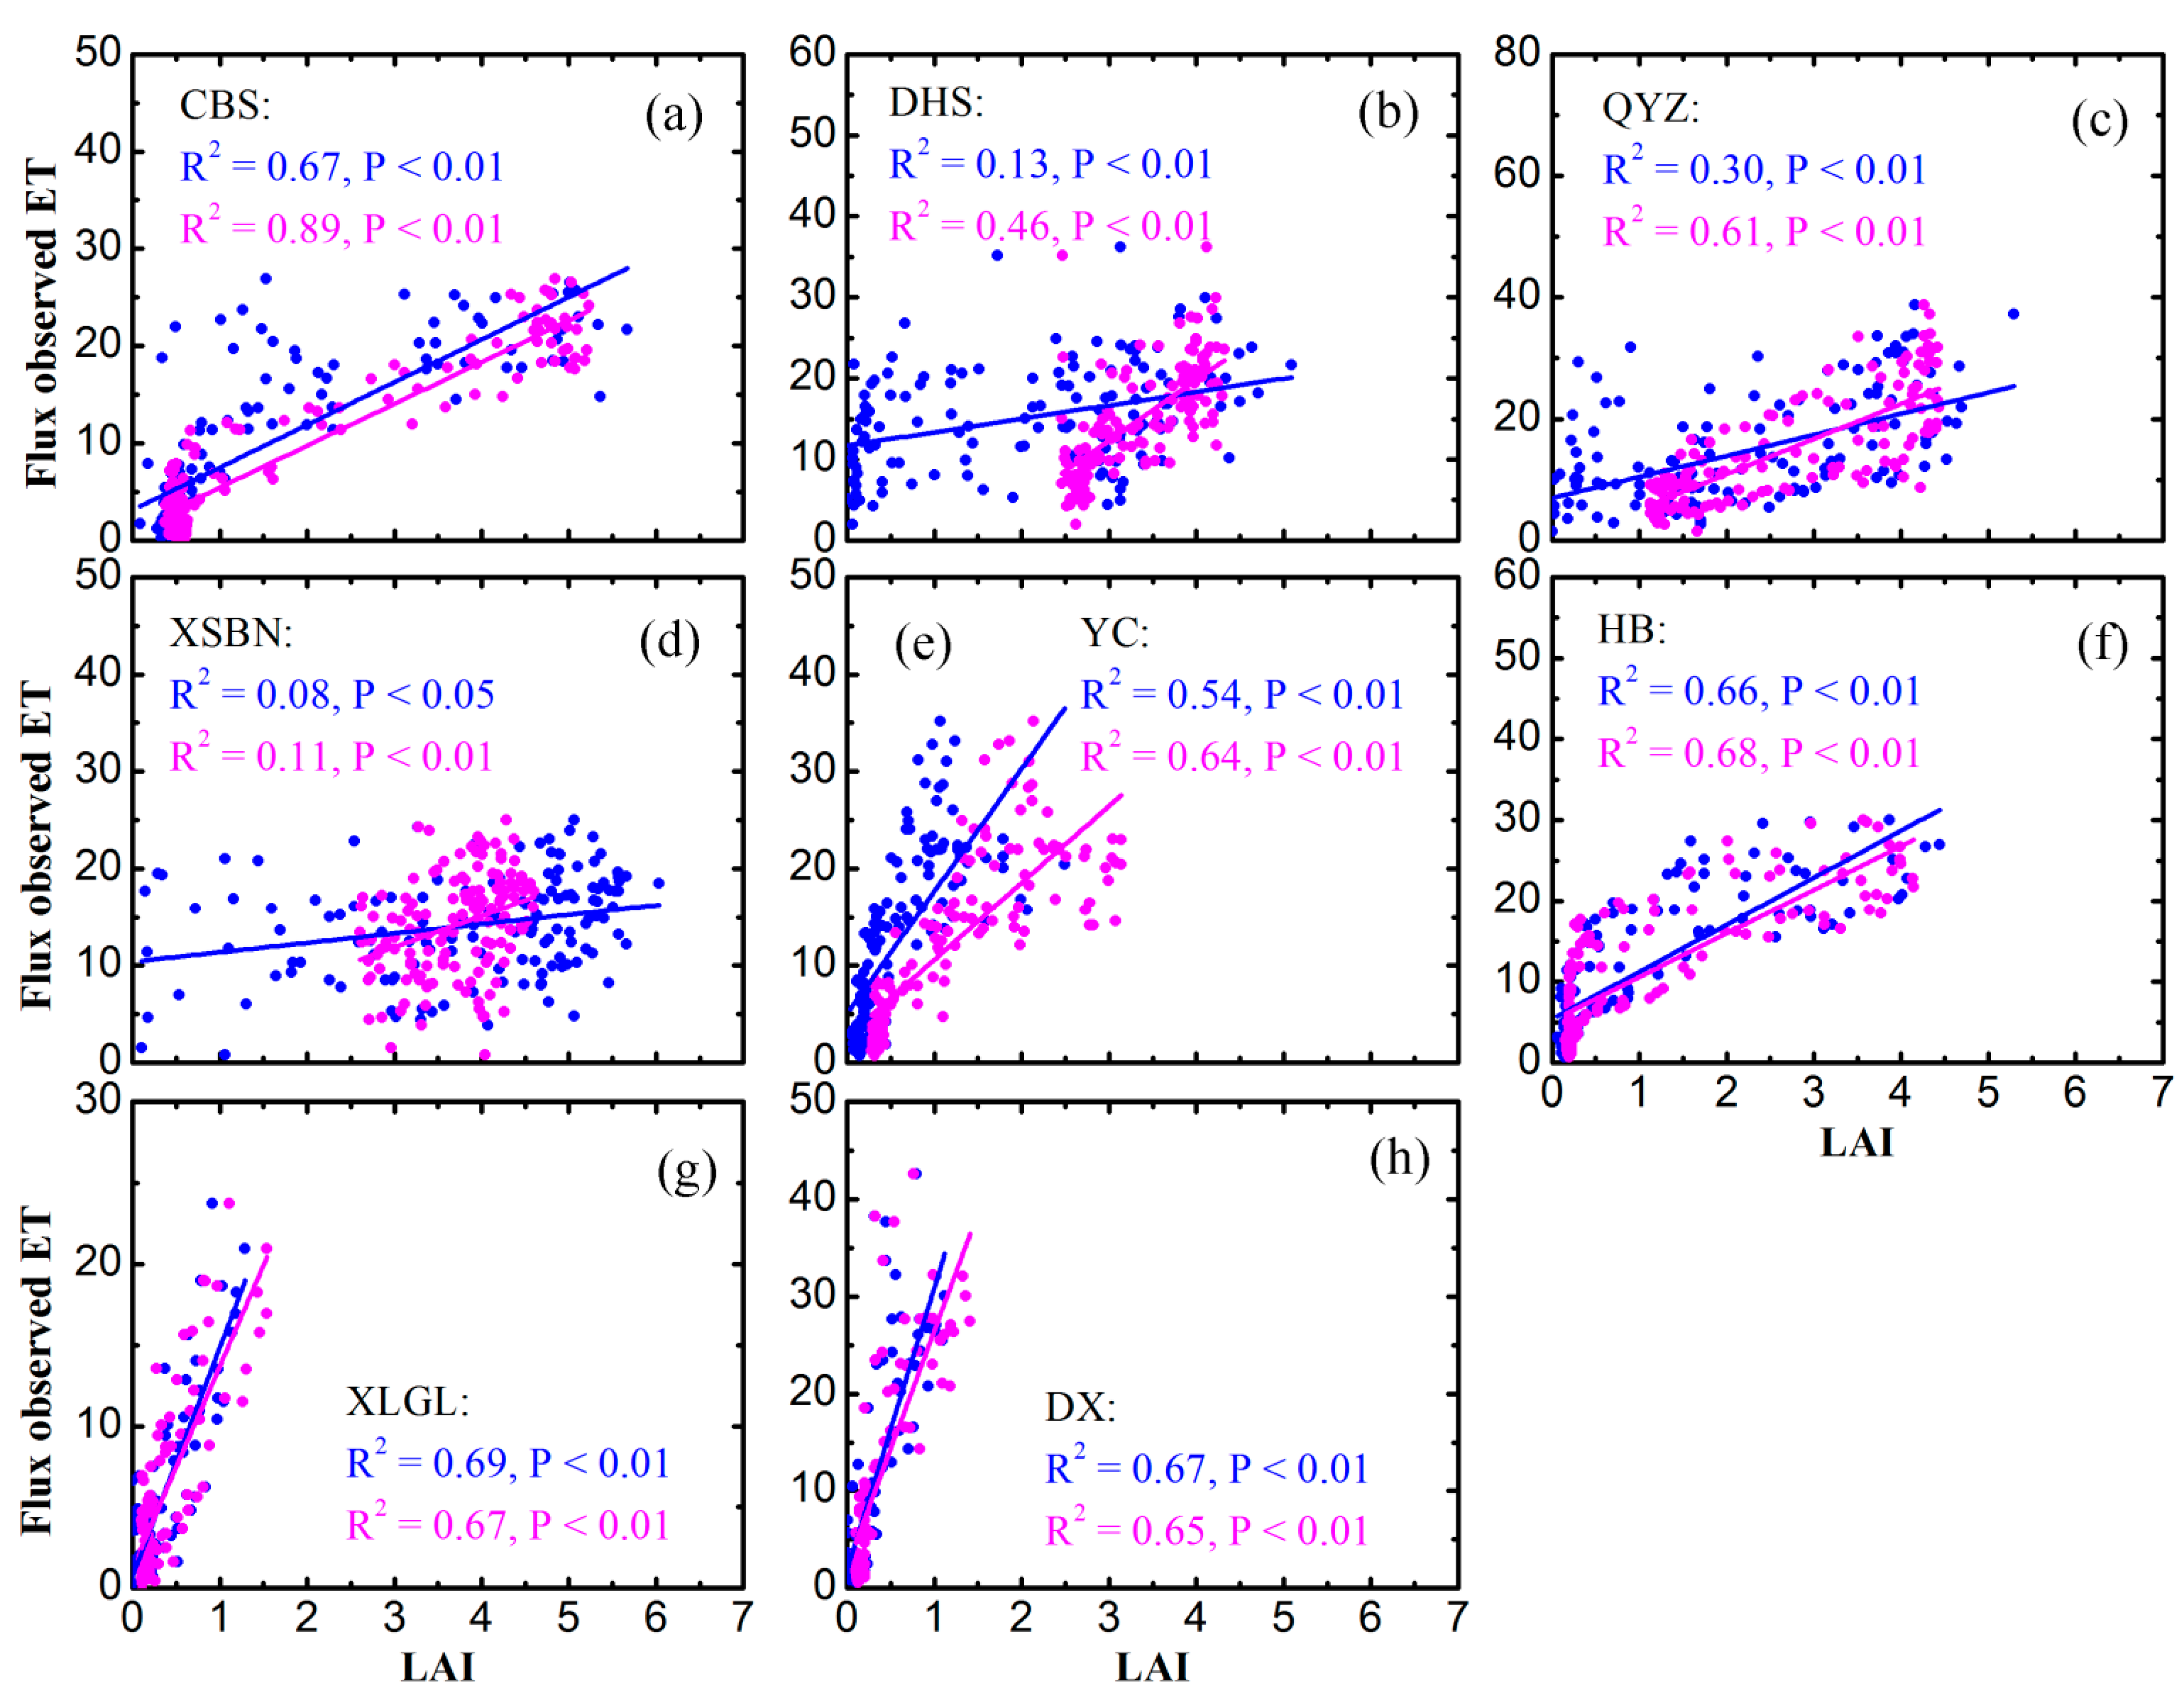
4.4. Impact of Different Remote Sensing LAI/FPAR on ET

Many studies have shown that LAI/FPAR and ET have a very good relationship via in-situ observations and it has been widely applied in ecosystem process models. For example, in BEPS-EASS model, canopy LAI is directly involved in the calculation process of canopy ET [27,36,37]. In addition, canopy ET usually occupies a large proportion in total ET. The relationship between LAI/FPAR and ET can be explained biophysically that LAI changes will affect stomatal conductance, further affect vegetation transpiration rate [38]. On the basis of an analysis of the carbon sequestration, vegetation controls the size of stomatal opening to absorb more carbon dioxide from the surrounding air, but at the same time it will also consume more water [31]. As assimilated more carbon is fixed as GPP, the corresponding allocation to leaf production also increases and further promotes LAI increasing and water consumption [39,40]. Without restriction of other environmental factors, the change of ET agrees with that of LAI/FPAR, since LAI/FPAR plays an important and positive role in calculating ET [27].
Figure 5. Relationship between flux observed ET (with mm/8-day) and GLASS-LAI (pink)/MODIS-LAI (blue) for each site. (a) in mixed forests site; (b) in evergreen broadleaf forests site; (c) in evergreen needleleaf forests site; (d) in evergreen broadleaf forests site; (e) in croplands; (f,g,h) in grasslands site.
Remotesensing 07 00135 g005
As shown in Figure 5, statistical analysis between flux observed ET and MODIS-LAI at site scale shows that MODIS-LAI can explain more than 50% variations of flux observed ET in five sites (CBS, YC, HB, XLGL, and DX, p < 0.01). For evergreen forests, GLASS-LAI with flux observed ET gives a higher R2 when comparing with that of MODIS-LAI. In particular, R2 increased by more than 30% in DHS and QYZ, owing to that GLASS-LAI values aggregated more relative to the scatter of MODIS-LAI. For evergreen broadleaf forests (Figure 5b,d), the fluctuation of MODIS-LAI is very large in the vigorous growth period, so the quality of MODIS-LAI directly impacted on the final ET. Thus, the consistency of MODIS-ET and flux measured ET is relatively poor. The reason of overestimated ET in croplands (Figure 5e) is hard to explain only by analyzing the relationship between LAI and flux observed ET, which is probably coming from the setting of key parameters in ET algorithm. Sun et al. [41] indicated that when using MODIS-ET algorithm to calculate cropland’s vapor flux, the estimated ET was about 20% more than the measured ET during the growing season of winter wheat. After they calibrated the crop physiological temperature parameters and coefficients for calculating the aerodynamic resistance and the fractional vegetation cover, the estimated results became more close to the measured values. Although R2 varies from different land cover types, MODIS-LAI and flux observed ET generally show the same fluctuations at each site. The above results indicated that the accuracy of remote sensing LAI might directly impact the accuracy of ET.

4.5. Uncertainties, Errors, and Accuracies

The concept of FPAR or FPARcanopy (the fraction of photo-synthetically active radiation absorbed by plant canopies) is employed in this studies, just like it is widely used in many classical models, such as GLO-PEM [42], 3-PG [43], MODIS-PSN [44], C-Fix [45], EC-LUE [46], etc. However, only the PAR absorbed by chlorophyll (FPARchl) or other photosynthetic pigments throughout the canopy is used for photosynthesis. Therefore, A few studies indicate that this widely used FPARcanopy has proved to be physiologically insufficient to calculate GPP [47,48,49,50]. For all this, they utilize MODIS reflectance products to calculated FPARcanopy and FPARchl, and evaluate differences between FPARcanopy and FPARchl. By using FPARchl instead of FPARcanopy to calculate GPP, Zhang et al. [49] presented that uncertainty of estimations was reduced. It indicates that FPARchl rather than FPARcanopy should be widely employed to calculate GPP in the further study.

5. Conclusions

GPP and ET are very important carbon and water fluxes in terrestrial ecosystem, and they determine several ecosystem functions, such as respiration and growth. Accurate simulation of these fluxes will be helpful for quantifying ecosystem carbon-water exchange and their response to climate change. In this study, flux measured data of eight sites provided by ChinaFLUX were used for validating the uncertainties of MODIS-GPP and -ET products in different land cover types over China. Results showed that MODIS-GPP generally underestimated measured GPP and MODIS-ET overestimated measured ET in China. The performance in evergreen forests is very poor for MODIS-GPP. MODIS-ET, in contrast, provides more reliable estimates than that of MODIS-GPP in evergreen forests. MODIS-GPP performs well in croplands with R2 of 0.80, but it overestimated flux derived GPP in non-growing season and underestimated flux derived GPP in growing season; while MODIS-ET overestimated measured ET of croplands. MODIS-GPP and -ET algorithms provided very good products in grasslands and mixed forests. By designing four experimental groups and taking GPP as an example, we differentiate the impacts of max light use efficiency, climate factors and LAI/FPAR on the estimations. The MOD17 maximum light use efficiency for croplands and EBF need to be optimized, otherwise it will significantly underestimate estimated GPP, especially in croplands. But the MOD17 maximum light use efficiency for other land cover types are comparable with the optimized maximum light use efficiency based on flux observed calibration. Statistical analysis showed that the differences between the Data Assimilation Office (DAO) meteorological data and site measured meteorological data had little impact on GPP, but the remote sensing input data (FPAR/LAI) could be more sensitive to the estimate of GPP and ET. Although there are a few uncertainties, our results suggest that MODIS-GPP and -ET algorithms can effectively estimate the seasonal dynamics of GPP and ET over China. They are effective algorithms for estimating GPP and ET at regional and global scales. Meanwhile, high accuracy of LAI and FPAR data can help improve the estimating accuracy of GPP and ET. In these cases, the improved algorithms of remote sensing products for cloud detection and removal are necessary.

Acknowledgments

We are grateful to the availability of the tower flux data from ChinaFLUX. We sincerely appreciate Wenjiao Shi, Chaoyang Wu and four anonymous reviewers for their constructive comments and suggestions. This work is supported by National Natural Science Foundation of China (41371409) and Key Projects in the National Science & Technology Pillar Program (2013BAC03B04).

Author Contributions

Zhengjia Liu conducted and analyzed data and wrote the manuscript; Quanqin Shao and Jiyuan Liu gave comments and suggestions on the manuscript.

Conflicts of Interest

The authors declare no conflict of interest.

References

  1. Nightingale, J.M.; Coops, N.C.; Waring, R.H.; Hargrove, W.W. Comparison of MODIS gross primary production estimates for forests across the U.S.A. with those generated by a simple process model, 3-PGS. Remote Sens. Environ. 2007, 109, 500–509. [Google Scholar]
  2. Gitelson, A.A.; Viña, A.; Verma, S.B.; Rundquist, D.C.; Arkebauer, T.J.; Keydan, G.; Leavitt, B.; Ciganda, V.; Burba, G.G.; Suyker, A.E. Relationship between gross primary production and chlorophyll content in crops: Implications for the synoptic monitoring of vegetation productivity. J. Geophys. Res. 2006, 111, D08S11. [Google Scholar]
  3. Zhao, M.; Running, S.W. Drought-induced reduction in global terrestrial net primary production from 2000 through 2009. Science 2010, 329, 940–943. [Google Scholar]
  4. Beer, C.; Reichstein, M.; Tomelleri, E.; Ciais, P.; Jung, M.; Carvalhais, N.; Rödenbeck, C.; Arain, M.A.; Baldocchi, D.; Bonan, G.B. Terrestrial gross carbon dioxide uptake: Global distribution and covariation with climate. Science 2010, 329, 834–838. [Google Scholar]
  5. Wu, C.; Chen, J.M.; Huang, N. Predicting gross primary production from the enhanced vegetation index and photosynthetically active radiation: Evaluation and calibration. Remote Sens. Environ. 2011, 115, 3424–3435. [Google Scholar]
  6. Myneni, R.; Hoffman, S.; Knyazikhin, Y.; Privette, J.; Glassy, J.; Tian, Y.; Wang, Y.; Song, X.; Zhang, Y.; Smith, G. Global products of vegetation leaf area and fraction absorbed PAR from year one of MODIS data. Remote Sens. Environ. 2002, 83, 214–231. [Google Scholar]
  7. Sims, D.; Rahman, A.; Cordova, V.; Elmasri, B.; Baldocchi, D.; Bolstad, P.; Flanagan, L.; Goldstein, A.; Hollinger, D.; Misson, L. A new model of gross primary productivity for North American ecosystems based solely on the enhanced vegetation index and land surface temperature from MODIS. Remote Sens. Environ. 2008, 112, 1633–1646. [Google Scholar]
  8. Xiao, X.; Zhang, Q.; Braswell, B.; Urbanski, S.; Boles, S.; Wofsy, S.; Moore, B., III; Ojima, D. Modeling gross primary production of temperate deciduous broadleaf forest using satellite images and climate data. Remote Sens. Environ. 2004, 91, 256–270. [Google Scholar]
  9. Bastiaanssen, W. SEBAL-based sensible and latent heat fluxes in the irrigated Gediz Basin, Turkey. J. Hydrol. 2000, 229, 87–100. [Google Scholar]
  10. Wang, K.; Wang, P.; Li, Z.; Cribb, M.; Sparrow, M. A simple method to estimate actual evapotranspiration from a combination of net radiation, vegetation index, and temperature. J. Geophys. Res. 2007, 112, D15107. [Google Scholar]
  11. Tang, R.; Li, Z.-L.; Jia, Y.; Li, C.; Sun, X.; Kustas, W.P.; Anderson, M.C. An intercomparison of three remote sensing-based energy balance models using Large Aperture Scintillometer measurements over a wheat-corn production region. Remote Sens. Environ. 2011, 115, 3187–3202. [Google Scholar]
  12. Gao, Y.; Yu, G.; Yan, H.; Zhu, X.; Li, S.; Wang, Q.; Zhang, J.; Wang, Y.; Li, Y.; Zhao, L. A MODIS-based Photosynthetic Capacity Model to estimate gross primary production in Northern China and the Tibetan Plateau. Remote Sens. Environ. 2014, 148, 108–118. [Google Scholar]
  13. Jin, C.; Xiao, X.; Merbold, L.; Arneth, A.; Veenendaal, E.; Kutsch, W.L. Phenology and gross primary production of two dominant savanna woodland ecosystems in Southern Africa. Remote Sens. Environ. 2013, 135, 189–201. [Google Scholar]
  14. Mu, Q.; Heinsch, F.A.; Zhao, M.; Running, S.W. Development of a global evapotranspiration algorithm based on MODIS and global meteorology data. Remote Sens. Environ. 2007, 111, 519–536. [Google Scholar]
  15. Mu, Q.; Zhao, M.; Running, S.W. Improvements to a MODIS global terrestrial evapotranspiration algorithm. Remote Sens. Environ. 2011, 115, 1781–1800. [Google Scholar]
  16. Turner, D.P.; Ritts, W.D.; Cohen, W.B.; Gower, S.T.; Zhao, M.; Running, S.W.; Wofsy, S.C.; Urbanski, S.; Dunn, A.L.; Munger, J. Scaling gross primary production (GPP) over boreal and deciduous forest landscapes in support of MODIS GPP product validation. Remote Sens. Environ. 2003, 88, 256–270. [Google Scholar]
  17. Zhao, M.; Heinsch, F.A.; Nemani, R.R.; Running, S.W. Improvements of the MODIS terrestrial gross and net primary production global data set. Remote Sens. Environ. 2005, 95, 164–176. [Google Scholar]
  18. Yuan, W.; Liu, S.; Yu, G.; Bonnefond, J.-M.; Chen, J.; Davis, K.; Desai, A.R.; Goldstein, A.H.; Gianelle, D.; Rossi, F.; et al. Global estimates of evapotranspiration and gross primary production based on MODIS and global meteorology data. Remote Sens. Environ. 2010, 114, 1416–1431. [Google Scholar]
  19. Wu, C.; Munger, J.W.; Niu, Z.; Kuang, D. Comparison of multiple models for estimating gross primary production using MODIS and eddy covariance data in Harvard Forest. Remote Sens. Environ. 2010, 114, 2925–2939. [Google Scholar]
  20. Yu, G.; Wen, X.; Sun, X.; Tanner, B.D.; Lee, X.; Chen, J. Overview of ChinaFLUX and evaluation of its eddy covariance measurement. Agric. For. Meteorol. 2006, 137, 125–137. [Google Scholar]
  21. Yu, G.R.; Zhu, X.J.; Fu, Y.L.; He, H.L.; Wang, Q.F.; Wen, X.F.; Li, X.R.; Zhang, L.M.; Zhang, L.; Su, W. Spatial patterns and climate drivers of carbon fluxes in terrestrial ecosystems of China. Glob. Chang. Biol. 2013, 19, 798–810. [Google Scholar]
  22. Zhao, M.; Running, S.W.; Nemani, R.R. Sensitivity of Moderate Resolution Imaging Spectroradiometer (MODIS) terrestrial primary production to the accuracy of meteorological reanalyses. J. Geophys. Res. 2006, 111, G01002. [Google Scholar]
  23. Monteith, J.L. Evaporation and environment. Symp. Soc. Exp. Biol. 1965, 19, 205–224. [Google Scholar]
  24. Zhao, X.; Liang, S.; Liu, S.; Yuan, W.; Xiao, Z.; Liu, Q.; Cheng, J.; Zhang, X.; Tang, H.; Zhang, X.; et al. The Global Land Surface Satellite (GLASS) remote sensing data processing system and products. Remote Sens. 2013, 5, 2436–2450. [Google Scholar]
  25. Liang, S.; Zhao, X.; Liu, S.; Yuan, W.; Cheng, X.; Xiao, Z.; Zhang, X.; Liu, Q.; Cheng, J.; Tang, H. A long-term global land surface satellite (GLASS) data-set for environmental studies. Int. J. Dight. Earth 2013, 6, 5–33. [Google Scholar]
  26. Xiao, Z.; Liang, S.; Wang, J.; Chen, P.; Yin, X.; Zhang, L.; Song, J. Use of general regression neural networks for generating the GLASS leaf area index product from time-series MODIS surface reflectance. IEEE Tran. Geosci. Remote Sens. 2014, 52, 209–223. [Google Scholar]
  27. Chen, J.M.; Mo, G.; Pisek, J.; Liu, J.; Deng, F.; Ishizawa, M.; Chan, D. Effects of foliage clumping on the estimation of global terrestrial gross primary productivity. Glob. Biogeochem. Cy. 2012, 26, GB1019. [Google Scholar]
  28. Liu, Z.; Wang, L.; Wang, S. Comparison of different GPP models in China using MODIS Image and ChinaFLUX data. Remote Sens. 2014, 6, 10215–10231. [Google Scholar]
  29. Zhang, Y.; Yu, Q.; Jiang, J.I.E.; Tang, Y. Calibration of Terra/MODIS gross primary production over an irrigated cropland on the North China Plain and an alpine meadow on the Tibetan Plateau. Glob. Chang. Biol. 2008, 14, 757–767. [Google Scholar]
  30. Li, F.; Wang, X.; Zhao, J.; Zhang, X.; Zhao, Q. A method for estimating the gross primary production of alpine meadows using MODIS and climate data in China. Int. J. Remote Sens. 2013, 34, 8280–8300. [Google Scholar]
  31. Hashimoto, H.; Wang, W.; Milesi, C.; White, M.A.; Ganguly, S.; Gamo, M.; Hirata, R.; Myneni, R.B.; Nemani, R.R. Exploring simple algorithms for estimating gross primary production in forested areas from satellite data. Remote Sens. 2012, 4, 303–326. [Google Scholar]
  32. Tian, Y.; Zhang, Y.; Knyazikhin, Y.; Myneni, R.B.; Glassy, J.M.; Dedieu, G.; Running, S.W. Prototyping of MODIS LAI and FPAR algorithm with LASUR and LANDSAT data. IEEE Tran. Geosci. Remote 2000, 38, 2387–2401. [Google Scholar]
  33. Huete, A.; Didan, K.; Miura, T.; Rodriguez, E.P.; Gao, X.; Ferreira, L.G. Overview of the radiometric and biophysical performance of the MODIS vegetation indices. Remote Sens. Environ. 2002, 83, 195–213. [Google Scholar]
  34. Ruimy, A.; Kergoat, L.; Bondeau, A.; Intercomparison, T.P.O.F.T.P.N.M. Comparing global models of terrestrial net primary productivity (NPP): Analysis of differences in light absorption and light-use efficiency. Glob. Chang. Biol. 1999, 5, 56–64. [Google Scholar]
  35. Viña, A.; Gitelson, A.A. New developments in the remote estimation of the fraction of absorbed photosynthetically active radiation in crops. Geophys. Res. Lett. 2005, 32, L17403. [Google Scholar]
  36. Liu, J.; Chen, J.; Cihlar, J.; Chen, W. Net primary productivity distribution in the BOREAS region from a process model using satellite and surface data. J. Geophys. Res. 1999, 104, 27735–27754. [Google Scholar]
  37. Chen, B.; Chen, J.M.; Ju, W. Remote sensing-based ecosystem-atmosphere simulation scheme (EASS)—Model formulation and test with multiple-year data. Ecol. Model. 2007, 209, 277–300. [Google Scholar]
  38. Pitman, A. The evolution of, and revolution in, land surface schemes designed for climate models. Int. J. Climatol. 2003, 23, 479–510. [Google Scholar]
  39. Kira, T.; Shidei, T. Primary production and turnover of organic matter in different forest ecosystems of the western Pacific. Jap. J. Ecol. 1967, 17, 70–87. [Google Scholar]
  40. Waring, R.H.; Schlesinger, W.H. Forest Ecosystems: Concepts and Management; Academic Press: Orlando, FL, USA, 1985; p. 340. [Google Scholar]
  41. Sun, Z.; Wang, Q.; Ouyang, Z.; Watanabe, M. Validation of the feasibility of MOD16 algorithm for estimating crop field vapor flux in North China Plain. Acta Geogra. Sini. 2004, 59, 49–55. [Google Scholar]
  42. Prince, S.D.; Goward, S.N. Global primary production: A remote sensing approach. J. Biogeogr. 1995. [Google Scholar] [CrossRef]
  43. Landsberg, J.J.; Waring, R.H. A generalised model of forest productivity using simplified concepts of radiation-use efficiency, carbon balance and partitioning. For. Ecol. Manag. 1997, 95, 209–228. [Google Scholar]
  44. Chase, T.N.; Pielke Sr, R.A.; Kittel, T.G.F.; Nemani, R.R.; Running, S.W. Simulated impacts of historical land cover changes on global climate in northern winter. Clim. Dynam. 2000, 16, 93–105. [Google Scholar]
  45. Veroustraete, F.; Sabbe, H.; Eerens, H. Estimation of carbon mass fluxes over Europe using the C-Fix model and Euroflux data. Remote Sens. Environ. 2002, 83, 376–399. [Google Scholar]
  46. Yuan, W.; Liu, S.; Zhou, G.; Zhou, G.; Tieszen, L.L.; Baldocchi, D.; Bernhofer, C.; Gholz, H.; Goldstein, A.H.; Goulden, M.L.; et al. Deriving a light use efficiency model from eddy covariance flux data for predicting daily gross primary production across biomes. Agric. For. Meteorol. 2007, 143, 189–207. [Google Scholar]
  47. Zhang, Q.; Xiao, X.; Braswell, B.; Linder, E.; Baret, F.; Moore, B., III. Estimating light absorption by chlorophyll, leaf and canopy in a deciduous broadleaf forest using MODIS data and a radiative transfer model. Remote Sens. Environ. 2005, 99, 357–371. [Google Scholar]
  48. Zhang, Q.; Xiao, X.; Braswell, B.; Linder, E.; Ollinger, S.; Smith, M.-L.; Jenkins, J.P.; Baret, F.; Richardson, A.D.; Moore Iii, B.; et al. Characterization of seasonal variation of forest canopy in a temperate deciduous broadleaf forest, using daily MODIS data. Remote Sens. Environ. 2006, 105, 189–203. [Google Scholar]
  49. Zhang, Q.; Middleton, E.M.; Margolis, H.A.; Drolet, G.G.; Barr, A.A.; Black, T.A. Can a satellite-derived estimate of the fraction of PAR absorbed by chlorophyll (FAPARchl) improve predictions of light-use efficiency and ecosystem photosynthesis for a boreal aspen forest? Remote Sens. Environ. 2009, 113, 880–888. [Google Scholar]
  50. Cheng, Y.; Zhang, Q.; Lyapustin, A.I.; Wang, Y.; Middleton, E.M. Impacts of light use efficiency and fPAR parameterization on gross primary production modeling. Agric. For. Meteorol. 2014, 189, 187–197. [Google Scholar]

