Derivation of Land Surface Albedo at High Resolution by Combining HJ-1A/B Reflectance Observations with MODIS BRDF Products


Abstract
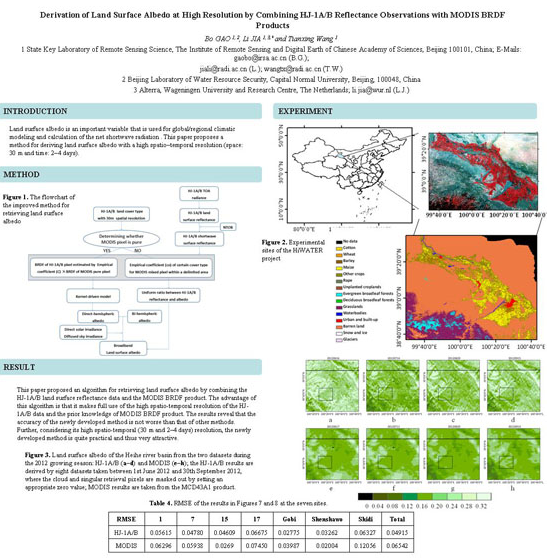
: Land surface albedo is an essential parameter for monitoring global/regional climate and land surface energy balance. Although many studies have been conducted on global or regional land surface albedo using various remote sensing data over the past few decades, land surface albedo product with a high spatio–temporal resolution is currently very scarce. This paper proposes a method for deriving land surface albedo with a high spatio–temporal resolution (space: 30 m and time: 2–4 days). The proposed method works by combining the land surface reflectance data at 30 m spatial resolution obtained from the charge-coupled devices in the Huanjing-1A and -1B (HJ-1A/B) satellites with the Moderate Resolution Imaging Spectroradiometer (MODIS) land surface bidirectional reflectance distribution function (BRDF) parameters product (MCD43A1), which is at a spatial resolution of 500 m. First, the land surface BRDF parameters for HJ-1A/B land surface reflectance with a spatial–temporal resolutions of 30 m and 2–4 day are calculated on the basis of the prior knowledge from the MODIS BRDF product; then, the calculated high resolution BRDF parameters are integrated over the illuminating/viewing hemisphere to produce the white- and black-sky albedos at 30 m resolution. These results form the basis for the final land surface albedo derivation by accounting for the proportion of direct and diffuse solar radiation arriving at the ground. The albedo retrieved by this novel method is compared with MODIS land surface albedo products, as well as with ground measurements. The results show that the derived land surface albedo during the growing season of 2012 generally achieved a mean absolute accuracy of ±0.044, and a root mean square error of 0.039, confirming the effectiveness of the newly proposed method.1. Introduction
Land surface albedo is defined as that fraction of the incident solar radiation in the 0.4–2.5 μm spectrum domain which is reflected by the land surface [1]; it is an important variable that is used for global/regional climatic modeling and calculation of the net shortwave radiation [2,3]. Land surface albedo data with high spatio–temporal resolution allows the monitoring of sudden natural processes or human activities at local scales (e.g., changes due to snowfall, snowmelt, precipitation, crop damage by disaster, and crop harvest). This data can also be used to evaluate the surface radiation budget to monitor the drastic variations in the natural environment, and has been used to monitor the urban heat island effect to guide the fight against climate change in urban areas.
In the past few years, satellite observations have led to the production of several land surface albedo products, including the Moderate Resolution Imaging Spectroradiometer (MODIS) albedo product (with a spatial resolution of 500–1000 m and a temporal resolution of 16 days) [4–6], the land surface albedo product from the Polarization and Directionality of the Earth’s Reflectance (POLDER) satellite (with a 1/12° spatial resolution and a 10 day temporal resolution) [7,8], the Medium Resolution Imaging Spectrometer (MERIS) albedo product (with a temporal resolution of 16–30 days and an spatial resolution of approximately 0.05° climate modeling grid (CMG)) [9], and the Meteosat and Meteosat Second Generation (MSG) product (with a characteristic time scale of 1 day by a iterative scheme or 10 days by composition of 1 day products) [10–12]. The spatial resolution of these typical land surface albedo products range from 500 m to 5000 m, and their temporal resolution range from one day to one month. The relatively coarse resolution of these products significantly limits their application to many sectors.
Recently, special attention has been paid for developing algorithms to retrieve land surface albedo data with a higher spatio-temporal resolution. For instance, Liang et al. (1999, 2005) proposed an albedo retrieval method on the basis of the radiative transfer simulation, usually called the direct-estimation algorithm [13–15]. It utilized the MODTRAN package [16] to simulate the top of atmosphere (TOA) reflectance under the Lambertian assumption for the land surface; a relation between the MODIS TOA reflectance and the broadband surface albedo was then obtained by training a neural network. This method could produce a daily albedo product using just one scene of MODIS data. Later, this method was further improved by Liang (2005) to estimate the daily land surface albedo of the Greenland ice sheet from MODIS data. Unfortunately, the studies mentioned above did not consider the anisotropy of the land surface. To this end, an improved direct-estimates method that considers the anisotropy using the POLDER Bidirectional Reflectance Distribution Function (BRDF) has been reported using the MODIS dataset [17], which can generate daily land surface albedo with a spatial resolution of 1000 m. Additionally, a method to estimate the snow-free albedo at a spatial resolution of 30 m has also been proposed on the basis of a fusion of the Landsat 5 reflectance data and the classification-based MODIS 500 m anisotropic BRDF information [18]. This product includes the snow-free land surface albedo with a temporal resolution of 16 day, and was validated over the Maryland, DC, and eastern Virginia areas of the US. Particularly, generating land surface albedos with high spatio–temporal resolutions over a large area by making full use of currently existing satellite observations is necessary. HJ-1A/B launched by China in 2009, have four charge-coupled devices (CCDs) each (with four bands, similar to Landsat 5), and each of these CCDs have a spatial resolution of 30 m and temporal resolution of 2–4 days [19]. Thus, producing a land surface albedo product with high spatio–temporal resolution on the basis of the HJ-1A/B data is possible if an appropriate retrieval algorithm could be devised. To this end, this paper proposes an alternative algorithm based on Shuai’s method [18], according to which MODIS pixels (500 m) are classified as either “pure” or “mixed.” When the MODIS pixels are pure, an empirical relation between the MODIS BRDF product and the HJ-1A/B data can be used to calculate the BDRF parameters of the HJ-1A/B pixels (30 m) within the pure pixel. On the other hand, if the MODIS pixel is mixed, then an empirical relation between the HJ-1A/B CCD reflectance data and the collocated derived albedo is constructed. In this fashion, the albedos of the cases of both pure and mixed MODIS pixels can be calculated.
The remainder of this paper is organized as follows. Section II provides a generic mathematical description and specific implementation of the improved algorithm for retrieving albedo by combining the HJ-1A/B CCD reflectance data with the MODIS BRDF. Section III presents a description of the study area and the ground measurement data. Section IV gives the results of this experiment, and presents a validation of these results. Section V draws the conclusion and outlines the objectives for further future research.
2. Algorithm
2.1. Theoretical Basis
The land surface albedo is a measure for the reflectivity of the earth’s surface. According to its definition (see introduction), a mathematical expression of the shortwave land surface albedo can be given as
Considering the fact that the surface downward solar irradiance comprises the direct solar irradiance (Fdir) and the diffuse solar irradiance (Fdif), the shortwave land surface albedo can be written as Equation (2) in the course of a specific calculation [20]:
A further integration of adh over all illumination angles results in the bi-hemispherical albedo (white-sky albedo), abh, under isotropic illumination, which is defined as the albedo in the absence of a direct solar irradiance:
To characterize the BRDF in Equations (3) and (4), a kernel-driven BRDF model is adopted, which is a linear composite of the three kernels for the isotropic scattering, the volume scattering, and geometric optics scattering [4,21]:
The land surface actually scatters anisotropically in the shortwave spectral range, which is usually characterized by the BRDF in the literature. Theoretically, the same land surface should have similar anisotropic scattering in the same spectral range. Based on this, if an area is pure and homogeneous in terms of its land cover, its BRDF in the shortwave spectral range should be identical even if it is observed by different sensors. However, the fact is that the BRDF derived from different sensors usually show some shift in magnitude because of minor differences in the visiting times of the sensors. If the BRDF derived from one sensor is known, the BRDF observed by another sensor can be obtained by constructing an empirical relation between the land surface reflectances observed by the two sensors at same solar and viewing geometry. The empirical relation can be expressed as
Once the BRDF (R2) becomes known, adh at any desired solar angle can be derived by the integration of BRDF over all viewing angles (Equation (3)); further, abh under isotropic illumination is derived by integration of adh over all illumination angles (Equation (4)). Finally, the land surface albedo can be calculated on the basis of Equation (2).
2.2. Derivation of Shortwave Broadband Albedo with High Resolution
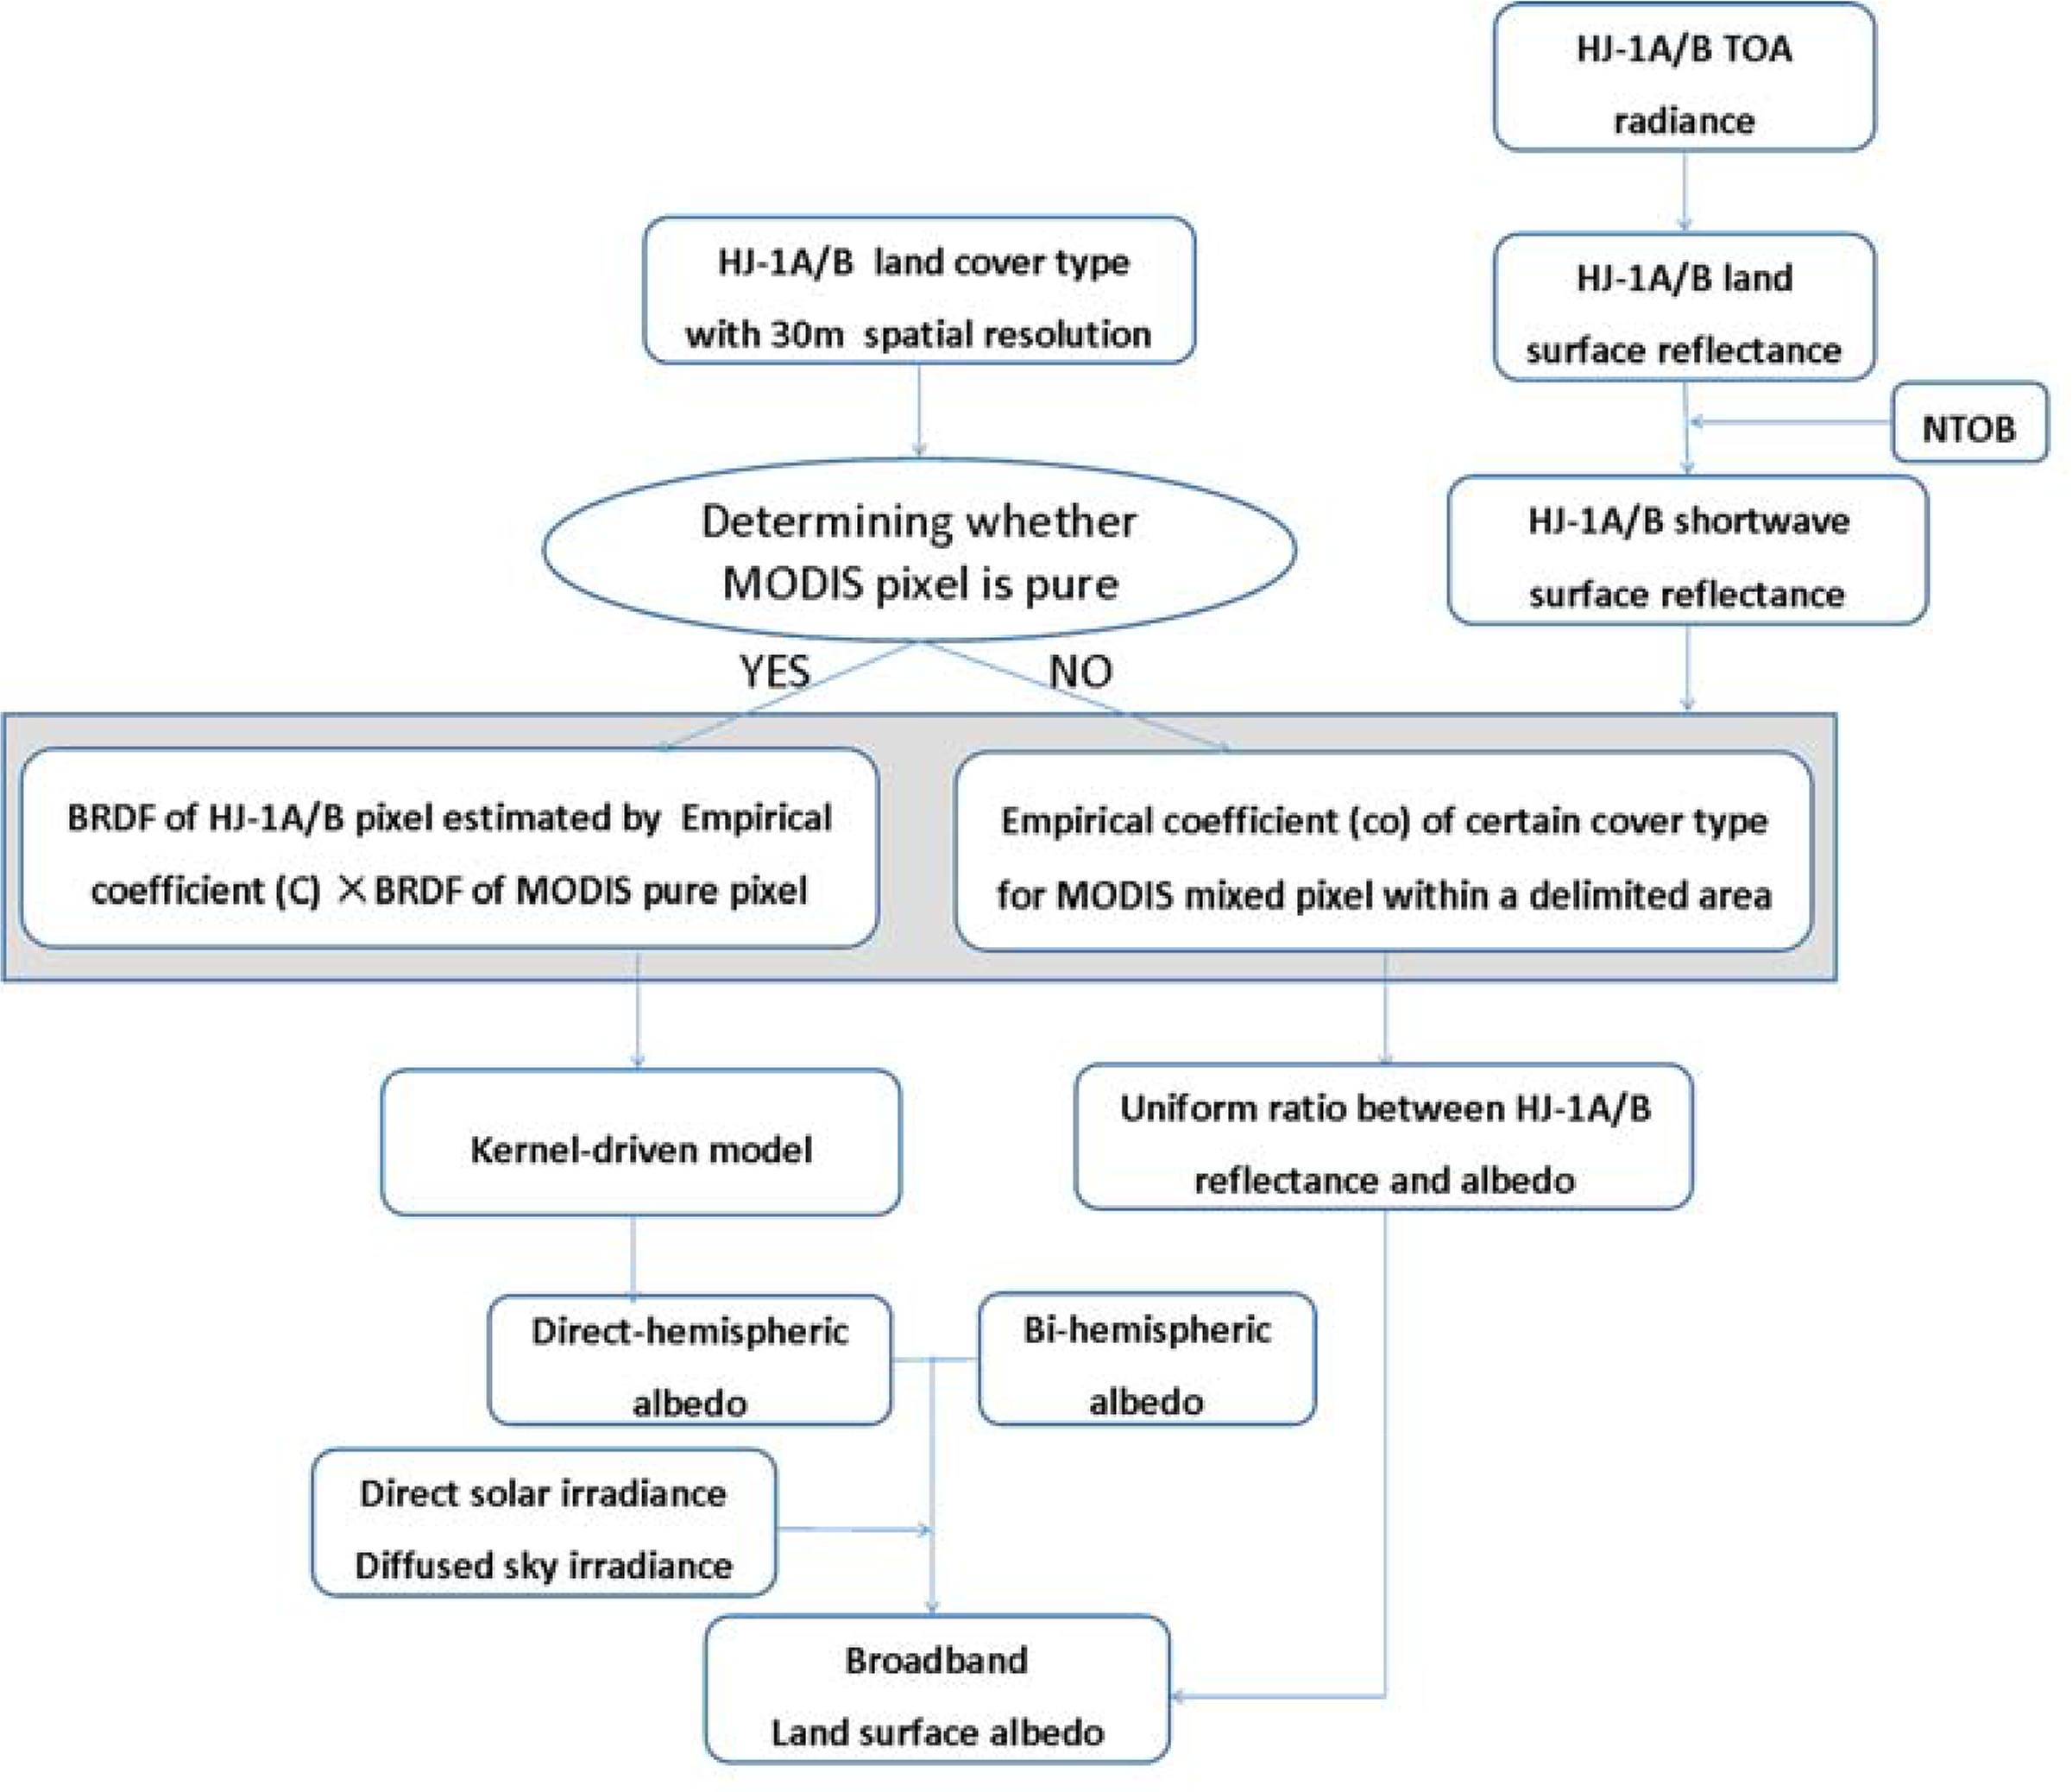
The new method for deriving the shortwave broadband albedo with high resolution presented in this paper starts with an atmospheric correction of the HJ-1A/B data [24,25], after which the land surface reflectance for the HJ-1A/B is calculated. After calculating the land surface reflectance, a narrowband to broadband (NTOB) shortwave surface reflectance conversion is performed to ensure the same spectral range for the HJ-1A/B data and the MODIS BRDF product, which will be shown in Subsection 2.2.1. MODIS 500 m pixels are classified as either “pure pixel” or “mixed pixel”. When one specific classification covers more than 50% of the MODIS pixel, the corresponding MODIS pixel is deemed as a “pure pixel,” otherwise it is classified as a “mixed pixel”. If HJ-1A/B pixels (30 m) are located in a pure MODIS pixel (500 m), an empirical coefficient between these two datasets (Equation (7)) is used to estimate the BRDF parameters of the HJ-1A/B pixel. If the MODIS pixel is a mixed pixel, an empirical coefficient between the HJ-1A/B CCD reflectance data and the collocated derived albedo is constructed. Finally, the direct-hemispheric albedo, bi-hemispheric albedo, and the land surface albedo at the scale of HJ-1A/B (30 m) are calculated on the basis of the scaled BRDF parameters. Figure 1 gives the scheme of the algorithm.
2.2.1. Converting NTOB Shortwave Land Surface Reflectance of HJ-1A/B CCD
Based on radiative transfer theory, the ground-measured land surface reflectance spectra of different land surface cover types with different solar and viewing geometries are inputted into MODTRAN4.0 [16] to simulate both the narrowband land surface reflectance of HJ-1A/B data and the shortwave land surface reflectance. The empirical formula converting shortwave land surface reflectance from narrow-band to broadband can be acquired by a linear fitting of the narrowband and shortwave broadband land surface reflectances (Equation (8)):
2.2.2. Retrieving the Land Surface Albedo in Pure MODIS Pixels
As mentioned above, the same land surfaces should have identical anisotropic scattering in the same spectral ranges. If an area covered by both MODIS and HJ-1A/B pixels is pure and homogeneous in terms of the land cover type, then the retrieved BRDF parameters based on the data from the two sensors should have a similar shape, with the exceptions of a few shifts in reflectance magnitude due to the optical difference between the sensors or differences in the dates of acquisition. For example, the MODIS BRDF on Day of Year (DOY) 161 in 2012 is derived from the land surface reflectance between DOY 161 and 177 of 2012, which represents an average land surface scattering status during those 16 days, whereas the HJ-1A/B BRDF obtained on DOY 161 of 2012 characterizes the status on that day, but not an average status over 16 days. Within one MODIS pixel, the HJ-1A/B land surface reflectance during those 16 days is assumed to have a fixed empirical relation with the land surface reflectance of the corresponding MODIS pixel that depends on the solar and viewing geometry in each HJ-1A/B pixel. Hence, if an HJ-1A/B pixel (30 m) is located inside a pure MODIS pixel (500 m), an empirical coefficient between these two datasets is used to estimate the BRDF parameters of the HJ-1A/B pixel:
Once the BRDF at each HJ-1A/B pixel is retrieved, integrating Rhj over all viewing angles results in a directional hemispherical albedo at any desired solar angle (Equation (3)). A further integration over all illumination angles results in a bi-hemispherical albedo under isotropic illumination (Equation (4)). Then, the land surface albedo for the HJ-1A/B pixel is finally calculated as the linear composition of the directional-hemispherical albedo and the bi-hemispherical albedo weighted by the components of solar direct and sky-diffused irradiance (Equation (2)).
2.2.3. Retrieving Land Surface Albedo at Mixed MODIS Pixels
If a MODIS pixel is covered by multiple land cover types (mixed pixel), the method described in Section 2.2.2 cannot be applied because of the heterogeneous property of the MODIS pixel. In this case, the BRDF of such a MODIS pixel is determined by the mixed scattering status of various land cover types. To derive the albedo of an HJ-1A/B pixel within a mixed MODIS pixel, a look-up table (LUT) is constructed on the basis of the results of Section 2.2.2. Specifically, for the MODIS image being studied, all the pure pixels are first collected, and then the HJ-1A/B pixel albedo is calculated on the basis of the MODIS BRDF, according to the method provided in Section 2.2.2 for each pure MODIS pixel. Then, the derived HJ-1A/B albedo, the position of the corresponding MODIS pure pixel, the land cover types, as well as the corresponding HJ-1A/B reflectance (Equation (10)) are all arranged into an LUT. One pure MODIS pixel corresponds to one record in the LUT. When an HJ-1A/B pixel is located in a mixed MODIS pixel, an image subset (1.5 km × 1.5 km) around the HJ-1A/B pixel is delimited, and all the possible MODIS pixels possessing the same land cover type as the HJ-1A/B pixel within this area are extracted from the LUT according to their positions. For each pure MODIS pixel, a ratio, con, can be calculated according to the work of Liang et al. [14] by dividing the HJ-1A/B surface reflectance by the corresponding derived albedo.
Since there maybe more than one MODIS pure pixel within the delimited area, the following equation is used to obtain a uniform ratio:
According to the above description, if the HJ-1A/B reflectance, rhj, and the corresponding amixed are provided, the albedo for an HJ-1A/B pixel within a mixed MODIS pixel can be easily derived as follows:
3. Study Area and Data
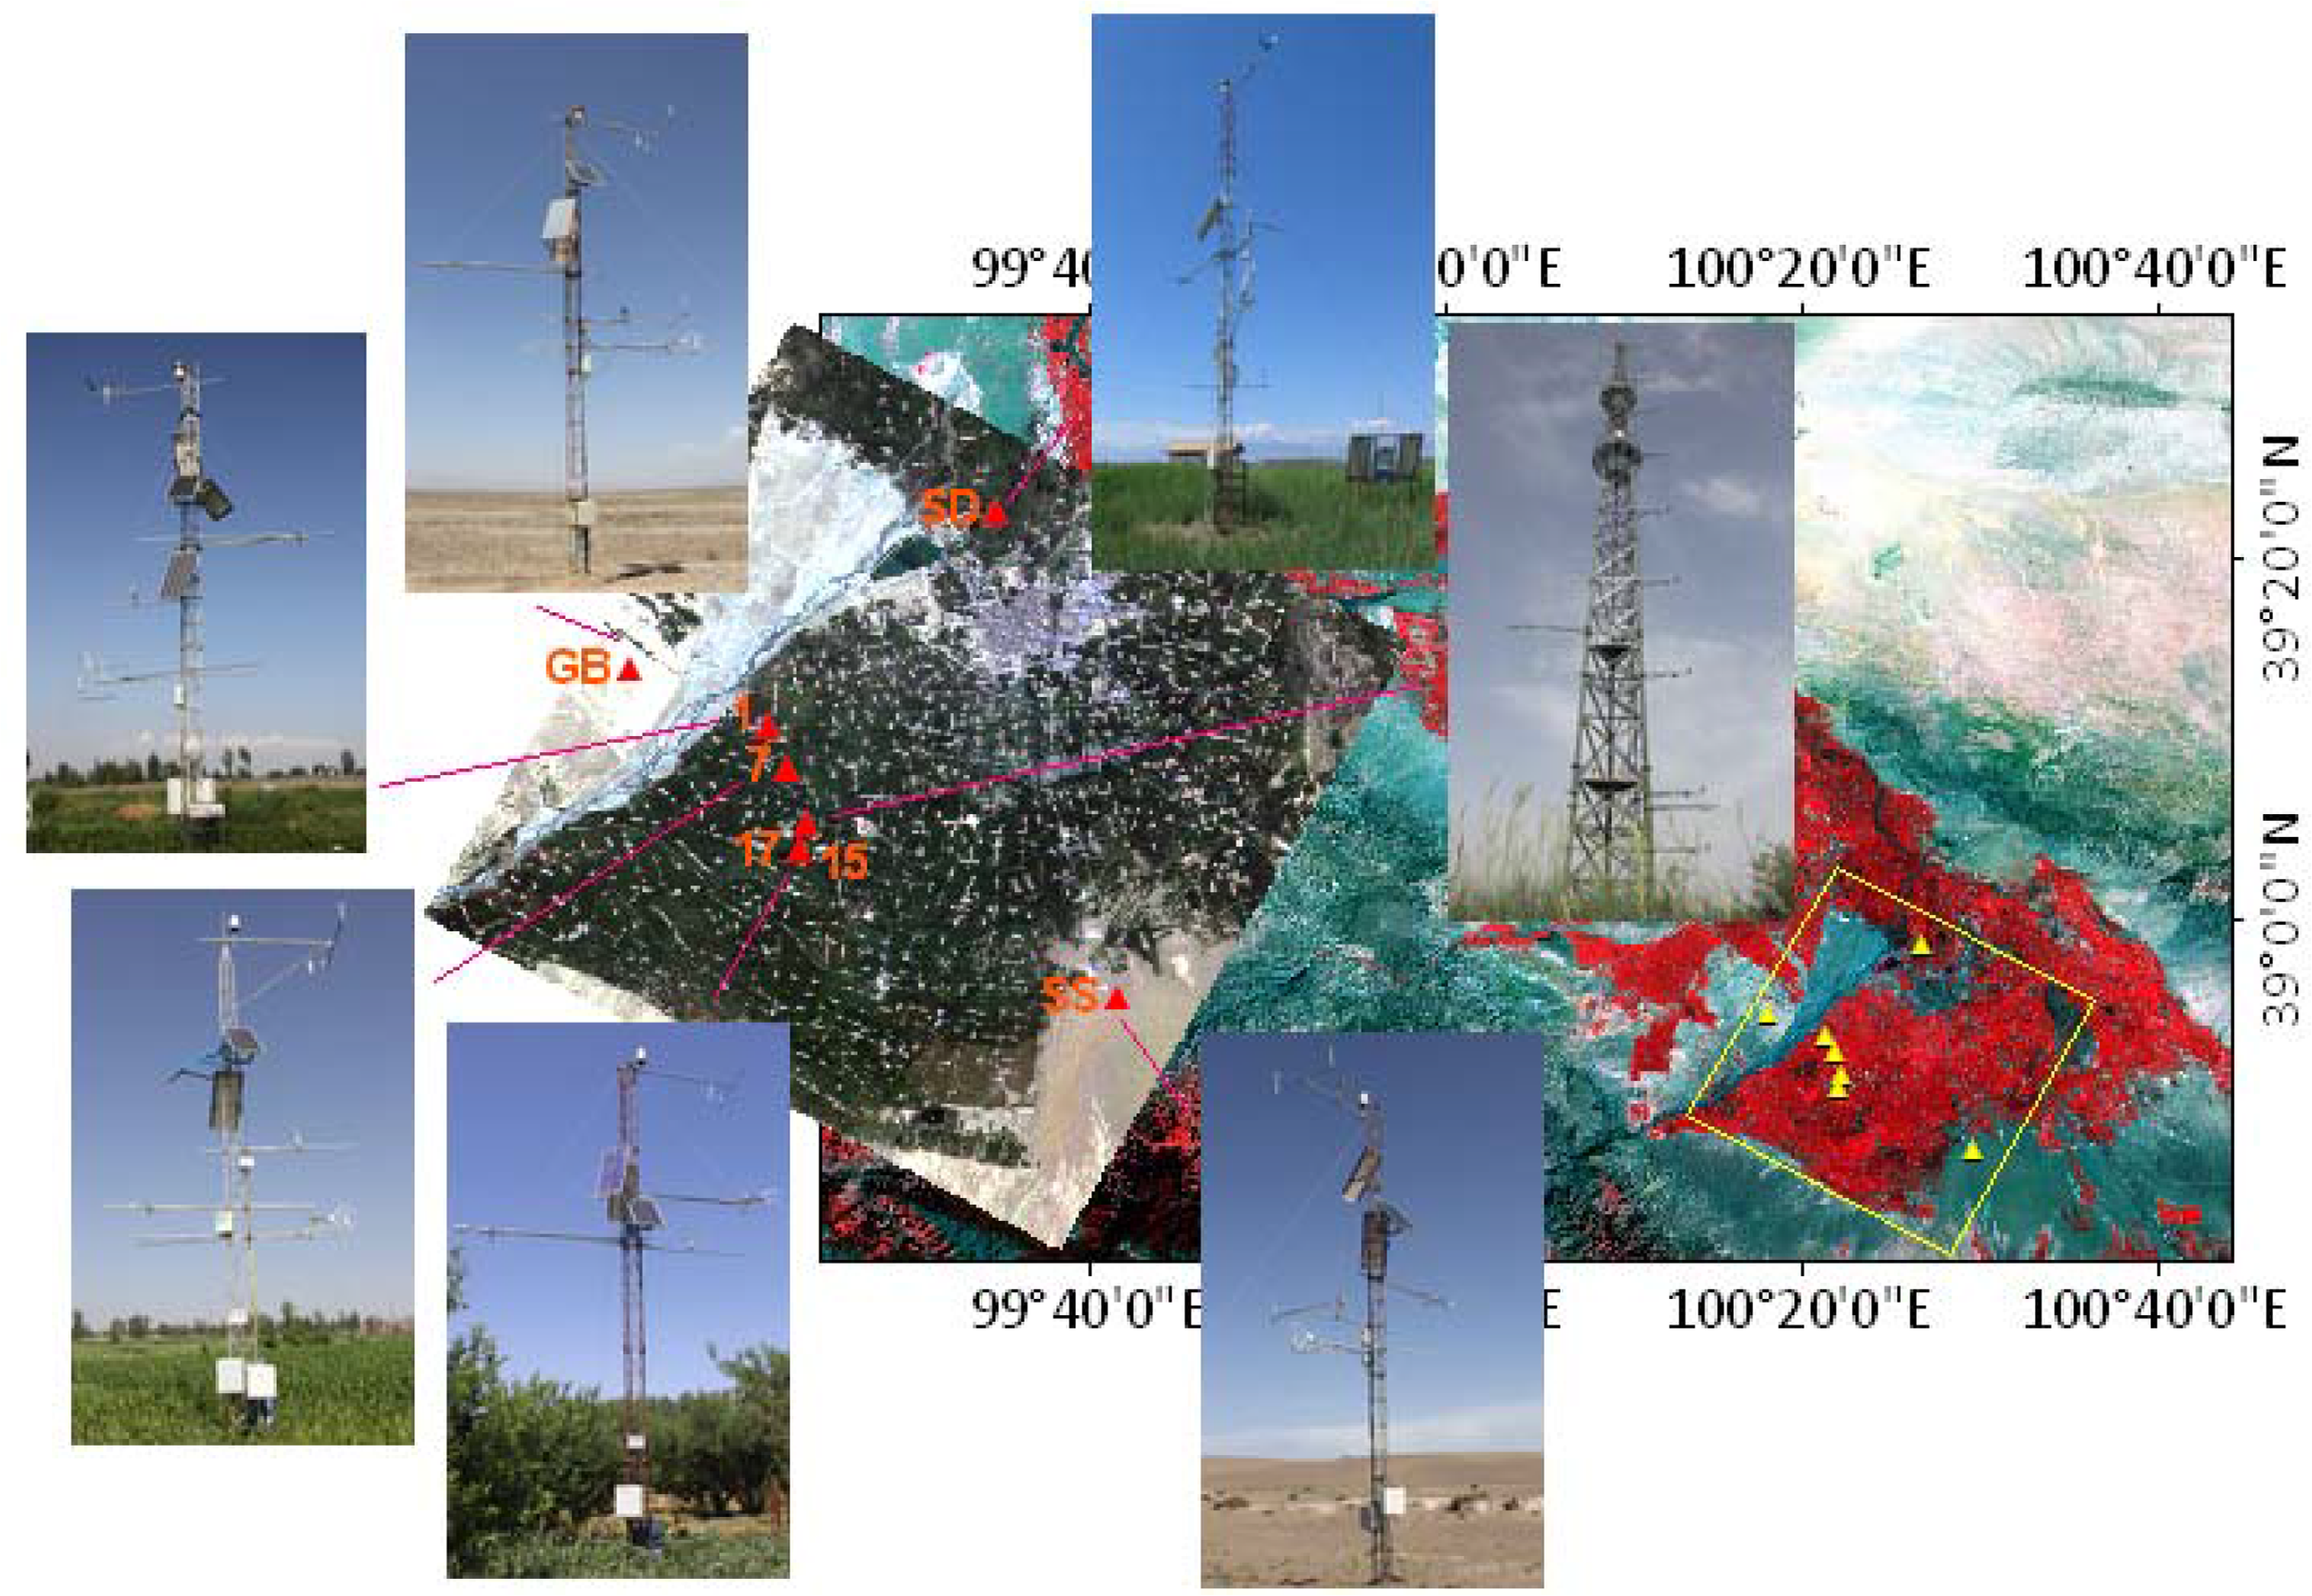
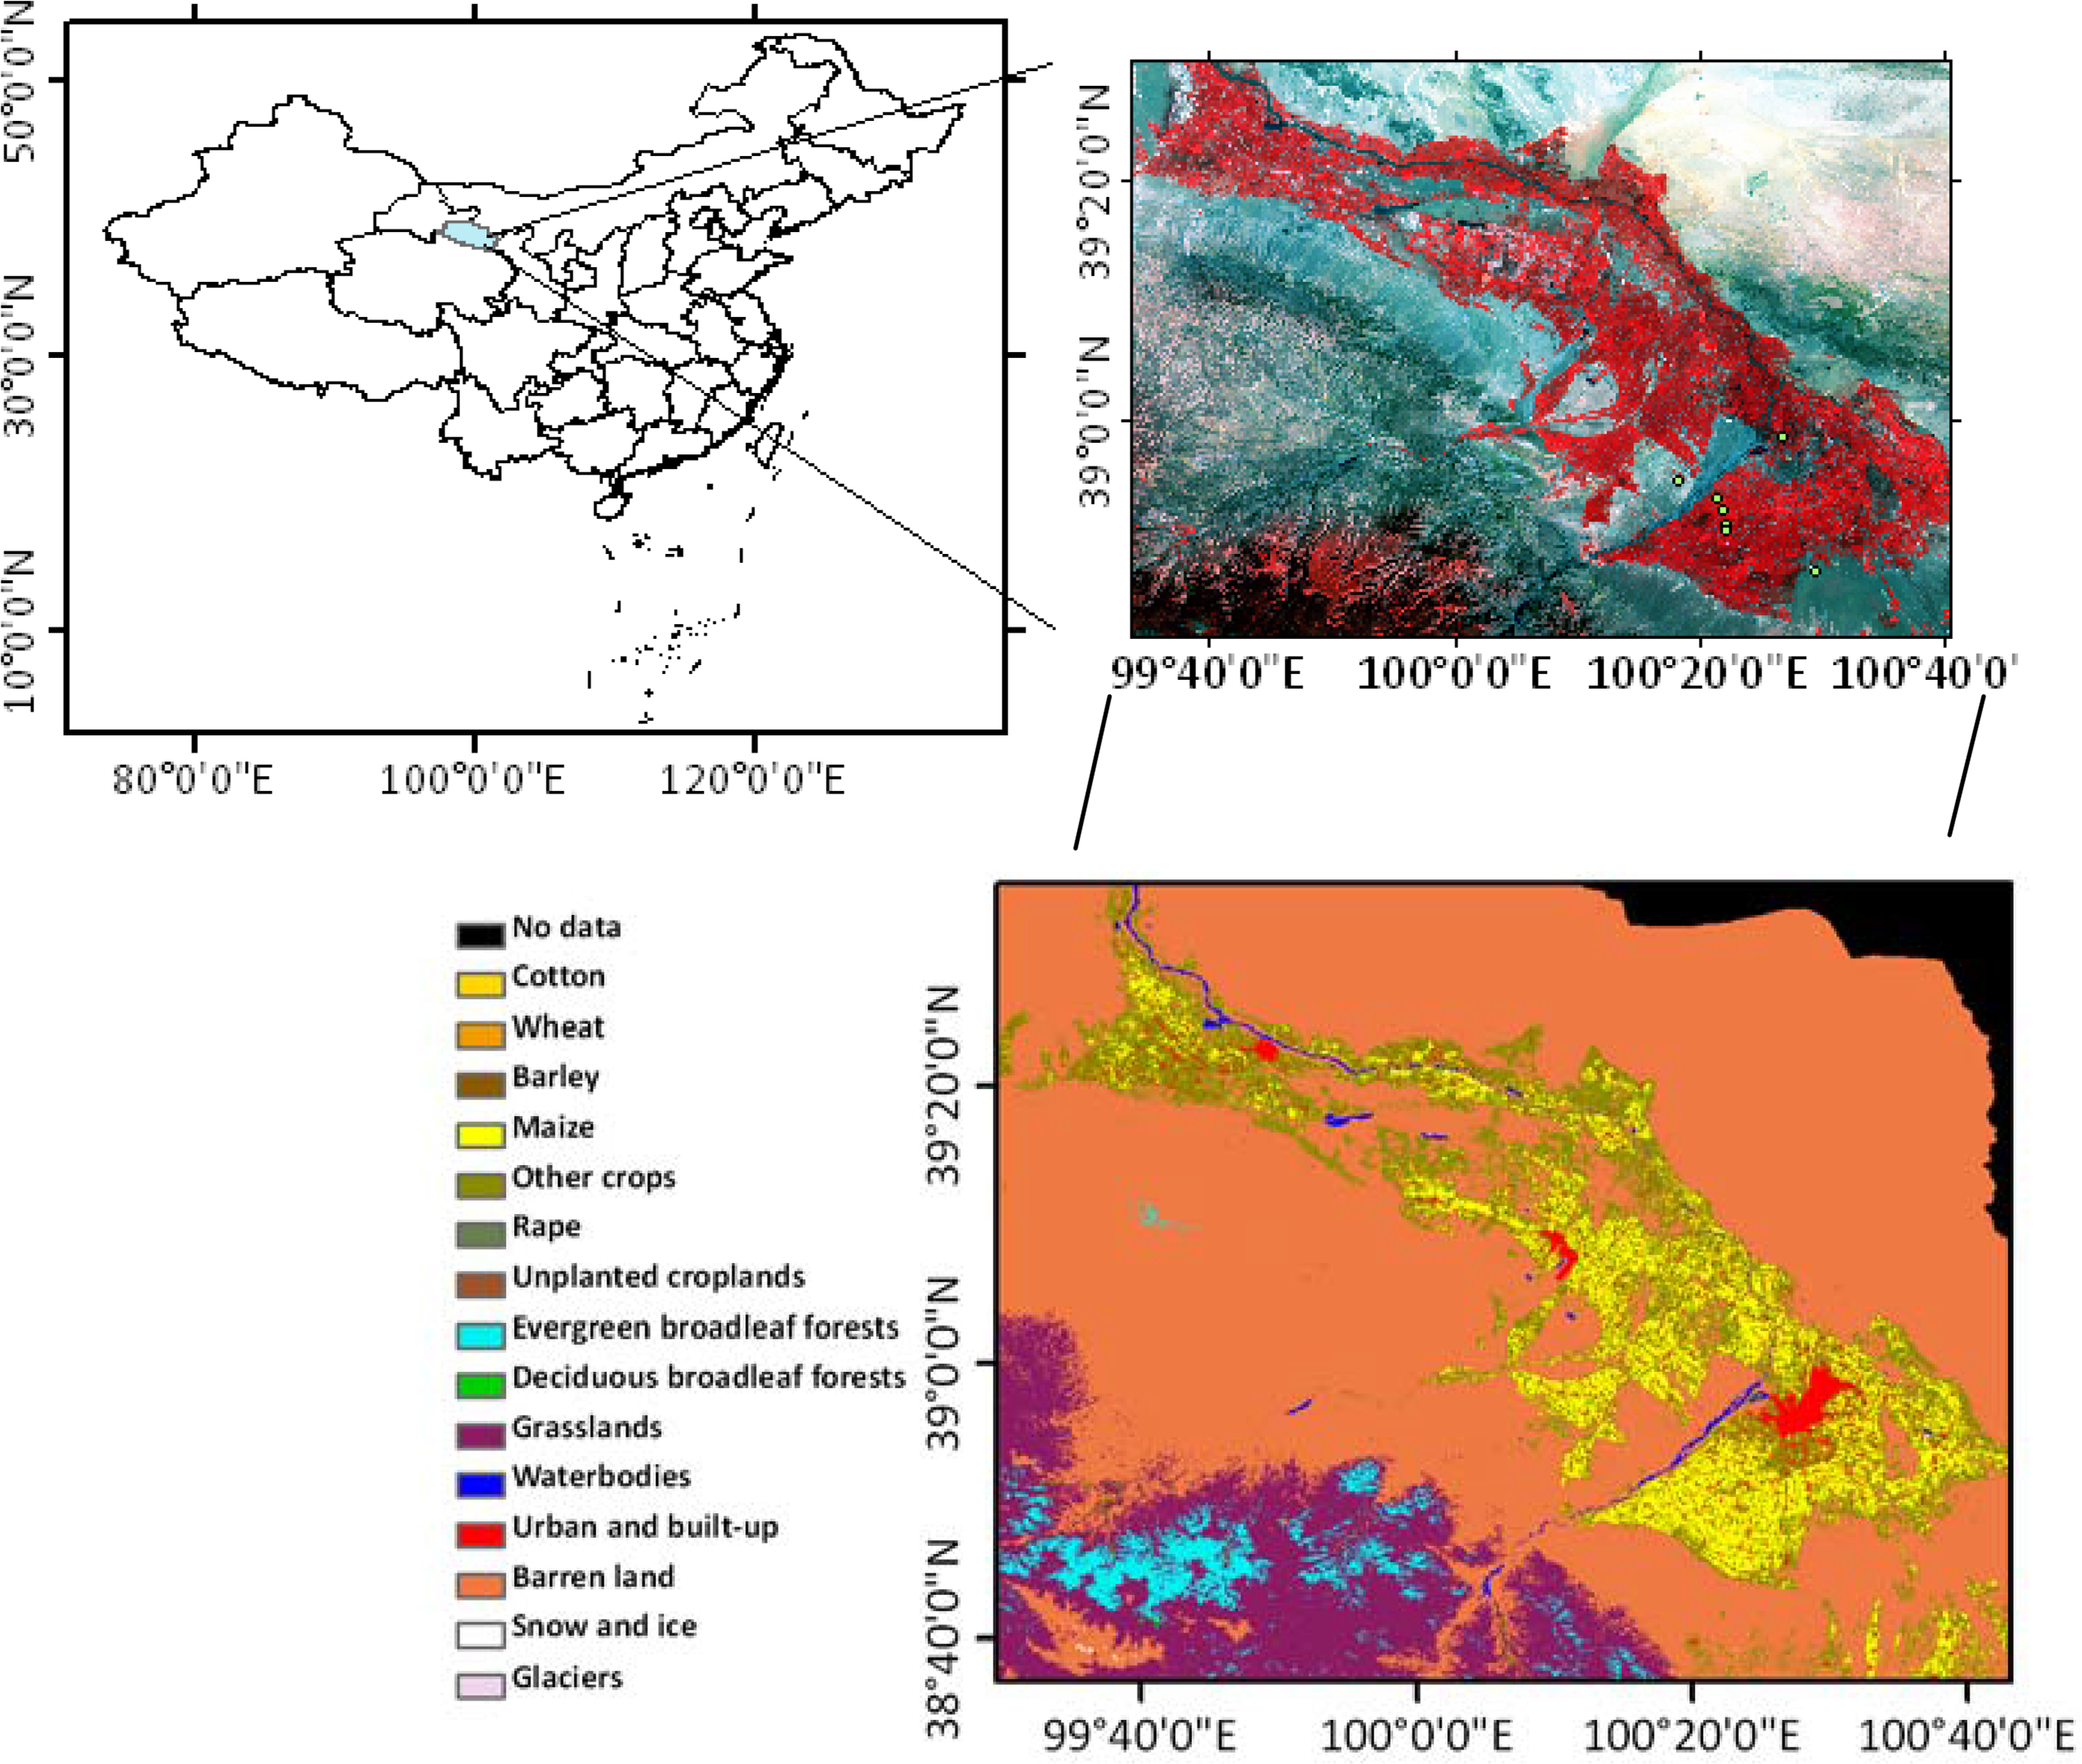
The Heihe river basin in the arid region of northwestern China is selected as the study area. The Heihe river basin is a typical inland river basin, and includes various ecosystems and land covers, including forest, alpine grassland, crop land, shrubs, and the Gobi desert. Numerous scientific experiments have been conducted to collect rich ground albedo measurements in the Heihe river basin [27,28]; hence, this region is an ideal study area. Figure 2 shows the location and the land covers of the study area.
3.1. Ground Measurements
The ground measurements of the albedo (which are used to validate the retrieval algorithm) are taken from the results of the HiWATER project at seven sites [28] located in the mid reach of Heihe river basin (Figure 3). Table 2 gives the information of land cover and characteristics of measurements of each site.
The sites are generally equipped with a net radiometer mounted on a horizontal platform atop a 6–12 m tall meteorological tower with both a skyward- and a downward-facing pyranometer to measure the shortwave radiation. The downward and upwelling solar radiations are continuously recorded by the skyward facing and downward facing pyranometers, respectively. Shuai et al. (2011) [18] believed that the downward facing pyranometer is most effective when it has an 81° field of view (FOV). Furthermore, our analysis experiment shows that the energy received by pyranometer is over 75% of the energy received by a pyranometer with a 90° FOV when the FOV is 60°. Thus, the ratio of sensor’s height to the radius of the effective field of view is 1/1.732.
3.2. Satellite Data
Land surface radiometric data collected by the Chinese satellites HJ-1A/B are used for this study. Each of the HJ-1A/B satellites has two CCDs containing four shortwave bands, and has a revisit period of 2–4 days (Table 3). The data used in this study were acquired from 1st June to 30th September in 2012.
Combining with the surface condition of Heihe river basin, Land cover classification data was derived from the HJ-1A/B data, by adopting a more delicate classification than the classification of the International Geosphere-Biosphere Program (IGBP) [29,30] (Figure 2), which classified crop more delicately, and neglected non-exist land cover type of Heihe river basin. The land cover data has a temporal resolution of one month. The temporal advantage of the HJ-1/CCD data not only increases the amount information, but also improves the accuracy on the land cover/use classification. In any case, there are still some inaccurate classifications, which may introduce retrieval errors which will be analyzed in Section 4.
The MODIS BRDF (MCD43A1) product supplies the weighting parameters of the Shortwave BRDF model with a temporal resolution of 8 days [31]. The shortwave BRDF parameter data used in this study were acquired between 1st June 2012 and 30th September 2012. The MCD43A2 product is the quality data of the MCD43A1 product, and is used to control the quality of the MCD43A1 data in this study.
4. Results and Discussion
According to the details of the improved method, an experiment is performed in the Heihe river basin, and the land surface albedo is then derived from the data introduced in Section III. The analysis results are presented as follows.
4.1. Comparison of Retrieved Albedos with MODIS Product
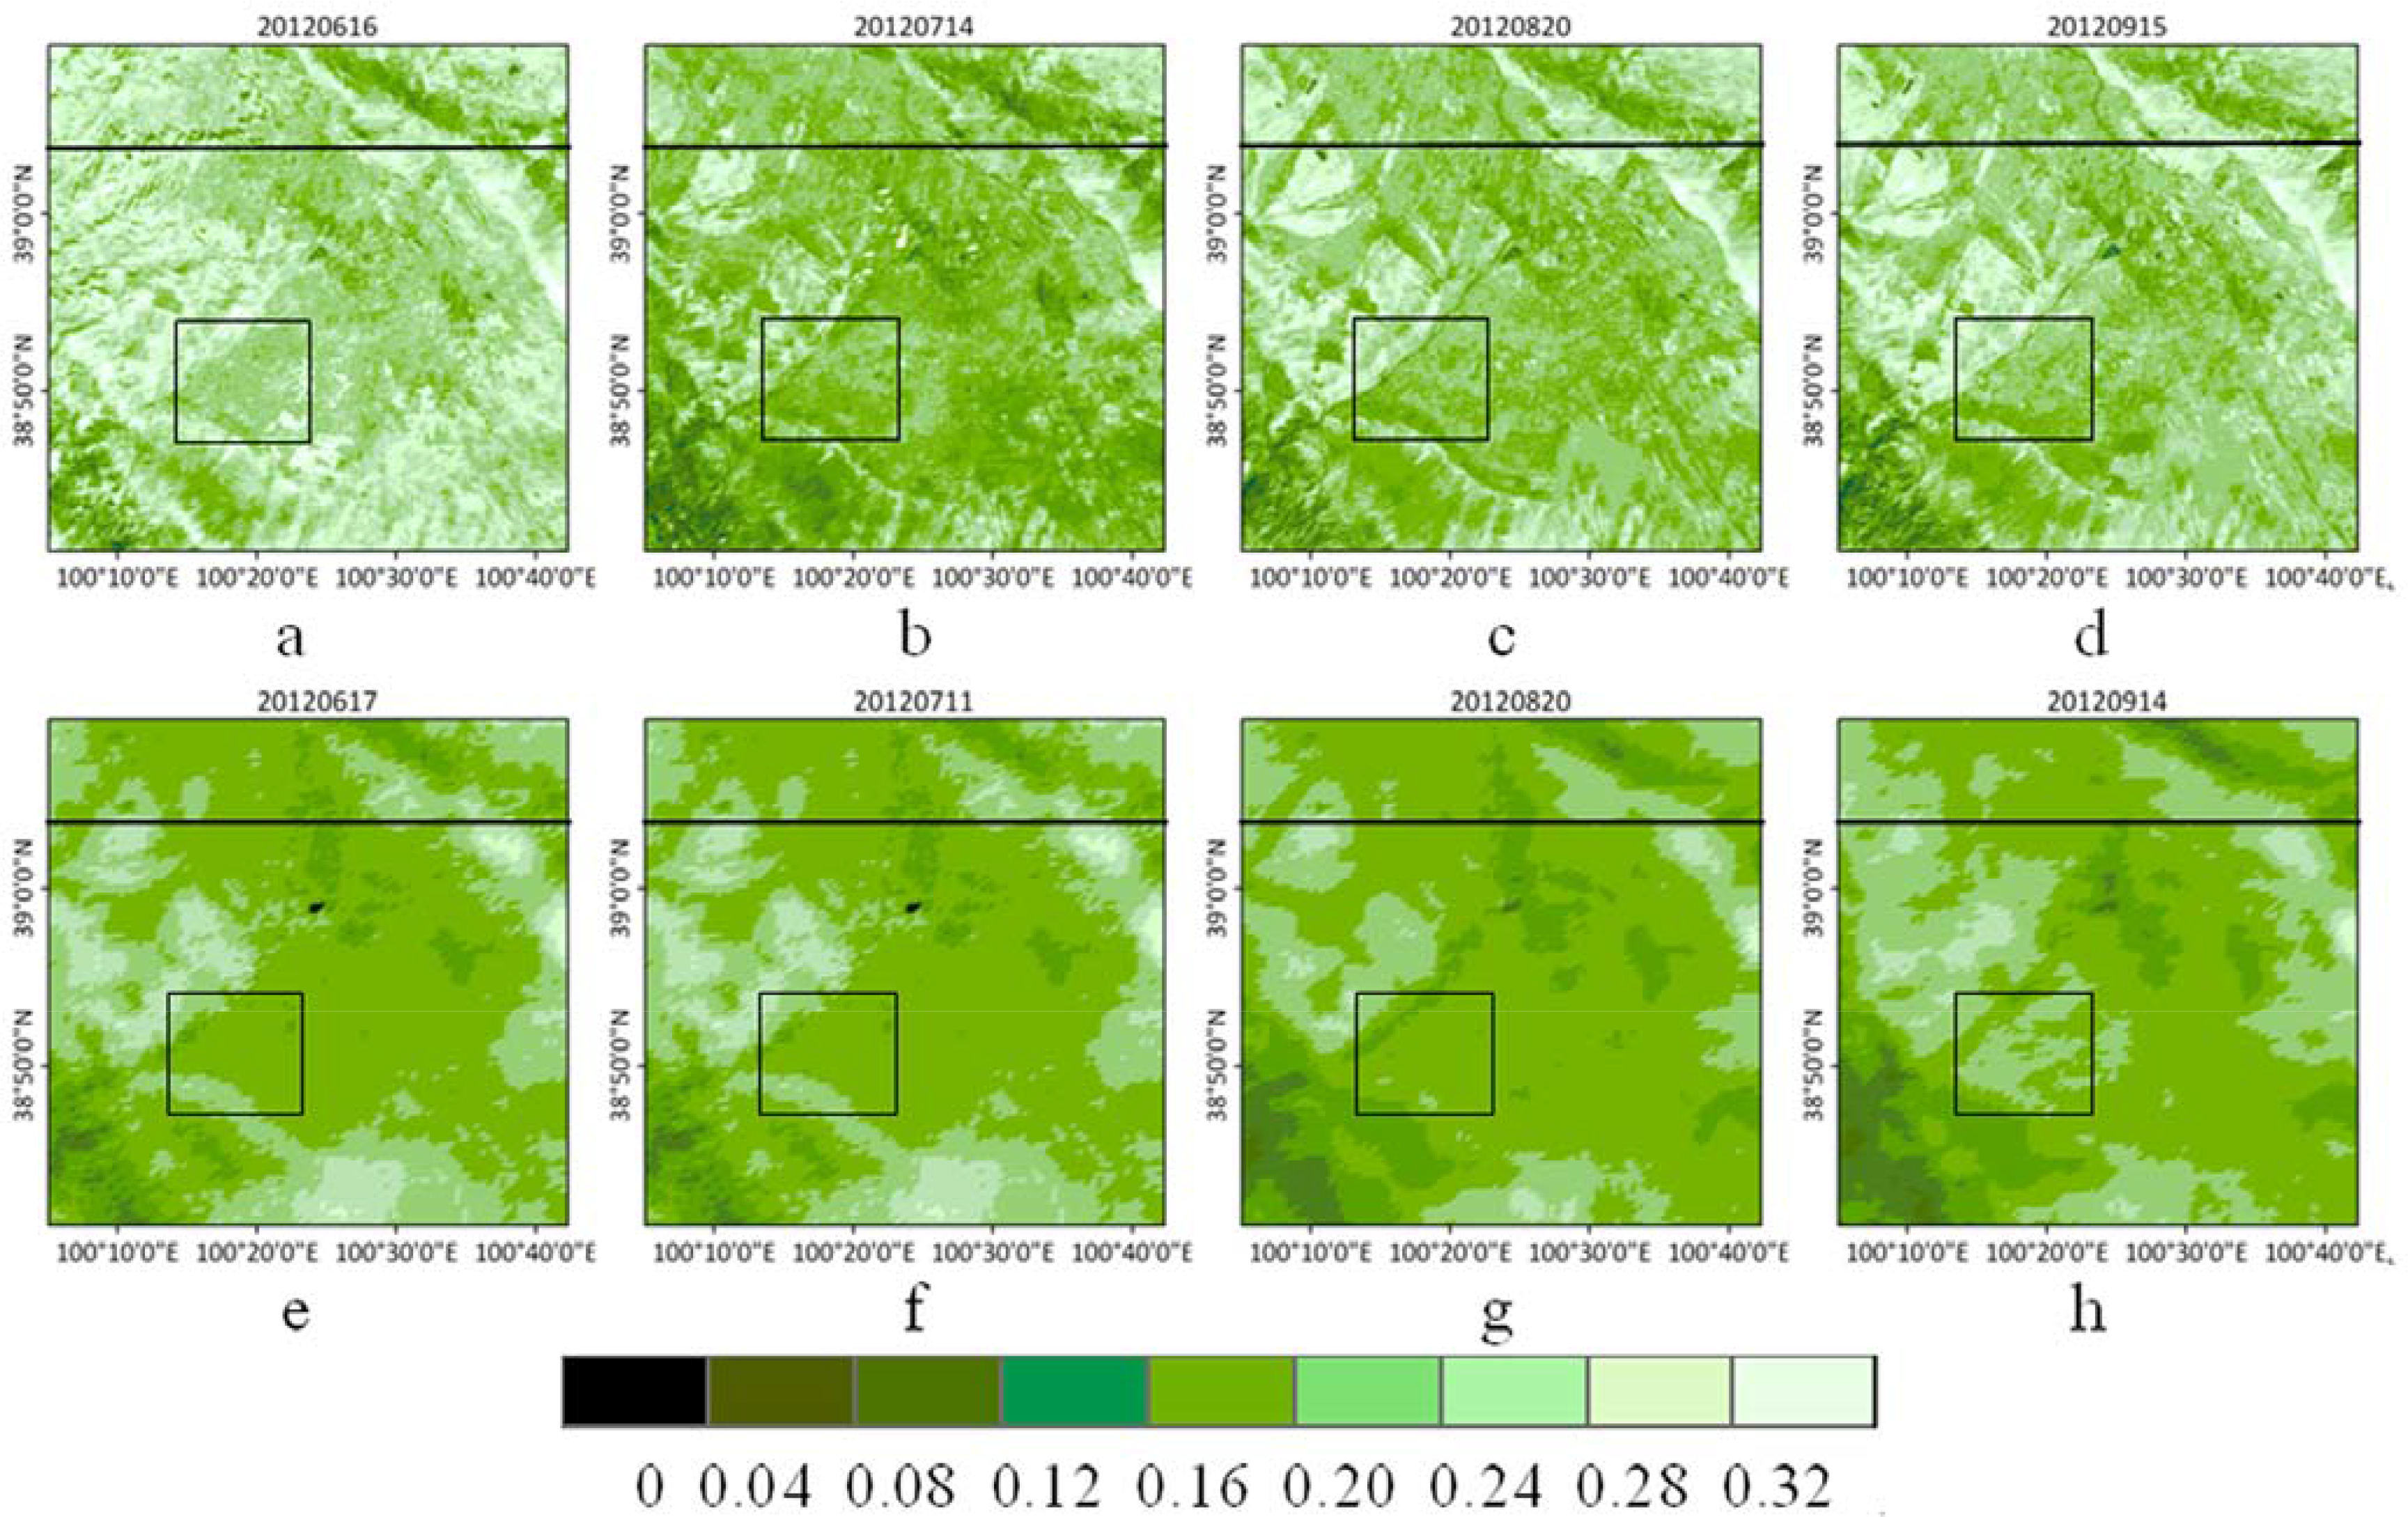
Figure 4 compares the HJ-1A/B land surface albedo with a concurrent MODIS 500 m product over the study area during the growing season of 2012. The albedos from these two products can be seen to have identical spatial distributions in their overall patterns, except that the HJ-1A/B albedo map contains more detail about the land. For instance, the Heihe river oasis includes a variety of vegetation, each of them having a different land surface albedo. These details are unfortunately smoothed out in the MODIS albedo product, while they can be seen more clearly in the HJ-1A/B product (see Figure 4). Compared to the MODIS albedo product, the land surface albedo derived from the HJ-1A/B land surface reflectance data with 30 m spatial resolution reveals a larger dynamic range (Figure 5). Thus, the 30 m HJ-1A/B retrievals have the potential to precisely detect fine-scale natural and anthropogenic changes in the land surface albedo.
In accordance with the vegetation phenology in the Heihe river basin, the land surface albedo gradually decreases from June to August with the growth of the vegetation (and thus the increase in the amount of chlorophyll). After August, the land surface albedo tends to rise because of the vegetation withering. This seasonal variation of the albedo is well reflected in Figures 4 and 5 for both products.
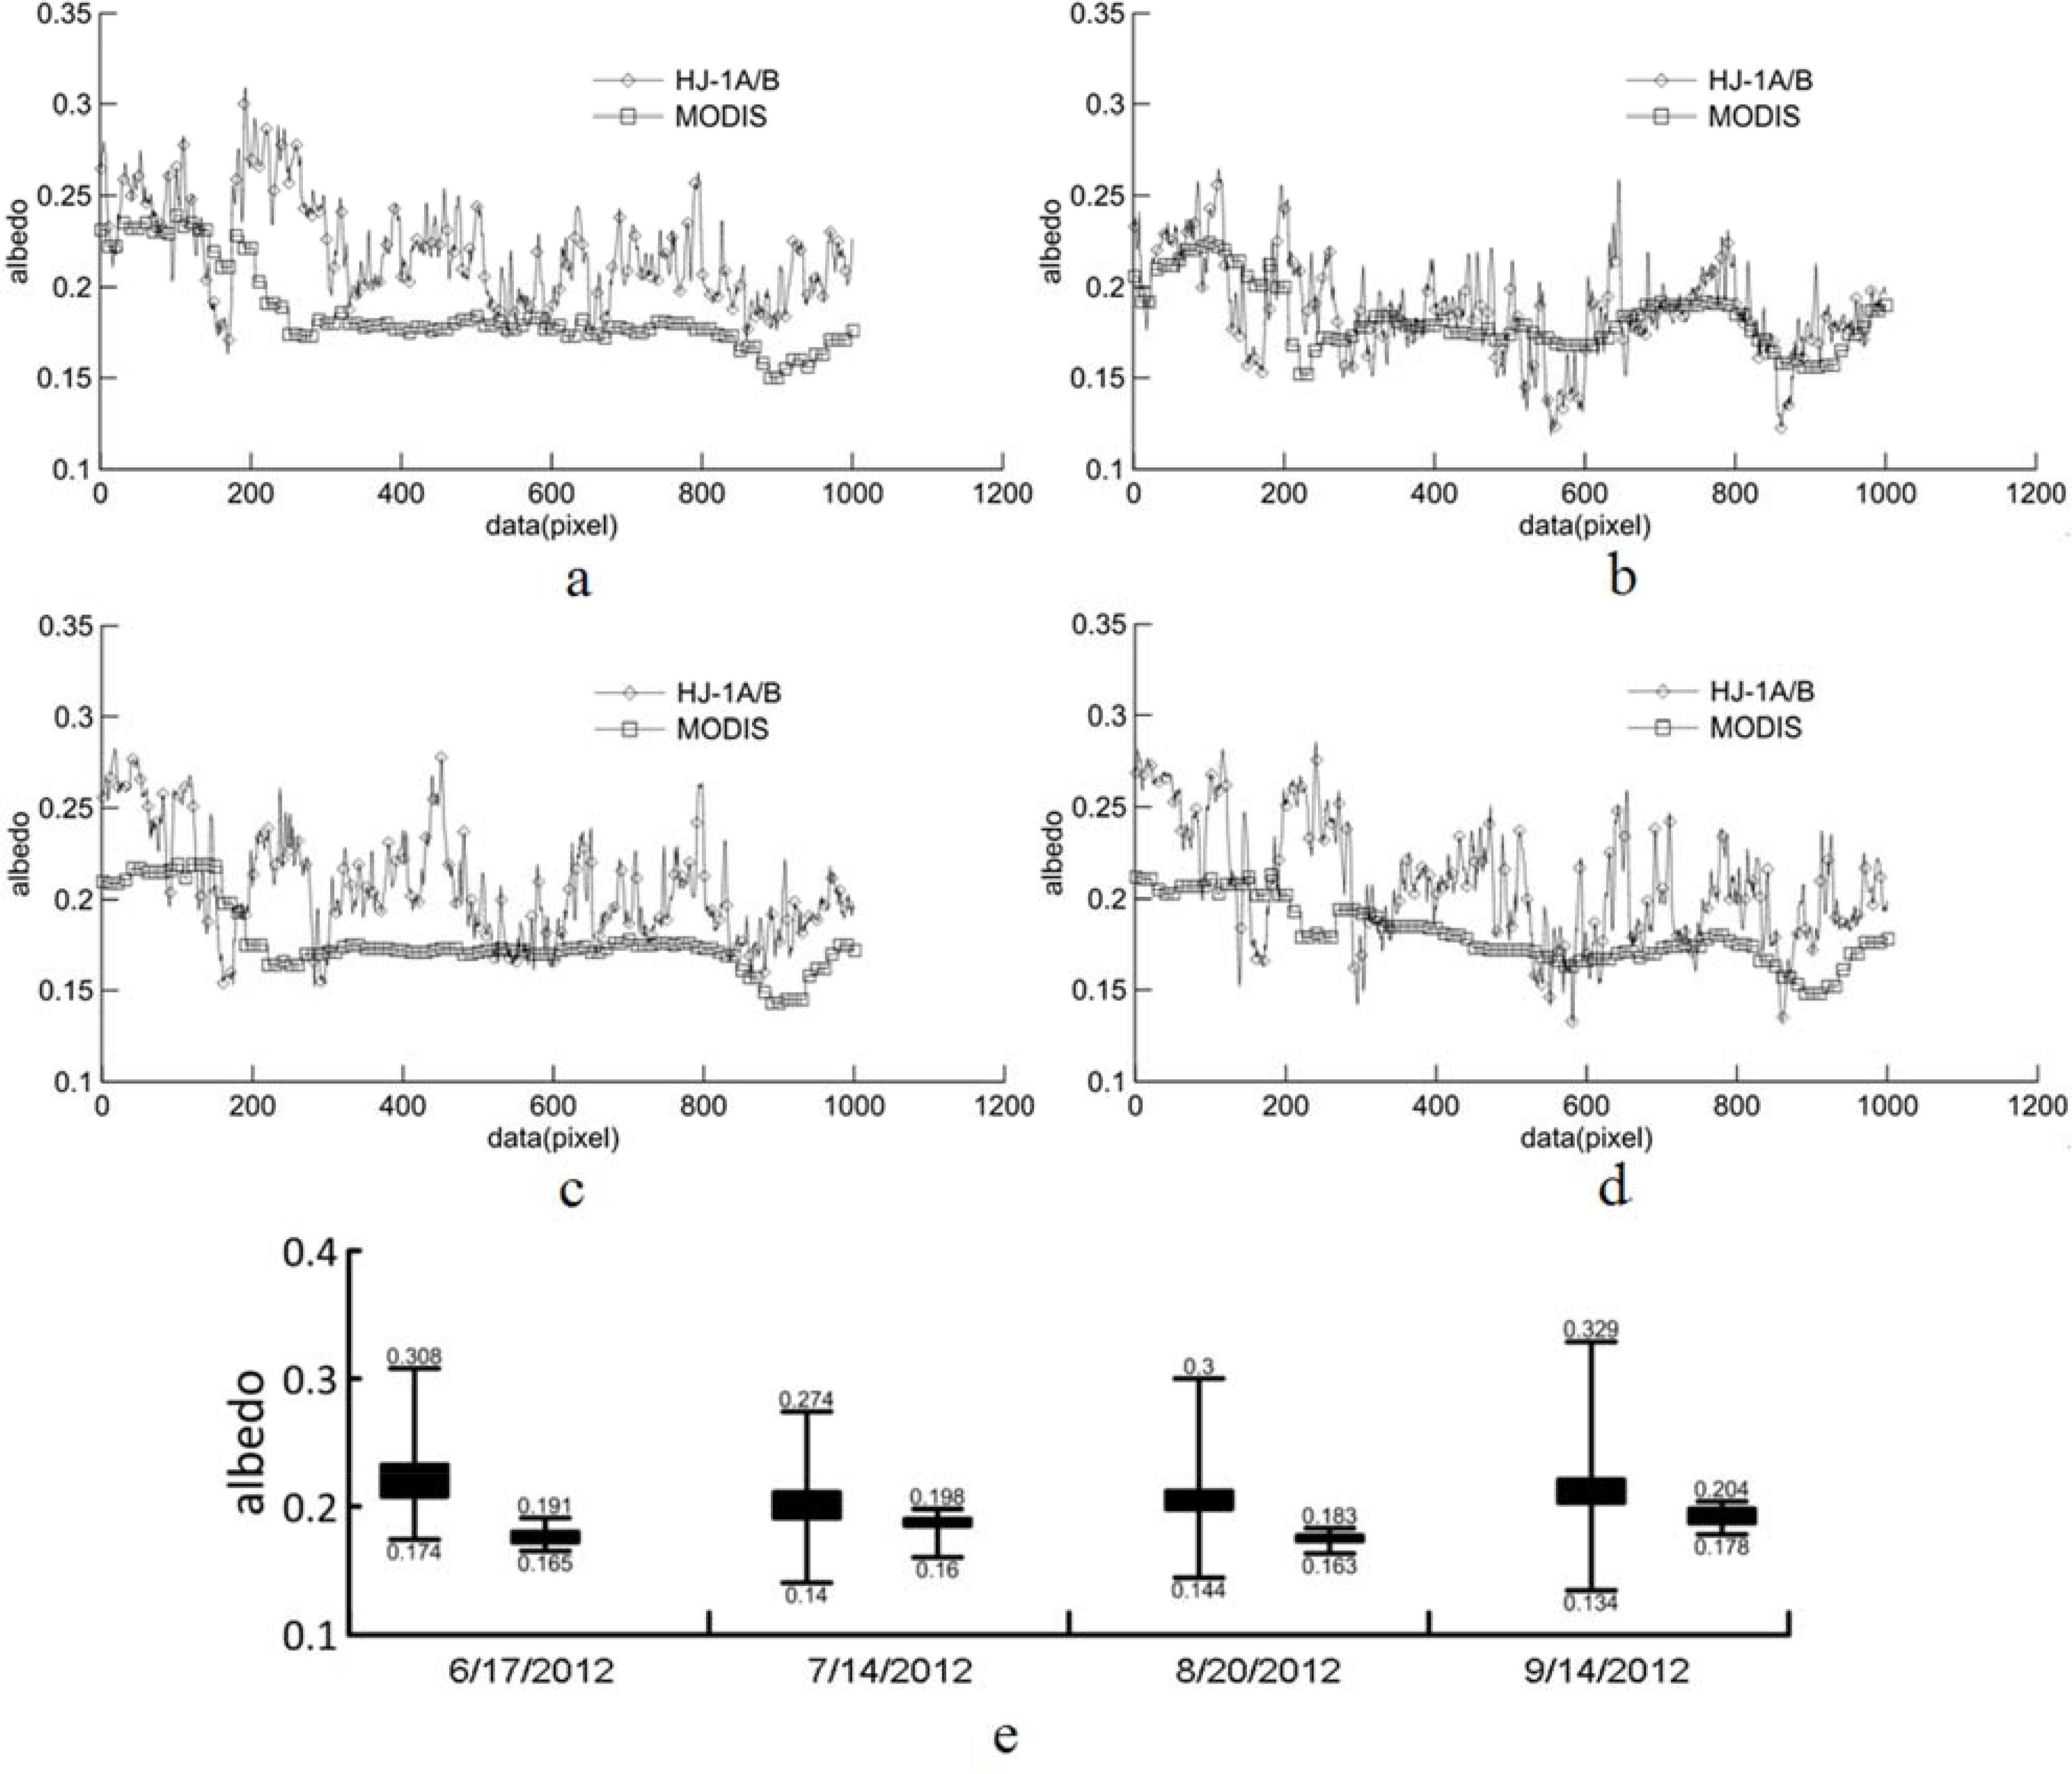
To examine the spatial characteristics of the albedos from the two products, a transect line and a square-shaped sub-area are selected to build regions of interest, from which the data are picked up for further analysis. The transect line is randomly graphed, and the square-shaped sub-area covers the area with most of the ground sites located. The comparison results within the transect line are shown in Figure 6a–d. and indicate that the HJ-1A/B albedo reveals a more dramatic and greater fluctuation than the MODIS product, which implies that the HJ-1A/B data has a better spatial expression capability (Figure 4a–d).
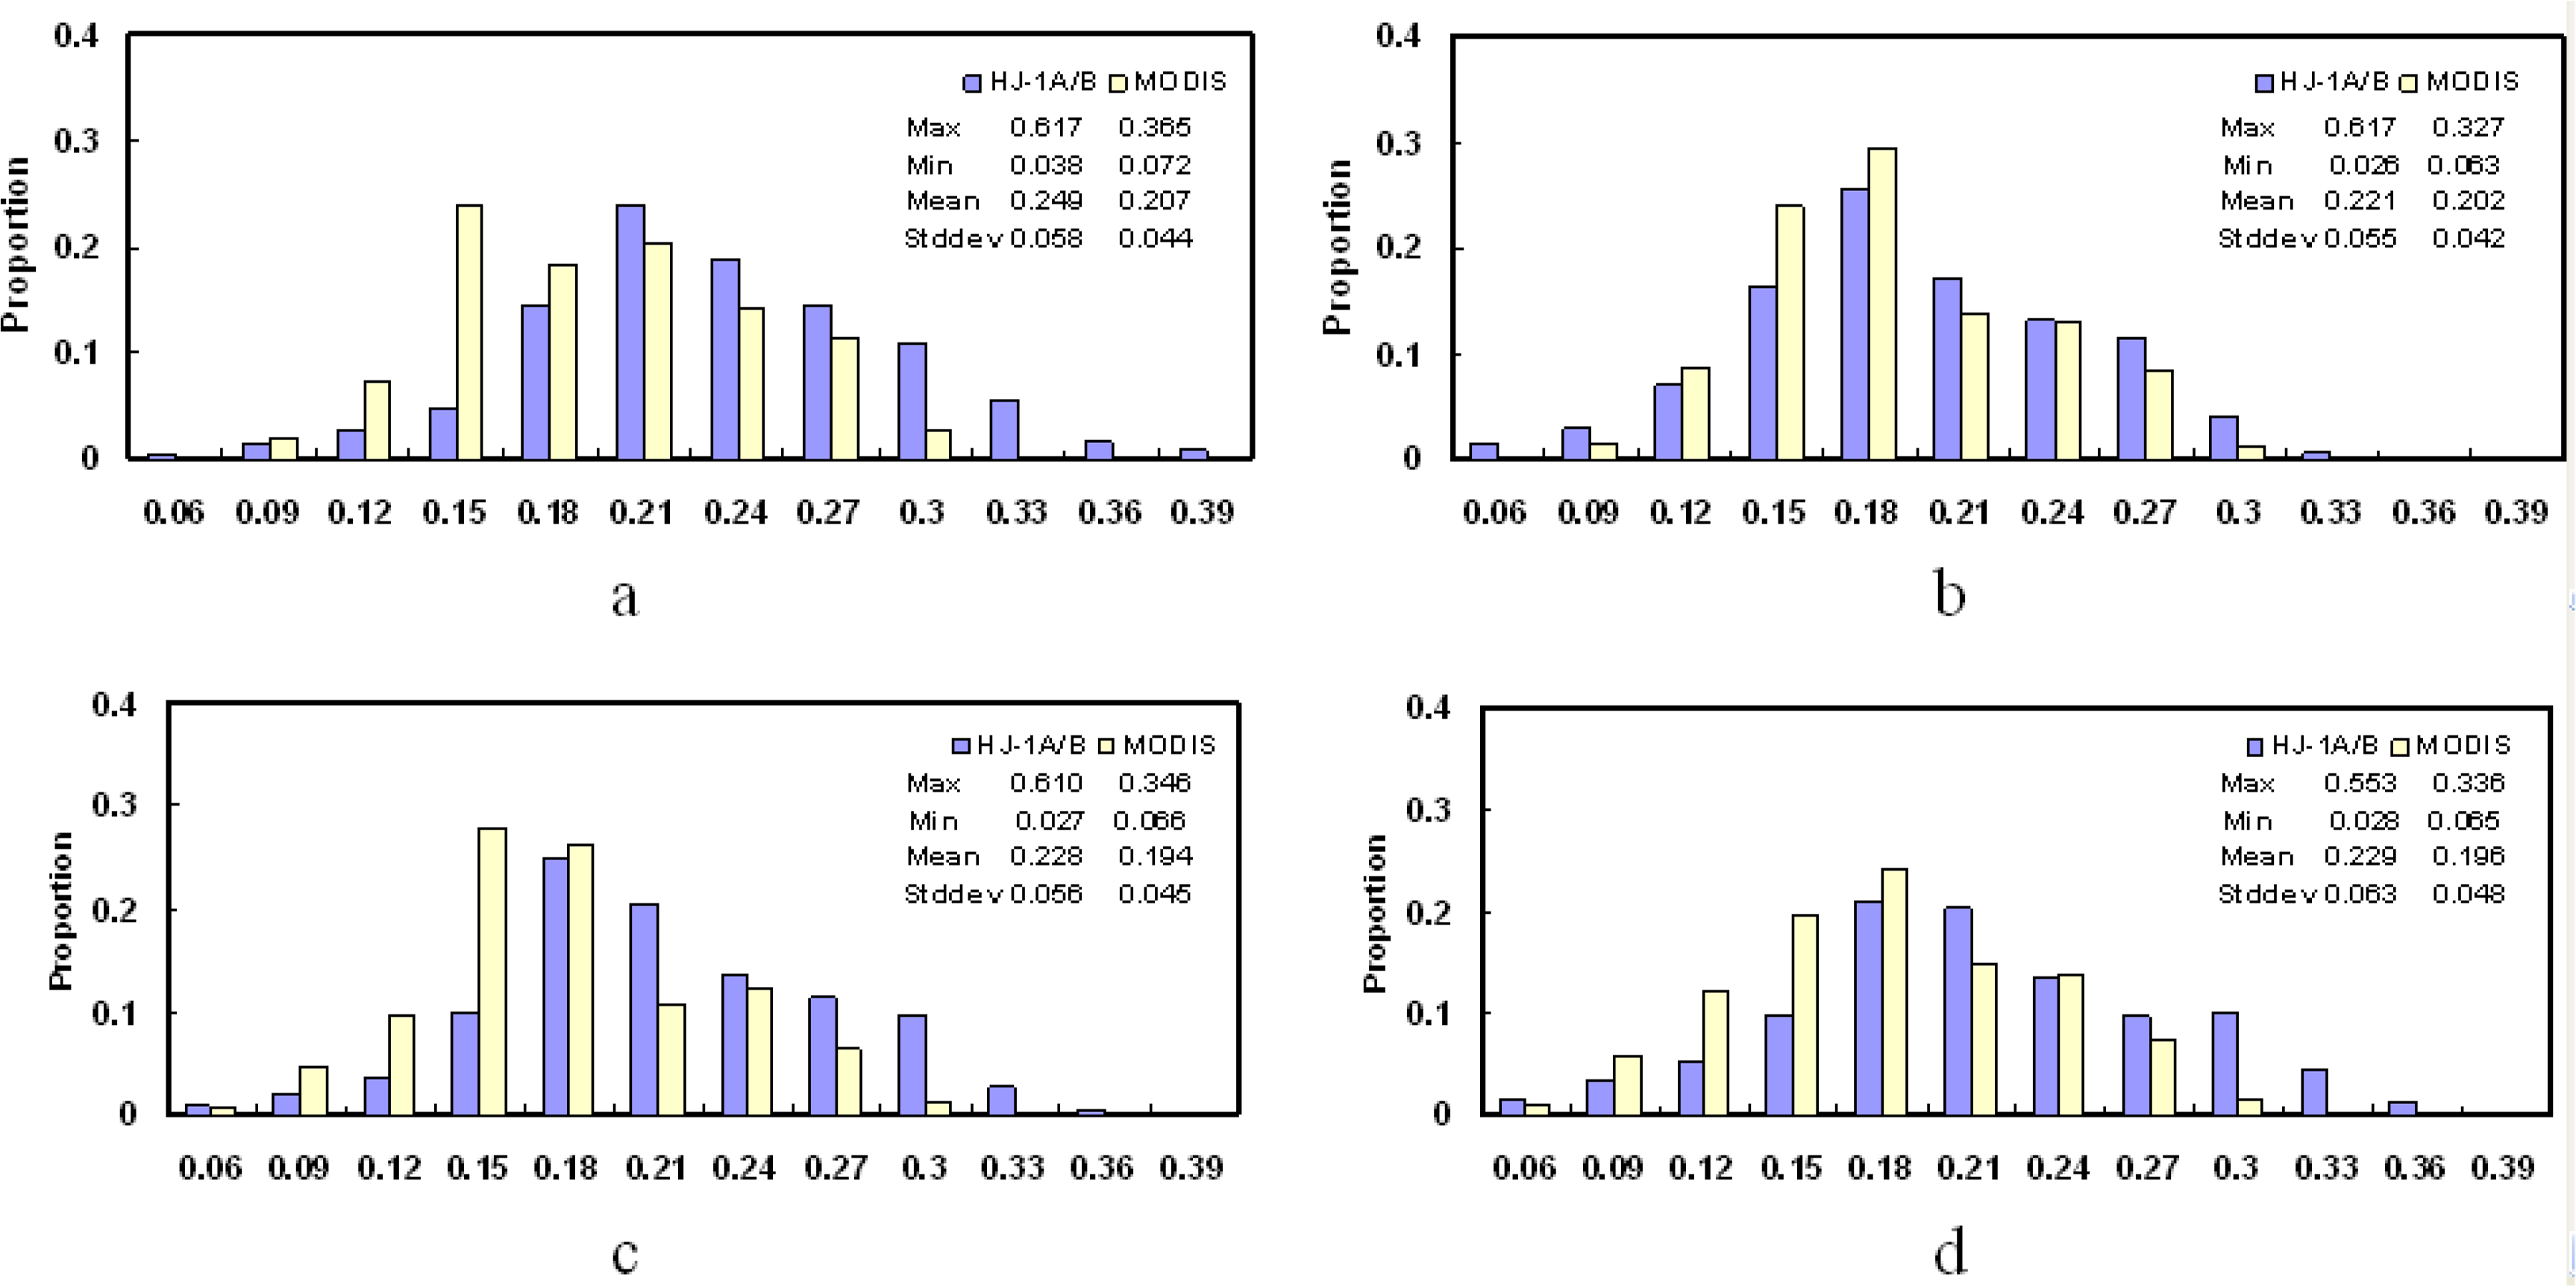
To further qualitatively analyze the spatial characteristics of both products (Figure 4), some statistical measurements (Figure 6e) are calculated for these two products within the square-shaped sub-area mentioned above. The left bar for each date in Figure 6e indicates statistics for the HJ-1A/B data, and the right bar indicates those for the MODIS product. The value range of the HJ-1A/B land surface albedo is obviously larger than that of the MODIS product at any date, which further proves that the HJ-1A/B land surface albedo has better spatial expression capability than that of the MODIS product.
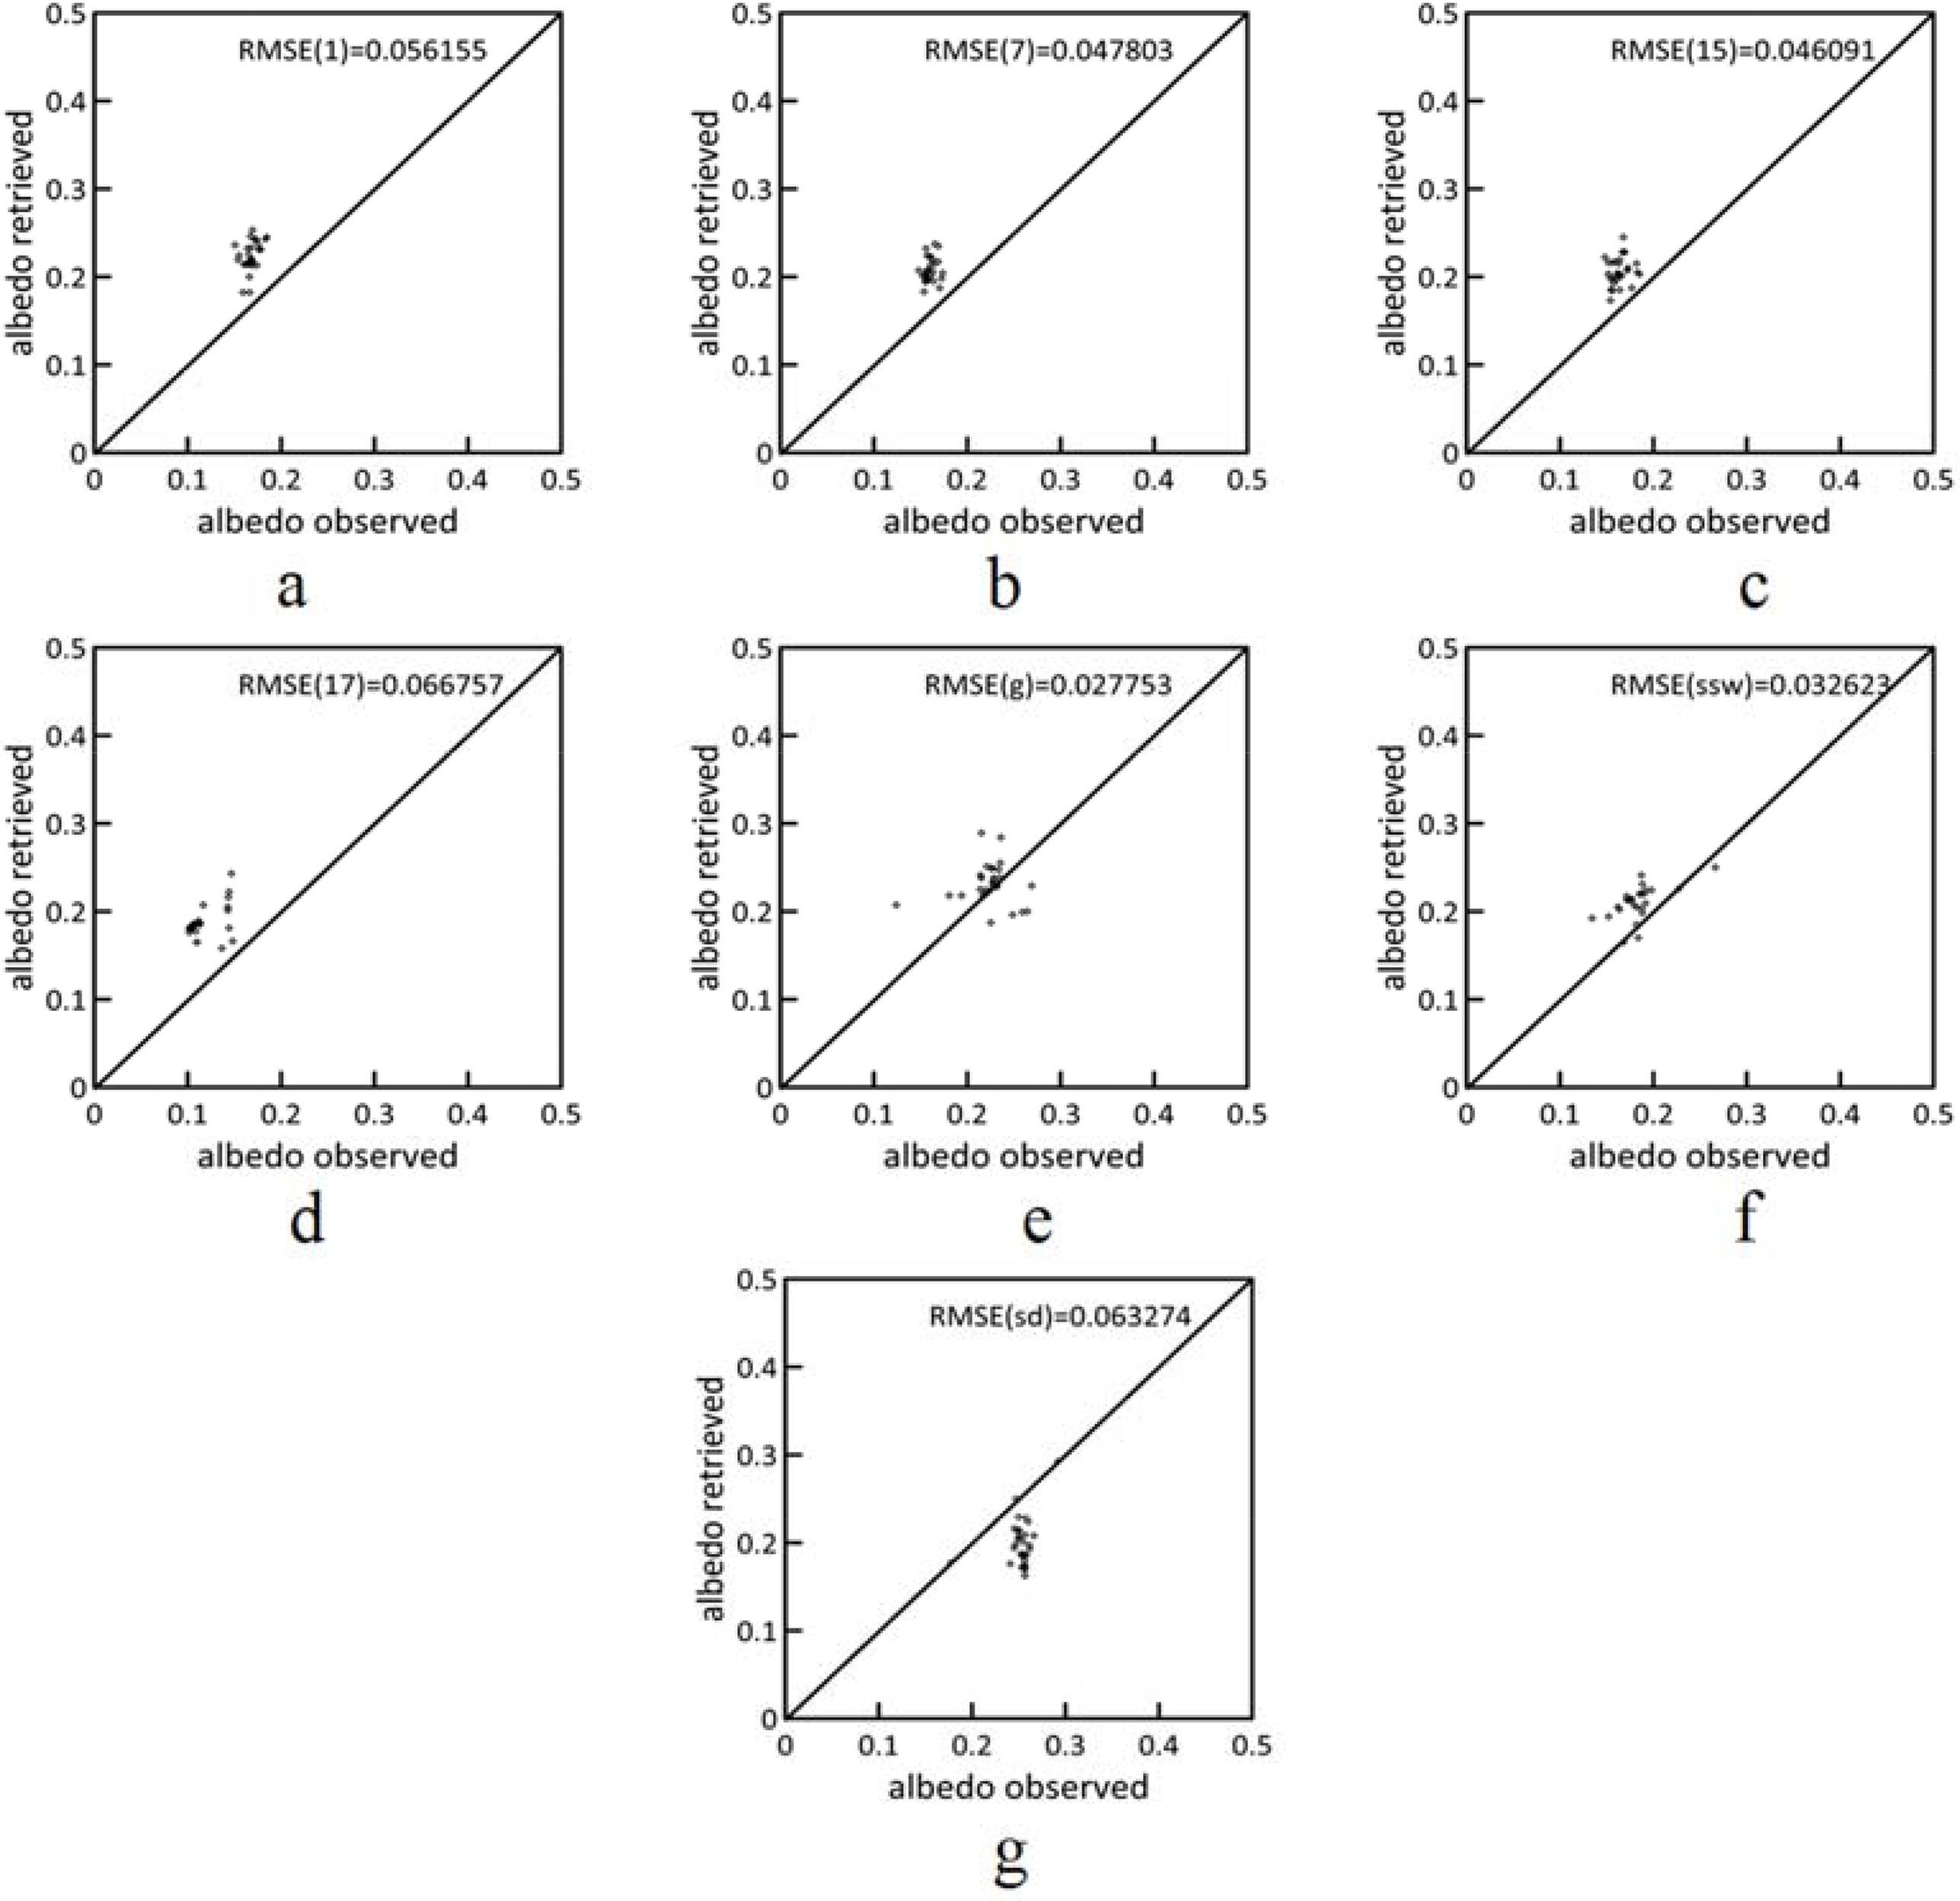
4.2. Comparison of the Retrieved Albedos with Ground Measurements
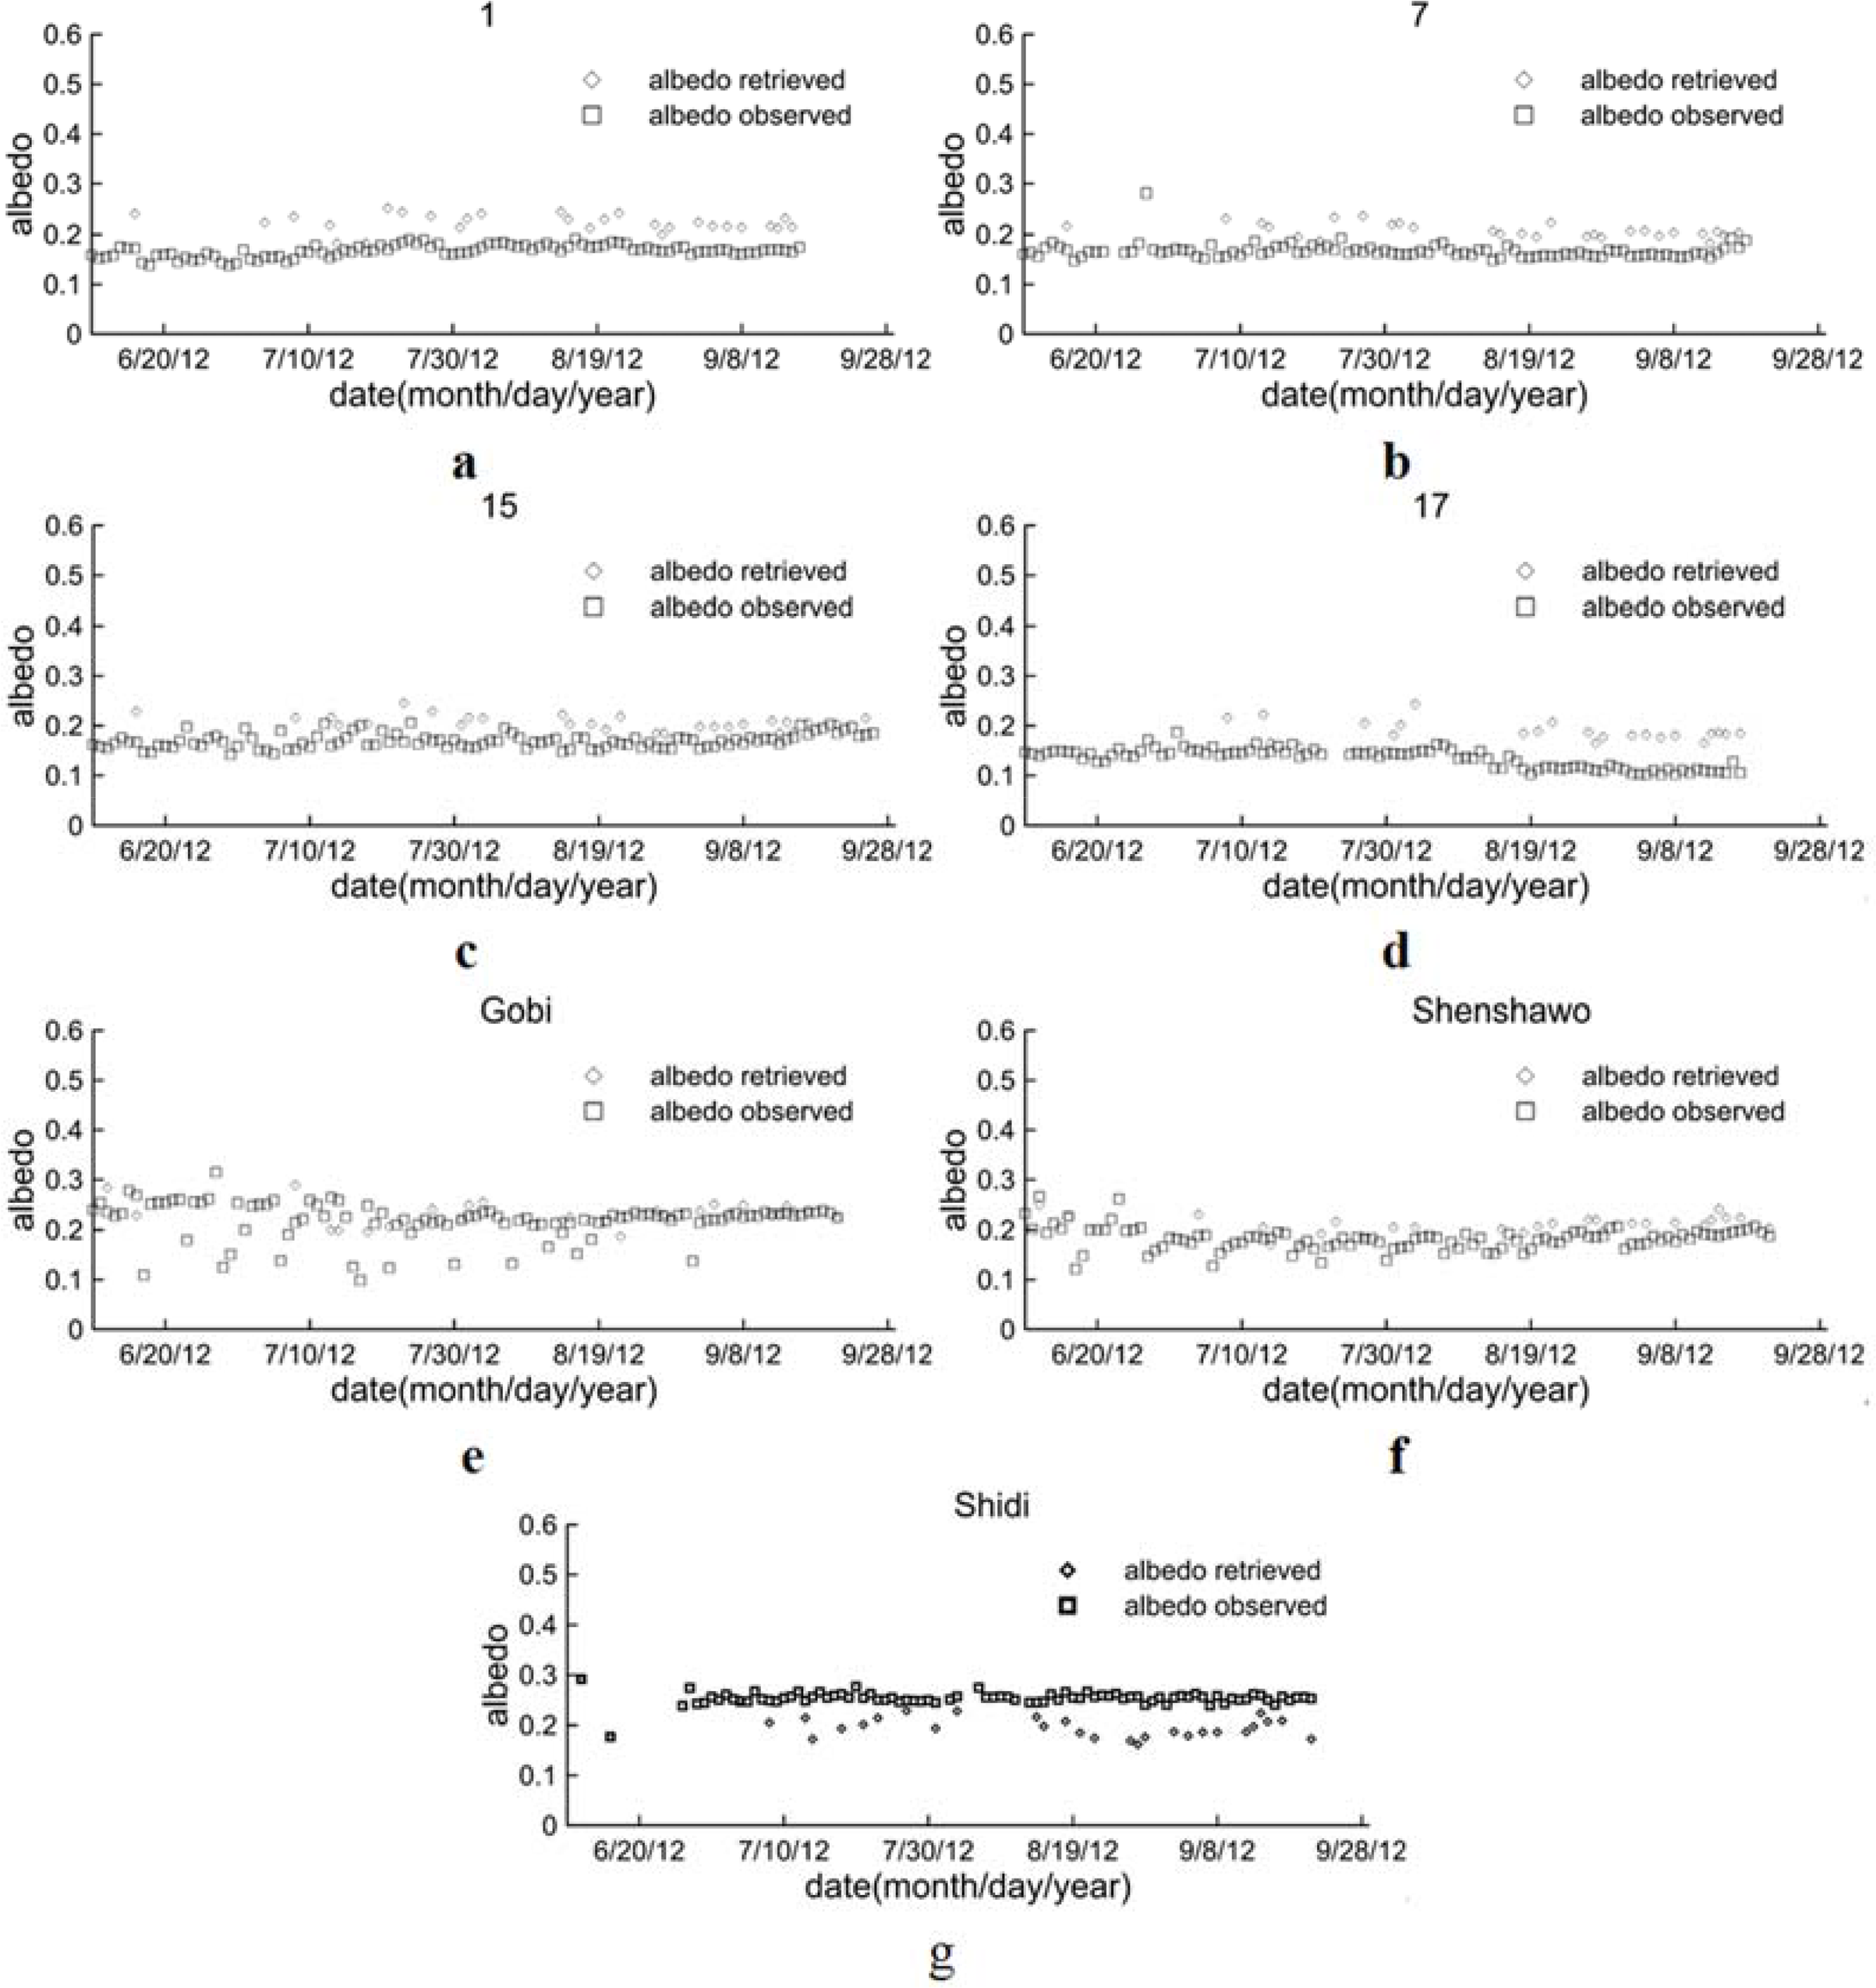
To validate the accuracy of the retrieved results, the albedos retrieved by the HJ-1A/B satellites between June and September 2012 at seven sites with different land cover types are organized into a temporal series. Then, a comparison between the retrieved albedo and ground measurements is performed (Figures 7 and 8). Considering that the pyranometers with 12 m altitude can cover an area within a 20 m radius at site No. 15 and those with a 6 m altitude can cover an area within a 10 m radius at the other sites, the retrieved land surface albedo with a 30 m resolution is theoretically considered to be consistent with the ground measurements in terms of spatial scale.
From the comparison, we can see that a minor discrepancy between the albedos from the ground measurements and those from the HJ-1A/B data can be detected for at the No. 7, No. 15, Gobi, and Shenshawo sites, while poorer agreement is found at No. 1, No. 17, and Shidi sites. There are two possible reasons for this, which can be explained as follows:
- (1)
Site No. 1 is located in a vegetable field, which is composed of not only vegetables but also a nearby greenhouse (Figure 3). In the classification criteria for the HJ-1A/B data, the greenhouse and vegetables are classified into the same type (crop), so the BRDF parameters of the HJ-1A/B data are actually estimated from a pseudo-MODIS pure pixel. Since the reflectance of greenhouse is generally higher than that of vegetables, the albedo of the pure pixel is greater than that measured at the ground site, who’s FOV only includes the vegetables.
- (2)
Atmospheric effects could have been overcorrected while processing the HJ-1A/B data.
Similarly, site No. 17 is located in an area covered by an orchard, around which various land cover types exist, such as short grass, roads, and bare soil. Most signals from the pyranometers are from the vicinity of the orchard with albedo generally less than that of the mixed pixel with vegetable, trees, and bare soil.
Unlike the situations of the two sites analyzed above, the Shidi site is located in the wetland, and corresponds to a pure pixel for the HJ-1A/B data and thus for MODIS. After careful analysis, we find that the BRDF parameters of the MODIS product are significantly underestimated in this area (not shown here). Since the BRDF parameters from the HJ-1A/B data are mainly derived from MODIS product, the lower values for the latter results of the retrieved albedo is underestimated as compared with the ground measurements.
In addition, a comparison between the MODIS albedo product and the in situ measurements over the seven sites is also conducted (Table 4). On average, the retrieved albedo from the HJ-1A/B data is relatively more accurate than the MODIS product for all seven sites (with a RMSE of 0.049 for the HJ-1A/B product, as compared with 0.065 for the MODIS product). Considering the mismatch in spatial coverage between the MODIS footprint and the ground measurements, as well as the similar accuracy of the retrieved albedos for both datasets at the No. 7, No. 15, Gobi, and Shenshawo sites, it can be concluded that the retrieved albedo from the HJ-1A/B data is at least no worse than the MODIS product. This accuracy is also comparable to, and even better than, the results obtained in [17] and [18]. Using the method proposed in this paper, land surface albedos with a high spatio–temporal (30 m and 2–4 days) resolution can be definitively derived using the high spatial and temporal resolution HJ observations.
4.3. Analysis of Error Sources
In general, any systematic analysis of error sources for ongoing studies definitely provides a basis for further improvement in the future. In this study, the error sources associated with our newly proposed method include the following: (1) Errors resulting from inaccurate atmospheric correction. The performance of atmospheric correction can directly affect the accuracy of the derived surface reflectance. As pointed out in the literature, when appropriate aerosol optical depth (AOD) is not available, the MODIS atmospheric-corrected reflectance can be unreliable [32]. In addition, the atmospheric parameter used for atmospheric correction of the HJ-1A/B band reflectance are acquired on the basis of the empirical knowledge referencing ground measurement and MODIS aerosol product, which may induce some uncertainties; (2) Uncertainties due to the variations in the MODIS BRDF within the 8-day scale. In this study, we hypothesized that the land surface state is steady during the 8 days studied (the temporal resolution of the MODIS albedo product). In fact, when several natural processes (e.g., snowfall, snowmelt, precipitation, and vegetation growth) and human activities (e.g., clearing and planting forests, sowing and harvesting of crops, and burning rangeland) occur, the land surface albedo could change rapidly [33]; (3) Misclassification. Image classification error for the HJ-1A/B data can lead to misjudgments in the classification of MODIS pixels as pure or mixed, and thus may introduce errors into the algorithm; and (4) similar to (3), uncertainties arising from unreasonable assignments for the threshold of verifying a pure pixel.
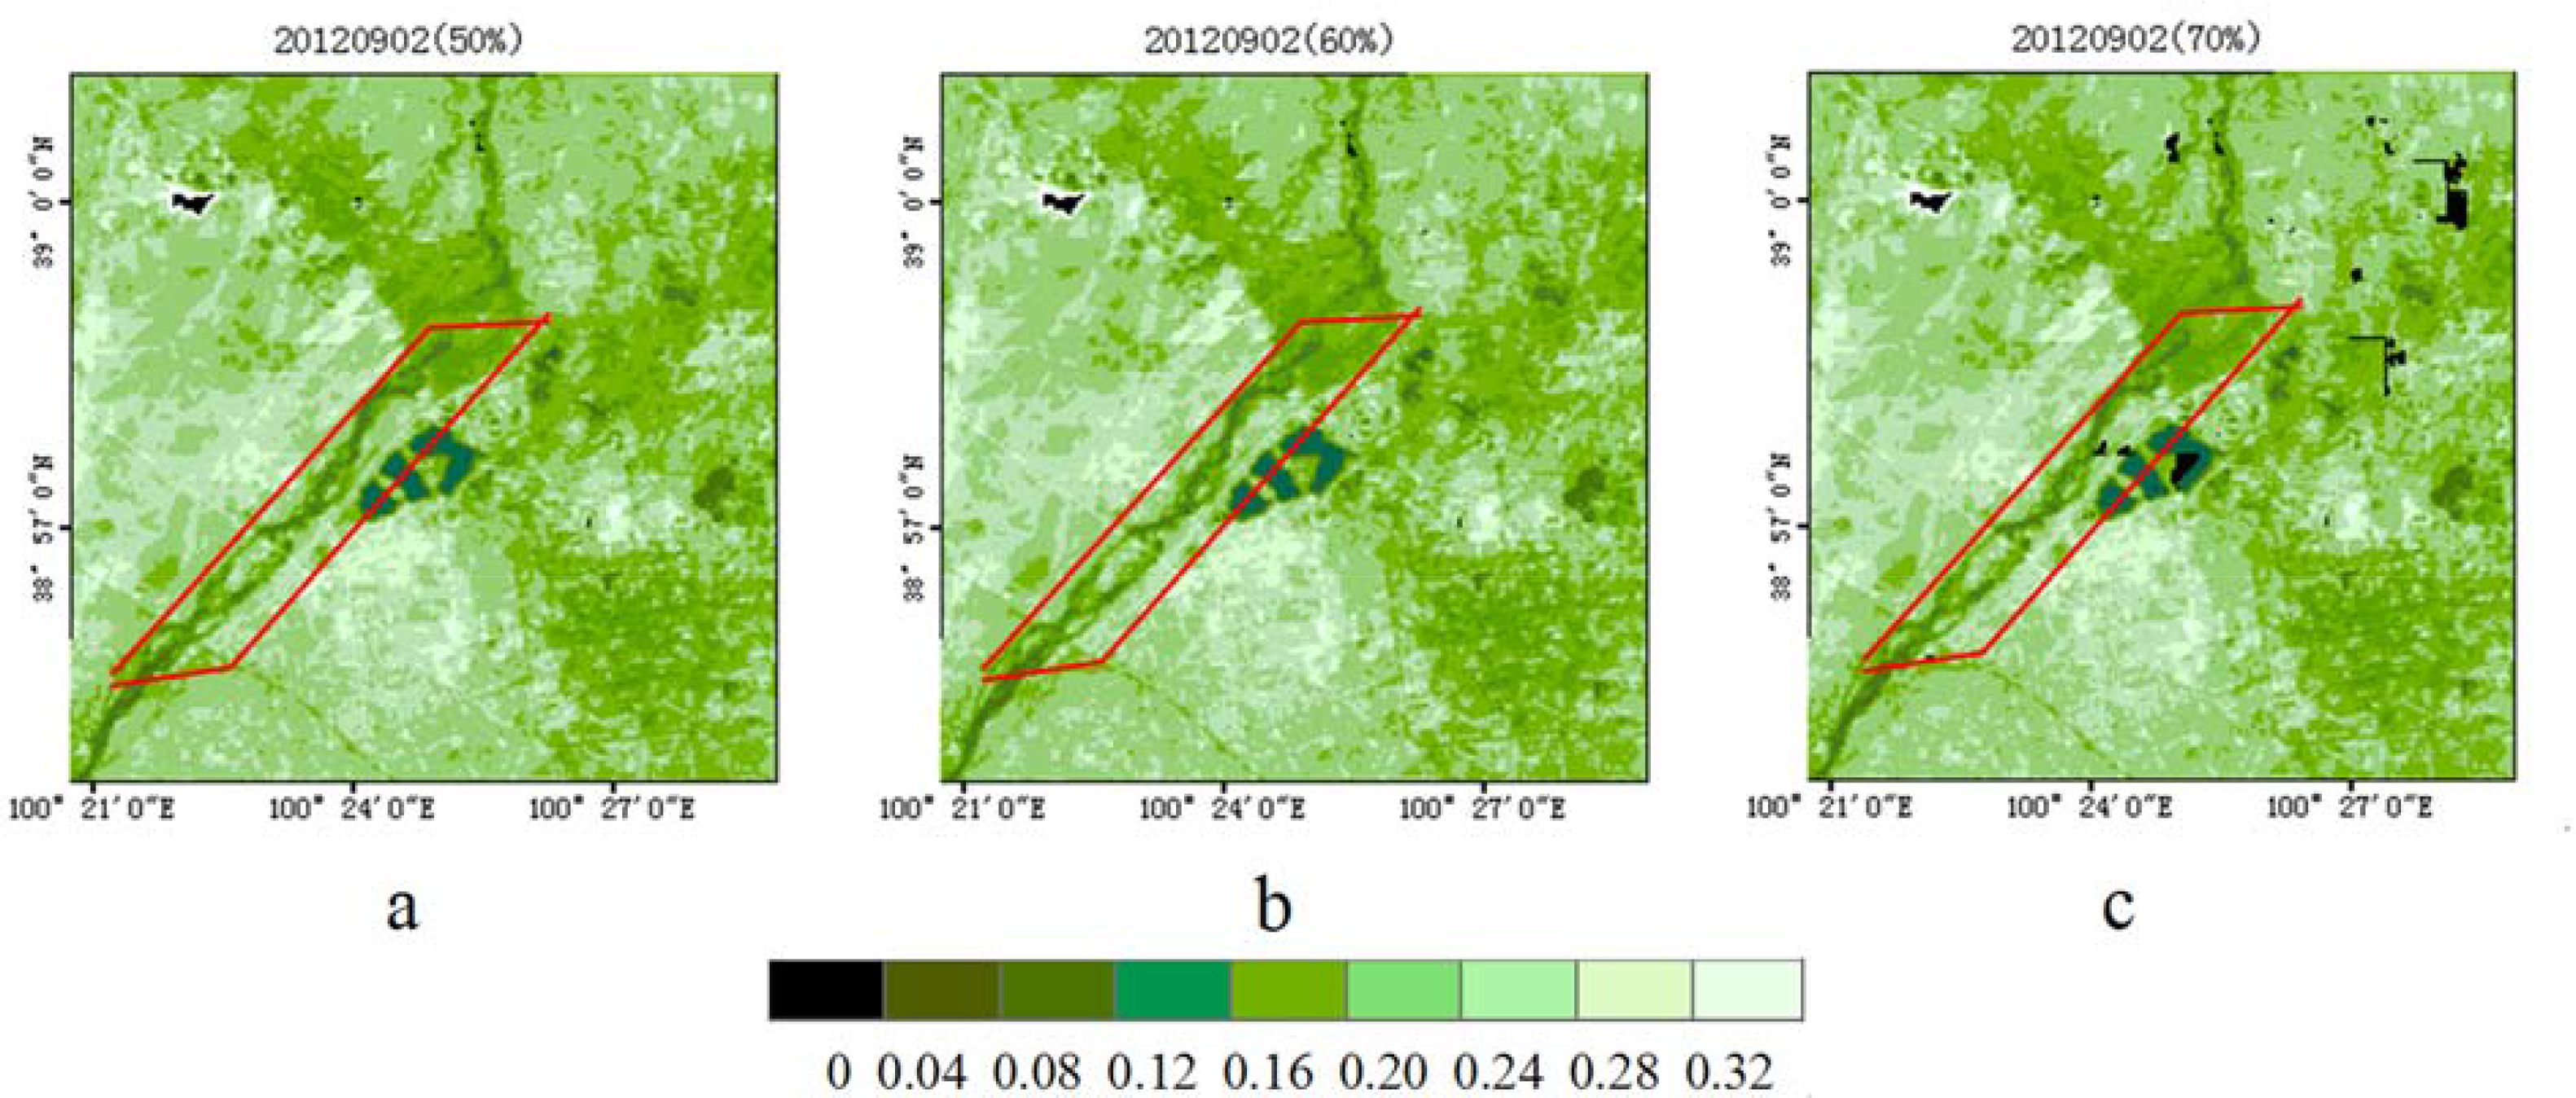
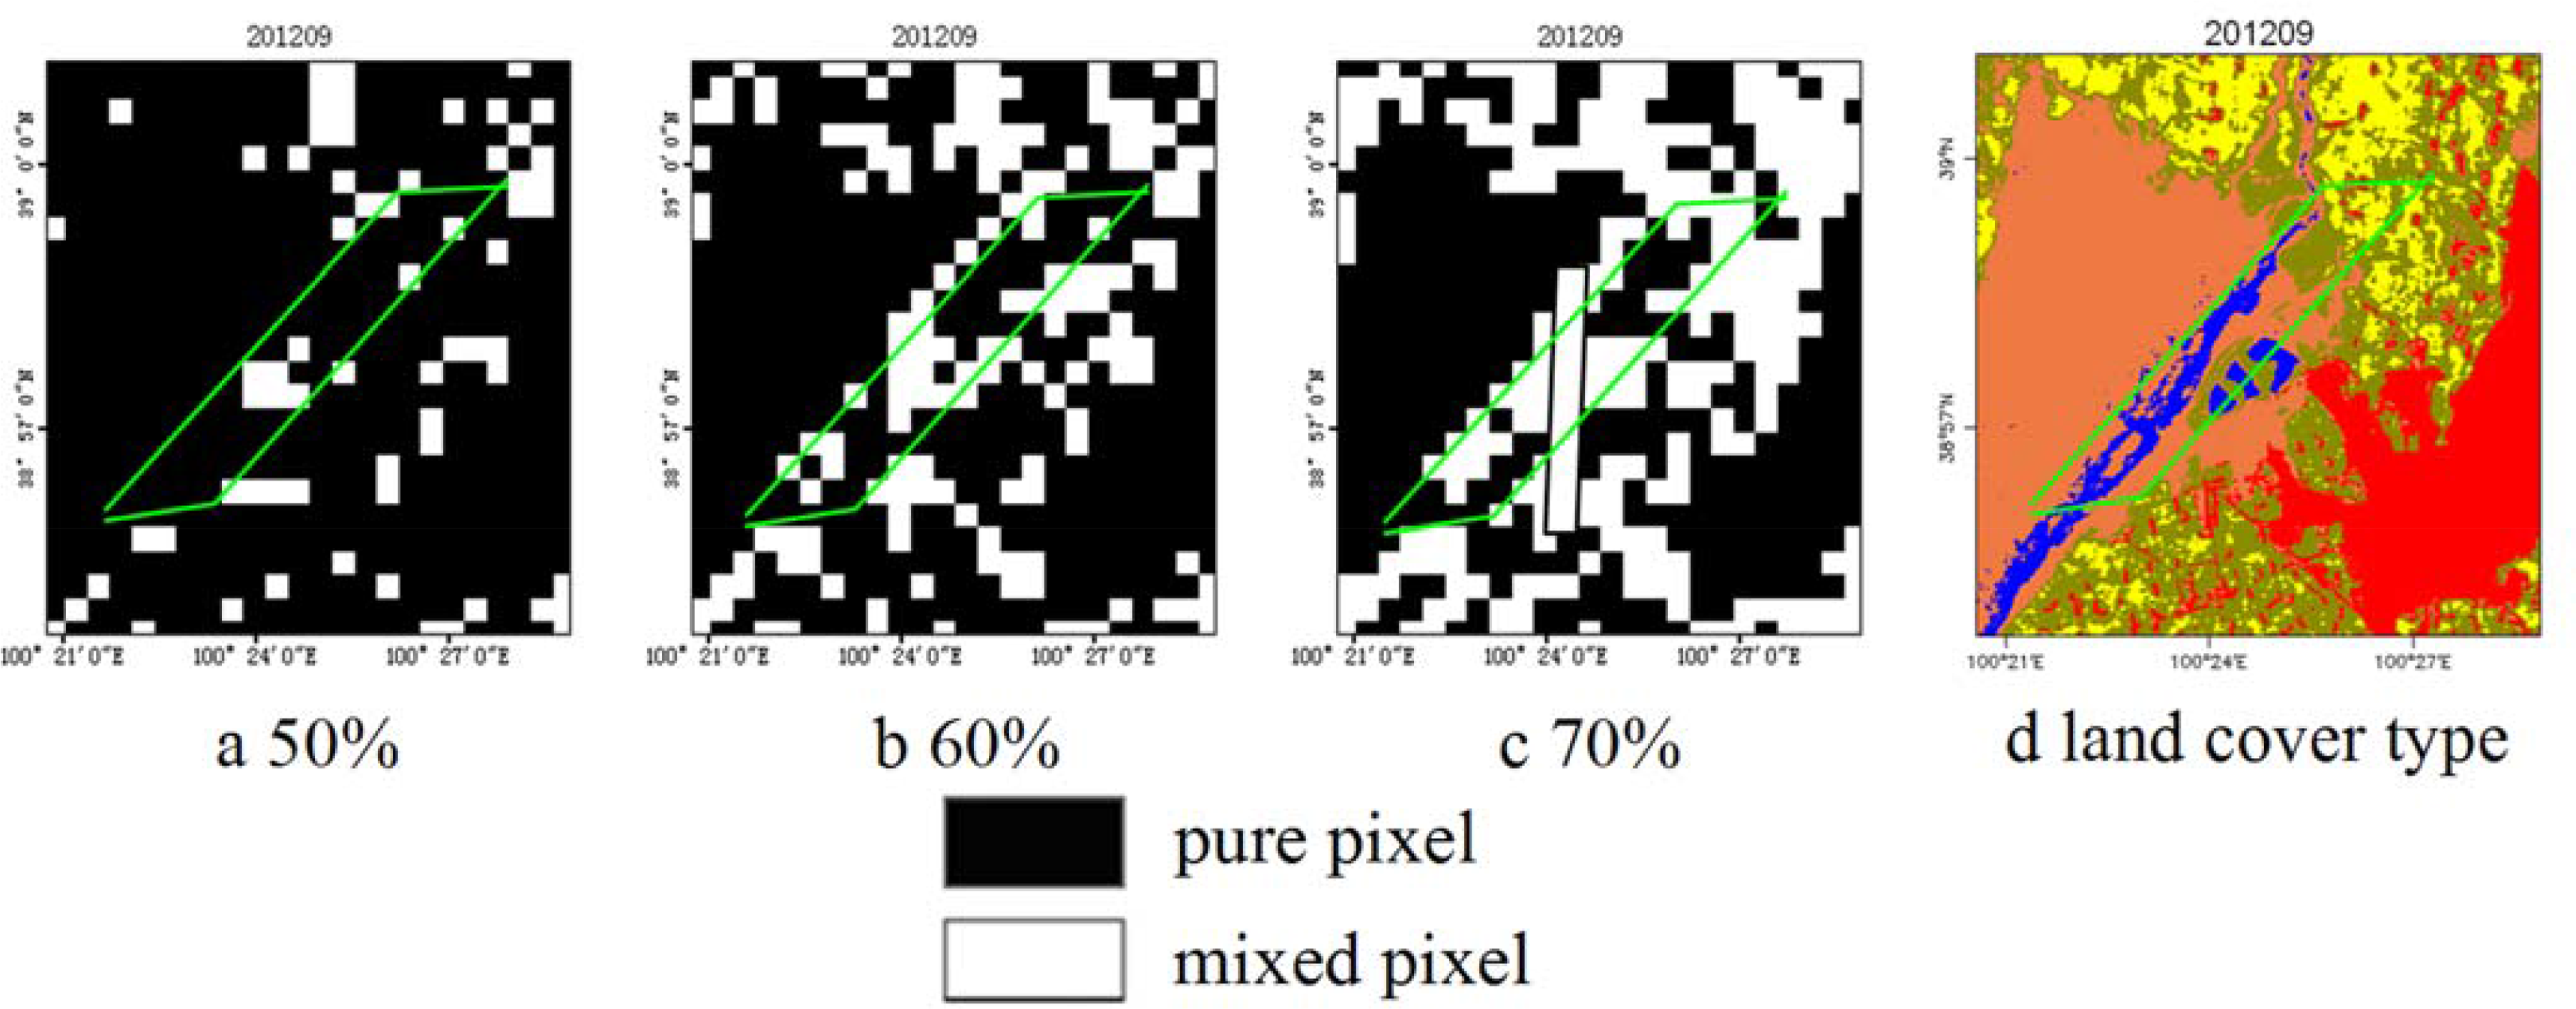
In this study, a threshold of 50% is used to discriminate a pure MODIS pixel. Is this reasonable? Theoretically, a higher threshold could result in a more accurate adjudgement of a pure pixel. While a higher percentage threshold means less pure MODIS pixels, and thus less valid samples that can be used for constructing LUT at mixed MODIS pixels. Hence, a higher value of the threshold doesn’t necessarily make for better retrieving accuracy. This depends on the inhomogeneous degree of the study region. For the purposes of demonstrating the reasonability of the 50% threshold we used in this study, a test study based on the different thresholds (50%, 60%, and 70%) in a sub-area (Figure 9) of our study site is further investigated.
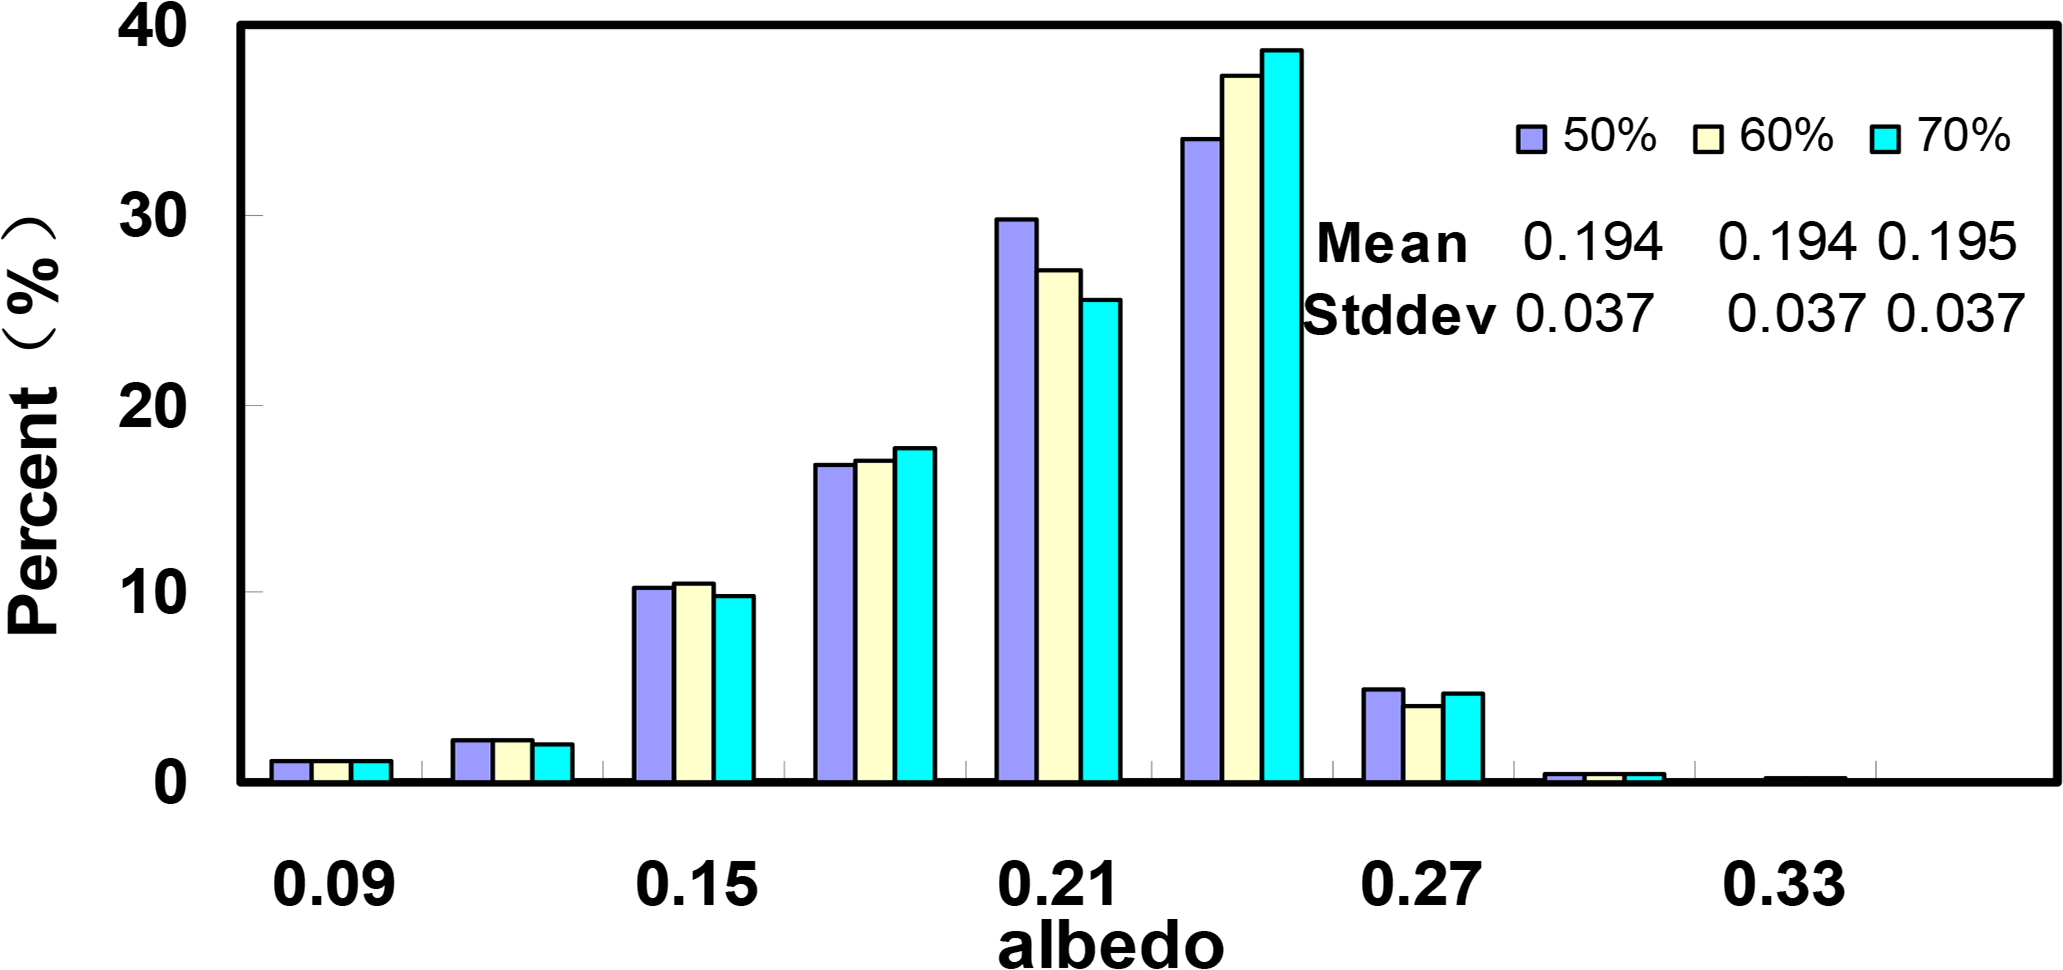
From Figure 9, different settings for the threshold could result in obvious judgment differences. However, the retrieved white-sky albedos based on different thresholds have a similar spatial distribution (Figure 10), except for some invalid pixels in the northeastern part of albedo map when a 70% threshold is adopted (Figure 10c). Most of these invalid pixels correspond to mixed pixels (Figure 9c), where not enough pure pixels can be used to construct LUT. For quantitative analysis, some statistical measurements are calculated within a marked area in Figure 10, where the discrimination of the pure pixel is obviously affected by the different assignments of threshold.
Based on Figure 11, the statistics show that the retrieved white-sky albedos based on different thresholds have similar possibility density histograms. Analysis reveals that larger thresholds don’t necessarily improve the accuracy of the result significantly in this study. Although it cannot affect the conclusion of this study, a higher threshold and more accurate classification are still recommended while considering the general applicability of the proposed method. Investigation of this issue over different study areas is one of our main works for the future.
Notably, although some of the errors mentioned above may exist in the novel method in its present version, the validation and comparison results reveal that the accuracy of the new method is still comparable to that of MODIS and other studies. Further, considering its high spatio-temporal resolution, the newly developed method is truly advantageous.
5. Conclusions
This paper proposed an algorithm for retrieving land surface albedo by combining the HJ-1A/B land surface reflectance data and the MODIS BRDF product. The advantage of this algorithm is that it makes full use of the high spatio-temporal resolution of the HJ-1A/B data and the prior knowledge of MODIS BRDF product. In total, eight HJ-1A/B images from 1st June 2012 to 30th September 2012 were used to test the proposed method. The validation against measurements of seven ground sites with different land cover types shows that on average, the retrieved HJ-1A/B albedos were consistent with those of ground measurements, except for relatively large discrepancies in the No. 1, No. 17, and Shidi sites because of the heterogeneity of the land surface in these sites. In addition, comparisons between the MODIS albedo product and the in situ measurements, as well as between the MODIS product and the HJ-1A/B data, were also conducted. The results reveal that the accuracy of the newly developed method is not worse than that of other methods. Further, considering its high spatio-temporal (30 m and 2–4 days) resolution, the newly developed method is quite practical and thus very attractive.
Acknowledgments
This work was partly supported by the CAS/SAFEA International Partnership Program for Creative Research Teams (Grant nr. KZZD-EW-TZ-09) and the strategic research program KBIV Sustainable Spatial Development of Ecosystems, Landscapes, Seas and Regions’ which is funded by the Dutch Ministry of Economic Affairs and carried out by the Wageningen University Research Centre in conjunction with the EU-FP7 project CEOP-AEGIS (Grant 212921), and NSFC project (Grant nr. 41201347).
Author Contributions
Bo Gao designed the research, processed the remote sensing data, and drafted the manuscript. The co-authors provided supervision on manuscript construction and revision, and results analysis throughout the process.
Conflicts of Interest
The authors declare no conflict of interest.
References
- Tsvetsinskaya, E.; Schaaf, C.; Gao, F.; Strahler, A.; Dickinson, R.; Zeng, X.; Lucht, W. Relating MODIS-derived surface albedo to soils and rock types over Northern Africa and the Arabian peninsula. Geophys. Res. Lett 2002, 29, 67–61. [Google Scholar]
- Mueller, R.; Trentmann, J.; Trager-Chatterjee, C.; Posselt, R.; Stockli, R. The role of the effective cloud albedo for climate monitoring and analysis. Remote Sens 2011, 3, 2305–2320. [Google Scholar]
- Choi, H.I. Parameterization of high resolution vegetation characteristics using remote sensing products for the Nakdong River watershed, Korea. Remote Sens 2013, 5, 473–490. [Google Scholar]
- Lucht, W.; Schaaf, C.B.; Strahler, A.H. An algorithm for the retrieval of albedo from space using semiempirical BRDF models. IEEE Trans. Geosci. Remote Sens 2000, 38, 977–998. [Google Scholar]
- Gao, F.; Schaaf, C.B.; Strahler, A.H.; Roesch, A.; Lucht, W.; Dickinson, R. MODIS bidirectional reflectance distribution function and albedo Climate Modeling Grid products and the variability of albedo for major global vegetation types. J. Geophys. Res.: Atmos 2005, 110. [Google Scholar] [CrossRef]
- Zhao, X.; Liang, S.L.; Liu, S.H.; Yuan, W.P.; Xiao, Z.Q.; Liu, Q.; Cheng, J.; Zhang, X.T.; Tang, H.R.; Zhang, X.; et al. The global land surface satellite (GLASS) remote sensing data processing system and products. Remote Sens 2013, 5, 2436–2450. [Google Scholar]
- Leroy, M.; Deuze, J.L.; Breon, F.M.; Hautecoeur, O.; Herman, M.; Buriez, J.C.; Tanre, D.; Bouffies, S.; Chazette, P.; Roujean, J.L. Retrieval of atmospheric properties and surface bidirectional reflectances over land from POLDER/ADEOS. J. Geophys. Res.: Atmos 1997, 102, 17023–17037. [Google Scholar]
- Hautecoeur, O.; Leroy, M.M. Surface bidirectional reflectance distribution function observed at global scale by POLDER/ADEOS. Geophys Res Lett 1998, 25, 4197–4200. [Google Scholar]
- Muller, J.P. Algorithm Theoretical Basis Document BRDF/ALBEDO Retrieval. Available online: http://modis.gsfc.nasa.gov/data/atbd/atbd_mod09.pdf (accessed on 31 July 2014).
- Pinty, B.; Roveda, F.; Verstraete, M.M.; Gobron, N.; Govaerts, Y.; Martonchik, J.V.; Diner, D.J.; Kahn, R.A. Surface albedo retrieval from meteosat-1: Part 1. Theory. J. Geophys. Res.: Atmos 2000, 105, 18099–18112. [Google Scholar]
- Pinty, B.; Roveda, F.; Verstraete, M.M.; Gobron, N.; Govaerts, Y.; Martonchik, J.V.; Diner, D.J.; Kahn, R.A. Surface albedo retrieval from meteosat-2: Part 2. Applications. J. Geophys. Res.: Atmos 2000, 105, 18113–18134. [Google Scholar]
- Geiger, B.; Carrer, D.; Franchisteguy, L.; Roujean, J.L.; Meurey, C. Land surface albedo derived on a daily basis from Meteosat Second Generation observations. IEEE Trans. Geosci. Remote Sens 2008, 46, 3841–3856. [Google Scholar]
- Liang, S.L.; Strahler, A.H.; Walthall, C. Retrieval of land surface albedo from satellite observations: A simulation study. J. Appl. Meteorol 1999, 38, 712–725. [Google Scholar]
- Liang, S.L.; Stroeve, J.; Box, J.E. Mapping daily snow/ice shortwave broadband albedo from Moderate Resolution Imaging Spectroradiometer (MODIS): The improved direct retrieval algorithm and validation with Greenland in situ measurement. J. Geophys. Res.: Atmos 2005, 110. [Google Scholar] [CrossRef]
- Liu, N.F.; Liu, Q.; Wang, L.Z.; Wen, J.G. A temporal filtering algorithm to reconstruct daily albedo series based on glass albedo product. In Proceedings of the 2011 IEEE International Geoscience and Remote Sensing Symposium (IGARSS), Vancouver, BC, Canada, July 24–29 2011; pp. 4277–4280.
- Acharya, P.; Berk, A.; Bernstein, L.; Matthew, M.; Adler-Golden, S.; Robertson, D.; Anderson, G.; Chetwynd, J.; Kneizys, F.; Shettle, E. Modtran User’s Manual Versions 3.7 and 4.0; Air Force Research Laboratory: Hanscom, MA, USA, 1998. [Google Scholar]
- Qu, Y.; Liu, Q.; Liang, S.L.; Wang, L.Z.; Liu, N.F.; Liu, S.H. Direct-estimation algorithm for mapping daily land-surface broadband albedo from MODIS data. IEEE Trans. Geosci. Remote Sens 2013, 52, 907–919. [Google Scholar]
- Shuai, Y.M.; Masek, J.G.; Gao, F.; Schaaf, C.B. An algorithm for the retrieval of 30-m snow-free albedo from Landsat surface reflectance and MODIS BRDF. Remote Sens. Environ 2011, 115, 2204–2216. [Google Scholar]
- Wang, Q.A.; Wu, C.Q.; Li, Q.; Li, J.S. Chinese HJ-1A/B satellites and data characteristics. Sci. China Earth Sci 2010, 53, 51–57. [Google Scholar]
- Schaaf, C.B.; Gao, F.; Strahler, A.H.; Lucht, W.; Li, X.W.; Tsang, T.; Strugnell, N.C.; Zhang, X.Y.; Jin, Y.F.; Muller, J.P.; et al. First operational BRDF, albedo NADIR reflectance products from MODIS. Remote Sens. Environ 2002, 83, 135–148. [Google Scholar]
- Wanner, W.; Li, X.; Strahler, A.H. On the derivation of kernels for kernel-driven models of bidirectional reflectance. J. Geophys. Res.: Atmos 1995, 100, 21077–21089. [Google Scholar]
- Roujean, J.L. A bidirectional reflectance model of the earth’s surface for the correction of remote sensing data. J. Geophys. Res 1992, 97, 455–468. [Google Scholar]
- Li, X.W.; Strahler, A.H. Geometric-optical bidirectional reflectance modeling of the discrete crown vegetation canopy-effect of crown shape and mutual shadowing. IEEE Trans. Geosci. Remote Sens 1992, 30, 276–292. [Google Scholar]
- Vermote, E.; Tanré, D.; Deuzé, J.; Herman, M.; Morcrette, J.; Kotchenova, S. Second Simulation of a Satellite Signal in the Solar Spectrum-Vector (6SV). Available online: ftp://loa.univ-lille1.fr/6S/6S_Manual_Part_1.pdf.gz (accessed on 21 August 2014).
- Vermote, E.F.; Tanré, D.; Deuze, J.L.; Herman, M.; Morcette, J.J. Second Simulation of the Satellite Signal in the Solar Spectrum, 6S: An overview. IEEE Trans. Geosci. Remote Sens 1997, 35, 675–686. [Google Scholar]
- Liu, S.; Liu, Q.; Liu, Q.; Wen, J.; Li, X. The angular and spectral kernel model for BRDF and albedo retrieval. IEEE J. Sel. Topics Appl. Earth Observ. Remote Sens 2010, 3, 241–256. [Google Scholar]
- Li, X.; Li, X.W.; Li, Z.Y.; Ma, M.G.; Wang, J.; Xiao, Q.; Liu, Q.; Che, T.; Chen, E.X.; Yan, G.J.; et al. Watershed allied telemetry experimental research. J. Geophys. Res.: Atmos 2009, 114. [Google Scholar] [CrossRef]
- Li, X.; Cheng, G.D.; Liu, S.M.; Xiao, Q.; Ma, M.G.; Jin, R.; Che, T.; Liu, Q.H.; Wang, W.Z.; Qi, Y.; et al. Heihe Watershed Allied Telemetry Experimental Research (HIWATER): Scientific objectives and experimental design. Am. Meteorol. Soc 2013, 94, 1145–1160. [Google Scholar]
- Loveland, T.; Reed, B.; Brown, J.; Ohlen, D.; Zhu, Z.; Yang, L.; Merchant, J. Development of a global land cover characteristics database and IGBP DISCover from 1 km AVHRR data. Int. J. Remote Sens 2000, 21, 1303–1330. [Google Scholar]
- Zhong, B.; Ma, P.; Nie, A.; Yang, A.; Yao, Y.; Lv, W.; Zhang, H.; Liu, Q. Land cover mapping using time series HJ-1/CCD data. Sci. China Earth Sci 2014, 1, 1–10. [Google Scholar]
- Strahler, A.H.; Muller, J.; Lucht, W.; Schaaf, C.; Tsang, T.; Gao, F.; Li, X.; Lewis, P.; Barnsley, M.J. MODIS BRDF/albedo Product: Algorithm Theoretical Basis Document Version 5.0. Available online: http://modis.gsfc.nasa.gov/data/atbd/atbd_mod09.pdf (accessed on 21 April 2014).
- Liang, S.; Fallah-Adl, H.; Kalluri, S.; JáJá, J.; Kaufman, Y.J.; Townshend, J.R. An operational atmospheric correction algorithm for Landsat Thematic Mapper imagery over the land. J. Geophys. Res. Atmos 1997, 102, 17173–17186. [Google Scholar]
- Mason, P.; Reading, B. Implementation Plan for the Global Observing Systems for Climate in Support of the UNFCCC. Available online: http://www.wmo.int/pages/prog/gcos/Publications/gcos-92_GIP_ES.pdf (accessed on 3 August 2014).


| Band | 1 | 2 | 3 | 4 |
| HJ1ACCD1 | 0.5878 | 0.6543 | 0.4183 | 0.3891 |
| HJ1ACCD2 | 0.5138 | 0.5175 | 0.4838 | 0.3865 |
| HJ1BCCD1 | 0.6066 | 0.6175 | 0.4703 | 0.3925 |
| HJ1BCCD2 | 0.5149 | 0.5403 | 0.4592 | 0.3898 |
| Pyranometers set-up | ||||
|---|---|---|---|---|
| Site | Location (Degree) | Land Cover | Sensor’s Height (m) | Radius of Covering Area (m) |
| No.1 | 100.3582E, 38.8932N | vegetable | 6 | 10 |
| No.7 | 100.36521E, 38.87676N | corn | 6 | 10 |
| No.15 | 100. 37223E, 38. 85551N | corn | 12 | 20 |
| No.17 | 100.36972E, 38.84510N | orchard | 6 | 10 |
| Gobi | 100.30420E, 38.91496N | Gobi | 6 | 10 |
| Shenshawo | 100.49330E, 38.78917N | desert | 6 | 10 |
| Shidi | 100.44640E, 38.97514N | wetland | 6 | 10 |
| Satellite | Band | Spectral Range (μm) | Spatial Resolution (m) |
|---|---|---|---|
| HJ-1A/1B | 1 | 0.43–0.52 | 30 |
| 2 | 0.52–0.60 | 30 | |
| 3 | 0.63–0.69 | 30 | |
| 4 | 0.76–0.90 | 30 |
© 2014 by the authors; licensee MDPI, Basel, Switzerland This article is an open access article distributed under the terms and conditions of the Creative Commons Attribution license (http://creativecommons.org/licenses/by/3.0/).
Share and Cite
Gao, B.; Jia, L.; Wang, T. Derivation of Land Surface Albedo at High Resolution by Combining HJ-1A/B Reflectance Observations with MODIS BRDF Products. Remote Sens. 2014, 6, 8966-8985. https://doi.org/10.3390/rs6098966
Gao B, Jia L, Wang T. Derivation of Land Surface Albedo at High Resolution by Combining HJ-1A/B Reflectance Observations with MODIS BRDF Products. Remote Sensing. 2014; 6(9):8966-8985. https://doi.org/10.3390/rs6098966
Chicago/Turabian StyleGao, Bo, Li Jia, and Tianxing Wang. 2014. "Derivation of Land Surface Albedo at High Resolution by Combining HJ-1A/B Reflectance Observations with MODIS BRDF Products" Remote Sensing 6, no. 9: 8966-8985. https://doi.org/10.3390/rs6098966