Improvements in Sample Selection Methods for Image Classification

Abstract
: Traditional image classification algorithms are mainly divided into unsupervised and supervised paradigms. In the first paradigm, algorithms are designed to automatically estimate the classes’ distributions in the feature space. The second paradigm depends on the knowledge of a domain expert to identify representative examples from the image to be used for estimating the classification model. Recent improvements in human-computer interaction (HCI) enable the construction of more intuitive graphic user interfaces (GUIs) to help users obtain desired results. In remote sensing image classification, GUIs still need advancements. In this work, we describe our efforts to develop an improved GUI for selecting the representative samples needed to estimate the classification model. The idea is to identify changes in the common strategies for sample selection to create a user-driven sample selection, which focuses on different views of each sample, and to help domain experts identify explicit classification rules, which is a well-established technique in geographic object-based image analysis (GEOBIA). We also propose the use of the well-known nearest neighbor algorithm to identify similar samples and accelerate the classification.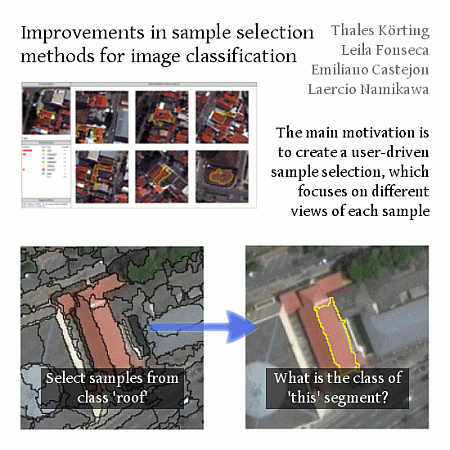
1. Introduction
Several strategies for satellite image classification are available in the literature (see [1]). These strategies combine different algorithms for feature extraction, classification and validation. Although great advances have been made in this area, the potential of human vision remains underexploited [2]. The large-scale use of direct visual analysis for image classification is a time-consuming task. Additionally, despite over 30 years of experience in data gathering, processing and analysis in the area of remote sensing, it is surprisingly difficult to provide a straightforward answer to the very basic question of “What’s in an image?” [3]. A recurrent statement given by [4] suggests that a well-designed analysis scheme should use the strengths of both humans and machines, but in a manner that remains efficiency and objectivity while maximally enhancing performance.
Since the 1970s, satellites have provided images of the earth’s surface, and the analysis of these images has been mainly performed using isolated pixel information. However, as stated by [5], the per-pixel approach has its limits. For example, a large proportion of the signal that apparently originates from the land area is represented by a pixel that originates from the surrounding pixels. Another well-known problem with per-pixel analysis is the common “salt and pepper” effect in the classification maps [4]. An important step to improve classification quality was introduced by the emergence of geographic object-based image analysis (GEOBIA), which is devoted to developing automated methods to partition remote sensing imagery into image objects and to assess their characteristics at spatial, spectral and temporal scales [6].
GEOBIA for image classification is primarily applied to very-high-resolution (VHR) images where image objects are composed of many pixels and can be visually identified [2]. Moreover, according to [1], the major steps of every image classification task may include selecting training samples, image preprocessing, feature extraction, selection of suitable classification approaches, post-classification and accuracy assessment. One of the first key steps is defined as the selection of training samples, which are patterns whose true class is known and are used for the design of a supervised classifier according to [7].
GEOBIA software, in general, is devoted to providing segmentation algorithms, feature analysis, classification and support for domain experts to add explicit knowledge to classify the segments. Such explicit knowledge is commonly represented by rules, which combine operation (e.g., segmentation or band ratio) with restriction on feature values (e.g., “select all objects with an average value greater than 100”).
Recently, more attention has been given to machine learning algorithms, such as decision trees or support vector machines. From the pattern recognition perspective, we know that supervised algorithms need training data (commonly known as samples); thus, the classifier exploits them as a priori information. In this paper we investigate the creation, by domain experts, of this a priori information, and we propose adaptations in graphic user interfaces (GUIs) to achieve this goal.
2. Motivation—Focus on the Segment
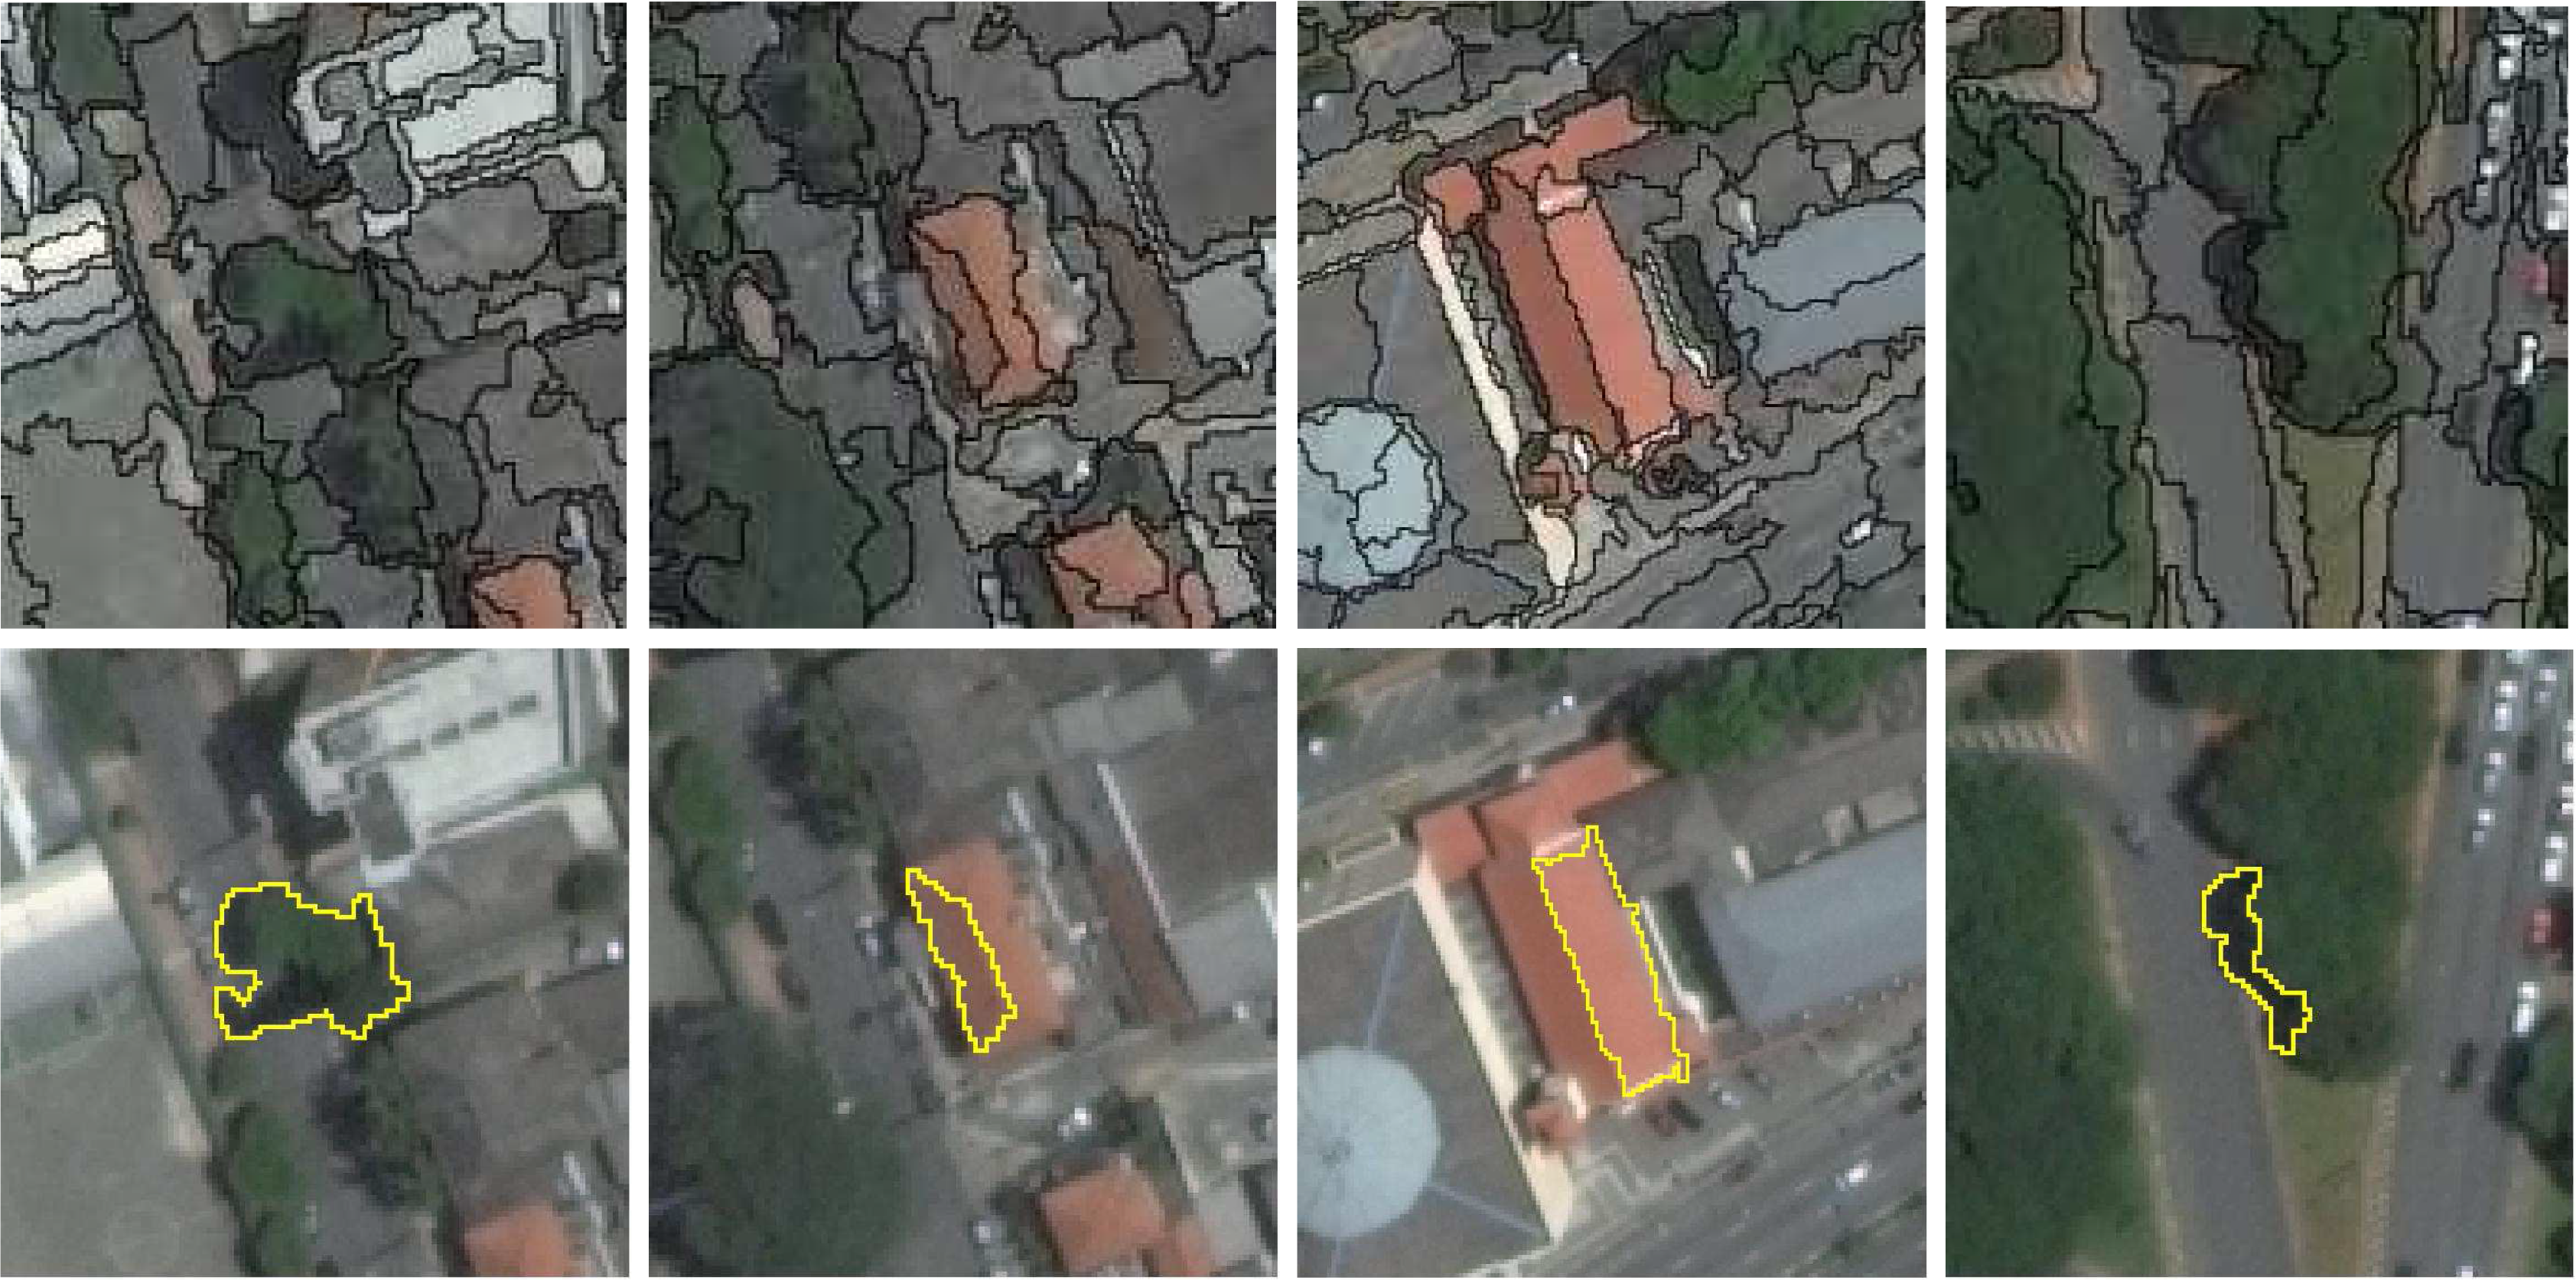
The basic workflow in image analysis using GEOBIA starts with segmenting the image, creating homogeneous regions that are defined as segments. Such segments are usually assigned to some class that is related to the expected patterns to be found in the image. Our proposal is based on the assumption that we must focus on these segments to provide a good sample selection GUI. We argue that if the domain expert can see each segment individually, it would be possible to better understand their properties and assign the correct training class. Current sample selection GUIs usually show the image with all segments superimposed and hinder the spectral properties of the individuals. In Figure 1, we compare the traditional method of showing segments with our proposal to focus on the individual segments. By focusing on each segment, the neighborhood is also highlighted, allowing the domain expert to understand better the relationships between the samples and neighborhood.
As the landscape of every study area is often complex and heterogeneous, selecting a sufficient number of training samples becomes difficult [1]. In general, in the beginning of the selection, the domain expert is usually not yet fully certain of the best segments to select as training samples; therefore, he or she intuitively defines segments in the image where the patterns are visually well defined. However, in certain cases this sample selection may lead to an ungeneralized sample set; then, the classification algorithms may create models with low accuracy.
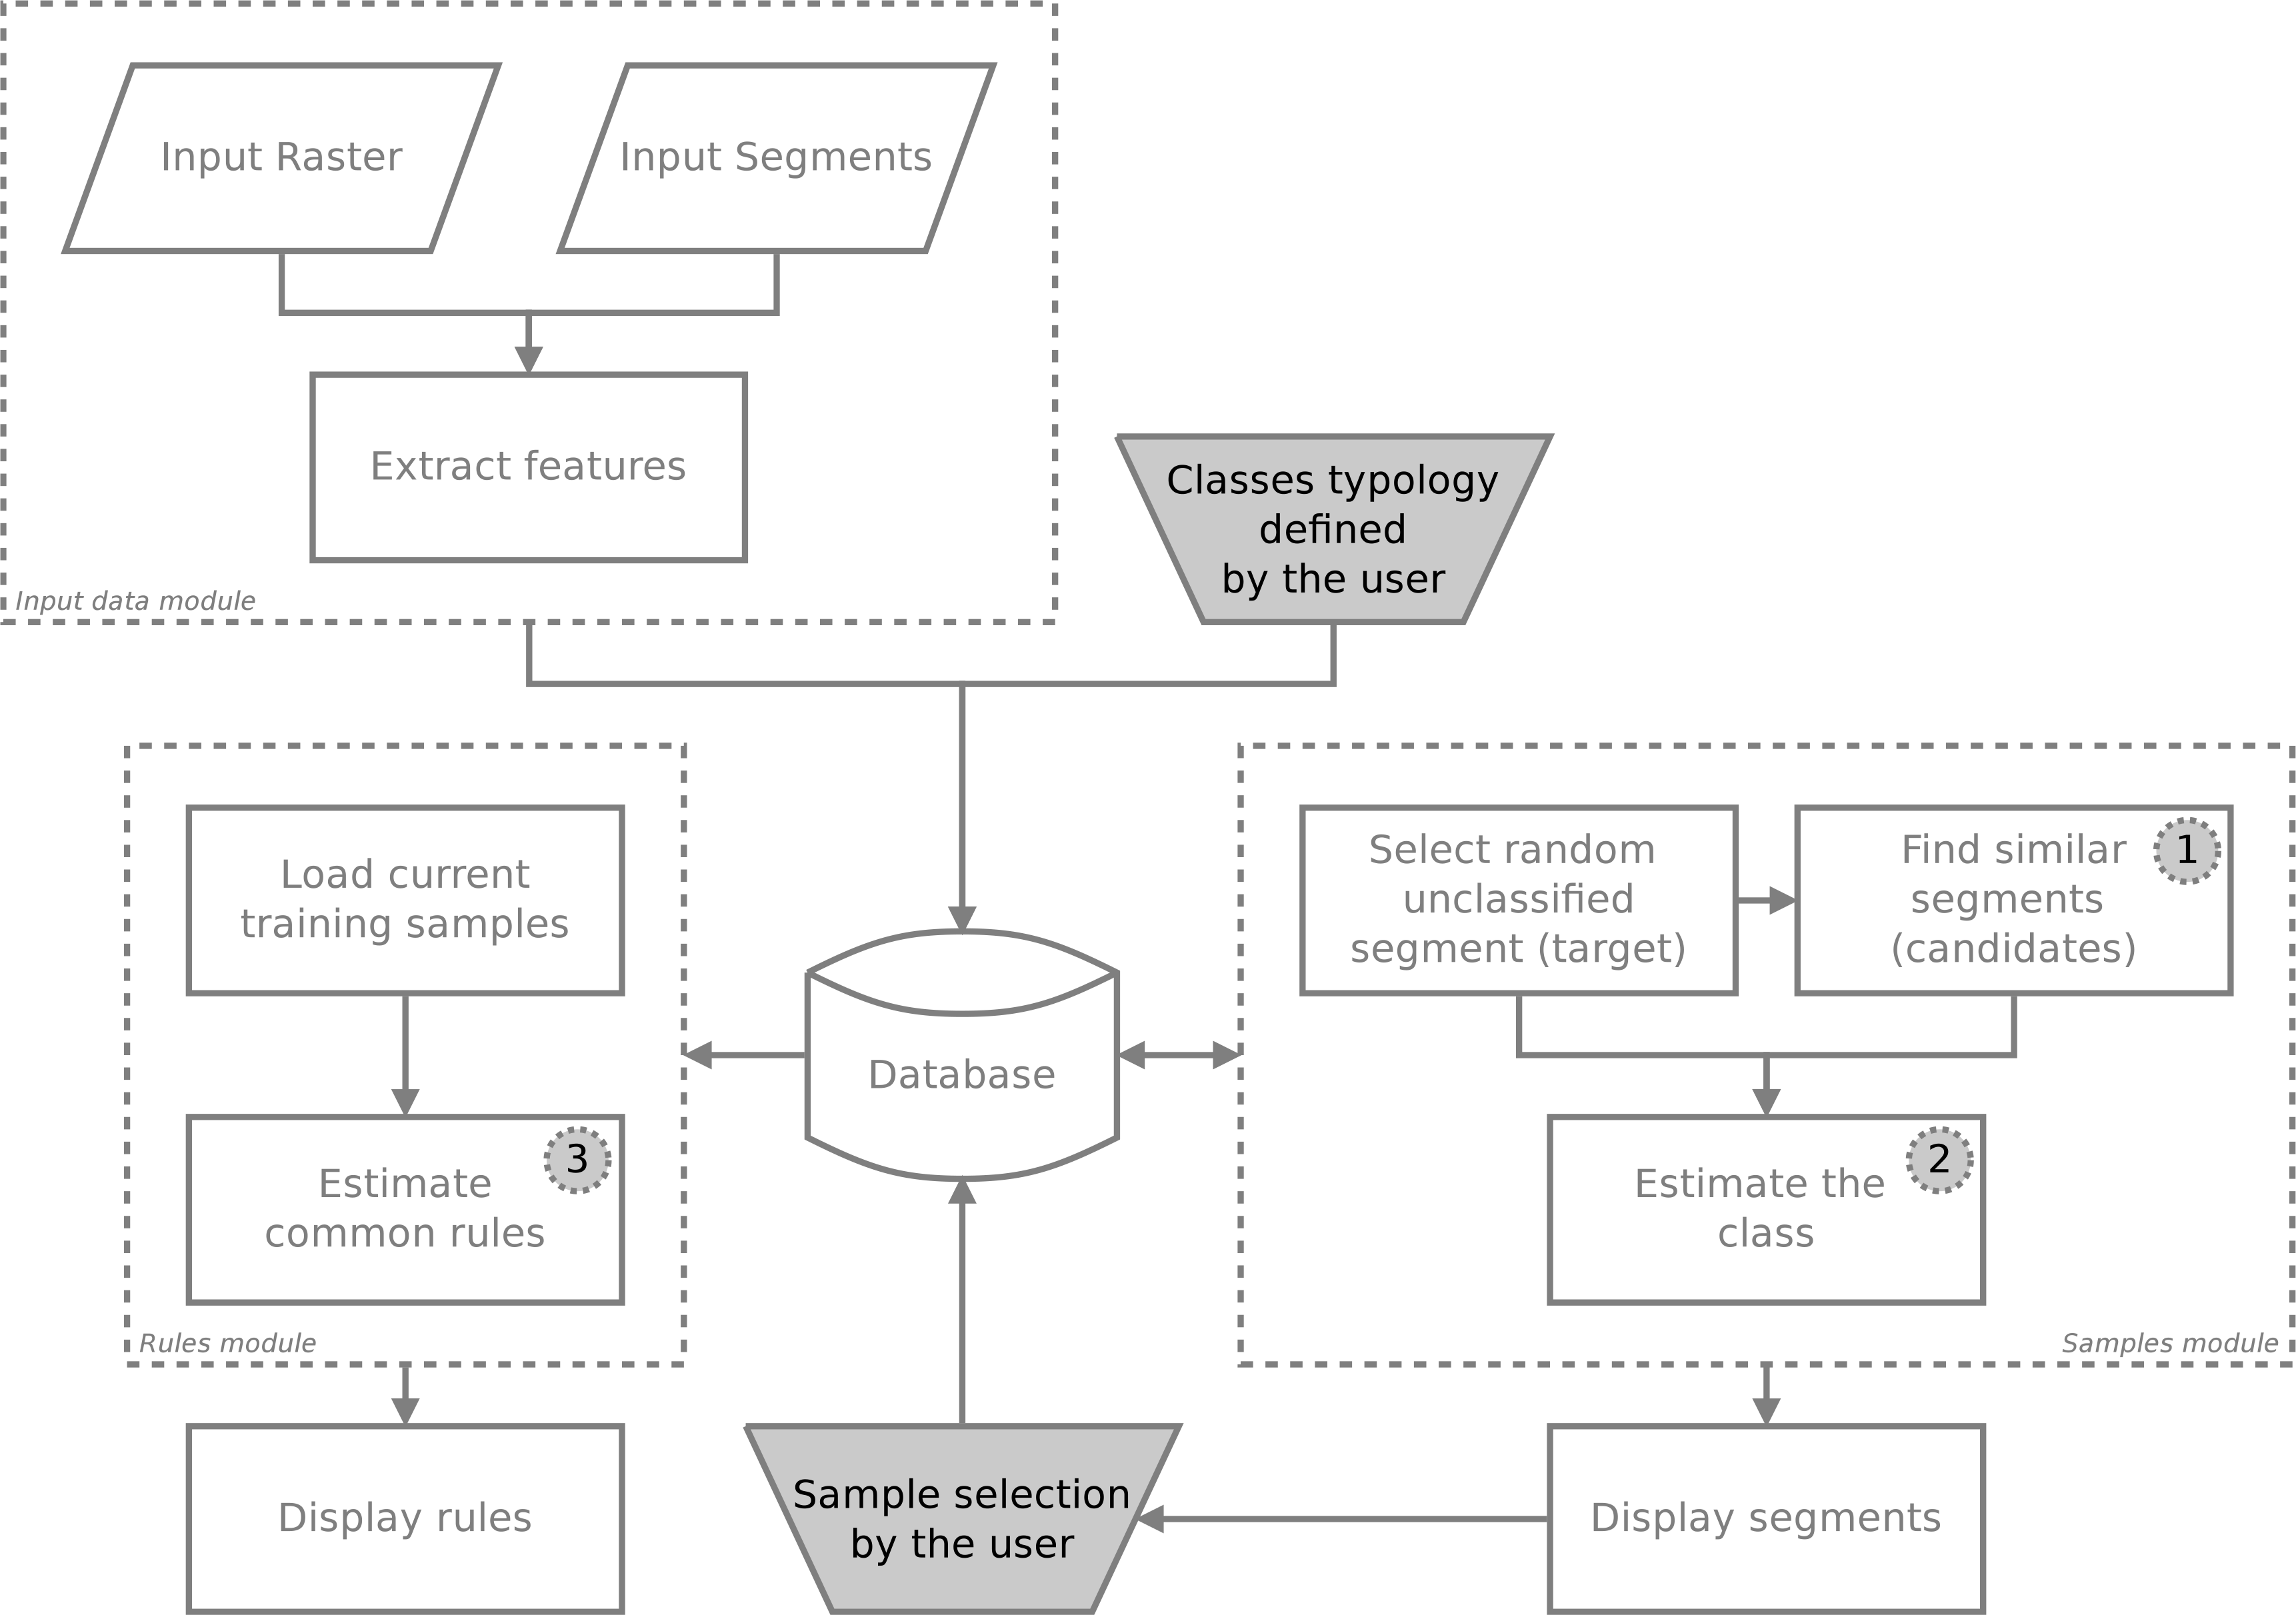
The focus of this work is to investigate three basic enhancements for the GUIs depicted in the diagram in Figure 2. Considering the domain expert is creating a sample set based on these previously selected samples, we suggest improvements, as summarized by the following questions:
- (1)
What if the GUI could suggest similar segments?
- (2)
What if instantaneous estimates of the class could be shown for a randomly selected segment?
- (3)
Is it possible to infer basic rules and translate them into explicit knowledge?
In the diagram of Figure 2, the initial state considers one input image and the input segments obtained by segmentation. All segments go through a feature extraction module, which stores their features in a database. Storage in the database accelerates further calculations because computing several distances between segments in the feature space is needed.
As follows, we discuss each aforementioned question, followed by an experiment demonstrating how to apply our prototypical GUI in high-resolution urban image sample selection.
2.1. Suggesting Similar Segments
The module for suggesting similar segments is an attempt to accelerate the selection of training samples. Let us call a random segment by target. The main idea is to find similar segments from this target (hereafter, candidates) based on their spectral features. If the domain expert selects a training class for the target, then all the other similar segments, if allowed, shall be considered training samples as well.
In this step, the candidates do not need to be geographically near the target because it is expected that samples are spread out in the image. Spectral features of the segments, such as their average pixel values, are used in this step. A similarity measure and limit must be set to determine the similarity of two segments.
In our experiments, we tested the well-known Euclidean distance between the target and the candidate segments. We empirically defined a threshold of 10% of the maximum distance between two segments (D), which will depend on the number of available spectral channels. Let us assume that all channels of the image are normalized in the interval [0, 1]; therefore, the maximum Euclidean distance between two feature vectors in an N-dimensional space is defined by
Each candidate segment will be considered similar if . In the examples shown in Section 3, we are providing the first six similar candidates to each target. The choice to display only six candidates is due to screen size limits, as we want to display the candidates with adequate resolutions for evaluation. If the domain expert has a larger screen, more candidates can be shown.
After this step, we estimate the class of the segments set, based on the current sample selection. Notably, at the start, the estimates will be inaccurate. However, as long as the domain expert selects new samples, the system will learn the characteristics of the samples and the estimates will improve.
2.2. Estimating the Classes Instantaneously
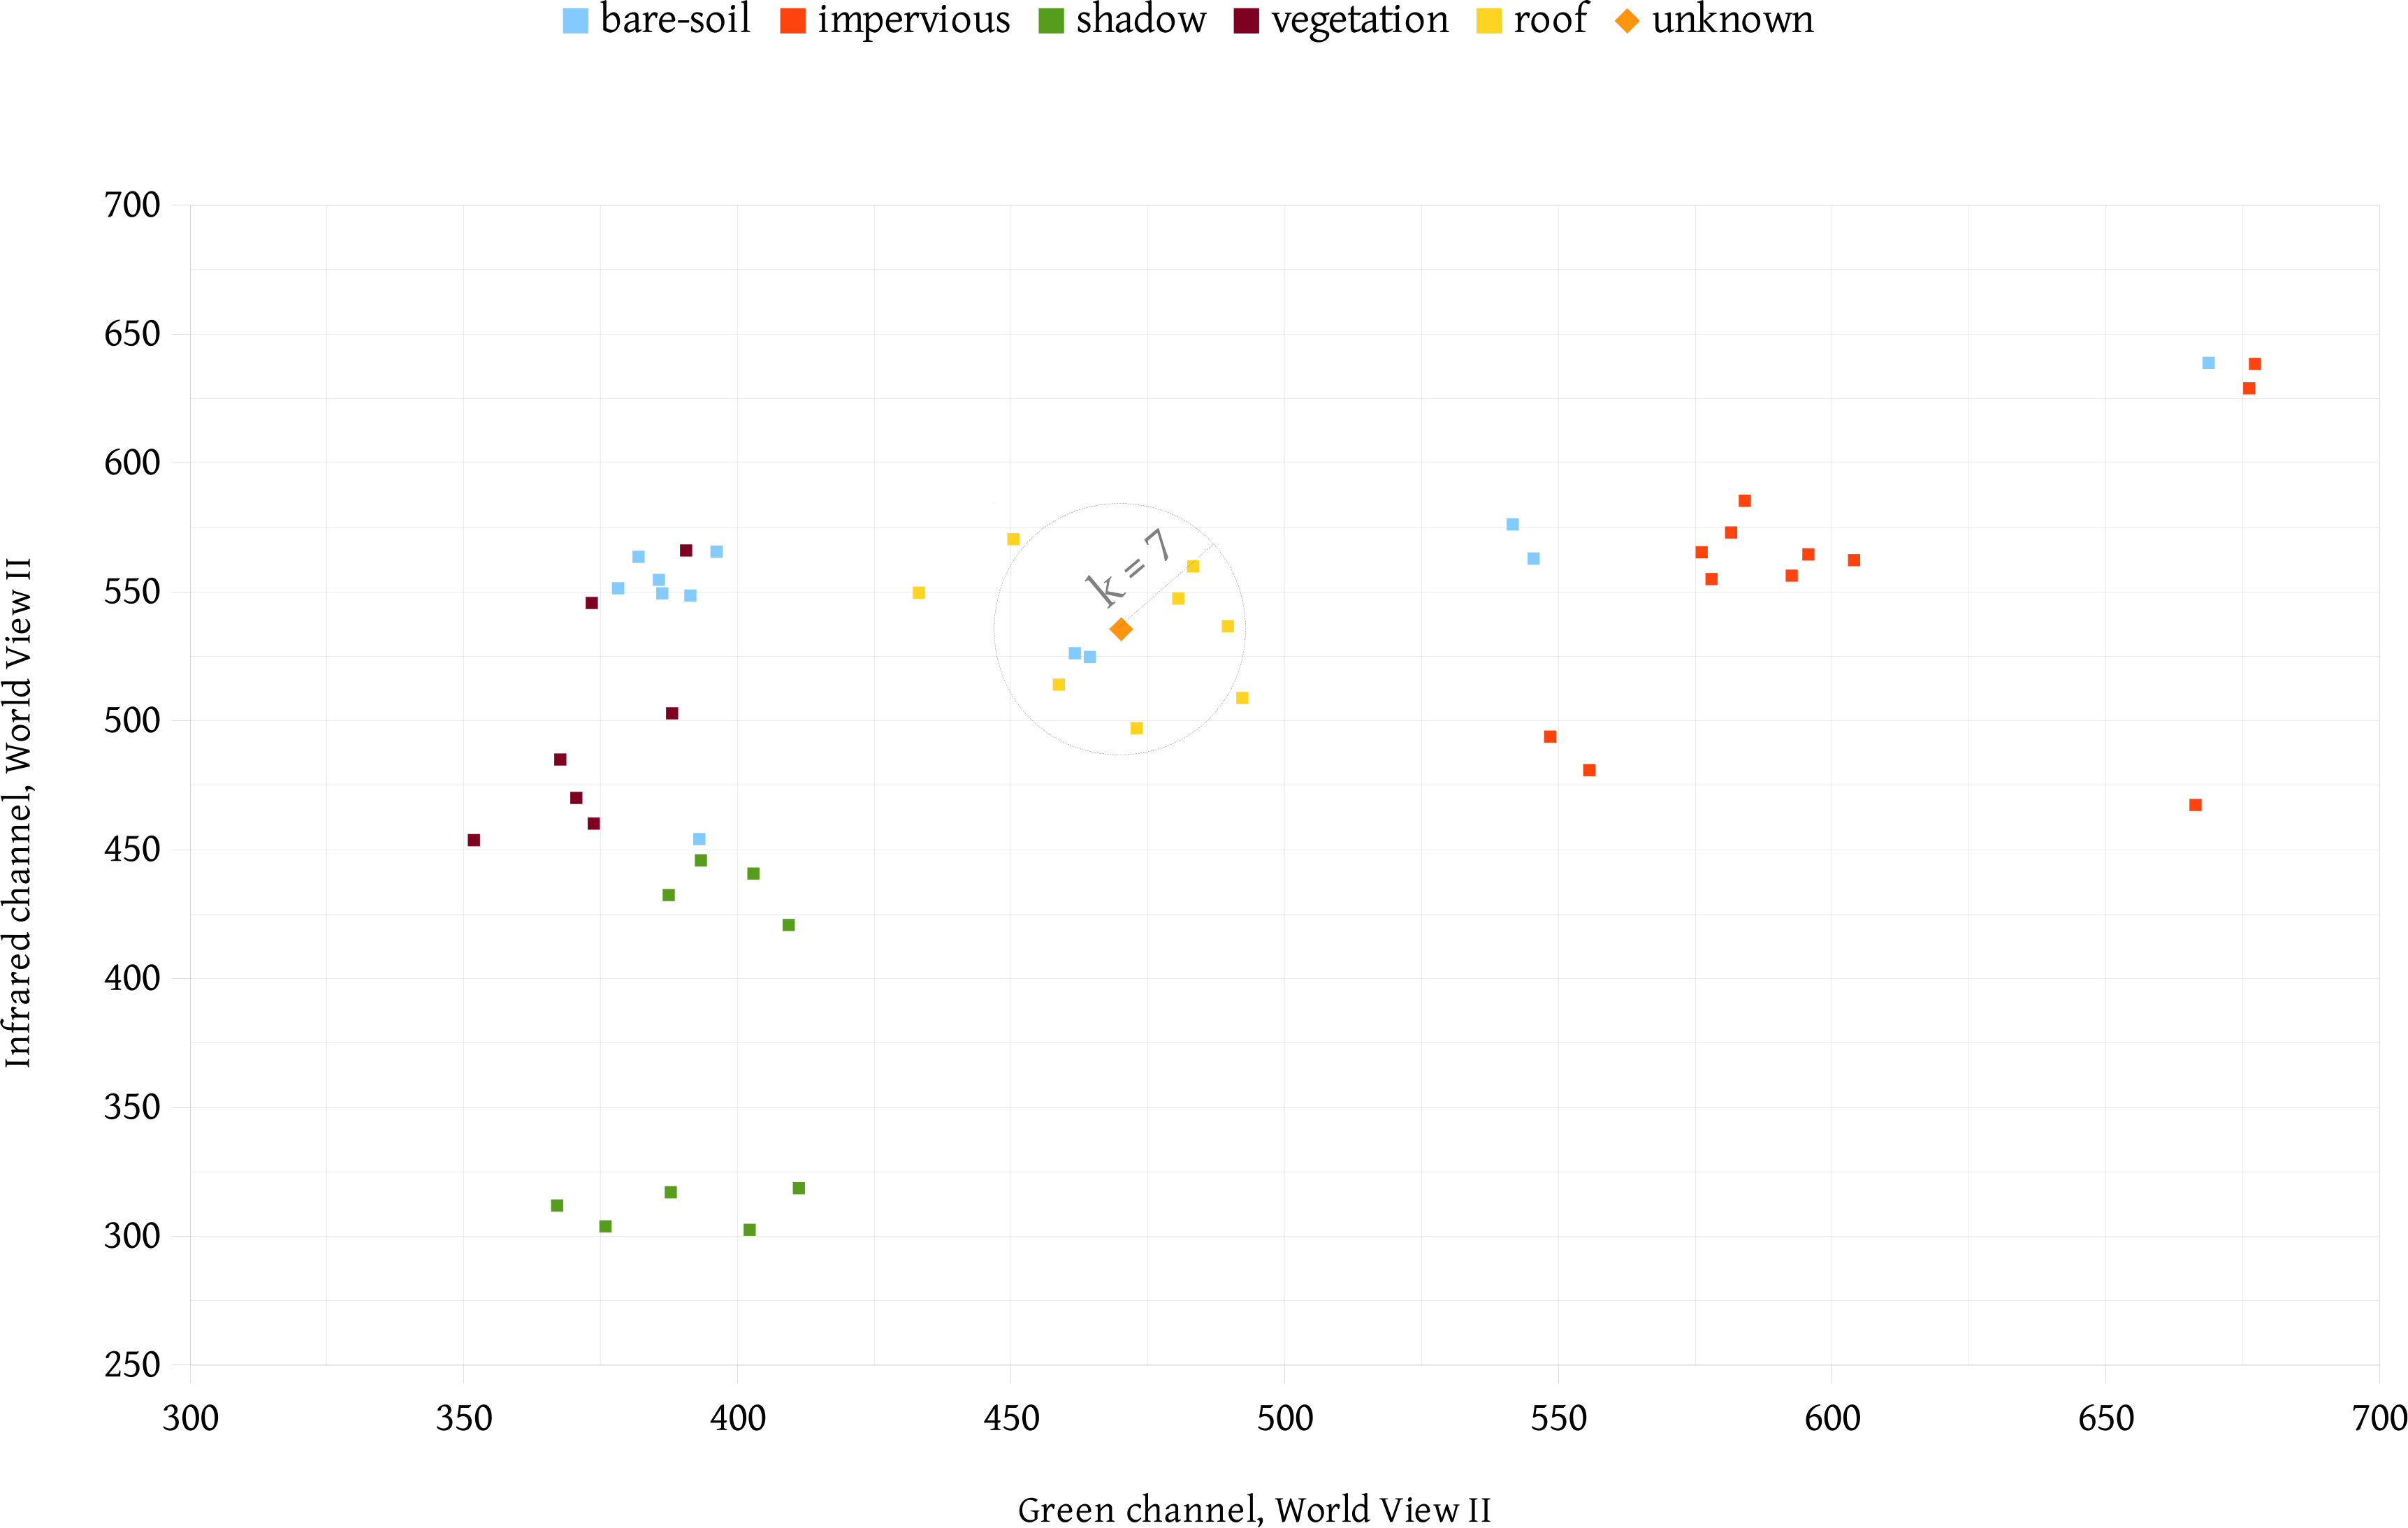
In our proposal, the number of training samples grows quickly because at each iteration, the system provides a set of similar segments that can be turned into samples. At this point, the samples are selected regardless of their location in the feature space, i.e., the main concern is what the domain expert determines by visual inspection as the class of the segment set. It is expected that such sample selection will fragment the feature space; thus, some classes may not be unimodal. Figure 3 presents one example of 50 samples for five different classes, and their distribution using two features. In this example, the average values for infrared and green channels were used.
Consider the samples of the class bare-soil. In this particular feature space, such a class appears in different locations. In this case, how do you define a proper model to classify new segments of the class bare-soil? We propose using the k nearest neighbors (kNN) algorithm to estimate the classes because it is a straightforward classification method for fragmented feature spaces.
According to [7], when the number of training samples is large enough, kNN performs well. This method finds the k nearest neighbors of a point in the feature space, and accounts for the most frequent class. With the number of the nearest neighbors per class, we obtain a similarity ranking and present it to the domain specialist as a glimpse of the similarity between the available samples and the target segment. Considering this ranking, the target with class unknown (Figure 3) and one example with k = 7 for the kNN algorithm would yield five votes for class roof and two votes for bare-soil.
2.3. Inferring Rules Based on Training Samples
According to [8], building a knowledge base for image interpretation is a difficult task because the knowledge often implicit and held by the domain experts; therefore, it is difficult to exactly define the correct range of feature values to classify each segment. In this work, we are not proposing an automatic method to define a knowledge base. Instead, we are exploring tools to help the user convert his/her knowledge into rules, which are commonly materialized as thresholds in the feature space.
To detect thresholds for classification, among all samples of the same class, the algorithms must identify one or more features whose values are similar for most of the samples. One simple strategy is to look inside the classes for features with a small standard deviation, by computing the intra-class homogeneity. For example, it is expected that all samples of the class vegetation have a small standard deviation for the feature average NDVI. If this assumption applies, the system can infer a rule such as “All elements of the class vegetation have the average NDVI around X”.
3. Results and Discussion
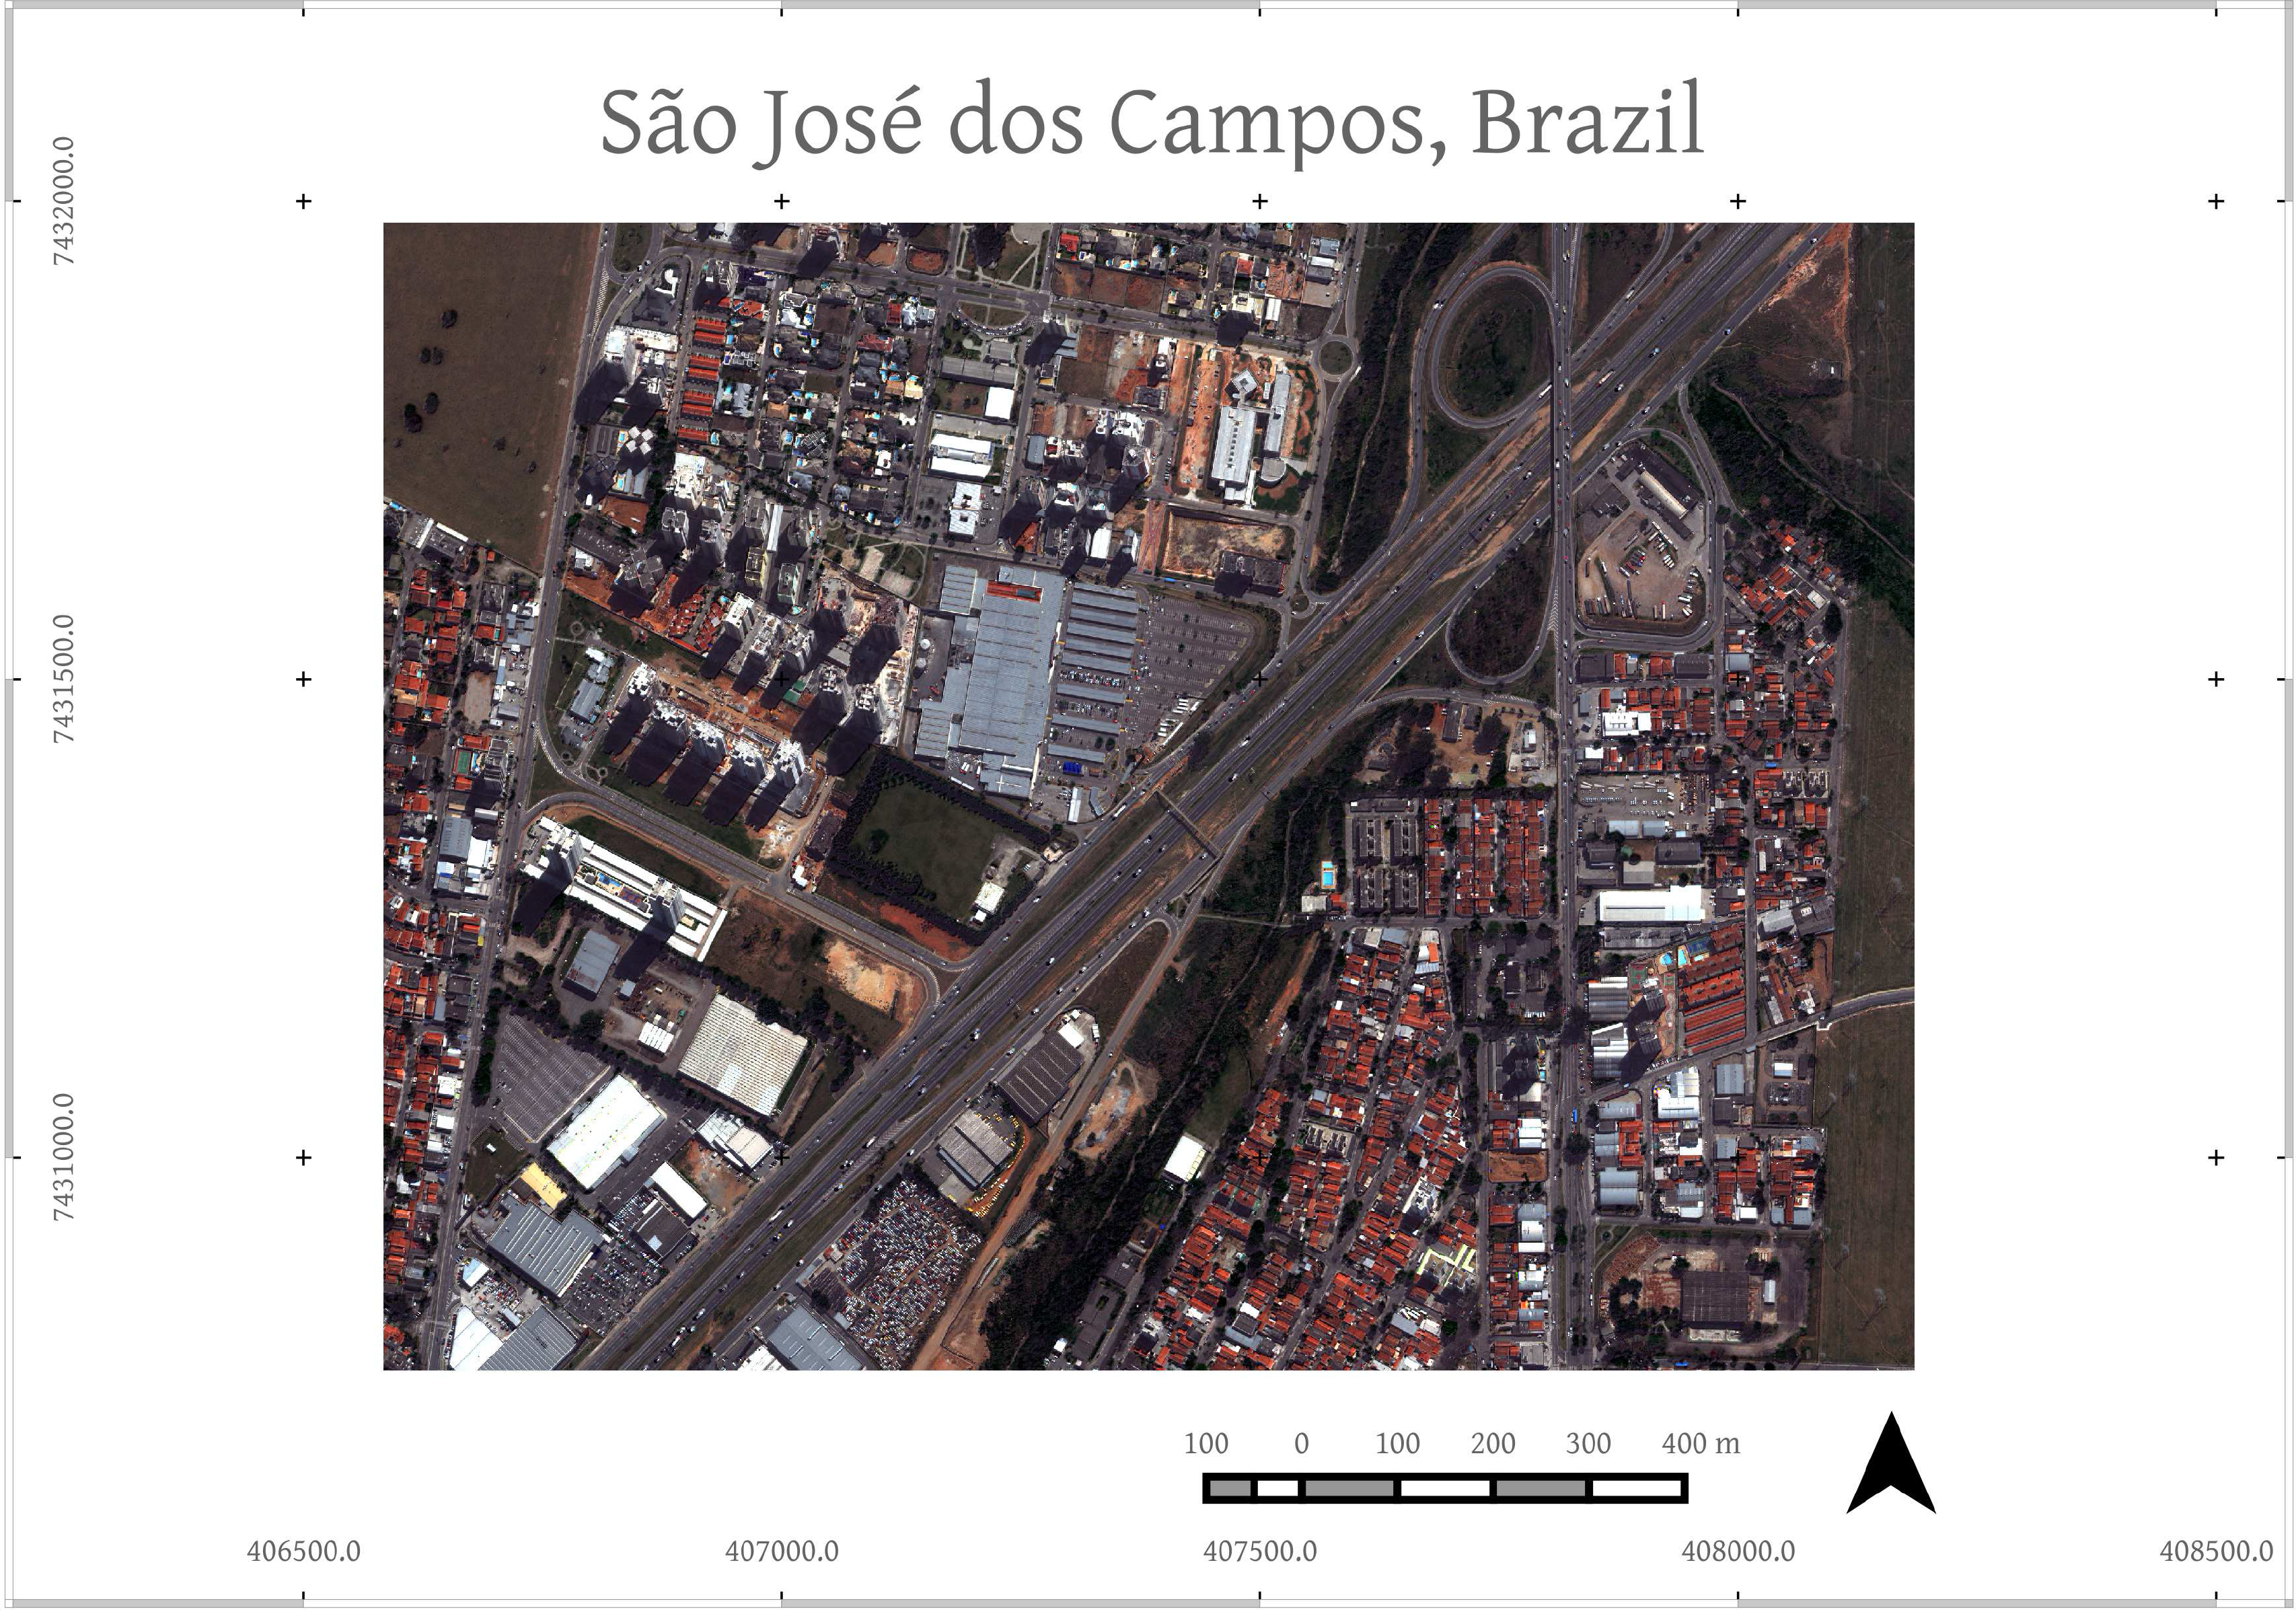
We created a test GUI to evaluate the suggestions proposed in this work. To perform the sample selection, we used an image of a World View 2 scene from São José dos Campos City, Brazil, with 3200 × 2400 pixels (Figure 4). The pixels of this image have a spatial resolution of 0.5 m, and the image was obtained in 2012. We applied the segmentation algorithm based on [9], resulting in 3198 segments. We then performed a feature extraction for the eight spectral bands of the image and stored them in a database. For this experiment, we defined a basic typology with seven classes: roof, impervious, shadow, vegetation, shining, bare-soil and pool.
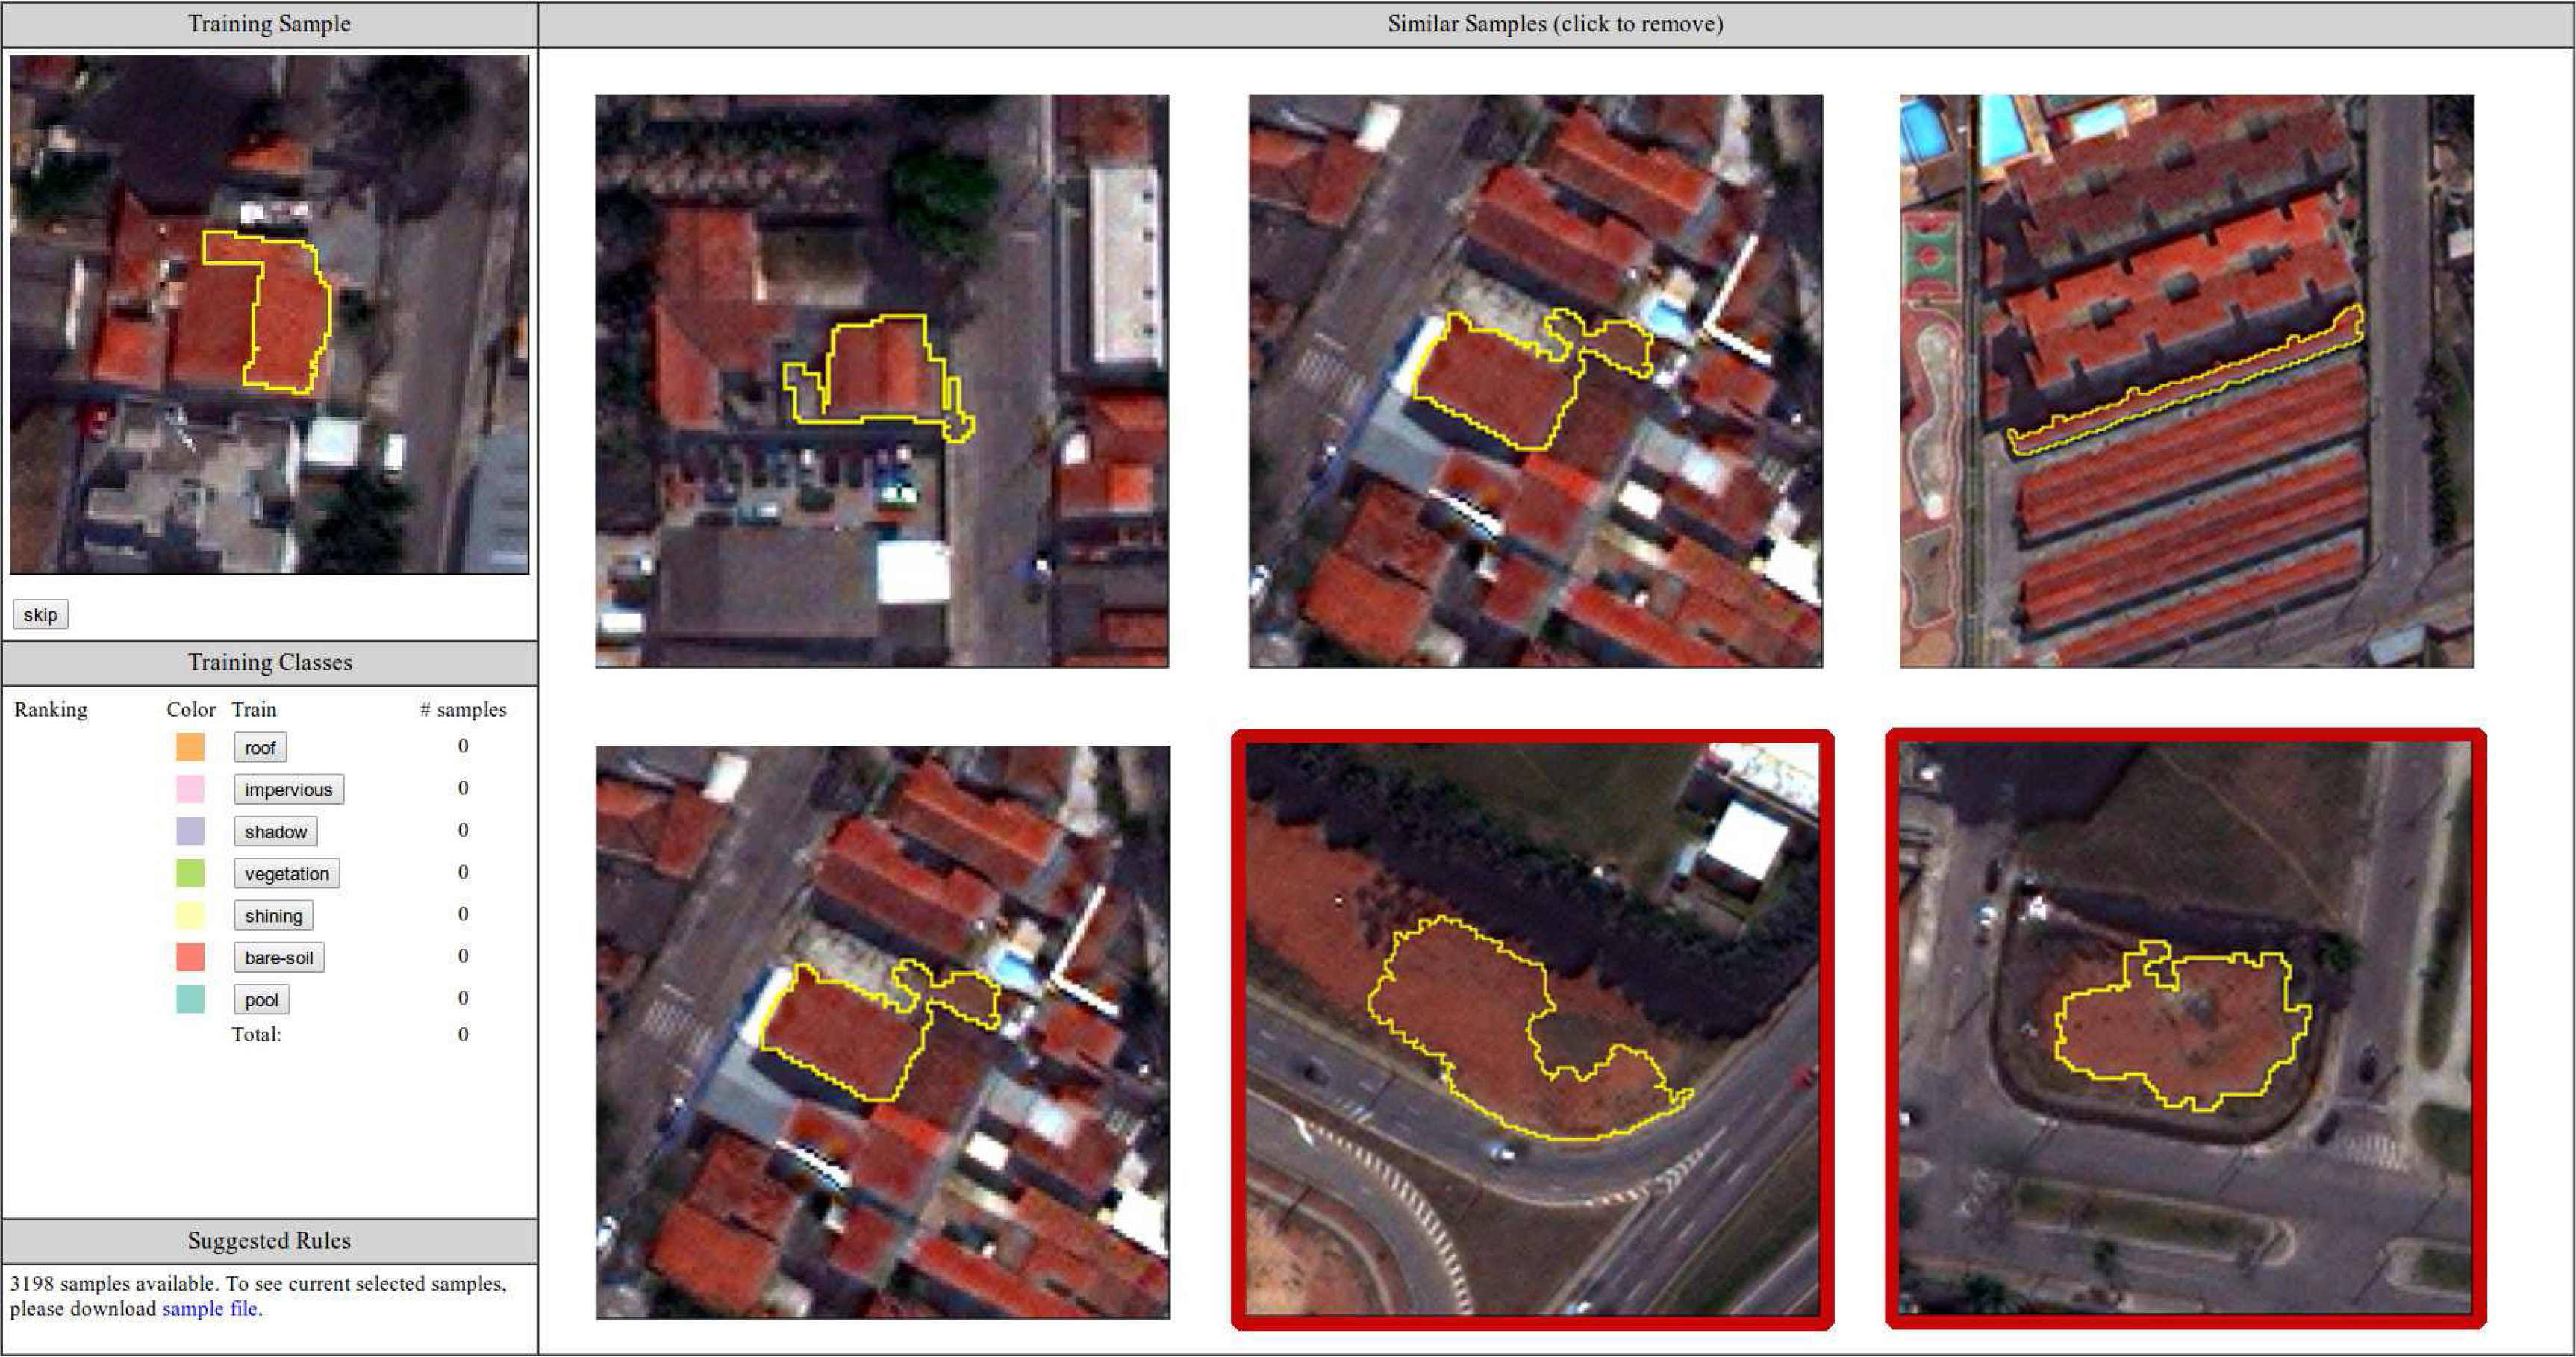
The first module of our GUI suggests similar segments based on a random target. In Figure 5, we show an example of a target of the class roof and the candidates selected by our similarity measure. All of the possible classes to be selected by the user are also shown; any candidate can be removed if the user believes that such a segment is not correct. A typical example of this case is presented by the two segments of class bare-soil (highlighted in red in the figure) that appear in the candidates. The user must mark such candidates as not similar to the target and then select the proper training sample.
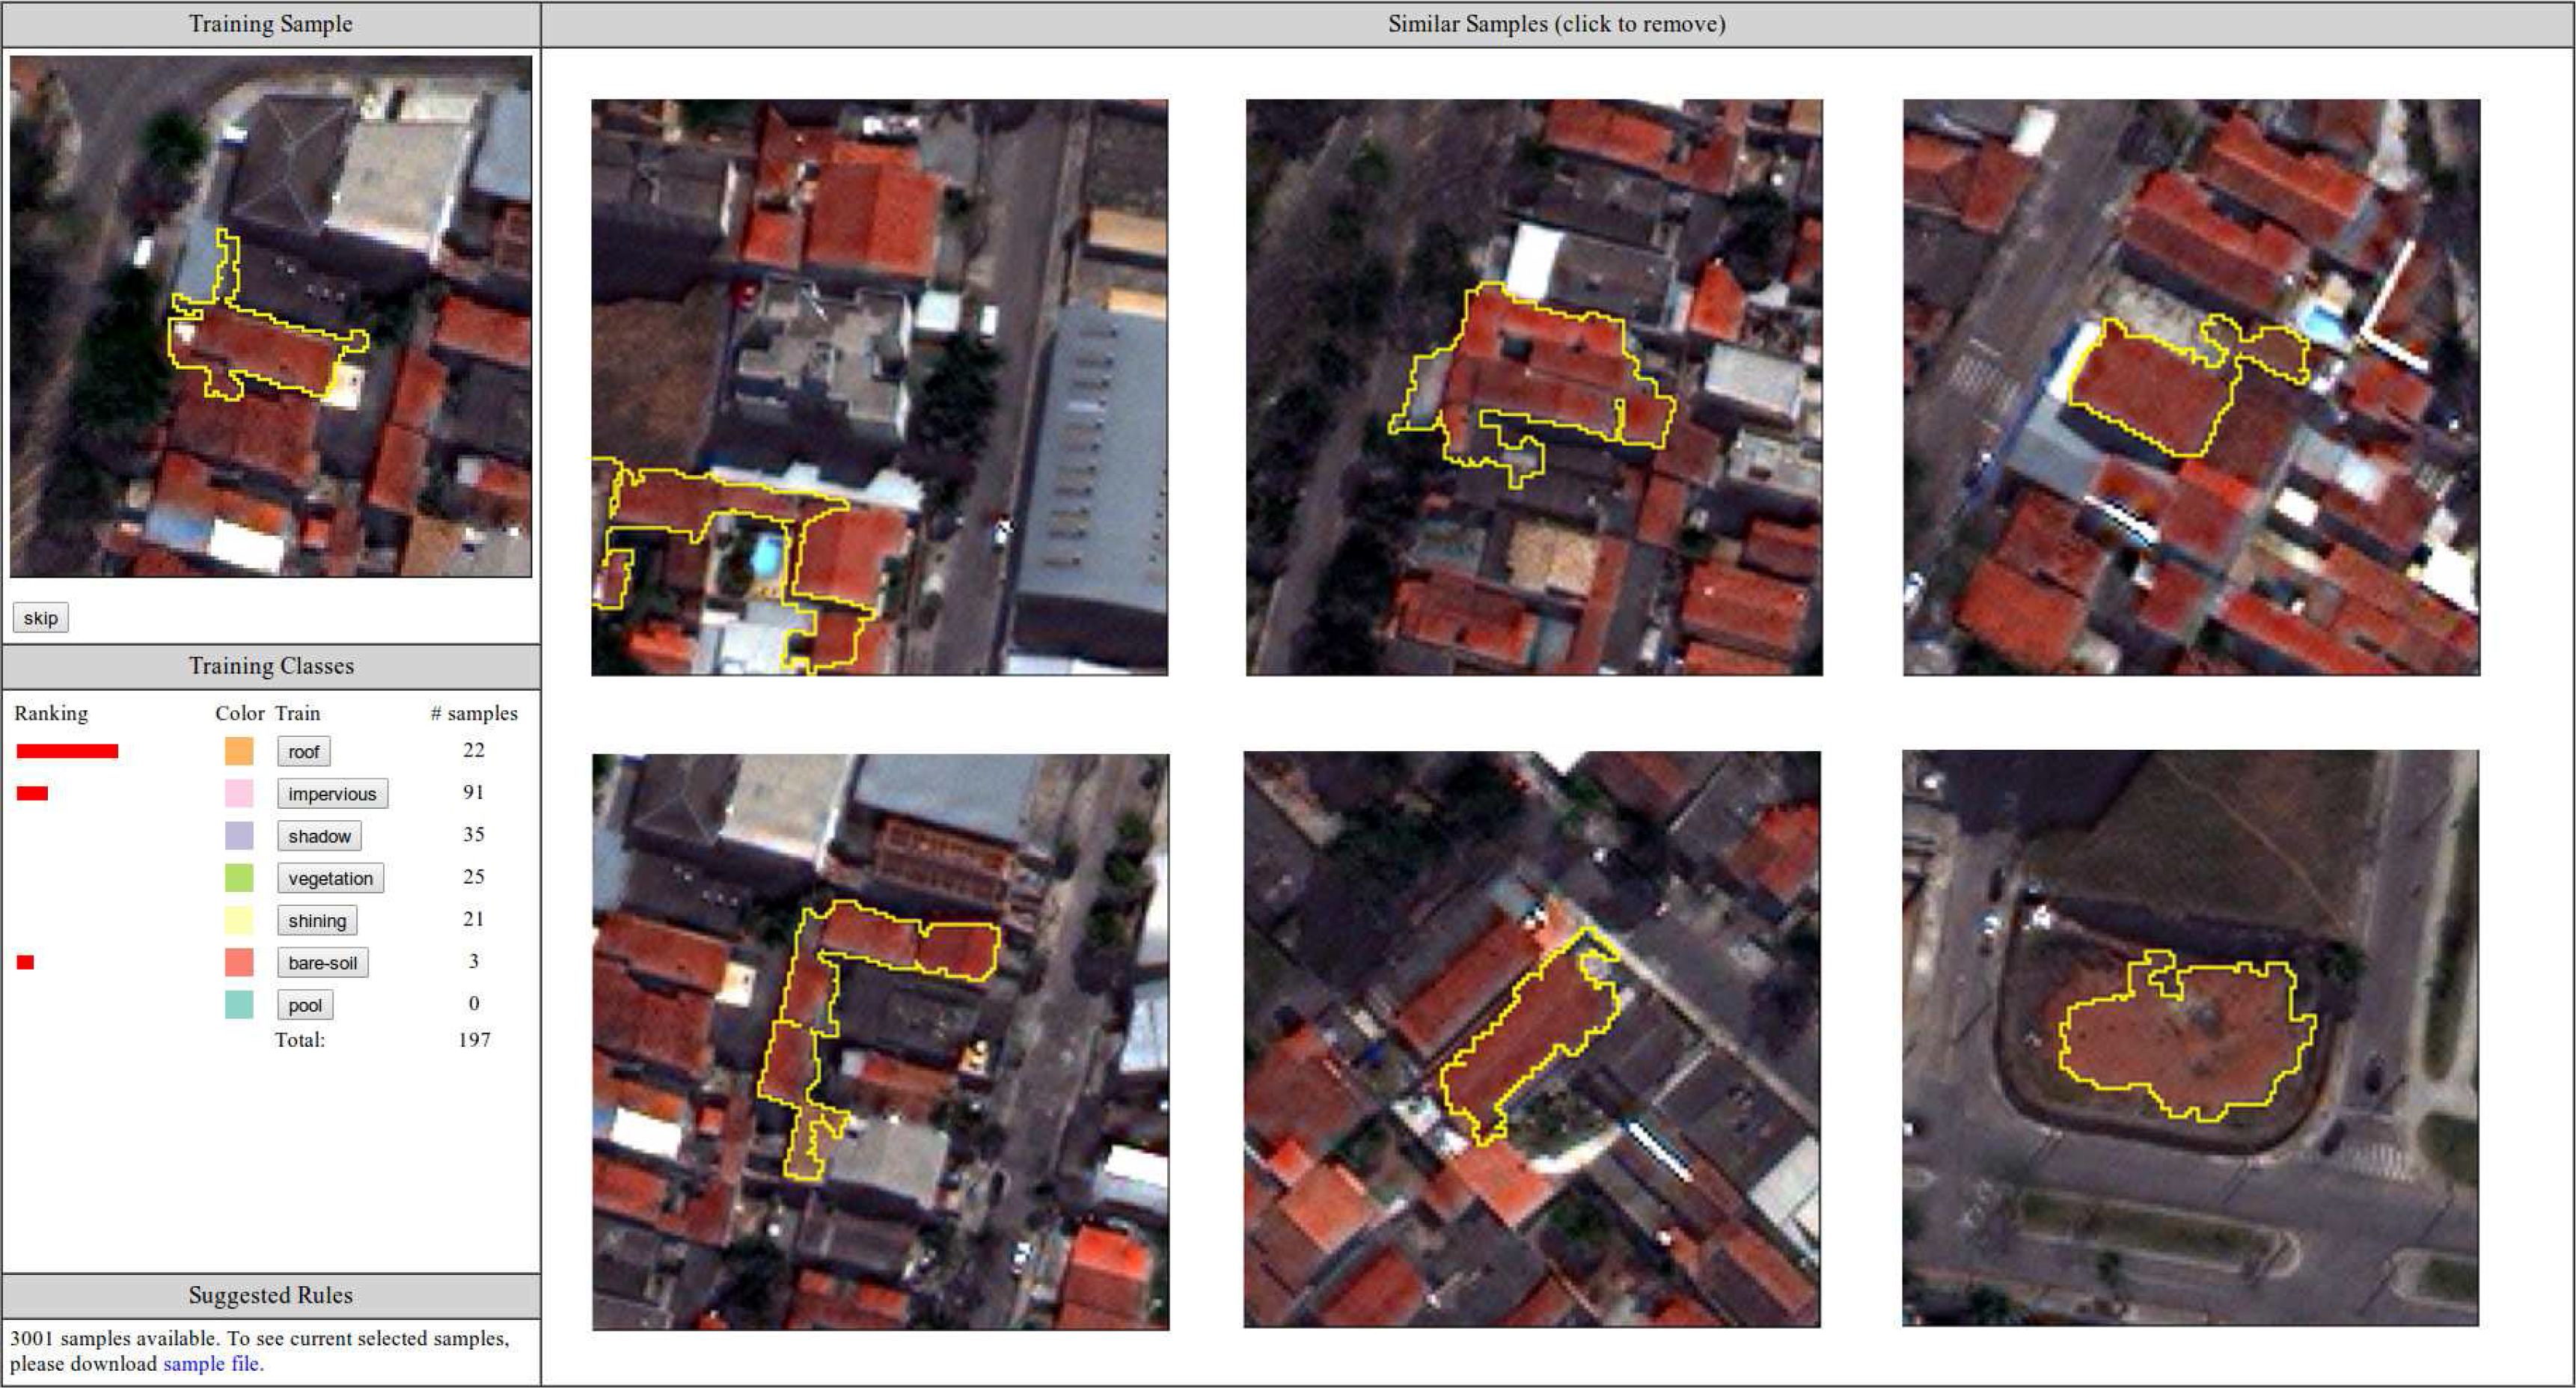
After selecting some training samples, the system can estimate the class for new targets. We provide a ranking of the similarity based on the number of votes counted by the kNN algorithm. This ranking is displayed in Figure 6. In this particular example, the domain expert already selected 197 samples, and the system computed a higher similarity with the class roof and slight similarities to classes impervious and bare-soil.
In the best case scenario, when a training class is assigned to all segments, one single mouse click will define seven samples for a specific training class (one target plus six candidates); thus, the sample selection is accelerated. For average cases (when some dissimilar candidates are found), the system stores this information to avoid further false positives.
The last feature of our GUI suggests rules based on the samples. When a reasonable number of samples is selected, the system starts to suggest rules. As already mentioned, this module only aims to help the domain experts better understand the distribution of samples in the feature space. In this example, after selecting 537 samples, the system suggested the following rules:
Elements of class impervious have an average Green channel of approximately 0.258.
Elements of class shadow have an average of Red channel of approximately 0.097.
Elements of class vegetation an have average NDVI of approximately 0.399.
Elements of class roof have an average Red Edge channel of approximately 0.307.
Elements of class bare-soil have an average Yellow channel of approximately 0.246.
Elements of class shining have an average Red Edge channel of approximately 0.473.
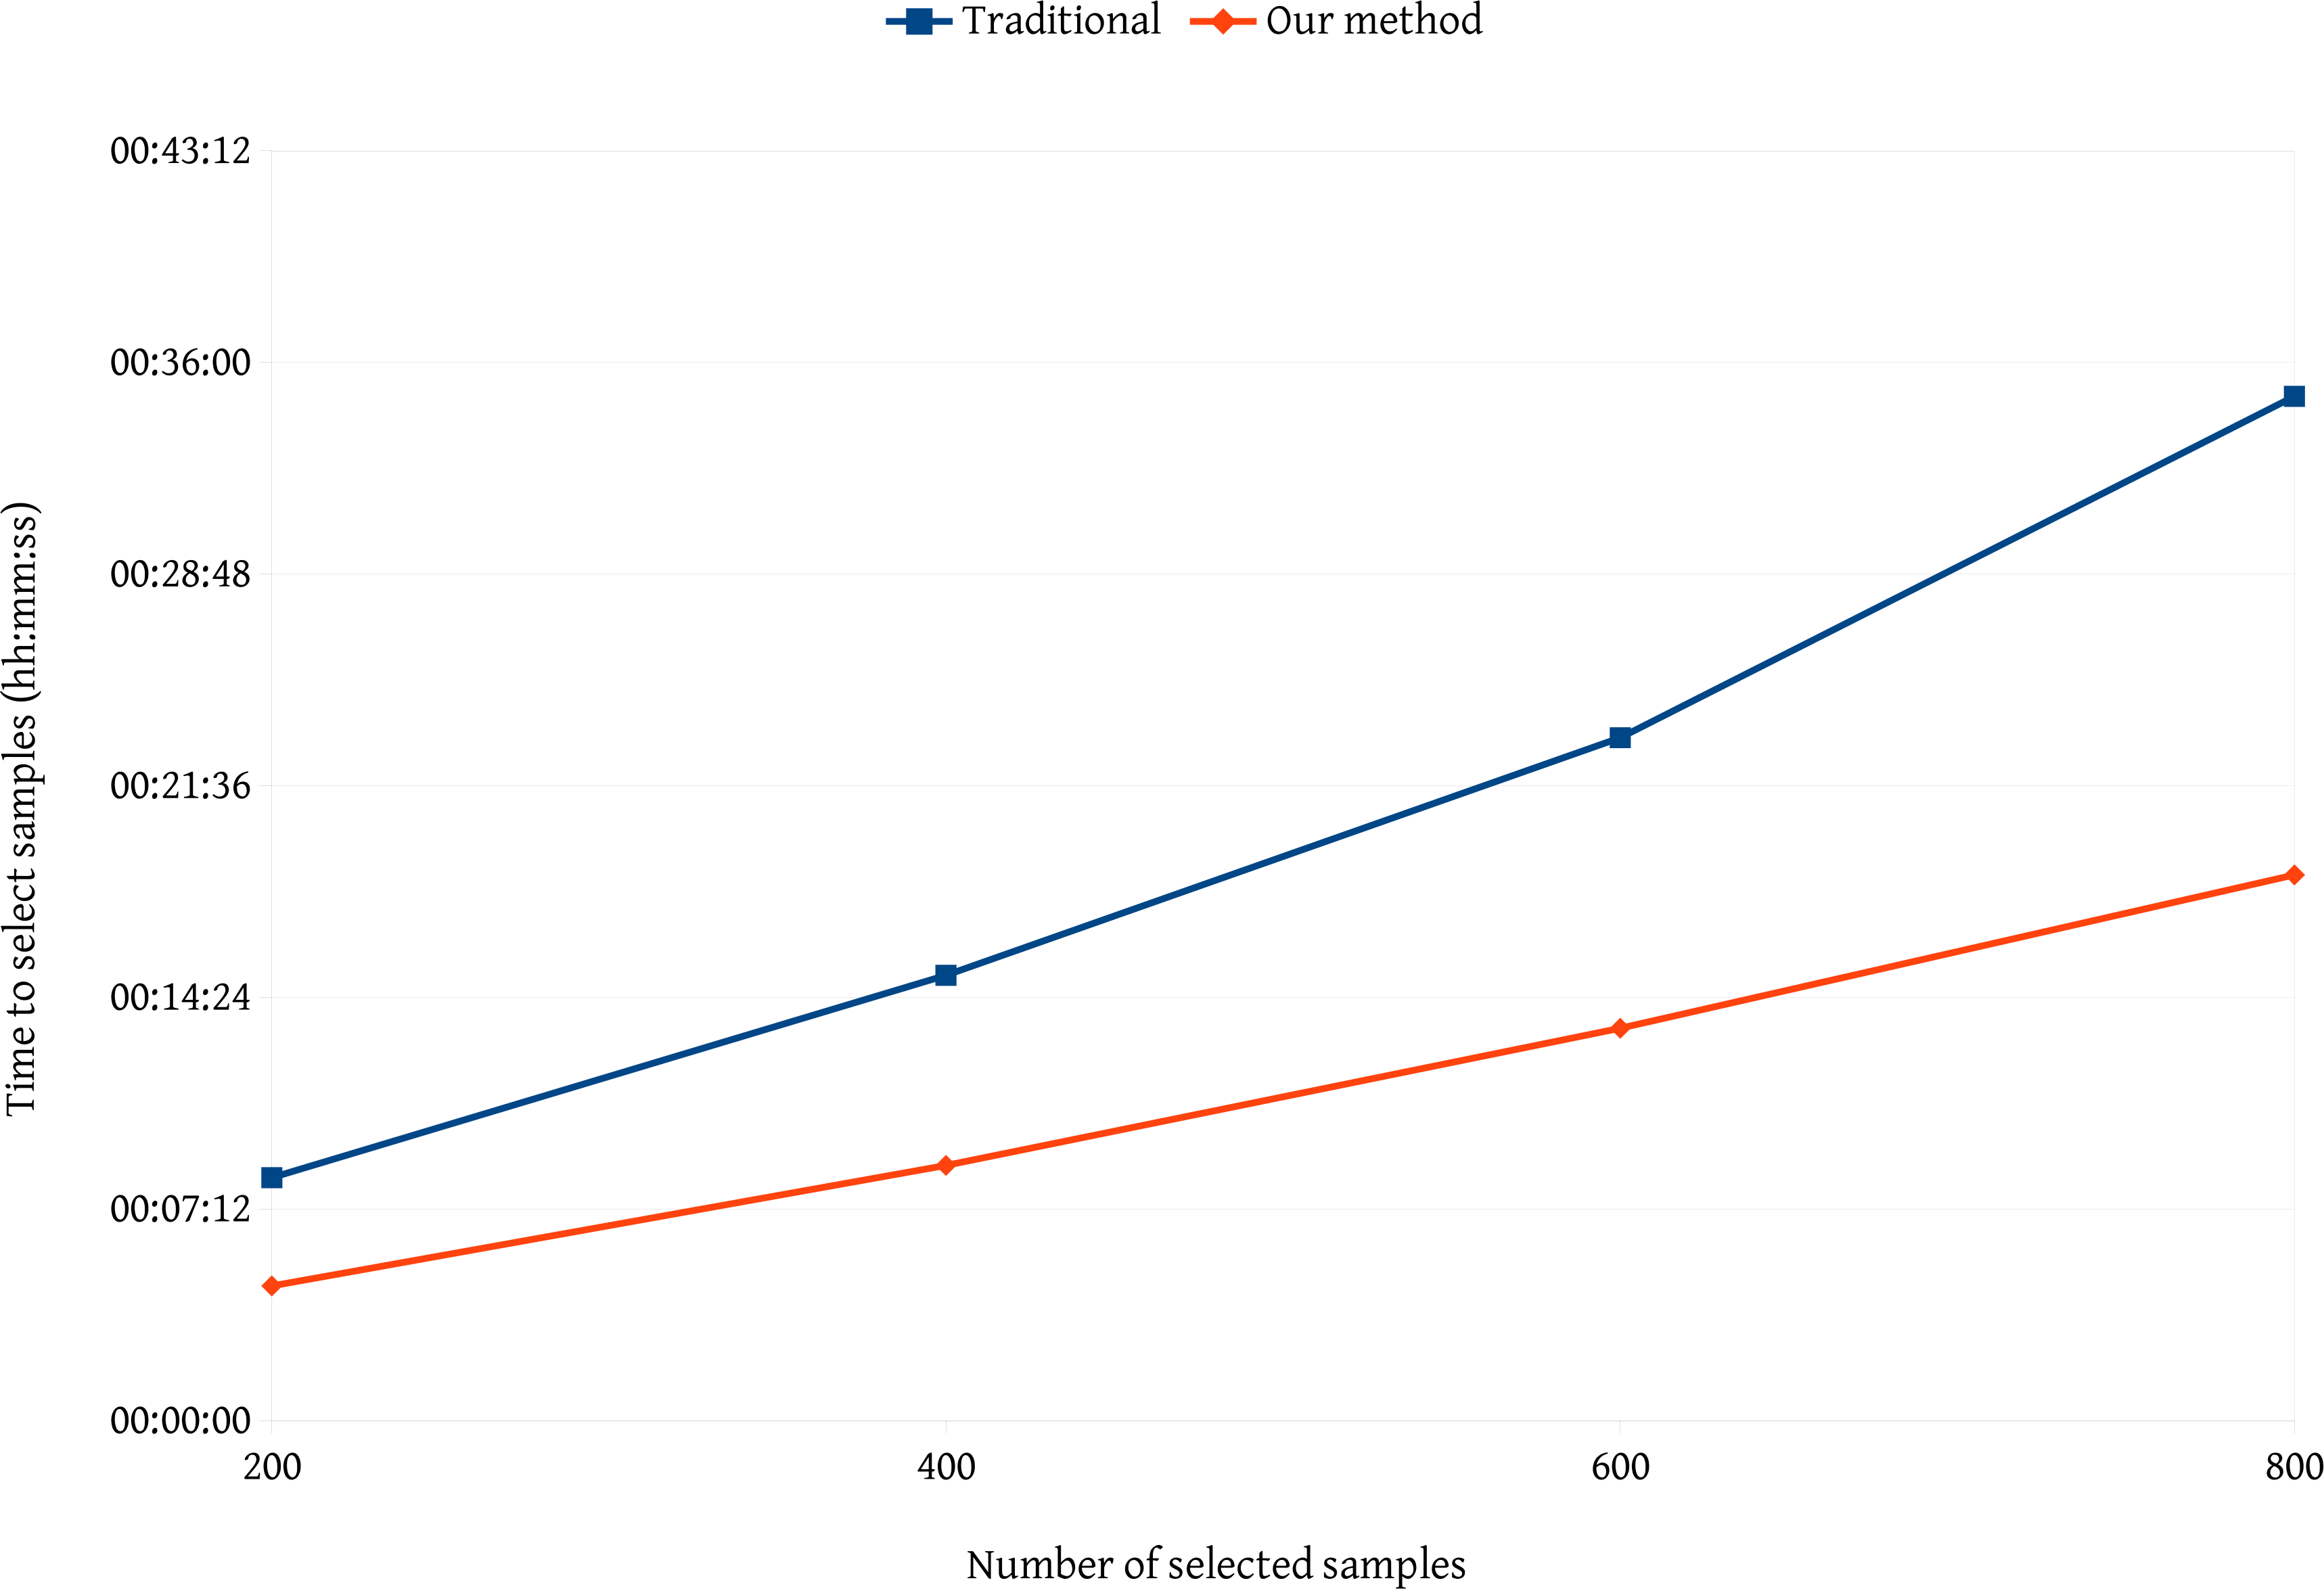
We performed two comparisons of our method against traditional methods. The first comparison considered the time needed to select samples. For this, we performed four tests with the same image by selecting 200, 400, 600 and 800 samples for each test. Figure 7 summarizes the comparison. Our method for sample selection is faster than traditional methods. By observing the curve of the traditional method, we perceive a nonlinear increase. As long as the user selects more samples, the traditional method of showing segments hides new samples and makes it difficult to select a large number of samples. Because our method focuses on the segments, it does not rely on the number of previously selected samples.
The second comparison considered the accuracy obtained by a classification algorithm using the samples selected from our method and from a traditional method. We used the same 800 samples per method that were selected in the previous comparison and the classification algorithm of support vector machines (SVM), which is available in the software WEKA [10]. We employed the SVM algorithm with a polynomial kernel and an exponent equal to 2.0 to both training samples.
The classification accuracy was analyzed using the cross-validation method, in which the samples are randomly divided into N = 10 folds of equal size. One fold is used for testing and the other N − 1 folds are used to train the model. The overall accuracy is obtained by averaging all of the folds. Our approach produced the best results with an accuracy of 82.48% and a Kappa equal to 0.75. Using the samples obtained by the traditional approach, the accuracy was 71.45% and the Kappa value was 0.65. A possible reason for these findings is that, in the manual sample selection, users often lean toward selecting samples in a specific region of the image. With our method, which is focused on the segments, the targets are randomly selected; this should contribute to a widespread sample selection and increase the accuracy.
4. Conclusions
Developing intuitive and straightforward graphic user interfaces (GUIs) is not an easy task, particularly changes are proposed to the standard methods of performing well-known tasks. Nevertheless, we proposed improvements to sample selection, which is an important task in pattern recognition. One of our main contributions is to change the way users see the segments, by focusing on each segment, i.e., highlighting its structure and neighborhood, to determine the best training class for a particular segment. In our proposal, the user may refine training samples and discover rules to be used in subsequent steps of the entire image analysis. The results presented in this article will be implemented in the GeoDMA system [11], and the current tests were performed using the TerraLib 5.0 library [12] for image processing.
A drawback of the proposed method is associated with the use of the k nearest neighbors (kNN) technique, which is the computational complexity in searching the nearest neighbors among the targets. This drawback becomes particularly severe in high-dimensional feature spaces [7]. To overcome this limit, it is possible to restrict the feature space for a subset of the features, for example using only visual spectral channels (i.e., red, green and blue).
Meanwhile, we are employing the strategy to infer classification rules. Other techniques, such as the well-known algorithm of decision trees based on entropy metrics [13] shall be investigated. Decision trees find thresholds in which the classes are distributed in the feature space. It is important to state that thresholds found by a decision tree algorithm may not be translated directly into rules of geographic object-based image analysis (GEOBIA); only the more general (top) nodes of the trees point to features that, with parsimony, can be translated into rules. We must also consider creating a region adjacency graph (RAG) to improve the analysis of the relationships between neighboring segments.
Other questions remain unanswered when dealing with GUI enhancements. The first concerns the minimum number of selected training samples that is adequate to estimate the classes of new targets. A second question concerns the user-defined parameters. From the human-computer interaction (HCI) perspective, the best alternative is to minimize the number of parameters that must be configured by the user; however, for different image characteristics, the similarity measures must be configured. Further research includes testing the interface with a group of domain experts for different applications.
Acknowledgments
The authors acknowledge Digital Globe for providing the WorldView 2 imagery used in this article.
Author Contributions
Thales Sehn Körting developed the methodology, and wrote the manuscript. Emiliano Ferreira Castejon, Laercio Massaru Namikawa, and Leila Maria Garcia Fonseca revised the methodology and the manuscript, providing several important suggestions.
Conflicts of Interest
The authors declare no conflicts of interest.
References
- Lu, D.; Weng, Q. A survey of image classification methods and techniques for improving classification performance. Int. J. Remote Sens 2007, 28, 823–870. [Google Scholar]
- Blaschke, T.; Hay, G.; Kelly, M.; Lang, S.; Hofmann, P.; Addink, E.; Feitosa, R.; Meer, F.; Werff, H.; Coillie, F.; et al. Geographic object-based image analysis—Towards a new paradigm. ISPRS J. Photogramm. Remote Sens 2014, 87, 180–191. [Google Scholar]
- Câmara, G.; Egenhofer, M.; Fonseca, F.; Monteiro, A. What’s in an image? Lect. Notes Comput. Sci 2001, 2205, 474–488. [Google Scholar]
- Landgrebe, D. Multispectral Data Analysis: A Signal Theory Perspective; Purdue University: West Lafayette, IN, USA, 1998. [Google Scholar]
- Blaschke, T.; Strobl, J. Whats wrong with pixels? Some recent developments interfacing remote sensing and GIS. GeoBIT/GIS 2001, 6, 12–17. [Google Scholar]
- Hay, G.; Castilla, G. Geographic object-based image analysis (GEOBIA): A new name for a new discipline. In Object-Based Image Analysis: Spatial Concepts for Knowledge-Driven Remote Sensing Applications; Blaschke, T., Lang, S., Hay, G., Eds.; Springer-Verlag: Berlin, Germany, 2008; pp. 75–89. [Google Scholar]
- Theodoridis, S.; Koutroumbas, K. Pattern Recognition, 4th ed.; Academic Press: London, UK, 2008. [Google Scholar]
- Forestier, G.; Puissant, A.; Wemmert, C.; Gançarski, P. Knowledge-based region labeling for remote sensing image interpretation. Comput. Environ. Urban Syst 2012, 36, 470–480. [Google Scholar]
- Baatz, M.; Schäpe, A. Multiresolution segmentation: An optimization approach for high quality multi-scale image segmentation. In Angewandte Geographische Informationsverarbeitung; Herbert Wichmann Verlag: Heidelberg, Germany, 2000; pp. 12–23. [Google Scholar]
- Witten, I.; Frank, E. Data Mining: Practical Machine Learning Tools and Techniques, 2nd ed.; Diane Cerra: San Francisco, CA, USA, 2005; p. 558. [Google Scholar]
- Körting, T.; Fonseca, L.; Câmara, G. GeoDMA—Geographic data mining analyst. Comput. Geosci 2013, 57, 133–145. [Google Scholar]
- Câmara, G.; Vinhas, L.; Ferreira, K.; Queiroz, G.; Souza, R.; Monteiro, A.; Carvalho, M.; Casanova, M.; Freitas, U. TerraLib: An open source GIS library for large-scale environmental and socio-economic applications. Open Source Approaches Spatial Data Handl 2008, 2, 247–270. [Google Scholar]
- Quinlan, J. C4.5: Programs for Machine Learning; Morgan Kaufmann: San Mateo, CA, USA, 1993; p. 302. [Google Scholar]

© 2014 by the authors; licensee MDPI, Basel, Switzerland This article is an open access article distributed under the terms and conditions of the Creative Commons Attribution license (http://creativecommons.org/licenses/by/3.0/).
Share and Cite
Körting, T.S.; Fonseca, L.M.G.; Castejon, E.F.; Namikawa, L.M. Improvements in Sample Selection Methods for Image Classification. Remote Sens. 2014, 6, 7580-7591. https://doi.org/10.3390/rs6087580
Körting TS, Fonseca LMG, Castejon EF, Namikawa LM. Improvements in Sample Selection Methods for Image Classification. Remote Sensing. 2014; 6(8):7580-7591. https://doi.org/10.3390/rs6087580
Chicago/Turabian StyleKörting, Thales Sehn, Leila Maria Garcia Fonseca, Emiliano Ferreira Castejon, and Laercio Massaru Namikawa. 2014. "Improvements in Sample Selection Methods for Image Classification" Remote Sensing 6, no. 8: 7580-7591. https://doi.org/10.3390/rs6087580