Assessing Long-Term Changes in the Beach Width of Reef Islands Based on Temporally Fragmented Remote Sensing Data

Abstract
: Atoll islands are subject to a variety of processes that influence their geomorphological development. Analysis of historical shoreline changes using remotely sensed images has become an efficient approach to both quantify past changes and estimate future island response. However, the detection of long-term changes in beach width is challenging mainly for two reasons: first, data availability is limited for many remote Pacific islands. Second, beach environments are highly dynamic and strongly influenced by seasonal or episodic shoreline oscillations. Consequently, remote-sensing studies on beach morphodynamics of atoll islands deal with dynamic features covered by a low sampling frequency. Here we present a study of beach dynamics for nine islands on Takú Atoll, Papua New Guinea, over a seven-decade period. A considerable chronological gap between aerial photographs and satellite images was addressed by applying a new method that reweighted positions of the beach limit by identifying “outlier” shoreline positions. On top of natural beach variability observed along the reweighted beach sections, we found that one third of the analyzed islands show a statistically significant decrease in reweighted beach width since 1943. The total loss of beach area for all islands corresponds to 44% of the initial beach area. Variable shoreline trajectories suggest that changes in beach width on Takú Atoll are dependent on local control (that is, human activity and longshore sediment transport). Our results show that remote imagery with a low sampling frequency may be sufficient to characterize prominent morphological changes in planform beach configuration of reef islands.1. Introduction
Trends of prevalent erosion along sandy shorelines have been recognized as a global phenomenon [1] and are commonly attributed to the interplay between natural and anthropogenic activities [2,3]. Specifically, shoreline behavior along linear siliciclastic coasts depends on fluvial sediment supply and longshore drift, which is greatly influenced by the construction of dams in the hinterland and groynes at the coast [1]. Environmental settings of tropical and sub-tropical atoll islands, however, differ from continental coastlines in that they are low-lying accumulations of carbonate sediments situated on mid-ocean reef rims throughout the tropical and sub-tropical realm [4]. Waves and currents transport biogenic calcareous sands and gravels from the reef crest and onto the reef flat where islands form [5]. The reef platform promotes refraction and diffraction of waves on the reef flat [6,7]. Resulting patterns of wave propagation control the entrainment and transport (supported by currents generated by winds, tides and wave pumping) of sediments to areas of least current velocity (i.e., nodal point) where the sediment load is deposited. A relative increase in water depth across the reef resulting from sea-level rise or a deterioration of the coral reef ecosystems (e.g., by seawater warming or ocean acidification) increases the wave energy on the reef flat [8–10]. Island morphodynamics are therefore closely linked to boundary conditions such as sea level and climate. A shift in these parameters will cause a change in position of the nodal point and ultimately induce a rearrangement of the sediments [11,12]. Atoll islands thus are inherently dynamic and shoreline movement is controlled by a number of additional natural and anthropogenic influences that can result in erosion and/or accretion over different temporal and spatial scales ([13–28], Table 1).
The detection of long-term changes in the shoreline position of sandy beaches based on the interpretation of remote sensing data is a common method for the study of continental coastlines and large islands [29–31]. However, there are few, if any, GIS-based studies on long-term changes in beach width for atoll islands. This is the surprising given that small islands have attracted a lot of attention in the discussion of losses related to climate change [32]. Important contributions to the understanding of historical shoreline changes on atoll islands are based on the interpretation of changes of the course of the edge of island vegetation as observed on remote sensing data [11,33,34]. These studies used the permanent vegetation line as shoreline proxy to filter out short-term shoreline dynamics resulting from seasonal or episodic fluctuations of the beach. While the edge of vegetation is an important marker for defining the delineations of an island, sandy beaches surrounding atoll and reef islands are of significant ecological and economical importance for atoll island nations. For example, beaches provide a natural defense against sea-level rise and storms [9]. Consequently, beach retreat may be an indicator for changing boundary conditions and permanent beach erosion can result in severe perturbations of atoll island systems including the inhabitants’ quality of life [35,36]. The objective of this study is to present a new approach for treating “outliers” in planimetric (i.e., with information about the outline of beach areas) shoreline position, and for dealing with statistical uncertainty with historical shoreline data. We test whether changes in relative beach width on atoll islands can be estimated via remotely sensed images despite irregular temporal spacing of the underlying data and the absence of in situ hydrodynamic data. We combine the information from the remote imagery with oceanographic (hydrodynamic) and meteorological data that are readily available and relate our observations to known influences on shoreline dynamics from the literature and anecdotal evidence.
Study Site
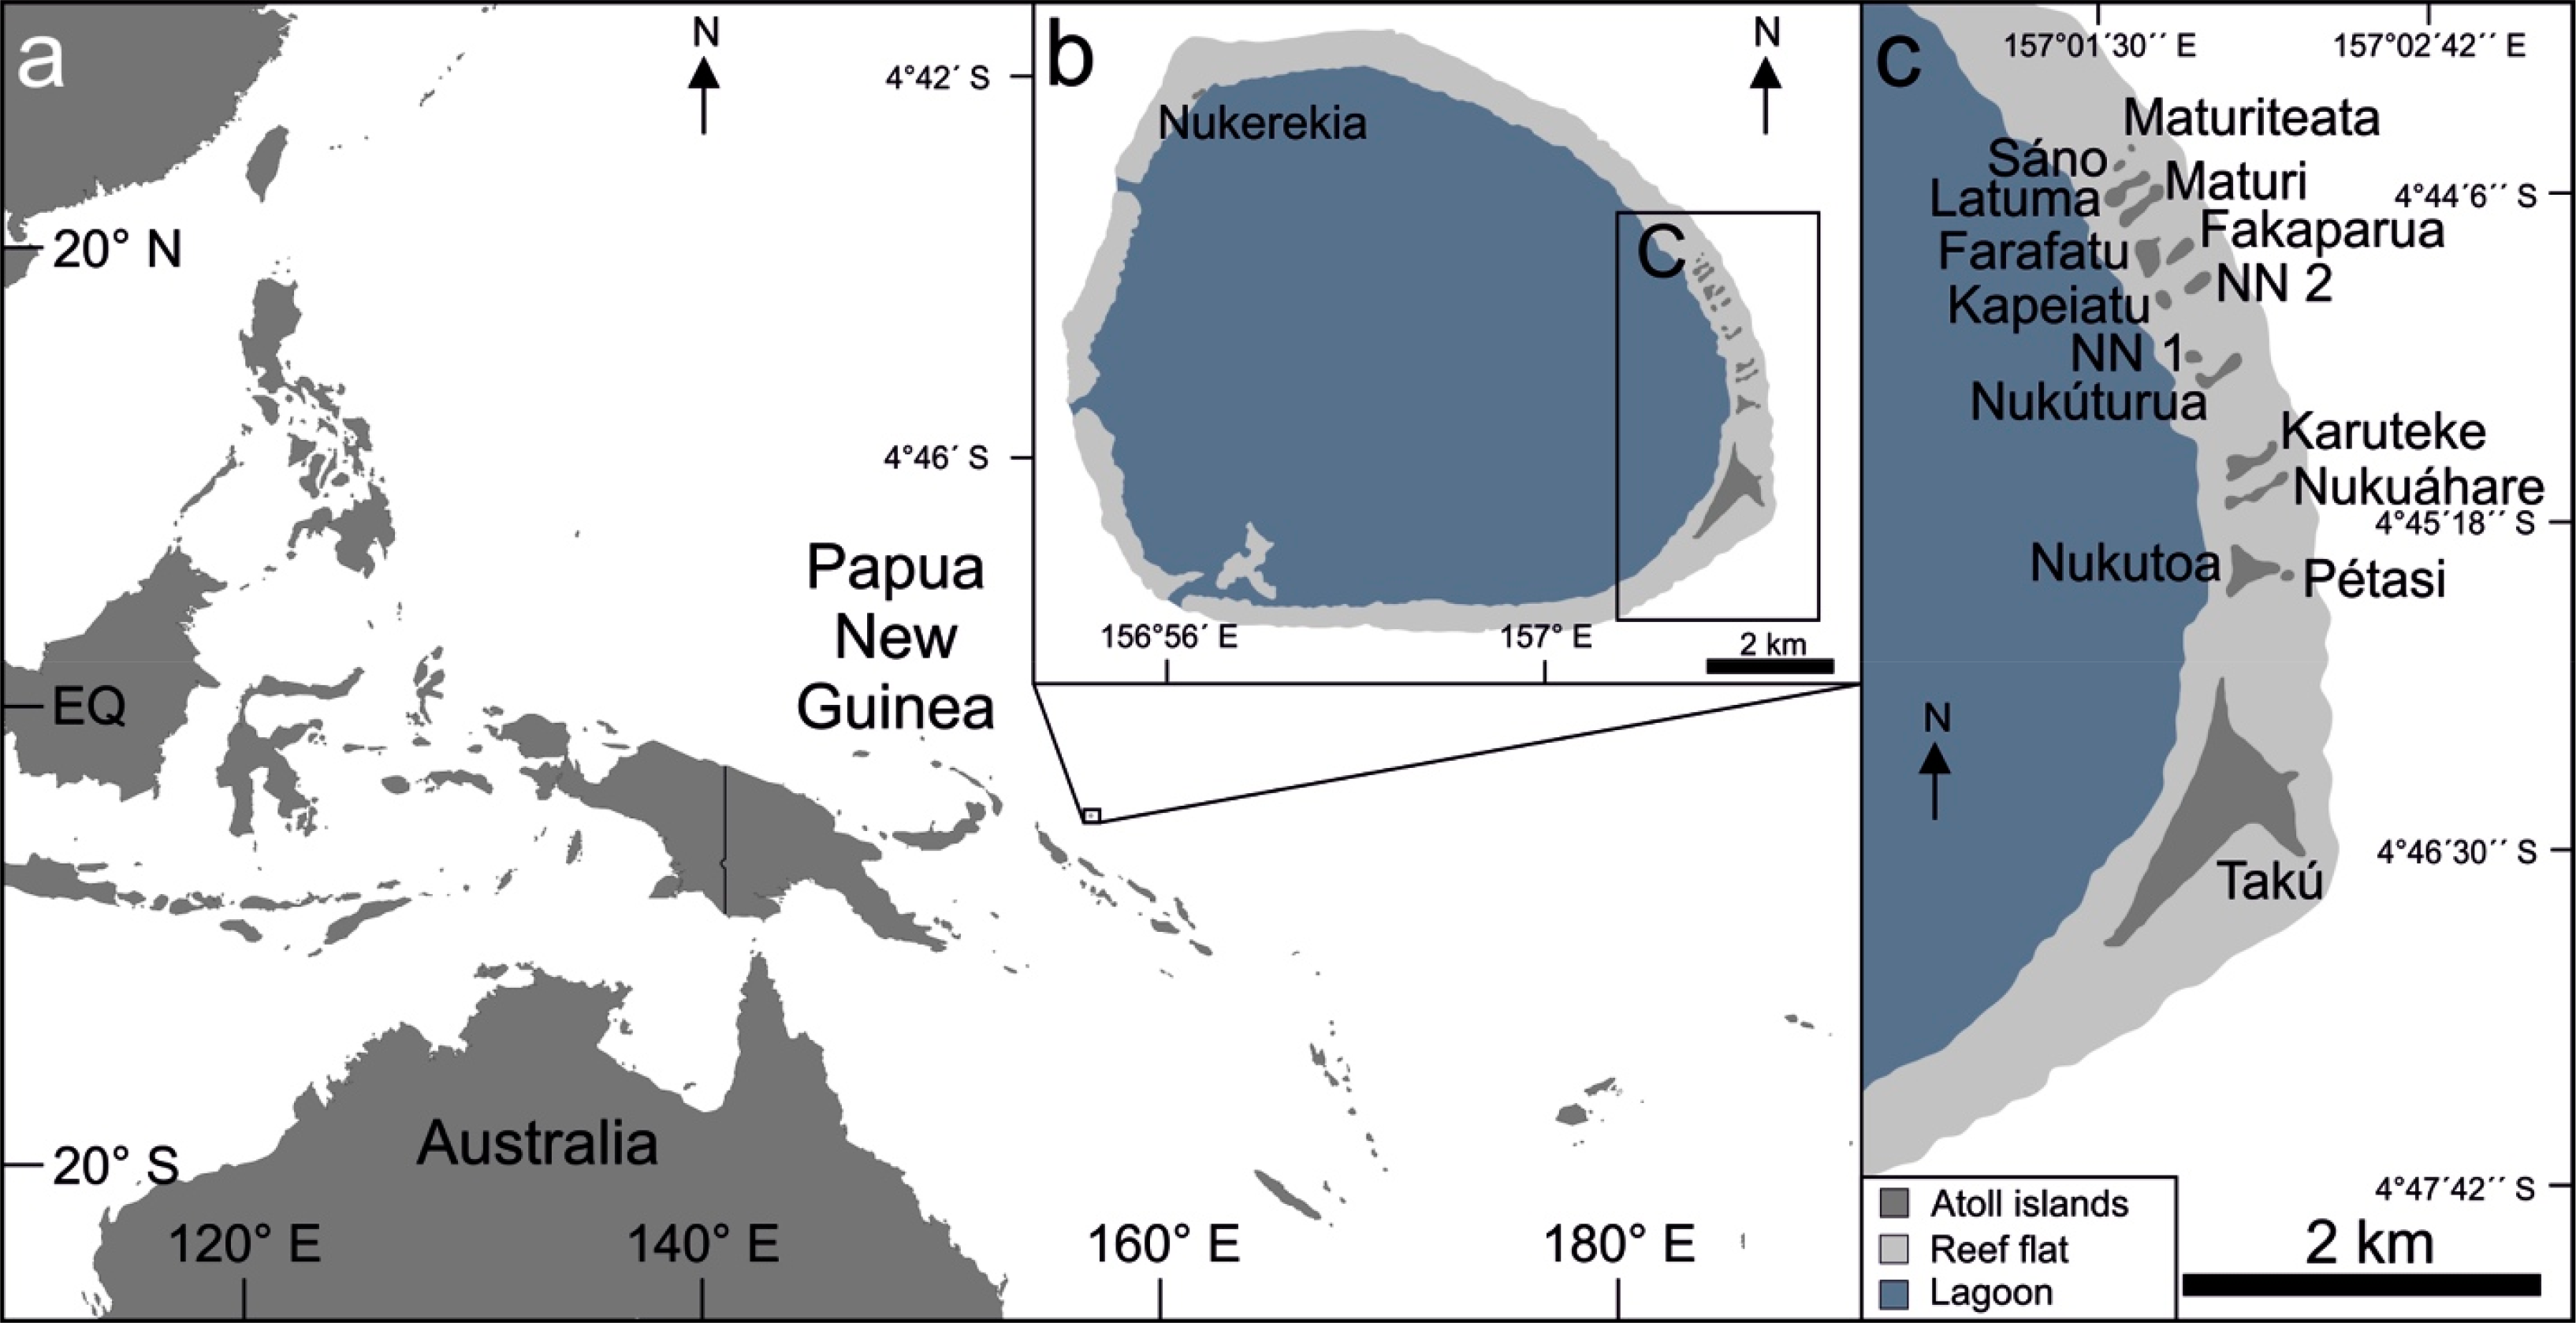
Takú Atoll is located in the easternmost extension of Papua New Guinea (PNG), approximately 265 km ENE from Bougainville Island, at 4°45′S and 157°E (Figure 1a). The atoll is administrated by the Autonomous Region of Bougainville and forms culturally a Polynesian Outlier-atoll in Melanesia [37,38]. The rim of the atoll is almost continuous and roughly circular in shape, with a diameter of 11 km in its northeast-southwest extension and 12.5 km from northwest to southeast. There are no published data on tectonic movements in this area, but leveling of fossil and living microatolls suggests that the vertical land motion at Takú Atoll is upwards at a rate not exceeding 0.2 mm/year (Hunter, J.R., [39]). Takú Atoll includes sixteen islands (Figure 1b), the majority of which resides on the eastern edge of the reef flat (Figure 1c). The atoll population has ranged between 74 and 600 inhabitants over the last 60 years. Today, about 400 people are living on Takú Atoll, inhabiting Nukutoa Island since 1930 [37].
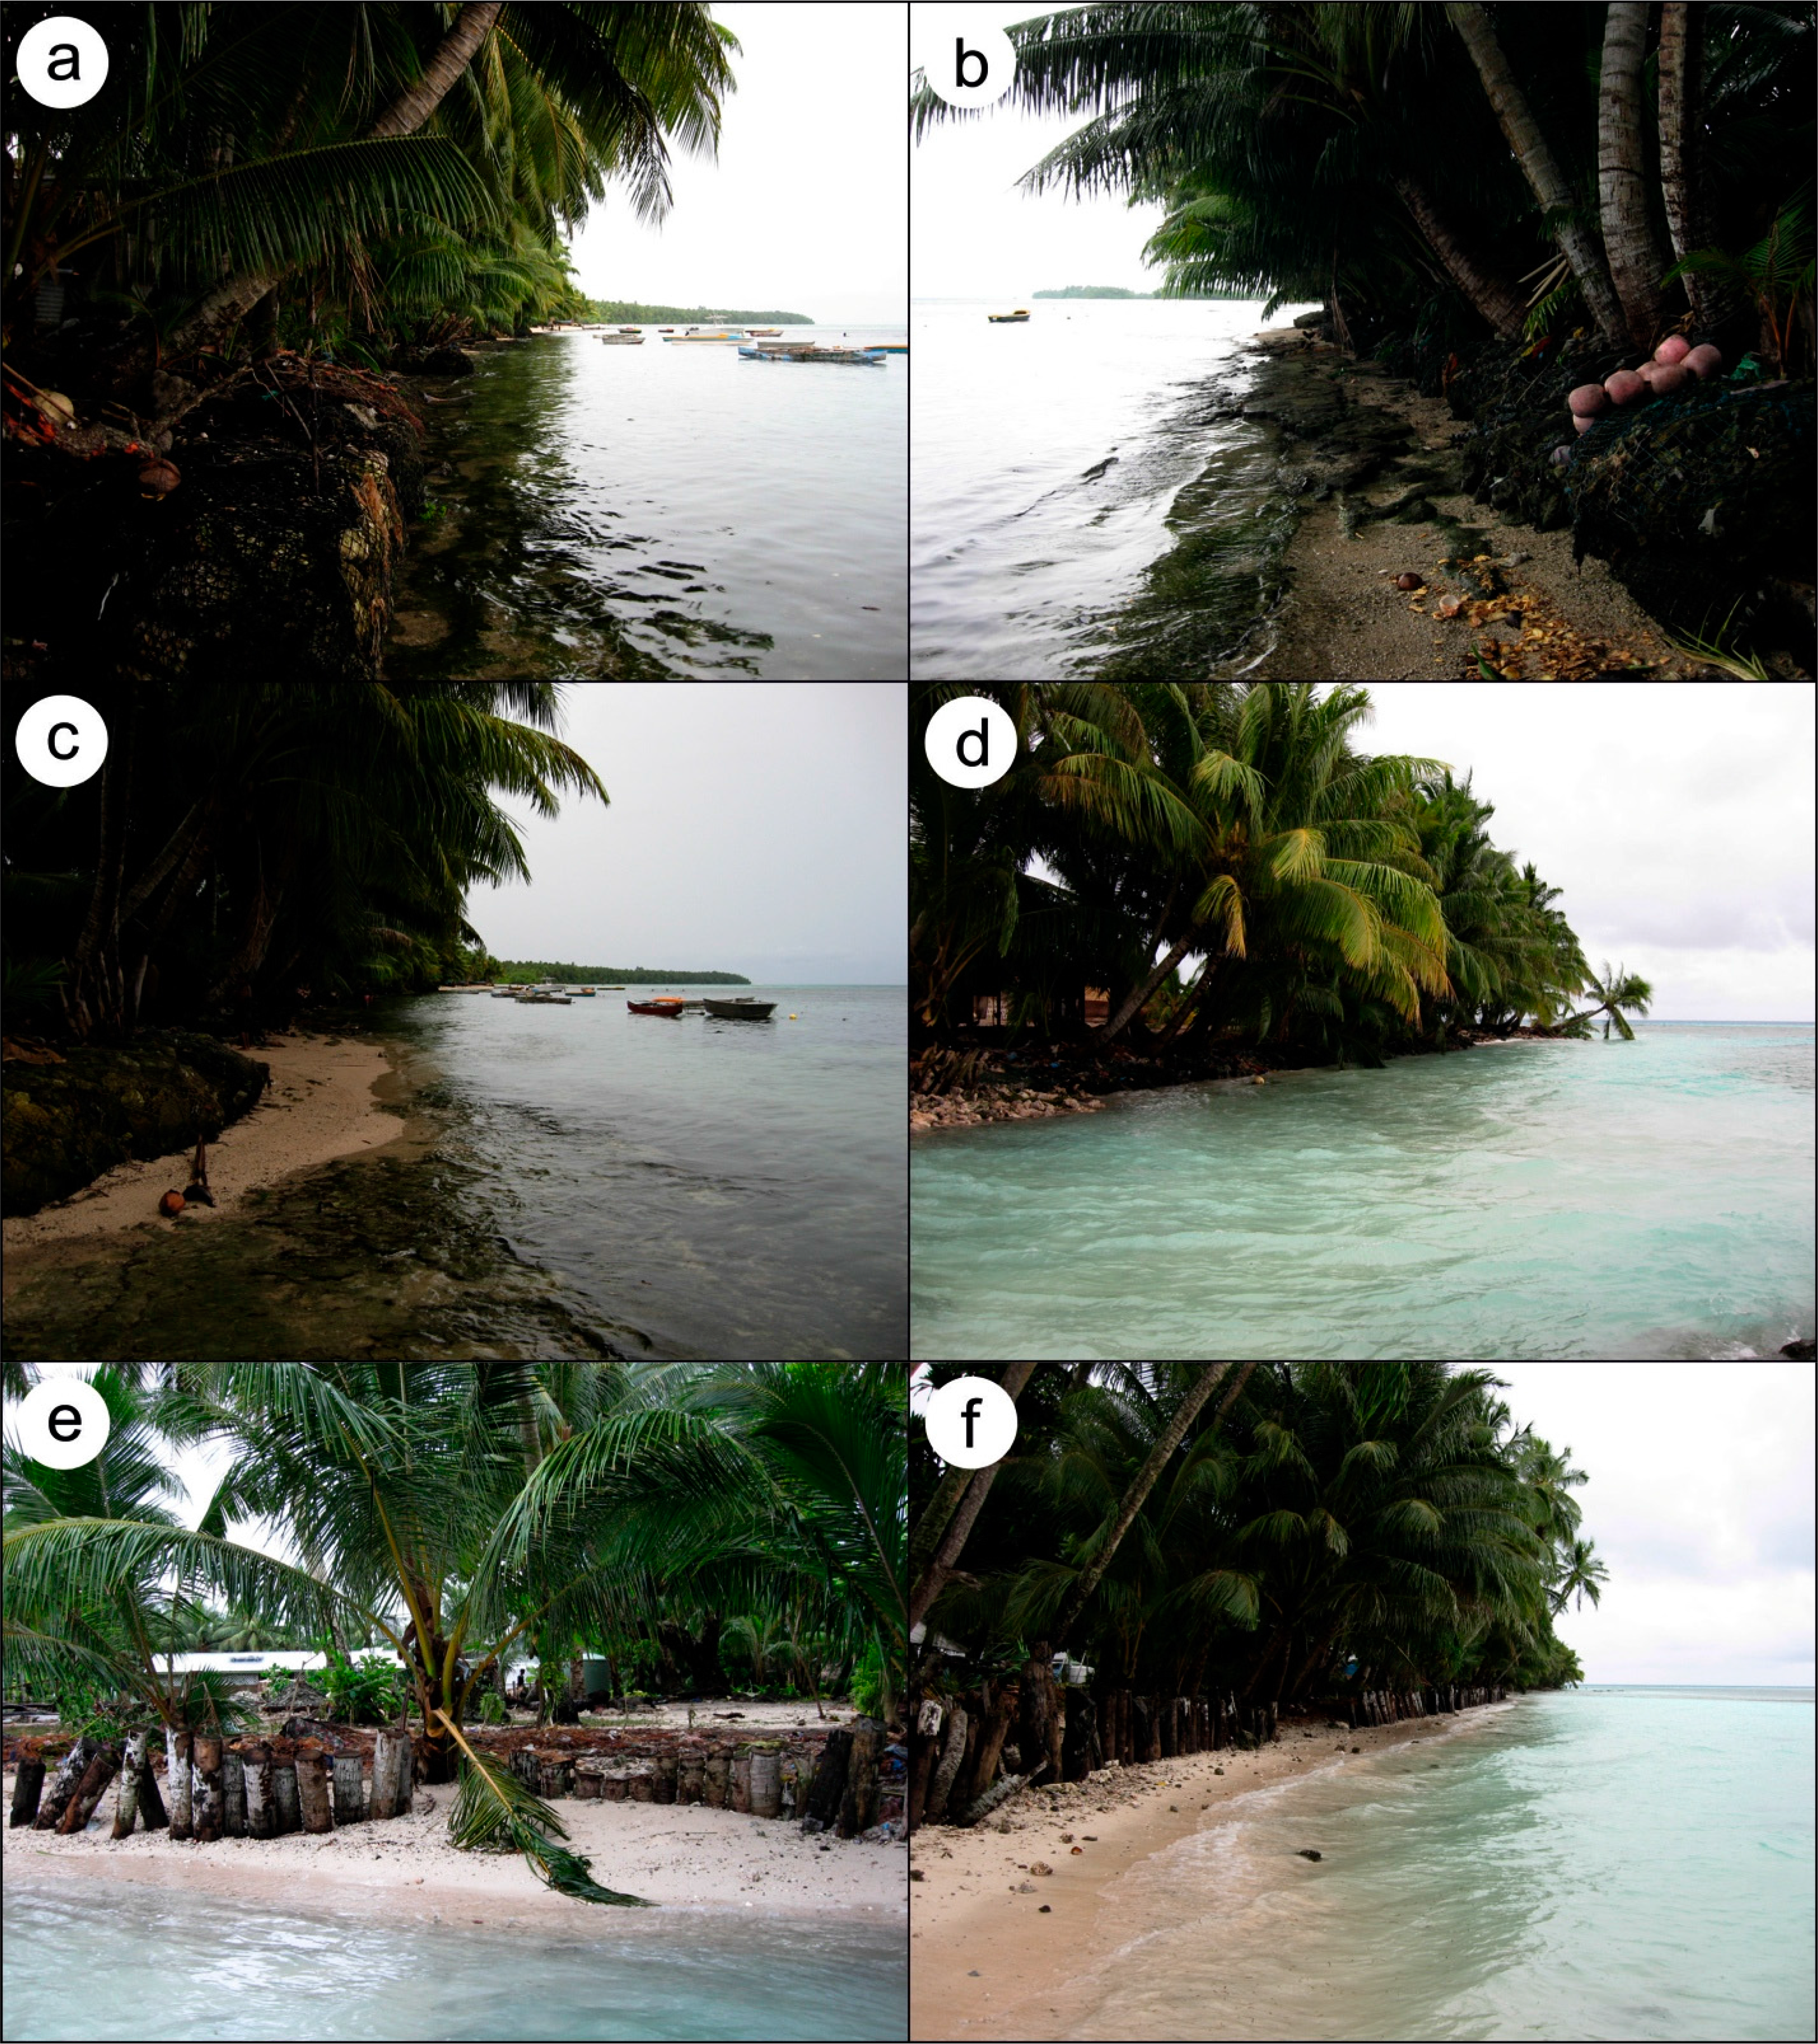
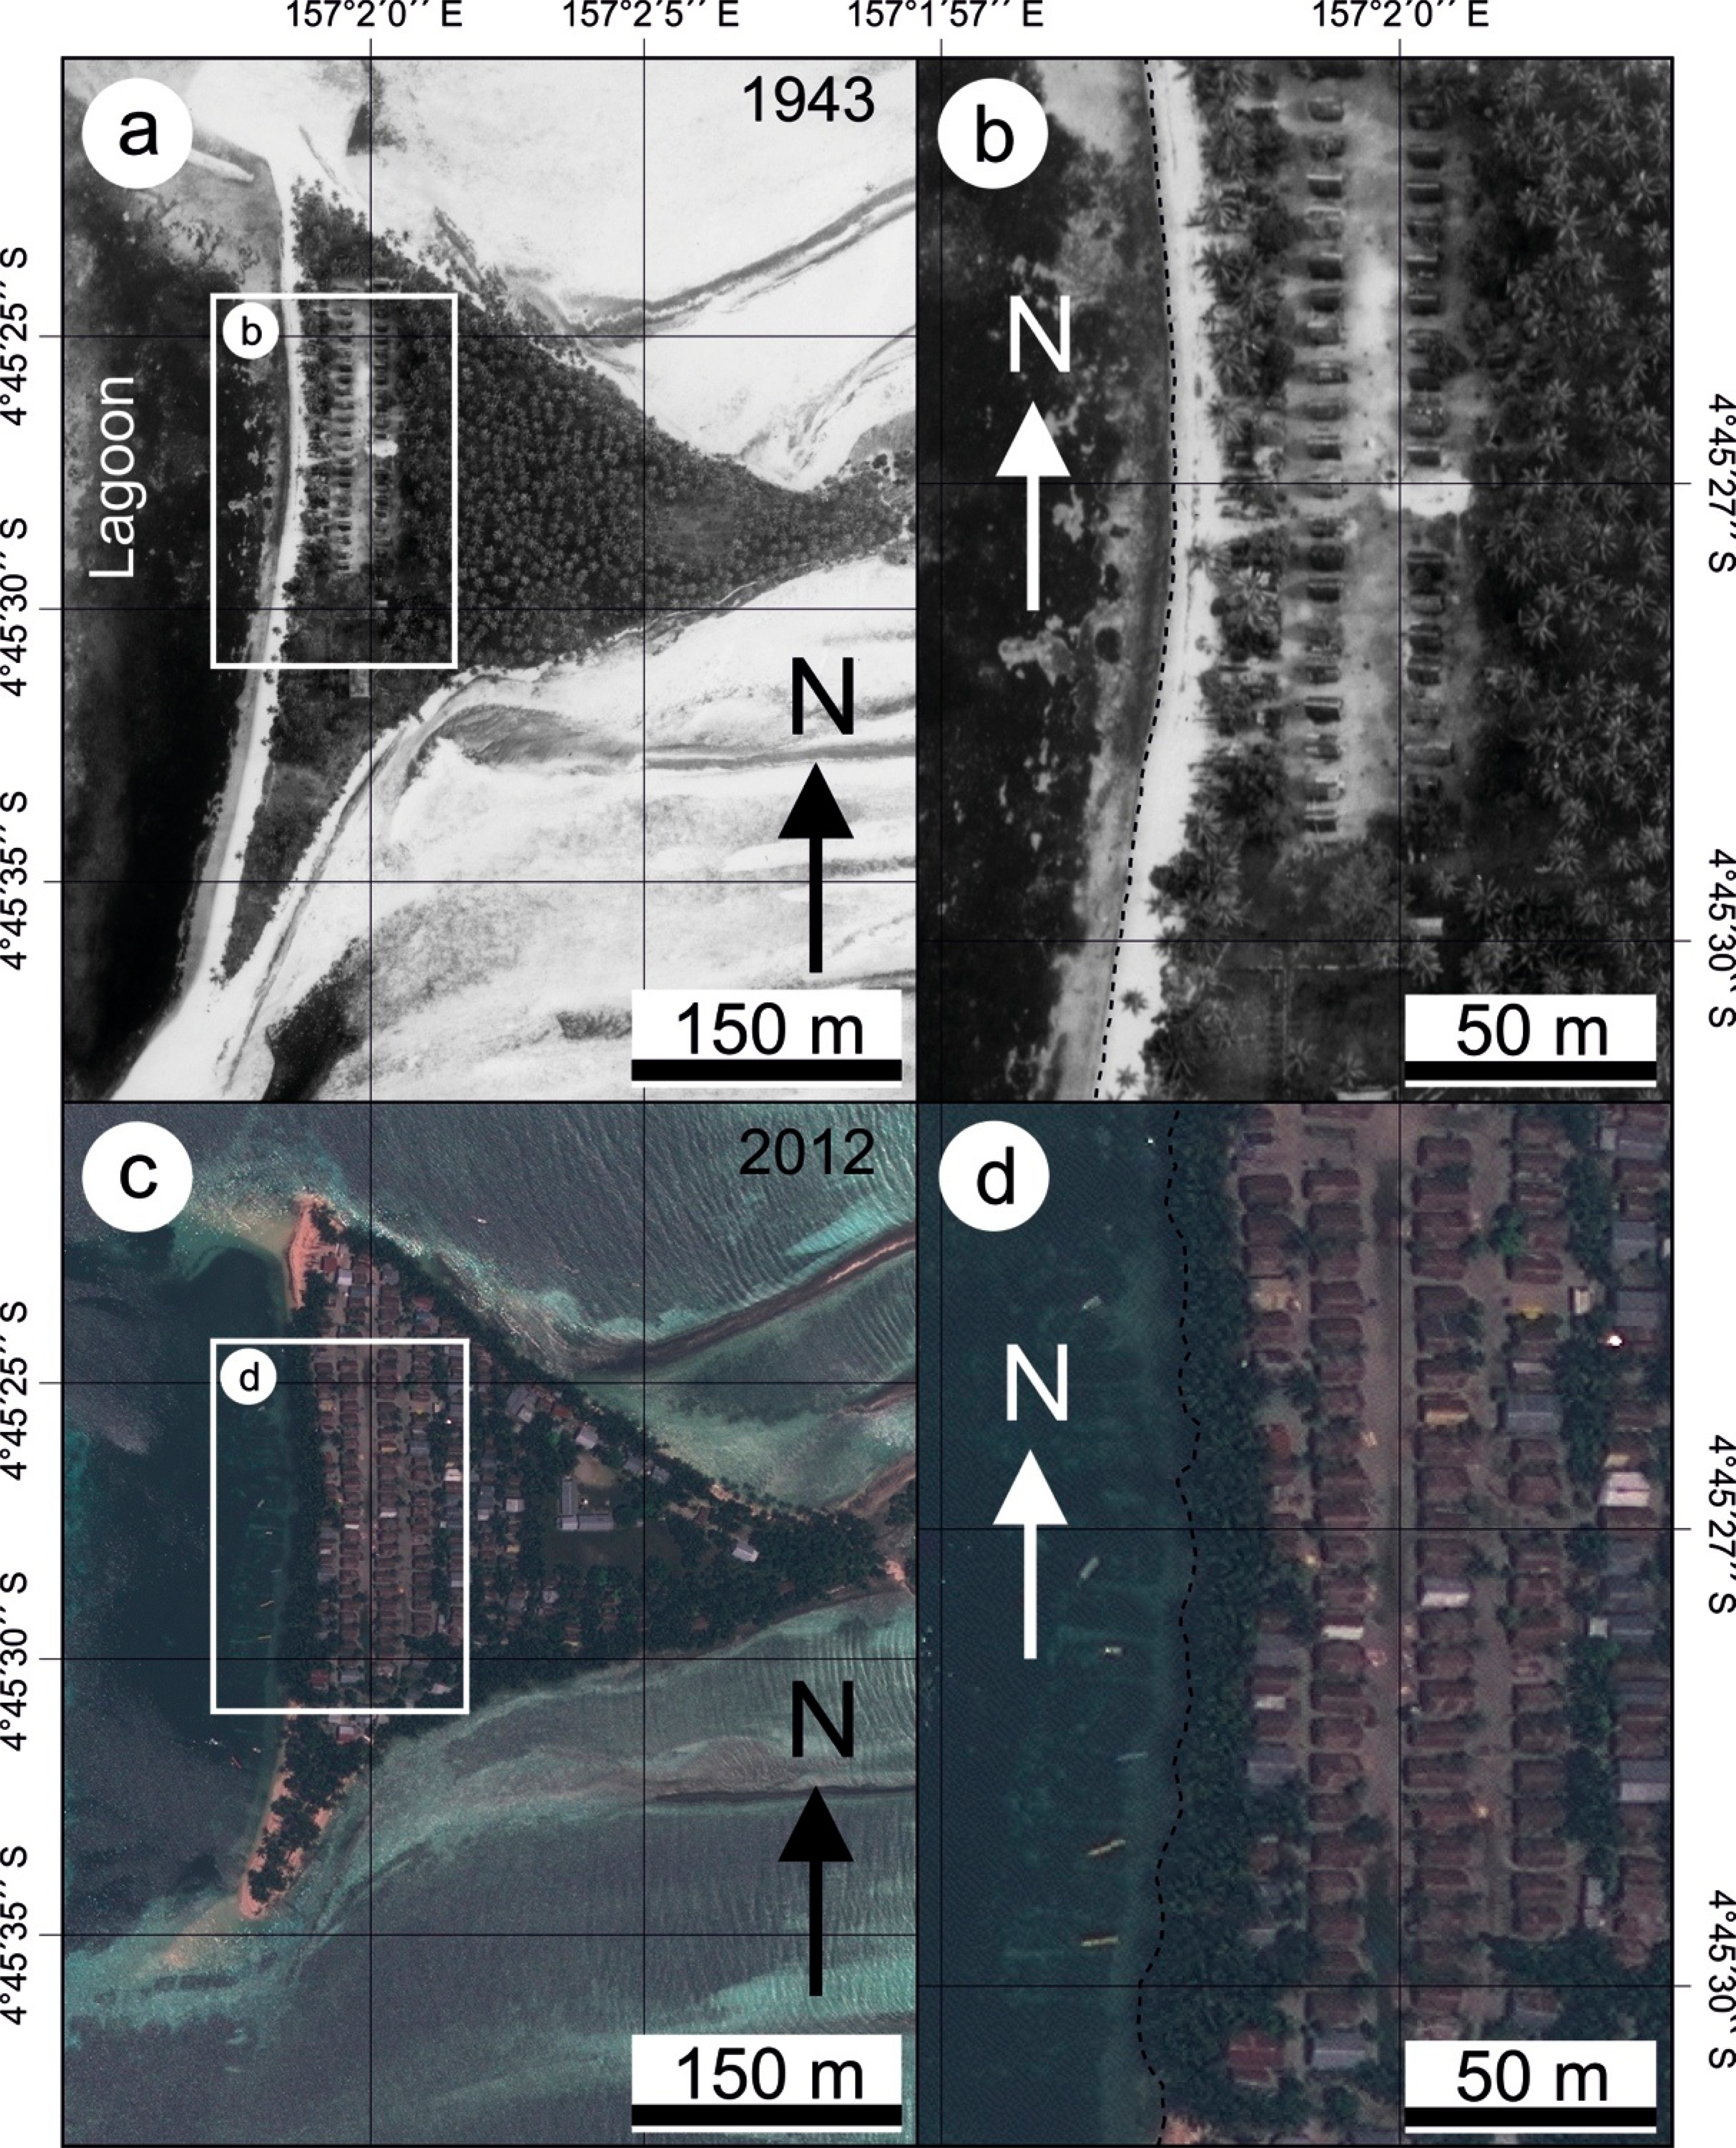
The inhabitants’ perception of environmental change was surveyed in December 2008 [39]. People living on Takú recognized increased rainfall, lower fish abundances and an increased extension of sea grass cover on the reef flat over the last decades. In addition, taro gardens (i.e., horticultural production of food crops) in the center of Takú Island are apparently affected by saline intrusion. Seawalls (i.e., “Gabion Baskets”, Figure 2a–d) were constructed along Nukutoa’s lagoon coast around 1970 to protect the beach against erosion. Contemporaneously, coconut trees were cut down to provide space for fishing canoes. Immediately after the construction of the seawalls, the inhabitants noticed an exacerbation of beach erosion. Later, a wall made of palm stumps (Figure 2e,f) was built to protect the island school against flooding events. The latest significant flooding of the atoll occurred in December 2008 and resulted in considerable geomorphological shoreline changes on Nukutoa Island [21]. Bourke and Betitis [38] report on beach erosion on Takú Island, the southeastern most islet on Takú Atoll. In contrast to the island of Nukutoa, anthropogenic alterations of the shoreline are not obvious on Takú Island, and hence, Bourke and Betitis [38] argue that beach erosion on this and some smaller islets may be a consequence of sea-level rise.
Local Climate and Hydrodynamics
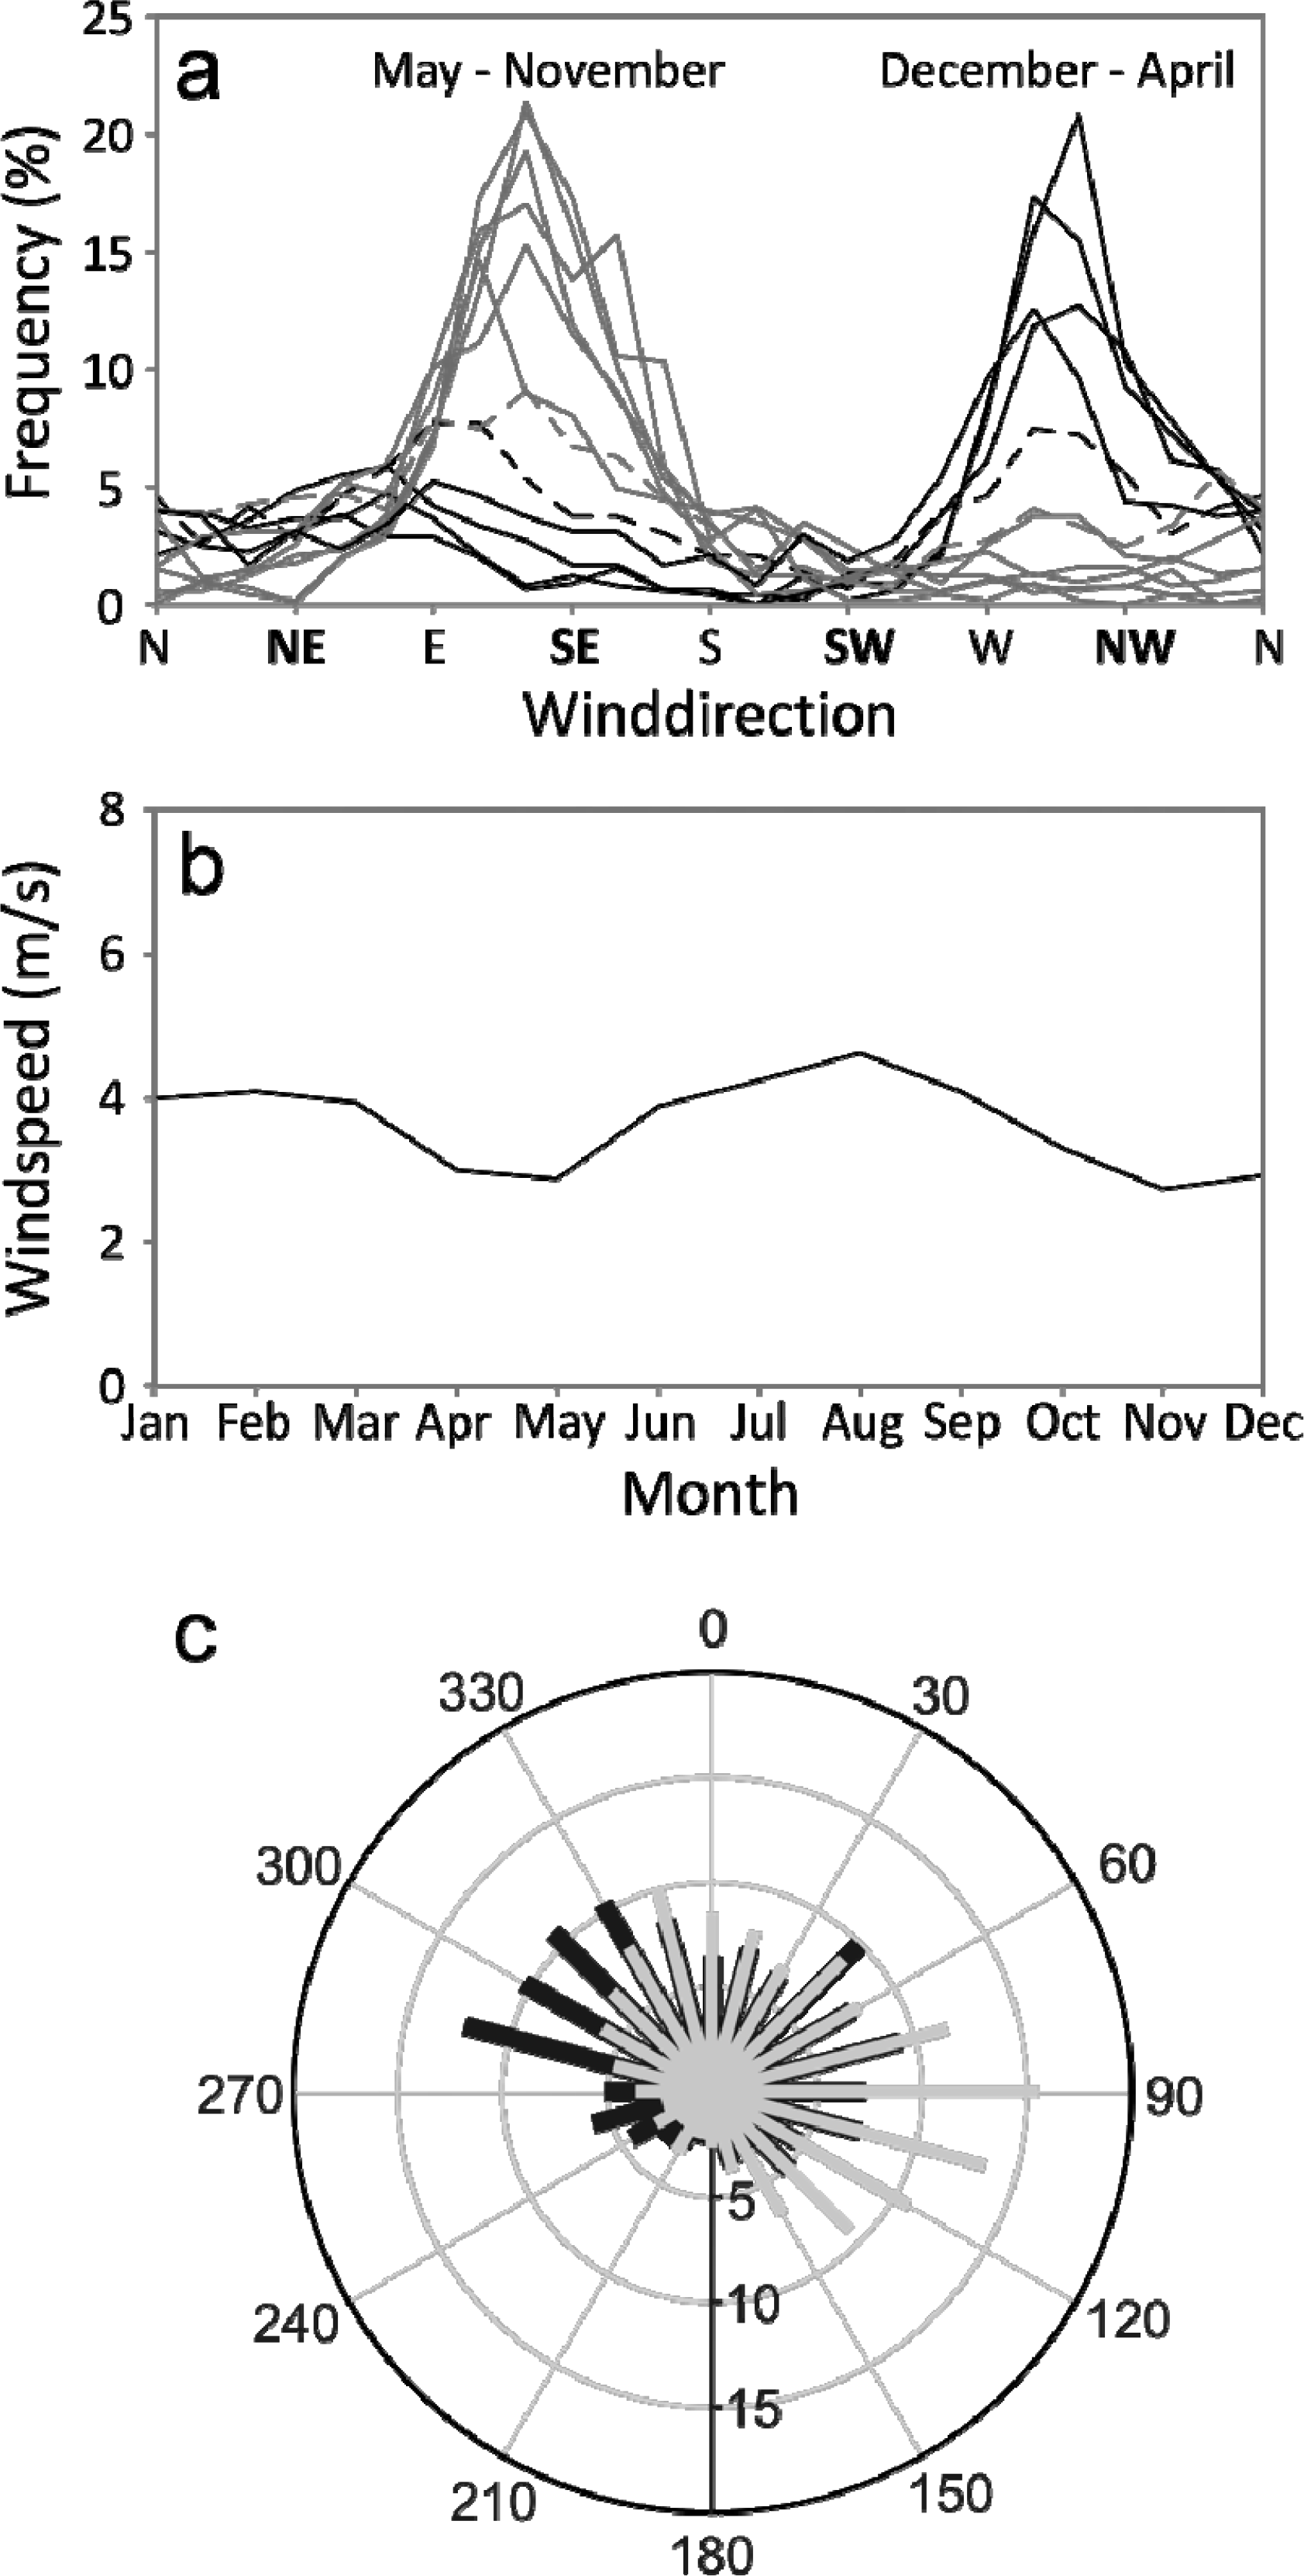
Wind data collected by the Tropical Atmosphere Ocean array [39] from 1991 to 2013 show that Takú Atoll experiences notable reversals in wind directions during the year (Figure 3a). Southeast trade winds (≈90°–165°) dominate the period from May to October (te anáke monsoon) with a mean wind speed of 3.7 m/s. From December to March (te laki monsoon), northwest winds (≈270°–330°) blow with a mean wind speed of 3.6 m/s. Highest wind speeds are recorded in February (4.1 m/s) and August (4.6 m/s) while lower wind speed and most variable wind directions appear in April to May and November (Figure 3b). There are no direct measurements of the wave and current conditions on the reef flat. Oceanographic data recorded since 1999 show that hydrodynamics around Takú Atoll are influenced by seasonal shifts in monsoon wind directions [40].
During the te anáke monsoon, the dominant swell direction is west-northwest, whereas during the te laki monsoon, the swell direction is south-southeast (Figure 3c). Furthermore, there are year-round currents coming from the north. Information about tidal ranges is limited to short-term measurements and indicates a diurnal, microtidal regime [39].
2. Materials and Methods
To analyze the morphological characteristics of the islands and their beaches, we used a combination of vertical aerial photographs of the year 1943 and high-resolution satellite images from 2003, 2005, 2008, 2010 and 2012 (Table 2). The satellite images were available as GeoTIFF files. The digitization of aerial photographs was undertaken by scanning the hardcopies at a resolution of 800 dpi and the image files were then added to ArcGIS 9.3.1. As spatial reference, we used the WGS 84 coordinate system (UTM Zone 57S). Because the satellite images were already georeferenced, a small number of control points were sufficient to align them accurately (see supplementary data). The aerial photos were georeferenced according to evenly distributed natural (e.g., the center of distinctly shaped patch reefs) and artificial (e.g., corners of huts) control points on the satellite images using a 2nd order polynomial transformation.
2.1. Shoreline Proxy
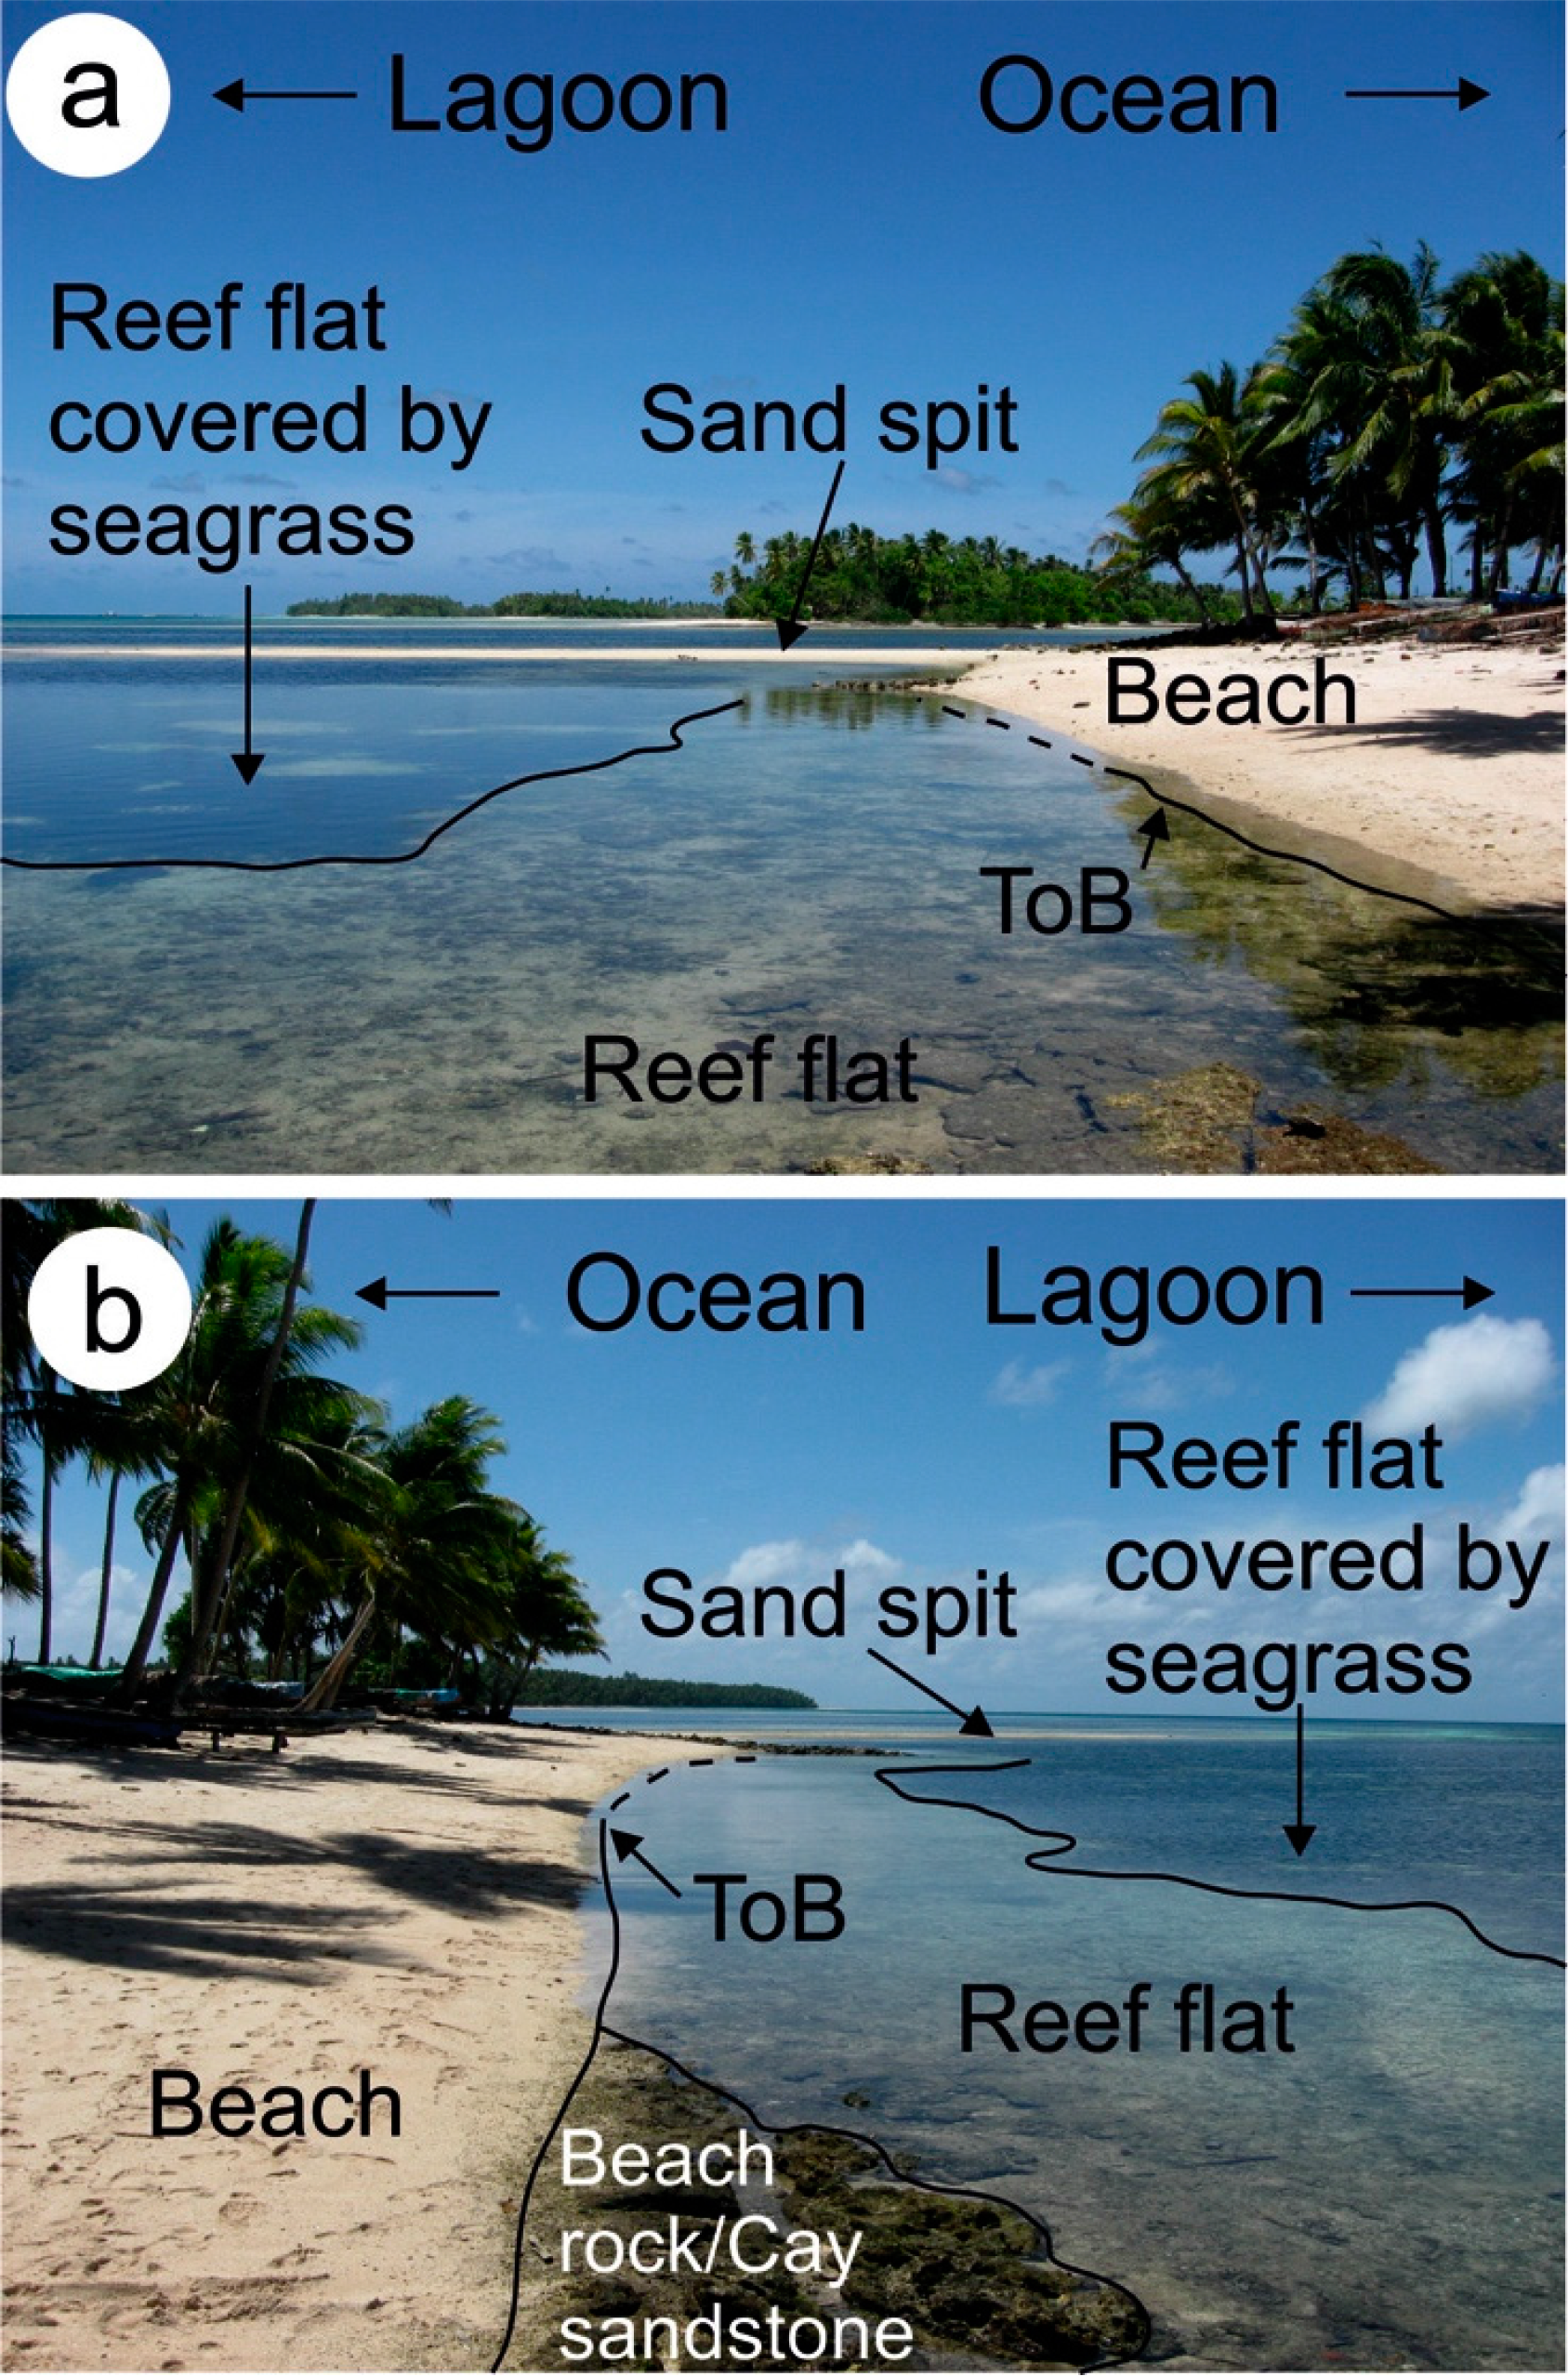
The islands included in this study show a visible beach on the 1943 air photographs. As shoreline proxy, we chose the toe of beach (ToB). For atoll islands, the ToB is defined as the intersection line between beach sediments and the reef flat [15]. The ToB is morphologically marked by a sharp transition between the flat reef surface and a steeply rising slope of beach sediments. On remote sensing data, the ToB furthermore assigns a light/dark boundary. This enables an identification based on image tone, particularly with favorable low-energy conditions when there are no wind-induced surface waves with short wavelengths. An evaluation of field photographs provided additional verification of the morphological elements of the reef flat and the islands (Figure 4). During vectorization, we reduced the brightness of some images to increase the visual contrast. This allowed an accurate identification of the ToB around the entire perimeter of the studied islands. To determine beach width, we furthermore manually digitized the vegetation limit as the apparent islandward delineation of beach sediments. The area between the permanent vegetation line and the ToB is defined as the beach. When there was no beach visible in front of vegetated island cores, we continued the vectorization process and instead digitized the vegetation boundary in order to cover the entire island perimeter.
2.2. Shoreline Change Analysis
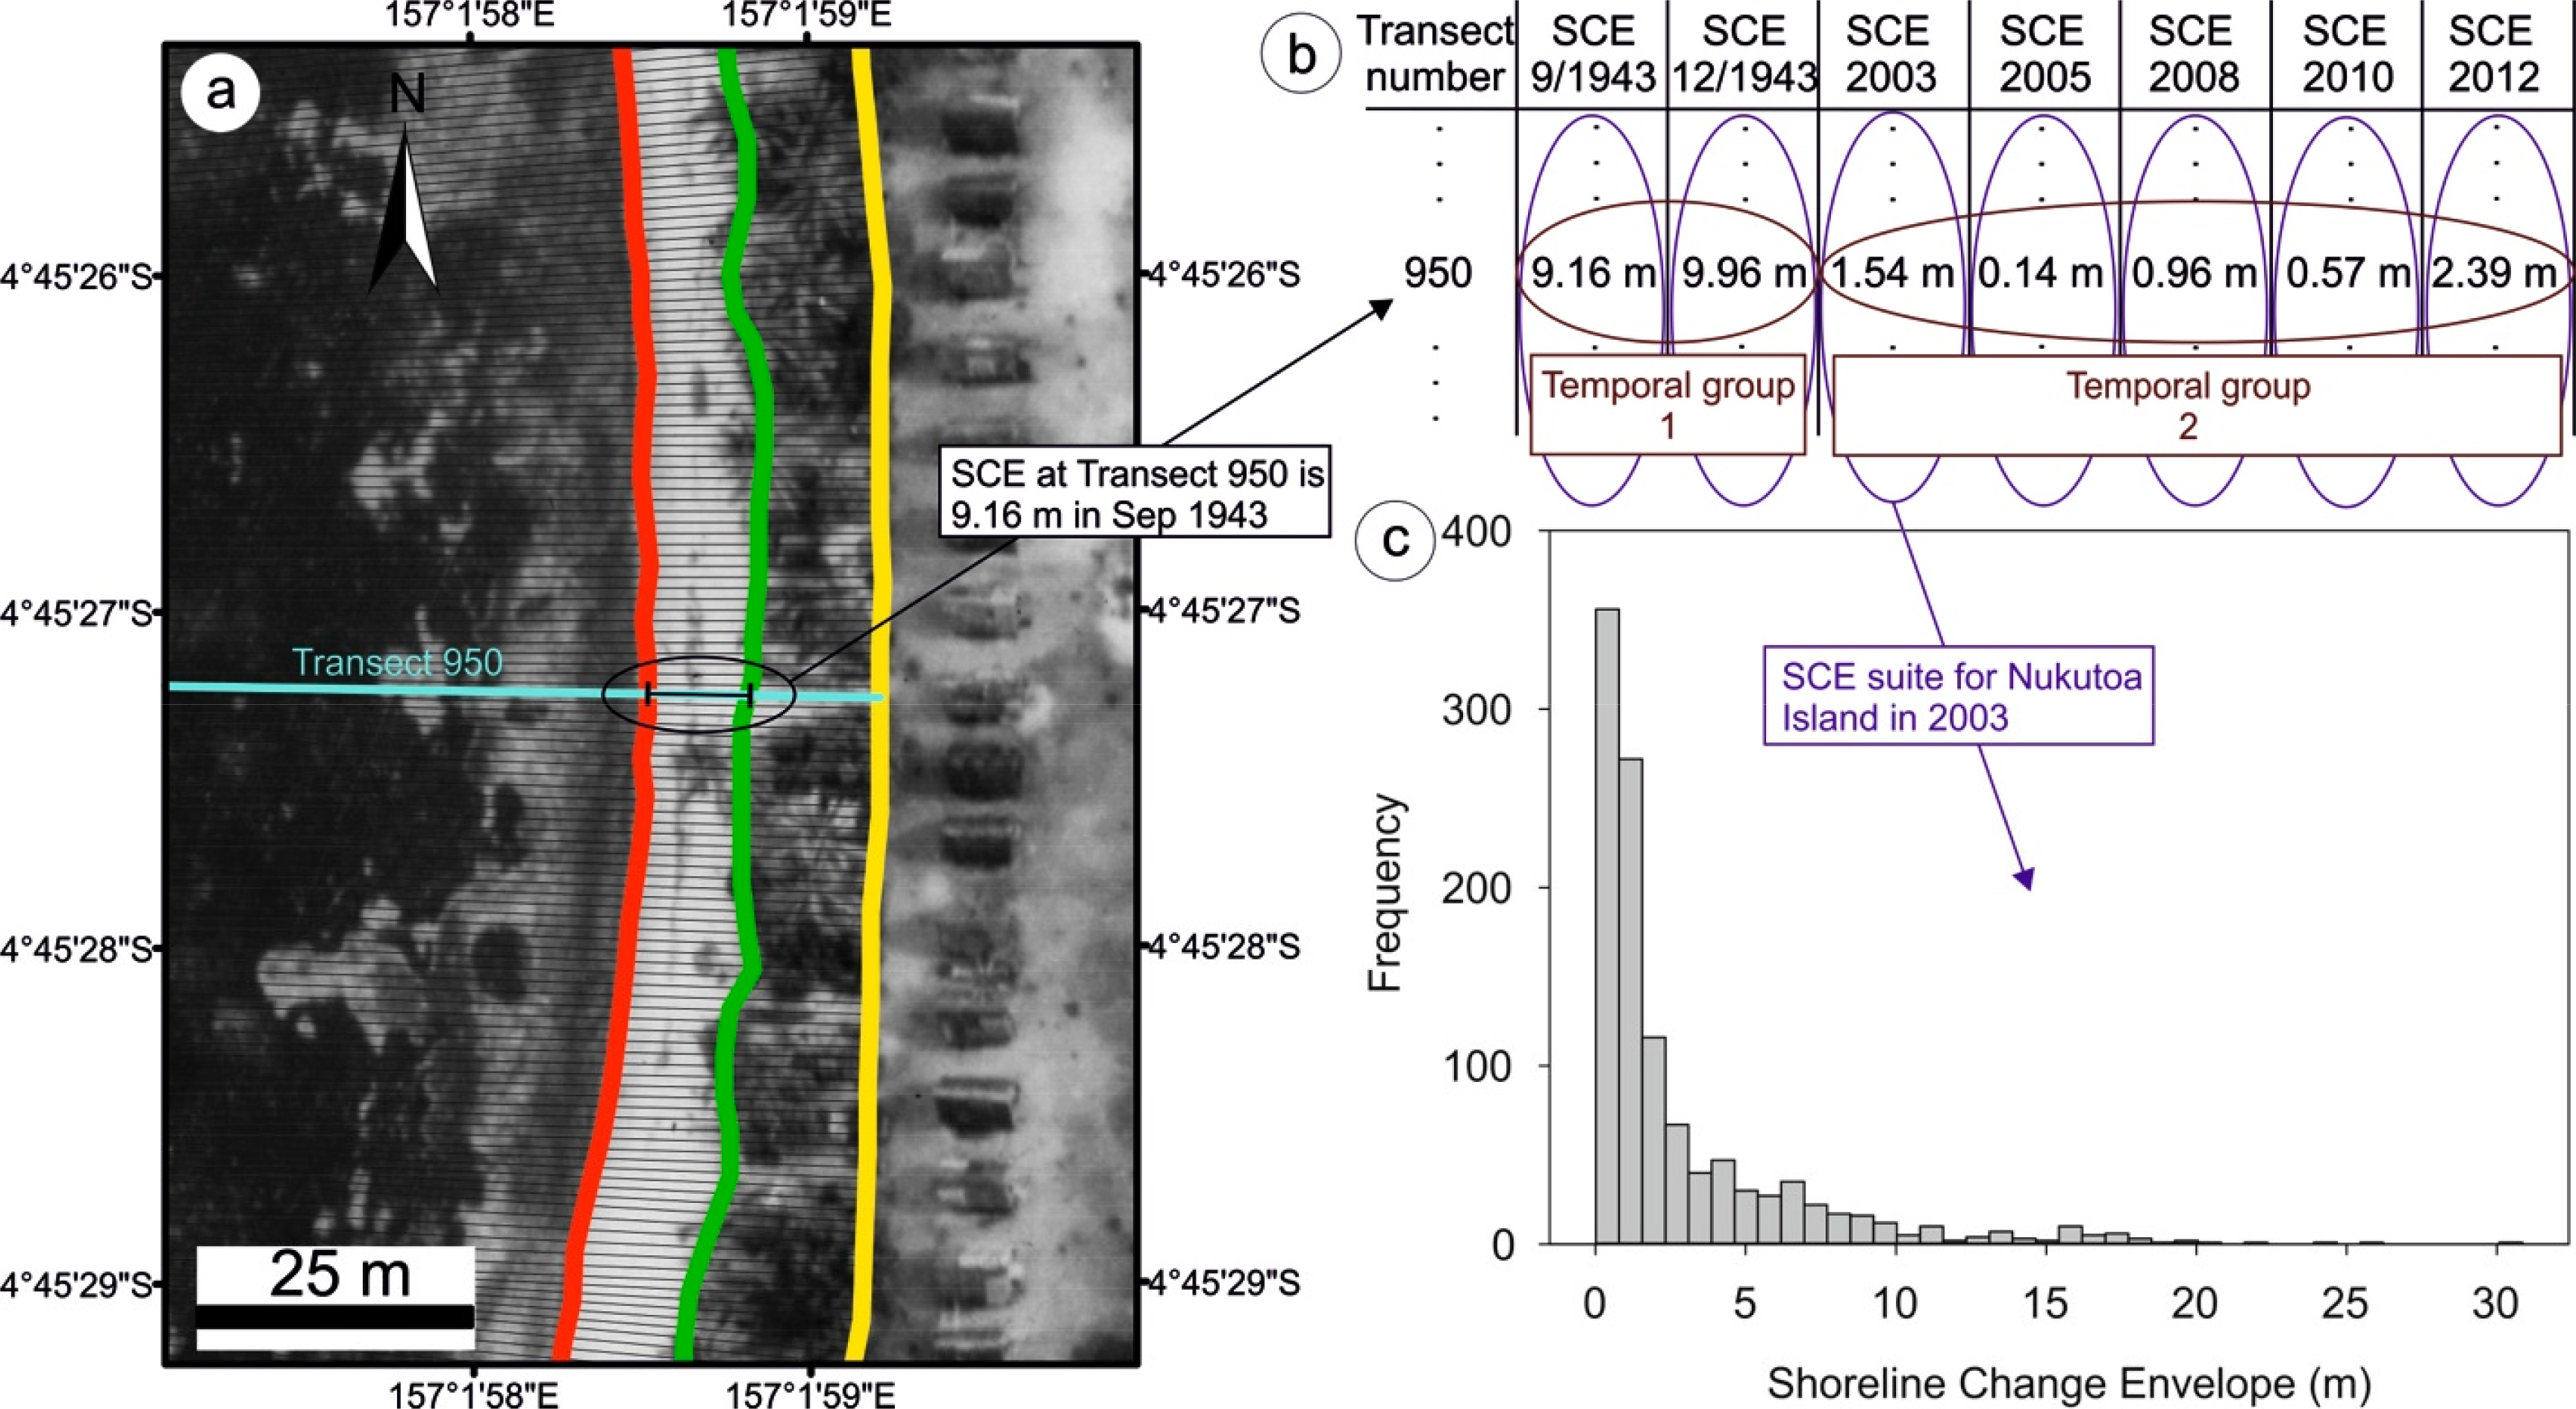
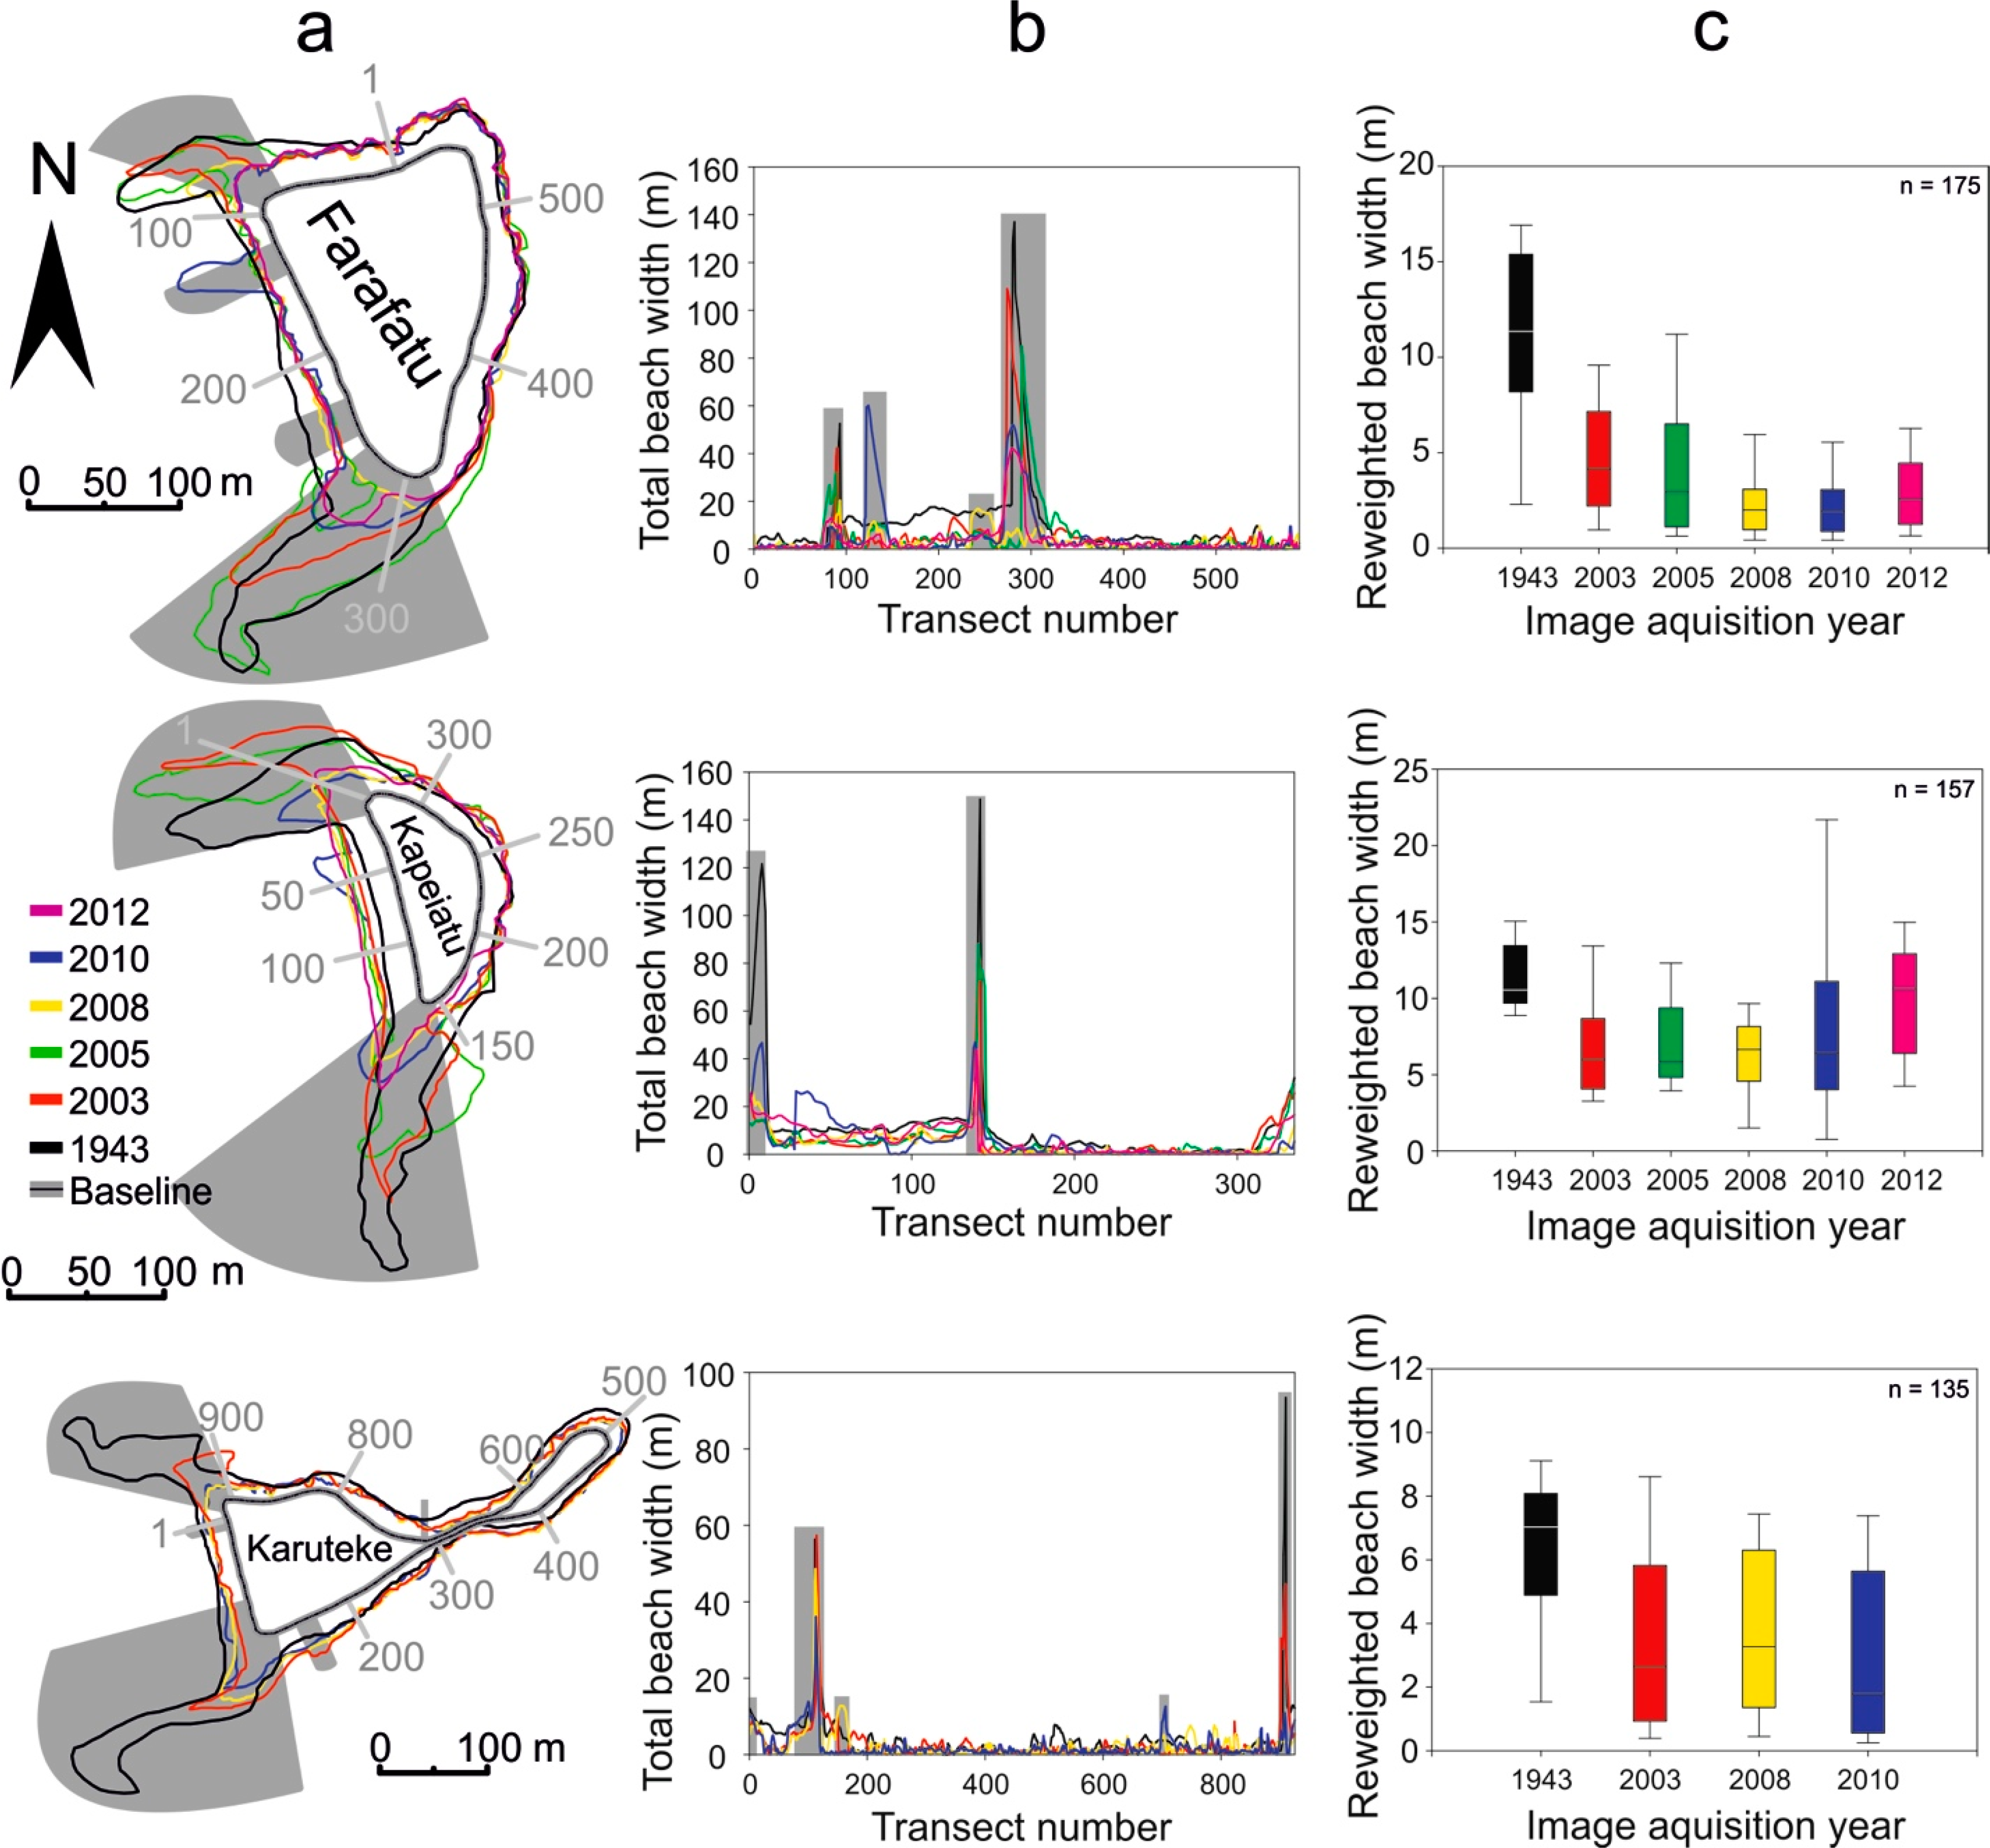
We determined changes in shoreline position with the Digital Shoreline Analysis System (DSAS 4.0), a software extension for ArcGIS. DSAS is a frequently used tool to analyze positional changes in shoreline position and accurately calculate rates of shoreline changes [33,41] The software casts transects at a freely selectable interval perpendicular to a baseline drawn by the user [41]. We constructed the baseline onshore and as far as possible parallel to the limit of vegetation. DSAS generated transects at a spacing of 1 m along the baseline. Intersection points between each transect and the digitized shorelines provide information about time and distance to the baseline. These points of measurement are then detected by the software and used for further processing. Shoreline change calculations with DSAS are usually referenced to the same feature, e.g., the ToB. The relative beach width at each transect, however, is the distance between the edge of vegetation and the ToB. Therefore, the shapefiles for the ToB were merged with the shapefiles of the edge of vegetation and imported to a geodatabase in ArcCatalog. We repeated this step for all islands and all years covered by images. As a result, up to seven geodatabases were created for each island. Importantly, the baseline as well as the location and number of transects remained. This allowed a direct comparison of shoreline change at each transect. In it’s actual meaning, the Shoreline Change Envelope (SCE) is defined as the distance between the shorelines nearest and farthest to the baseline at each transect [41]. In our study, the SCE represents the distance between the vegetation and beach limits at each transect for each image (Figure 5a). Hence, the beach width is depicted by the SCE. DSAS furthermore computed rates of positional changes using the Weighted Linear Regression (WLR) method. WLR at each transect provides statistically reliable results on shoreline changes that also account for oscillating patterns between erosion and accretion along highly dynamic sections of the shoreline. To determine WLR rates, all toe of beach shapefiles for each island were imported into a single geodatabase. Annualized WLR rates of erosion or accretion provided by DSAS are considered as statistically significant when both limits of the 2σ confidence interval are negative (i.e., erosion) or positive (i.e., accretion) respectively [42]. The calculation of WLR rates was based on all transects, but only statistically significant values were used for further calculations. We determined beach areas as the difference between the polygons enclosing the ToB and the vegetated island cores (Table S1). To approximate representative beach areas that are not biased from the most dynamic beach sections (i.e., reweighted beach areas, see below), we integrated the function between SCE (beach width) and the transects for each island. This step is based on the assumption that SCE at each transect approximates the area between two neighboring transects in m2 because the transect spacing was 1 m. Thus, reweighted beach areas result from the sum of SCE values at all reweighted transects.
2.3. Data Weighting
Seasonal and event-scale variability can result in extreme shoreline positions when compared to unaffected sections of the beach. A common approach to treat measurements that derive from extreme shoreline positions is to classify them as statistical outliers using a least median of squares (LMS) regression at each transect [43]. This however may lead to a loss of up to 50% of the data [43]. For Takú Atoll, as for many other Pacific atolls, the LMS technique is inadequate because of the irregular temporal spacing of the data. As a result, shoreline positions at each transect do not show a linear trend but are rather separated into two distinct temporal groups (Figure 5b). A LMS regression hence may identify “non-extreme” shoreline positions as outliers.
Therefore, we here consider the entire SCE suite for each time slice (and island) separately (Figure 5b). As noted by Limpert et al. [44], measurements of natural mechanisms in many cases approximate a log-normal distribution. Indeed, measurements between the vegetation limit and the ToB are by definition positive values with a large variance due to extreme shoreline positions and a low mean (Figure 5c). If a variable X is log-normally distributed, then ln(X) shows a normal distribution [44]. Standard statistical normality tests failed, however, linear regression analyses of the logarithmic SCE values show that most data points plot within the 95% prediction intervals of a normal distribution (R2 > 0.81, average = 0.95). To avoid manipulation of the original data, the following steps were based on the assumption of log-normally distributed SCE values.
We used prediction intervals based on the geometric mean x̄* and the multiplicative standard deviation σ* (see [44]) to remove extreme shoreline positions from the dataset. Thereby, the geometric mean is given by:
We calculated the prediction intervals for all times and islands individually. As we used the same set of transects for each island, we were able to compare the changes in SCE values along the transects. If one of the SCE values in the time series (i.e., at a certain transect) was greater than:
2.4. Quality and Uncertainties of Data Analysis
Vectorized shoreline positions are inevitably afflicted with uncertainties and errors related to natural influences and measuring inaccuracies [41,43,45–47]. The reliability of the computed rates of change provided by DSAS depend on the accuracy of the shoreline data and their overall uncertainties [41]. According to Fletcher et al. [43], natural influences cause uncertainties related to the tidal stage at the time of image acquisition and seasonal variations of the ToB location. In this study, higher tidal levels and the associated glint occasionally obstructed the visibility of the ToB in the 2012 satellite image (Supplementary data). To compensate for the refraction of light in water, we assigned a horizontal error of 1.5 m due to the tidal stage (TS) when we digitized the ToB. Measurement uncertainties result from georeferencing errors and inaccuracies due to image resolution and shoreline digitization. ArcGIS list the root mean square (RMS) errors after image georeferencing and in our study the total RMS errors ranged from 0 to 2.8 m. Errors associated with image resolution (IR) ranged between 0.13 and 0.6 m (Table 2). To determine errors related to the digitization (Di) of the different polylines, we adopted the approach from Ford [33,42] and calculated the standard deviation in shoreline positions after the same shoreline section was repeatedly digitized. This procedure was applied to all resolutions and resulted in values ranging from 0.3 to 1.1 m. The total uncertainty Ut [43] is given by:
3. Results
The studied islands are variable in terms of size and shape (e.g., triangular, auriculate, dumbbell-shaped; Figure 1). All analyzed islands are characterized by a large variability in total planform beach configuration. The magnitude of changes in beach width are spatially different within the individual islands, however exhibit consistencies between each other. Table S1 shows summary data on changes in beach area. Figures 6 and 8 and Figure S1 present selected examples of beach morphological changes over the timeframe of analysis.
3.1. Changes in Planform Beach Configuration
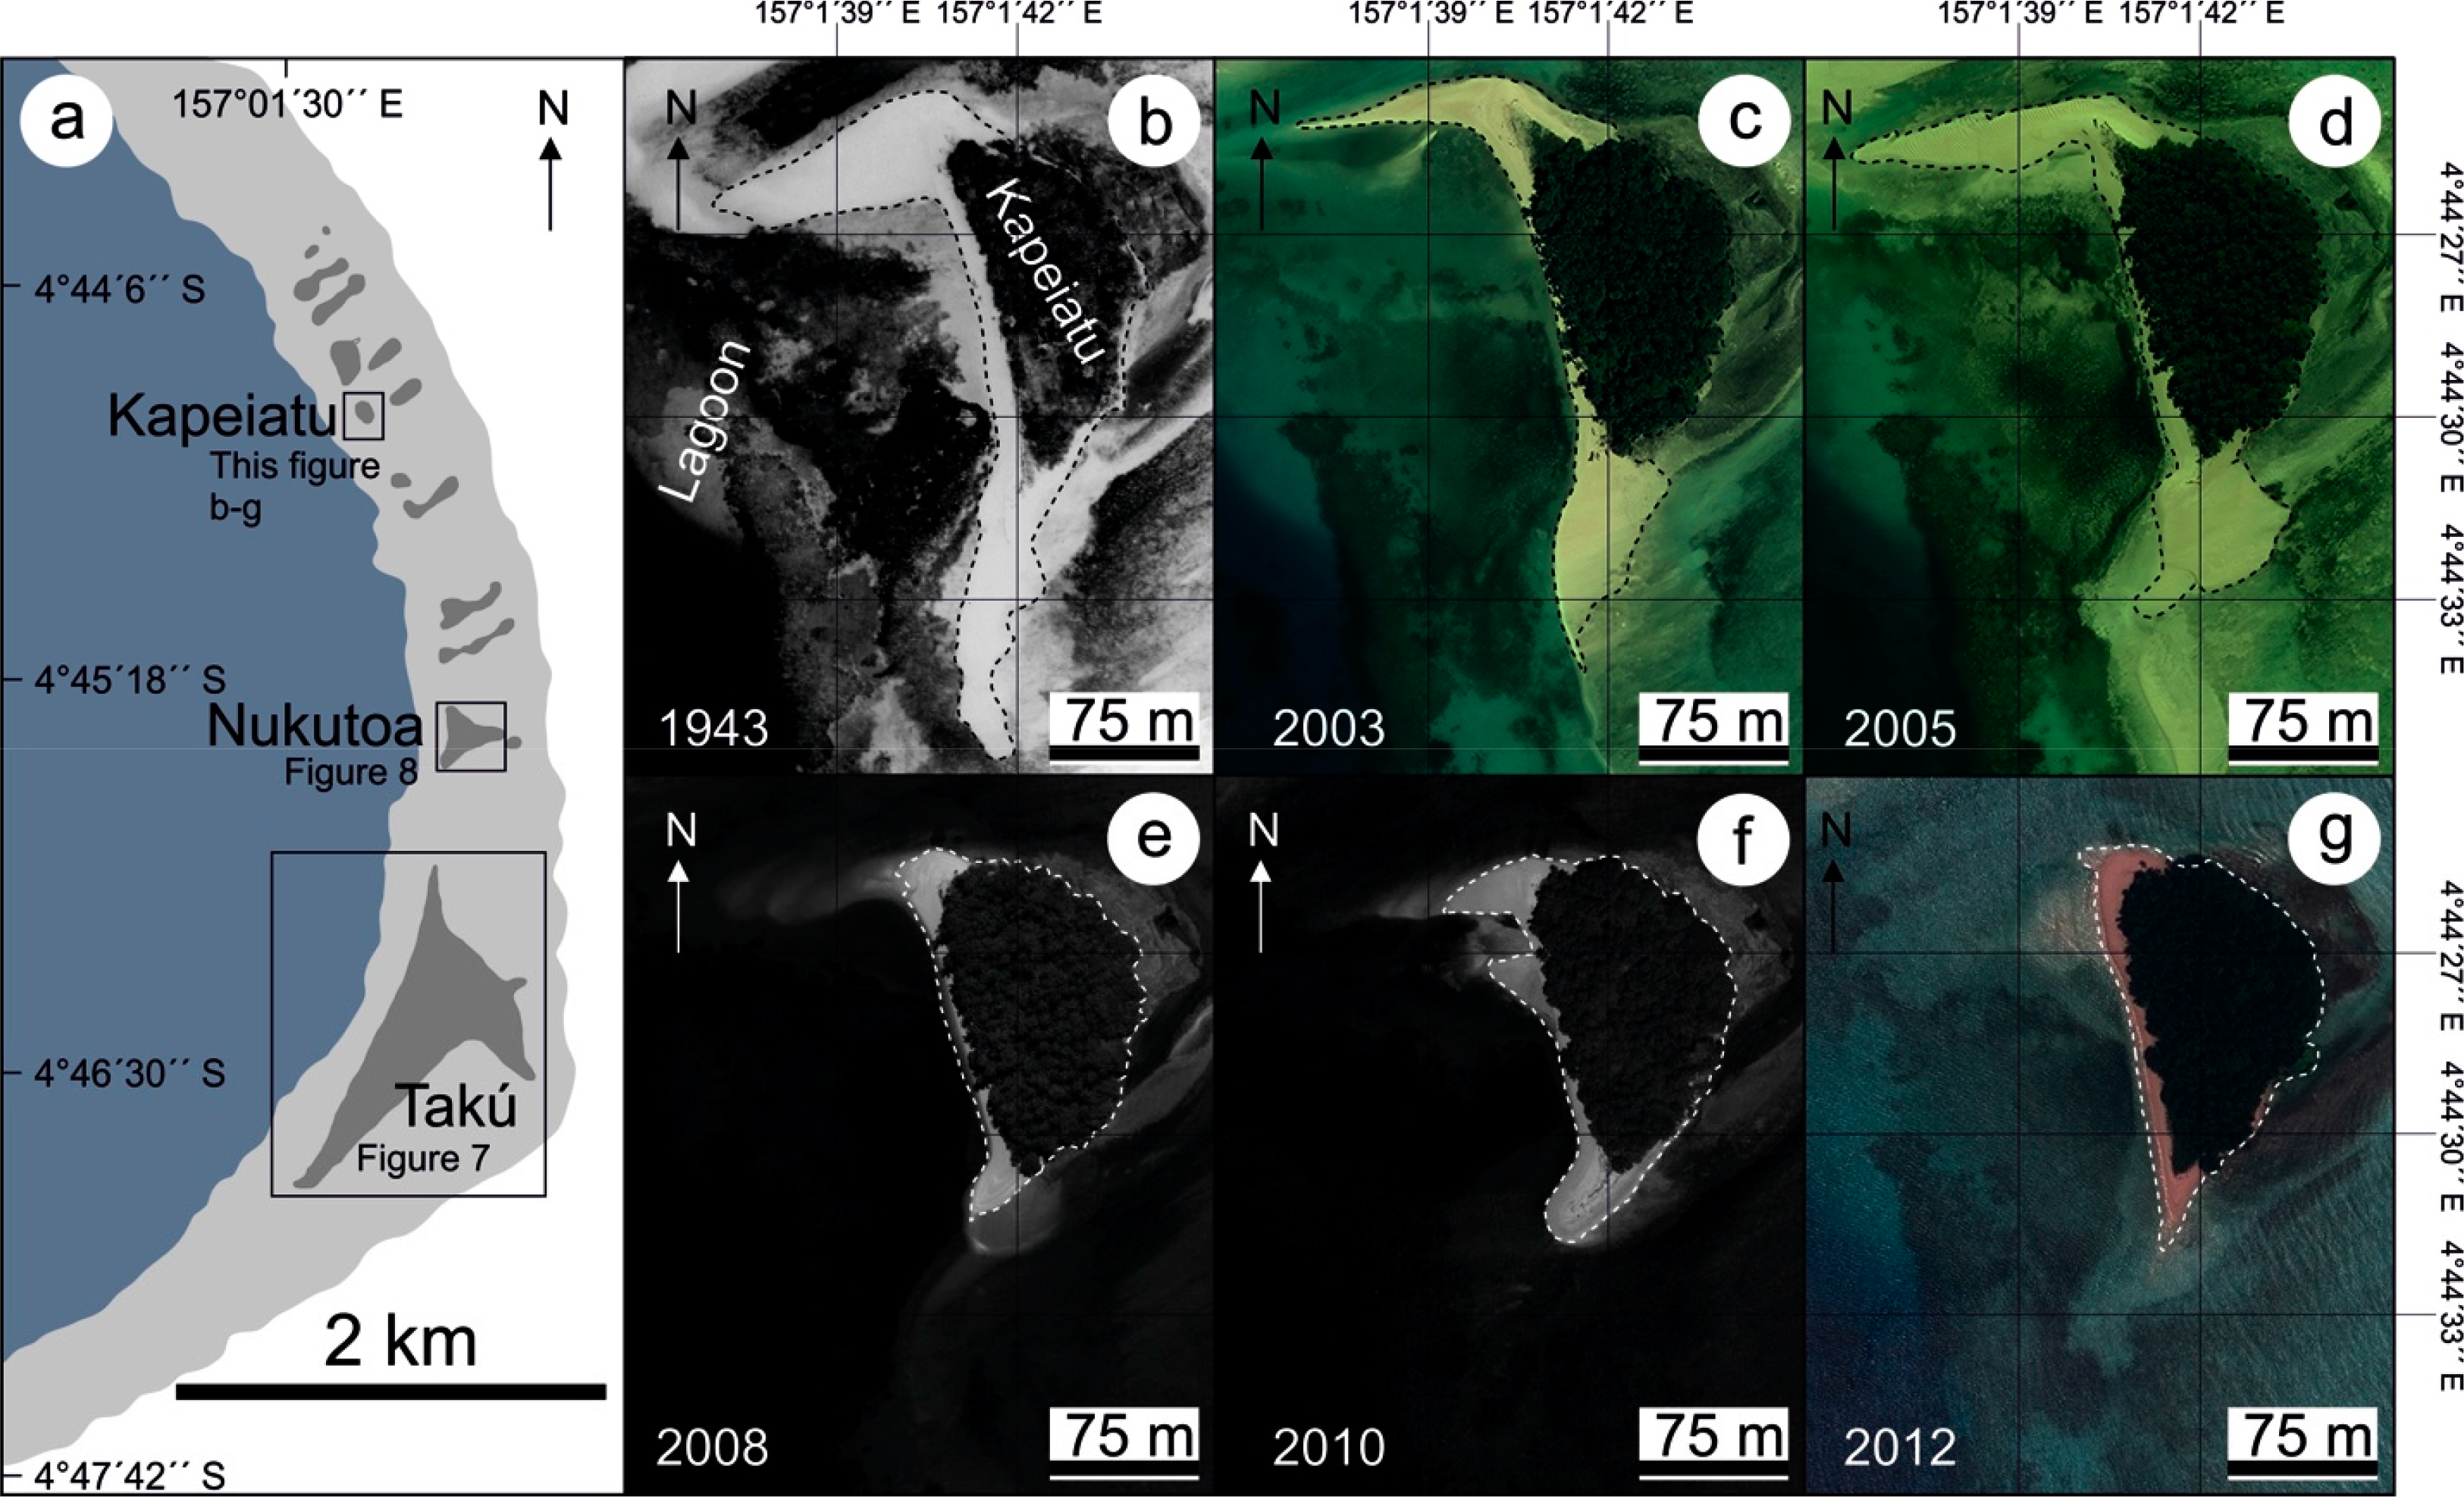
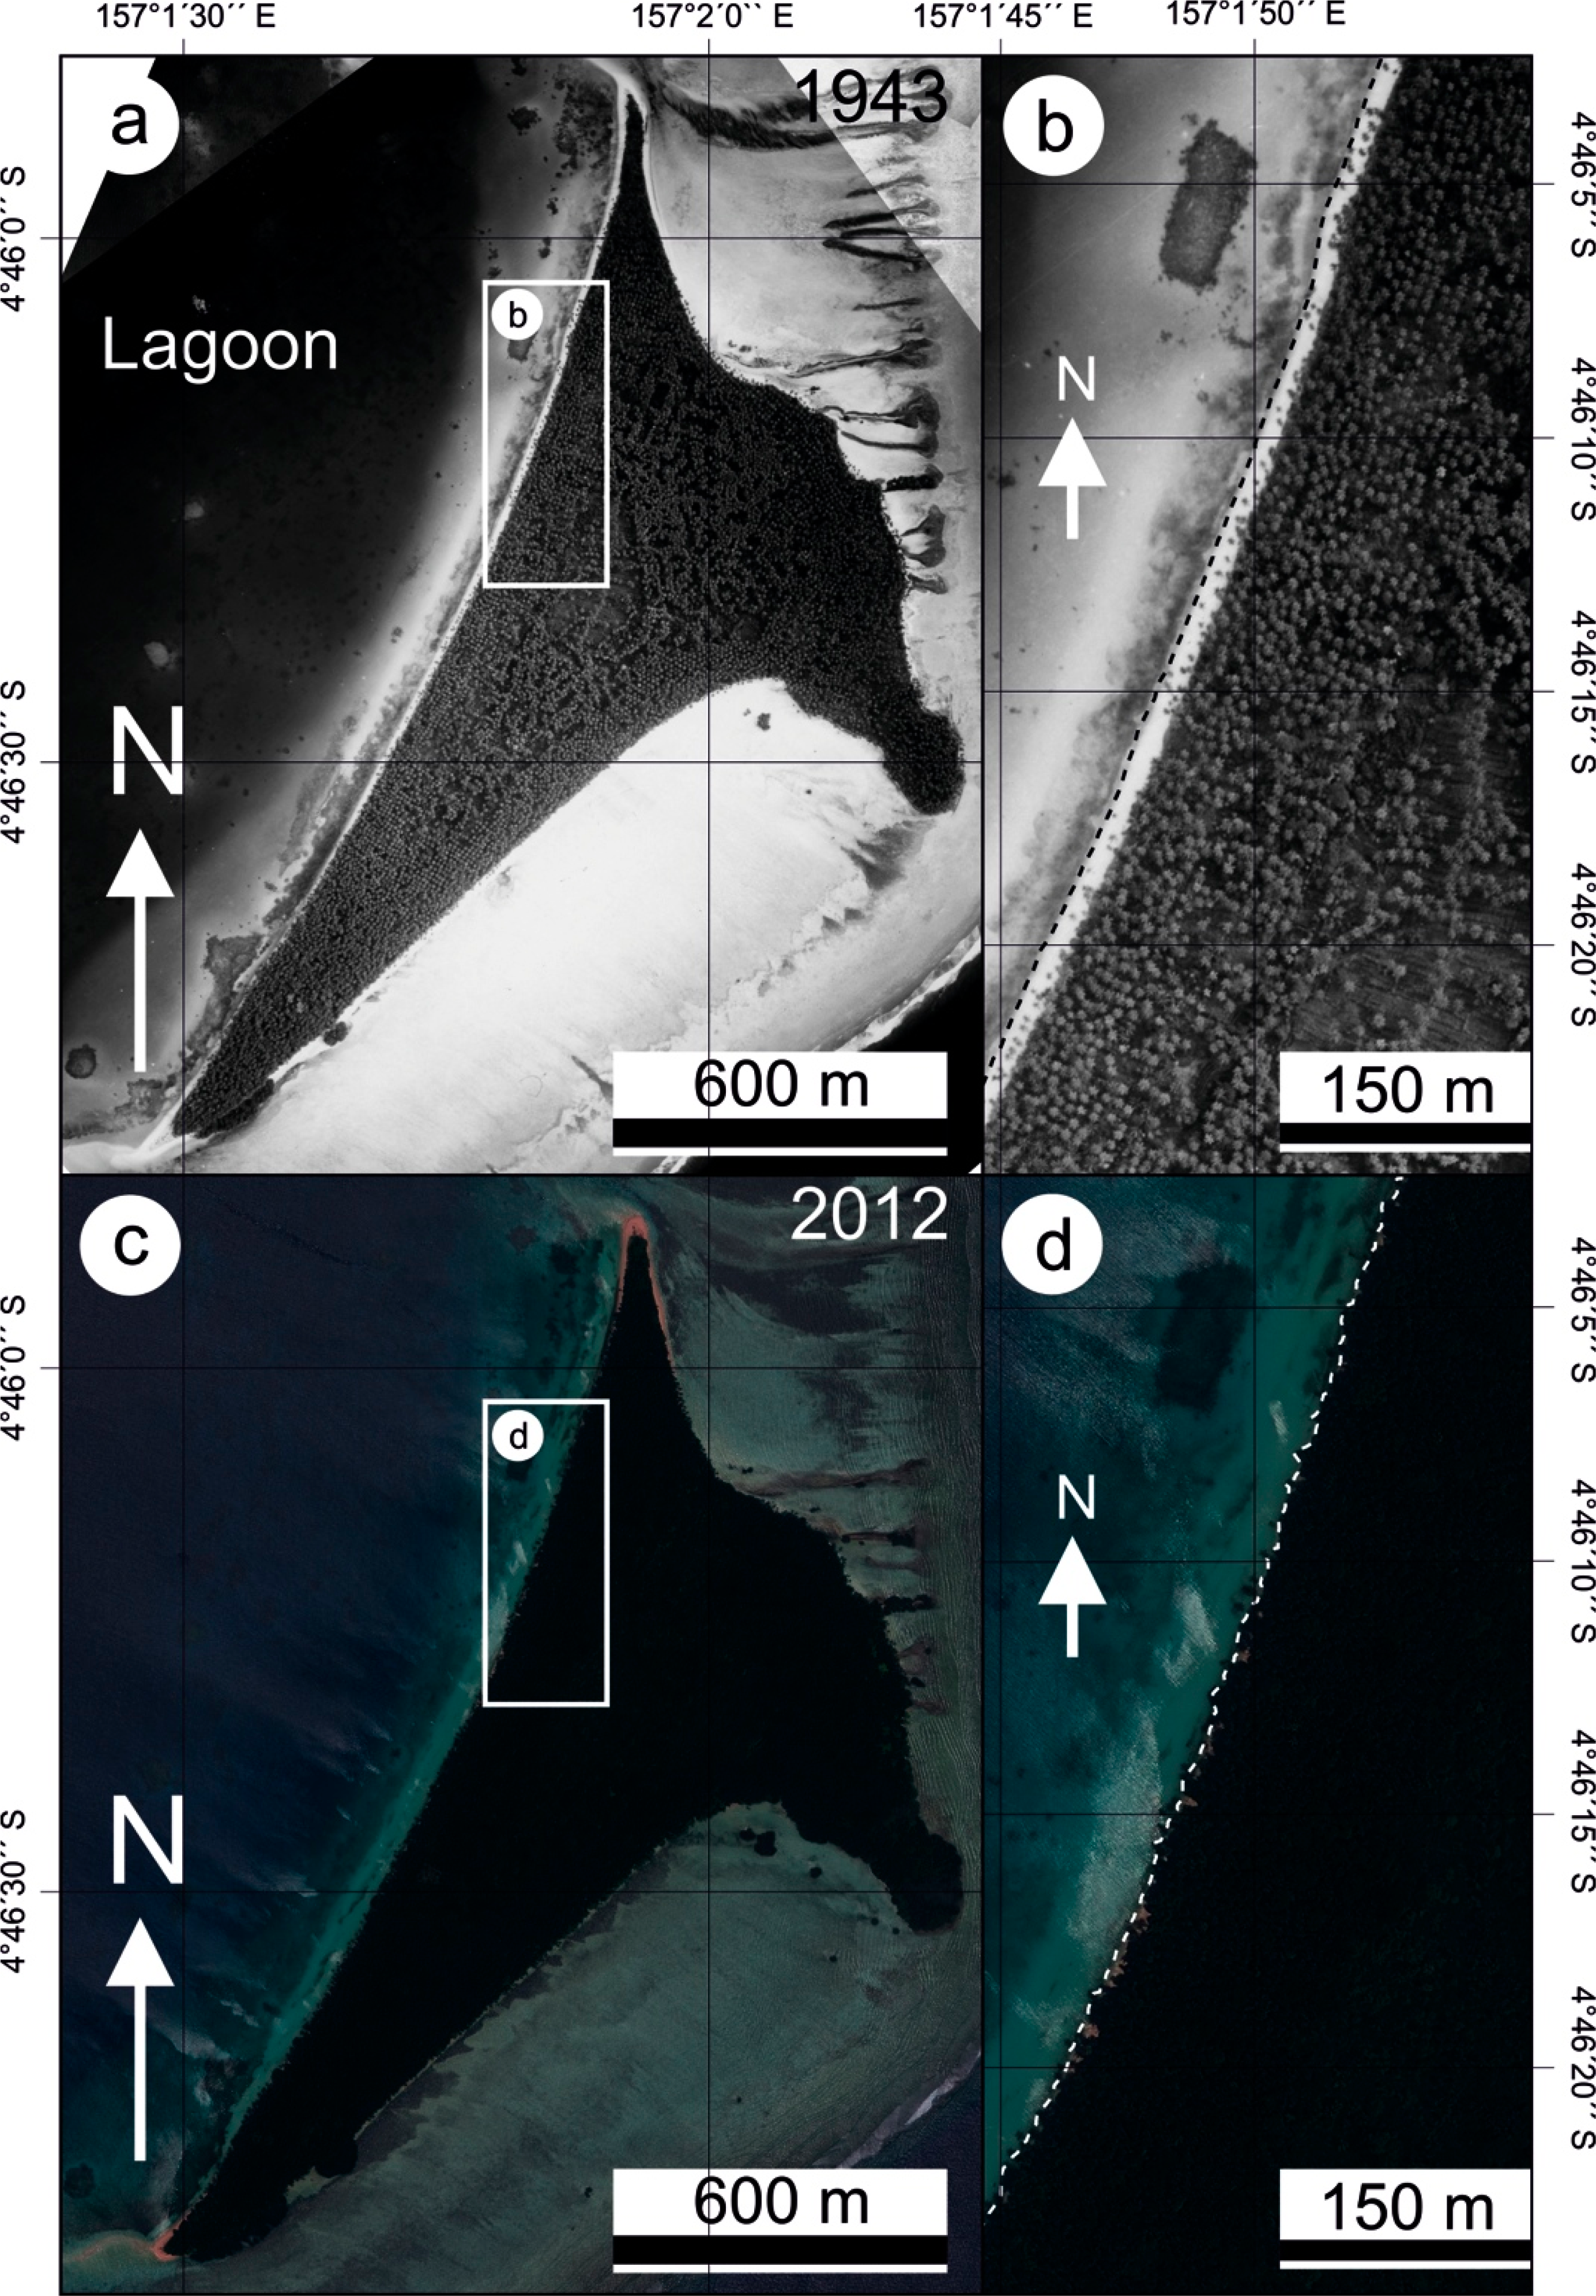
The beaches are largely confined to the lagoonward island rims with minor occurrences at the oceanward sides (Figure 6). Only the 1943 aerial photographs of the triangular islands Takú and Nukutoa show an additional narrow beach along large portions of the oceanward shores (Figures 7a,b and 8a,b). We highlight that, on recent satellite images (2003–2012) these beaches have virtually disappeared (Figures 7c,d and 8c,d). Similar patterns of a reduction in beach width are observable for other islands, where the lagoonward beaches appear less pronounced on the satellite images. On the other hand, some islands apparently are less affected by changes in beach width along the straight lagoonward shoreline (Figure 6 and Figure S1).
Sand spits attached to the northwestern and southwestern island edges are directed towards the lagoon and greatly vary in both size and shape (Figure 6 and Figure S1). Spit dimensions fluctuate considerably thus causing temporary shifts of the ToB up to a hundred meters and more (Figures 9 and 11). As a result, all studied islands on Takú Atoll exhibit remarkable changes in beach area that can amount to a multiple of the planform beach area of the preceding season (Table S1).
3.2. Long-Term Trends of Shoreline Change
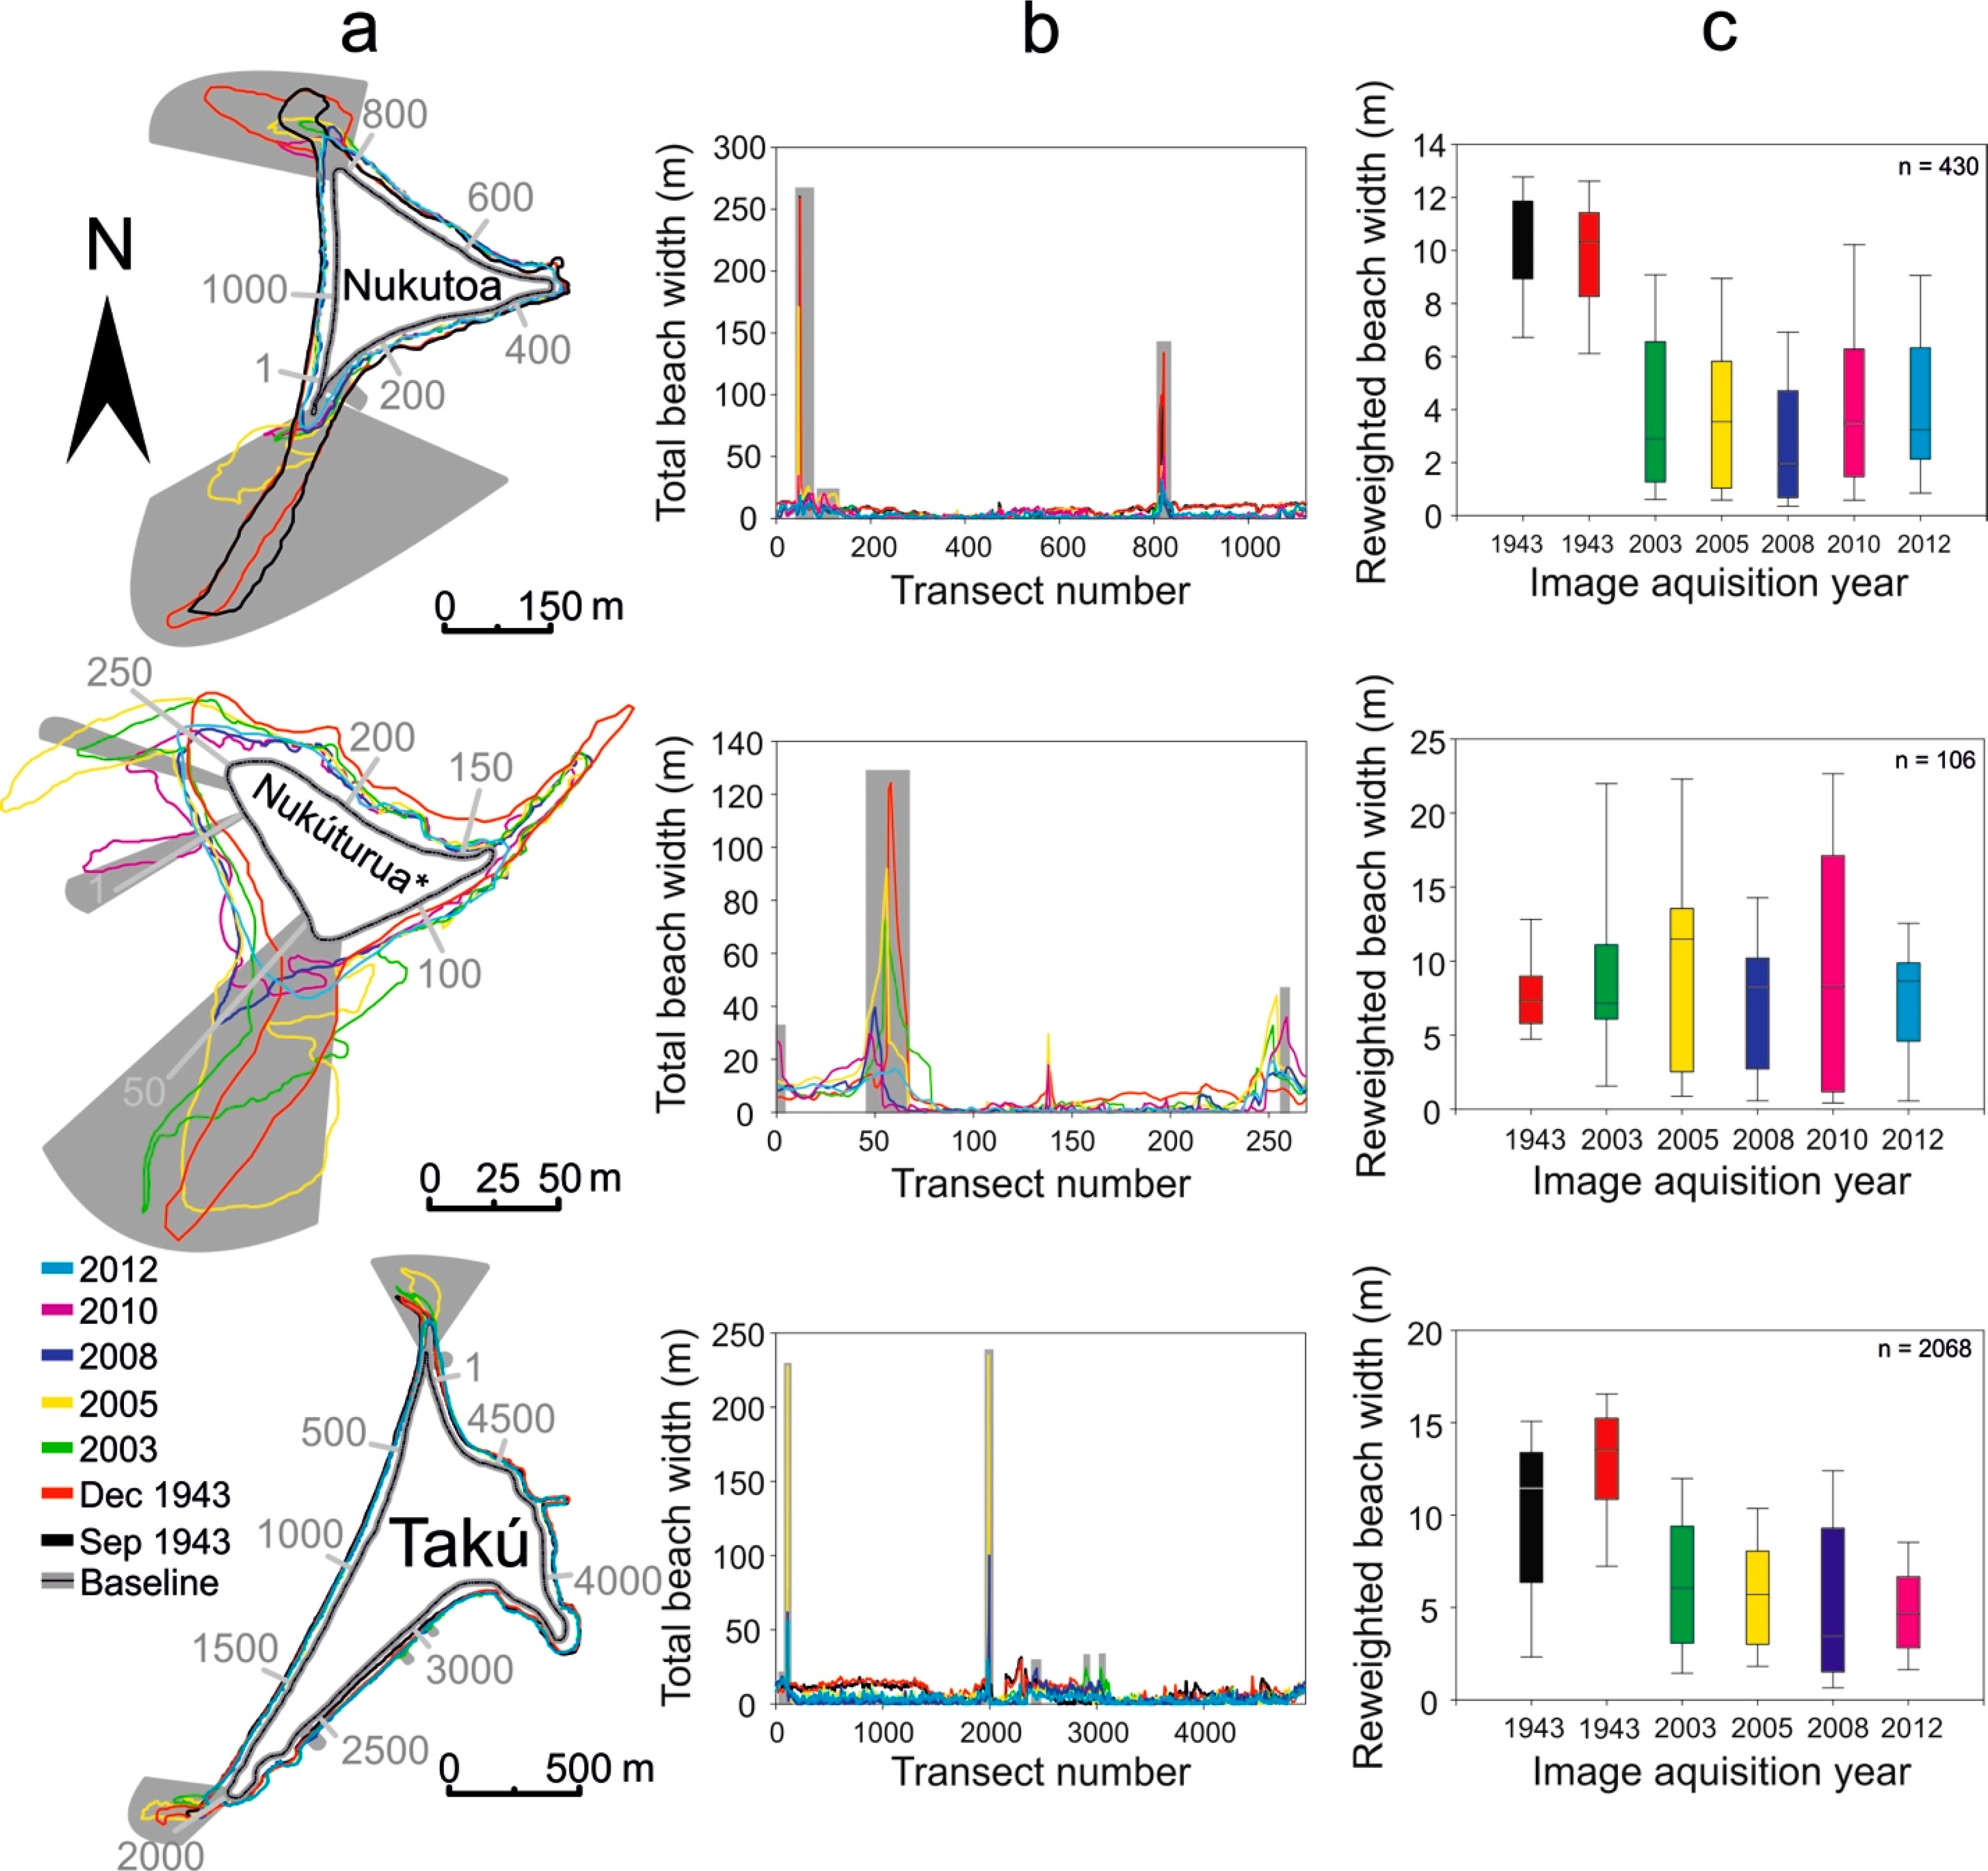
The results indicate a decrease in reweighted (median) beach widths with an average decline of 4.7 m since 1943 (Figures 9 and 11). Farafatu, Kapeiatu, Maturi and Nukutoa islands show a significant reduction in beach width at the interquartile range (Q0.75–Q0.25) from 1943 to 2003. When the whole time span (1943–2012) is considered, it appears that some of the detected changes in reweighted beach width could be due to short-term beach variability in the data set that is not detected by data weighting. Continuous significant differences for all analyzed time periods are observable for Farafatu, Maturi (except for a prominent outlier in 2005) and Nukutoa. This corresponds to 33% of all analyzed islands.
Table 3 summarizes the changes in beach area for studied islands, after extreme shoreline positions were removed (i.e., reweighted beach area). Except for Nukúturua, all islands decreased in reweighted beach area from 1943 to 2003. It is clear that the reweighted beach areas from 2003 to 2012 show some considerable percentage changes due to natural beach variability. However, the diminishment from 1943 to 2003 resulted in an important reduction of the reweighted beach areas for most islands (89%) and consequently, percentage changes of reweighted beach areas from 2003 to 2012 represent small absolute changes. In total, 44% of the 1943 beaches disappeared by the early 21st century.
The values for averaged significant WLR rates indicate that different proportions of the islands are affected by statistically significant erosion and accretion (Table 4). WLR rates range from −0.29 ± 0.28 m/year (Kapeiatu) to +0.09 ± 0.10 m/year (Takú) and show that more than half of the investigated islands (56%) show statistically significant overall erosion.
4. Discussion
The results clearly show that all islands experienced large changes in shoreline position and beach area from 1943 to 2012. Concise sand lobes extending almost exclusively from the lagoonward arcuate island edges exhibit morphological characteristics that are largely comparable between the individual islands. It is conspicuous that the evolution of these sand lobes does not follow a one-way trend (i.e., long-term erosion or accretion), but rather appear to oscillate. Some of the narrow beaches along the straight lagoon- and oceanward shorelines also indicate changes over time. However, the different magnitudes of shoreline change between the straight and the arcuate shoreline sectors indicate that islands on Takú Atoll are affected by a combination of different driving mechanisms as given in Table 1.
4.1. Driving Mechanisms of Extreme Shoreline Positions
Large storms or seasonal variations within local climatic conditions may result in extreme shoreline repositioning of mobile beaches [48]. Extreme shoreline positions bias the calculation of reliable long-term trends. Therefore, they need to be either corrected by field measurements [48] or removed from the raw data [43,49]. On Maui, Hawaii, Fletcher et al. [43] showed that the removal of extreme shoreline positions improves the calculation of long-term shoreline trends. On Takú Atoll, extreme shoreline positions show large variability in beach width, but remain largely localized in well-defined parts of the islands. Gourlay [5] noted that the shoreline orientation of coral reef islands is influenced by cyclones and climate variations (i.e., changing wind directions). Flood [6] argued that wind directions fluctuate as a result of long-term climatic oscillations such as a change in the predominant wind direction, the occurrence of cyclones and seasonal variations. Wind data for Takú Atoll do not indicate a long-term shift in wind direction [40], and tropical cyclones are uncommon between 5°N and 5°S [50]. There is no indication or anecdotal evidence that Takú Atoll was affected by waves caused by individual storms or cyclones between 1910 and 1967 [13,21]. Since the interception of meteorological monitoring in 1991, the highest wind speed recorded in the study area was ca. 12 m/s [40] and in the database of historical cyclones (1906 to present) from the Australian Bureau of Meteorology [51] only four cyclones (195960_01, 1959; Ida, 1972; Hannah, 1972; Hope, 1976) are recorded within a radius of 200 km from Takú Atoll, all of them lower than category one (i.e., a tropical depression). Consequently, it is assumed that the shorelines on the remote sensing data used in this study are unaffected by important geomorphological changes due to single high-energy events that occurred immediately prior to image acquisition.
Kench and Brander [15], and Kench et al. [16] showed that reef island shorelines in the Maldives dynamically react to seasonal reversals in wind directions and to the resulting incidence of waves and nearshore currents with significant sand deposition at the leeward sides of the islands. The same conclusion has been drawn for Heron Island in the Great Barrier Reef (GBR [52]) and was confirmed for Raine Island, GBR [14]. It should be noted, however, that reef islands in the Maldives are faros (i.e., ring-shaped reefs with infilled lagoon), while Raine Island is a coral cay located on a patch reef behind a barrier reef. Consequently, the sedimentary and hydrodynamic environment may be different to an atoll rim in the open ocean. The images used in this study comprise the ending of each season (May and September–December resp.) and may display the peaks of shoreline displacement from the preceding season. Unfortunately, the temporal resolution of the remote sensing data is too low to allow the detection of seasonal signals. However, in agreement with anecdotal evidence [39], it is known that the amount of sand attached to the islands is different during the different monsoon seasons. Therefore, varyingly extending sand lobes directed towards the lagoon could be explained by the interplay of seasonal climate oscillations and the presence of an annular reef rim that almost completely encloses an extensive lagoon.
4.2. Potential Drivers of Long-Term Change
Kench and Brander [15] and Kench et al. [16] noted that seasonally unaffected sections of reef island shorelines act as sediment bypass zone and show only minor morphological change on seasonal scales. Consequently, transects within these sections of the islands appear to be most appropriate to detect long-term trends of shoreline change. We assume that the reweighted transects approximately correspond to the sediment transfer zones recognized on other atoll islands [15].
4.2.1. Sediment Production
Most islands show a considerable decline in reweighted median beach width from 1943 to 2003. For the study period after 2003, these values are undetermined at the chosen confidence interval. Only Maturi Island shows an unbalanced high value in 2005 (approx. 8 m; Figure 11c). However, it is clear from Table S1 that the amount of sediment temporarily stored on the islands mobile beaches is explicitly larger in 2005 when compared to the other satellite images. Since all islands show this additional input, the observed increase in beach areas cannot result from a redistribution of sediments previously contained on the islands beaches. Kench and Cowell [18] concluded that the annual sediment production of reefs is negligible compared to the total amount of sediment stored on the islands. Hence, the observed accumulation of beach areas in 2005 likely results from the concentration of sediment that was previously distributed across a larger area. This led to the contemporaneous deposition of an extensive sand spit attached to the southwestern edge of Maturi, and a laterally extending narrow strip of sand along the western portion of the straight northern shoreline (Figure 10a). As a result, the SCE suite for Maturi in 2005 is characterized by a large variability in beach width in combination with a nonrecurring deposition pattern. Hence, transects that intersected this nonrecurring sand strip remained in the data set as the related SCE values were within the calculated prediction interval. This distinct beach strip apparently does not reflect long-term trends of shoreline change. Therefore, in order to make valid estimations about long-term trends, it is of particular importance to compare the results with a set of additional satellite images as in this study with the other 2000’s images.
4.2.2 Sea-Level Extremes: Tsunamis, Distant-Source Wave Events and El Niño/Southern Oscillation (ENSO)
No indications were found that waves generated by a tsunami event affected the islands on Takú Atoll, neither anecdotal nor in the literature or in online databases [53] even though Takú Atoll is located close the highly active convergent boundary between the Pacific and Australian Plates. There are also no indications of the impact of local tsunamis created e.g., by landslides and volcanoes. For other atoll islands it has been shown that horizontal geomorphic changes following a tsunami are small compared to seasonally induced variations [19,20].
A combination of spring tides (highest astronomical tide), ENSO and distant storms induce large waves that affect Takú Atoll about every 30 years [54]. The latest so-called king tide happened in December 2008 and Smithers and Hoeke [21] showed that such events are capable of producing thick sand depositions on Nukutoa, building up the island. The satellite image from May 2008, however, does not show any significant difference to the post-event image from October 2010.
Solomon and Forbes [22] argue that shoreline erosion and accretion in Tarawa Atoll, Kiribati, are controlled by ENSO-related changes in sea-level and climate. La Niña years are known to result in a higher sea level in the western tropical Pacific [55]. At the end of the year in question here, 1943, there were neutral conditions or a moderate La Niña event according to the multivariate ENSO index [56]. According to the Oceanic Niño Index, the 2003 to 2012 period experienced both La Niña events and neutral conditions. Therefore, a direct relationship between ENSO and planform shoreline changes on Takú Atoll cannot be assessed on the database studied here but remain a possible influence.
4.2.3. Sea-Level Rise
Numerous studies have related atoll island shoreline erosion of the past decades to the rise in sea level [32,35,57,58]. A potential relationship between island stability and sea level is also implied by findings that relate atoll island evolution with the late stages of the Holocene transgression [59–61]. For continental coastlines and larger islands, local long-term sea-level measurements and continuously captured remote sensing data are more often available than for remote atolls due to the shortage of capacity on many small islands. Well-covered areas provide good prerequisites to investigate a potential relationship between sea-level rise and coastal change. Published results are nevertheless ambiguous in this respect and still a matter of scientific debate [29,62–64]. The morphological response of atoll islands to a rise in ambient sea level is unresolved as well.
Previous studies on shoreline changes on atoll islands from other regions (Tuvalu, Kiribati, Marshall Islands, Federated States of Micronesia, French Polynesia) reported of a variety of planform shoreline changes, implying that climate-related sea-level rise is currently not the main control on recent-past shoreline variability [11,33,34]. These studies focused on the island cores stabilized by vegetation, not considering the mobile and unconsolidated beaches in detail. In this study, movements of the ToB and rates of ToB change are different on the individual islands with considerable short-term variability (Figures 9 and 11, Table 4). Sea-level rise however is uniform on atoll scale, and we do not see a consistent pattern of shoreline change that could be unequivocally related to sea-level rise.
Shoreline changes on Takú Atoll seem to be more strongly influenced by a local control. The islands differ strongly in size (Figure 1c). The largest islands, Nukutoa and Takú, are located on the southernmost end of the eastern reef rim. As there is a year-round surface current from the north in this region, this indicates that sediment redistribution on Takú Atoll could be affected by long-shore transport as observed for other atolls [23].
4.2.4. Anthropogenic Shoreline Modifications
Nukutoa Island is densely populated (400 persons/km2 [38]) and has developed considerably since 1943. In many atoll communities, sand is mined locally as a basic material for construction [35]. Sand has been transported by the local population from the smaller islets to Nukutoa as cover for floors in the houses and the paths in the village [37]. Furthermore, ancestral inhabitants of Takú Atoll may have redistributed large quantities of sand and thereby modified the topography of Nukutoa Island [21]. Hence, the amplification of erosion along some beaches by sand mining is very likely.
A common response of island populations to shoreline erosion is the construction of seawalls [35]. On Nukutoa, the seawalls constructed in the 1970s provoked an accelerated loss of sandy beaches (Figure 2a–d). Previous studies have analyzed the interaction between seawalls and the fronting beach on continental coastlines [65,66]. In general, the process underlying sand mobilization in front of a seawall is the result of concentrated wave energy in a now smaller area and a higher wave energy of reflected waves that cause an offshore-directed cross-shore transport of sediment [67–69]. Beach erosion in front of seawalls has also been identified for atoll islands such as the Carteret Islands, PNG [26] and on Fiji [27]. Our results show that reweighted beach width on Nukutoa declined from roughly 10 m in 1943 to about 3 m at least since 2003. In agreement with anecdotal evidence, this observation can be best explained by the presence of seawalls in front of the vegetation limit.
4.2.5. Study Limitations
Although our approach proved capable of detecting long-term changes in beach width, few limitations must be highlighted. On the 1943 air photo, Nukuáhare is observed as one coherent island whereas the satellite images show a bipartite island, the single parts connected by a sand tombolo. This morphological change precluded the applicability of DSAS with our method. Occasionally, it was difficult to differentiate between suspended and deposited sediment at the tips of the sand spits, also when taking into consideration the individual imaging band combinations. Suspended sand can be attributed to daily occurrences such as tidal cycles [25]. However in December 2008, Smithers mapped the ToB on Nukutoa Island using a high-precision global positioning system [21]. A careful visual inspection of the course of the ToB in their Figure 1 revealed that the digitized shorelines in this study are realistic for Nukutoa Island. For this reason, we expect that the vectorized shorelines of the other studied islands are also reliable. WLR rates of ToB change show statistically significant beach erosion for some islands (Table 4). This indicates that the observed reduction in beach width does not result from a seaward migration of the edge of vegetation. Yet the reduction may partly correspond to overwash processes. Further studies could involve digital close-range photogrammetric techniques or, if available for the particular study site, active remote sensing technology (e.g., LiDAR) in order to quantify changes in the sediment volume.
5. Conclusions
Sandy beaches surrounding small tropical islands are among the most dynamic parts of atoll environments, some sections evolving at a rapid pace as reaction to seasonal variability and high-energy events. These natural oscillations result in considerable changes in the position of the toe of the beach. Additionally, high-quality remote sensing data prior to the advent of modern satellite images are rare for many Pacific atolls. Shoreline change analysis with the toe of beach as reference line and based on the evaluation of remotely sensed images need to include these aspects. In this paper, a new method is presented that excludes “outlier” shoreline positions for sparse data sets with large temporal gaps. The resulting reweighted sections of the beach yielded statistically distinguishable trends. This additional measure can be combined with other statistically robust parameters such as a weighted linear regression in order to gain more information about the long-term evolution of the highly dynamic beach environment.
We quantify planimetric beach loss among nine islands on the eastern flank of Takú Atoll over a time span of almost 70 years. Forty-four percent of the analyzed islands show a significant reduction in beach width on the interquartile range from 1943 to 2003 with an average decline in median reweighted beach width of 4.7 m since 1943. Short-term data (2003–2012) provide valuable information on natural beach variability and allows for the verification of an end-point analysis (1943–2003). In this study, a permanent and statistically significant reduction in reweighted beach width is observed for Farafatu, Maturi and Nukutoa islands. The reweighted beach area that disappeared in the time interval studied approximates 1.8 hectares, thus representing a decrease of 44% of the initial (1943) reweighted beach area. Weighted linear regression rates of shoreline change show that 56% of the analyzed islands display statistically significant erosion. In combination with the reduction in reweighted beach width and reweighted beach area, this reveals the critical need for a continued monitoring of this remote atoll.
Previous studies used the vegetation boundary as shoreline proxy to filter out short-term shoreline dynamics, assuming that the edge of vegetation follows the long-term trend of the land-or seaward movement of the toe of beach. To decipher different signals, if there are any, between the different shoreline proxies (edge of vegetation and toe of beach), future studies can take up our results and compare them to the outcomes of a multi-decadal shoreline change analysis based on the edge of vegetation.
The morphological response of atoll islands to changing boundary controls is not fully understood and likely to differ, even on the atoll scale. Therefore, it is fundamental to understand the present state of island persistence in its entirety and transferring this knowledge to local authorities is of eminent importance for future adaptation strategies to be effective. Our results show that statistically significant beach morphodynamics on atoll islands can be detected on the basis of remotely sensed images despite the temporal gap of the underlying database. The results have important implications for the systematic monitoring of remote atoll islands in the future and are applicable to other atolls with similar environmental and geological conditions.
Supplementary Information
remotesensing-06-06961-s001.docxAcknowledgments
John R. Hunter, University of Tasmania is gratefully acknowledged for providing valuable information about the morphological and social-ecological situation on Takú Atoll. Thanks are also due to the other contributors to the Takú film project, Scott Smithers, Briar March, Lyn Collie and John Gibson. Tim Bayliss-Smith, University of Cambridge, UK, helped to identify the archive in Honolulu where the historical aerial photographs of Takú Atoll are stored and kindly provided literature from his own library. Tia Reber helped to locate the aerial photographs in the archives of the Bishop Museum, Honolulu. Richard Moyle, University of Auckland and Mike Bourke, Australian National University, helped to gather important information on living conditions of Takú inhabitants. Many thanks to Alessio Rovere (ZMT and Marum, University of Bremen) for fruitful discussions and for reading through an earlier version of this paper. The manuscript benefited from thorough and constructive comments of three anonymous reviewers. This study is part of the Takú interdisciplinary project in collaboration with the ZMT Leibniz Chair, anthropologist Bettina Beer, University of Lucerne. The project was funded by the Leibniz Center for Tropical Marine Ecology.
Author Contributions
Hildegard Westphal conceived the project; Hildegard Westphal and Thomas Mann designed the research; Thomas Mann analyzed data, performed research and prepared figures; Hildegard Westphal and Thomas Mann wrote the manuscript.
Conflicts of Interest
The authors declare no conflict of interest.
References
- Bird, E. World-wide trends in sandy shoreline changes during the past century. Géogr. Phys. Quat 1981, 35, 241–244. [Google Scholar]
- Eurosion. Living with Coastal Erosion in Europe: Sediment and Space for Sustainability. A Guide to Coastal Erosion Management Practices in Europe: Lessons Learned. Service Contract B4–3301/2001/329175/MAR/B3 “Coastal Erosion—Evaluation of the Need for Action”; 2004; p. 164, Available online: http://www.eurosion.org/reports-online/reports.html (accessed on 29 June 2013).
- NRC. Managing Coastal Erosion; The National Academies Press: Washington, DC, USA, 1990. [Google Scholar]
- Stoddart, D.R.; Steers, J.A. The nature and origin of coral reef islands. In Biology and Geology of Coral Reefs; Academic Press: New York, NY, USA, 1977; Volume 4, pp. 59–105. [Google Scholar]
- Gourlay, M.R. Coral cays: Products of wave action and geological processes in a biogenic environment. In Proceedings of the 6th International Coral Reef Symposium, Townsville, Australia, 8–12 August 1988; 2, pp. 491–496.
- Flood, P.G. Sensivity of coral cays to climate variations, southern Great Barrier Reef, Australia. Coral Reefs 1986, 5, 13–18. [Google Scholar]
- Mandlier, P.G.; Kench, P.S. Analytical modeling of wave refraction and convergence on coral reef platforms: Implications for island formation and stability. Geomorphology 2012, 159–160, 84–92. [Google Scholar]
- Sheppard, C.; Dixon, D.J.; Gourlay, M.; Sheppard, A.; Payet, R. Coral mortality increases wave energy reaching shores protected by reef flats: Examples from the Seychelles. Estuar. Coast. Shelf Sci 2005, 64, 223–234. [Google Scholar]
- Ferrario, F.; Beck, M.W.; Storlazzi, C.D.; Micheli, F.; Shepard, C.C.; Airoldi, L. The effectiveness of coral reefs for coastal hazard risk reduction and adaptation. Nat. Commun 2014, 5, 3794. [Google Scholar]
- Saunders, M.I.; Leon, J.X.; Callaghan, D.P.; Roelfsema, C.M.; Hamylton, S.; Brown, C.J.; Baldock, T.; Golshani, A.; Phinn, S.R.; Lovelock, C.E.; et al. Interdependency of tropical marine ecosystems in response to climate change. Nat. Clim. Chang 2014. in press.. [Google Scholar]
- Webb, A.P.; Kench, P.S. The dynamic response of reef islands to sea-level rise: Evidence from multi-decadal analysis of island change in the Central Pacific. Glob. Planet. Chang 2010, 72, 234–246. [Google Scholar]
- Perry, C.T.; Kench, P.S.; Smithers, S.G.; Riegl, B.; Yamano, H.; O’Leary, M.J. Implications of reef ecosystem change for the stability and maintenance of coral reef islands. Glob. Chang. Biol 2011, 17, 3679–3696. [Google Scholar]
- Bayliss-Smith, T.P. The role of hurricanes in the development of reef islands, Ontong Java Atoll, Solomon Islands. Geogr. J 1988, 154, 377–391. [Google Scholar]
- Dawson, J.L.; Smithers, S.G. Shoreline and beach volume change between 1967 and 2007 at Raine Island, Great Barrier Reef, Australia. Glob. Planet. Chang 2010, 72, 141–154. [Google Scholar]
- Kench, P.; Brander, R. Response of reef island shorelines to seasonal climate oscillations: South Maalhosmadulu atoll, Maldives. J. Geophys. Res 2006, 111, 1–12. [Google Scholar]
- Kench, P.S.; Parnell, K.E.; Brander, R.W. Monsoonally influenced circulation around coral reef islands and seasonal dynamics of reef island shorelines. Mar. Geol 2009, 266, 91–108. [Google Scholar]
- Samosorn, B.; Woodroffe, C.D. Nearshore wave environments around a sandy cay on a platform reef, Torres Strait, Australia. Cont. Shelf Res 2008, 28, 2257–2274. [Google Scholar]
- Kench, P.S.; Cowell, P.J. Variations in sediment production and implications for atoll island stability under rising sea level. Proceedings 9th International Coral Reef Symposium, Bali, Indonesia, 23–27 October 2000; 2.
- Kench, P.S.; Nichol, S.L.; Smithers, S.G.; McLean, R.F.; Brander, R.W. Tsunami as agents of geomorphic change in mid-ocean reef islands. Geomorphology 2008, 95, 361–383. [Google Scholar]
- Kench, P.S.; McLean, R.F.; Brander, R.W.; Nichol, S.L.; Smithers, S.G.; Ford, M.R.; Parnell, K.E.; Aslam, M. Geological effects of tsunami on mid-ocean atoll islands: The Maldives before and after the Sumatran tsunami. Geology 2006, 34, 177–180. [Google Scholar]
- Smithers, S.G.; Hoeke, R.K. Geomorphological impacts of high-latitude storm waves on low-latitude reef islands—Observations of the December 2008 event on Nukutoa, Takuu, Papua New Guinea. Geomorphology 2014. in press.. [Google Scholar]
- Solomon, S.M.; Forbes, D.L. Coastal hazards and associated management issues on South Pacifc Islands. Ocean Coast. Manag 1999, 42, 523–554. [Google Scholar]
- Collen, J.D.; Garton, D.W.; Gardner, J.P.A. Shoreline Changes and Sediment Redistribution at Palmyra Atoll (Equatorial Pacific Ocean): 1874-Present. J. Coast. Res 2009, 25, 711–722. [Google Scholar]
- Kench, P.S.; Cowell, P.J. The morphological response of atoll islands to sea-level rise . Part 2: Application of the modified shoreface translation model (STM). J. Coast. Res 2000, 34, 645–656. [Google Scholar]
- Vila-Concejo, A.; Harris, D.; Power, H. Sediment transport and mixing depth on a coral reef sand apron. Geomorphology 2014. in press.. [Google Scholar]
- Connell, J. The Carteret Islands: Precedents of the Greenhouse effect. Geography 1990, 75, 152–154. [Google Scholar]
- Mimura, N.; Nunn, P.D. Trends of beach brosion and shoreline protection in rural Fiji. J. Coast. Res 1998, 14, 37–46. [Google Scholar]
- Kench, P.S.; Parnell, K.E.; Brander, R.W. A process based assessment of engineered structures on reef islands of the Maldives. In Proceedings of 2003 Coasts & Ports Australasian Conference, Auckland, New Zealand, 9–12 September 2003; pp. 1–10.
- List, J.H.; Sallenger, A.H.J.; Hansen, M.E.; Jaffe, B.E. Accelerated relative sea-level rise and rapid coastal erosion: Testing a causal relationship for the Louisiana barrier islands. Mar. Geol 1997, 140, 347–365. [Google Scholar]
- Romine, B.M.; Fletcher, C.H.; Barbee, M.M.; Anderson, T.R.; Frazer, L.N. Are beach erosion rates and sea-level rise related in Hawaii? Glob. Planet. Chang 2013, 108, 149–157. [Google Scholar]
- Boak, E.H.; Turner, I.L. Shoreline definition and detection: A Review. J. Coast. Res 2005, 214, 688–703. [Google Scholar]
- Barnett, J.; Adger, W.N. Climate dangers and atoll countries. Clim. Chang 2003, 61, 321–337. [Google Scholar]
- Ford, M.R. Shoreline changes interpreted from multi-temporal aerial photographs and high resolution satellite images: Wotje Atoll, Marshall Islands. Remote Sens. Environ 2013, 135, 130–140. [Google Scholar]
- Yates, M.L.; Cozannet, L.G.; Garcin, M.; Sala, E.; Walker, P. Multidecadal Atoll Shoreline Change on Manihi and Manuae, French Polynesia. J. Coast. Res 2013, 29, 870–882. [Google Scholar]
- Leatherman, S.P.; Beller-Simms, N. Sea-level rise and small island states: An overview. J. Coast. Res 1997, 24, 1–16. [Google Scholar]
- UNESCO. Island Agenda. An Overview of UNESCO’s Work on Island Environments, Territories, and Societies; UNESCO: Paris, France, 1994; p. 130. [Google Scholar]
- Moyle, R.M. Songs from the Second Float: A Musical Ethnography of Takú Atoll, Papua New Guinea; Pacific Islands Monograph Series 21; Hanlon, D., Rensel, J., Eds.; University of Hawaii Press: Honolulu, HI, USA, 2007; p. 307. [Google Scholar]
- Bourke, R.; Betitis, T. Sustainability of Agriculture in Bougainville Province Papua New Guinea; Australian National University: Canberra, ACT, Australia, 2003; p. 109. [Google Scholar]
- Hunter, J.R. Personal Communication. University of Tasmania, Hobart, TAS, Australia. 2013.
- National Oceanic and Atmospheric Administration (NOAA) & Pacific Marine Environmental Laboratory (PMEL). Tropial Atmosphere Ocean Project. Available online: http://www.pmel.noaa.gov/tao/data_deliv/deliv.html (accessed on 16 April 2013).
- Thieler, E.R.; Himmelstoss, E.A.; Zichichi, J.L.; Ergul, A. The Digital Shoreline Analysis System (DSAS) Version 4.0—An ArcGIS Extension for Calculating Shoreline Change, U.S. Geological Survey Open-File Report 2008-1278 v 4.2; 2009. Available online: http://woodshole.er.usgs.gov/project-pages/DSAS/version4/ (accessed on 8 July 2013).
- Ford, M.R. Shoreline changes on an urban atoll in the central Pacific Ocean: Majuro Atoll, Marshall Islands. J. Coast. Res 2011, 28, 11–22. [Google Scholar]
- Fletcher, C.; Rooney, J.; Barbee, M.; Siang-Chy, L.; Richmond, B. Mapping shoreline change using digital orthophotogrammetry on Maui, Hawaii. J. Coast. Res 2003, 38, 106–124. [Google Scholar]
- Limpert, E.; Stahel, W.A.; Abbt, M. Log-normal distributions across the sciences: Keys and clues. Bioscience 2001, 51, 341–352. [Google Scholar]
- Moore, L.J. Shoreline Mapping Techniques. J. Coast. Res 2000, 16, 111–124. [Google Scholar]
- Crowell, M.; Leatherman, S.P.; Buckley, M.K. Historical shoreline change: Error analysis and mapping accuracy *. J. Coast. Res 1991, 7, 839–852. [Google Scholar]
- Thieler, E.R.; Danforth, W.W. Historical shoreline mapping (I): Improving techniques and reducing positioning errors. J. Coast. Res 1994, 10, 549–563. [Google Scholar]
- Honeycutt, M.G.; Crowell, M.; Douglas, B.C. Shoreline-position forecasting: Impact of storms, rate-calculation methodologies, and temporal scales. J. Coast. Res 2001, 17, 721–730. [Google Scholar]
- Douglas, B.C.; Crowell, M. Long-term shoreline position prediction and error propagation. J. Coast. Res 2000, 16, 145–152. [Google Scholar]
- Henderson-Sellers, A.; Zhang, H.; Berz, G.; Emanuel, K.; Gray, W.; Landsea, C.; Holland, G.; Lighthill, J.; Shieh, S.-L.; Webster, P.; McGuffie, K. Tropical Cyclones and Global Climate Change: A Post-IPCC Assessment. Bull. Am. Meteorol. Soc 1998, 79, 19–38. [Google Scholar]
- Australian Bureau of Meteorology. Tropical Cyclone Information for the Australian Region. Available online: http://www.bom.gov.au/cgi-bin/silo/cyclones.cgi (accessed on June 16 2013).
- Flood, P.G. Sand movements on Heron Island, a vegetated sand cay, Great Barrier Reef Province, Australia. In Proceedings of the 2nd International Coral Reef Symposium, Brisbane, Australia, 22 June–2 July 1974; pp. 387–394.
- Natural Hazards Data Images Education. Available online: http://www.ngdc.noaa.gov/hazard/tsu.shtml (accessed on 20 August 2013).
- Hoeke, R.K.; McInnes, K.L.; Kruger, J.C.; McNaught, R.J.; Hunter, J.R.; Smithers, S.G. Widespread inundation of Pacific islands triggered by distant-source wind-waves. Glob. Planet. Chang 2013, 108, 128–138. [Google Scholar]
- Becker, M.; Meyssignac, B.; Letetrel, C.; Llovel, W.; Cazenave, A.; Delcroix, T. Sea level variations at tropical Pacific islands since 1950. Glob. Planet. Chang 2012, 80–81, 85–98. [Google Scholar]
- Wolter, K.; Timlin, M.S. El Niño/Southern Oscillation behavior since 1871 as diagnosed in an extended multivariate ENSO index (MEI.e xt). Int. J. Climatol 2011, 31, 1074–1087. [Google Scholar]
- Mimura, N. Vulnerability of island countries in the South Pacific to sea level rise and climate change. Clim. Res 1999, 12, 137–143. [Google Scholar]
- Dickinson, W. Holocene sea-level record on Funafuti and potential impact of global warming on central Pacific atolls. Quat. Res 1999, 51, 124–132. [Google Scholar]
- Kench, P.S.; Smithers, S.G.; McLean, R.F. Rapid reef island formation and stability over an emerging reef flat: Bewick Cay, northern Great Barrier Reef, Australia. Geology 2012, 40, 347–350. [Google Scholar]
- Kench, P.S.; McLean, R.F.; Nichol, S.L. New model of reef-island evolution: Maldives, Indian Ocean. Geology 2005, 33, 145–148. [Google Scholar]
- Woodroffe, C.D.; Mclean, R.F.; Smithers, S.G.; Lawson, E.M. Atoll reef-island formation and response to sea-level change: West Island, Cocos (Keeling) Islands. Mar. Geol 1999, 160, 85–104. [Google Scholar]
- Leatherman, S.P.; Zhang, K.; Douglas, B.C. Sea level rise shown to drive coastal erosion. Eos, Trans. Am. Geophys. Union 2000, 81, 55–57. [Google Scholar]
- Brunel, C.; Sabatier, F. Potential influence of sea-level rise in controlling shoreline position on the French Mediterranean Coast. Geomorphology 2009, 107, 47–57. [Google Scholar]
- Cazenave, A.; Cozannet, G. Le Sea level rise and its coastal impacts. Earth’s Future 2013, 2, 15–34. [Google Scholar]
- Kraus, N.C. The effects of seawalls on the beach: An extended literature review. J. Coast. Res 1988, 4, 1–28. [Google Scholar]
- Kraus, N.C.; McDougal, W.G. The effects of seawalls on the beach: Part I, an updated literature review. J. Coast. Res 1996, 12, 691–701. [Google Scholar]
- Tait, J.F.; Griggs, G.B. Beaches Respond to the Presence of a Seawall; Comparison of Field Observations; University of California: Santa Cruz, CA, USA, 1991; p. 63. [Google Scholar]
- Plant, N.G.; Griggs, G.B. Interactions between nearshore processes and beach morphology near a seawall. J. Coast. Res 1992, 8, 183–200. [Google Scholar]
- Everts, C.H. Effects of small protective devices on beaches. Proceedings of California’s Battered Coast, a Conference on Coastal Erosion, San Diego, CA, USA; February 1985; pp. 127–138. [Google Scholar]


| Control on Shoreline Dynamics | Occurrence* | Literature |
|---|---|---|
| Natural
| ||
| Hurricanes and tropical cyclones | yearly | [13,14] |
| Shift in wind direction | decadal | [5,6] |
| Shift in wind direction | daily-seasonal | [15–17] |
| Sediment production | permanent | [18] |
| Tsunamis | unregularly | [19,20] |
| Distant-source wave events | decadal | [21] |
| El Niño/Southern Oscillation | interannually | [22] |
| Longshore sediment transport | permanent | [23] |
| Sea-level rise | permanent | [32,35] |
| Tidal stage | daily | [25] |
| Shore geomorphology | - | [24] |
| Anthropogenic
| ||
| Sand mining | - | [35] |
| Coastal armoring structures | - | [26,27] |
| Beach nourishment | - | [35] |
*Frequency of occurrences is dependent on the location.
| Acquisition Date | Image Type | Imaging Bands | Focal Length (in) | Altitude (ft) | Scale | Pixel Resolution (m) |
|---|---|---|---|---|---|---|
| 18 September 1943 | Aerial photograph b/w | 6 | 2360 | 1:4720 | 0.13 | |
| 6 | 5000 | 1:10,000 | 0.29 | |||
| 11 December 1943 | Aerial photograph b/w | 24 | 10,000 | 1:5000 | 0.24 | |
| 20 September 2003 | QuickBird | 3 bands pansharpened | 0.60 | |||
| 21 July 2005 | QuickBird | 3 bands pansharpened | 0.60 | |||
| 13 May 2008 | WorldView-1 | Panchromatic | 0.50 | |||
| 30 October 2010 | WorldView-1 | Panchromatic | 0.50 | |||
| 10 November 2012 | WorldView-2 | 3 bands pansharpened | 0.50 |
| Island | Reweighted Beach Areas (m2) | |||||||
|---|---|---|---|---|---|---|---|---|
| September 1943 | December 1943 | September 2003 | July 2005 | May 2008 | October 2010 | November 2012 | Net Change | |
| Farafatu | 1916 | 835 (−56) | 791 (−5) | 435 (−45) | 460 (6) | 564 (22) | −1351 (−71) | |
| Kapeiatu | 1847 | 1140 (−38) | 1158 (1) | 991 (−14) | 1304 (31) | 1522 (17) | −324 (−18) | |
| Karuteke | 856 | 508 (−41) | 502 (−1) | 419 (−16) | −436 (−51) | |||
| Latuma | 67 | 58 (−14) | 46 (−20) | 12 (−73) | 10 (−16) | 13 (27) | −54 (−80) | |
| Maturi | 479 | 119 (−75) | 498 (319) | 57 (−88) | 71 (24) | 125 (76) | −354 (−74) | |
| NN1 | 605 | 461 (−24) | 305 (−34) | 149 (−51) | 278 (87) | 326 (17) | −278 (46) | |
| Nukutoa | 3954 | 3973 (0) | 1435 (−64) | 1658 (16) | 1235 (−26) | 1707 (38) | 1504 (−12) | −2449 (−62) |
| Nukúturua | 1008 | 1066 (6) | 1256 (18) | 811 (−35) | 1083 (33) | 817 (−24) | −190 (−19) | |
| Takú | 23,797 | 29,279 (23) | 14,947 (−49) | 13,644 (−9) | 12,440 (−9) | 11,651 (−6) | −12,146 (−51) | |
| Total | −17,583 (−44) | |||||||
| Island | Erosion (%) | Accretion (%) | WLR (m/year) | Confidence Intervals |
|---|---|---|---|---|
| Farafatu | 21.69 | 4.24 | −0.15 | 0.13 |
| Kapeiatu | 5.97 | 4.78 | −0.29 | 0.28 |
| Karuteke | 7.24 | 2.38 | −0.11 | 0.10 |
| Latuma | 18.14 | 7.01 | −0.09 | 0.08 |
| Maturi | 19.44 | 0.69 | −0.09 | 0.06 |
| NN1 | 23.53 | 26.70 | −0.01 | 0.05 |
| Nukutoa | 36.72 | 17.47 | −0.08 | 0.08 |
| Nukúturua | 39.78 | 27.51 | −0.07 | 0.08 |
| Takú | 7.61 | 14.60 | 0.09 | 0.10 |
© 2014 by the authors; licensee MDPI, Basel, Switzerland This article is an open access article distributed under the terms and conditions of the Creative Commons Attribution license (http://creativecommons.org/licenses/by/3.0/).
Share and Cite
Mann, T.; Westphal, H. Assessing Long-Term Changes in the Beach Width of Reef Islands Based on Temporally Fragmented Remote Sensing Data. Remote Sens. 2014, 6, 6961-6987. https://doi.org/10.3390/rs6086961
Mann T, Westphal H. Assessing Long-Term Changes in the Beach Width of Reef Islands Based on Temporally Fragmented Remote Sensing Data. Remote Sensing. 2014; 6(8):6961-6987. https://doi.org/10.3390/rs6086961
Chicago/Turabian StyleMann, Thomas, and Hildegard Westphal. 2014. "Assessing Long-Term Changes in the Beach Width of Reef Islands Based on Temporally Fragmented Remote Sensing Data" Remote Sensing 6, no. 8: 6961-6987. https://doi.org/10.3390/rs6086961