Damage Mapping of Powdery Mildew in Winter Wheat with High-Resolution Satellite Image

Abstract
: Powdery mildew, caused by the fungus Blumeria graminis, is a major winter wheat disease in China. Accurate delineation of powdery mildew infestations is necessary for site-specific disease management. In this study, high-resolution multispectral imagery of a 25 km2 typical outbreak site in Shaanxi, China, taken by a newly-launched satellite, SPOT-6, was analyzed for mapping powdery mildew disease. Two regions with high representation were selected for conducting a field survey of powdery mildew. Three supervised classification methods—artificial neural network, mahalanobis distance, and maximum likelihood classifier—were implemented and compared for their performance on disease detection. The accuracy assessment showed that the ANN has the highest overall accuracy of 89%, following by MD and MLC with overall accuracies of 84% and 79%, respectively. These results indicated that the high-resolution multispectral imagery with proper classification techniques incorporated with the field investigation can be a useful tool for mapping powdery mildew in winter wheat.1. Introduction
Powdery mildew (Blumeria graminis) is a disease mainly infecting winter wheat. It reduces the plant photosynthetic ability resulting in a stunted growth, reduced productivity and poor grain quality [1]. Powdery mildew is one of the major threats to the worldwide wheat production nowadays; however, current approach of detecting this disease mainly relies on manual field scouting and visual assessments which is time-consuming, labor-expensive and spatially-restrictive. Remote sensing, especially the multispectral technology, has become an important alternative to the conventional field scouting for monitoring crop diseases featured with its non-destructive and rapid way of data collection over a large area. An early detection of the infected crop using remote sensing technology offers an optimal timing for fungicide application in crop management; and a post-disease remote sensing provides farmers and insurance companies a rapid damage assessment. Recent development of the remote sensing technology increased the spatial resolution of the satellite/airborne imagery while reducing its cost, which made it feasible for crop detection and mapping.
Plant diseases often induce physiological changes of the plant metabolism causing variations of plant pigment and water contents, as well as the change of plant cell structures [2]. These biological or biophysical changes are the basic reason causing the alteration of plant spectral readings. For instance, the increase of reflectance in the visible bands is associated with the breakdown of the chloroplasts and some visible foliar symptoms [3,4]; whereas the reflectance increase in the mid-infrared and shortwave near-infrared bands could indicate water deficiency [5,6]. Current remote sensing technologies for disease sensing can be categorized into the hyperspectral system and the multispectral system in terms of the spectral bandwidth. Fletcher et al. [7] used airborne digital imagery for detecting Phytophthora foot rot infections on citrus trees. Apan et al. [8] evaluated the potential of Hyperion satellite hyperspectral imagery for detecting the orange rust disease in sugarcane. Although the hyperspectral system gives more detailed information for identifying feature bands responding to particular crop diseases, its high hardware and computational costs prohibit its application over large areas. Recent studies showed the prospect of using multispectral sensing systems with 3–6 broad bands, ranging from visible to near-infrared spectral regions, on crop disease or insect infestation damage mapping over large spatial areas. Zhang et al. [9] demonstrated that the airborne multispectral imagery can be used to detect late blight infestations in tomato fields. Landsat multispectral imagery was used for detecting the severe infestation of the take-all disease in wheat by Chen et al. [10]. Franke and Menz [11] used high-resolution multi-spectral data to detect in-field heterogeneities of crop vigor, and the results showed a varying performance among different growing stages. Oumar and Mutanga [12] demonstrated the potential of Worldview-2 sensor data in predicting bronze bug damage in plantation forests. All of these studies motivate us to make an attempt to use multispectral data for mapping the powdery mildew in winter wheat.
On 9 September 2012, a new satellite, SPOT-6 built by Astrium was successfully launched from the Satish Dhawan Space Center in India. SPOT-6 has a spatial resolution of 6 m with three visible bands (blue, green, red), a near-infrared band (6 nm) and a panchromatic band of 1.5 m (Table 1). Because of its band positions and spatial resolution, images taken by SPOT-6 sensor are suitable for detecting the powdery mildew disease. So far, few studies have been conducted on this application. Hence, the objectives of this study were: (1) to evaluate the potential of SPOT-6 imagery on mapping powdery mildew in winter wheat; (2) to compare the performance of three classification algorithms—mahalanobis distance (MD), maximum likelihood classifier (MLC) and artificial neural network (ANN)—for their capability in mapping the disease.
2. Methods
2.1. Study Area and Field Survey
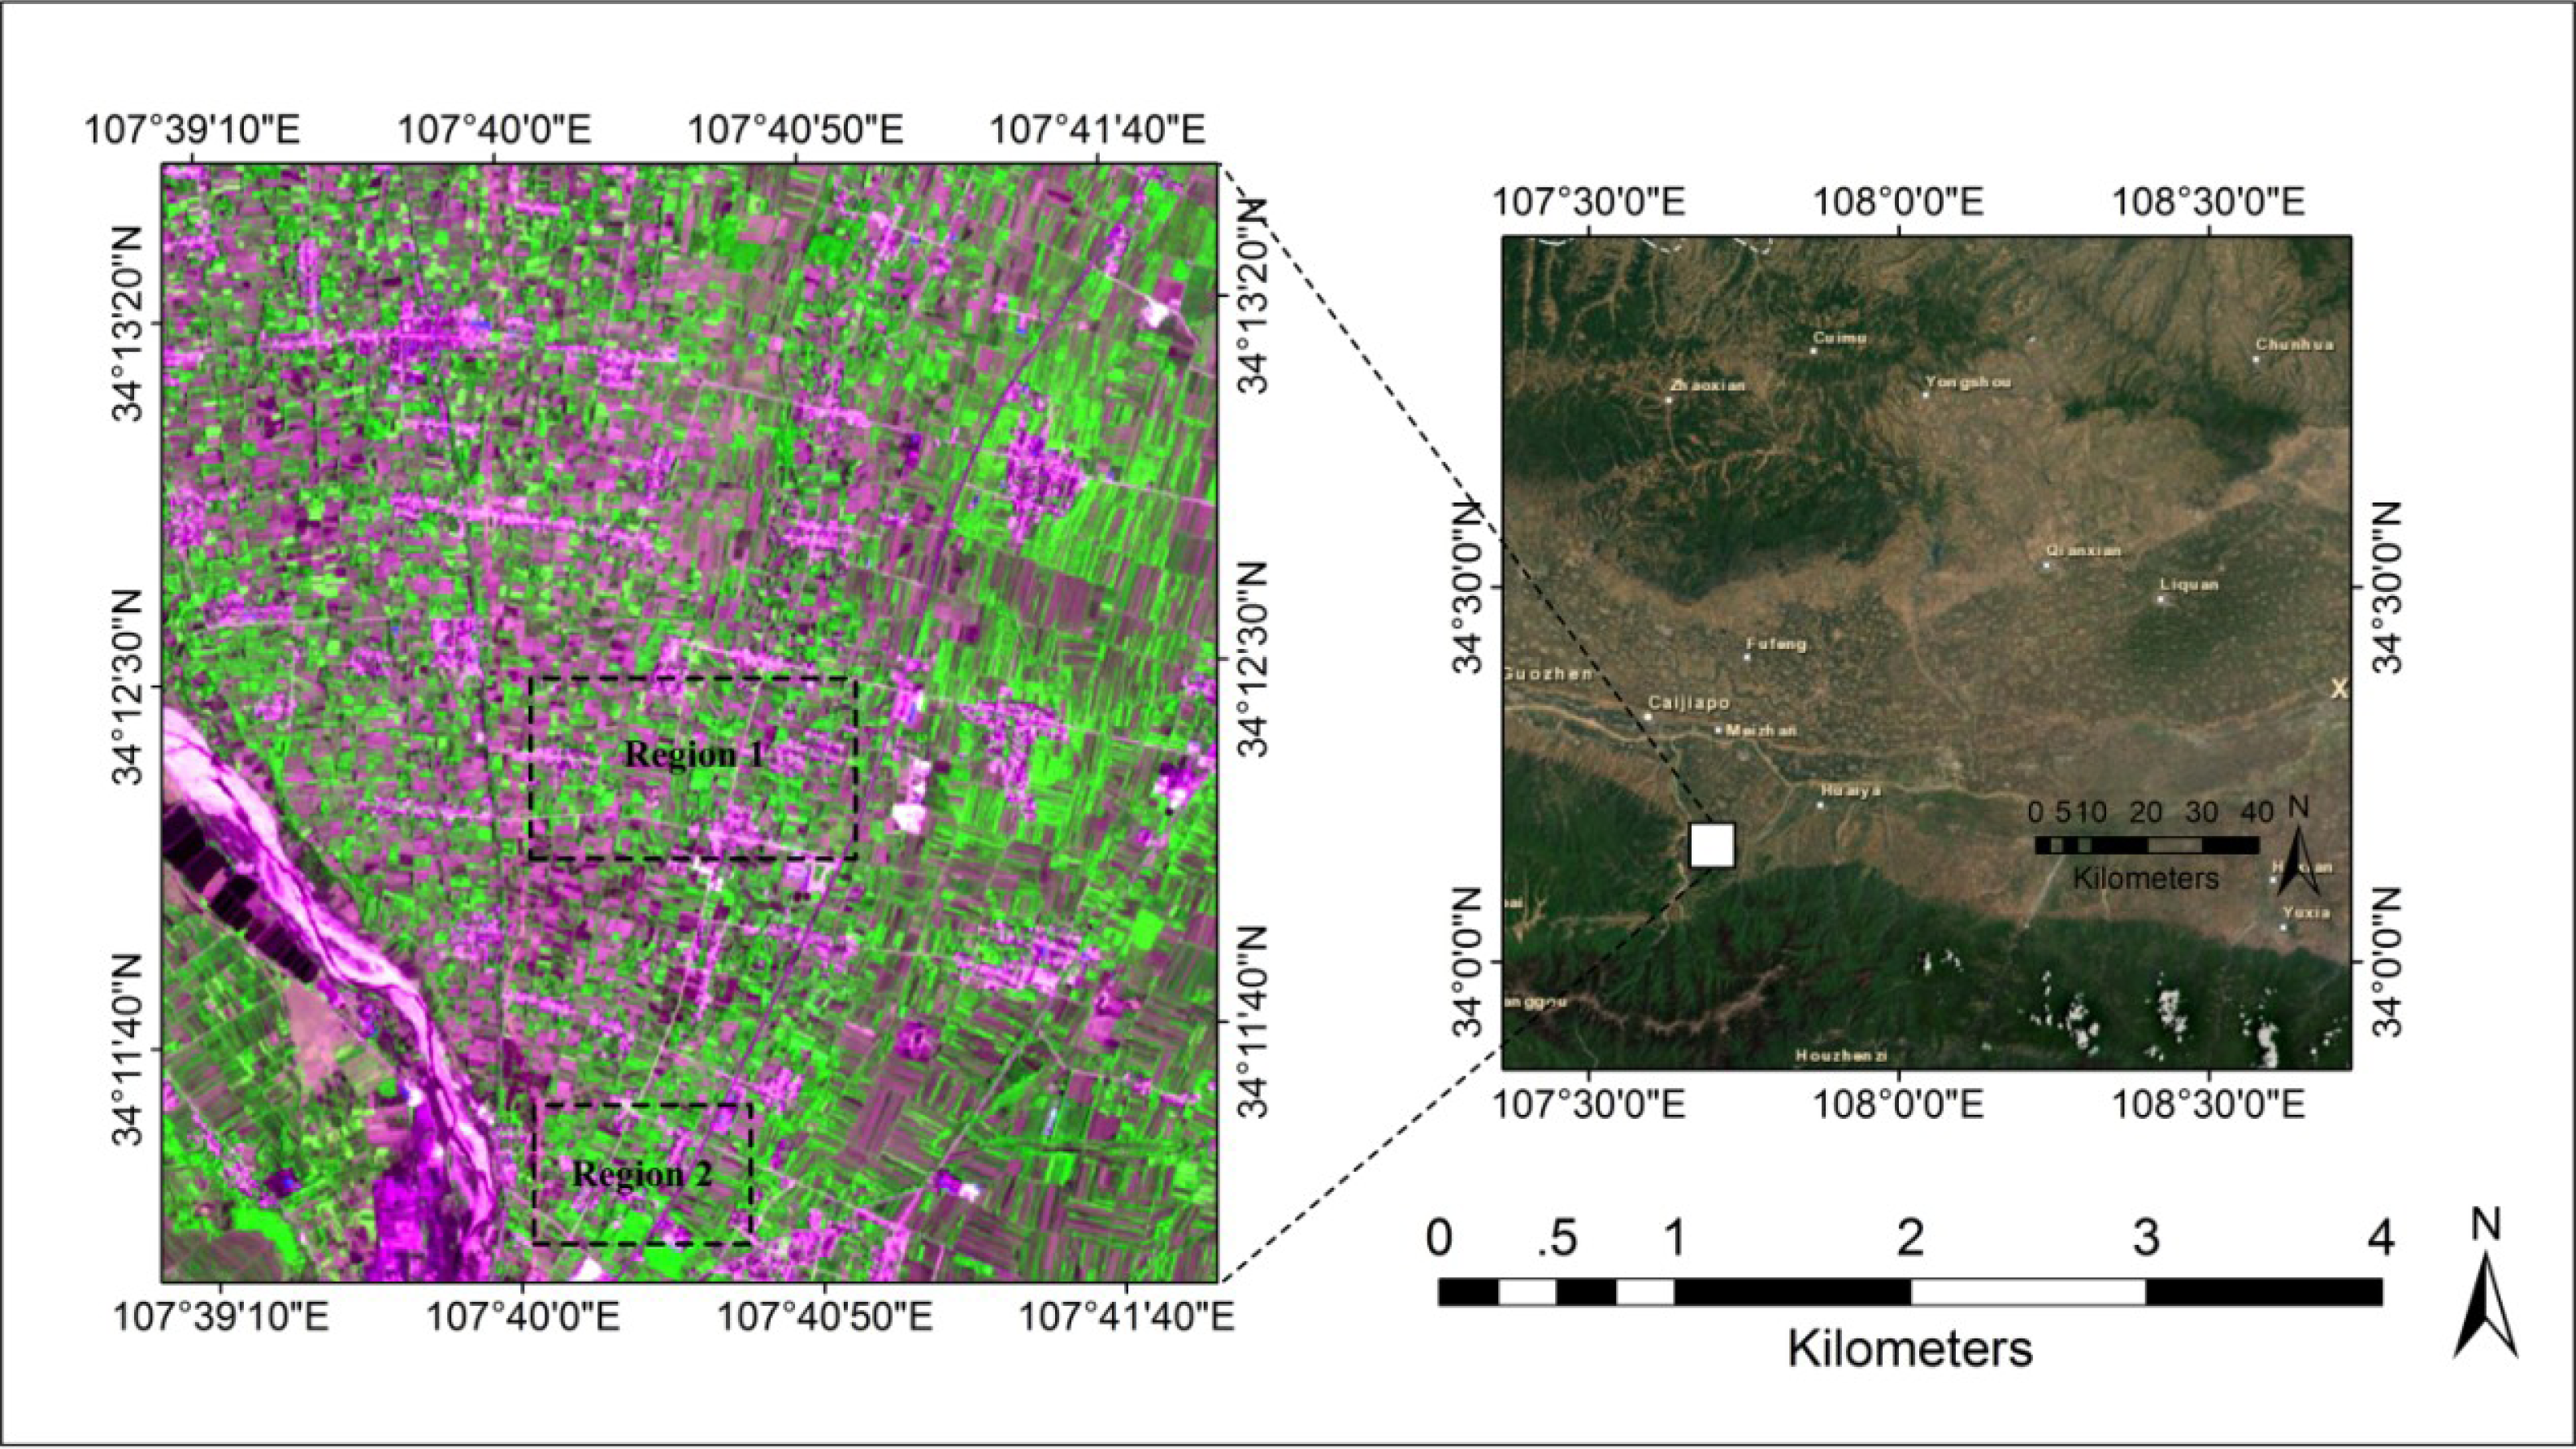
The study area (34°2′12.86″N, 107°0′48.84″E) was located in Mei County of Shaanxi province in China (Figure 1). Located near the Qin Mountain with a humid climate, Mei County provides a suitable environment for the powdery mildew pathogen to be propagated. Two typical powdery mildew infected regions, designated as regions 1 and 2 in Figure 1, were selected for conducting a field survey.
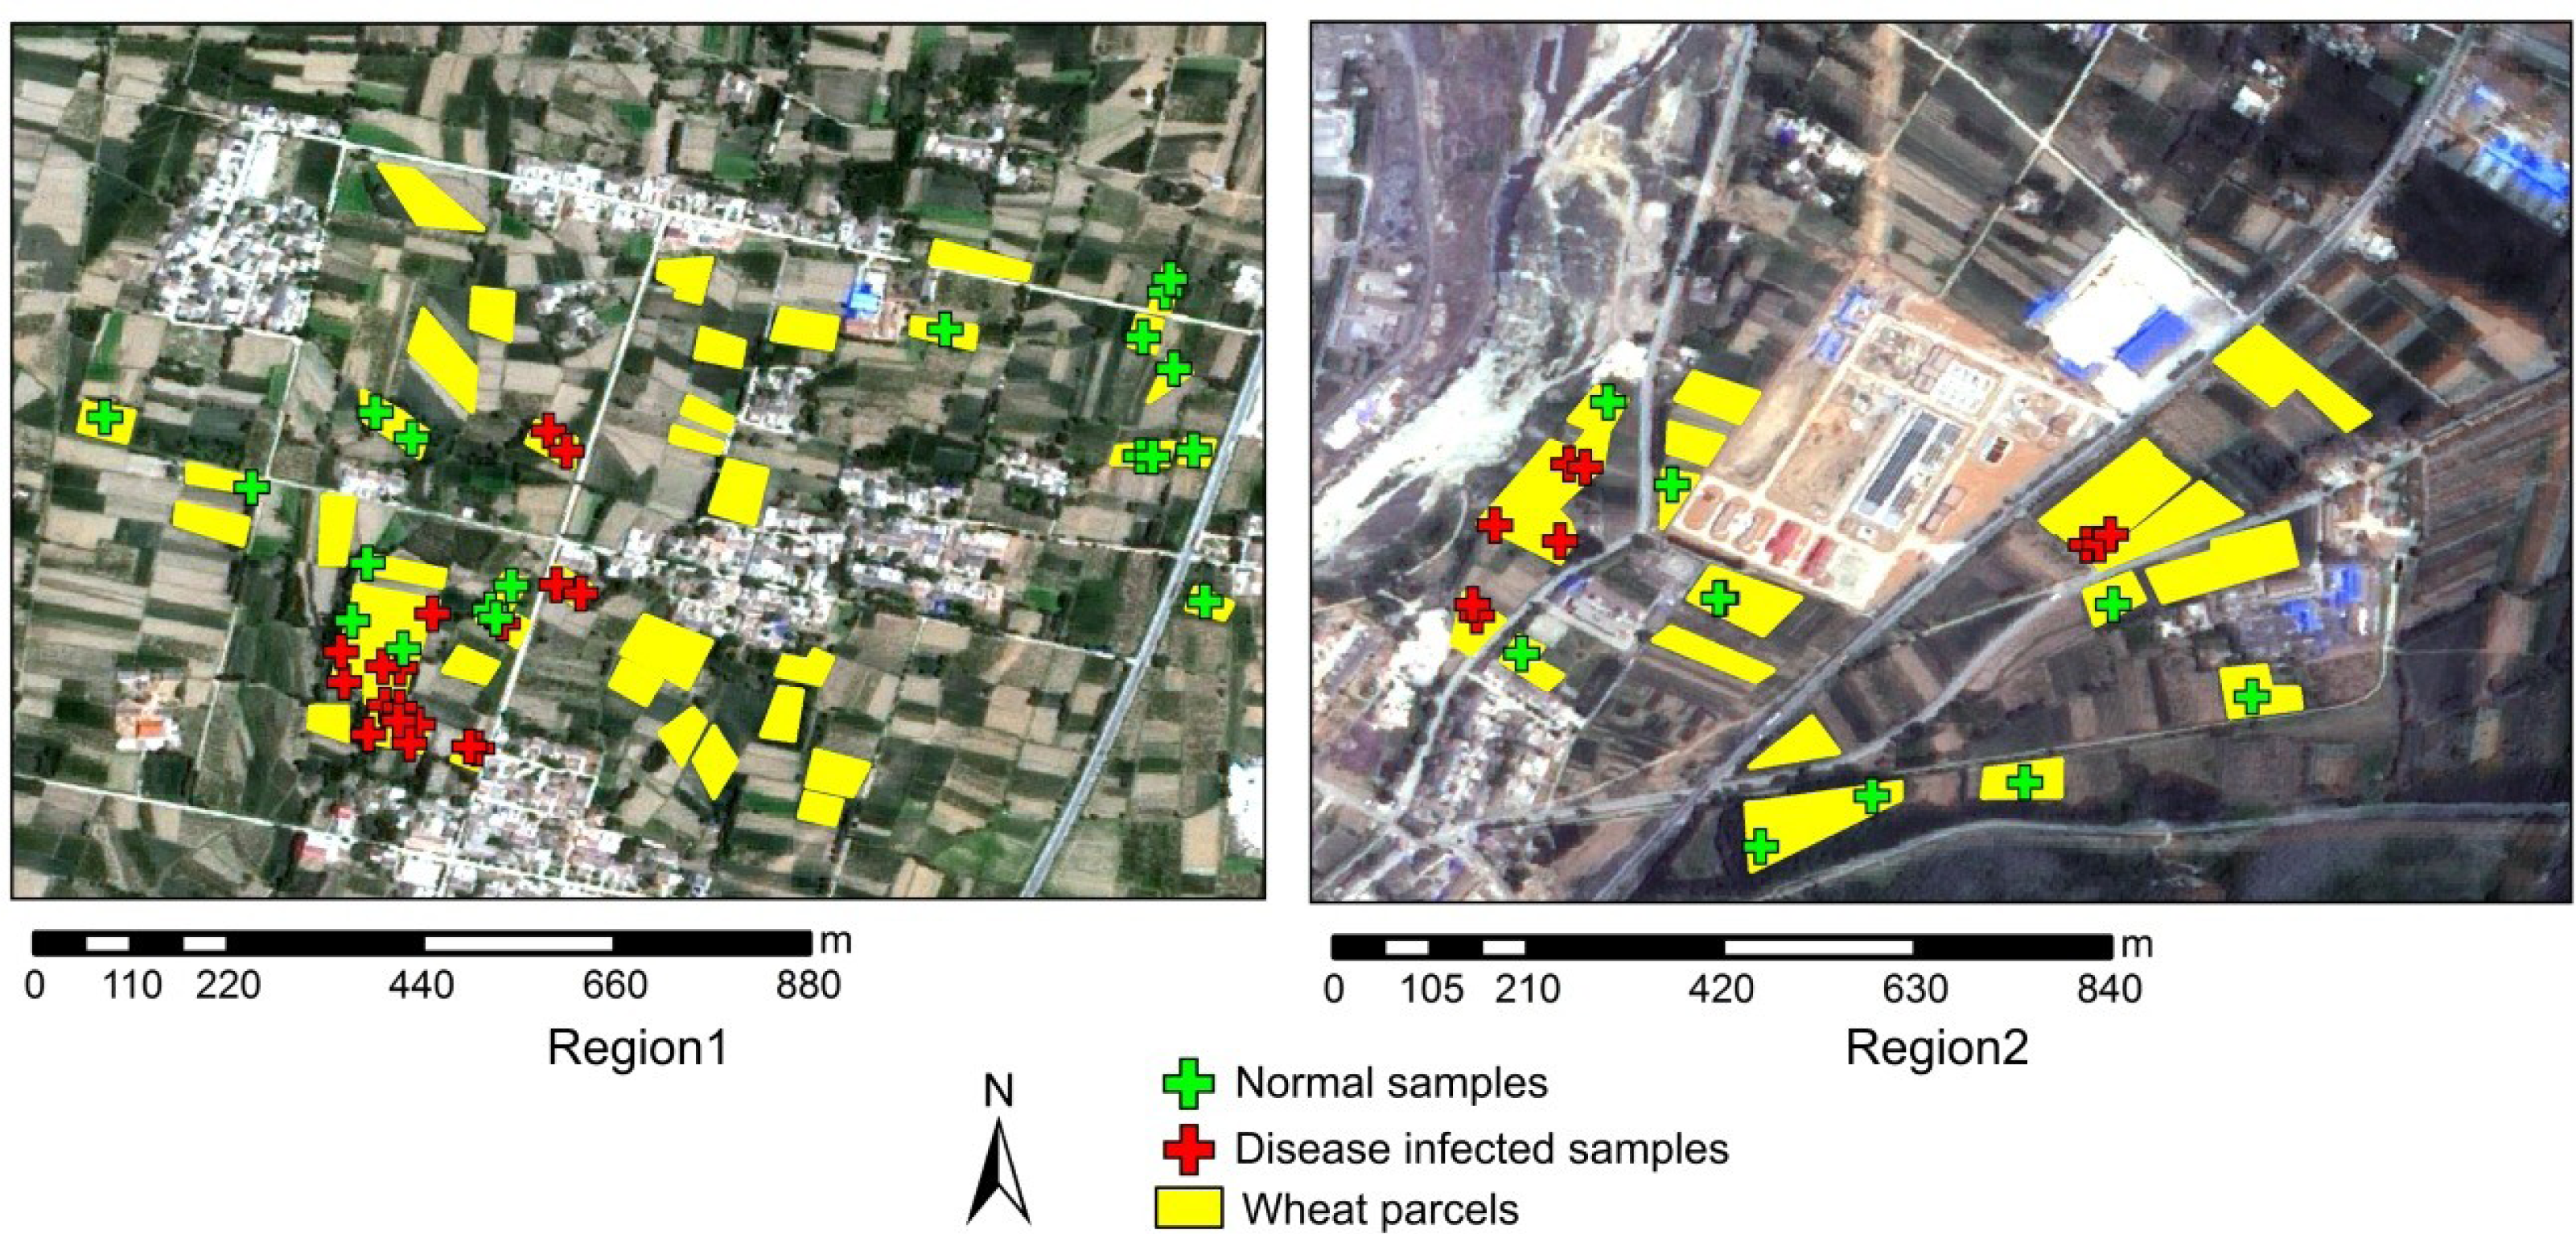
Ground truth data were collected in 37 plots (19 healthy plots and 18 diseased plots) of region 1 and 19 plots (10 healthy plots and 9 diseased plots) of region 2, respectively. The data collected in region 1 were used for calibration, and the data collected in region 2 were used for validation (Table 2). Twenty wheat plants were randomly selected in an area of 6 m × 6 m of each plot for the disease survey. Since powdery mildew starts to infect plants from their bottom stems to the top canopy, an early stage infection would not have a detectable spectral response. Hence, we marked the plot as infected only if over 80% of the surveyed plants in a plot had obvious powdery mildew pustules on the top canopy. To minimize possible subjective error, all of the field survey was conducted by only one operator. The geographical coordinates of the center of each plot were recorded with a Differential Global Positioning System (DGPS) sensor (Trimble GeoXT). Boundaries of all the plots in both regions were marked in yellow color in Figure 2.
2.2. Imagery Acquisition and Preprocessing
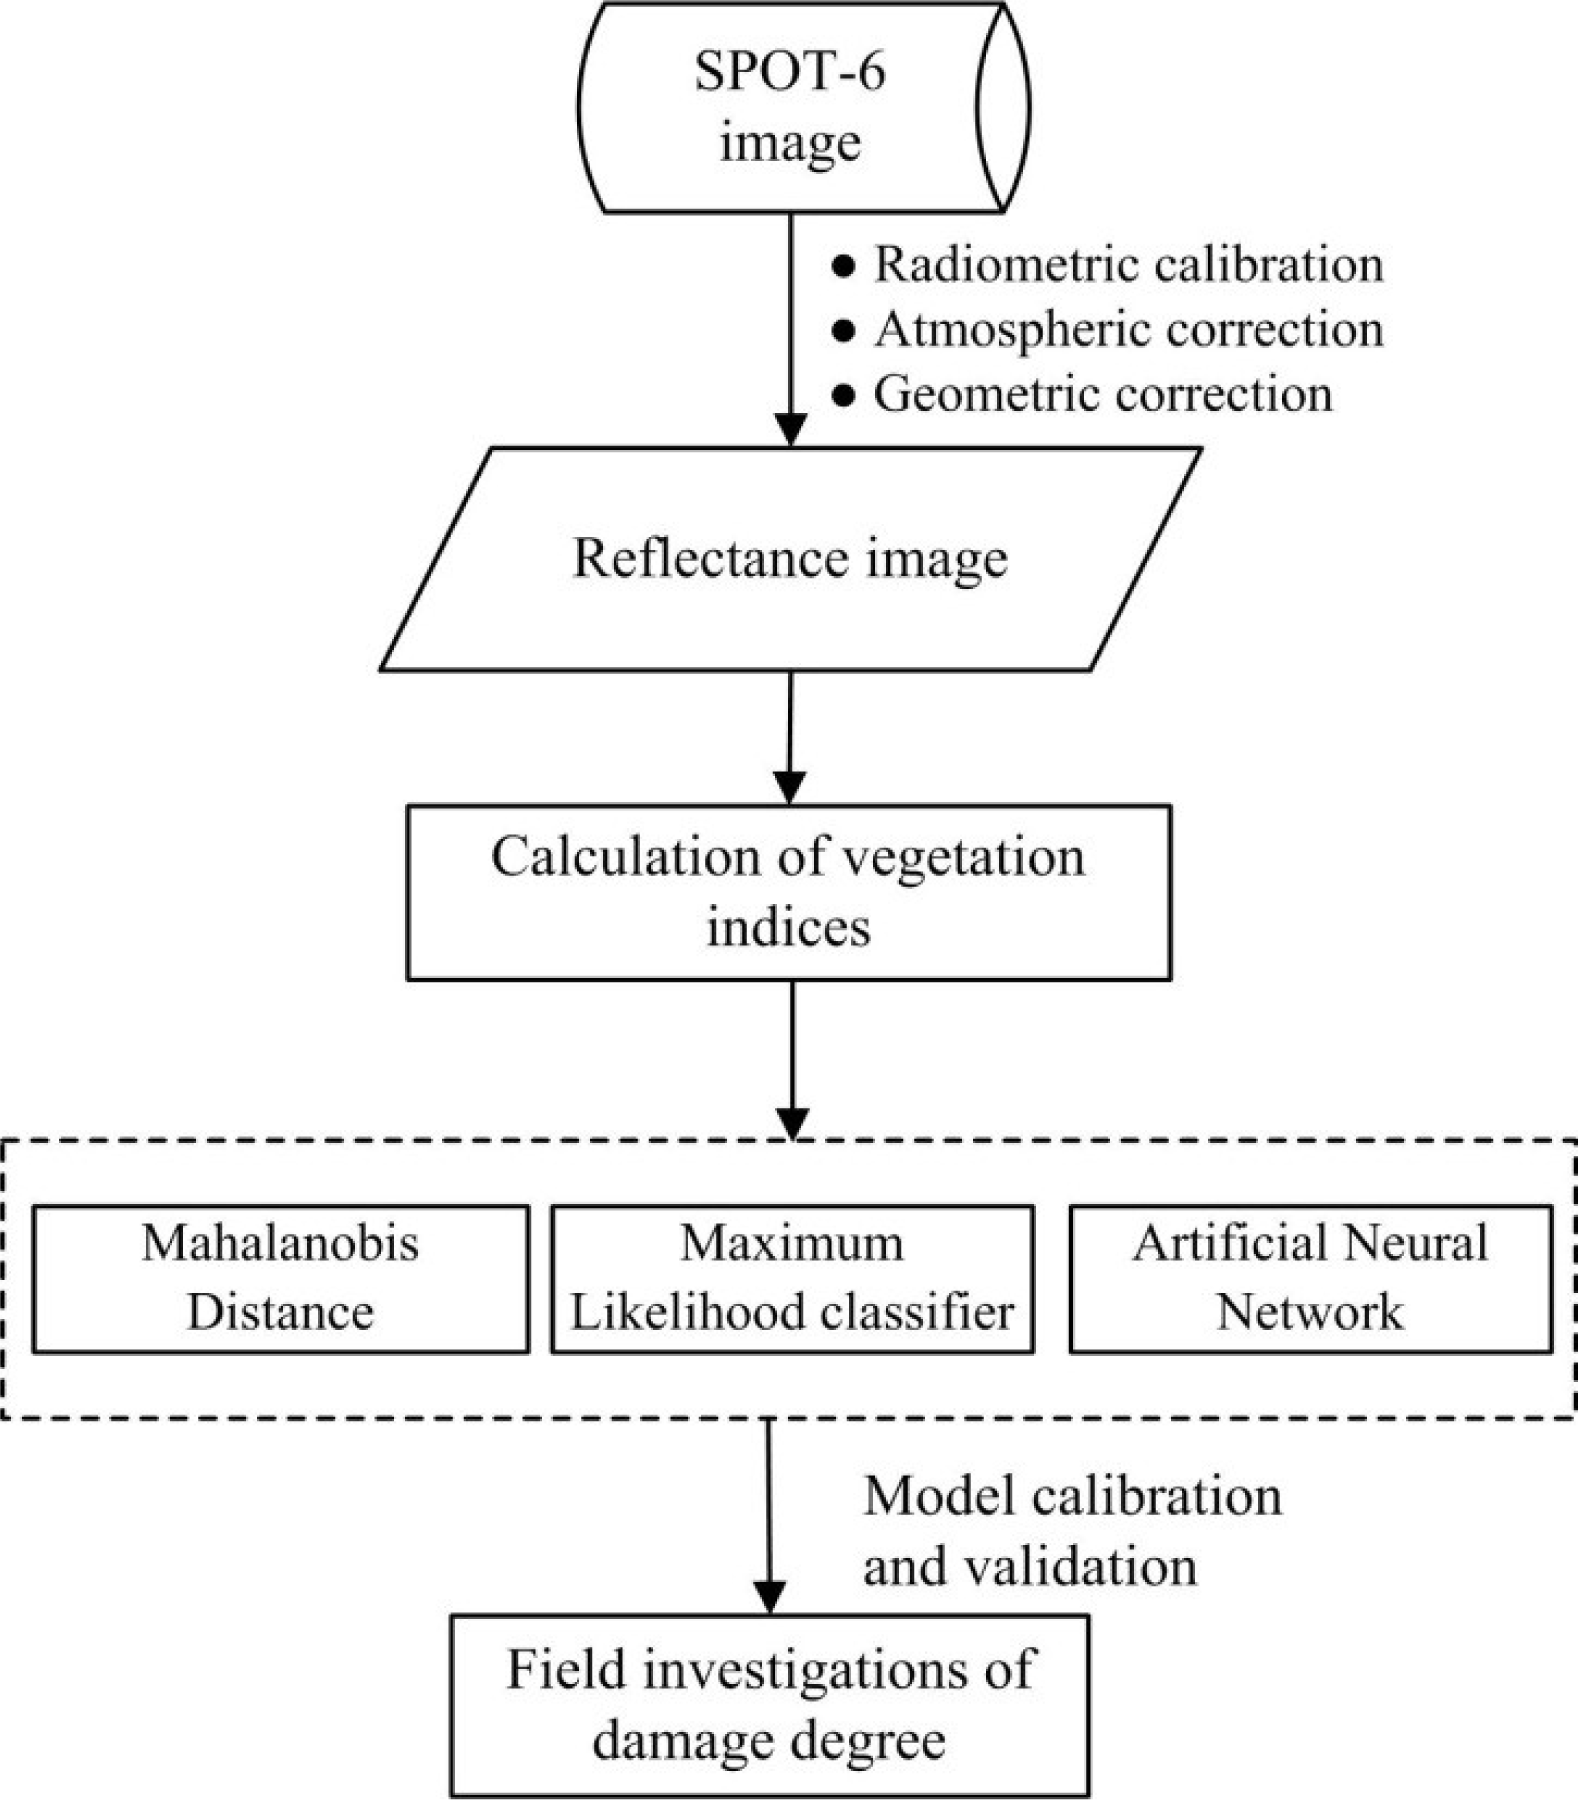
A scene of SPOT-6 was acquired on 11 May 2013, when the powdery mildew was fully expressed on the winter wheat in the study regions. The SPOT-6 image was registered to the Universal Transverse Mercator (UTM), World Geodetic Survey 1984 (WGS-84), Zone 48N, coordinate system. Image preprocessing included a radiometric calibration, an atmospheric correction and a geometric correction. Calibration coefficients were obtained from the header file of the image. The calibrated data then went through an atmospheric correction using the algorithm developed by Liang et al. [13], which estimated the spatial distribution of atmospheric aerosols and retrieved surface reflectance under general atmospheric and surface conditions. The geographical registration was conducted with a set of ground control points (n = 56) collected using the DGPS with sub-meter accuracy by Registration module and Image-to-Map Ground Control Point function in ENVI 4.3. For image-map co-registration accuracy assessment, an independent accuracy assessment was also conducted. The image was co-registrated using 32 ground control points (60%), and was then assessed the co-registration accuracy against the reserved 24 points (40%). The RMS of 4.8 m showed that the co-registration error was less than one pixel (6 m). Since the spectral difference between the disease plants and healthy ones was smaller than their difference with other ground objects (e.g., water, vegetation, impervious area) or the difference between plant species, the targeted plant areas were extracted prior to the subsequent spectral analysis. To achieve this, the boundaries of wheat parcels were extracted through a visual interpretation from a panchromatic image (Figure 2).
2.3. Selection of Spectral Features for Disease Mapping
Vegetation indices calculated from the original bands, which are used for monitoring vegetation health (green, and yellow), pigment indices (red), and moisture content (near-infrared), are tested to assess their potential in predicting powdery mildew damage using fewer but well-positioned bands. A number of hyperspectral vegetation indices have been proposed for disease/insect mapping (e.g., Aphid Index, ADHI) or have been proven to be effective in the disease/insect mapping (e.g., DWSI, SIPI, PRI) [8,14–16]. However, few broad-band vegetation indices (VIs) that have potential in reflecting crop stresses were tested for monitoring crop diseases [10,17]. In this study, in addition to the four original bands of SPOT-6, a total of 6 broad-band VIs were investigated for their sensitivity to powdery mildew including Normalized Difference Vegetation Index (NDVI), Green Normalized Difference Vegetation Index (GNDVI), Triangular vegetation index (TVI), Soil adjusted vegetation index (SAVI), Enhanced vegetation index (EVI), and Re-normalized Difference Vegetation Index (RDVI) (Table 3 [18–23]). Each VI applied a certain mathematical transformation from original bands to emphasize vegetation status whereas eliminate the background influences such as soil impact. An independent t-test was used to examine the sensitivity of the VIs in detecting the powdery mildew. To conduct such an analysis, the calculated VI values of each sample from healthy and disease-infected groups were used as input data. While the p-value, as an output result of t-test, was used for determining if a significant difference between two groups is achieved. The p-value < 0.05 indicates the two groups were significantly different, which in our case, can be understood as a disease sensitive situation. However, given those VIs were derived from the four original bands, a certain degree of correlation can be expected among them. To avoid using VIs with high level of redundancy, a cross-correlation check was conducted. Only the VIs have lower correlation than R = 0.8 with other VIs were reserved for subsequent analysis.
2.4. Algorithms for Disease Mapping
To map powdery mildew on the multispectral satellite image, three algorithms based on different theories were implemented and their performances were compared in this study—maximum likelihood classifier (MLC), mahalanobis distance (MD), and artificial neural network (ANN). All of them have been widely used as classification algorithms in remote sensing. In them, both the MLC and MD are mainstream classification methods, which are founded on relatively simple mathematical principles with different quantifications of distance among samples. While for ANN, as an important data mining tool that has relatively comprehensive mathematical mechanism, it was widely used in image classification in remote sensing domain. The features and corresponding literatures of the three algorithms were summarized in Table 4 [24–27].
MLC assumes that the statistics of each class in each band are normally distributed. It calculates the probability of a given pixel’s belongingness to a certain class. All pixels are classified with a specified probability threshold. Each pixel is assigned to a class with a highest probability (i.e., the maximum likelihood). If the highest probability is smaller than a specified threshold, the pixel would remain unclassified [24]. ENVI Classic implements maximum likelihood classification by calculating the following discriminant functions for each pixel in the image [24]:
MD classification is a direction-sensitive distance classifier that uses statistics of each class. All pixels are classified to the closest reference pixels unless a distance threshold is specified. The Mahalanobis distance takes the co-variances into account, which lead to elliptic decision boundaries in the 2D case, as opposed to the circular boundary in the Euclidean case. The Euclidean distance may be seen as a special case of the Mahalanobis distance with equal variances of the variables. Therefore, the Mahananobis distance is a better way to reduce linear correlation and some scaling. It is used to identify and gauge the similarity of an unknown sample set to a known one [24]. MD can be written as:
ANN is a computational methodology that could perform multifactorial analyses. Motivated by networks of biological neurons, artificial neural network models contain layers of simple computing nodes that operate as nonlinear summing devices. The nonlinear characteristic of ANN allows efficient knowledge learning superior over traditional methods, such as predicting an output value, classifying an object, approximating a function, and recognizing a pattern in the multifactorial data [28]. A supervised feed-forward neural network was applied in this study and was trained with a back-propagation learning. The back-propagation learning has been demonstrated in other studies to be the best learning method for modeling non-linear relationships [29]. In this study, the ANN was implemented using ENVI Classic. The model structure and initial parameters in a ANN are usually determined empirically including representative training samples and to specify the training threshold contribution, the training rate, the momentum rate, the training RMS exit criteria, the number of hidden layers and training iteration. The training threshold contribution, with a range from 0 to 1.0, controls the contribution of the internal weight with respect to the activation level of the node. The training rate (0–1.0) and the momentum rate (0–1.0) determine the magnitude of the adjustment of the weights. The setting of the two factors will influence the oscillation or convergence of the training result. A greater momentum rate allows users to set a higher training rate without oscillations. Over 40 different settings of the above factors according to the referential values from previous study cases were tested to select an optimal combination [30,31]. Specifically, the tested training threshold contribution varied from 0.6 to 0.8; the tested learning rate varied from 0.1 to 0.2; the tested momentum rate ranged from 0.6 to 0.8; the tested training RMS threshold ranged from 0.3 to 0.4. In addition, the number of hidden layer and training iteration were fixed as 1 and 10,000, respectively. Table 5 shows the results of four parameter combinations. The highest accuracy (overall accuracy of 89.5%) was achieved with learning rate of 0.2, momentum rate of 0.8, and training threshold contribution of 0.8 was adopted in this study.
2.5. Accuracy Assessment of Disease Mapping
Four error matrices of each plot were calculated for each classification algorithm by comparing the classification results with the ground truth to evaluate their performance on disease mapping—an overall accuracy (OA), a producer’s accuracy, a user’s accuracy and a kappa coefficient. The data collected in region 1 were used for model calibration and the data collected in region 2 were used for the validation of the model. Data analysis processes are summarized in Figure 3.
3. Results and Discussion
3.1. Selecting Optimal Indices for Mapping Powdery Mildew
Independent t-tests were conducted between healthy and diseased samples to quantitatively evaluate the sensitivity of each spectral index to the powdery mildew disease. Though all VIs were sensitive to the disease at a significant level of p-value < 0.05, only NDVI and TVI were reserved for subsequent analysis according to a cross-correlation check with a threshold of R = 0.8. The characteristic symptoms of powdery mildew are white, fluffy mycelia covering the leaf surface. This disease often causes physiological changes in plant metabolism and may alter the spectral response of the plant. The lesions of powdery mildew on leaves, together with destruction of chloroplast, would result in an increase of reflectance in the visible spectral range; while the biomass reduction due to senescence and defoliation would cause a decrease of canopy reflectance in the NIR spectral range. Since NDVI and TVI respond to the change of green biomass and variation of leaf pigments’ concentration, both VIs had stronger responses to the powdery mildew [18,20].
3.2. Mapping Powdery Mildew Using Different Classification Algorithms
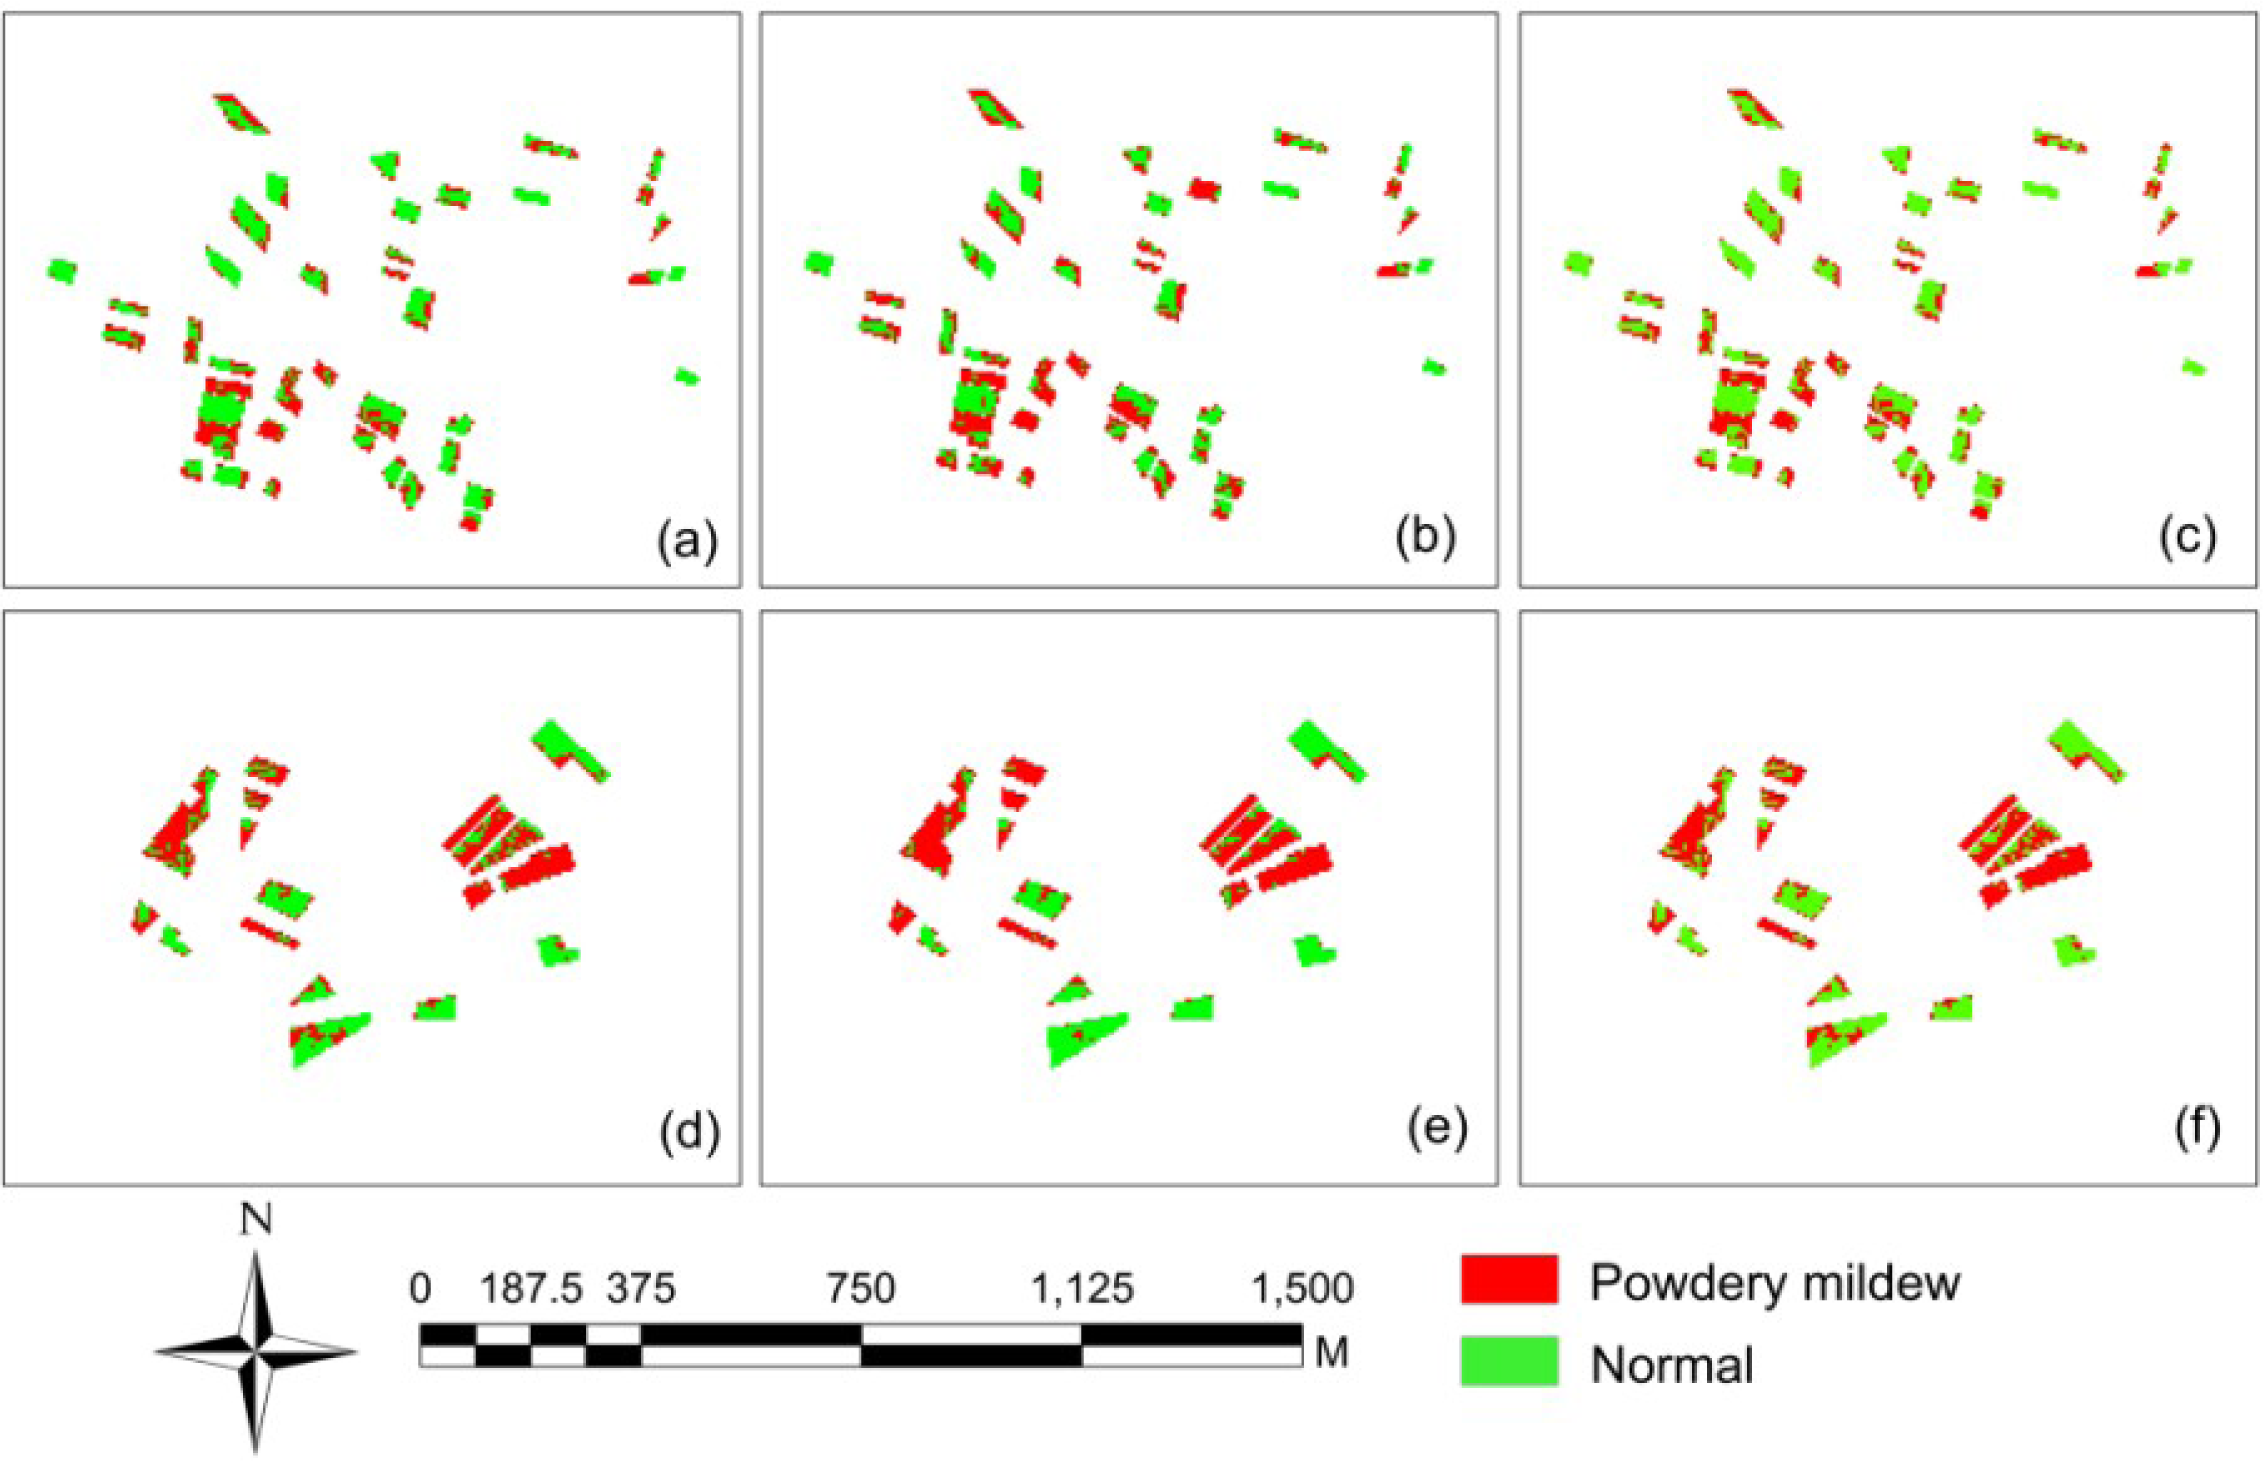
The performance of three algorithms—MD, MLC and ANN—in mapping powdery mildew were evaluated and compared with the six-bands image (including four original bands, NDVI and TVI) (Figure 4). The accuracies under the three methods were summarized in Table 6. In general, the disease-infected areas can be successfully identified by all the three methods, with the highest overall accuracy of 89% for ANN, following by MD and MLC with overall accuracy of 84% and 79%, respectively. For classification accuracy of each class, all three methods produced reasonable results. The relatively low producer’s accuracy for powdery mildew class implied that large areas of powdery mildew infected winter wheat were misclassified as the healthy ones. For example, MD had a producer’s accuracy of 77.78% and a user’s accuracy of 87.5% for powdery mildew. These values indicate that although 87.5% of the areas called powdery mildew on the classification map were actually powdery mildew, only 77.78% of the powdery mildew areas on the ground were correctly identified as powdery mildew on the map. Besides, a visual comparison showed that the spatial patterns of the identified disease infected area are generally consistent among the three tested classifiers (Figure 4).
The above stated results suggested that the soft computing approach (ANN) outperformed the statistical approach (MD and MLC) in our case. For MD and MLC, their simple, straightforward analyzing principles make them easier to be implemented so that they are more suitable for regions with less field variability. The superior performance of ANN was possibly because of the algorithm’s adaptability of the optimizing weights through layers. The advantage of such soft computing algorithm over conventional statistical method could be more obvious in monitoring crop diseases in fields with more field variability. These advantages of soft computing algorithms were also discovered in other studies [29–31] which make the soft computing algorithms become the mainstream in disease mapping. Since there are few studies in disease mapping at a regional level to compare with, we further compared our results with studies implemented at a parcel level. Zhang et al. [9] used an airborne multispectral image with four broad bands (similar bands with SPOT-6) to map late blight infections in two experimental fields. In that study, their average mapping accuracy was 86.9%. In another study by Franke and Menz [11] in mapping wheat diseases over an experimental field with multi-spectral images, the accuracy varied from 56.8% to 88.6% over different growing stages. Considering disease mapping at a broader scale is more complicated and challenging than that at the parcel-level, the accuracies varying from 79% to 89% achieved in this study is promising.
4. Conclusions
The study evaluated the performance of three supervised classification methods—artificial neural network (ANN), mahalanobis distance (MD) and maximum likelihood classifier (MLC)—for mapping powdery mildew of winter wheat using high-resolution multispectral satellite imagery data (SPOT-6) and ancillary information at a regional scale. Our results suggested that both the soft computing approach (ANN) and the statistical approach (MD and MLC) are able to achieve acceptable performance in mapping powdery mildew, with an overall accuracy over 79%. Among the three tested methods, ANN produced higher accuracy than MD and MLC. The superior capability in data fitting of ANN makes it an optimal solution in detecting crop anomalies in practice. The image-derived disease infection map could be useful for determining areas requiring intensive field survey, and can serve as a guide for disease control management.
As the disease mapping at a regional level would inevitably stand a risk of being confused with other issues, such as other types of stresses, spectral variation due to different cultivars, and the microtopography influence. In the future, studies could also incorporate multi-sources information (e.g., climatic data, geographic data and data collected from wireless sensors network) that are able to eliminate the classification uncertainty. In addition, more advanced soft computing methods and some hybrid methods (e.g., ANN-GA, ANN-Fuzzy) could be tested to further improve the stability and reliability on crop disease mapping. Overall, increased availability and reduced cost make the application of high-resolution remote sensing data more promising now than any time before. Its application on disease detection will greatly benefit growers worldwide in the near future.
Acknowledgments
This work was subsidized by National Natural Science Foundation of China (Grant No. 41301476, 41271412), Beijing Natural Science Foundation (Grant No. 4132029). The authors are grateful to Weiguo Li, Hong Chang for their helps in field data collection.
Author Contributions
All authors contributed extensively to the work presented in the manuscript. Lin Yuan analyzed the data and wrote the paper. Jingcheng Zhang is the corresponding author and contributed much on experimental design and data analysis. Yeyin Shi participated in organizing the paper and also helps to polish the language. Jihua Wang provided useful suggestions on making the manuscript become logical and readable. Chenwei Nie and Liguang Wei contributed on the data collection and algorithm validation.
Conflicts of Interest
The authors declare no conflict of interest.
References
- Olsen, M.; Rasmussen, S.; Nischwitz, C. Effect of powdery mildew of pecan shucks on nut weight and quality and relevance to fungicide application. Crop Protection 2003, 22, 679–682. [Google Scholar]
- Gamon, J.A.; Surfus, J.S. Assessing leaf pigment content and activity with a reflectometer. New Phytol 1999, 143, 105–117. [Google Scholar]
- Devadas, R.; Lamb, D.W.; Simpfendorfer, S.; Backhouse, D. Evaluating ten spectral vegetation indices for identifying rust infection in individual wheat leaves. Precis. Agric 2009, 10, 459–470. [Google Scholar]
- Sankaran, S.; Mishra, A.; Ehsani, R.; Davis, C. A review of advanced techniques for detecting plant diseases. Comput. Electron. Agric 2010, 72, 1–13. [Google Scholar]
- Pu, R.; Foschi, L.; Gong, P. Spectral feature analysis for assessment of water status and health level in coast live oak (Quercus agrifolia) leaves. Int. J. Remote Sens 2004, 25, 4267–4286. [Google Scholar]
- Weng, Q.H. Hyperspectral Remote Sensing of Vegetation Bioparameters. In Advances in Environmental Remote Sensing; Pu, R.L., Gong, P., Eds.; CRC Press: Boca Raton, FL, USA, 2011; pp. 101–130. [Google Scholar]
- Fletcher, R.S.; Skaria, M.; Escobar, D.E.; Everitt, J.H. Field spectra and airborne digital imagery for detecting phytophthora foot rot infections in citrus trees. HortScience 2001, 36, 94–97. [Google Scholar]
- Apan, A.; Held, A.; Phinn, S.; Markley, J. Detecting sugarcane orange rust disease using EO-1 Hyperion hyperspectral imagery. Int. J. Remote Sens 2004, 25, 489–498. [Google Scholar]
- Zhang, M.; Qin, Z.; Liu, X. Remote sensed spectral imagery to detect late blight in field tomatoes. Precis. Agric 2005, 6, 489–508. [Google Scholar]
- Chen, X.; Ma, J.; Qiao, H.; Cheng, D.; Xu, Y.; Zhao, Y. Detecting infestation of take-all disease in wheat using Landsat Thematic Mapper imagery. Int. J. Remote Sens 2007, 28, 5183–5189. [Google Scholar]
- Franke, J.; Menz, G. Multi-temporal wheat disease detection by multi-spectral remote sensing. Precis. Agric 2007, 8, 161–172. [Google Scholar]
- Oumar, Z.; Mutanga, O. Using WorldView-2 bands and indices to predict bronze bug (Thaumastocoris peregrinus) damage in plantation forests. Int. J. Remote Sens 2012, 34, 2236–2249. [Google Scholar]
- Liang, S.L.; Fang, H.L.; Chen, M.Z. Atmospheric correction of Landsat ETM+ land surface imagery—Part 1: Methods. IEEE Trans. Geosci. Remote Sens 2001, 39, 2490–2498. [Google Scholar]
- Mirik, M.; Michels, G.J., Jr.; Kassymzhanova-Mirik, S.; Elliott, N.C. Reflectance characteristics of Russian wheat aphid (Hemiptera: Aphididae) stressand Abundance in winter wheat. Comput. Electron. Agric 2007, 57, 123–134. [Google Scholar]
- Luo, J.H.; Huang, M.Y.; Zhao, J.L.; Huang, W.J.; Zhang, J.C.; Dong, Y.Y.; Wang, J.H. Spectrum characteristics of winter wheat infected by aphid in filling stage. Trans. CSAE 2011, 27, 215–219. [Google Scholar]
- Huang, W.J.; David, W.L.; Niu, Z.; Zhang, Y.J.; Liu, L.Y.; Wang, J.H. Identification of yellow rust in wheat using in-situ spectral reflectance measurements and airborne hyperspectral imaging. Precis. Agric 2007, 8, 187–197. [Google Scholar]
- Naidu, R.A.; Perry, E.M.; Pierce, F.J.; Mekuria, T. The potential of spectral reflectance technique for the detection of Grapevine leafroll-associated virus-3 in two red-berried wine grape cultivars. Comput. Electron. Agric 2009, 66, 38–45. [Google Scholar]
- Rouse, J.W.; Haas, R.H.; Schell, J.A.; Deering, D.W. Monitoring Vegetation Systems in the Great Plains with ERTS. In Third Earth Resources Technology Satellite-1 Symposium- Volume I: Technical Presentations; Freden, S.C., Mercanti, E.P., Becker, M.A., Eds.; NASA Press: Washington, D.C., USA, 1974; pp. 1–309. [Google Scholar]
- Gitelson, A.A.; Kaufman, Y.J.; Merzlyak, M.N. Use of green channel in remote sensing of global vegetation from EOS-MODIS. Remote Sens. Environ 1996, 58, 289–298. [Google Scholar]
- Broge, N.H.; Leblanc, E. Comparing prediction power and stability of broadband and hyperspectral vegetation indices for estimation of green leaf area index and canopy chlorophyll density. Remote Sens. Environ 2001, 76, 156–72. [Google Scholar]
- Huete, A.R. A soil-adjusted vegetation index (SAVI). Remote Sens. Environ 1988, 25, 295–309. [Google Scholar]
- Huete, A.; Didan, K.; Miura, T.; Rodriguez, E.P.; Gao, X.; Ferreira, L.G. Overview of the radiometric and biophysical performance of the MODIS vegetation indices. Remote Sens. Environ 2002, 83, 195–213. [Google Scholar]
- Rumelhart, D.E.; Hinton, G.E.; Williams, R.J. Learning Internal Representations by Error Propagation. In Parallel Distributed Processing—Explorations in the Microstructure of Cognition; Rumelhart, D.E., McClelland, J.L., Eds.; The MIT Press: Cambridge, MA, USA, 1986; pp. 318–362. [Google Scholar]
- Richards, J.A. Remote Sensing Digital Image Analysis; Springer-Verlag: Berlin, Germany, 1999; p. 240. [Google Scholar]
- Richards, J.A. Image Processing in Practice. In Remote Sensing Digital Image Analysis; Springer: Berlin, Germany, 2013; pp. 381–435. [Google Scholar]
- Kohonen, T. Learning Vector Quantization for Pattern Recognition; Technical Report: TKK-F-A601; Helsinki University of Technology: Otaniemi, Finland, 1986. [Google Scholar]
- Rokach, L.; Maimon, O. Clustering Methods. In Data Mining and Knowledge Discovery Handbook; Springer: Berlin, Germany, 2005; pp. 321–352. [Google Scholar]
- Bishop, C.M. Neural Networks for Pattern Recognition; Oxford University Press: New York, NY, USA, 1995. [Google Scholar]
- Jensen, J.R.; Qiu, F.; Ji, M.H. Predictive modelling of coniferous forest age using statistical and artificial neural network approaches applied to remote sensor data. Int. J. Remote Sens 1999, 20, 2805–2822. [Google Scholar]
- Gong, P.; Pu, R.; Chen, J. Mapping ecological land systems and classification uncertainties from digital elevation and forest-cover data using neural networks. Photogramm. Eng. Remote Sens 1996, 62, 1249–1260. [Google Scholar]
- Ingram, J.C.; Dawson, T.P.; Whittaker, R.J. Mapping tropical forest structure in southeastern Madagascar using remote sensing and artificial neural networks. Remote Sens. Environ 2005, 94, 491–507. [Google Scholar]


| Category | Items | Information |
|---|---|---|
| Parameters of sensors | Main Sensor | NAOMI (New AstroSat Optical Modular Instrument) |
| Spacecraft bus | AstroBus-L | |
| Spatial resolution (m) | Pan:1.5 m; MS:6 m | |
| Spectral range (nm) | Blue:455–525 | |
| Green:530–590 | ||
| Red:625–695 | ||
| Near Infrared:760–890 | ||
| Swath width (km) | 60 | |
| Revisit time (day) | 1∼3 | |
| Location | Type | Number of Samples | ||
|---|---|---|---|---|
| Healthy | Powdery mildew | Total | ||
| Region 1 | Calibration | 19 | 18 | 37 |
| Region 2 | Validation | 10 | 9 | 19 |
| Title | Definition | Formula | Literatures |
|---|---|---|---|
| RB | Original reflectance of each band of SPOT-6 | ||
| RG | |||
| RR | |||
| RNIR | |||
| NDVI | Normalized Difference Vegetation Index | (RNIR − RR)/(RNIR + RR) | [18] |
| GNDVI | Green Normalized Difference Vegetation Index | (RNIR − RG)/(RNIR + RG) | [19] |
| TVI | Triangular vegetation index | 0.5[120(RNIR − RG) − 200(RR − RG)] | [20] |
| SAVI | Soil adjusted vegetation index | (1 + L) × (RNIR − RR)/(RNIR + RR + L); L = 0.5 | [21] |
| EVI | Enhanced vegetation index | 2.5(RNIR − RR)/(RNIR + 6RR − 7.5RB + 1) | [22] |
| RDVI | Re-normalized Difference Vegetation Index | (RNIR − RR)/(RNIR + RR)0.5 | [23] |
| Methods | Description | Literature |
|---|---|---|
| Maximum likelihood classifier (MLC) | A standard parametric classifier, which assumes that the statistics for each class in each band are normally distributed and calculates the probability that a given pixel belongs to a specific class. | [24,25] |
| Mahalanobis distance (MD) | A direction-sensitive distance classifier that uses statistics for each class, which assumes all class covariances are equal. | [24,25] |
| Artificial Neural Network (ANN) | An artificial neural network is an interconnected group of nodes, akin to the vast network of neurons in a brain. Anon-linear characteristic of ANN is a distinct advantage over traditional methods that allows efficient knowledge learning. | [26,27] |
| Training Threshold Contribution | Training RMS Exit Criteria | Learning Rate/Momentum Rate | No. Iteration | Test_Accu.(%) |
|---|---|---|---|---|
| 0.8 | 0.4 | 0.2/0.8 | 10,000 | 89.470 |
| 0.6 | 0.4 | 0.1/0.6 | 10,000 | 73.680 |
| 0.8 | 0.3 | 0.2/0.8 | 10,000 | 68.420 |
| 0.6 | 0.3 | 0.1/0.6 | 10,000 | 73.680 |
| Accuracy Indicators | Reference | |||||||
|---|---|---|---|---|---|---|---|---|
| Healthy | Diseased | Sum | User Accuracy (%) | Overall Accuracy | Average Accuracy | Kappa | ||
| Mah | Healthy | 9 | 2 | 11 | 81.82 | 0.84 | 0.84 | 0.68 |
| Diseased | 1 | 7 | 8 | 87.50 | ||||
| Sum | 10 | 9 | 19 | |||||
| Producer accuracy (%) | 90.00 | 77.78 | ||||||
| Mlc | Healthy | 9 | 3 | 12 | 75.00 | 0.79 | 0.78 | 0.57 |
| Diseased | 1 | 6 | 7 | 85.71 | ||||
| Sum | 10 | 9 | 19 | |||||
| Producer accuracy (%) | 90.00 | 66.67 | ||||||
| ANN | Healthy | 8 | 0 | 8 | 100.00 | 0.89 | 0.90 | 0.79 |
| Diseased | 2 | 9 | 11 | 81.82 | ||||
| Sum | 10 | 9 | 19 | |||||
| Producer accuracy (%) | 80.00 | 100.00 | ||||||
© 2014 by the authors; licensee MDPI, Basel, Switzerland This article is an open access article distributed under the terms and conditions of the Creative Commons Attribution license (http://creativecommons.org/licenses/by/3.0/).
Share and Cite
Yuan, L.; Zhang, J.; Shi, Y.; Nie, C.; Wei, L.; Wang, J. Damage Mapping of Powdery Mildew in Winter Wheat with High-Resolution Satellite Image. Remote Sens. 2014, 6, 3611-3623. https://doi.org/10.3390/rs6053611
Yuan L, Zhang J, Shi Y, Nie C, Wei L, Wang J. Damage Mapping of Powdery Mildew in Winter Wheat with High-Resolution Satellite Image. Remote Sensing. 2014; 6(5):3611-3623. https://doi.org/10.3390/rs6053611
Chicago/Turabian StyleYuan, Lin, Jingcheng Zhang, Yeyin Shi, Chenwei Nie, Liguang Wei, and Jihua Wang. 2014. "Damage Mapping of Powdery Mildew in Winter Wheat with High-Resolution Satellite Image" Remote Sensing 6, no. 5: 3611-3623. https://doi.org/10.3390/rs6053611