Article

Persistent Scatterer Interferometry Processing of COSMO-SkyMed StripMap HIMAGE Time Series to Depict Deformation of the Historic Centre of Rome, Italy

1
British Geological Survey (BGS), Natural Environment Research Council (NERC), Nicker Hill, Keyworth, NG12 5GG Nottingham, UK
2
Institute of Methodologies for Environmental Analysis (IMAA), National Research Council (CNR), c/da S.Loja, Tito Scalo, 85050 Potenza, Italy
3
Institute for Archaeological and Monumental Heritage (IBAM), National Research Council (CNR), c/da S.Loja, Tito Scalo, 85050 Potenza, Italy
4
School of Engineering, University of Basilicata, Via Nazario Sauro 85, 85100 Potenza, Italy
5
Department of Geography, Institute of Hazard, Risk and Resilience (IHRR), Durham University, Lower Mountjoy, South Road, Durham DH1 3LE, UK
*
Author to whom correspondence should be addressed.
Authors are listed in alphabetical order.
Remote Sens. 2014, 6(12), 12593-12618; https://doi.org/10.3390/rs61212593
Submission received: 6 August 2014 / Revised: 25 November 2014 / Accepted: 27 November 2014 / Published: 15 December 2014
(This article belongs to the Special Issue New Perspectives of Remote Sensing for Archaeology)

Abstract

:
We processed X-band COSMO-SkyMed 3-m resolution StripMap HIMAGE time series (March 2011–June 2013) with the Stanford Method for Persistent Scatterers (StaMPS), to retrieve an updated picture of the condition and structural health of the historic centre of Rome, Italy, and neighbouring quarters. Taking advantage of an average target density of over 2800 PS/km2, we analysed the spatial distribution of more than 310,000 radar targets against: (1) land cover; (2) the location of archaeological ruins and restoration activities; and (3) the size, orientation and morphology of historical buildings. Radar interpretation was addressed from the perspective of conservators, and the deformation estimates were correlated to local geohazards and triggering factors of structural collapse. In the context of overall stability, deformation was identified at the single-monument scale, e.g., for the Roman cistern and exedra in the Oppian Hill. Comparative assessment against InSAR processing of C-band imagery (1992–2010) published in the literature confirms the persistence of ground motions affecting monuments and subsidence in southern residential quarters adjacent to the Tiber River, due to the consolidation of compressible deposits. Vertical velocity estimated from COSMO-SkyMed PS exceeds −7.0 mm/y in areas of recent urbanization.

Graphical Abstract

1. Introduction

Interferometric synthetic aperture radar (InSAR) techniques and their derived products are nowadays increasingly used in archaeology for prospection, condition monitoring and ground stability assessment [1,2,3,4,5]. Land deformation affecting the urban environment of the city of Rome in central Italy (Figure 1) has been extensively investigated in the last few years by using InSAR. Multi-interferogram processing was used to estimate line-of-sight (LOS) displacement from long time series of C-band SAR imagery from the European ERS-1/2 and ENVISAT satellites [6,7], as well as from the Canadian RADARSAT-1/2 constellation [8,9], with a monthly sampling frequency. In the context of a wider assessment of urban geohazards via the small baseline subset (SBAS) approach, Zeni et al. [10] also showed two examples of the application over the historic centre of Rome; whereas, Tapete et al. [8] developed a dedicated approach for the interpretation of PSInSAR™ and SqueeSAR™ datasets [11,12] to monitor the condition of cultural heritage assets and assess the beneficial effects of restoration works, with site-specific demonstration over the archaeological heritage of the Palatine and the Oppian Hills.
One of the pieces of evidence that came out from the above previous studies is that long-term preservation of historical buildings and ancient remains exposed to urban and geo-hazards can be cost-effectively managed by using regularly-acquired SAR imagery to update their condition reports. In this regard, the dual-use (civilian and defence) end-to-end earth observation system named the Constellation of Small Satellites for Mediterranean Basin Observation (COSMO-SkyMed), and funded by the Italian Space Agency (ASI (Agenzia Spaziale Italiana)) and the Italian Ministry of Defence (MoD) [13], nowadays represents a valuable resource, owing to the metre-level spatial resolution, daily to hourly revisiting time and increasing archive with the fully operational constellation starting from mid-2010.
This paper presents the results of persistent scatterer interferometry (PSI) processing of COSMO-SkyMed StripMap HIMAGE time series with the Stanford Method for Persistent Scatterers (StaMPS) [14], over the historic centre of Rome and neighbouring quarters. We focus particularly on the ancient to modern, even contemporary, built heritage. Section 2 reports a detailed explanation of the SAR data stack exploited and PSI processing undertaken. PS densities retrieved over the Roman monuments are critically discussed to assess the performance of COSMO-SkyMed imagery and StaMPS for geospatial analysis at the site to the single-building scale (Section 3.1). Condition assessment of heritage assets is demonstrated in Section 3.2 with examples from:
(i)
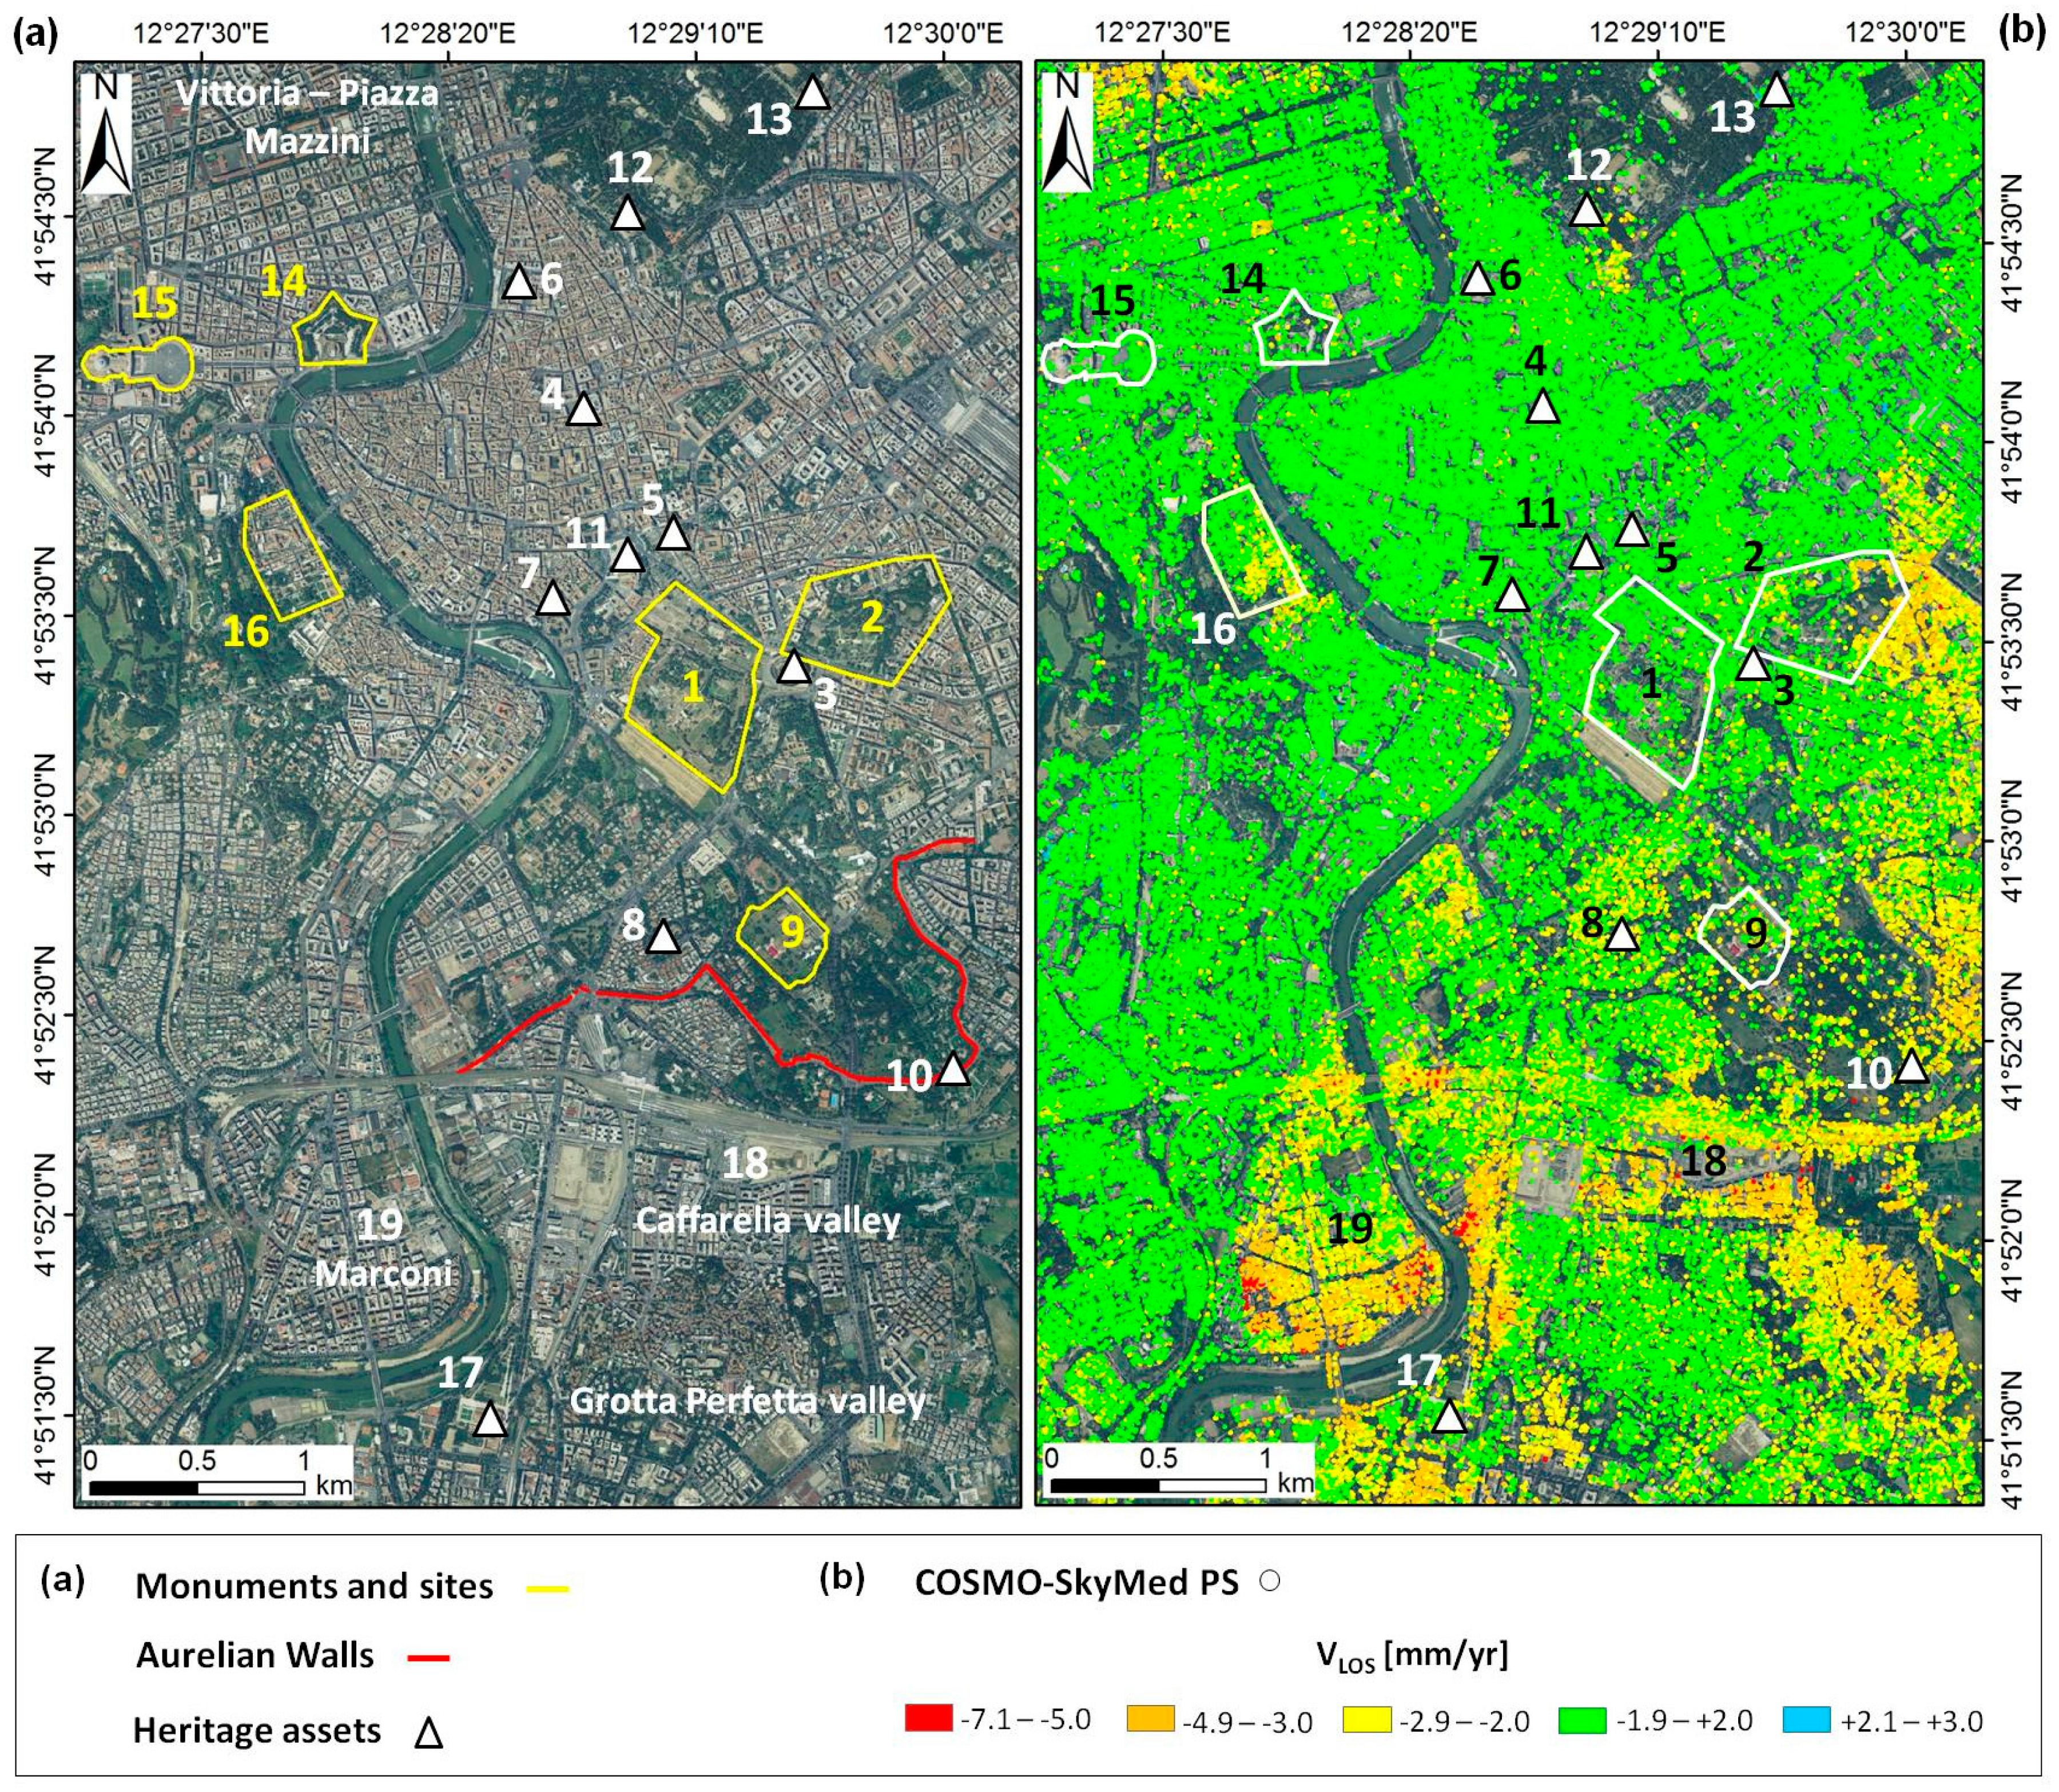
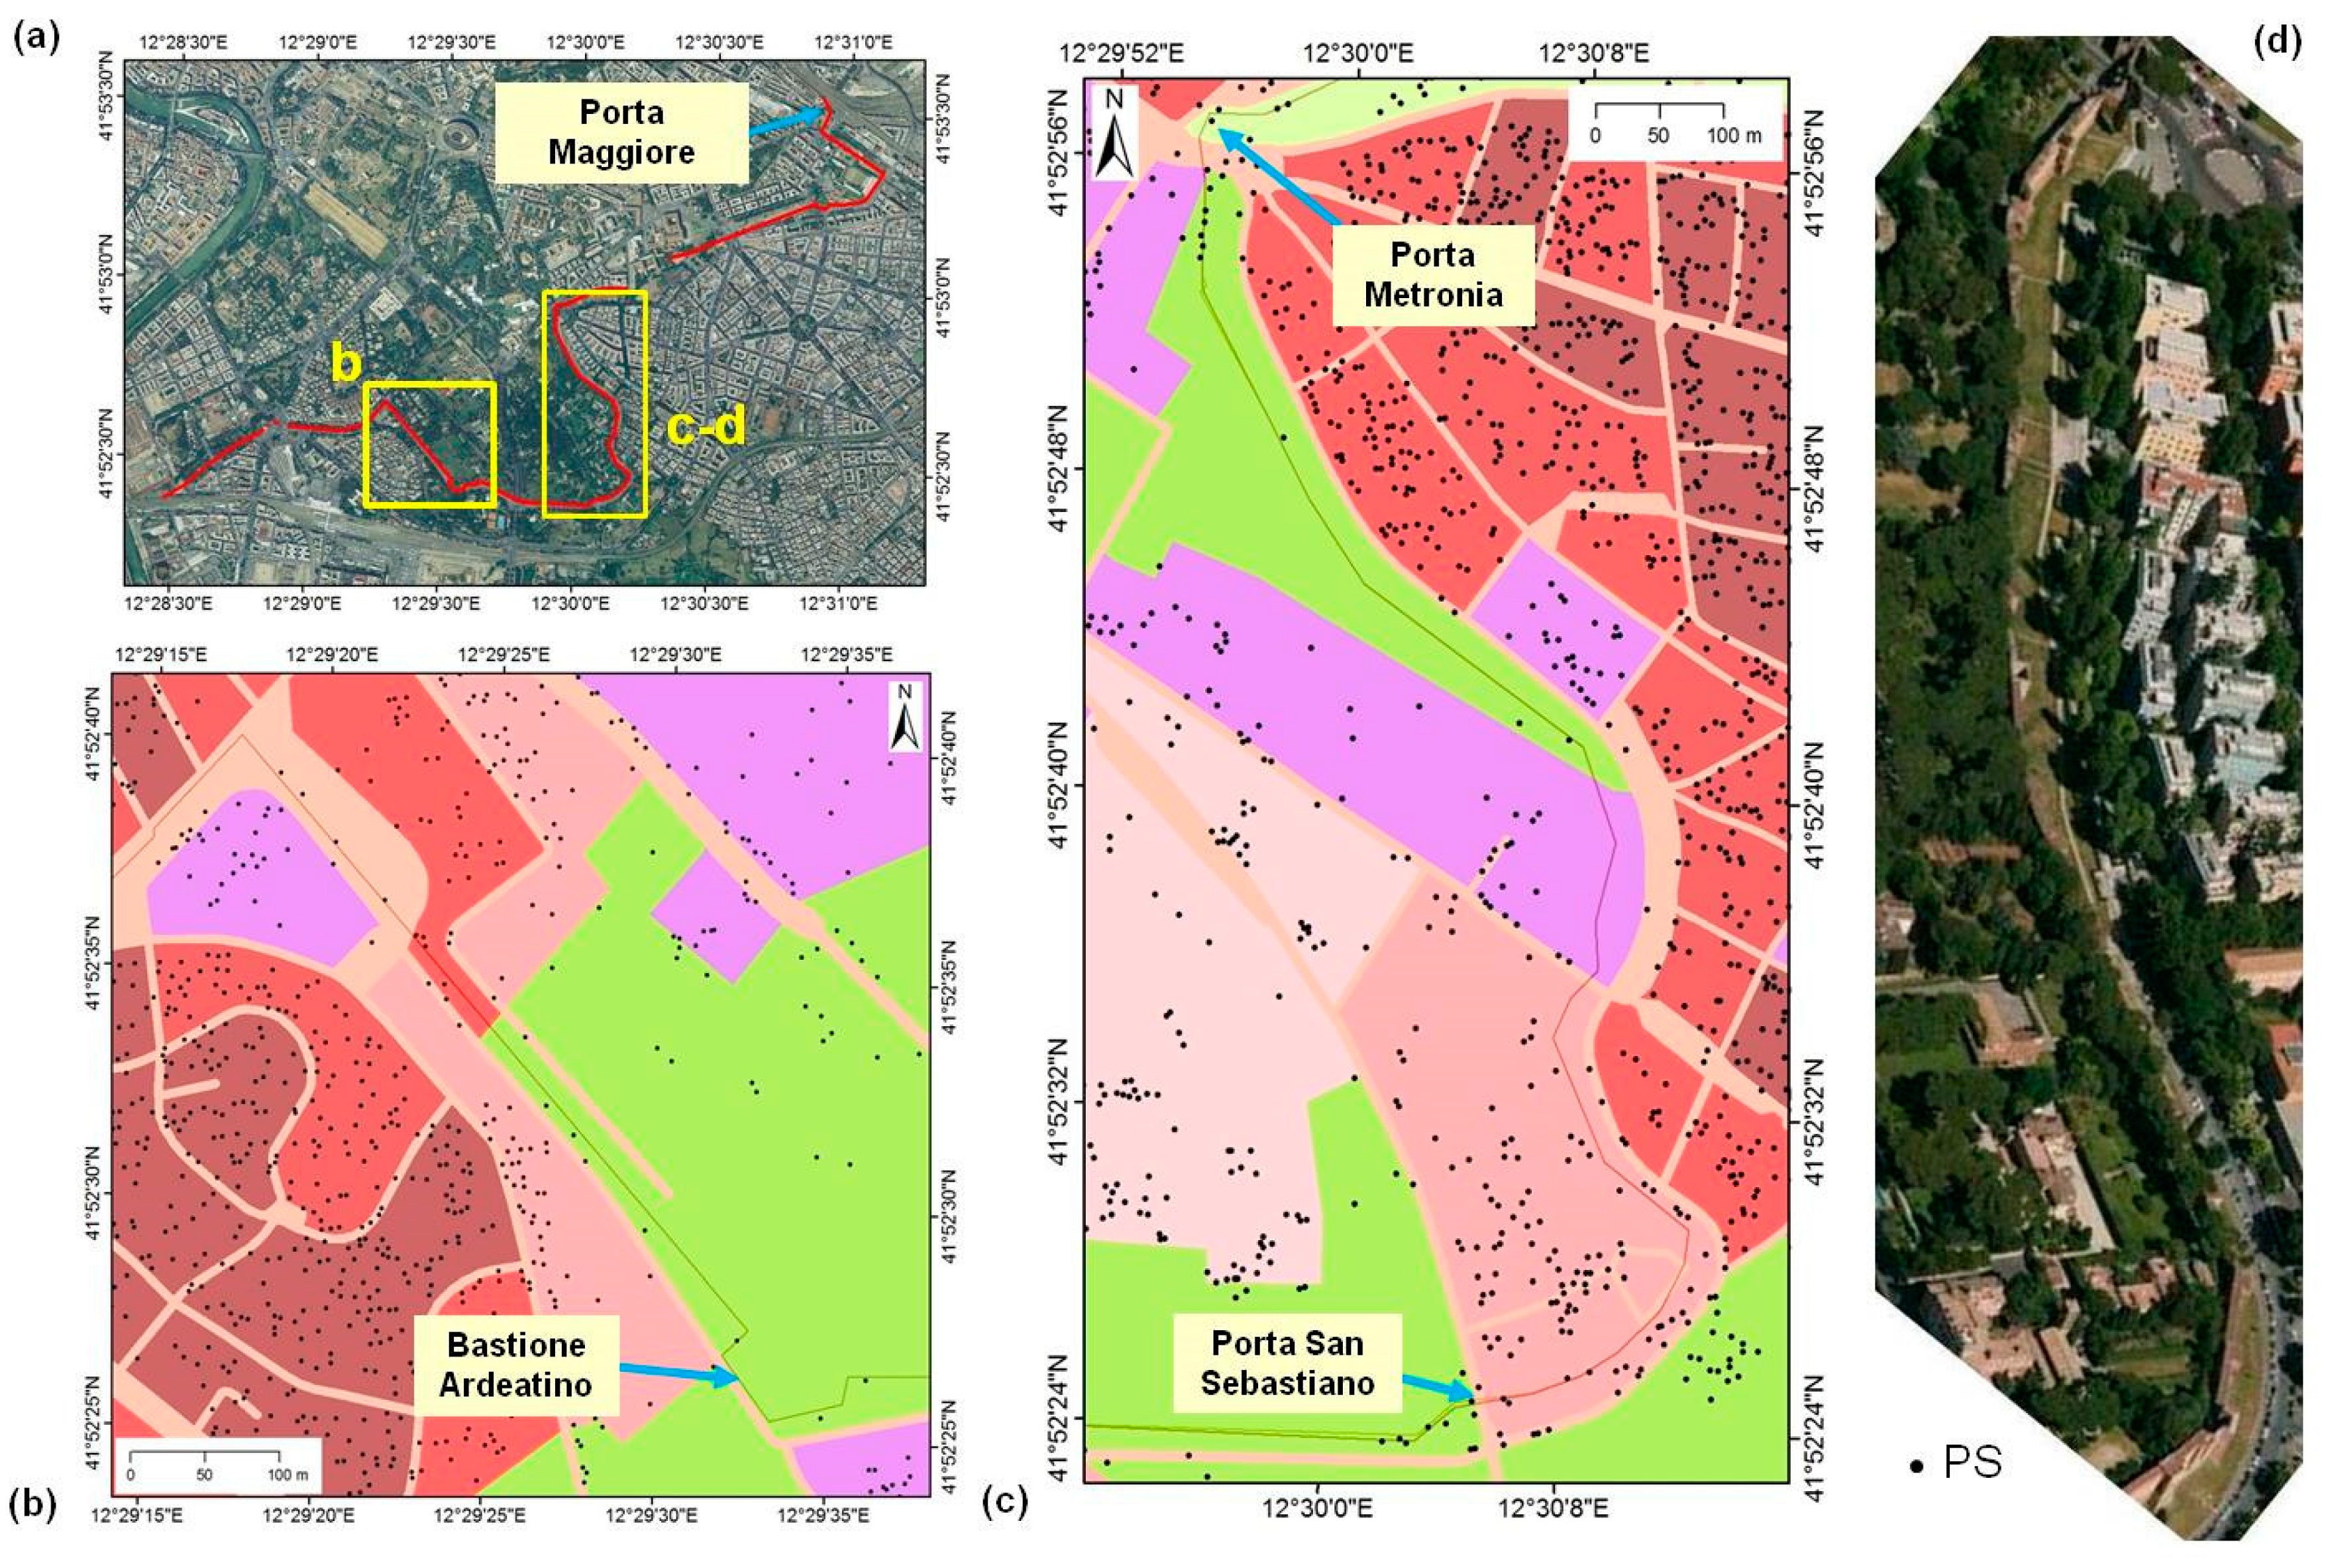
The central archaeological area, including the Palatine and Oppian Hills, Colosseum and Baths of Caracalla, as well as the Aurelian Walls (which conventionally define the historic centre of Rome); the major causes of instability are due to local geohazard factors related to bedrock and outcropping geology, anthropogenic deposits and cavities, as well as deterioration (cf. [15,16] and the references therein for a wider introduction to geohazards in Rome);
(ii)
Modern buildings dating back to the medieval-Renaissance period to 19–20th century, such as the papal fortress of Castel Sant’Angelo and the Basilica of St Paul Outside-the-Walls;
(iii)
Residential quarters adjacent to the Tiber River, where subsidence phenomena due to the compression of very fine-grained and organic soils are well-known, and investigated at some extent with InSAR techniques (e.g., [7,17]).
Figure 1. COSMO-SkyMed StripMap HIMAGE SAR image frame acquired along ascending orbits over the city of Rome, central Italy (© ASI (Agenzia Spaziale Italiana), all rights reserved), overlapped on SRTM DEM, with the identification of the processed subset and the location of the reference point used for the Stanford Method for Persistent Scatterers (StaMPS) processing.
Remotesensing 06 12593 g001
Throughout the discussion, COSMO-SkyMed results are compared with PSI outcomes of InSAR processing of archived C- and X-band data that have been published in the recent literature. Our comparative assessment focuses on areas where the deformation history of which has been analysed and validated by other authors and aims to highlight the persistence of instability or stable conditions in the years 2011–2013.
This research was carried out in the framework of the “Smart management of cultural heritage sites in Italy and China: Earth observation and pilot projects”, a bilateral cooperation programme funded by the Italian Ministry of Foreign Affairs and started in 2013 between Italy and China and, in particular, the Institute of Methodologies for Environmental Analysis (IMAA) and Institute for Archaeological and Monumental Heritage (IBAM) of the National Research Council (CNR) of Italy, the Institute of Remote Sensing and Digital Earth (RADI) of the Chinese Academy of Sciences (CAS) and the International Centre on Space Technologies for Natural and Cultural Heritage under the Auspices of UNESCO (HIST) in Beijing.
Advances in knowledge, methods and technologies are being achieved by this project by using space- and air-borne active and passive remote sensing, geophysical prospecting, terrestrial surveying, virtual reality and geomatics, to support site discovery, monitoring and smart management of UNESCO cultural heritage sites, which require constant monitoring to preserve their integrity [18].
Moreover, the case study of Rome is also part of scientific activities carried out by CNR-IBAM, CNR-IMAA and ASI on the assessment of the capability of COSMO-SkyMed data for applications in the field of cultural heritage.

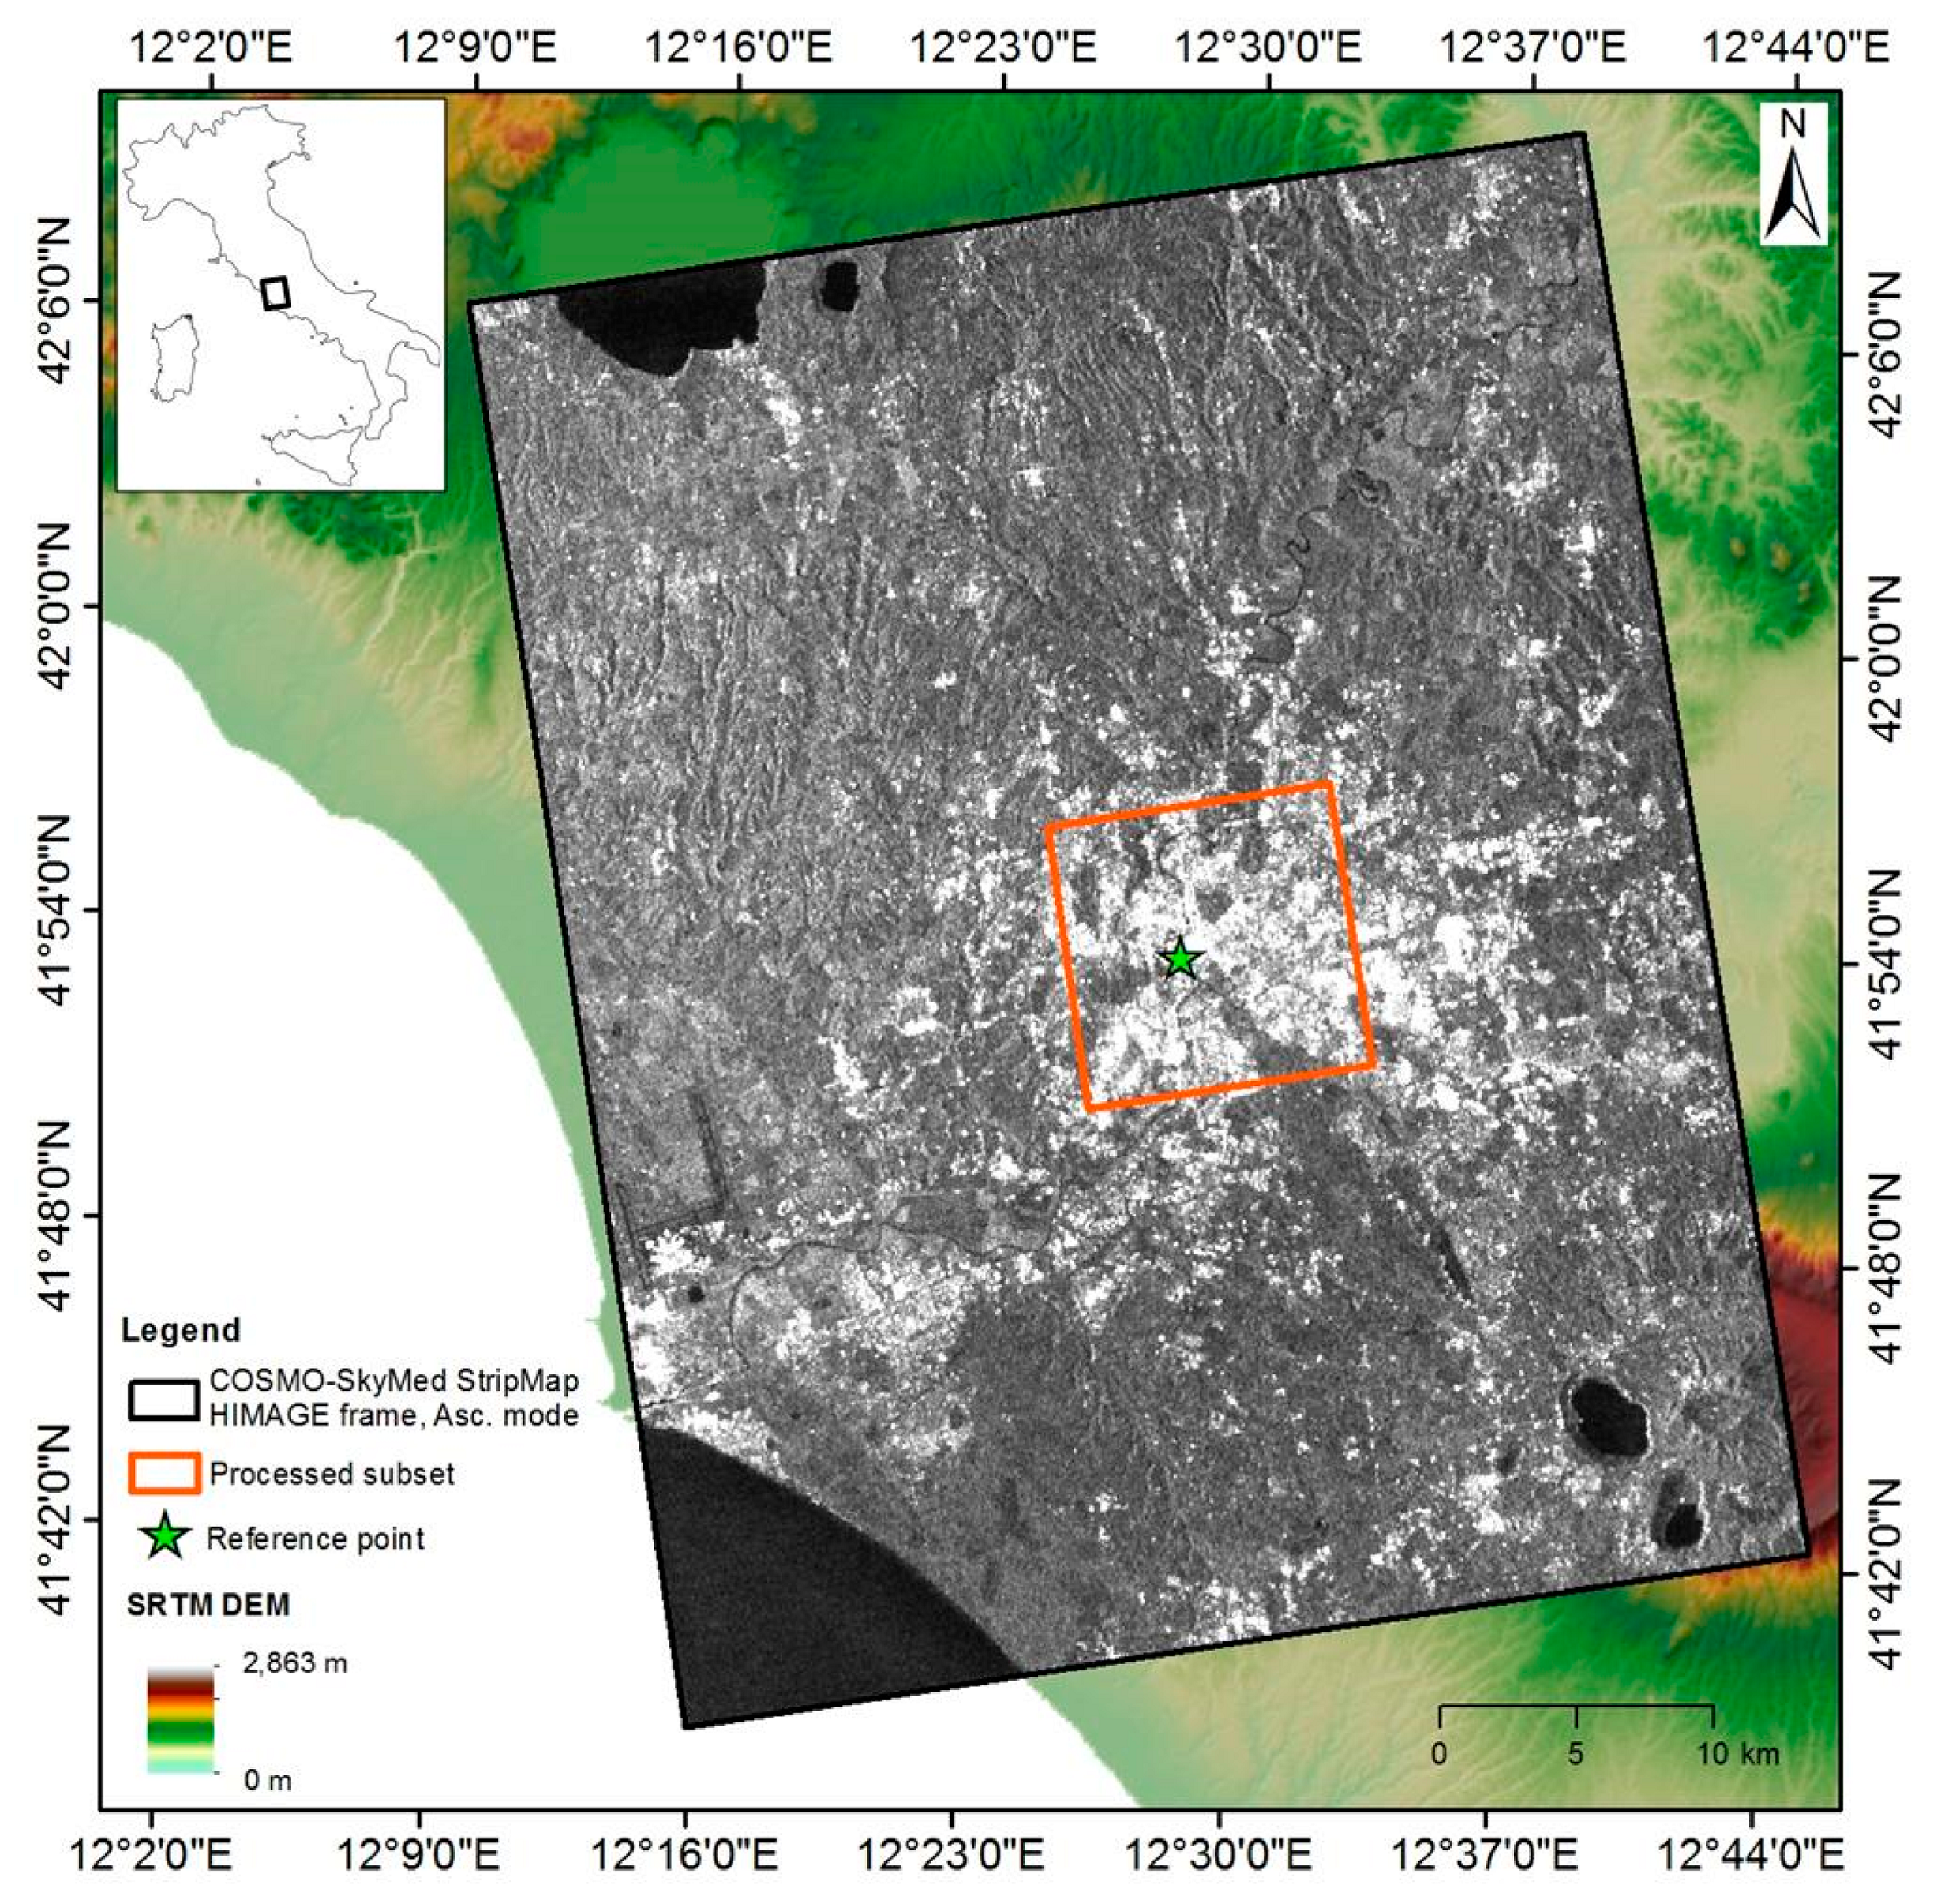
2. SAR Dataset and PSI Processing
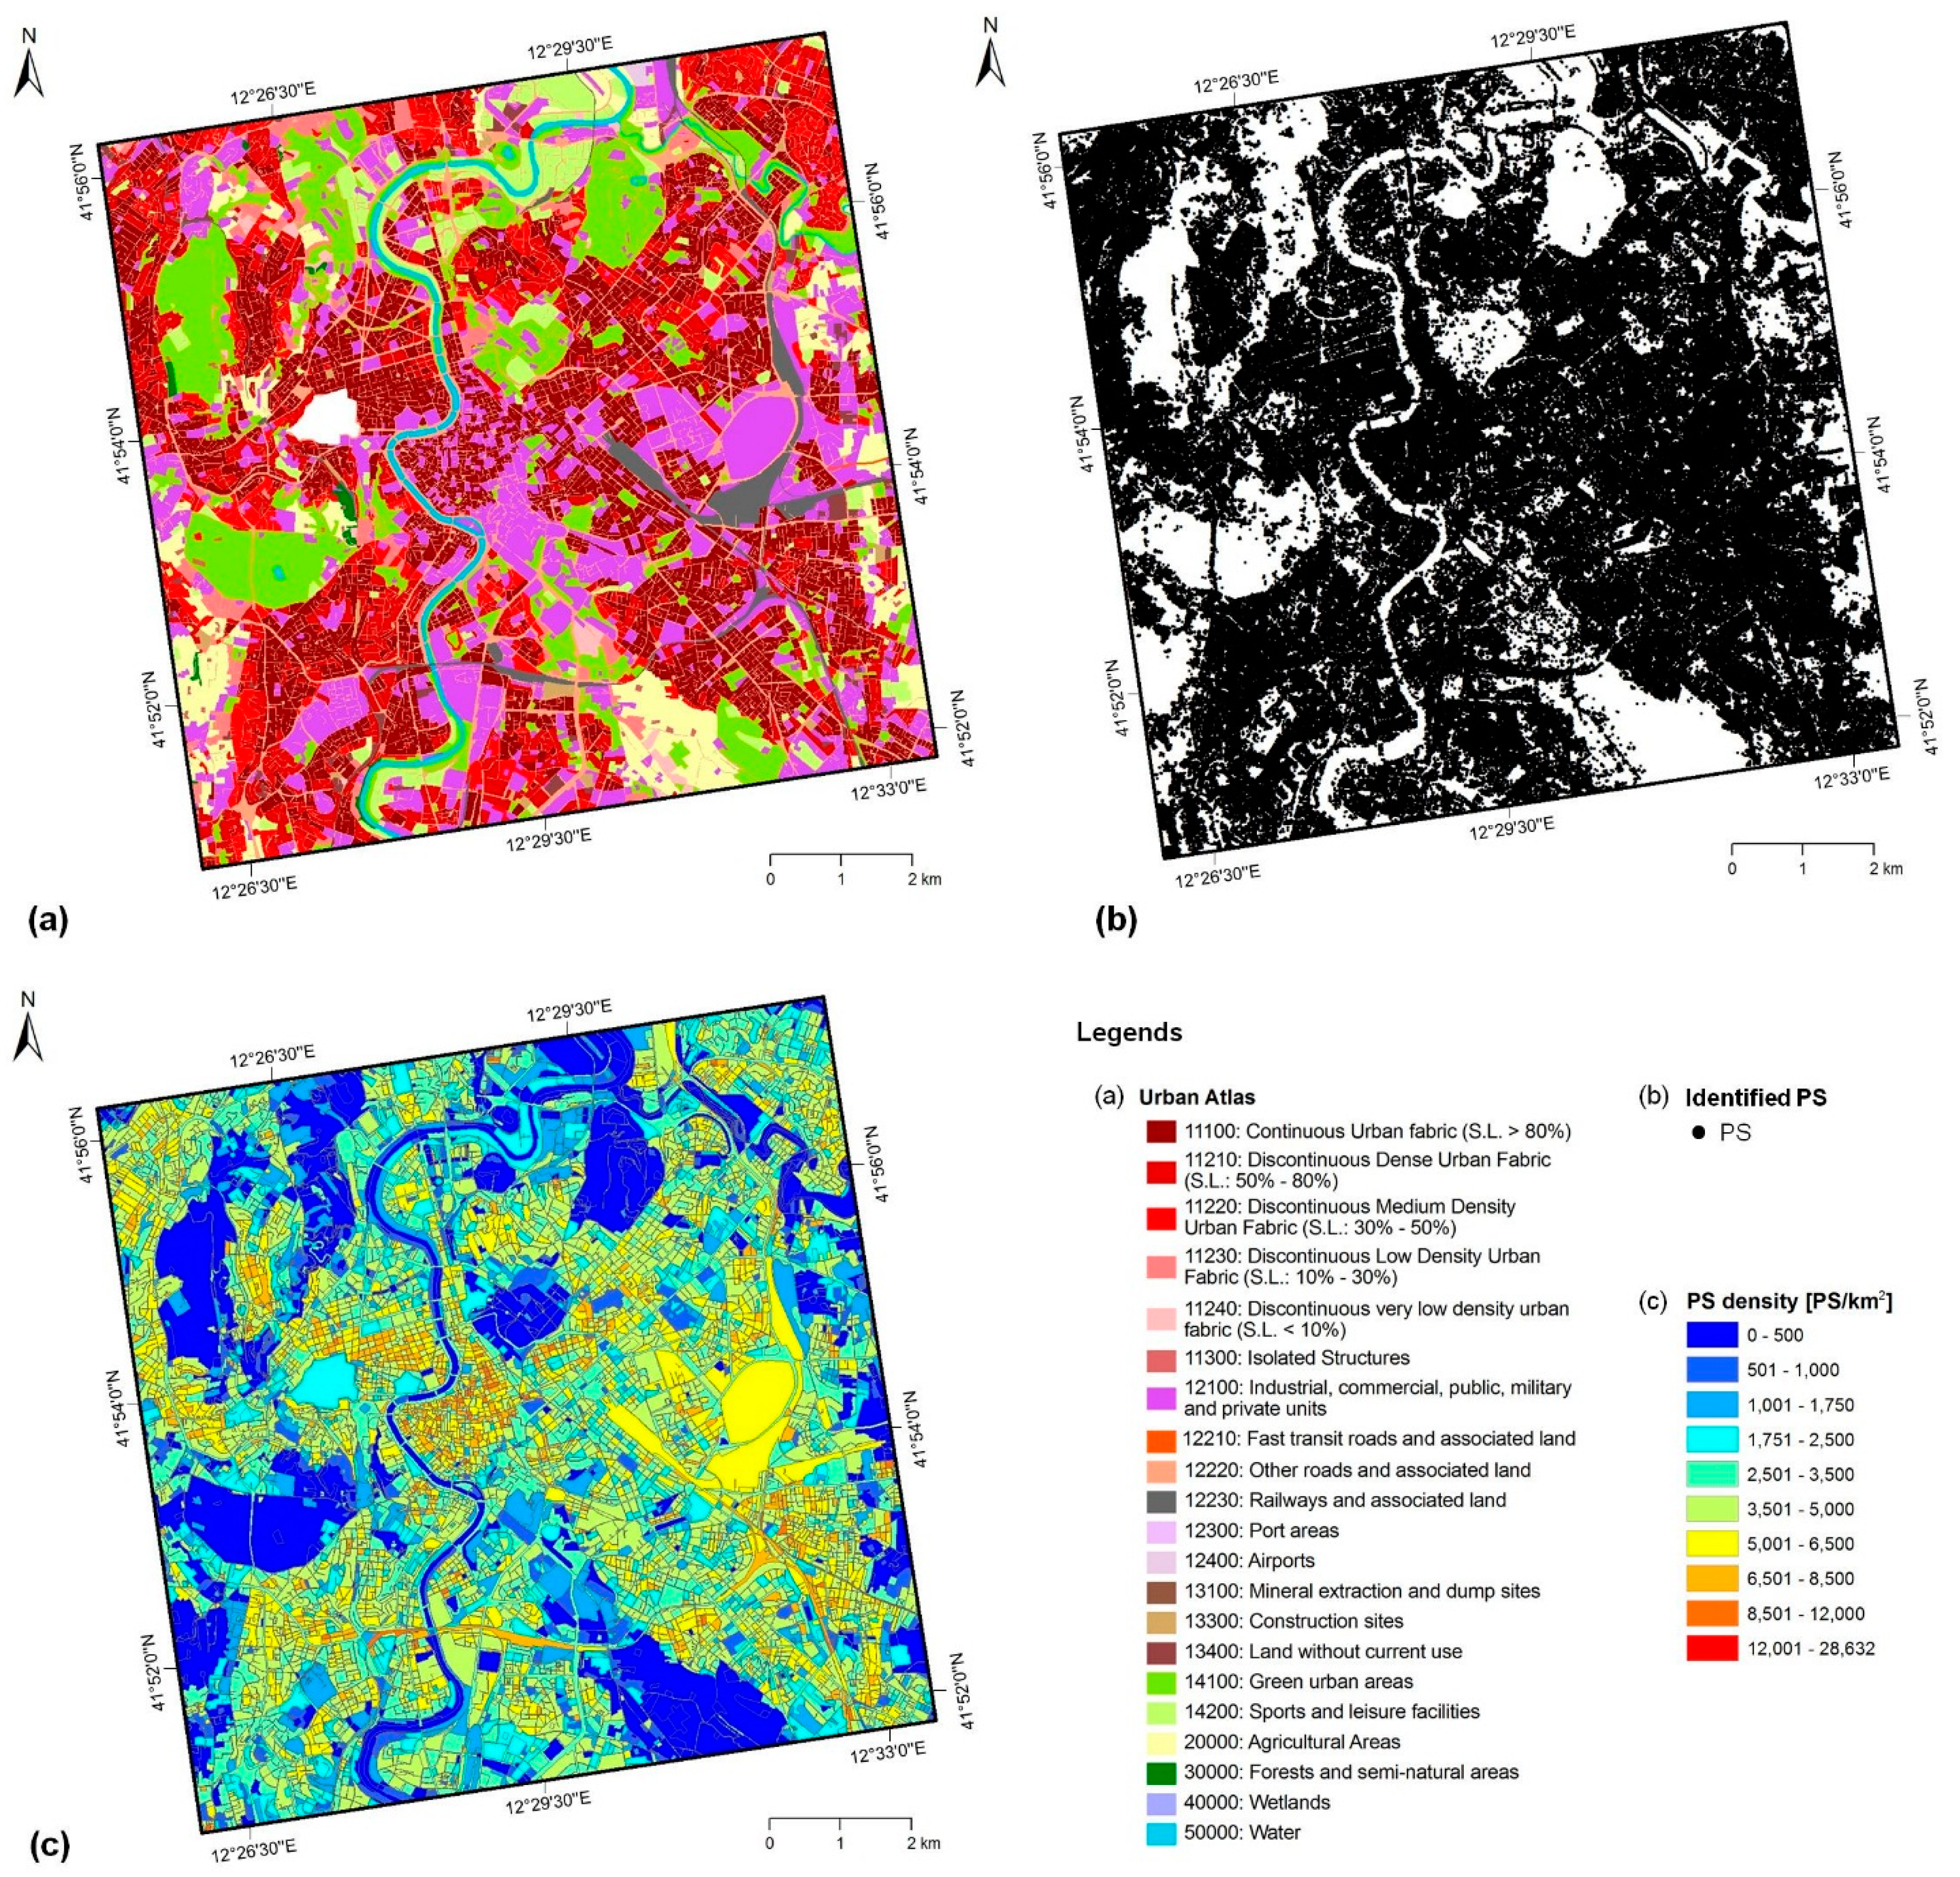
Our data stack consists of 32 StripMap HIMAGE, right-looking, ascending mode scenes with an image swath of 40 km, which were acquired at 3-m resolution and with HH polarization, between 21 March 2011 and 10 June 2013, from the SAR sensors on-board the four satellites of the COSMO-SkyMed constellation, at a ~620-km altitude above the Earth’s surface (Figure 1). These images were made available through the MAP-Italy project, a nationwide monitoring plan developed by ASI in cooperation with the Centres of Competence of the National Civil Protection Department of Italy, aiming to create and routinely populate an archive of COSMO-SkyMed StripMap imagery suitable for InSAR applications, in support of hydrological, volcanic and seismic risk management. For the analysed stack, the revisiting time is mostly equal to 16 days, with only occasional gaps within the time series, the longest of which occurred between 2 December 2011 and 10 August 2012.
The COSMO-SkyMed stack was acquired in H4_05 Beam mode, with an LOS incidence angle of 34° at the scene centre, a minimum of 32.4° and a maximum of 35.5° at the near and far range, respectively, and a track angle of the satellite orbits of −9°. The orientation of the LOS at the scene centre and computation of its directional cosines via the approach described in [19] suggest that the LOS of the stack is capable of depicting 83% of vertical motion, 55% of E-W motions and only 9% of N-S motions.
The images were processed using the StaMPS software and technique [14], which is a single master, PSI approach. The scene acquired on 28 August 2011, was used as the master to minimise the temporal and normal baselines of the interferograms to be formed. A subset of the full scene was selected (Figure 1), centred at the location 12.485°E, 41.900°N, hence at the Quirinal Palace. This subset extends 10.5 km along the range direction (i.e., ENE-WSW) and 10.4 km along the azimuth direction (i.e., NNW-SSE) and covers a total of ~109 km2.
Following the approach commonly adopted in StaMPS [14,20] for the identification of the initial set of PS candidates to form the first order reference network, the amplitude dispersion criterion [11] was employed, with a relaxed threshold of 0.6. This means that targets showing a ratio between the standard deviation and mean of their SAR amplitude lower than 0.6 were considered at the first stages of the processing during the preliminary parameters estimation, whilst pixels with higher phase dispersion, typically across water bodies and densely vegetated areas, were discarded.
Initial topographic components were subtracted from the differential interferograms by using elevation information from the Shuttle Radar Topography Mission (SRTM) DEM at 90-m resolution provided by NASA [21]. The residual interferometric phase was then analysed by using a combination of low pass and adaptive phase filters [14,20], which exploit the spatial and temporal characteristics of the various components of the interferometric phase, to discriminate those relating to deformation, the residual topographic signal due to DEM errors, orbital inaccuracies, atmosphere and noise. A simple linear model of phase variation through time was assumed to extract phase components relating to deformation.
COSMO-SkyMed PS results from the StaMPS processing consist of a dataset of more than 310,000 radar targets (Figure 2b), with average density across the processed region of interest of ~2800 PS/km2 (Figure 2c). As commonly found by analysing PS results over areas with mixed land use (see, for instance, [22]), the distribution of the identified targets is controlled by land cover. According to the Global Monitoring for Environment and Security (GMES) European Urban Atlas (IT001L) of Rome at 1:10,000 scale [23], the most represented land cover classes within the processed frame are: Code 11100, continuous urban fabric (Sealing Layer, S.L. > 80%); 12100, industrial, commercial, public, military and private units; 12220, other roads and associated land; 11210, discontinuous dense urban fabric (S.L.: 50%–80%); and 14100, green urban areas, which account for ~84% of the region of interest (Figure 2a; Table 1). As expected, denser PS networks with 2300 to 6000 PS/km2 are found across continuous and discontinuous urban fabric, with railways and associated land (Code 12230) as the most populated class, while very low densities are found over urban parks and vegetated land (Figure 2a–c). A density of 365 PS/km2 is obtained over green urban areas (Code 14100), which include, among others, the whole archaeological park of the Oppian Hill (i.e., No. 2 in Figure 3a; see also Figure 5) and the vegetated eastern slope of the Palatine Hill, along Via di S. Gregorio (see Figure 4b).
Despite the general stability of the processed region of interest, which is revealed by the evidence that, on average, the entire dataset shows a −1.19 ± 1.29 mm/y LOS motion rate across the whole processing area, there are a number of sectors of the city highlighting a moderate ground motion velocity (Figure 3b). These are mostly in the direction away from the satellite sensor, with up to −7.10 mm/y LOS annual rates, and are concentrated in the Marconi and Garbatella quarters, Basilica of St. Paul Outside the Walls (i.e., No. 17 in Figure 3a; see also Figure 11) and VIII Tuscolano to the south, V Nomentano and the Tiburtina station nearby to the east (in agreement with findings by Scutti et al. [24]), as well as some sectors of Vittoria (Piazza Mazzini) and I Flaminio quarters, adjacent to the Tiber River. LOS velocity standard deviations range between 0.3 mm/y in the proximity of the reference point location (which was set in a central position within the processed area, at 12.473°E 41.896°N, i.e., north-west of Piazza Venezia; Figure 1) and 3 mm/y at the outskirts of the processed region of interest.
Figure 2. (a) Land cover for the city of Rome within the processed subset (cf. Figure 1) from the Global Monitoring for Environment and Security (GMES) European Urban Atlas (IT001L) of Rome at 1:10,000 scale [23]; (b) distribution of COSMO-SkyMed PS targets; (c) PS density observed across the Urban Atlas, including calculation for the territory of the Vatican, not included in the Urban Atlas (i.e., 1223 PS targets identified, 2427 PS/km2 on average).
Remotesensing 06 12593 g002
For our interpretation, we further processed the StaMPS results by converting LOS estimates to the vertical direction. The assumption that land motion occurred mainly along the vertical direction (in the form of either subsidence or ground heave) allowed us to reproject the LOS velocity values (VLOS) to the vertical direction, by dividing the LOS values by the directional cosine of the LOS, i.e., cos34°, hence 0.83. This results in the increase of all LOS velocity values by 21%, the COSMO-SkyMed LOS in this mode being capable of depicting 83% of pure vertical motions. Unless otherwise specified, PS deformation rates are expressed hereafter as vertical velocity (Vv).
Table 1. Observed number and average density of COSMO-SkyMed (CSK) PS for the different land cover classes of the Urban Atlas within the processed subset (cf. Figure 2). Sealing Layer, S.L.
CODEUrban Atlas ClassCoverage within CSK Processing AreaNo. PSAverage PS Density (PS/km2)
(km2)(%)
11100Continuous urban fabric (S.L. > 80%)23.73522.04108,4804570
11210Discontinuous dense urban fabric (S.L.: 50%–80%)13.32112.3748,0543608
11220Discontinuous medium density urban fabric (S.L.: 30%–50%)4.1563.8611,1142674
11230Discontinuous low density urban fabric (S.L.: 10%–30%)2.2922.1336821607
11240Discontinuous very low density urban fabric (S.L. < 10%)0.5740.53369643
11300Isolated structures0.1200.11110916
12100Industrial, commercial, public, military and private units18.29917.0060,7923322
12210Fast transit roads and associated land0.0280.031344756
12220Other roads and associated land14.57513.5442,8792942
12230Railways and associated land2.4162.2414,3855955
12400Airports0.0990.091561572
13100Mineral extraction and dump sites0.0120.0100
13300Construction sites0.5130.4811622266
13400Land without current use0.9520.8811131169
14100Green urban areas14.07013.075,135365
14200Sports and leisure facilities4.9274.5887351773
20000Agricultural + semi-natural areas + wetlands5.8385.422265388
30000Forests0.2790.2698352
50000Water bodies1.4671.3613793

3. Results and Discussion

The COSMO-SkyMed PS dataset obtained from the StaMPS processing was analysed with regard to: (i) the spatial coverage and distribution of scatterers over the urban environment and, specifically, the heritage assets of Rome (Section 3.1); and (ii) the deformation estimates that could elucidate the condition of the manmade structures of interest. Throughout the discussion, comparative evaluation is done against the outcomes of previous research carried out with C- and X-band SAR imagery as they are published in the literature (Table 2), taking into account differences in the satellite data stacks used, processing algorithms applied and discrepancies in temporal coverage. It is worth noting that attention is given to those sectors of the historic centre of Rome and its surrounding quarters for which the published studies proved a specific deformation history, with ground-truth validation and/or correlation with other monitoring data and geophysical investigations.
The reader should refer to Figure 3a to localize the site or monument discussed here below, following the numbering therein. Even at a small scale, the StaMPS results already provide an overview of the distribution of the major deformation patterns observed in the years 2011–2013 (Figure 3), showing that some of the monuments, archaeological sites and heritage assets of Rome fall in areas affected by surface motions.
Table 2. Publications dealing with InSAR processing and radar interpretation over the historic centre and residential areas of Rome, Italy, which are recalled throughout the paper for comparative evaluation. SBAS, Small BAseline Subset; IPTA, Interferometric Point Target Analysis; asc., ascending orbit; desc., descending orbit.
AuthorsProcessing TechniqueData StackIntervalSpatial Coverage
Tapete et al., 2013SqueeSAR™RADARSAT-1 asc.March 2003–February 2010Southern Aurelian Walls
Tapete et al., 2012PSInSAR™ERS-1/2 desc.April 1992–December 2000Palatine Hill and Roman Forum
SqueeSAR™RADARSAT-1 asc.March 2003–February 2010Palatine and Oppian Hills, Roman Forum
RADARSAT-2 desc.June 2008–June 2010Oppian Hill
Comerci et al., 2012PSInSAR™ERS-1/2 desc.April 1992–December 2000Municipality of Rome
ENVISAT ASAR desc.October 2003–July 2005
Ardizzone et al., 2012SBASCOSMO-SkyMed asc.July 2010–September 2011Torrino area
Scutti et al., 2013SBASCOSMO-SkyMed asc.2010–2011/2011–2012Historic centre of Rome, Ancient Ostia
Zeni et al., 2011SBASERS-1/2 desc.June 1992–August 2007Palatine Hill, Colosseum, Vittoriano
ENVISAT ASAR desc.November 2002–January 2010
Fornaro et al., 20104D SAR imagingERS-1/2 desc.May 1995–June 2000Grotta Perfetta area
Manunta et al., 2008SBASERS-1/2 desc.May 1995–June 2000City centre, Marconi, Piazza Mazzini
Stramondo et al., 2008IPTAERS-1/2 desc.October 1995–October 1999City centre, Marconi, Piazza Mazzini
ENVISAT ASAR desc.November 2002–April 2005City centre, Basilica St. Paul

3.1. PS Densities and Spatial Coverage

Among the dataset of PS identified (see Section 2), we focus our attention on the coverage obtained over the heritage assets of the historic city centre. This aspect is crucial, since the availability of PS over the monuments of interest is the essential requisite to assess their condition. End-users, such as archaeologists and conservators, demand detailed information on the structural health of built heritage, and the metre-level resolution of COSMO-SkyMed imagery can even inform at the scale of a single architectural element. In this paper, the comparative considerations with respect to PS densities that were obtained from previous studies (Table 2) are therefore made following this end-user-driven perspective.
Figure 3. (a) Aerial view of the historic centre of Rome from the orthophoto acquired in 2008 [25], with the location of the monuments and sites, heritage assets and linear archaeological features, the deformation of which is investigated in this paper: (1) Palatine Hill and Roman Forum; (2) Oppian Hill, Baths of Trajan and Cisterna delle Sette Sale; (3) Colosseum; (4) Marcus Aurelius’ Column; (5) Trajan’s Column and Imperial Forums; (6) Mausoleum of Augustus; (7) Porticus Octaviae; (8) Basilica di San Saba; (9) Baths of Caracalla; (10) Porta San Sebastiano and Arch of Drusus; (11) Vittoriano; (12) Villa Medici; (13) Galleria Borghese; (14) Castel Sant’Angelo; (15) Basilica of St. Peter, Vatican; (16) Via delle Mantellate, Trastevere; (17) Basilica of St. Paul Outside the Walls; (18) Caffarella quarter; (19) Marconi quarter. Numbering follows the order of site-specific discussion in Section 3.2. (b) Spatial distribution and associated VLOS estimates of the COSMO-SkyMed StripMap HIMAGE PS (March 2011–June 2013) obtained from the StaMPS processing (cf. also Figure 2b).
Remotesensing 06 12593 g003
Over the archaeological site of the Palatine Hill and Roman Forum (i.e., No. 1 in Figure 3a), more than 800 PS were identified (Figure 4), with a PS density greater than 2200 PS/km2 (Figure 2c). Most of the archaeological sectors are covered by radar targets, with the exception of the western side of the Palatine Hill and the Domus Tiberiana located at its NNW corner, where very few PS were retrieved (Figure 4a). The limited number of deformation estimates therefore prevents any deformation analysis to be performed with regard to the years 2011–2013, though for this area, RADARSAT-1 ascending data (2003–2009) had highlighted ongoing instability over the Temple of Magna Mater in the SW corner of the Palatine Hill and stabilization of the Domus Tiberiana owing to recent restorations [8]. In this area, the majority of the PS falls over the exposed bare surfaces and the standing structures of the Palatine Hill. Nonetheless, as demonstrated in the zoomed views in Figure 4b–d, some PS are found in areas of vegetation. In this regard, this is a misleading visual effect due to the multi-layering with the orthophoto, for which a minor shift was found. This effect has been accounted for during local-scale interpretation of the data.
Figure 4. (a) VLOS of the COSMO-SkyMed PS (March 2011–June 2013) over the archaeological site of the Palatine Hill and Roman Forum and the Colosseum (i.e., Nos. 1 and 3, respectively, in Figure 3a), with the indication of (b) the arches of the Domitian aqueduct along Via di San Gregorio, (c) the Convento di San Bonaventura al Palatino and (d) the Chiesa di Sant’Anastasia and archaeological ruins in the SW corner of the Palatine Hill, the latter being also depicted in the aerial photograph from BingMaps (© 2014 BLOM, © 2014 Microsoft Company).
Remotesensing 06 12593 g004
Similar PS density is retrieved over the neighbouring Oppian Hill (i.e., No. 2 in Figure 3a), with over 660 PS (i.e., ~2150 PS/km2; Figure 5a). This value is higher than that found across the whole land cover class of green urban areas (cf. Section 2 and Figure 2c), an effect of the widespread presence of archaeological ruins across the site that have acted as persistent radar scatterers. Different clusters of ruins belonging to Nero’s Golden House (Domus Aurea) and the Baths of Trajan are covered by PS, although a significant portion of the archaeological park is densely vegetated (Figure 5b,d). For speculative comparison, SqueeSAR™ processing of a longer stack of RADARSAT-1 ascending mode data (composed of 87 images, at 8-m resolution, with a 24-day nominal repeat cycle) resulted in ~3000 measurement points, but these included not only PS, but also distributed scatterers (DS) [8].
Figure 5. (a) Land cover and distribution of the identified PS targets (black dots) over the archaeological park of the Oppian Hill (i.e., No. 2 in Figure 3a), with the indication of (b) the terrain overlying the buried structures of Nero’s Golden House and the central exedra, (d) the north-eastern exedra and the Roman cistern of the Baths of Trajan (i.e., Cisterna delle Sette Sale) and (c) the detail of the inner surface of the central exedra (photo by D. Tapete).
Remotesensing 06 12593 g005
Nonetheless, the coverage of our StaMPS results is inhomogeneous across the different sectors of the archaeological park. For instance, six PS are identified over the north-eastern exedra of the Baths of Trajan, while just a few tens of metres away, only two PS are found over the Roman cistern, known as Cisterna delle Sette Sale (Figure 5d). Compared with the higher densities obtained with the RADARSAT-1/2 SqueeSAR™ data (see [8,9]), the condition of the cistern can be assessed only partially by using our COSMO-SkyMed PS dataset, although these two PS were proven to be highly informative (cf. Section 3.2). The observed difference in the number of targets identified via the RADARSAT-1/2 and the COSMO-SkyMed analysis are related mainly to the difference in the processing approaches, i.e., SqueeSAR™ and StaMPS. Although greater numbers of targets are, generally, expected when processing higher resolution data, the number of observed COSMO-SkyMed PS is lower than the overall number of scatterers identified by SqueeSAR™. As mentioned above, this is due to the fact that SqueeSAR™ generates both PS and DS (which predominate across this area in the RADARSAT-1/2 results [8,9]), whilst conventional PSI approaches consider only point target signatures. The difference in the number of targets is also explained by taking into account the acquisition wavelength (i.e., 3.1 cm for TerraSAR-X, 5.6 cm for RADARSAT-1/2) and the decorrelation of natural terrain. X-band data are indeed more vulnerable to temporal decorrelation than C-band imagery, and this plays an important role in the identification of scatterers. Moreover, the lower number of scenes and shorter period covered by the COSMO-SkyMed stack compared to the RADARSAT-1/2 stacks are considered a further influencing factor for the potential to identify point scatterers in this area.
On the other side, the irregular spatial distribution of the PS results could also be attributed, to some extent, to human actions, such as archaeological excavations and restoration interventions. For instance, this is observed for the area overlying the buried structures of the western part of Nero’s Golden House (Figure 5b). As reported in [26], archaeological trial pits and consolidation works have been carried out since 2011–2012. These activities can significantly alter the radar signature of the scene imaged by the SAR sensors, thereby inducing a loss of coherence and inhibiting PS identification.
It is also interesting to analyse the results of the StaMPS processing with regard to the capability of PS identification over linear features. Along the 6 km-long southern portion of the Aurelian Walls (i.e., the Roman to modern walls erected to defend Rome by invaders; see red line in Figure 3a), only ~170 PS were found, indicating an average density of ~30 PS per linear kilometre (Figure 6). In addition to the presence or absence of vegetation, the planimetric orientation of linear structures with respect to the satellite LOS influences PS identification. As the orientation of linear structures gets closer to the satellite ground track (~N-S direction), the observed PS densities tend to increase. For instance, the sectors of the southern Aurelian Walls, where the highest number of targets was identified, coincide with those running from Via Castrense to Piazza di Porta Maggiore (see location in Figure 6a) and from Bastione Ardeatino to the corner of Via Ardeatina and Via Giotto, passed the arches over Via Guerrieri (Figure 6b). An additional detrimental effect is of course due to local vegetation cover. This is the case of the nearly N-S-oriented sector running along Via delle Mura Latine and Viale Metronio, up to Porta Metronia (Figure 6c). Despite the favourable orientation, dense vegetation cover worsens the visibility of the walls (Figure 6d) and causes most sections of this wall sector to be not covered by any radar scatterers (Figure 6c).
Satisfactory PS densities were obtained for the vast majority of monuments, with a total count of radar targets spanning from tens to hundreds of PSs per monument (for instance, for the Colosseum, Baths of Caracalla, Vittoriano and Basilica of St. Peter, Vatican (i.e., Nos. 3, 9, 11 and 15 in Figure 3a), though the spatial distribution of the identified PSs for these monuments varies significantly. While Baths of Caracalla and Vittoriano (Figure 7b and Figure 10, respectively) are fully covered by PS and the condition can be therefore assessed for the entirety of these monuments, the PSs are not homogeneously distributed over the Basilica of St. Peter, with only eight PS located over the apse and the lateral chapels (see Figure 8b).
Figure 6. (a) Aerial view of the Southern Aurelian Walls (red line in Figure 3a) with the location of the sectors (b) between Bastione Ardeatino and the corner of Via Ardeatina with Via Giotto and (c) along Via delle Mura Latine up to Porta Metronia, with respective land cover; (d) aerial photograph from BingMaps (© 2014 BLOM, © 2014 Microsoft Company) showing constraints due to vegetation cover.
Remotesensing 06 12593 g006
It is worth noting that the statistics in Table 1 seem to suggest the presence of scatterers in areas of water (Urban Atlas Code 5000) and an average target density greater than 90 PS/km2 for this land cover class. An analysis of the location of these scatterers, however, reveals that these PSs correspond with either structures, the size of which is negligible with respect to the mapping scale of the Atlas (i.e., 1:10,000), for instance small artificial islets and flood control structures along the Tiber River, or bridges, which misleadingly fall within polygons of water in the Atlas, e.g., the bridge of Via Guglielmo Marconi (cf. Figure 11).
Figure 7. (a) VHR WorldView-2 image depicting the monumental ruins of the Baths of Caracalla (courtesy of Planetek Italia) and (b) land cover and distribution of the PS targets identified with StaMPS.
Remotesensing 06 12593 g007

3.2. Condition Assessment of Heritage Assets

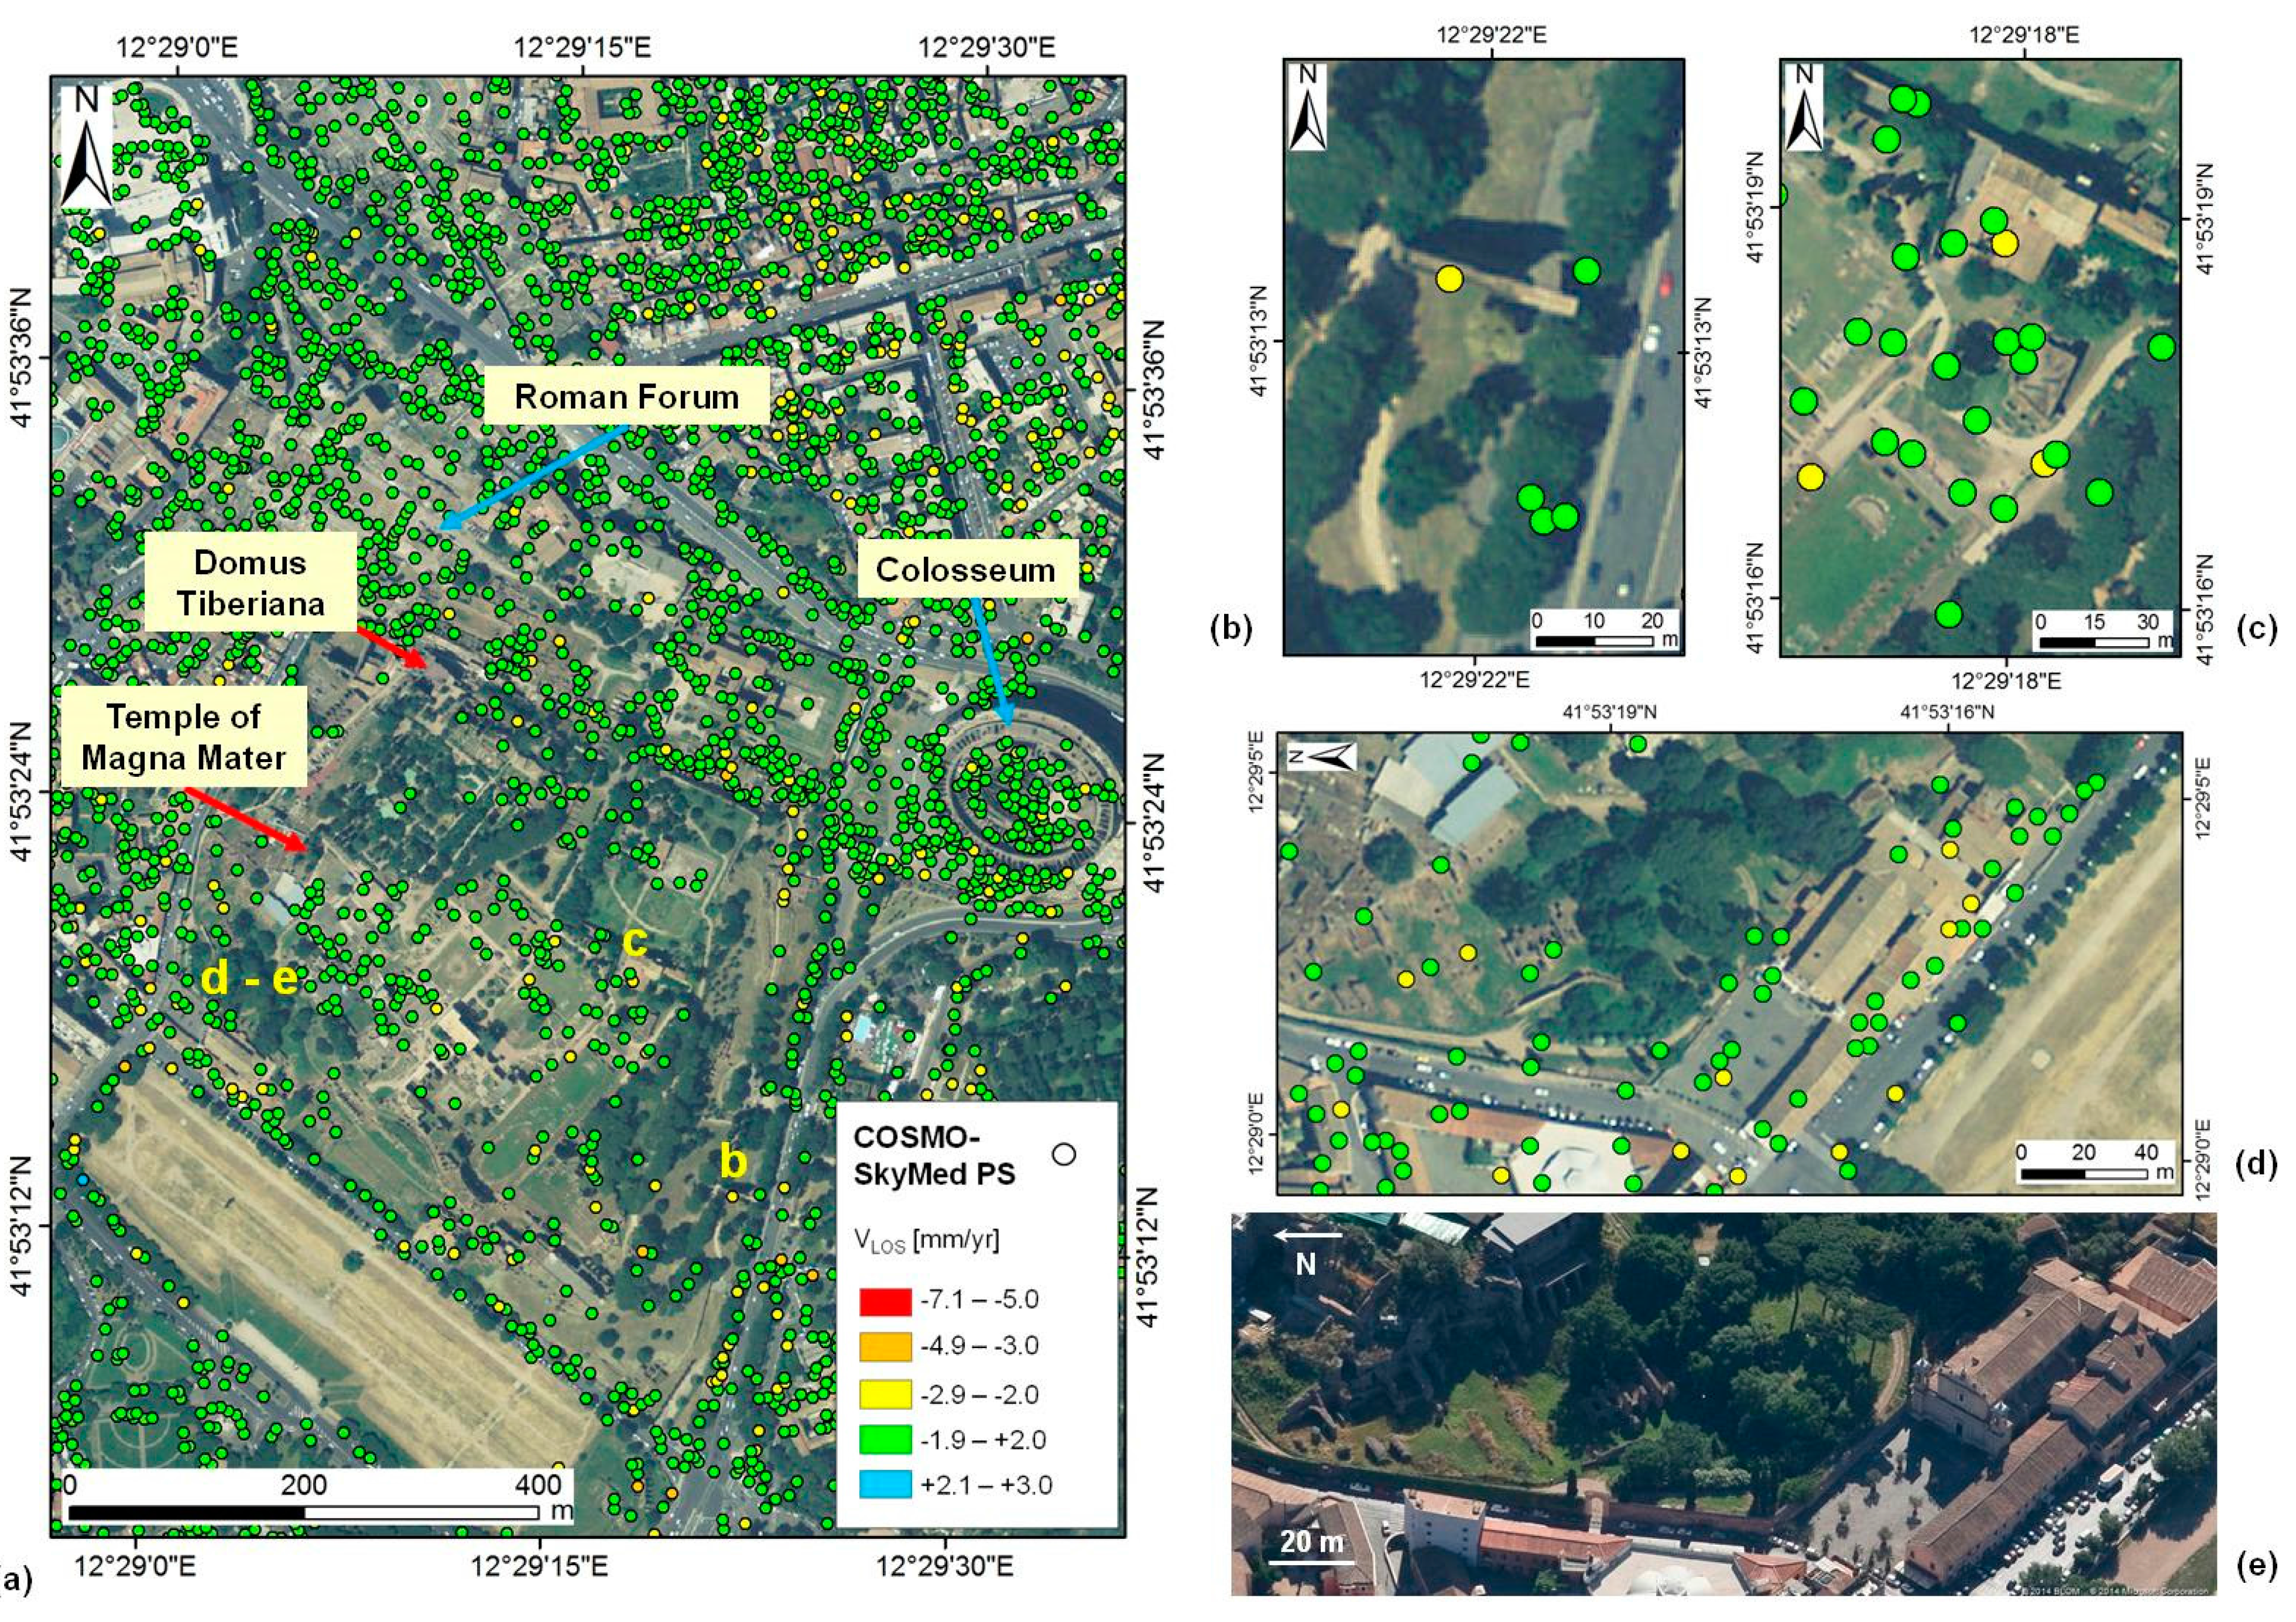
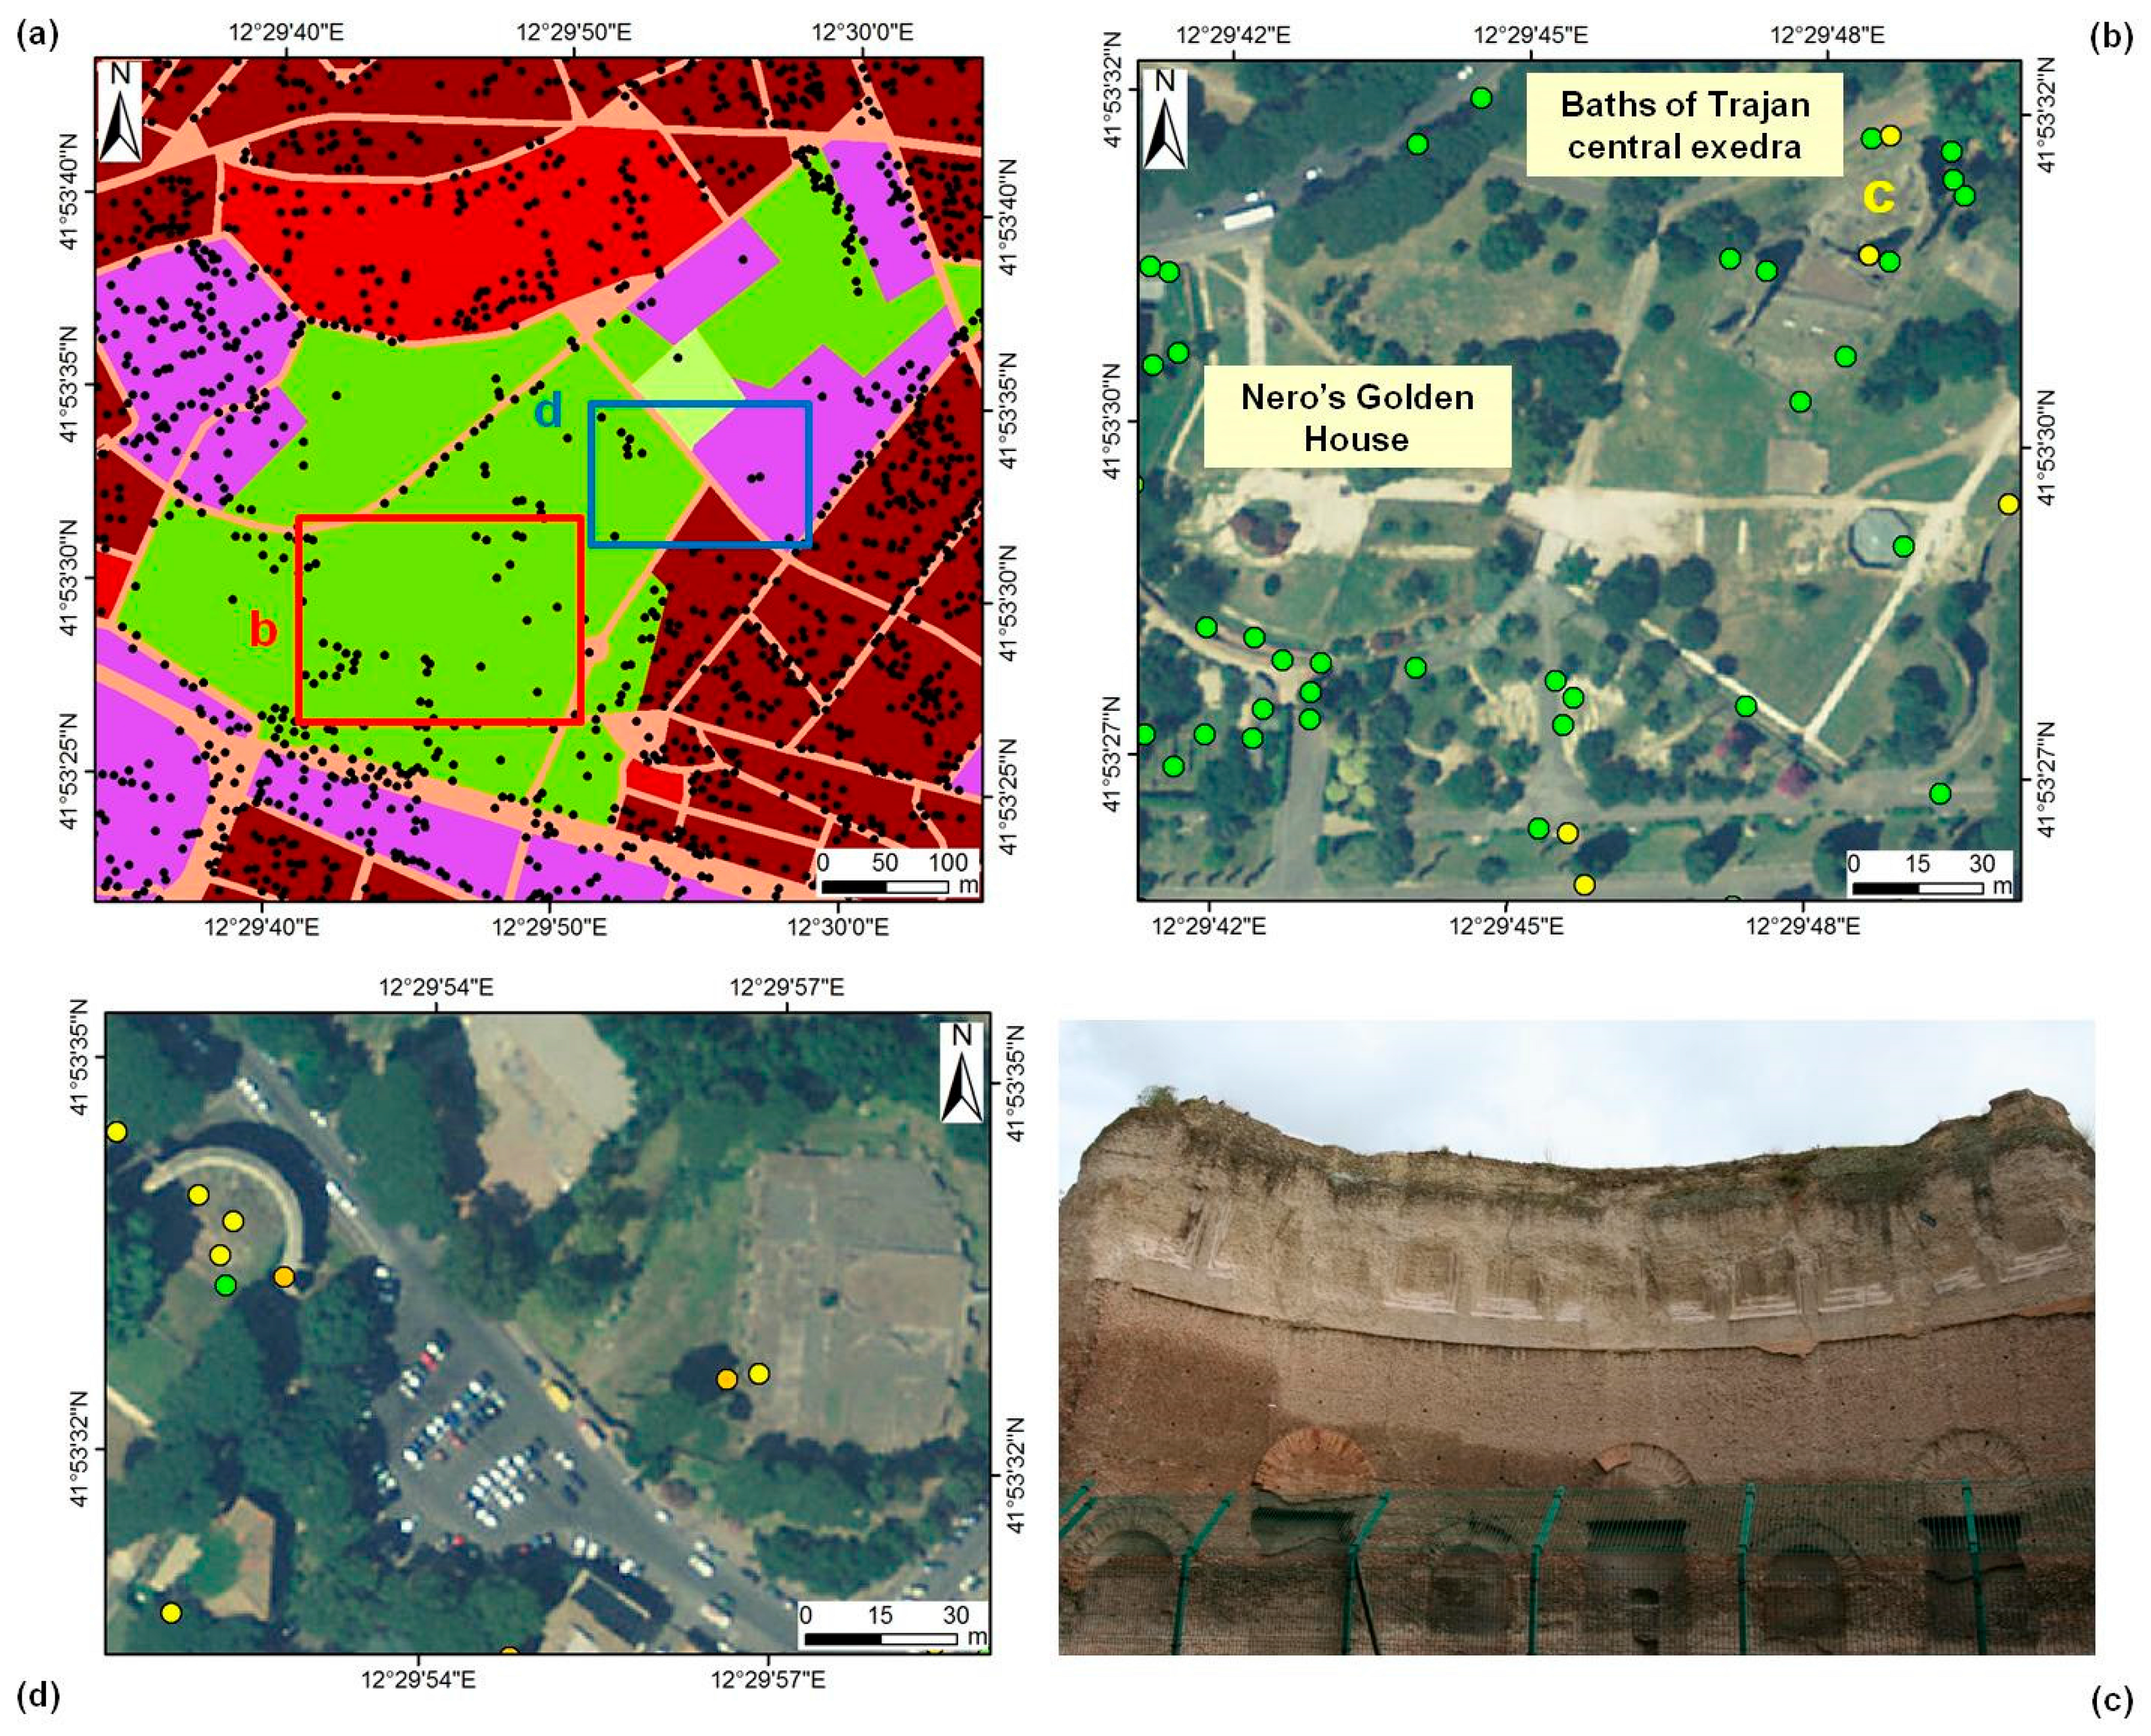
3.2.1. Archaeological Ruins and Ancient Monuments

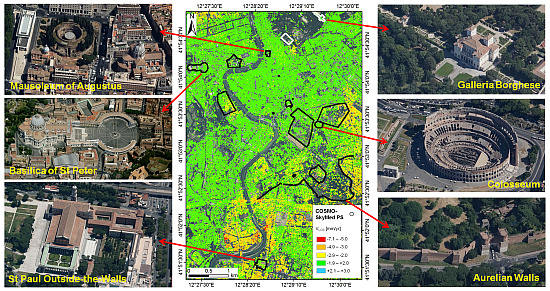
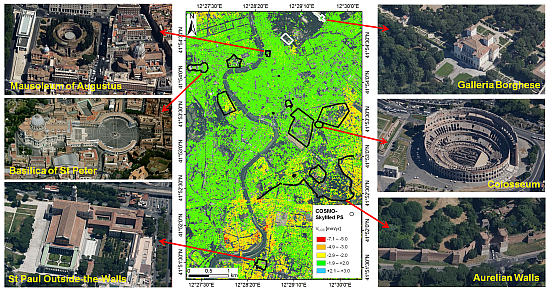
Central Archaeological Area: Palatine and Oppian Hills, Colosseum and Forums (Monuments, Sites and Heritage Assets Nos. 1–5 in Figure 3a)

Besides the typical impacts due to urban pollution and vibrations produced by vehicles and engineering works, the central archaeological area of Rome, i.e., Palatine Hill, Roman Forum, Colosseum and Oppian Hill, is chronically exposed to geohazard factors, which relate to bedrock geology and the superimposition of anthropogenic strata (e.g., [8,27,28,29,30]).
In this sense, COSMO-SkyMed PS data seem not to warn about wide-area subsidence processes occurring between 2011 and 2013 (Figure 4). The deformation velocity map across the whole area for this period confirms the trend observed from: ERS-1/2 and RADARSAT-1 data processed with PSInSAR™ and SqueeSAR™ and discussed in [8]; Interferometric Point Target Analysis (IPTA) processing of ERS-1/2 data [7]; and SBAS analyses of ERS-1/2 and ENVISAT in [6,10]. Indeed, the Roman and Imperial Forums show relative stability with average Vv of −1.0 mm/y (Figure 4a), whilst localized deformation reaches −4.0 mm/y and +1.6 mm/y. Looking at the local scale, PSs indicating subsidence potentially relevant for further on-site investigations were found in the sectors of: (i) the arches of the Domitian aqueduct along Via di San Gregorio (moving at −2.4 mm/y; Figure 4b); (ii) Convento di San Bonaventura al Palatino (up to −2.5 mm/y; Figure 4c); (iii) Chiesa di Sant’Anastasia (up to −2.6 mm/y); and (iv) the archaeological ruins in the SW corner of the Palatine Hill, west of the Capanne del Palatino (up to −2.5 mm/y; Figure 4d,e).
Overall, stability is also found for the entire complex of the Colosseum, with average Vv of −1.3 mm/y. Only a few PS within the hemicycle show −2.9 mm/y and likely refer to localized deformation of single architectural elements (Figure 4a). This result confirms the stability trend observed by analysing archive SAR imagery for 1992–2010 [10]. In particular, the spatial distribution of relatively stable PS over the southern portion of the monument is highly relevant for the assessment of its condition. In this sector, the Colosseum lies on Holocene alluvium, compared with the volcanic and Pleistocene deposits underneath the northern part of the amphitheatre (cf. stratigraphic and geotechnical studies in [31,32]).
It is with this perspective that we should also read the velocity values retrieved for Marcus Aurelius’ Column in Piazza della Colonna (No. 4 in Figure 3), where Vv ranges from −1.1 to +2.7 mm/y. The latter appears significant, if we consider that since the mid-16th century, the column has a historical record of fracturing and dislocation of marble blocks that were caused by differential ground motion across a narrow zone due to the lateral heterogeneity of the local bedrock geology [32,33]. A similar situation is observed for the other famous ancient column in Rome, i.e., Trajan’s Column in the namesake Imperial Forum (Figure 10a). Here, StaMPS provides deformation estimates not exceeding −2.4 mm/y.
As discussed in Section 3.1, COSMO-SkyMed PS data can elucidate the conditions of the ruins belonging to the Baths of Trajan over the Oppian Hill Park (Figure 5). With regard to the structures of the central sector of the baths, the ascending geometry provided higher coverage over the exedra compared with the neighbouring apsed-wall (Figure 5b). The few PSs identified over the latter show an average velocity of −0.6 mm/y, while significant deformation rates observed in the RADARSAT-1 descending data in 2003–2010 suggested structural instability along the cracks running vertically across the wall [8]. On the other hand, a COSMO-SkyMed PS with Vv of −2.8 mm/y is located in the area of the exedra, the condition of which, from in situ observations, appears not to be worrisome, except for some deterioration patterns visible over the inner surface (Figure 5c). Higher Vv values up to −4.0 mm/y are found over the north-eastern exedra, with a spatial distribution (cf. comments on PS density in Section 3.1) that suggests that displacements are depicted by the satellite not only over the structure itself and the neighbouring arch, but also the ground within the hemicycle.
The PS coverage obtained over the Cisterna delle Sette Sale does not allow us to confirm the instability condition observed in the RADARSAT-1/2 data (cf. Section 3.1; Figure 5d). Nevertheless, the two PS located at the SW corner of the cistern and showing Vv values of −3.7 and −3.1 mm/y in some way match with the deformation that 8-m resolution RADARSAT-1 archive data had highlighted since 2003 [8,9]. The impact that these pieces of satellite evidence can have for addressing the conservation strategy of this monument is to be weighed against the fact that the cistern is still nowadays included among the Roman ruins managed by the local municipality that need targeted restorations [34].

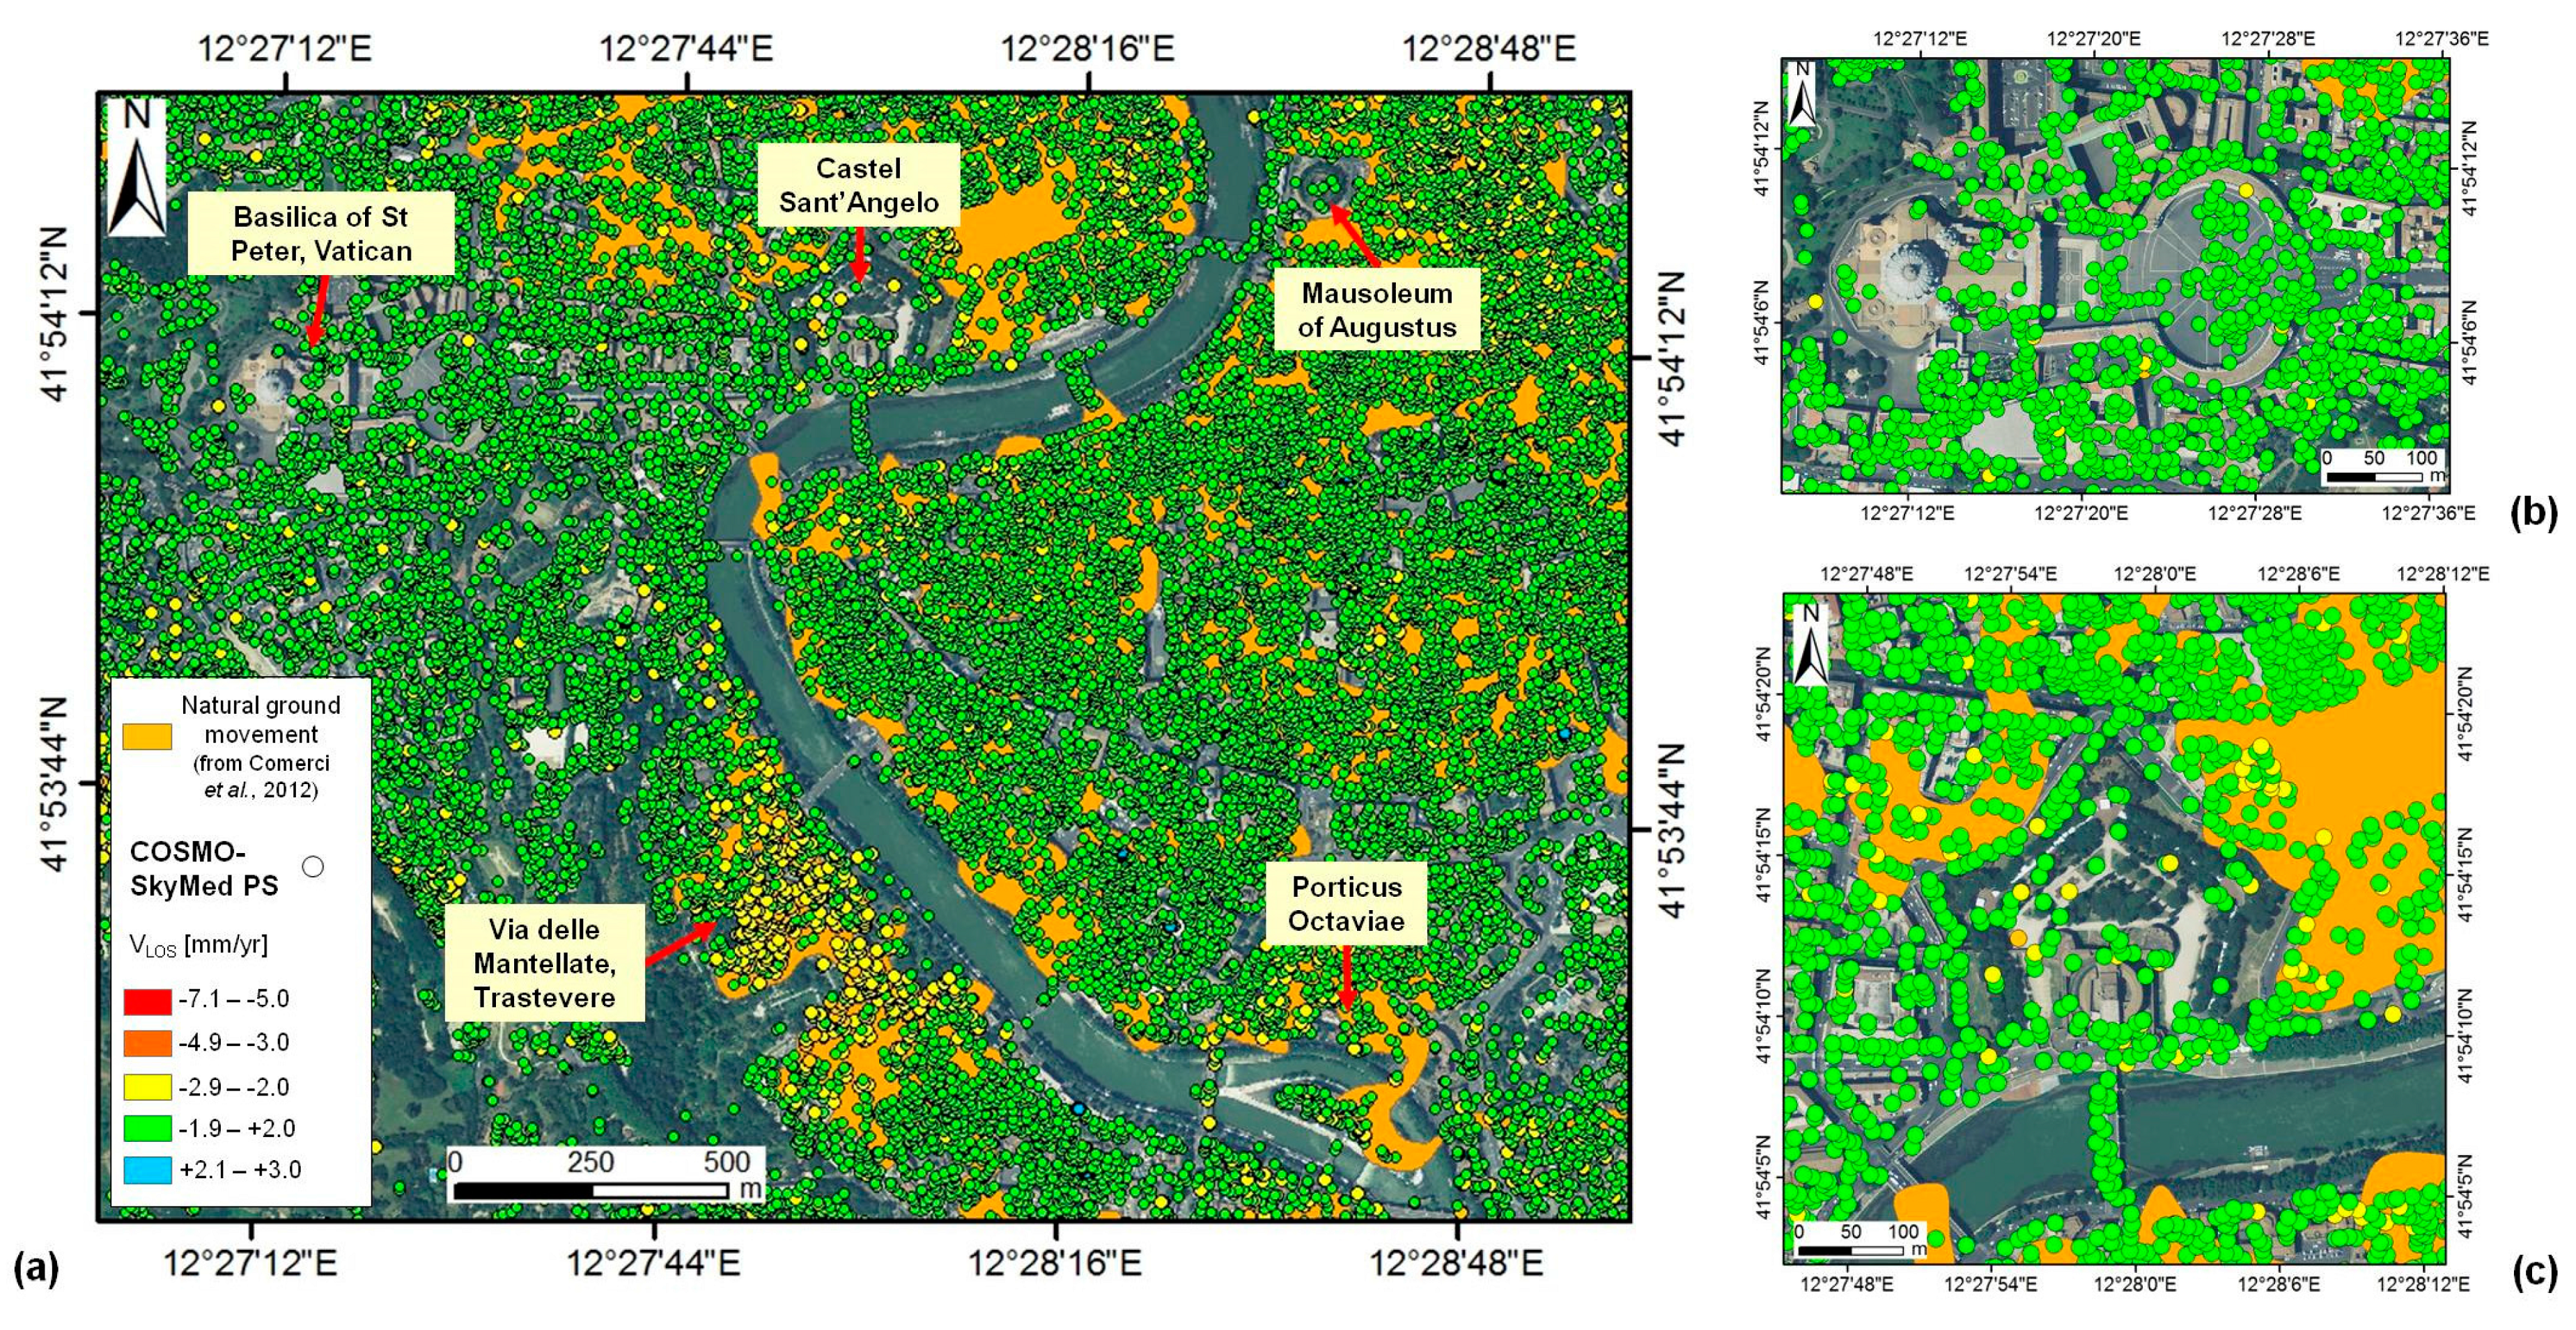
Left Riverbank Ancient Monuments: Mausoleum of August and Porticus Octaviae (Monuments, Sites and Heritage Assets Nos. 6–7 in Figure 3a)

Interventions are also required to preserve the Mausoleum of Augustus, which is located in Piazza Augusto Imperatore on the left bank of the Tiber River. In the surrounding area, Comerci et al. [16] have detected “natural ground movements” due to compressible ground, with a high degree of confidence based on geological interpretation of ERS-1/2 1992–2000 PS data (Figure 8a). Indeed, COSMO-SkyMed PS data highlight relative stability over the mausoleum, as well as the whole area, including the Museum of Ara Pacis, and the two churches, Chiesa di San Rocco and San Carlo al Corso. Only a few PSs with Vv up to −3.6 mm/y are found over the latter and neighbouring buildings.
A similar situation is observed for the quarter of the Roman portico known as Porticus Octaviae, in the old Jewish Ghetto adjacent to the river, where the geohazard mapping for Rome from the EC-FP7 project, PanGeo, reports geohazards due to compressible ground (Figure 8a). We can therefore infer that no major deformation has occurred in these two sectors during 2011–2013, as reasonably expectable in such a short period of time for ancient buildings. In light of the age of these monuments, unless other sources of subsidence (e.g., groundwater over-exploitation) intervene, most of the settlement already occurred (cf. interpretation of subsidence patterns proposed in [7]).
Figure 8. (a) VLOS of the COSMO-SkyMed PS along the left and right banks of the Tiber River, in the historic centre of Rome, compared with the geohazard polygons by Comerci et al. [16], with the location of: the Basilica of St. Peter, Vatican, Castel Sant’Angelo, Mausoleum of Augustus, Porticus Octaviae and Trastevere; zooms of (b) Basilica of St. Peter and (c) Castel Sant’Angelo.
Remotesensing 06 12593 g008

Inside the Wall Monuments and Aurelian Walls (Monuments, Sites and Heritage Assets Nos. 8–10 in Figure 3a)

Mining and quarrying legacy is to be included among the potential sources of structural instability, wherever newer constructions and architectural palimpsests are built above cavities and subterranean networks that were used in the past, but nowadays are abandoned or dismantled. In the quarter of Piazza G.L. Bernini, where the medieval complex of Basilica di San Saba (No. 8 in Figure 3a) is located, COSMO-SkyMed PS data show average Vv of −2.3 mm/y, with values up to −5.3 mm/y (Figure 9a,b). These pieces of evidence seem to agree with the trend observed based on ERS-1/2 archive data by Comerci et al. [16], who digitized a geohazard polygon of “anthropogenic ground instability” by interpreting the LOS displacements as surface indicators of instability due to the presence of cavities underneath the buildings’ foundations.
The mapped geohazards do not include the Baths of Caracalla, for which we have discussed PS coverage in Section 3.1.
Figure 9. VLOS of the COSMO-SkyMed PS over: (a) the Basilica di San Saba; with (b) aerial photograph from BingMaps (© 2014 BLOM, © 2014 Microsoft Company); and (c) the area of Via delle Mantellate, Trastevere (cf. Figure 8). Geohazard polygons are from Comerci et al. [16].
Remotesensing 06 12593 g009
Issues relating to the anthropogenic deposits chronically affect not only hilly areas of long-standing occupation, such as the Palatine Hill [27,30], but also monuments running across the alluvial plain of the Tiber River, such as the southern portion of the Aurelian Walls [35,36,37,38]. Due to rain infiltration and the mechanical damage of vegetation and plant roots, these linear archaeological structures have experienced localized events of curtain detachments and wall collapses in the last few years [9]. In the wider context of the subsidence deformation pattern located SW of Monte Testaccio (up to −6.9 mm/y), the last section of the south-western Aurelian Walls seems not to have suffered significant deformation during 2011–2013. On the other hand, local-scale PS analysis in the sector of Porta San Sebastiano (Figure 3a; see Figure 6c) highlights LOS deformation up to −4.7 mm/y (and −3.1 mm/y on average) over the structures of the Roman gate, as well as the neighbouring monumental Arch of Drusus.
The impact of PS retrieval for applications of built environment management in the peri-urban area is demonstrated by the collapse event that occurred just a few metres away along Via di Porta San Sebastiano, after heavy rainfall in March, 2014, which damaged an 18/19th-century fencing wall [39]. Vegetation cover is the major inhibiting factor (see Figure 6d), which drastically constrains PS density, so that the StaMPS output could only provide isolated PS in these areas classified as “discontinuous very low (S.L. < 10%)” to “discontinuous low density urban fabric (S.L.: 10%–30%)” in [23]. In this regard, the higher spatial resolution and shorter revisiting time offered by COSMO-SkyMed seem to have neutral effects, and no significant improvements are achieved compared with medium-resolution C-band imagery.

3.2.2. Modern Monuments

The capability of COSMO-SkyMed PS data to depict deformation is also proven with regard to the structural health assessment of the modern cultural heritage of Rome, meaning here with “modern” all buildings erected from the 15th to 19th century. After the Roman Age, the second most flourishing architectural period of Rome lasted from the Renaissance to the whole Baroque, with a third phase in late 19th century when the city became the capital of the new Italian State.
Figure 10. (a) VLOS of the COSMO-SkyMed PS over the Vittoriano and Trajan’s Colum and Imperial Forums (i.e., Nos. 11 and 5 in Figure 3a); (bd) as reported in [40], images from Google Maps Street View acquired in November, 2012, highlight cracks affecting the stonework on the western side of the monument (© 2014 Google).
Remotesensing 06 12593 g010

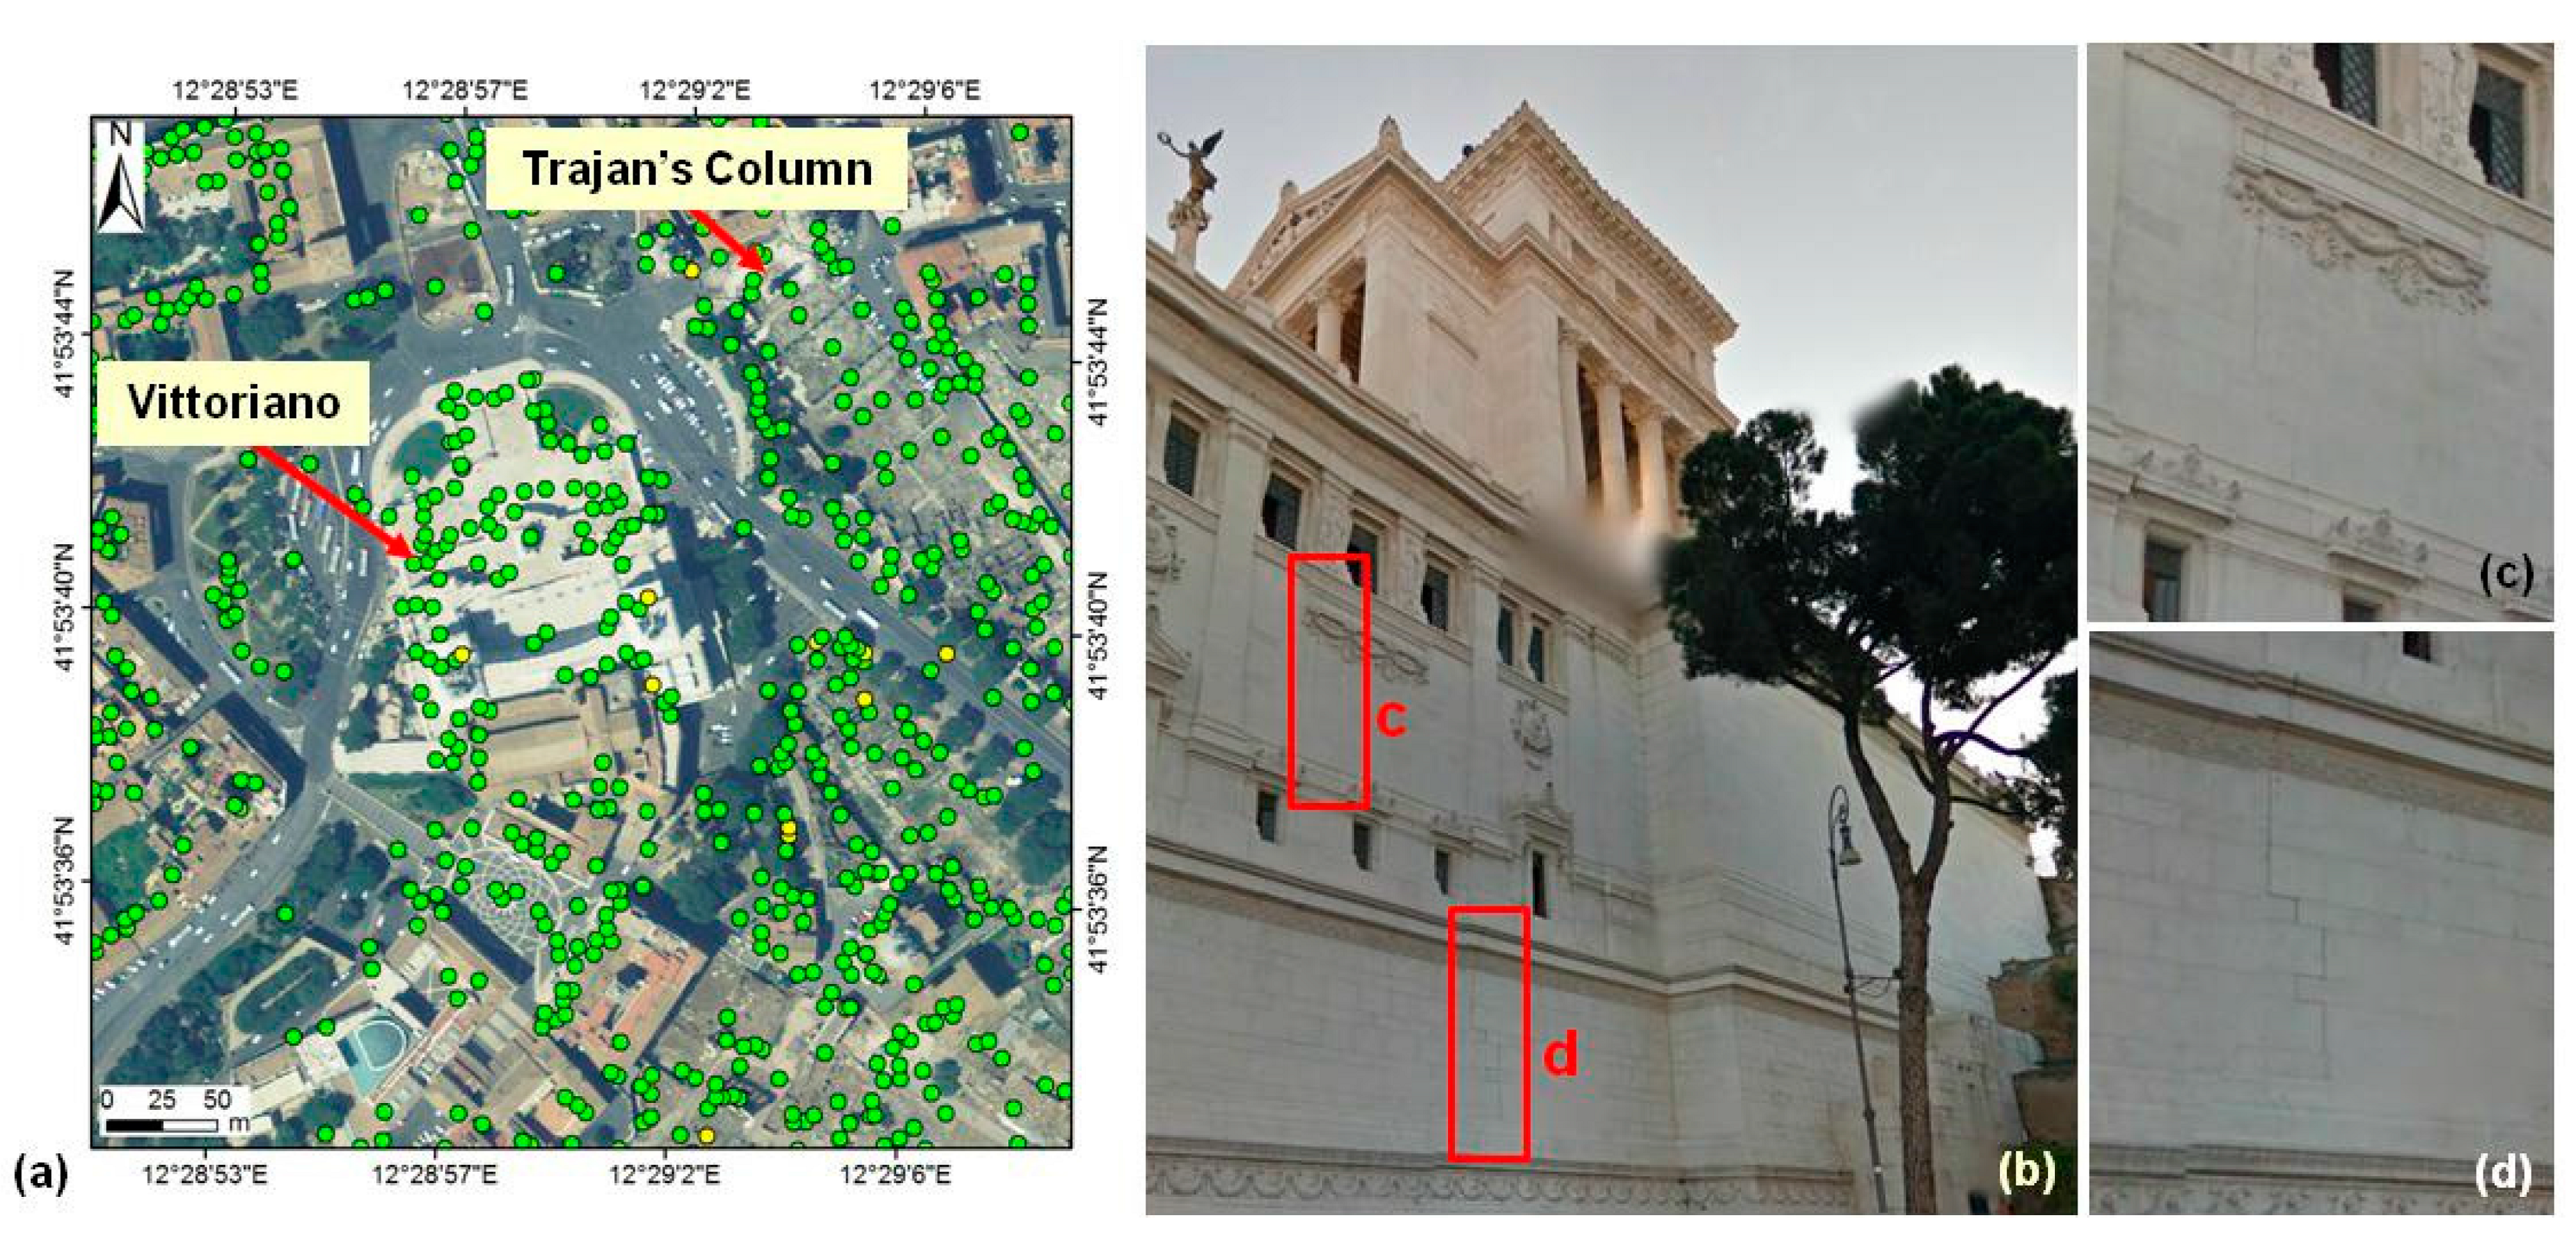
Central Archaeological Area: Vittoriano (Monument No. 11 in Figure 3a)

Starting from the latter phase, the most iconic monument is the Vittoriano (Figure 3a), in Piazza Venezia (Figure 10). This enormous altar, celebrating the unity and freedom of Italy, has represented a challenge for ordinary maintenance and management since the time of its construction (water infiltration and dampness across the masonry were already observed in the early 1900s). In recent times, concerns were raised also with respect to the static nature of the monument [40], with cracks opened across the marble blocks over the western side (Figure 10b–d). For the overall stability, Zeni et al. [10] detected a few pixels in the north-western corner, close to the first staircase, with a subsidence rate of −1 mm/y in the period 1992–2010 (cf. Figure 10a). Despite the difference of technical parameters and the type of processing, a similar PS spatial distribution is shown by COSMO-SkyMed time series for the period 2011–2013. In particular, over the south-western part of the monument, Vv values range from −1.0 up to −3.0 mm/y (the latter deformation estimate was observed over the entrance to the tower), while −2.4 mm/y is observed for the eastern part. Although a clear subsidence pattern is not recognized, the above values confirm the need to continue monitoring, also in relation to possible structural impacts due to the nearby excavations for the new metro Line C of Rome.

Hilltop Palaces: Villa Medici and Galleria Borghese (Heritage Assets Nos. 12–13 in Figure 3a)

Looking across the COSMO-SkyMed PS dataset, updated information can be also retrieved for historical buildings that host cultural institutions and museums, such as Galleria Borghese and Villa Medici (Figure 3a), that were built on hilltop locations and can be subject to local slope instability. Situated on the Pincio Hill, which is the highest point of Rome, the elegant buildings of the Académie de France à Rome in Villa Medici are covered by 35 PS, with Vv up to −3.4 mm/y, the spatial distribution of which along the fabric allows us to perform assessment also at the scale of the fountain with the obelisk and the buildings along the fencing wall.
Almost the same number of PS (i.e., 37) is obtained over Galleria Borghese and its gardens, although higher stability is observed (average Vv is +1.5 mm/y), with a few PSs on the western side of the main building moving at +3.2 mm/y. Although vegetation is an unavoidable obstacle, 3-m resolution COSMO-SkyMed data provide PS over those monuments sticking out from the ground, such as the 1920s cistern of the Acqua Marcia, north of Galleria Borghese, which results in being quite stable over the period March, 2011–June, 2013 (Vv < +1.7 mm/y).

Right Riverbank Monuments and Palaces: Castel Sant’Angelo and Trastevere (Monuments, Sites and Heritage Assets Nos. 14–16 in Figure 3a)

As already discussed in Section 3.1, monumental complexes of a certain extent are more likely to be covered by PS, although the orientation and visibility to the LOS satellite can act detrimentally. An example is offered by the spatial distribution obtained over the late ancient-medieval fortress of Castel Sant’Angelo (Figure 3a; Figure 8c), where the interest for condition monitoring is not limited to the central part with the tower and the surrounding bastions, but also to the enclosing star-shaped fortifications. Despite denser coverage over the western part than the eastern section, it is possible to infer an overall stability for the entire complex, with only a few PSs with Vv up to −3.6 mm/y. While some of them are located over the central tower and the bastions, other sparse PSs are distributed within the park. We therefore cannot exclude the possibility that a few of them refer to unrelated targets (e.g., light poles), with the consequent risk of overestimation of these deformation (cf. the recommendations in [41]).
The absence of a clear subsidence pattern is relevant evidence, if compared with the fact that in the immediate surroundings of Castel Sant’Angelo, the PanGeo project reports a geohazard [16] relating to natural ground movements due to compressible ground (Figure 8a,c).
Referring to the discussion in Section 3.1 for the PS coverage and stability conditions for the Basilica of St. Peter in the Vatican, it is worth noting instead that, just one kilometre SW of Castel Sant’Angelo, in the quarter XIII Trastevere on the same river bank (Figure 3a), COSMO-SkyMed PSs highlight ground displacements in the direction away from the satellite, with Vv up to −4.6 mm/y throughout the interval March, 2011–June, 2013 (Figure 8a and Figure 9c). Among the historical buildings that fall within this area and that are covered by downward-moving PS we recall here: Convento delle Mantellate di San Francesco di Sales, Chiesa della Visitazione, Palazzo Corsini and Villa Farnesina (Figure 9c).

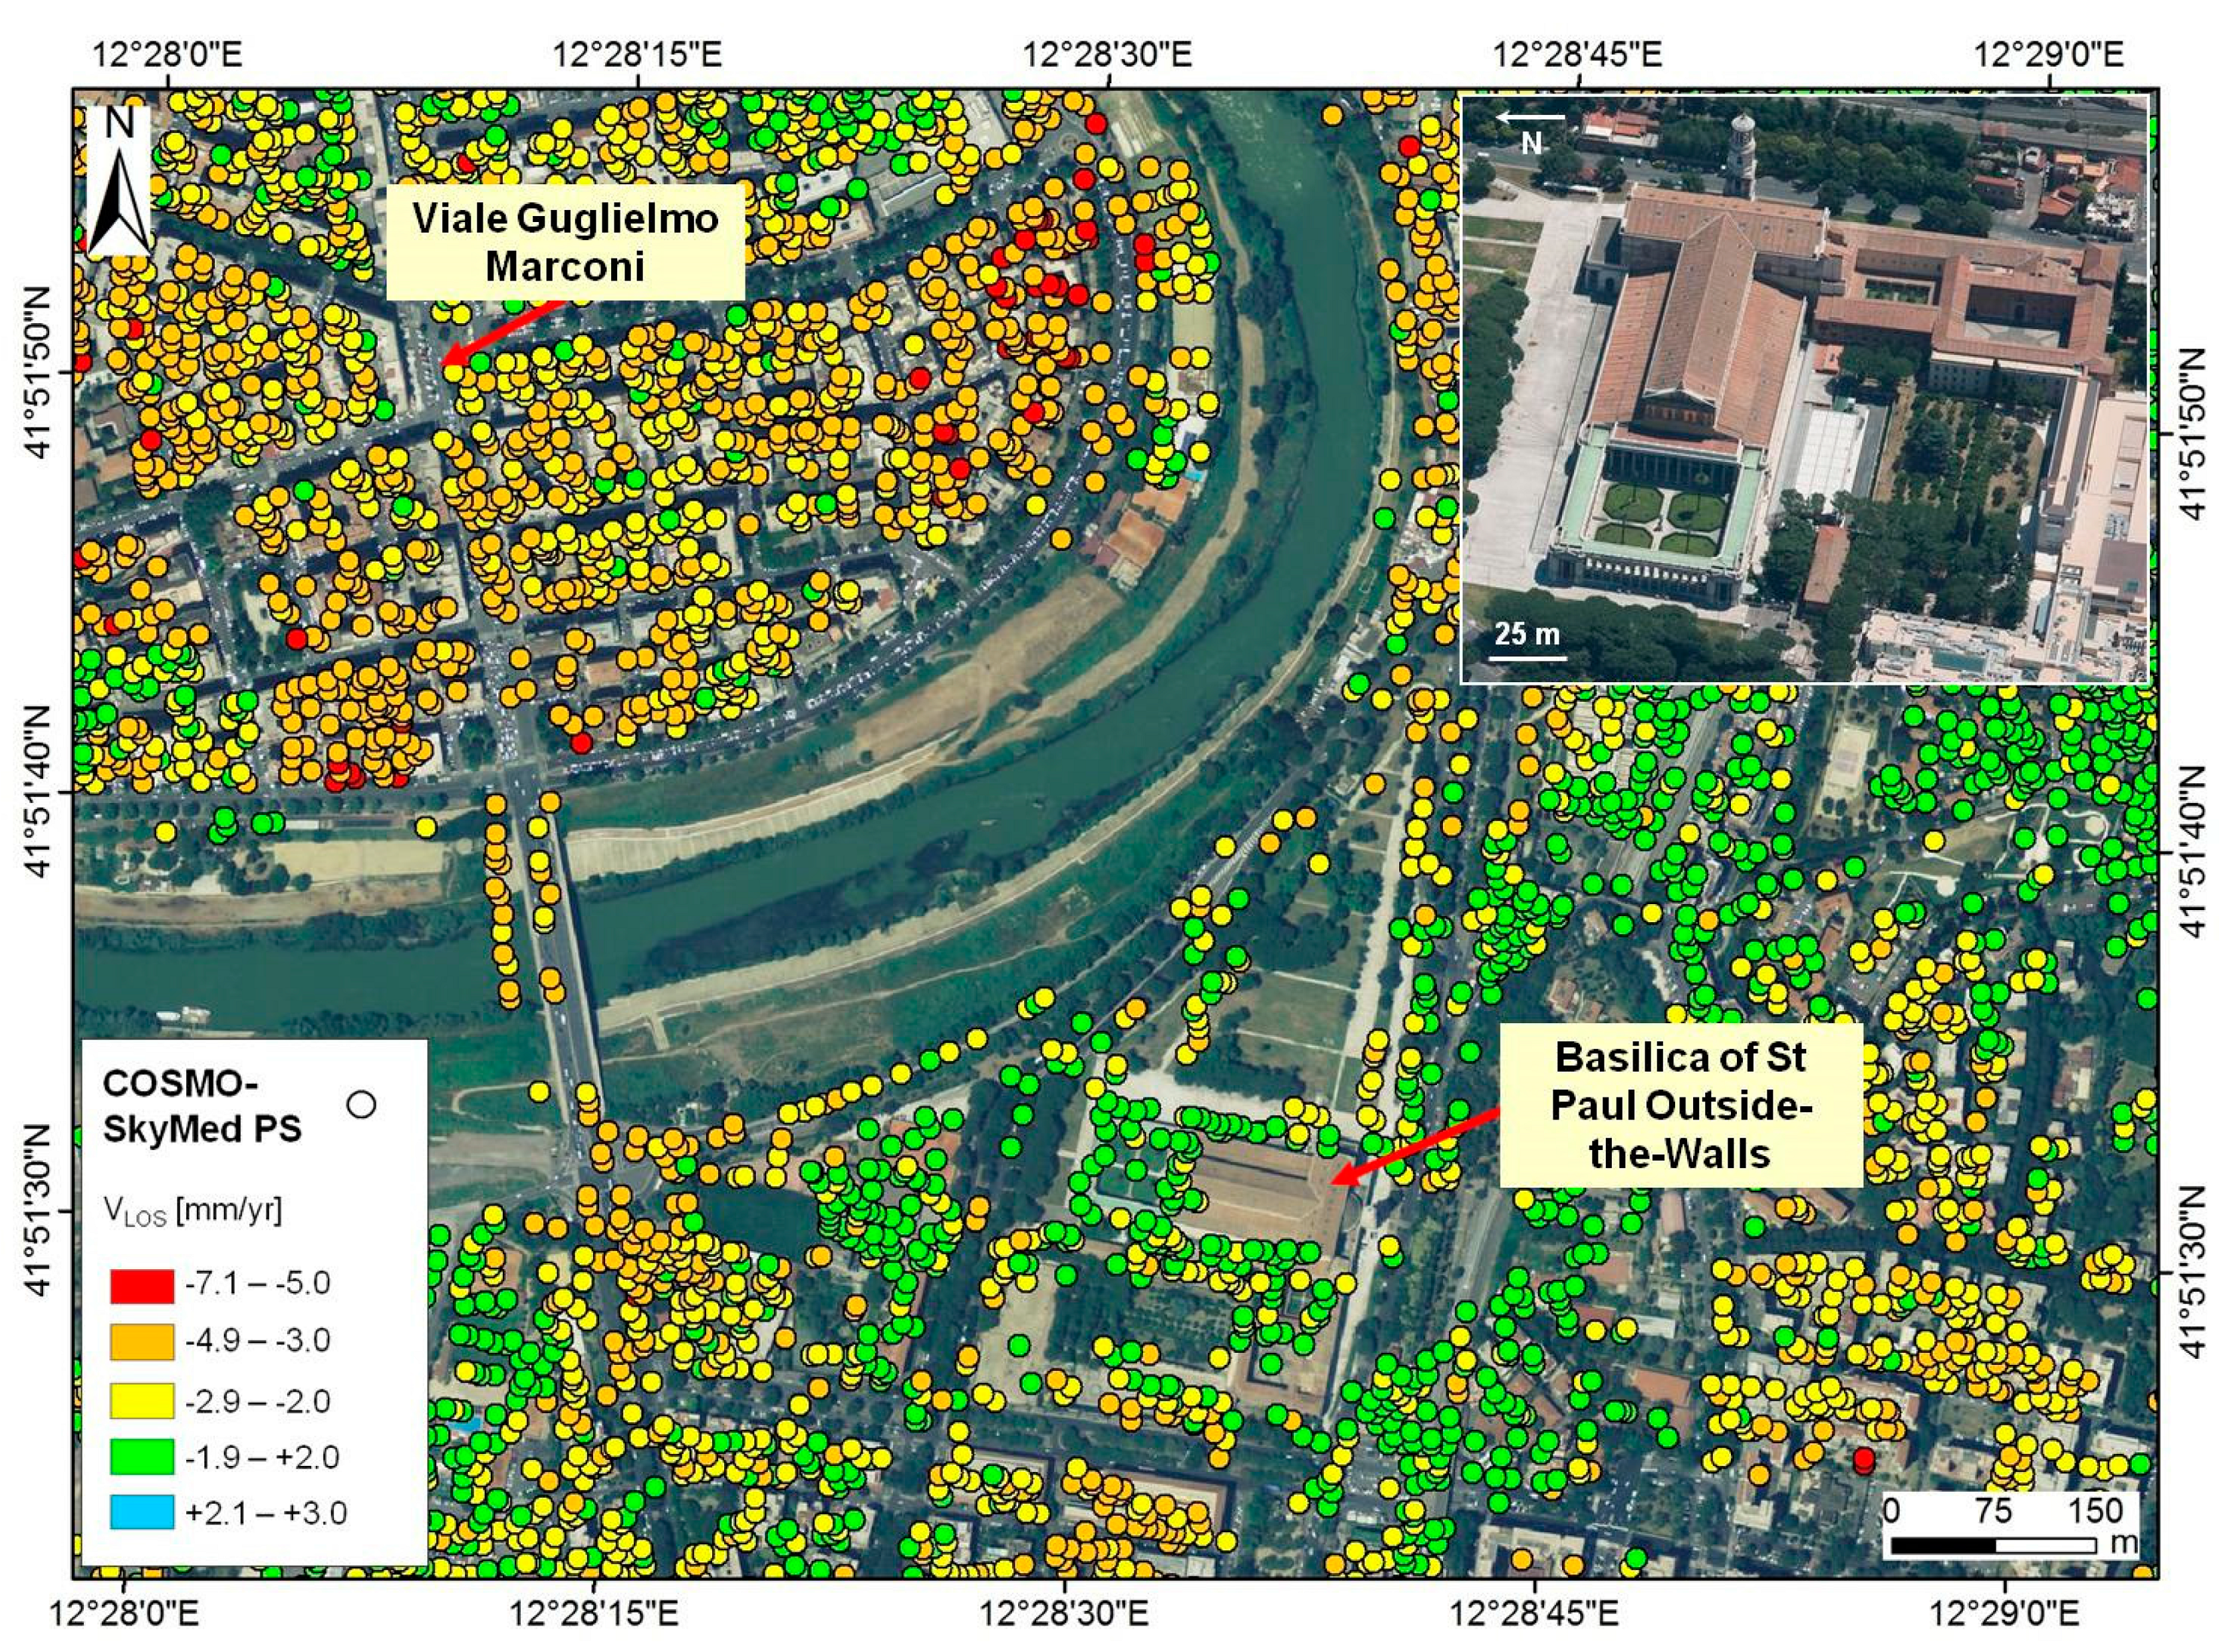
Southern Rome Quarters: Basilica of St. Paul Outside-the-Walls (Monuments and Sites No. 17 in Figure 3a)

As mentioned above, issues due to compressible soils are well known in Rome, especially along the banks of the Tiber River and the alluvial valleys created by the former tributary water streams, such as the Grotta Perfetta valley in the south [15] (see Figure 3). The major cultural heritage site of this quarter is the national monument of the Basilica of St. Paul Outside the Walls (Figure 3a), the original building of which was hugely damaged by a fire in 1823 and then re-built in the 1850–1870s, with the last addition of the vast four-sided portico in 1928 (Figure 11). In this area, Fornaro et al. [42] found subsidence affecting the metro B railway station, as depicted by ERS-1/2 in 1995–2000, and Manunta et al. [6] correlated this deformation to the local geological conditions and validated with ground-truth. Similar results are shown in Stramondo et al. [7] with IPTA processing. Our COSMO-SkyMed data confirm this deformation pattern, with thousands of PS reaching Vv of −8.6 mm/y and averaging −3.0 mm/y (Figure 11). More than 130 PSs are identified over the architectural complex, with an average Vv of −2.1 mm/y and a maximum of −4.0 mm/y.

3.2.3. Contemporary Buildings (Nos. 18–19 in Figure 3a)

Although discussion of the COSMO-SkyMed results for the outskirts of Rome is outside of the scope of this paper, further comments can be added with regard to the topic of subsidence in the southern part of the city, due to the combined effect of overloading from urbanization pressure and the consolidation process of the Holocene alluvial deposits. COSMO-SkyMed PS data confirm ongoing deformation in the Caffarella Valley on the left river bank (Figure 3b), as well as in the Marconi quarter on the right side (Figure 3b and Figure 11). Maximum values of −7.3 and −7.6 mm/y are found, respectively, with some clusters of higher deformation estimates located close to the Tiber River. Following the geotechnical interpretation in [7], the thickness of the sediments subject to consolidation appears to be one of the factors to take into account to explain why such high rates of subsidence are still observed in recent times. Certainly, construction type is a further element to consider. The urban sprawl across the southern quarters of Rome was undertaken starting from the 1940s, with the erection of groups of different structures, the foundations of which are made of 15 to 20 m-long piles, and the inter-connection is mediated by dilation joints (cf. [6,17]). Geological control of such instability processes is, on the other hand, apparent over the whole region, as also proven by Ardizzone et al. [43] based on COSMO-SkyMed results from SBAS processing for the Torrino area, which is located south of the lower margin of our processed frame.
Figure 11. VLOS of the COSMO-SkyMed PS over the architectural complex of the Basilica of St. Paul Outside the Walls and the Marconi quarter (i.e., Nos. 17 and 19 in Figure 3a). The inset shows an aerial photograph of the basilica from BingMaps (© 2014 BLOM, © 2014 Microsoft Company).
Remotesensing 06 12593 g011

4. Conclusions

This paper for the first time assesses the condition of both the city centre and the peripheral quarters of Rome in Italy, by comparing persistent scatterer interferometry deformation estimates from high resolution COSMO-SkyMed data covering the period March 2011, to June 2013, with observations published in the literature based on C-band medium-resolution SAR archives available from the European and Canadian Space Agencies since 1992.
Processing undertaken by using the StaMPS approach provided a spatial distribution of more than 310,000 radar targets, with an average target density of over 2800 PS/km2. This allowed us to cover the areas of study, to improve the knowledge over Rome, which has a well-known history of deformation.
Among the key outcomes, our analysis highlights the following main pieces of evidence:
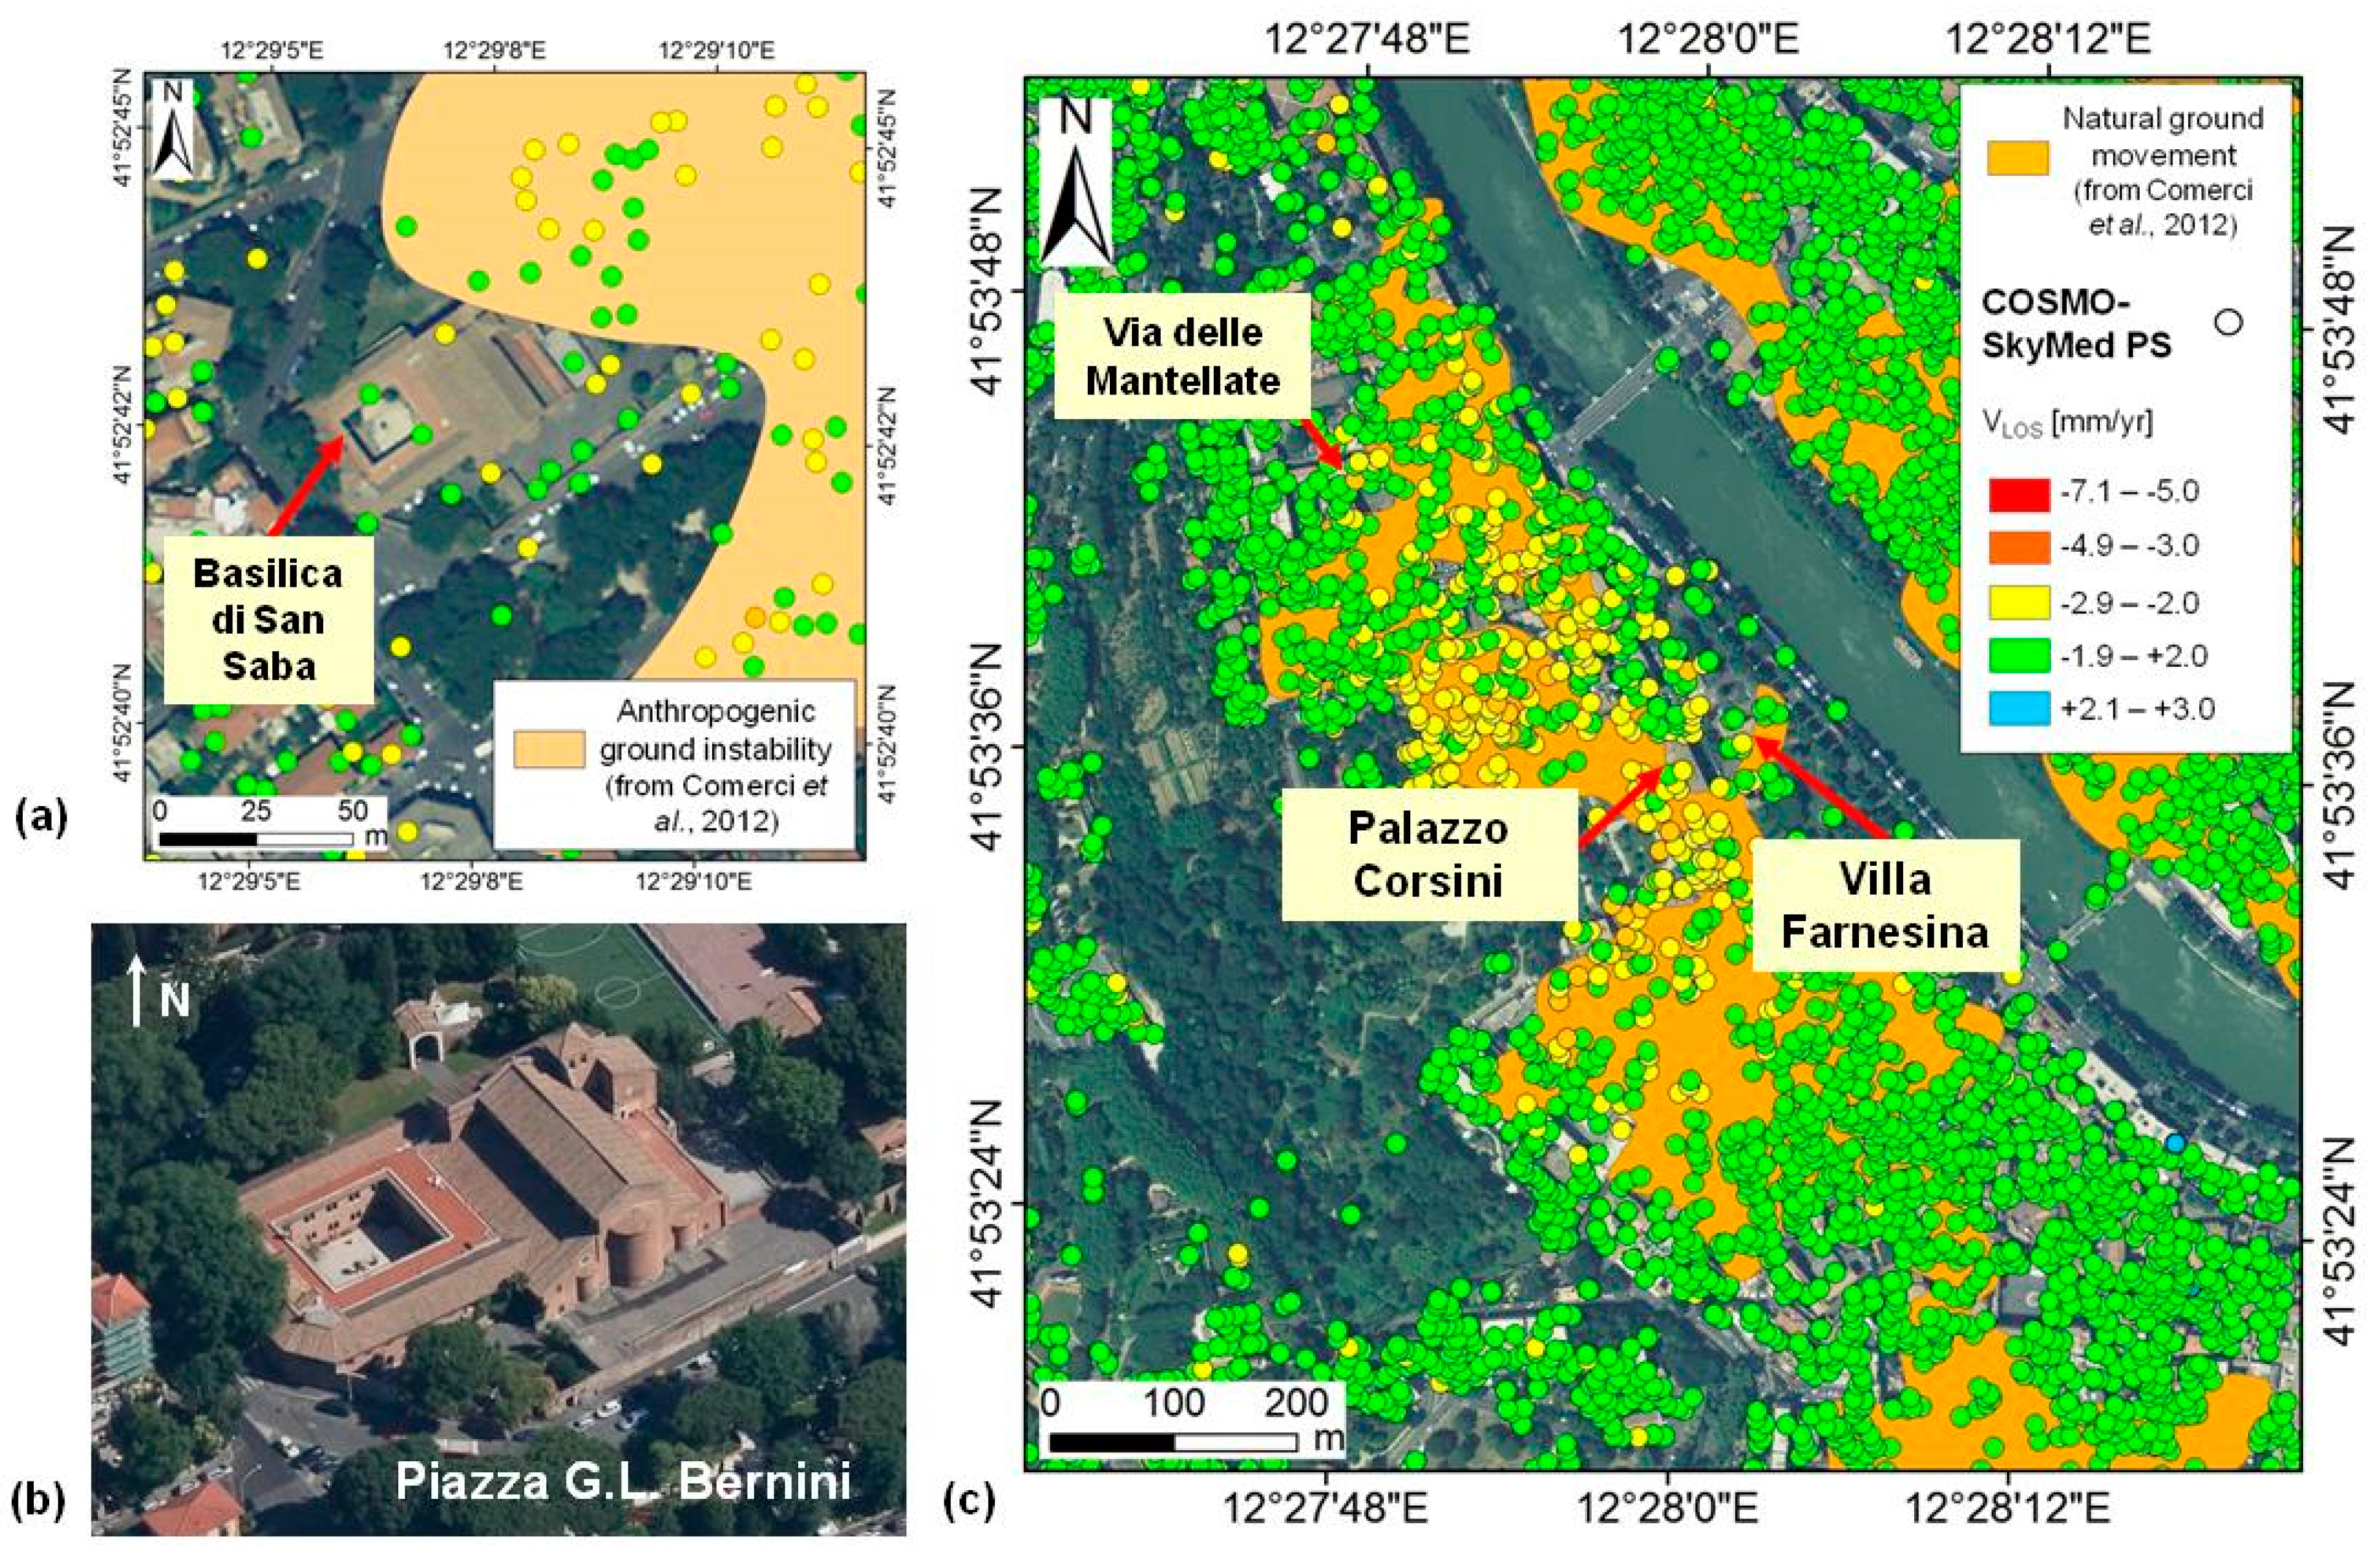
The overall stability of the main monuments and archaeological sites of the historic centre and the absence of clear deformation patterns at local-scale, except for movements detected in Trastevere and the area of Basilica di San Saba;
persistent subsidence with vertical velocity in some cases of more than −7.0 mm/y, in areas of recent urbanization, i.e., in the quarter of Marconi and the valleys of Caffarella and Grotta Perfetta, the latter close to the monumental complex of the Basilica of St. Paul Outside the Walls.
One of the strengths of this research is the demonstration, from the perspective of conservators, of the capability of the StripMap HIMAGE mode of the COSMO-SkyMed constellation to detect deformation at a single-building scale. This is crucial, especially whenever surface indicators of potential instability are localized and pointed out by isolated PSs. As demonstrated through the case of the Roman cistern and the exedra in the Oppian Hill, even a few points can be highly informative, despite the limited spatial coverage over the whole extent of the monument. For these monuments, the comparison with previous results from RADARSAT-1/2 data confirmed the critical condition as depicted from space, which should be taken into account to prioritize and plan targeted interventions.
Numerical analysis of PS density against land cover classes, type and orientation of buildings and vegetation cover highlights a beneficial effect of the higher spatial resolution of COSMO-SkyMed to identify PSs in correspondence with objects and ruins sticking out of the ground, even in densely vegetated areas, such as the public parks and archaeological sites of the historic centre of Rome. This improved capability to identify PS in such contexts, of course, is advantageous to ensure public safety of passers-by and tourists, as well. Nonetheless, the technical properties and acquisition geometry of COSMO-SkyMed compared with past medium-resolution C-band SAR sensors seem to have a neutral impact on improving PSs detection in areas of scarce visibility, despite the ideally favourable orientation of the imaged structure (cf. what was found in the case of the N-S-oriented section of the Aurelian Walls along Via delle Mura Latine).
The way forward for such a type of research is to continue acquiring new high resolution imagery with the current space radar missions, to prolong the time series and undertake periodic processing to update the understanding of the deformation and slow surface processes occurring in the city of Rome in the upcoming years. In this regard, our paper also serves as a proof-of-concept and explains the shortcomings that are to be considered alongside with the pros of having a fully-operational constellation that routinely acquires images, when planning monitoring activities in time. Our analysis provides new information to update the overall picture of the structural health of the Roman heritage assets, and demonstrates the usefulness of COSMO-SkyMed to perform a multi-temporal and multi-platform investigation of the deformation history of a complex urban site like Rome.

Acknowledgments

This research was performed in the framework of the project “Smart management of cultural heritage sites in Italy and China: Earth observation and pilot projects”, funded by the Italian Ministry of Foreign Affairs. COSMO-SkyMed data were provided by the Italian Space Agency, under licence agreement Archeocosmo. SRTM DEM data were provided by NASA via the Consultative Group for International Agriculture Research - Consortium for Spatial Information (CGIAR-CSI) (http://srtm.csi.cgiar.org). The 2008 orthophoto was accessed via the WMS service of the National Geoportal of the Italian Ministry of Environment, Land and Sea. Geohazard polygons from Comerci et al. (2012) were accessed via the EU-FP7 GMES PanGeo project at http://www.pangeoproject.eu/home.

Author Contributions

Pietro Milillo processed COSMO-SkyMed imagery with StaMPS. Francesca Cigna and Deodato Tapete carried out radar interpretation and geospatial analysis of PS data and wrote the paper under the scientific coordination of and with the contribution of Rosa Lasaponara and Nicola Masini.

Conflicts of Interest

The authors declare no conflict of interest.

References

  1. Evans, D.; Farr, T. The use of Interferometric Synthetic Aperture Radar (InSAR) in archaeological investigations and cultural heritage preservation. In Remote Sensing in Archaeology; Wiseman, E.-B., Ed.; Springer: New York, NY, USA, 2007; pp. 89–102. [Google Scholar]
  2. Hesse, R. Geomorphological traces of conflict in high-resolution elevation models. Appl.Geogr. 2014, 46, 11–20. [Google Scholar]
  3. Delmonaco, G.; Leoni, G.; Margottini, C.; Spizzichino, D. Implementation of advanced monitoring system network in the Siq of Petra (Jordan). In Engineering Geology for Society and Territory; Lollino, G., Giordan, D., Marunteanu, C., Christaras, B., Yoshinori, I., Margottini, C., Eds.; Springer: Berlin/Heidelberg, Germany, 2015; Volume 8, pp. 299–303. [Google Scholar]
  4. Chen, F.; Jiang, A.; Ishwaran, N. Angkor site monitoring and evaluation by radar remote sensing. Proc. SPIE 2014, 9260. [Google Scholar] [CrossRef]
  5. Cigna, F.; Osmanoğlu, B.; Cabral-Cano, E.; Dixon, T.H.; Ávila-Olivera, J.A.; Garduño-Monroy, V.H.; DeMets, C.; Wdowinski, S. Monitoring land subsidence and its induced geological hazard with Synthetic Aperture Radar Interferometry: A case study in Morelia, Mexico. Remote Sens. Environ. 2012, 117, 146–161. [Google Scholar] [CrossRef]
  6. Manunta, M.; Marsella, M.; Zeni, G.; Sciotti, M.; Atzori, S.; Lanari, R. Two-scale surface deformation analysis using the SBAS-DInSAR technique: A case study of the city of Rome, Italy. Int. J. Remote Sens. 2008, 29, 1665–1684. [Google Scholar] [CrossRef]
  7. Stramondo, S.; Bozzano, F.; Marra, F.; Wegmuller, U.; Cinti, F.R.; Moro, M.; Saroli, M. Subsidence induced by urbanisation in the city of Rome detected by advanced InSAR technique and geotechnical investigations. Remote Sens. Environ. 2008, 112, 3160–3172. [Google Scholar] [CrossRef]
  8. Tapete, D.; Fanti, R.; Cecchi, R.; Petrangeli, P.; Casagli, N. Satellite radar interferometry for monitoring and early-stage warning of structural instability in archaeological sites. J. Geophys. Eng. 2012, 9, S10–S25. [Google Scholar]
  9. Tapete, D.; Casagli, N.; Fanti, R. Radar interferometry for early stage warning on monuments at risk. In Landslide Science and Practice; Margottini, C., Canuti, P., Sassa, K., Eds.; Springer: Berlin/Heidelberg, Germany, 2013; Volume 1, pp. 619–625. [Google Scholar]
  10. Zeni, G.; Bonano, M.; Casu, F.; Manunta, M.; Manzo, M.; Marsella, M.; Pepe, M.; Lanari, R. Long-term deformation analysis of historical buildings through the advanced SBAS-DInSAR technique: The case study of the city of Rome, Italy. J. Geophys. Eng. 2011, 8, S1–S12. [Google Scholar]
  11. Ferretti, A.; Prati, C.; Rocca, F. Permanent scatterers in SAR interferometry. IEEE Trans. Geosci. Remote Sens. 2001, 39, 8–20. [Google Scholar] [CrossRef]
  12. Ferretti, A.; Fumagalli, A.; Novali, F.; Prati, C.; Rocca, F.; Rucci, A. A new algorithm for processing interferometric data-stacks: SqueeSAR. IEEE Trans. Geosci. Remote Sens. 2011, 49, 3460–3470. [Google Scholar] [CrossRef]
  13. Covello, F.; Battazza, F.; Coletta, A.; Lopinto, E.; Fiorentino, C.A.M.; Pietranera, L.; Valentini, G.; Zoffoli, S. COSMO-SkyMed an existing opportunity for observing the Earth. J. Geodyn. 2010, 49, 171–180. [Google Scholar] [CrossRef]
  14. Hooper, A.; Zebker, H.; Segall, P.; Kampes, B. A new method for measuring deformation on volcanoes and other natural terrains using InSAR persistent scatterers. Geophys. Res. Lett. 2004, 31, L23611. [Google Scholar] [CrossRef]
  15. Campolunghi, M.P.; Capelli, G.; Funiciello, R.; Lanzini, M. Geotechnical studies for foundation settlement in Holocenic alluvial deposits in the City of Rome (Italy). Eng. Geol. 2007, 89, 9–35. [Google Scholar] [CrossRef]
  16. Comerci, V.; Cipolloni, C.; di Manna, P.; Guerrieri, L.; Vittori, E.; Bertoletti, E.; Ciuffreda, M.; Succhiarelli, C. PanGeo: Enabling Access to Geological Information in Support of GMES—D7.1.26 Geohazard Description for Rome V 1.0. 15 December 2012, p. 175. Available online: http://www.pangeoproject.eu/ (accessed on 28 May 2014).
  17. Arangio, S.; Calò, F.; di Mauro, M.; Bonano, M.; Marsella, M.; Manunta, M. An application of the SBAS-DInSAR technique for the assessment of structural damage in the city of Rome. Struct. Infrastruct. Eng. 2014, 10. [Google Scholar] [CrossRef]
  18. Smart Management of Cultural Heritage Sites in Italy and China: Earth Observation and Pilot Projects. “Technologies Applied to Cultural Heritage”. Available online: http://www.silkroad.imaa.cnr.it (accessed on 18 May 2014).
  19. Cigna, F.; Bianchini, S.; Casagli, N. How to assess landslide activity and intensity with Persistent Scatterer Interferometry (PSI): The PSI-based matrix approach. Landslides 2013, 10, 267–283. [Google Scholar] [CrossRef] [Green Version]
  20. Hooper, A.; Segall, P.; Zebker, H. Persistent scatterer InSAR for crustal deformation analysis, with application to Volcán Alcedo, Galápagos. J. Geophys. Res. 2007, 112, B07407. [Google Scholar]
  21. Farr, T.G.; Rosen, P.A.; Caro, E.; Crippen, R.; Duren, R.; Hensley, S.; Kobrick, M.; Paller, M.; Rodriguez, E.; Roth, L.; et al. The Shuttle Radar Topography Mission. Rev. Geophys. 2007, 45, RG2004/2007. [Google Scholar]
  22. Cigna, F.; Bateson, L.; Jordan, C.; Dashwood, C. Simulating SAR geometric distortions and predicting Persistent Scatterer densities for ERS-1/2 and ENVISAT C-band SAR and InSAR applications: Nationwide feasibility assessment to monitor the landmass of Great Britain with SAR imagery. Remote Sens.Environ. 2014, 152, 441–466,. [Google Scholar] [CrossRef]
  23. Urban Atlas. it001l_roma. Available online: http://www.eea.europa.eu/data-and-maps/data/urban-atlas/ (accessed on 15 July 2014).
  24. Scutti, M.; Scifoni, S.; Marsella, M.; Sonnessa, A.; Manunta, M. Where: World heritage monitoring by remote sensing, a pre-operational system to monitor UNESCO sites—A focus on the interferometry processing chain. In Proceedings of the 4th EARSeL Workshop on Cultural and Natural Heritage “Earth observation: A Window on the Past”, Matera, Italy, 6–7 June 2013; pp. 159–174.
  25. National Geoportal 2011 Ortofoto Colore 2008. Available online: http://www.pcn.minambiente.it/PCNDYN/catalogowms.jsp?lan=it (accessed on 14 May 2014).
  26. IL Cantiere Della Domus Aurea. IL Progetto Di Risanamento del Complesso Monumentale. Available online: http://archeoroma.beniculturali.it/cantieredomusaurea/ (accessed on 15 July 2014).
  27. Heiken, G.; Funiciello, R.; de Rita, D. Palaces and Gardens—The Palatine (Palatino) Hill. In The Seven Hills of Rome: A Geological Tour of the Eternal City; Princeton University Press: Princeton, NJ, USA, 2005; pp. 37–50. [Google Scholar]
  28. Casagli, N.; Tapete, D.; Del Conte, S.; Luzi, G.; Fanti, R.; Massagni, S.; Leva, D. Valutazione di stabilità e stato di conservazione localizzati. Foro Romano—Palatino. Il monitoraggio satellitare e con radar da terra. In Roma Archaeologia. Interventi per la Tutela e la Fruizione del Patrimonio Archeologico. Secondo Rapporto Settembre 2009–Febbraio 2010; Cecchi, R., Ed.; Electa: Rome, Italy, 2010; pp. 145–157. [Google Scholar]
  29. Casagli, N.; Tapete, D.; Fanti, R.; Del Ventisette, C.; Massagni, S. Il monitoraggio radar satellitare del Parco archeologico del Colle Oppio. In Roma Archaeologia. Interventi per la Tutela e la Fruizione del Patrimonio Archeologico. Terzo rapporto; Cecchi, R., Ed.; Electa: Rome, Italy, 2011; Vol. II, pp. 208–233. [Google Scholar]
  30. Di Luzio, E.; Moscatelli, M.; Corazza, C.; Stigliano, F.; Casagli, N.; Tapete, D.; Del Conte, S.; Fanti, R. Valutazione di stabilità e stato di conservazione localizzati. Foro Romano—Palatino. Analisi delle possibili correlazioni tra movimenti al suolo accertati da dati interferometrici e criticità geo-archeologiche. In Roma Archaeologia. Interventi per la Tutela e la Fruizione del Patrimonio Archeologico. Secondo Rapporto Settembre 2009–Febbraio 2010; Cecchi, R., Ed.; Electa: Rome, Italy, 2010; pp. 158–167. [Google Scholar]
  31. Bozzano, F.; Funiciello, R.; Marra, F.; Rovelli, A.; Valentini, G. Il sottosuolo dell’area dell’Anfiteatro Flavio a Roma. Geol. Appl. Idrogeol. 1995, 30, 417–436. [Google Scholar]
  32. Donati, S.; Funiciello, R.; Rovelli, A. Seismic response in archaeological areas: The case-histories of Rome. J. Appl.Geophys. 1999, 41, 229–239. [Google Scholar] [CrossRef]
  33. Boschi, E.; Caserta, A.; Conti, C.; di Bona, M.; Funiciello, R.; Malagnini, L.; Marra, F.; Martines, G.; Rovelli, A.; Salvi, S. Resonance of subsurface sediments: An unforeseen complication for designers of Roman Columns. Bull. Seismol. Soc. Am. 1995, 85, 320–324. [Google Scholar]
  34. Bramati, E. Il Sindaco di Roma Parte Per l’Arabia Saudita Con una Lista di Beni da Salvare. La Stampa. 28 March 2014. Available online: http://www.lastampa.it/2014/03/28/cultura/arte/il-sindaco-di-roma-parte-per-larabia-saudita-con-una-lista-di-beni-da-salvare-H5jEuz7CQDoZbpLjPr1ZBL/pagina.html (accessed on 15 July 2014).
  35. Santini, C. Le Mura Aureliane e Il Settore Meridionale Della Città di Roma: Caratteri Geologici, Fattori di Pericolosità ed Evoluzione Territoriale. Master Thesis, Università Roma La Sapienza, Rome, Italy, 2007. [Google Scholar]
  36. Mantilli, A. Il Settore Sud Occidentale Dell’Area Urbana di Roma: Caratteri Geologici e Sviluppo Urbano. Master Thesis, Università Roma La Sapienza, Rome, Italy, 2006. [Google Scholar]
  37. Urru, G. Pericolosità Geologica e Caratteristiche del Suolo. Metodologie di Analisi e Applicazioni al Caso di Roma. Master Thesis, Università Roma La Sapienza, Rome, Italy, 2008. [Google Scholar]
  38. Casagli, N.; Tapete, D.; Fanti, R.; Morelli, S.; Del Ventisette, C. Il monitoraggio radar satellitare di sistemi archeologici a sviluppo lineare: Applicazioni innovative su acquedotti romani e Mura Aureliane. In Roma Archaeologia. Interventi per la Tutela e la Fruizione del Patrimonio Archeologico. Terzo Rapporto; Cecchi, R., Ed.; Electa: Roma, Italy, 2011; Vol. II, pp. 234–265. [Google Scholar]
  39. Dailymotion. Crolla Il Muro di Porta San Sebastiano. Available online: http://www.dailymotion.com/video/x1h8p3t_crolla-il-muro-di-porta-san-sebastiano_news (accessed on 15 July 2014).
  40. Gentile, F. Crepe al Vittoriano, Gigante Malato. La Repubblica. 18 June 2007. Available online: http://roma.repubblica.it/dettaglio/crepe-al-vittoriano-gigante-malato/1325070 (accessed on 15 July 2014).
  41. Tapete, D.; Cigna, F. Rapid mapping and deformation analysis over cultural heritage and rural Sites based on persistent scatterer interferometry. Int. J. Geophys. 2012. Article ID 618609. [Google Scholar]
  42. Fornaro, G.; Serano, F.; Reale, D. 4-D SAR imaging: The case study of Rome. IEEE Geosci. Remote Sens. Lett. 2010, 7, 236–240. [Google Scholar] [CrossRef]
  43. Ardizzone, F.; Bonano, M.; Giocoli, A.; Lanari, R.; Marsella, M.; Pepe, A.; Perrone, A.; Piscitelli, S.; Scifoni, S.; Scutti, M.; et al. Analysis of ground deformation using SBAS-DInSAR technique applied to COSMO-SkyMed images, the test case of Roma urban area. Proc. SPIE 2012, 8536. [Google Scholar] [CrossRef]

