1. Introduction
In recent years, the use of unmanned aerial vehicles (UAVs) has extended to civilian applications such as homeland security, forest fire monitoring, quick response surveillance for emergency disasters, Earth science research, volcanic gas sampling, humanitarian observations, biological/chemosensing/demining tasks, and gas pipeline monitoring [
1]. The International Civil Aviation Organization (ICAO) has defined unmanned aircraft as any aircraft intended to operate without a pilot on board [
2], and they have established the rules for a subset of such aircraft with a limited level of autonomy, which are known as remotely-piloted aircraft systems (RPAS), in preparation for flight operations in the near future. Globally, road-map strategies and legislation initiatives are being defined to fill the technological and operational gaps that limit the full operation of RPAS. For the sake of simplicity and to remain consistent with the majority of the research work reviewed in this paper, the term UAV is applied to any aerial platform that is capable of flying without a person on board, independent of its level of autonomy.
Civilian applications of UAVs were initially considered for D3 operations (dirty, dull and dangerous). For instance, the use of UAVs in dirty situations, such as radioactive contamination, was documented after the Fukushima reactor damage [
3,
4]. The use of UAVs for dull operations includes their use in frontier surveillance [
5] and digital elevation model (DEM) creation [
6]. In dangerous situations, UAV-based applications have been used during hurricanes and wildfire situations [
7,
8]. Currently, the reduced cost of these platforms compared to other alternatives has positioned UAV as a viable substitute and/or complement to current remote sensing aerial platforms, such as satellites and full-scale manned aircraft. Because of the reduced cost, the use of UAVs is also a possibility for businesses related to entertainment, logistics, multimedia creation, cargo operations,
etc.
Apart from the use of UAVs in dirty, dull and dangerous conditions, a number of remote sensing operations have tested the use of UAVs in the monitoring of wildlife, ice cover, weather phenomena, climate change,
etc. [
9]. Scientific studies have been mainly concerned with the precursors of remote sensing flights using UAVs. They have shown the feasibility of UAVs and the advantages of using such platforms, including their cost savings and increased opportunities for usage, endurance, flexibility and resolution. Compared to satellite-based remote sensing applications, UAV-based applications have a much better resolution (from hundreds of meters to several centimeters) and greater flexibility in selecting suitable payloads and appropriate time and/or space resolutions [
10]. When comparing UAVs with full-scale manned aircraft remote sensing in terms of endurance, cost or opportunity, UAVs have shown advantages because they have a greater set of possibilities. Dunford
et al. [
11] focused on the advantages of UAV aerial work in obtaining high-resolution imagery (less than 25 cm) that was collected relatively cheaply and at a high temporal resolution because of the high flexibility of the UAV operation. The easily deployable capability of UAVs makes them useful for rapid response applications.
In this paper, we will review a number of recently published works describing the use of UAVs in remote sensing applications, especially those experiments documenting real flight operations devoted to monitoring vegetated areas. Approximately 40 UAV experiments are used as the base for this review, and they describe UAV flights over 15 countries that have monitored 18 different types of vegetation, measured up to 21 types of vegetation indices, included a similar number of payload configurations, and operated 32 different UAV frame models. It should be noted that the main focus of the paper is on the direct applications of UAVs, rather than on the current research in platforms and sensors. More comprehensive overviews of the evolution and state-of-the-art of platforms and sensing payloads can be found in [
10,
12,
13]. The objective of the paper is to show the success of such experiments, problems that must be solved, use of processing algorithms and results obtained after the flight and data processing. We also review the correlations, if any, between the payloads, frames and applications to possibly assist newcomers in determining the best options for each UAV remote sensing application based on research experience.
This paper is organized as follows.
Section 2 presents previous review works related to UAVs and remote sensing and proposes a new taxonomy for UAV experiments classification.
Section 3 classifies UAV experiments based on the vegetation types being sensed.
Section 4 presents the different applications of remote sensing UAV flights.
Section 5 focuses on the realized data processing and algorithms executed to obtain useful results.
Section 6 and
Section 7 present the sensors and frames used and classify them according to the type of vegetation, application, data processing and expected results of the remote sensing.
Section 8 analyzes current and future trends extrapolated from the reviewed works. Finally,
Section 9 presents the conclusions and future view of the authors on the use of UAVs in vegetation mapping and monitoring.
2. Taxonomy of UAV Experiments in the Remote Sensing of Vegetation
Several reviews have been published recently reporting UAV experiments [
9,
10,
14,
15,
16]. In general they focus on a specific feature of the experiments, such as the platform, or report applications other than vegetation monitoring. In this paper we will focus exclusively on actual UAV flight experiments over any type of vegetation. In order to reach a complete view of all elements in the scene, we base our review in the taxonomy proposed by Zecha
et al. [
16]. Zecha
et al. present a review on the use of robotic vehicles in precision agriculture starting from 2000 when the US Department of Defense switched off the selective availability of global positioning system (GPS) [
17]. Improvements in precise position referencing created possibilities for the use of robotic vehicles such as UAVs for outdoor and wide-space applications. The miniaturization of electronic devices (sensors, modems, processors, servos, batteries,
etc.) has produced the elements required for a change of paradigm in the unmanned vehicle arena. There is a long list of universities and research centers currently involved in UAV development projects suitable for agriculture, including Utah State, Technical of Braunschweig, Stuttgart, Illinois, Brisbane, Munster, Fraunhofer FHR, Cordoba CSIC, NRC in Fiorenze, Alaska, Sydney, NASA,
etc. The survey is focused on the description and classification of vehicular platforms. Platforms are presented according to a taxonomy in the form of a categorization tree [
18].
Table 1 shows Zecha’s taxonomy: the first column contains the categories and each row presents the classifications within each category. The nomenclature has been adapted for consistency with the rest of paper. The first level sets thirteen categories, such as usage, propulsion or degree of automation, and the second level provides an alternative classification within each category. For example, the category
1-Area of mobility has three subcategories: Air, Ground and Water. For the purposes of this review, it is clear that certain categories of the taxonomy are not relevant, such as the category
1-Area of mobility, since only the subcategory Air is of interest for this work. In the rest of the section we will provide a simplified taxonomy (see
Table 2) on the UAV experiments applied to the remote sensing of vegetated areas. The proposed taxonomy is based on the categories of Zecha’s taxonomy. For each category, the corresponding category or categories in the Zecha’s taxonomy is shown in brackets. Other related review works will be also presented inside the corresponding category.
Table 1.
Zecha’s taxonomy on mobile sensor platforms [
16].
Table 1.
Zecha’s taxonomy on mobile sensor platforms [16].
| Category | Subcategory |
|---|
| 1-Area of mobility | Air Ground Water |
| 2-Area of application | Military Industry Surveying Agriculture Aquaculture Forestry |
| 3-Application 4-Processing | Mapping Monitoring Scouting Applying |
| 5-Data analysis | Online Offline |
| 6-Level of data fusion | Regression Classification Data mining Low Intermediate High |
| 7-Software architect. | Modular Blackboard Control Multi-agent Component Dataflow Redundant Complementary Cooperative |
| 8-Sensors set 9-Sensing activity | Active Passive |
| 10-Method 11-Platform size 12-Propulsion | Optical Thermal Electrical Magnetic Acoustic Mechanical Chemical Small / Light Medium Large / Heavy |
| 13-Automation degree | Electric Combustion Manual Automated Autonomous |
Table 2.
Taxonomy on UAV-based remote sensing systems operating in vegetated areas.
Table 2.
Taxonomy on UAV-based remote sensing systems operating in vegetated areas.
| Category | Subcategory |
|---|
| (2) | A-Vegetation | Wildland Agricultural field |
| (3) | B-Application | Passive Proactive Rective |
| (4–7) | C-Processing | Pre-processing Vegetation indices Segmentation 3D reconstruction |
| (8–10) | D-Payload | Laser Spectral Thermal Chemical |
| (11–13) | E-Platform | Fixed-wing Rotorcraft Unpowered |
2.1. Vegetation
The category
2-Area of application is a recurrent topic in other reviews. Following a recommendation of the International Society for Photogrammetry and Remote Sensing, Everaerts [
19] presents the first version of an inventory of current UAV platforms and sensors being used in remote sensing. Based on the information collected at the UVS-International web site, which reaches up to 800 new UAV platforms each year, they found that military organizations are the most advanced current users of UAVs. Austin [
20] also provides a long list of UAV applications for military usage in this book but also indicates the use of UAVs in the civilian arena, which includes aerial photography, agriculture, coastguard and customs operations, infrastructure conservation, fire services, fisheries, information and communication services, meteorology, road traffic, police activities,
etc. This list of civilian roles has yet to be adopted because of current regulatory limitations and issues with insurance acceptance. UAVs have been used in South Africa and Australia for tasks related to animal care, especially for sheep and cattle herds. Related to agricultural and farming works, the book distinguishes three type of applications: crop monitoring, crop sowing/spraying, and herd monitoring/driving. For Dunford
et al. [
11], the fields of application of UAVs in remote sensing are as follows: forestry, agriculture, geosciences, vegetation, gullies, biophysics, archeology, tidal, sediments, soil surfaces, bathymetric maps and rangeland. Nex and Remondino [
14] propose a similar list: agriculture, forestry, archeology and architecture, environment, emergencies and traffic monitoring. Their review contains three case studies on aerial works for archeology, mining and urban data modeling in three dimensions.
Because our interest is limited to UAV-based experiments that have been carried out over vegetation for civilian remote sensing purposes, only the subtypes agriculture and forestry of Zecha’s taxonomy are considered. Our first category (A-Vegetation) is ordered by the vegetation type, and it is divided into two subcategories: wildland and agricultural field. “Wildland” includes rangeland and forest. “Agricultural field” includes large extensions of uniform crops, such as cereal fields, and smaller land areas with fruit trees or high added-value bushes, such as vineyards. The list of crops for which UAVs have been tested is long (alfalfa, wheat, corn, cotton, olive, peach, coffee, papaya, beet palm, potatoes, citrus, barley, rice, clover, sorghum, sunflowers, in vineyards, etc.). As the price of electronics has decreased, an increasing number of crops have been benefiting from the application of UAVs in remote sensing.
2.2. Application
In the category
3-Application, the listed subtypes are: Mapping, Monitoring, Scouting and Applying. Thus, this classification has an increasing level of complexity. Mapping consists of showing the observed spatial data on top of a map. Adding time repetitions to obtain temporal progress results in monitoring. Including a search for a target, such as weeds, results in scouting. For the last level of complexity, applying acts upon the observed area. In this paper, we will show that most of the reported UAV flights over vegetation up to now are mainly for mapping purposes. The final objective of those experiments is to test the platform and payload to show the UAV capabilities. In more advanced experiments, airborne data are compared to ground (truth) data. Only a limited number of reviewed papers [
21,
22] present actual monitoring through repeated flights over the crop season or by comparing forested mass against previous years. Reports on scouting are also limited to vegetation classification using models of anomalous light reflectance and transmittance detection in vegetation. Finally, the only mentions of ‘applying’ are from Austin [
20] and Watts
et al. [
9] for sowing and fumigating in Japan and Australia; however, a reference to a scientific paper has not been provided.
In this paper, we organize the category (
B-Application) differently and define the following subtypes: passive, proactive, and reactive. This classification considers the possible consequences for which the UAV is used, and in particular, it considers the decision-making processes that follow UAV flights. ‘Passive’ applications are those used to generate a map without immediate consequences in which the obtained information is useful in the long term. An example can be scientific UAV flights that support decisions made at political levels related to a forest. In “proactive” applications, the UAV data is used immediately after landing and rapid off-line data processing. For example, farmer decisions related to water management (irrigation, evaporation/transpiration, salinity,
etc.), nutrient management (usually nitrogen but also ferrum, magnesium, zinc and copper), pesticide application (herbicides for weeds, limitation of insect, mite and nematode populations and root-related diseases), growth regulation (plant density and defoliation) and harvest assessment [
23]. Finally, “reactive” applications consist of the production of actuation capabilities for the UAV itself at the same moment that a situation is detected. We believe a progression from the current passive applications towards proactive ones is already underway, but the final targets are the reactive applications.
2.3. Processing
The categories from four to seven (
4-Processing, 5
-Data analysis,
6-Level of data fusion and
7-Software architecture) are all relative to payload processing and are primarily focused on
how the processing is performed. In the long list of reviewed papers, payload processing is performed offline except for those papers focusing on UAV flight control [
24]. The data analysis is based mainly on classification, and some works use regression [
25]; however, none of the studies document data mining techniques. Finally, software architecture is never described in the references, which has lead us to assume that a sequential modular architecture is used.
Instead of documenting how processing is performed, the reviewed literature provides numerous details of what processing is done, including the involved inputs, their combination, and the final results of the processing. This leads to our third category (C-Processing). Three main processing steps are identified: “vegetation indices” calculation, “segmentation”, and “three-dimensional (3D) reconstruction”. The target information to be obtained drives the different steps of the processing. In vegetation mapping, usually one or more vegetation index is applied to obtain the vegetation type, health, stress or growth status. Processing algorithms used in target recognition are mainly related to image processing techniques, such as segmentation and classification. Finally, 3D reconstruction algorithms are based on stereo vision, structure from motion and other techniques from the field of computer animation. A number of lateral calculations have also been mentioned in many papers. Sensor calibration and radiometric homogenization are examples of pre-processing steps that have significant importance for the posterior processing. Georeferencing and mosaicking techniques are frequent processing steps too. All such calcultations are included in the fourth subcategory: “pre-processing”.
2.4. Payload
The categories
8-Sensor set, 9-Sensing activity and
10-Method are all related to sensors, and they are all covered in the fourth proposed category (
D-Payload). In the reviewed experiences, because of the low-cost requirements and limited weight capabilities, the sensors are never redundant or cooperative, but complementary. If more than one sensor is on board, then the second sensor obtains additional required data that complement the first sensor. Most sensors use optical, electro-optical and thermal methods, so they are passive sensors. According to Austin [
20], there is a nearly worldwide use of visual and infrared cameras in crop monitoring. Nevertheless, a number of experiments use radar/LiDAR sensors, which use active acoustic, ultrasonic and light emissions, in the remote sensing of vegetation [
26,
27,
28]. The capability of UAVs for flying much closer to the ground than satellites or full-scale manned aircraft increases the variety of sensors that can be used as payload, and they are not limited to spectral imaging. Biochemical sampling has been reported by Techy
et al. [
29], but only the flight coordination capabilities are reported in the paper. Studies using magnetic, mechanical or chemical sensors for vegetation monitoring have not been found. A review of sensors for classical remote sensing is provided by Pinter
et al. [
23]. The biophysics basis of such sensors is fundamental for providing information on the spectral reflectance and thermal emittance of ground objects and differential characteristics of leaves, soils, and dry and green vegetation. These are the classification characteristics of electromagnetic sensors. Other factors that affect the quality and confidence of vegetation index results are illumination and meteorological conditions in general, topography, and the angle of view of the remote sensor with respect to the plant.
2.5. Platform
The categories 11-Platform size, 12-Propulsion and 13-Automation degree are all relative to the air platform. The size of the platform is always reported data for all experiments using UAV because such data characterize most of the functionalities and limitations of the flight and payload of the experiment. Propulsion is in general, directly related to the size of the platform. Large platforms typically use internal combustion engines while small platforms use electrical engines. However, the automation degree, which is set by the autopilot of the UAV, is independent of the size of the platform, which is shown later.
Surprisingly, the majority of UAV classifications provided in the literature [
9,
10,
14,
20] are not focused on the size, propulsion or automation degree but on the airspace and flight characteristics. Endurance, range, altitude, and aerodynamics profile of the platform (fixed wind, rotorcraft, blimps,
etc.) are major differential features. Nevertheless, endurance and ceiling altitude are related to platform size, with large platforms having long endurance, long ranges and high ceiling altitudes and small platforms having short endurance, short range and low altitudes. In addition, cost is directly related to size.
Watts
et al. [
9] classify UAVs using three basic parameters (altitude, endurance and flight capabilities). They propose 7 categories: HALE, MALE, LALE (all Long-Endurance with High/Medium/Low Altitudes), LASE, LASE Close (Low Altitudes Short-Endurance), MAV/NAV (Mini and Micro/Nano UAV), and VTOL (Vertical Take-Off and Landing). A similar platform classification is provided in Austin’s book [
20]. The author classifies UAVs according to the platform range/endurance but also by the size, and the following five categories are defined: Long-endurance long-range; Medium-range; Close range; Mini UAV; and Micro/Nano UAV. The two classifications produce different names for similar concepts, differ in the VTOL category and on the subdivisions in the long-endurance category. In addition, Everaerst [
19] offers a classification by altitude but excludes the medium altitude vehicles for remote sensing applications because of the conflict indicated for commercial flights. For the low altitude UAVs, Everaerst extends the previous classifications to include new types of frame: blimps [
30], balloons [
31], and powered paragliders [
32]. Similarly, Dunford
et al. [
11] present a review focused on low altitude UAVs and classify such UAVs according to the flying method: kites, blimps, balloons, paragliders and motor-powered UAVs. Nex and Remondino [
14] present three orthogonal classifications of the UAV platforms: according to their use are classified as tactical and strategical, according to their propulsion systems as rotary, fixed-wing and lighter-then-air, and according to the power system as unpowered or powered.
An alternative classification can be found in Clothier
et al. [
33]. According to a risk-based approach, the UAVs are classified in two axis. One axis accounts potential damage in terms of energy and the other axis the damage in term of the size of the area or number of people involved. The proposed classification has 5 levels: Category 1 for less risk UAS (can only cause injuries to one or few people), Category 2 for UAS able to injury a small amount of people standing outdoors, Category 3 is for UAS with some probability to break a wall/roof and injury people indoors, in category 4 UAS are able to penetrate in a concrete structure and category 5 in the highest risk category, where the affected area can extend more than 1 hectarea. Risk assessment is regulated through the airworthiness regulations, which sets that all aircraft must show a Certification of Airworthiness (CoA). Up to now, only very few UAVs have obtained it in a temporal basis [
34], while waiting for legislation still to be fully developed. In the future, the new legislation developed after the ICAO Circular [
2] will set the exact classification of the UAV.
Another review focused on autopilots only for small UAVs (mini, micro and nano) is from Chao
et al. [
15]. Autopilots are the part of the flight management system in charge of the guidance of the vehicle through the desired route. And guidance is traslated into the adequate order to the controller close-loop, a control system which translates then to the surface servo-mechanisms and to the engines. The control orders must consider the current state of the UAV and the desired commands emitted from the ground station by the pilot, and their execution must be smooth. The current state is provided by the fusion of the sensors onboard, mainly innertial units, GPS receivers and magnetometer. Different control and filtering techniques exist, such as proportional-integral-derivative (PID) controller, fuzzy logic, neural networks and Kalman filter. Common commercial reported autopilots are: Procerus Kertrel (of only 16.7 gr of weight), the MicroPilot series (
i.e., MP2028), the Piccolo family (with multi-UAV support) and the UNAV 3500 (the cheapest). All of them have navigation through waypoints, hold states and auto-takeoff and landing. In the open source bazaar the list is: Paparazzi (from ENAC), Crossbow (package including MNAV inertial system and Stargate processor) and Ardupilot.
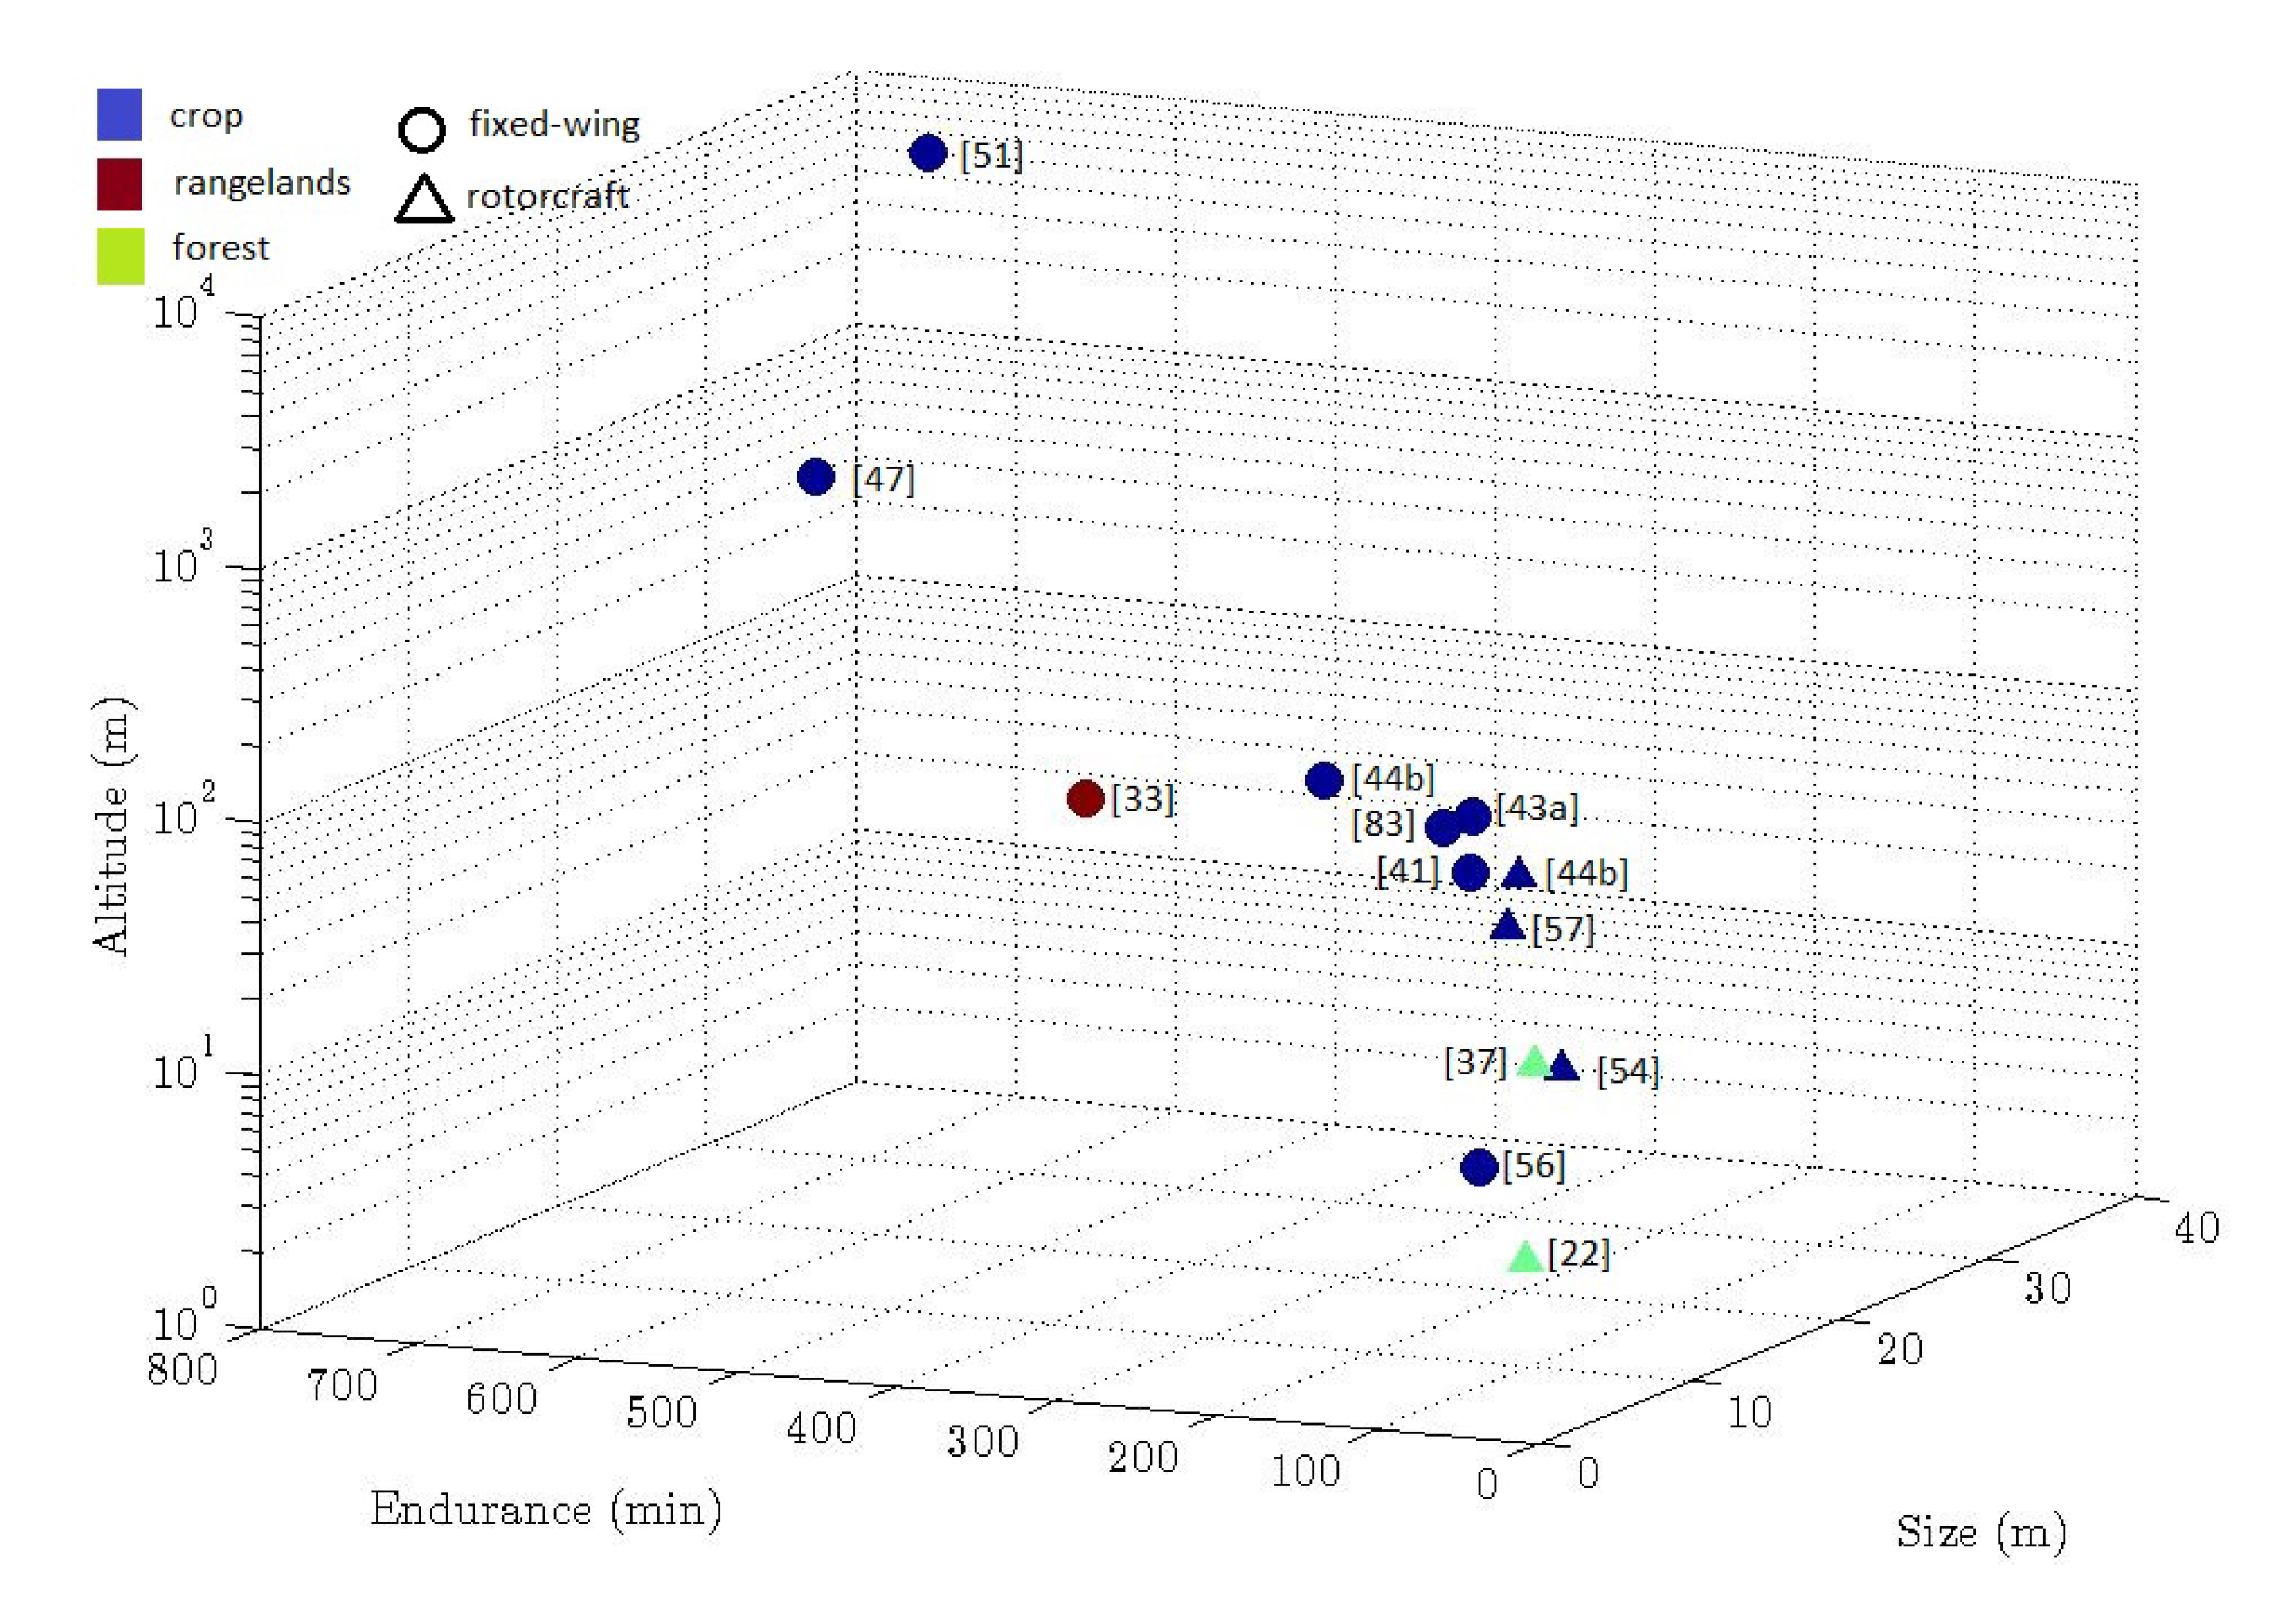
Figure 1.
UAV experiments classification by vegetation type (colors), airframe (symbols), altitude, size, and endurance.
Figure 1.
UAV experiments classification by vegetation type (colors), airframe (symbols), altitude, size, and endurance.
A global view of the most significant characteristics of some of the UAV experimental flights is shown in
Figure 1. Colors show the type of vegetation: blue is for crops, green is for forests, and red for rangelands. Markers show the type of airframe: circle is fixed-wing and triangle is rotorcraft. Then flight altitude, experiment flight time and platform size are given in the three axis. Notice that altitude is in logarithmic scale to better distinguish between low altitude flights. Not all experiments are shown because not all the data required for the plot were available. Nevertheless, the figure gives an global idea of the experiments and their characteristics.
3. Vegetation Types
A number of different vegetation types have been surveyed using UAVs. Most studies have focused on crops fields in which the scan area is limited and well known. However, there is also a significant number of studies on wildlands where limited access and low population density make the use of UAVs especially interesting.
Wildland experiments include those in rangelands [
25,
35,
36,
37,
38] and closed canopy forests [
11,
39,
40,
41]. The term rangeland describes extensive unforested lands in the form of prairies, desert grasslands and shrublands, woodlands, savannas, chaparrals, steppes, and tundras. Although the different forms of rangeland comprise more than half of the earth’s land surface, a lack of approaches is observed in this area. Rango
et al. [
35] presented preliminary results from study sites in New Mexico and Idaho showing the great potential for the use UAVs for rangeland management. The Hung
et al. experiment [
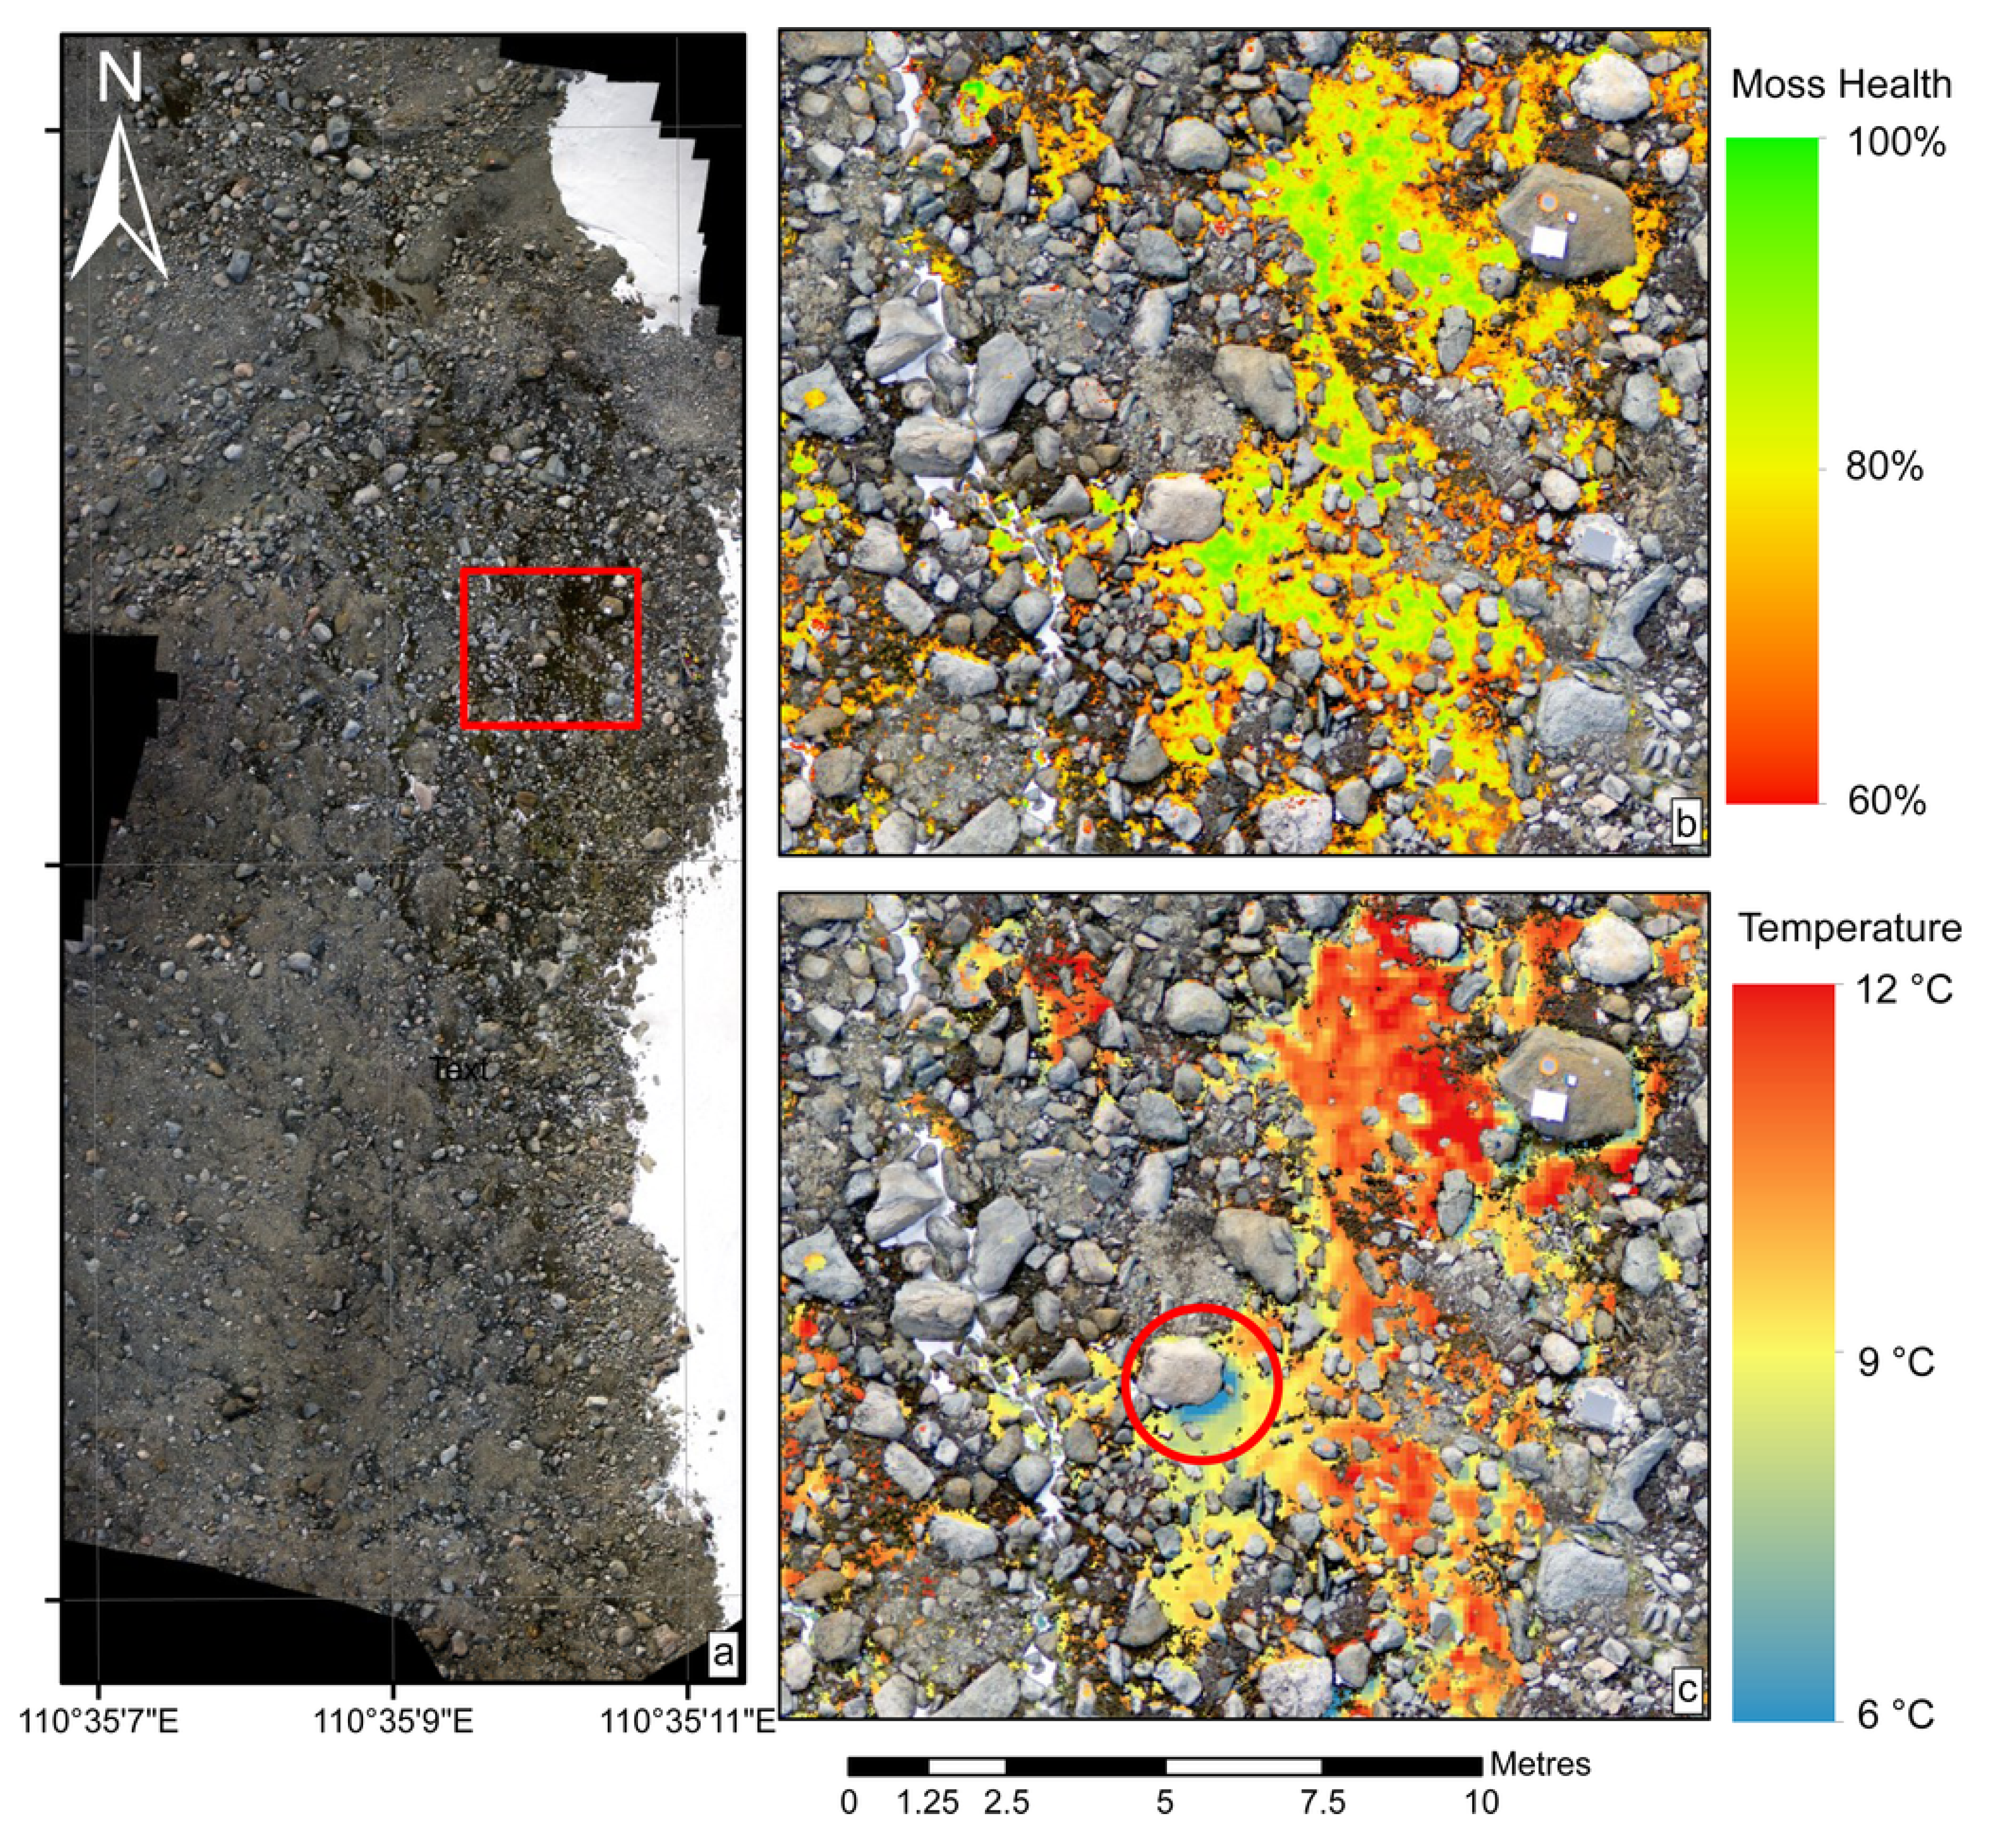
25] obtains the distribution of different vegetation species and detect invasive weeds over two cattle farms of Queensland, Australia. Lucieer
et al. [
42] conducted a successful experiment using a UAV for mapping moss beds in Antarctica. Logistical constraints and the spatial scale of the moss beds (tens of m
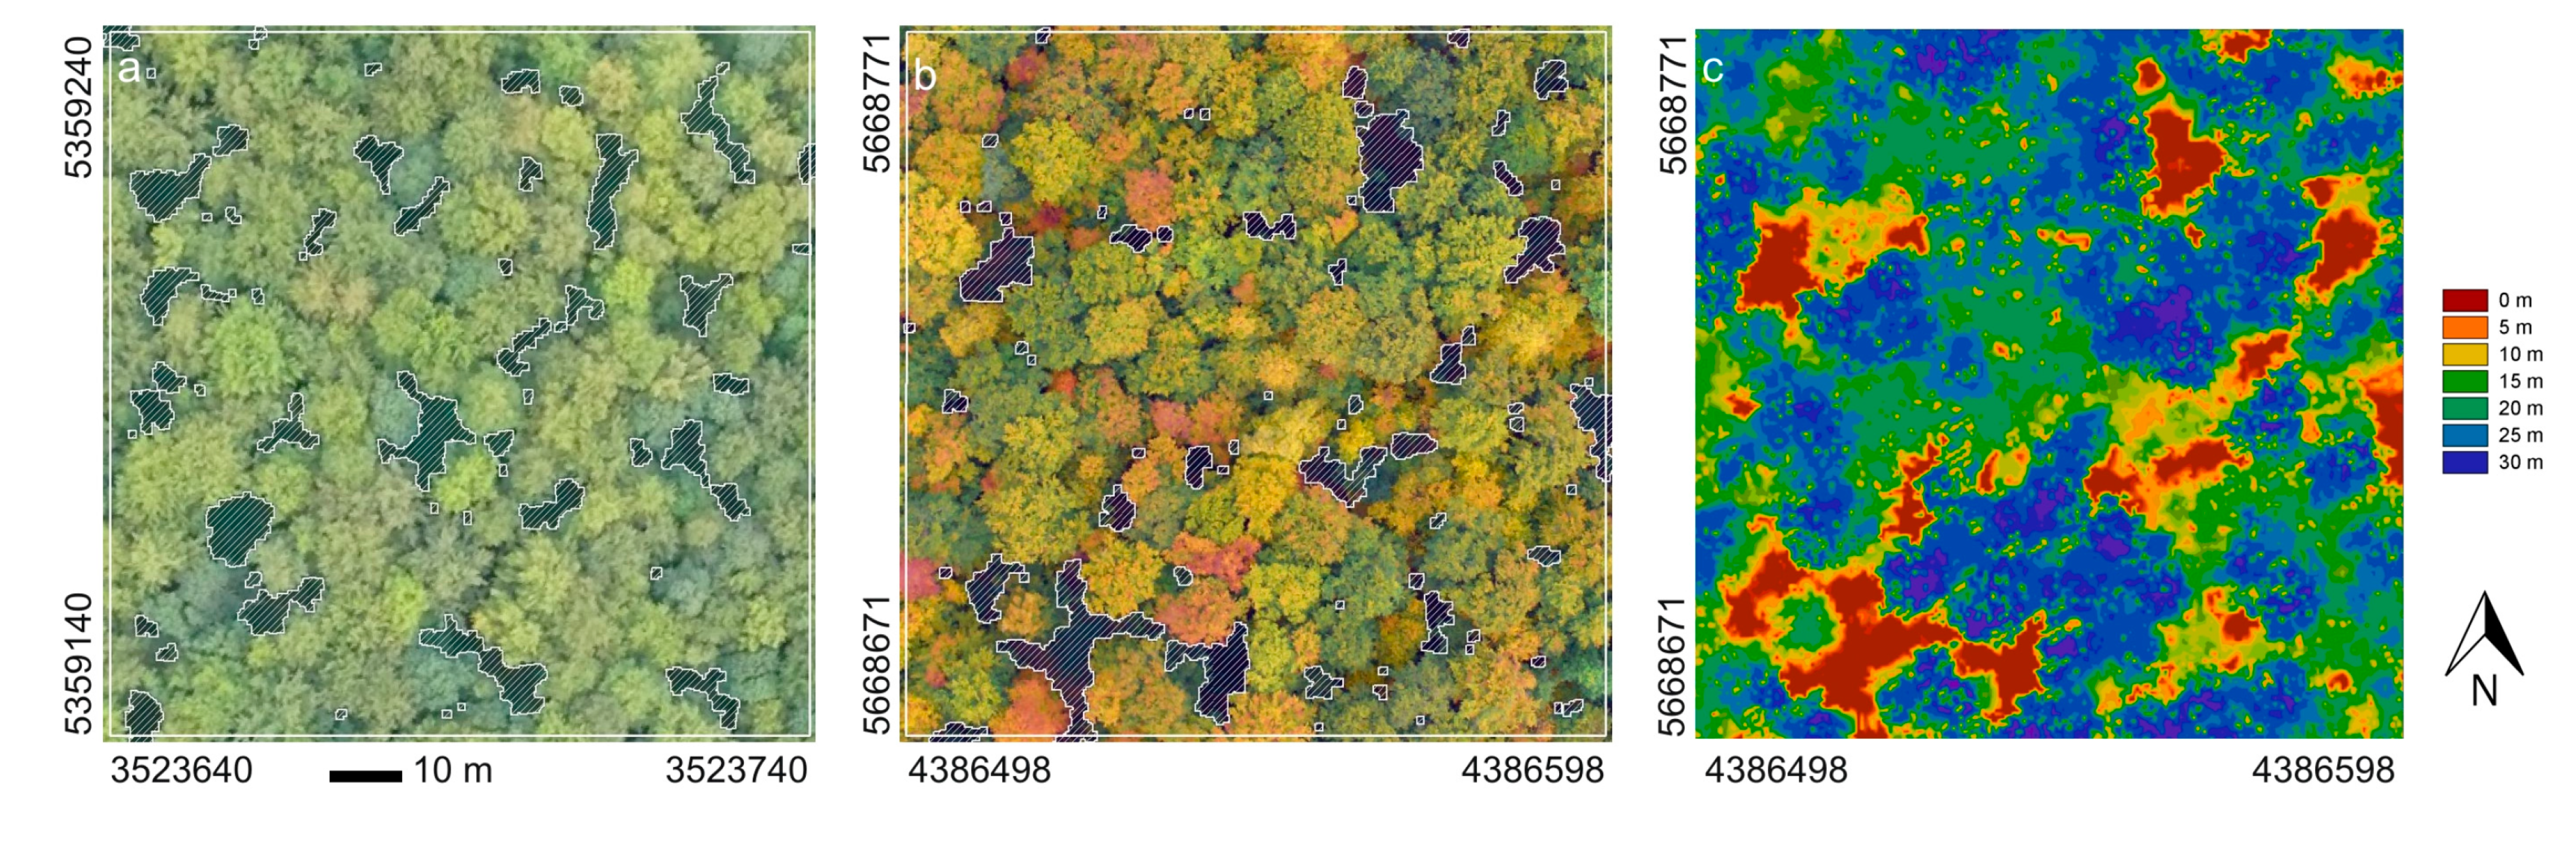
2) make a UAV an ideal tool for collecting ultra-high resolution imagery in such an environment. Wallace
et al. [
39] demonstrated the capability of a UAV-LiDAR system for forestry inventory applications. In [
28] a
Eucalyptus globulus plantation in Tasmania, Australia, is used as the test field for canopy structure estimation. The flexibility and cost-effectiveness of UAVs has also been shown by Dundorf
et al. [
11] for riparian forests in the Drôme River in southern France, and by Jensen
et al. [
43] in the Oneida Narrows near Preston, Idaho.
On the other hand, numerous studies have been conducted in agricultural areas and include a variety of test fields ranging from fruit trees to bushes, roots, legumes and cereals. UAV-based remote sensing experiments on citrus, peach and olive trees in Spain and papaya and palm orchards in Malaysia are reported in the literature [
44,
45,
46,
47]. Vineyards are a common target of study in wine-producing countries such as the USA [
48,
49] and Spain [
50,
51,
52]. In September 2002, NASA’s solar-powered Pathfinder-Plus UAV was used to conduct a proof-of-concept mission in US national airspace above the 1500 ha plantation of the Kauai Coffee Company in Hawaii [
53]. Other reported crops include potatoes [
29,
54], soya [
54], sugar beet [
55,
56], rice [
57] corn [
46,
56,
58,
59], wheat [
22,
57,
60], and barley [
57]. The higher number of tests compared to wildlands can be explained by the ease of operation, reduced area of study, lower heterogeneity and more familiar characterization (for a particular crop), and productivity interests.
4. Applications
There are a large number of experiences that demonstrate the great potential of the use of UAVs for vegetation mapping and monitoring. A subset of documented use cases is listed in
Table 3. Mapping and monitoring applications involve acquiring and processing data, and the obtained results are expected to provide the basis for making decisions and trigger different actions for the vegetation. Based on the degree of participation of the application in the full process, we have classified them as passive, proactive or reactive.
Table 3.
Vegetation remote sensing applications using UAVs.
Table 3.
Vegetation remote sensing applications using UAVs.
| Application area | Use case |
|---|
| Passive applications | |
| Climate change monitoring | Mapping moss beds in Antarctica [42] |
| | Monitoring of biodiversity in the Fonttainebleau forest [41] |
| Rangeland health monitoring | Determining canopy cover and gap sizes [35] |
| | Monitoring changes in the canopy structure [28] |
| | Dead wood identification [11] |
| Rangeland/forest inventory | Differentiating rangeland vegetation [36] |
| | Mapping and characterization of riparian forests [11] |
| Topographic surveying and mapping | Mapping the substrate and vegetation in rivers [43] |
| | Assessing ephemeral gully erosion in agricultural fields [61] |
| Proactive applications | |
| Wildfire fighting | Forest fire detection and monitoring [62,63] |
| Precission Agriculture | Modeling canopy structure [48] |
| | Ripeness monitoring [53] |
| | Water stress detection [45,46,50,51] |
| | Estimation of nitrogen level [22,59,64] |
| | Pathogen detection [44,55] |
| | Aerobiological sampling [29] |
| | Plant health monitoring [54] |
| | Mapping invasive weeds [53] |
| | Monitoring herbicide applications [65] |
| Reactive applications | |
| Spraying | Spraying chemicals on crops [66] |
Passive applications are primarily engaged in collecting information, but not in conducting a direct action on the vegetation in the short term. Examples of such applications include estimating canopy cover, monitoring vegetation change, modeling biophysical and biochemical characteristics, and mapping of species [
11,
25]. Vegetation change [
28,
35] is a major indicator for climate change [
42], biodiversity conservation [
41], and estimation of health and remediation treatment effectiveness [
67]. For example, Breckenridge [
38] uses different mapping and classification systems to evaluate changes in vegetation as a result of fires. In agriculture, changes in crop status over time can be extrapolated to predict future crop growth [
56,
65]. Modeling and mapping applications are also used for rangelannd and forestry inventory. Laliberte and Rango [
36] highlight the ability of UAV imagery to quantify spatial patterns and patches of vegetation and soil not detectable with piloted aircraft or satellite imagery. The high resolution, low-cost, and flexibility of UAVs are also valuable features to get updated data in continuously changing environments, such as rivers [
43], where the vegetation, the path and the flow of the river are always changing, and ephemeral gullies in agricultural fields [
61], where their intermittency and small width and depth make them difficult to be detected by general topographic surveying and mapping. Also noteworthy is the versatility of UAV-based systems to be used in different contexts. It is the case of the AggieAir platform [
43], which is involved in agricultural, riparian, habitats and road mapping projects.
Proactive applications typically monitor the vegetation status to detect areas of disease, nutrient deficiency, invasive weeds, pathogens and drought. They differ from passive application in that collected data are used to make decisions on short-term actions. Their main area of application is Precision Agricuture(PA). PA allows fertilizers, pesticides, herbicides, and irrigation to be applied to the specific needs of each crop in each specific area, rather than apply equally to the entire field, thus improving the product and saving resources. For example, monitoring water status [
45,
46,
50,
51,
55] is widely reported in the literature and it is required to optimize irrigation strategies. Herwitz
et al. [
53] and Johnson and Herwitz [
49] reported on experiments that analyze ripeness for vineyards and coffee plantations. Nitrogen mapping [
59] can also be used to guide fertilizer tasks. Aerobiological sampling [
29] enables plant pathologists to detect, monitor, and forecast the spread of high risk plant pathogens above agricultural fields. Calderon
et al. [
44] assessed methods for early detection of
Verticillium wilt, which is the most limiting disease in all of the traditional olive-growing regions worldwide. Another relevant field of application where a quick and efficient response is critical is fire fighting. Wildfires are a devastating catastrophe for forest. Remote sensing experiments using UAVs for forest fires have already been presented. In [
62], a heterogeneous fleet of UAVs cooperate in the detection and monitoring of forest fires. In [
63], the large Ikhana airframe hosted the AMS scanner and obtained imagery from high altitudes. All the above applications involve collecting and processing data quickly and repeatedly for different time periods, thus making UAV-based systems particularly suitable. In the case of wildfires, safety is added to the already mentioned advantages of UAVs.
In the near future, UAVs are expected to be used for reactive applications, which would increase their autonomous ability to make decisions and perform actions. UAV systems are already in use in Japan for sowing and spraying [
20]. In such cases, perimeter fences are used for electronic positioning and allow for the automatic flight of the UAV. Smart sowing or spraying applications must be considered in which the data produced by the sensors are processed in real-time and the system has the intelligence to react in accordance with the results of the scan. In [
66], feedback obtained from a wireless sensor network deployed on the crop field is used to control the route of a spraying UAV. As indicated by Zecha
et al. [
16], future solutions of this type will require a standardized interchange of data and system components. Additional well-known challenges to be addressed by UAV-based solutions are the limited accuracy of position and orientation data, synchronization issues between imaging sensors and the GPS and inertial navigation system, high roll and pitch variation between images, perspective distorsion, and high variability in illumination conditions [
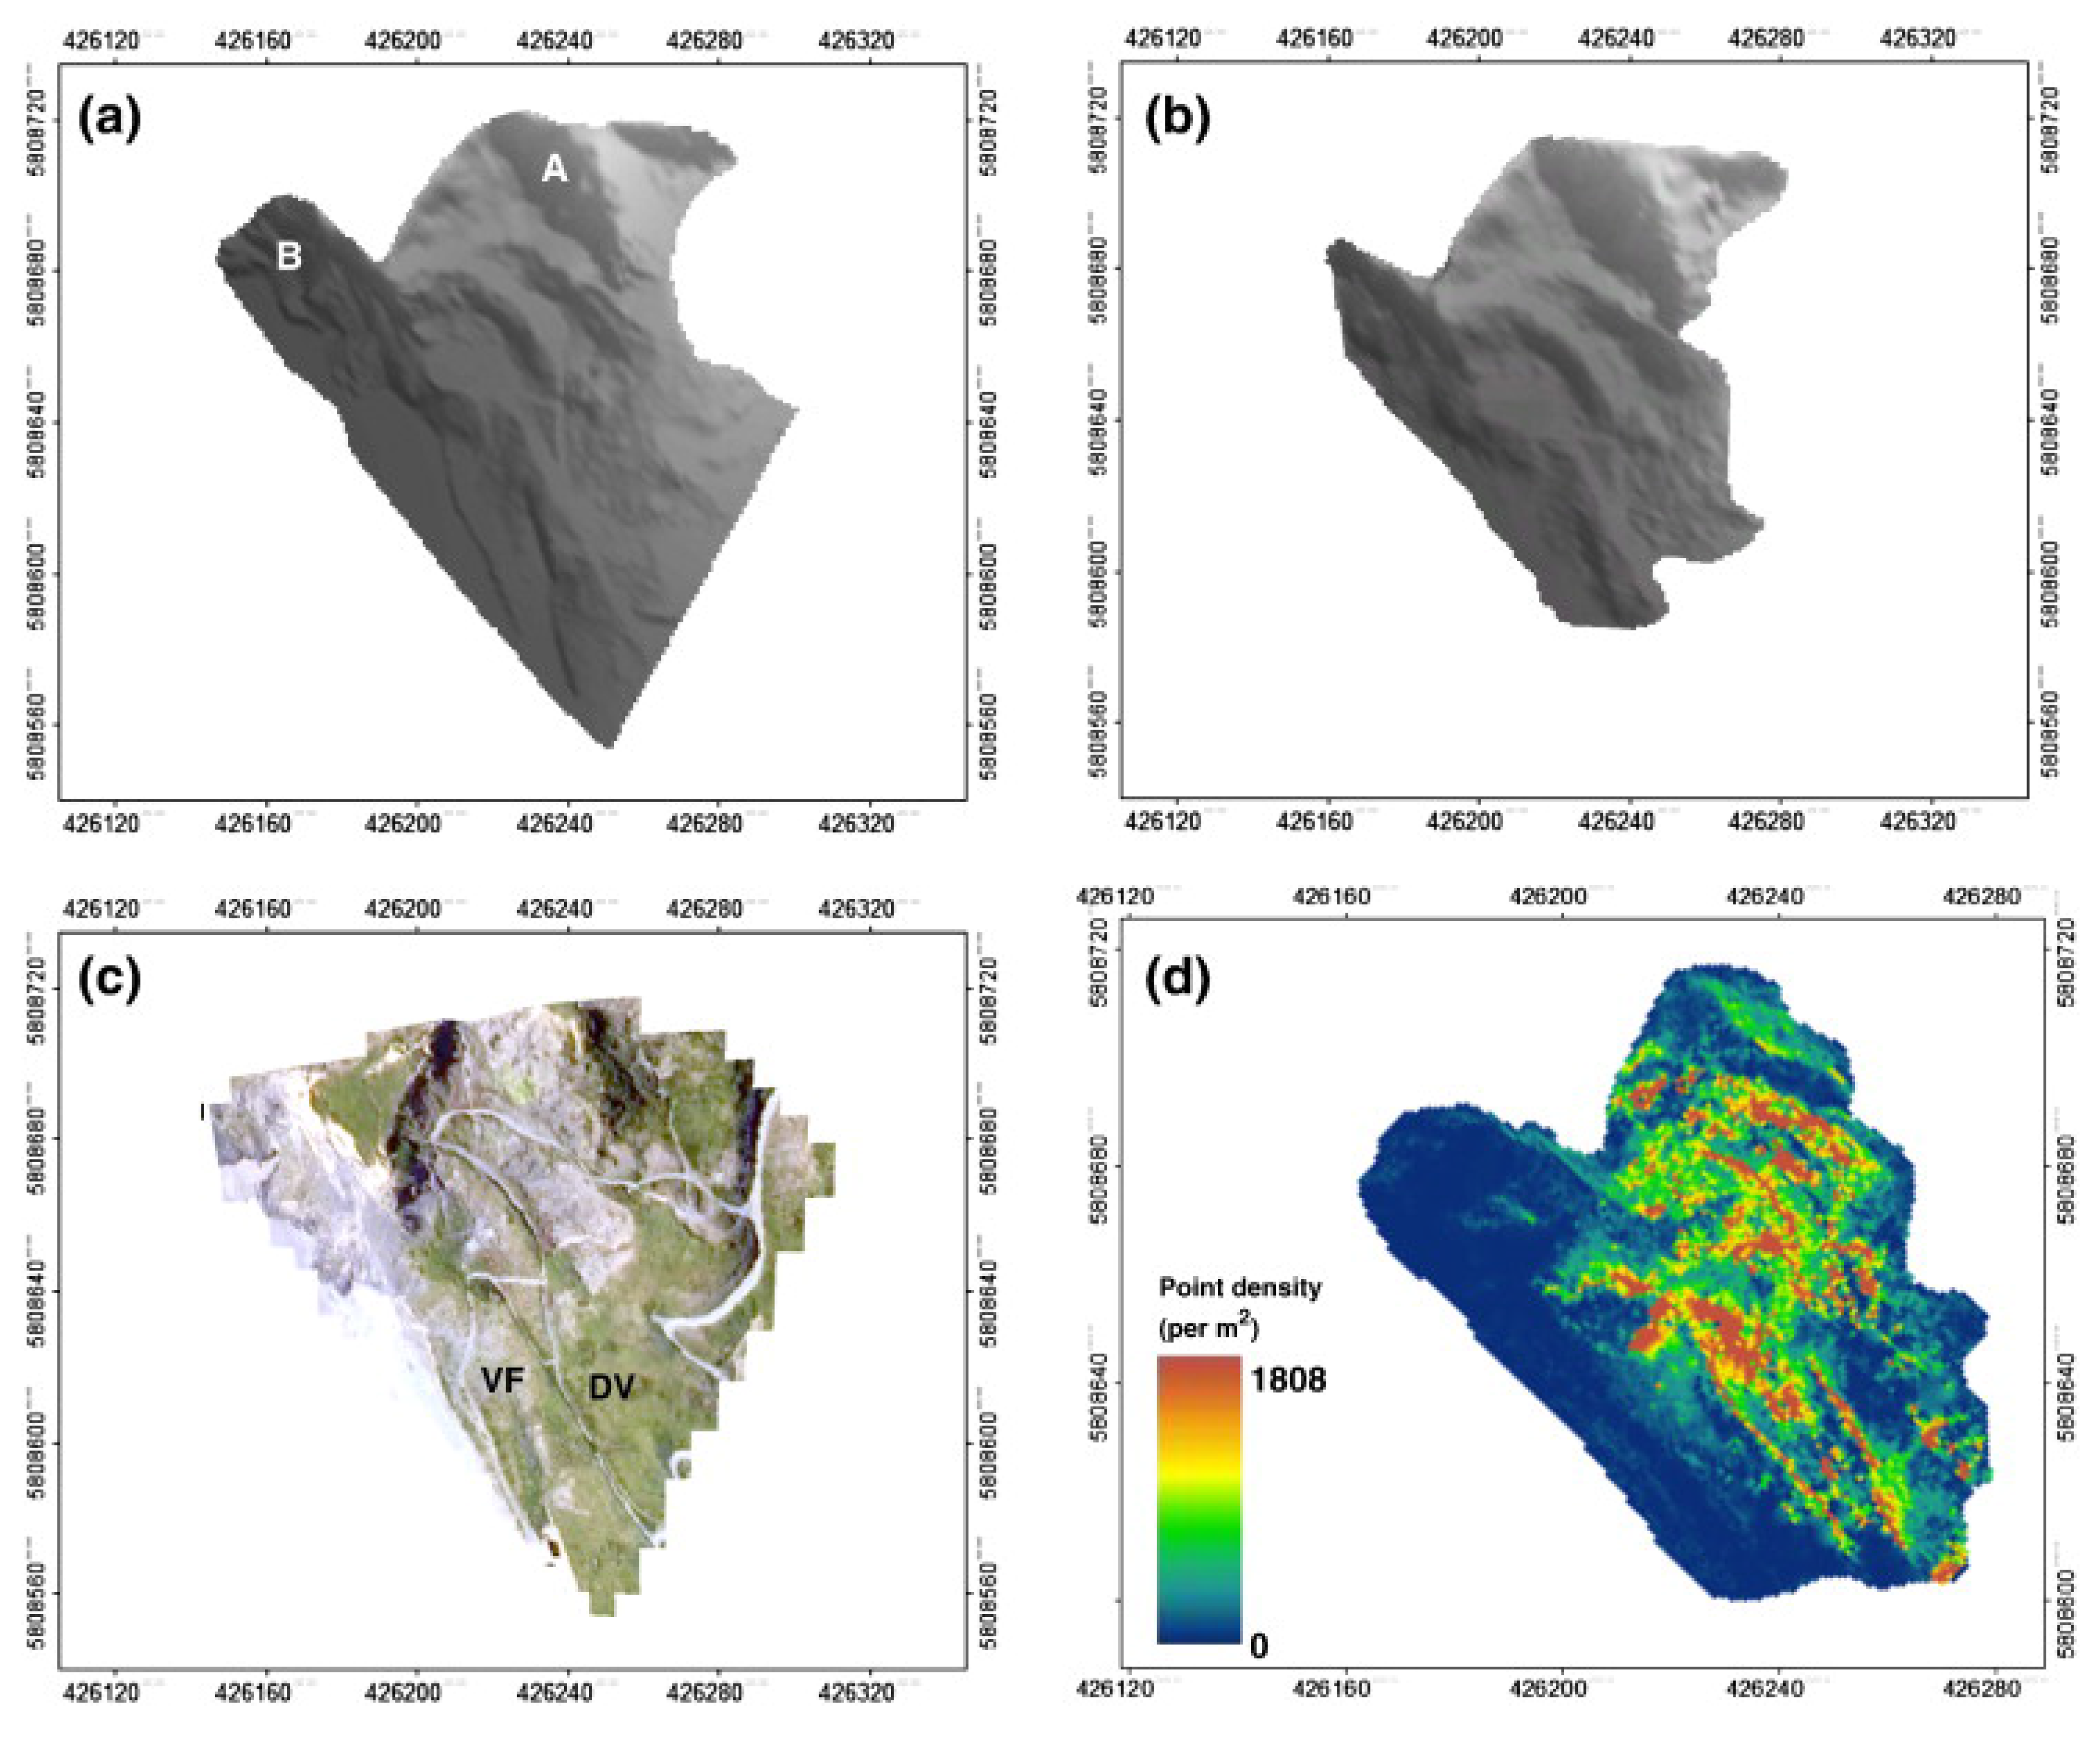
6].
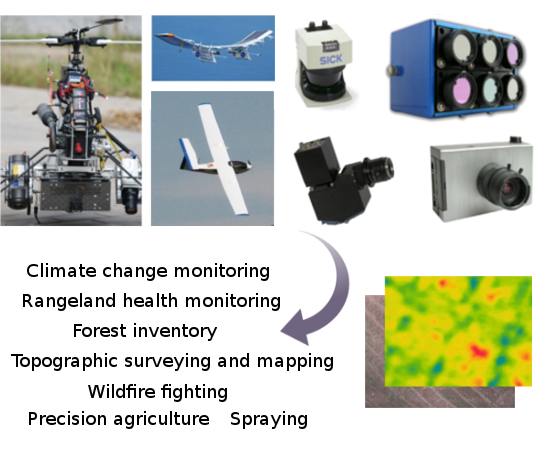
6. Payload
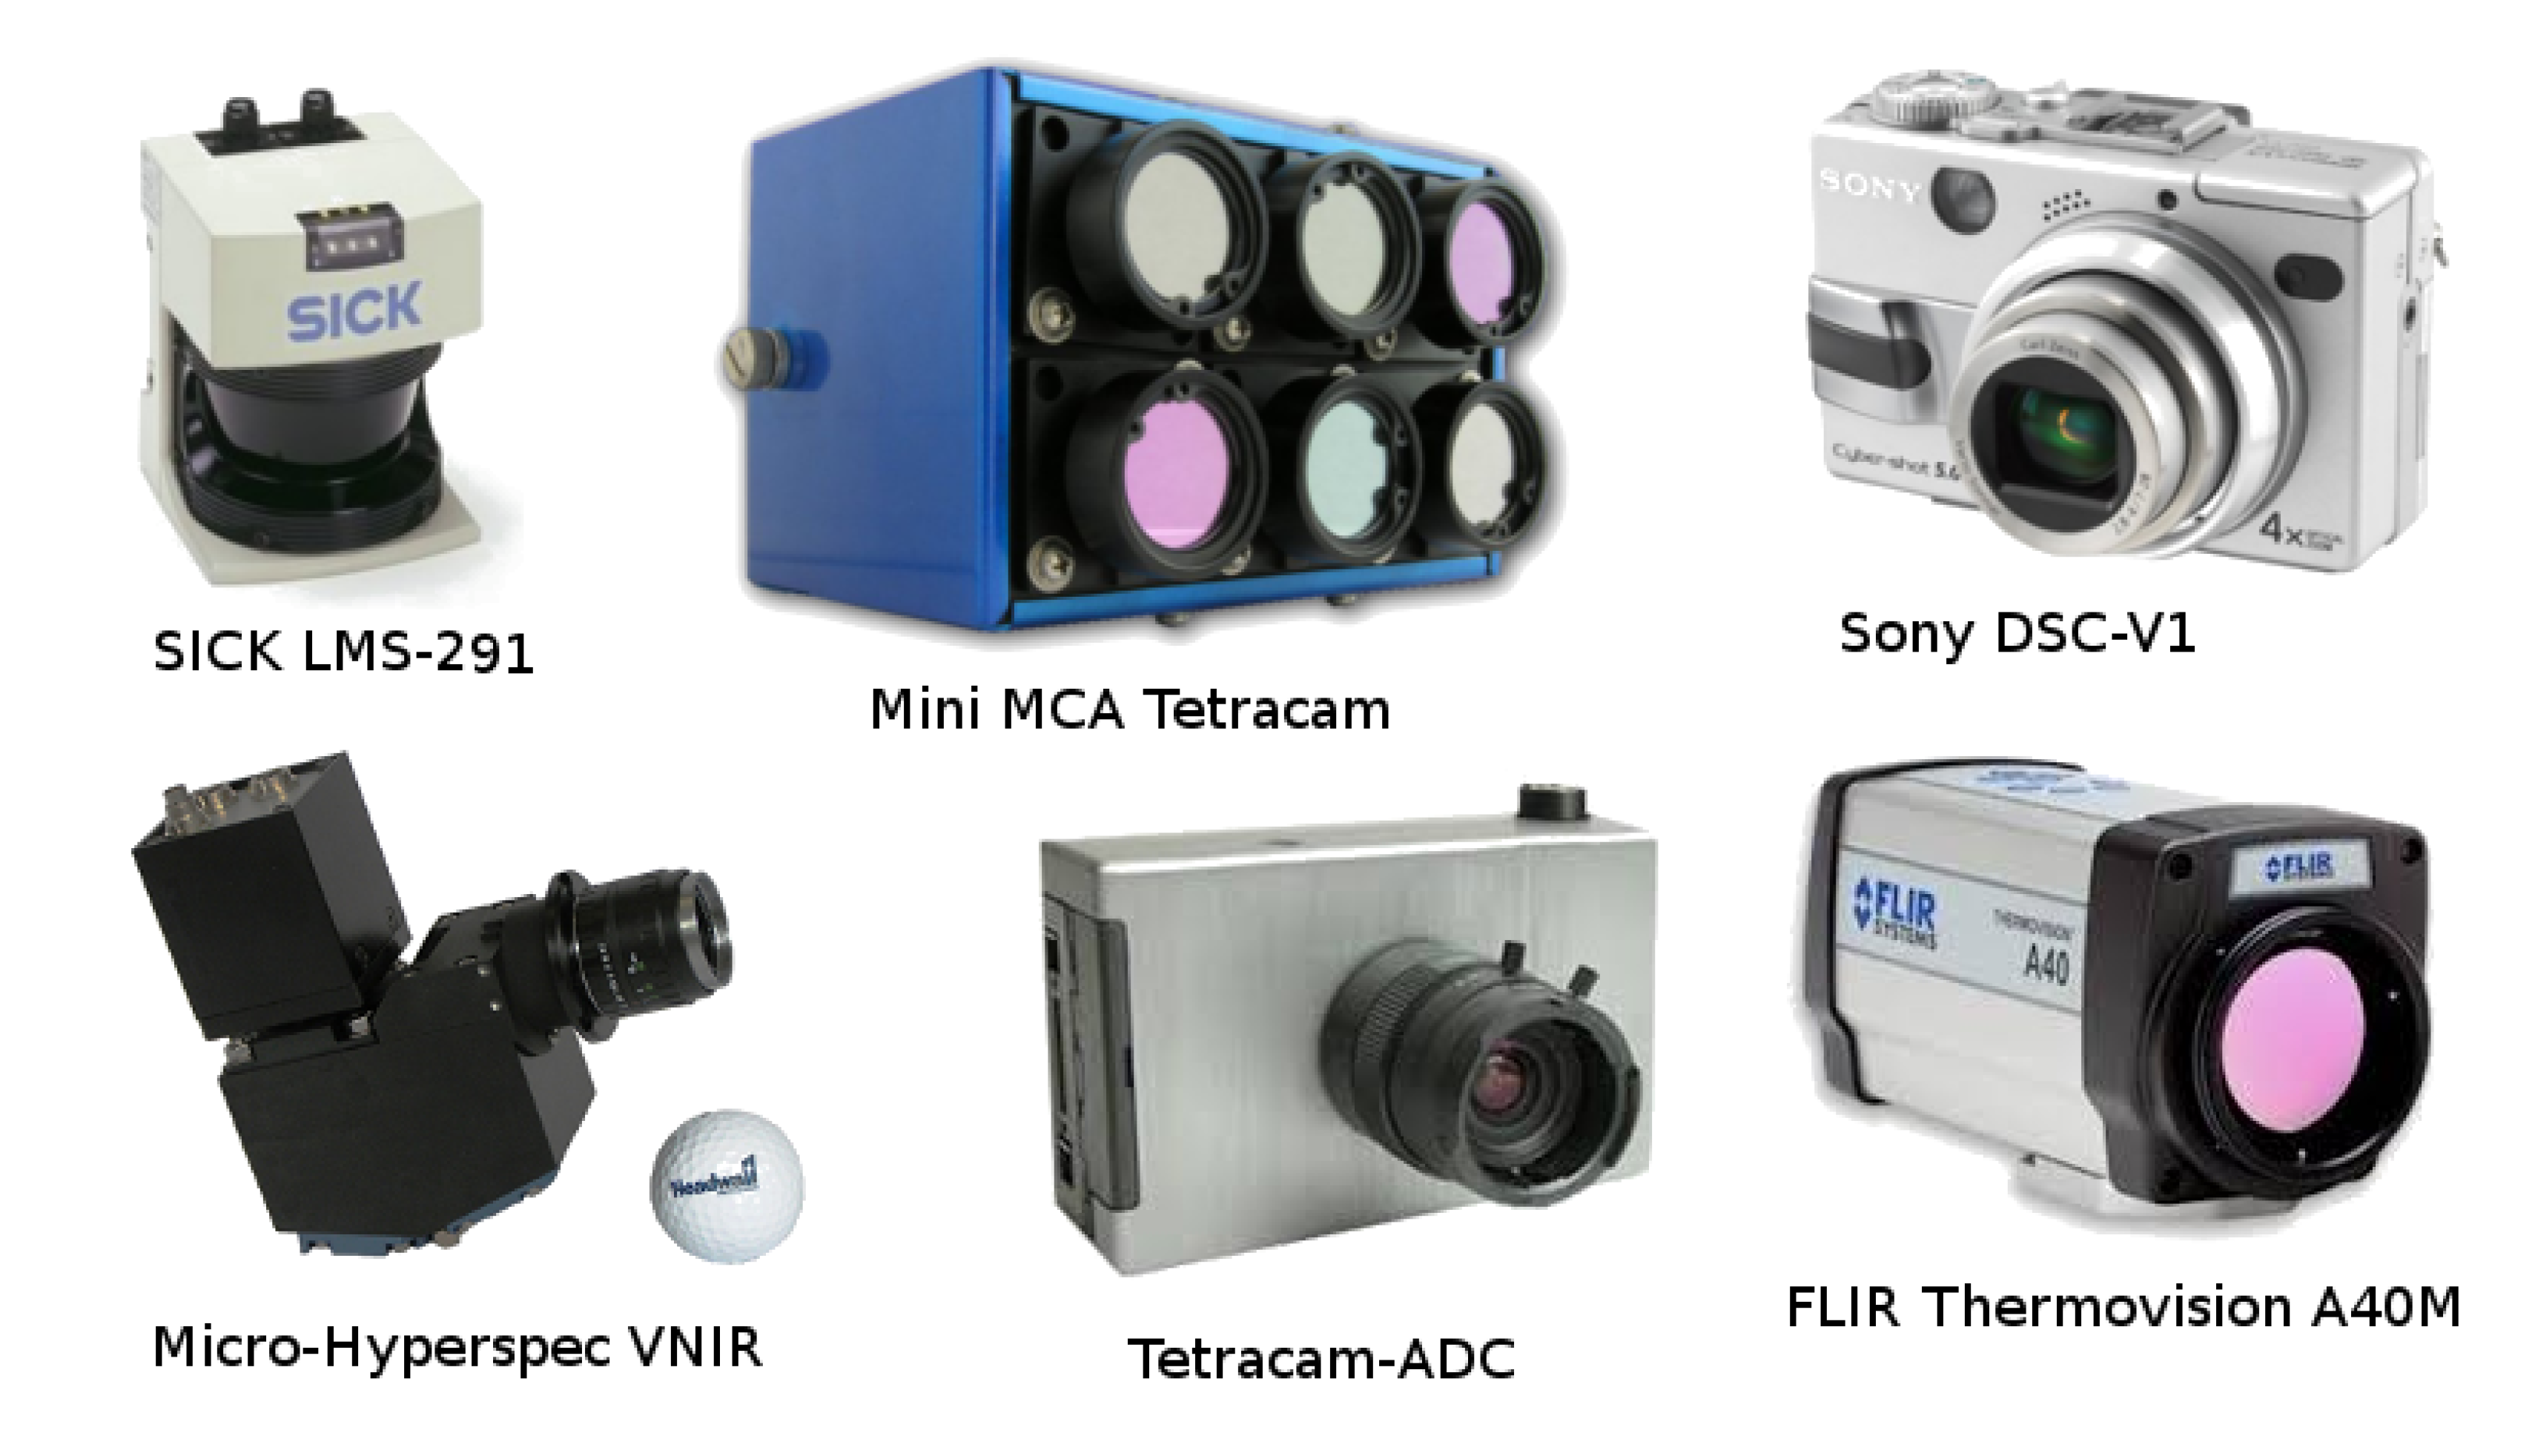
The equipment required for modeling, mapping, and monitoring vegetation is mainly composed of imaging sensors together with a GPS and an inertial navigation system (INS). Existing commercial technology allow for high resolution imagery sensors to an increasingly small size and weight, and at a reasonable cost.
Figure 5 shows some imaging sensors used in UAV systems. Sensors are broadly classified as
passive (an external source of energy, such as the sun light, is needed to observe the target), and
active (they rely on their own sources of radiation to illuminate the target so that the energy reflected and returned to the sensor may be measure).
Figure 5.
Imaging sensors used in UAV-based systems for vegetation remote sensing.
Figure 5.
Imaging sensors used in UAV-based systems for vegetation remote sensing.
The LiDAR is an active optical sensor that transmits laser beams toward a target. The time from when the laser pulse left the system to when the reflection is returned is used to calculate the range distance between the sensor and the target. The distance is then combined with the positional information (GPS and INS) to produce a highly accurate georeferenced point cloud. The UAV-LiDAR system presented in [
28], with application to forest inventory, uses an Ibeo LUX laser scanner (maximum range 200 m, maximum scanning range 110°set to ±30°, distance resolution 4 cm, angular resolution 0.25°, 1 kg). In [
90], digital surfaces are modeled using a SICK LMS-291 Laser RangeFinder (maximum range 80 m, error of about 10 mm, angular resolution 0.25°, 4 Kg).
A spectral image sensor is a passive sensor that captures image data at specific frequencies across the electromagnetic spectrum. The data from a spectral image sensor can be viewed as a stack of images, with each image corresponding to a different color or spectral band. Calibration and correction operations must be performed to compensate for artifacts and gain variations in the sensor [
22,
25,
46,
49,
51,
54,
57,
68,
93,
94]. Multispectral imagers are the main type of sensors used in the reviewed experiments. As example of the multispectral sensors used, we can cite MCA6 Tetracam (1.3 MP, 2.7Kg) [
46,
51,
94], Mini MCA Tetracam (1.3 MP, 720 g) [
55], Tetracam-ADC (2.1 MP, 500 g) [
65], and Geospatial Systems MS3100 (1.3 MP, 13 Kg) [
53]. Reported spatial resolution is in the order of decimeters at 200 m AGL and centimeres at 50 m AGL. Different combinations of spectral bands are used for different purposes. As seen in the previous section, Green, Red an NIR channels are the most commonly used for vegetation applications. In some works, the required bands are obtained by adding or removing optical filters to commercial RGB digital cameras, just replacing one color channel by the desired NIR band [
22,
42,
56,
58,
60]. Commercial off-the-shelf digital cameras provide easy access to standard RGB channels. Pixel resolution typically ranges from 5 to 12 MP, such as in Sony DSC-V1 [
61], Canon PowerShot G5 and Canon EOS 5D [
11], FUJIFILM-FinepixZ10fd [
40], Canon PowerShot A480 [
48], and Canon PowerShot SX100 [
43]. RGB images were mainly used for stereoscopic or SfM-based 3D reconstruction, but also for mapping and dead wood identification [
11].
Recently, relatively low-cost, small size, and light weight hyperspectral image sensors are also emerging. A hyperspectral image sensor employs hundreds of contiguous bands through a wide spectral range. A micro-hyperspectral camera Micro-Hyperspec VNIR (260 bands, spectral range 400–1000 nm, 6 nm FWHM, 450 g) was installed on board a UAV at the Laboratory for Research Methods in Quantitative Remote Sensing (QuantaLab, IAS-CSIC, Spain) [
44,
45]. Uto
et al. [
64] developed a hyperspectral sensor system based on the Mini-Spectrometer C10988MA (256 bands, spectral range 340–763 nm, spectral resolution 14 nm, 400 g). Burkart
et al. [
93] developed a hyperspectral measurement system in the visible to near infrared range based on the Ocean Optics STS microspectrometer (1024 bands, spectral range 350–800 nm, 3 nm FWHM, 216 g).
Finally, thermal imaging sensors, used for temperature measurement, capture data in the 8 to 15
µm spectral range. Examples of thermal cameras documented in the reviewed experiments are Thermoteknix MIRICLE 307 (spectral range 8–12
µm, 640
× 480 pixel resolution, 200 g) [
44], NEC F30IS (spectral range 8–13
µm, 160
× 120 pixel resolution, 300 g) [
55], FLIR Thermovision A40M (spectral range 7.5–13
µm, 320
× 240 pixel resolution, 1.7 kg) [
46,
51], and Xenics Gobi384 (spectral range 8–14
µm, 384
× 288 pixel resolution, 500 g) [
50].
A completely different type of payload is the spore-sampling devices used by Techy
et al. [
29] for aerobiological sampling missions. The spore-sampling devices consist of circular petri plates that can be opened and closed like a clam shell while the UAV is in flight. After the flight, the plates are transferred to the laboratory to detect, monitor, and forecast the spread of high risk plant pathogens above agricultural fields.
7. Aerial Platforms and Flight Characteristics
A UAV is an aircraft, so it shares the same features of the design and development process of full-scale aircraft. The principal differences are the necessity of a ground station, communication link with the airframe and lack of regulation. From the user’s perspective, UAV can be flown at lower altitudes, which can be considered dangerous for non-remotely piloted aircraft and with lower cost. The lower altitudes permit higher resolutions of the sensor information, and the lower cost permits a higher frequency of flights and improved temporal resolutions.
The aerial platforms used in the experimental flights under review are almost half fixed-wing and half rotorcraft, with a scarce 10% of the experiments using gliders or kites as a test platform. The mentioned fixed-wing platform names are AggieAir [
43], APV-3 [
49], Carolo P330 [
73], J3 Cub [
25], L’Avion Jaune [
22], MLB Bat 3 [
35], Pathfinder [
53], Quantalab [
45], and Vector-P [
60]. Rotorcraft frame list is even longer: Camcopter [
72], Align Trex 500 [
42], AscTecFalcon-8 [
93], Hexa XL [
59], MD4-1000 [
64], Microdrones md4-200 [
72], Mikado Logo 600 [
57], Mikrokopter [
50], NUS
QuadLion [
27], Oktokopter MK-Okto [
55], Parrot ARDrone [
24], Quanta-H [
94], Rotomotion [
72], TerraLuna OktoKopter [
28], Vario [
46] and WeControl AG [
54]. Certain works use more than one platform of the same type [
27,
29,
44,
54,
59,
72], and others use platforms of different types [
22,
73,
94]; certain platforms are used for collaboration, but most of the platforms are compared to test their responses and approaches.
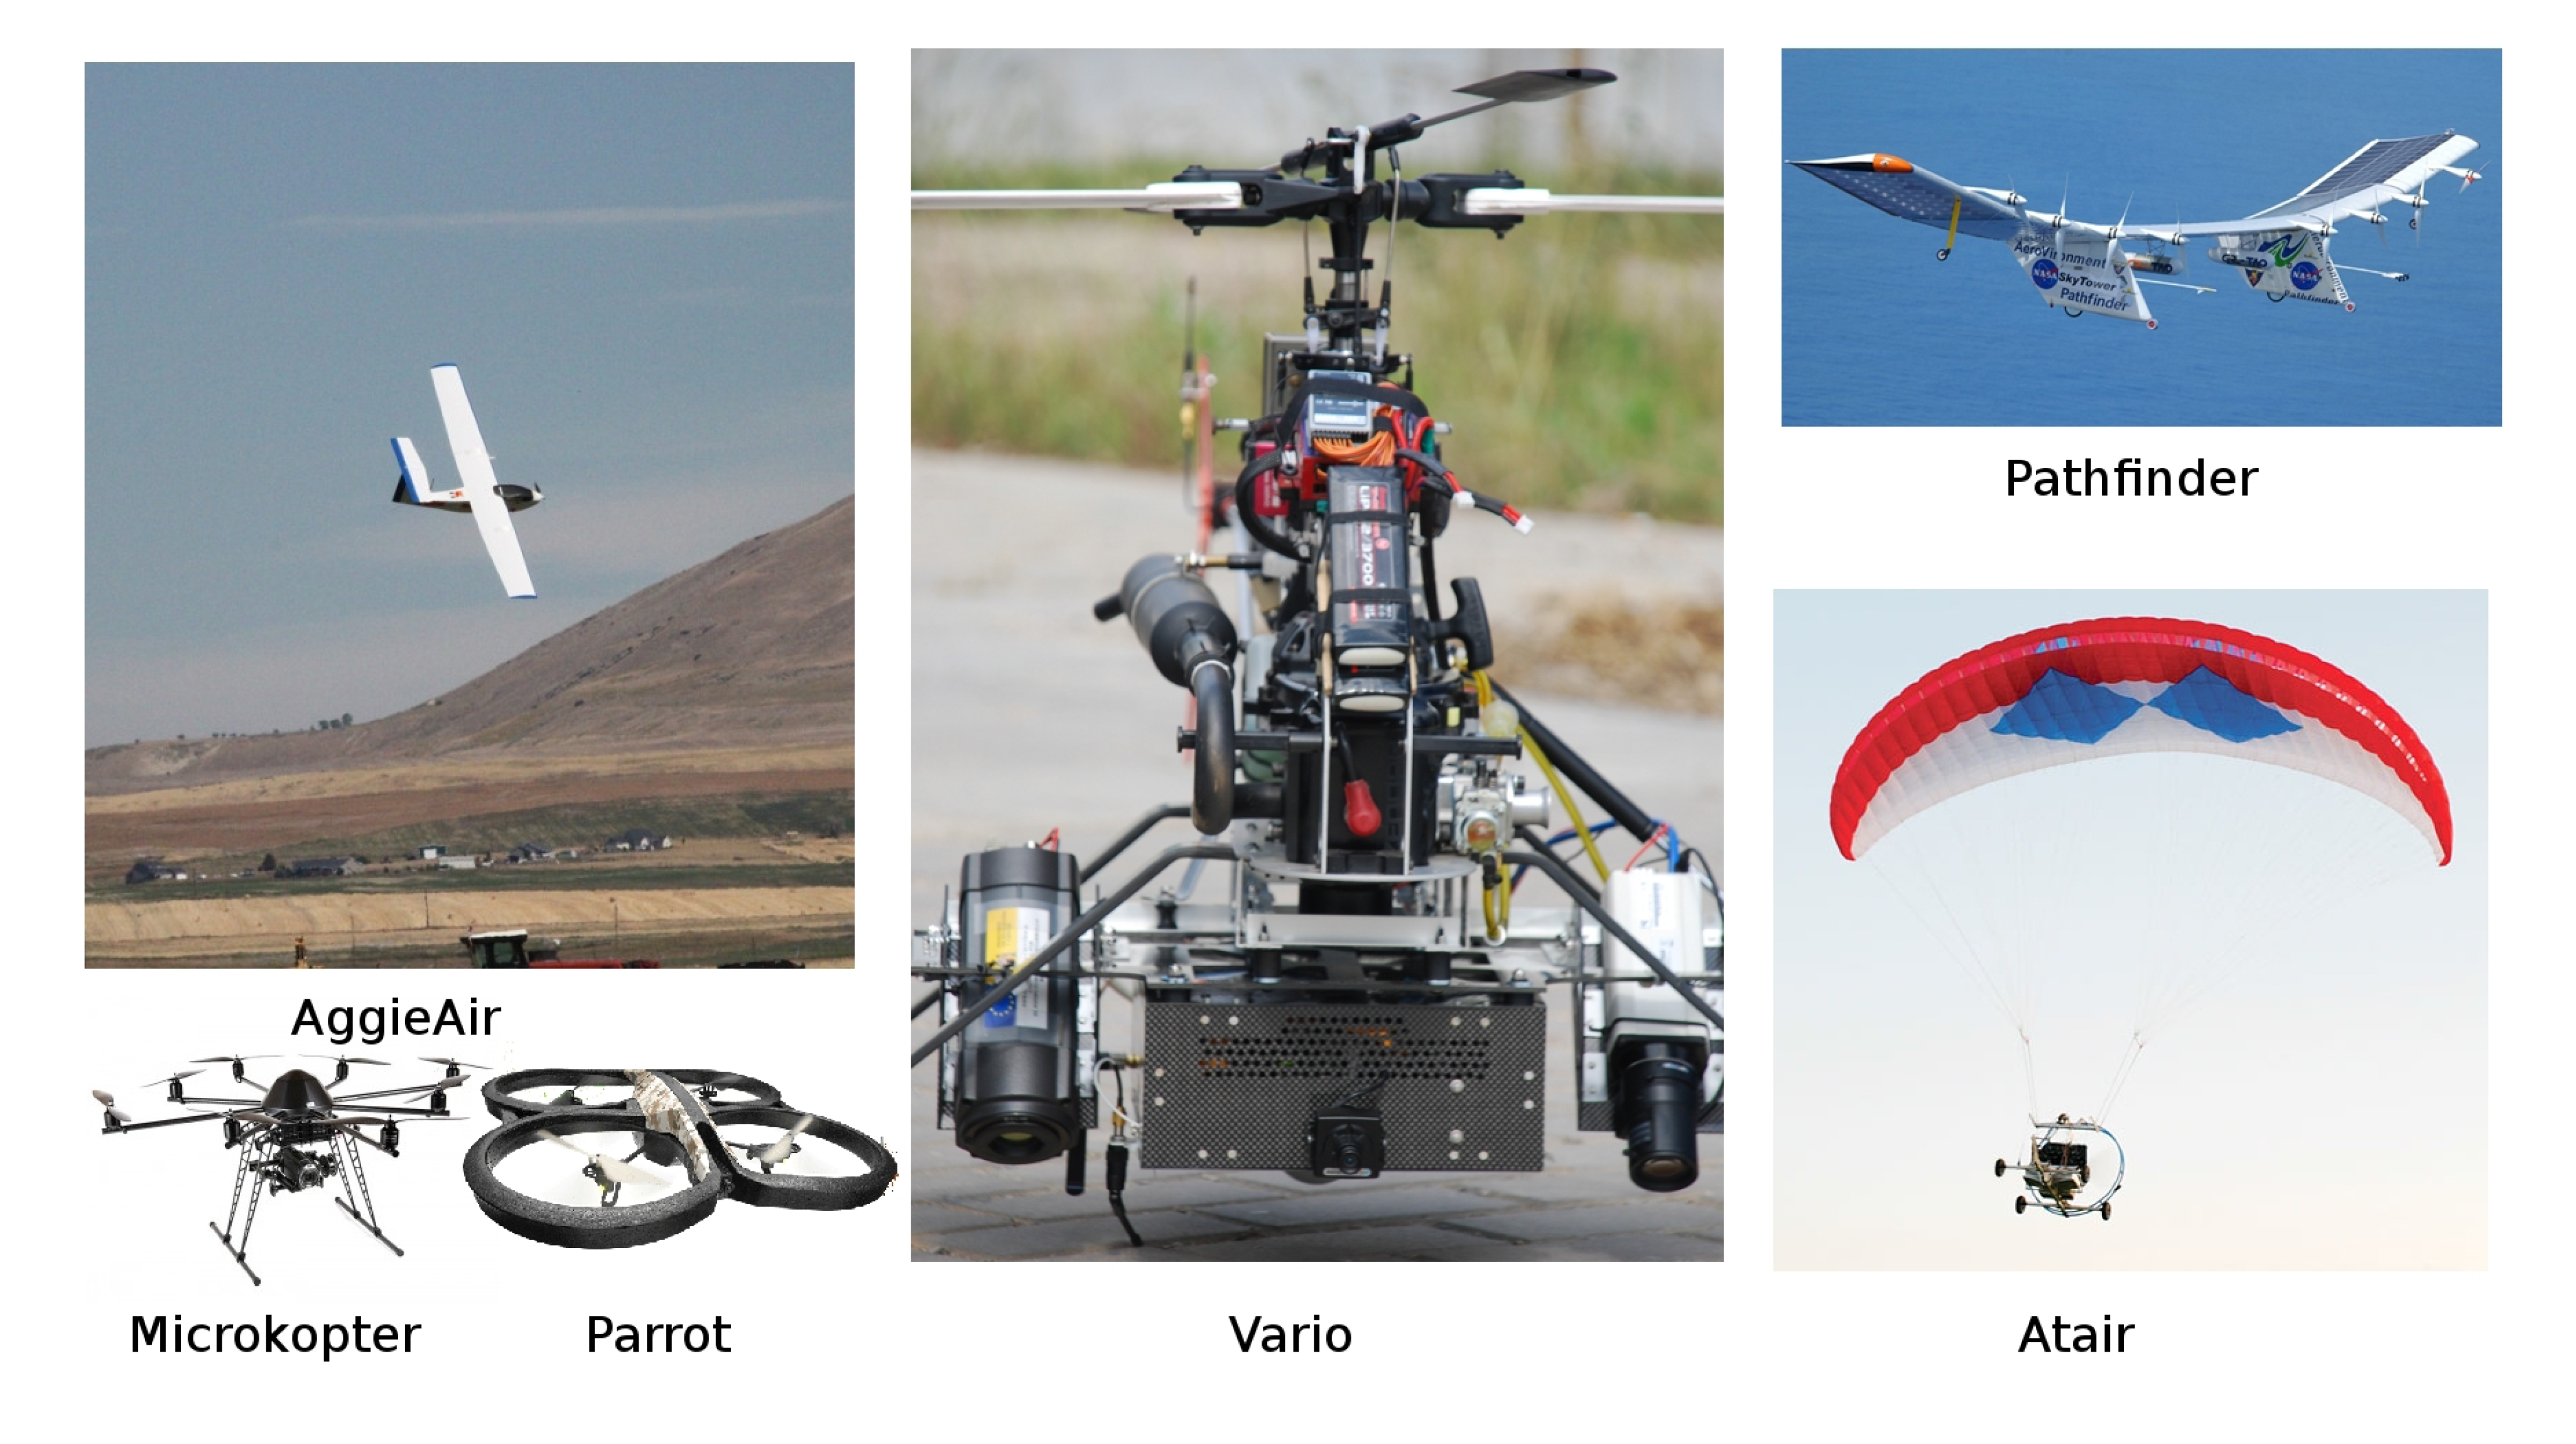
Figure 6 shows some examples.
Figure 6.
Different UAV platforms used in vegetation remote sensing.
Figure 6.
Different UAV platforms used in vegetation remote sensing.
The sizes are generally small (23 mini/micro and 18 nano UAV), but there is also documentation of a 36.3 meter wingspan aircraft [
53]; it is a solar-powered AeroVironment Pathfinder used to analyze the ripeness of coffee plants in Hawaii. The smallest documented size is a Parrot quad-rotor at 30
× 30 centimeters, which is used to navigate a forest in Australia [
24] by using two visual cameras. In general, fixed-wing aircraft are larger than rotorcraft aircraft, with the former within 2–5 m and the later between 1–3 m. For rotorcraft UAV, helicopters are closer to 3 m, whereas multi-copters with 4-6-8 rotors are in the smaller size category. Certain platforms are self-designed, but most (90%) are commercial off-the-shelf UAVs and aeromodels adapted to hold the payload.
The number of autopilots being documented is also very extense: AP04 [
44,
46,
51], Ardupilot AHRS [
58], DJI ACE Waipoint [
57], Mavionics [
73], Microdrones [
64], Micropilot [
60], Mikrokopter [
39,
50,
59], Paparazzi [
43], Rotomotion AFCS [
65] and WePilot1000 [
54]. In a small number of works (8%) the autopilot is self-designed. There is a high correlation for rotorcraft with the use of autopilots; this correlation is not found for fixed-wing platforms. The reason is most likely the complexity of manually flying a rotorcraft, especially helicopters. Most gliders, paragliders, and kites, use radio control manual piloting [
11,
22,
48,
73]. It is worth mentioning here the Tetracam Hawkeye Parafoil-based UAV [
95], able to carry any of Tetracam’s multispectral imaging systems. The Hawkeye can be flown either manually via by radio control, or flying a pre-programmed mission via its Goose autopilot. A clear benefit of platforms with an autopilot is that the experiment obtains more detailed location data, such as the altitude above ground. For an accurate location, the most frequently used combination is boarding a GPS receiver and adding ground control points on the ground. The use of an autopilot also allows for sophisticated flight plans that are especially suitable for area monitoring, which is necessary in many vegetation mapping applications. Linear, square, circular and rectangular flight plans are simple examples. Other generic forms such as trochoidal, L-form or looped are generated using the waypoint navigation available in most autopilots. However, scans of areas following parallel transects, even in perpendicular directions, are the most used flight patterns [
28,
54,
57,
60,
64,
73]. The size of the areas monitored by the UAV flights are generally within 1–10 ha. The largest area is 7000 ha [
43] as a result of the high altitude platform used (AggieAir).
The payload capacity and flight autonomy of the platform are usually a trade-off decision: additional payload is usually possible if less fuel is used. However, both are directly related to the size of the aircraft. Mini/micro UAV hold payloads from 1 kg to 30 kg with a median value of 5 kg. The nano UAV have a reduced payload capacity (in the range of hundreds of grams), but this payload is sufficient to board commercial off-the-shelf cameras. The flight time ranges from 12 hours for a Pathfinder to 5 minutes for the TerraLuna Oktokopter, which shows a direct relation to the size of the platform. The most frequent values in monitoring vegetation works is in the half-hour to one-hour range.
8. Discussion
The extensive list of papers documenting remote sensing flights using UAVs shows the capabilities of these aerial vehicles to be used as a complement, or even as substitute, of satellites and full-scale aircraft. While these pre-existing platforms and their attached sensors have been performing remote sensing flights in the last decades, UAVs are showing advantages on the temporal and spatial resolution of the imagery. By flying over the area of interest more frequently and at lower altitudes, unmanned aircraft appear to provide a good remote sensing tool at low-cost. UAVs arise at the perfect moment to profit from the current knowledge of the properties of the light reflectance and emittance, from the state-of-the-art on methods of calculation and interpretation of vegetation indices, and from the capacity of electronics to miniaturize in size and price. On the negative side, the extremely diverse alternatives of the experiments show a lack of standardization at all levels, from sensors, vegetation indices, operational methods, UAV sizes and models, and automation of pilot capabilities.
The high-intensive high-value crops are the main target for the use of UAVs because they provide a good return of investment. The majority of flights (two thirds of the works) are given for this type of vegetation. The use of UAVs over crops is also explained by the ease of operation, well delimited area of study, low heterogeneity, familiar characterization, and productivity interests. Vineyards are probably the best example. The quality (and price) of the grapes is very dependent on the time for the harvest, temperature, water stress or infestations. As a second target, cereals fields, such as corn and wheat, are also common in UAVs remote sensing works. The third type of vegetation in number of experiments are the fruit trees. In contrast, although more than half of the earth’s land surface are different forms of rangeland, only the 20% of documented flights focus on these areas. Six papers disseminate UAVs flights over closest forest. They present vegetation mapping results used in scientific and ecological studies, in which the short term economical benefits are not always given. The only three papers using LiDAR on their UAVs are also applied to forest.
About two thirds of the revised papers are classified in our taxonomy as proactive applications, since the captured information is used to trigger future actions over the vegetation, being the water stress and nitrogen level estimation the most common. This fact correlates directly with the type of vegetation of the majority of the papers: crops. The remaining one third of the papers documents mainly passive applications. They used the UAV to collect data for mapping or inventory purposes. Only two papers report reactive applications: both use the UAV for spraying chemicals but only one is able to decide the route using ground sensors input. In general, we observe that most works just replicate the applications previously done by conventional aircraft to prove the capabilities of UAVs for remote sensing. In a near future, we expect to see more advanced robotics systems on board, providing automatic/autonomous behavior to the UAVs and their payload, and working on reactive applications as a high-efficient and cost-effective tool for precision agriculture.
Typically, the UAV payload produces as final result a NDVI map, which is recognized as a good estimator of the biomass of the vegetation and for long-term water stress assessment. The map is a large mosaic image constructed by stitching images together. The images contain spectral information, mainly the NDVI or other derived vegetation indices. The near-infrared channel wavelengths are the most basic input to obtain them (20 times). Six works demonstrate that commercial off-the-shelf cameras can be rapidly transformed to obtain the near-infrared band. After validating aerial results against ground-measured biophysical parameters, a precision of 15% demonstrate the goodness of such estimations. In addition, sensor calibration and noise reduction are shown to be of as much importance as the identification of the spectral signatures of the vegetation. The low cost of these sensors allows also to have duplicated cameras and to increase the output products. Few works rely on thermal sensors, almost 2-order of magnitude more expensive than commercial cameras. Thermal bands are basically used for water stress detection, but similar or even better results [
51] are obtained from the combination of near-infrared and visual bands. On the other side, water stress indices have been also obtained using only visual bands. From the authors perspective, the rapid evolution of software (image processing, statistical analysis, data fusion,
etc.) and the high-quality of commercial cameras will define the remote sensing done with UAVs. The main reason are the expected short-term economical benefits. We think that expensive sensors, such as thermal cameras, LiDAR or multi/hyper-spectrometers, are going to be used only in scientific and research works. For this specific type of applications, sophisticated algorithms such as object-based segmentation or 3D reconstruction, are being developed. Special attention must be given to the combination of the flight data (such as inertial and positioning information) with the payload to increase the quality and accuracy of the output.
UAVs platforms are diverse, almost half being fixed-wing and the other half rotorcraft. Only two papers present long-endurance (8–12 hours) high-altitude (3–6 thousand meters) experiments with the Path Finder and the RCATS/APV-3 sensing huge areas of vegetation. For the rest of the papers, the trend is a cost-effective solution of adapting aeromodels with commercial-off-the-shelf autopilots. In general, small UAVs have low autonomy and flight for short periods (from 5 minutes to half an hour) and at low altitude (5–30 m). Larger platforms have more endurance (1–3 hours) and higher altitudes (100–200 m). The extension of the covered areas oscillates from tens to some hundreds of hectares in size.
In the future, we believe that the use of UAVs will extend globally to non-urban areas. The ground control points currently used for improving geolocation mapping will be a network of sensors spread over fields and collaborating with remote sensing tasks. While today the processing of data acquired by the UAV is usually performed offline, in the future online data processing and intercommunication functionality will provide aerial works with the ability to further extend from current mapping and modeling applications to more intelligent application activities. The current concept of precision agriculture will shift to smart farming, incorporating mapping, monitoring and scouting applications, and to be able to apply these abilities with a high level of autonomy. Future ecological crops will require less water waste and minimal application of fertilizers, and will provide quality products. Frequent enough, periodicity of remote sensing flights (monitoring application) will improve to the knowledge and development of sensing models and efficiency of online decision-making processes. Certain gaps must still be filled, such as that of standardization, UAV flight reliability, increased levels of data fusion (including external sensors and additional vehicles), higher levels of automation, potential sense and avoid requirements for small UAVs, human-UAV interfaces, etc. We propose to follow the 5-categories taxonomy, adapted from Zecha’s taxonomy, to obtain a holistic approach able to fill all these gaps and be able to use robotics aerial platforms in vegetation monitoring. The current costs of UAV sensing platforms and complexity of their use suggest remote-sensing businesses opportunities that might provide pay-per-use services for smart farming based on timeliness and frequency, which would require up-to-date interpreted maps with a regular delivery frequency.


