Supporting Urban Energy Efficiency with Volunteered Roof Information and the Google Maps API


Abstract
: The Heat Energy Assessment Technologies (HEAT) project uses high-resolution airborne thermal imagery, Geographic Object-Based Image Analysis (GEOBIA), and a Geoweb environment to allow the residents of Calgary, Alberta, Canada to visualize the amount and location of waste heat leaving their houses, communities, and the city. To ensure the accuracy of these measures, the correct emissivity of roof materials needs to be known. However, roof material information is not readily available in the Canadian public domain. To overcome this challenge, a unique Volunteered Geographic Information (VGI) application was developed using Google Street View that engages citizens to classify the roof materials of single dwelling residences in a simple and intuitive manner. Since data credibility, quality, and accuracy are major concerns when using VGI, a private Multiple Listing Services (MLS) dataset was used for cross-verification. From May–November 2013, 1244 volunteers from 85 cities and 14 countries classified 1815 roofs in the study area. Results show (I) a 72% match between the VGI and MLS data; and (II) in the majority of cases, roofs with greater than, or equal to five contributions have the same material defined in both datasets. Additionally, this research meets new challenges to the GEOBIA community to incorporate existing GIS vector data within an object-based workflow and engages the public to provide volunteered information for urban objects from which new geo-intelligence is created in support of urban energy efficiency.1. Introduction
Canada produces large quantities of energy for both domestic and international markets due to its diverse portfolio of natural resources. It is also an energy intensive nation given its cold climate, massive territory, increasing population, and high standard of living [1]. Various air pollutants and greenhouse gas (GHG) emissions are by-products of its energy production (and subsequent consumption) that negatively influence humans and their surrounding environment [2]. Thus, the Canadian government has set goals to develop a low-carbon economy that is focused on reducing energy consumption and related GHG emissions [3]. Additionally, 63% of Canada’s residential energy use results from space heating [4]. Supported by the City Sustainability Direction [5], Calgary Climate Change Accord [6], and Calgary Community GHG Reduction Plan [7], the City of Calgary is seeking to implement energy initiatives with similar goals that are cost-effective, actionable, and reach a wide city audience. This presents new opportunities for further exploration in the domain of urban energy efficiency.
One such opportunity is the Heat Energy Assessment Technologies (HEAT) project from the University of Calgary that allows anyone with Internet access to visualize the amount and location of waste heat leaving 37,914 single dwelling residences in Calgary, Alberta, Canada [8,9]. Using innovative Geographic Object-Based Image Analysis (GEOBIA) techniques [10,11], GIS cadastral and airborne Thermal Infrared (TIR) data [12], the HEAT project provides Calgarians with location-specific waste heat information about their homes and communities [8]. Specifically, there are three energy efficiency solutions targeted at citizens that are geographically linked to each house:
- (1)
A HEAT Score—A comparative waste heat metric created for every house and community that ranges from 1 (low waste heat) to 100 (high waste heat) [13].
- (2)
The locations of 12 Hot Spots (shown three at a time)—these indicate the hottest waste heat locations in and around the building envelope.
- (3)
Yearly estimates of potential energy Savings (both financial and environmental)—based on fuel types used for space and water heating.
These three energy efficiency solutions are packaged within a Geoweb environment, which allows dissemination of geospatial information (i.e., location-specific waste heat maps) to the end user through the World Wide Web [14]. The HEAT project provides an interactive user experience including multi-scale waste heat maps and GHG information at the house, community, and city levels along with recommendations for energy efficiency improvements. Most importantly, as these feedback solutions are derived from high-resolution TIR imagery, a critical element in their generation is their reliance on correct emissivity values. Emissivity (ɛ) is an object-specific thermal characteristic that is defined as “a ratio between the actual radiance emitted by a material (Mr) and a blackbody (Mb) at the same kinetic temperature” [15], as shown in Equation (1).
Conceptually, emissivity represents how materials absorb and then re-radiate (or emit) TIR radiation. In practice, emissivity values range from 0.00 (e.g., shiny mirror) to 1.00 (e.g., blackbody), where the material absorbs all of the incoming incident TIR radiation [15]. For the HEAT project, the emissivity of roof materials is required to convert relative radiant temperature (Trad) as seen by the airborne TIR sensor into absolute kinetic temperature (Tkin), which represents the true temperature of a roof object [8,15]. This information is then used to accurately generate HEAT Scores [13], Hot Spots, and estimated Savings information. Due to the relationship between radiant and kinetic energy and how emissivity is calculated Equation (2), Table 1 illustrates how a very small change in the emissivity value of different roof materials can result in dramatic variation in Tkin. It is evident from this table that if emissivity values are not correctly accounted for, then Tkin will be underestimated.
By default, the HEAT project assumes that asphalt composes 100% of the roof material in the study area, which is assigned an emissivity value of 0.91 [8]. However, based on more recent real-estate information, this number is actually closer to ∼80% of the roofs in Calgary. As a result, roofs composed of cedar, concrete, metal, and other kinds of materials, have inaccurate Tkin values associated to them, which need to be corrected in order to provide accurate energy efficiency feedback solutions, such as HEAT Scores.
Roofs and their associated materials are known as the gateway to greater damage for homes, as they directly influence the insurance and energy related costs [16]. In Calgary and Canada, there is lack of publically available information that describes roof materials for single dwelling residences. Although some private Multiple Listing Services (MLS) provide this information, they do not make it accessible for third parties to use. Having public access to roof material information for single dwelling residences can act as an additional layer of evidence to benefit (I) local roofing service providers for home renovations; (II) real-estate agents for on-going house sale portfolios; and (III) remote sensing analysts for improving supervised image classifications of impervious surfaces in urban areas by using this information as training/test data.
So, how does one collect roof material information over a large geographic area and for thousands of houses? A potential solution is to develop and implement an application to collect Volunteered Geographic Information (VGI). This application will enable citizens with little, or no formal qualifications to actively engage in creating volunteered geographic content that can be consumed for multiple purposes [17]. In this research, volunteers will be able to use the HEAT VGI application to classify the roof materials for individual Calgary houses. Thus, roofs are the geo-objects [18] under investigation in this research. Geo-objects are recognizable entities in an image that have been computationally delineated and which meaningfully model a geographic referent (e.g., the GIS polygons of urban rooftops derived from a high-resolution aerial imagery).
1.1. Geographic Object-Based Image Analysis (GEOBIA)
In a recent keynote presentation to the GEOBIA community, Hay [19] proposed a new definition of GEOBIA as “a sub-discipline of Geo-informatics focused on (I) developing automated methods to extract meaningful image-object attributes from remote sensing imagery; (II) assessing their multi-scale characteristics through time and space; (III) and generating new geo-intelligence [20] (i.e., geospatial content “in context”) from these and related multi-source datasets” Hay further challenged the GEOBIA community to incorporate existing GIS vector objects within the GEOBIA workflow [21] rather than focusing (almost exclusively) on segmentation methods that have no unique solution [18]. In this paper, we report on new HEAT VGI research that meets these challenges and takes them a step further by engaging the public to provide volunteered information based on unique urban geo-objects.
1.2. The Benefits of Volunteer Participation
The latest technological advancements from the Web 2.0 era [22] have led to a new case of user-generated content known as Volunteered Geographic Information (VGI) [17]. It presents numerous opportunities for collaboration between geospatial researchers and volunteers through interactivity that encourages a bi-directional flow of knowledge. Rather than relying on a closed team to solve complex problems, or collect geospatial data over time and space, researchers can create an open-ended application that invites volunteers to participate from around the world. Additionally, researchers can use these applications to engage and initiate conversation among local populations on issues that they may not be aware of such as wildlife preservation, mapping invasive species, and monitoring radiation levels and air quality [23]. Previous literature has already demonstrated that the involvement of volunteers can be highly beneficial for multiple reasons. For example, according to the UK Environmental Observation Framework, volunteers have proven to provide information that has “high value to research, policy, and practice” [24].
Volunteer participation in research and academia has had an impressive history. While their involvement formally began in 1900 with the Christmas Bird Count Project (Christmas Bird Count by the National Audubon Society— www.birds.audubon.org/christmas-bird-count) [17], volunteers are now engaged worldwide in many scientific endeavors and community-based initiatives such as OpenStreetMap (OpenStreetMap: A free and editable map of the world created by volunteers— www.openstreetmap.org) (OSM), Ushahidi (Ushahidi: Crowdsourcing disaster relief through multiple platforms: web, Twitter, and SMS— www.ushahidi.com), the Early Detection and Distribution Mapping System (Early Detection and Distribution Mapping System—Mapping invasive species: www.eddmaps.org) (EDDMapS), and Project Noah (Project Noah: Volunteers documenting wildlife sightings— www.projectnoah.org). While these examples range from GIS to ecological conservation, volunteers have also been used in remote sensing. For example, Clark and Aide [25] demonstrated this through their implementation of the Virtual Interpretation of Earth Web-Interface Tool (VIEW-IT). Its primary objective was to improve the accuracy of reference samples through cross-verification of volunteer and expert interpretation [25]. By combining these two approaches, they were able to successfully solve issues relating to land change. Similarly, the Geo-Wiki Project (Geo-Wiki Project: Improving the quality of global land cover maps with volunteers— www.geo-wiki.org) uses volunteers to improve the classification quality of remotely sensed global land cover maps. More recently, Tomnod (Tomnod: Crowdsourcing to identify objects and places in satellite images— www.tomnod.com) uses the power of volunteers to identify objects and places in detailed satellite images. Applications range from search and rescue of lost planes and ships to natural disaster mapping including many more. Each of these examples favorably illustrates the benefits of engaging volunteers with remote sensing imagery.
However, before developing an application to collect VGI, volunteer requirements need to be well understood to ensure volunteer satisfaction, motivation, and future retention. Attracting and retaining volunteers is vital to a VGI application’s lifecycle. Fortunately, the ability to grow volunteer subscribership can be dealt with by understanding their needs and wants. Thus, it is imperative to keep these concepts in mind during each development phase of a VGI application.
1.3. Volunteer Requirements
Engaging volunteers in scientific research can be challenging for many reasons. Not only must the process of volunteering geographic content be streamlined, but it should also be easy to use so that the volunteers are satisfied with the overall experience. Recent HEAT user surveys show that participants want to be engaged via multiple means. For example, many novice and first-time volunteers require background information about the research, or guidelines, such as How It Works or Why It Matters. EDDMapS and Common Sense (Common Sense: Mobile technologies that help communities gather environmental data— www.communitysensing.org) are good examples of how these guidelines, and other relevant information can be effectively communicated with volunteers. This step is particularly important because volunteers originate from different regions around the world with broadly varying life experiences. As a result, such guidelines act as a mutual contract between researchers and volunteers; and represent one part of the contract. It is the responsibility of the volunteer to fulfill the other half by contributing high quality data. Additionally, volunteers can be further kept engaged through data entry and manipulation, data download, technical support, interactivity, discussion boards, and feedback mechanisms [26]. Continual feedback is a key factor, as volunteers want to provide feedback through anonymous surveys, and receive feedback in return—some of which could be in the form of a digital currency. Thus, research has to come full circle by providing updates back to volunteers [23,27].
As VGI applications become prominent, more attention is being directed towards their usability. In particular, volunteers emphasize simplicity (i.e., ease of use) the most out of all the previously mentioned volunteer requirements [26]. As such, an effective user interface (UI)—which is usually the first element observed by volunteers and used for contributing the required information—is fundamental to the contribution process. If it is not simple to use, it will not attract, or retain volunteers. Thus, usability directly affects the overall success of the related research [26]. In addition, ease of use also influences data credibility, quality, and accuracy, which are the major concerns with VGI and should be seriously considered early in the research design process.
1.4. Researcher Considerations
When using VGI, researchers must also be aware of its limitations. Specifically, volunteer motivation and retention is essential in determining the lifecycle of a VGI application. A common practice to tackle this is through the use of digital rewards, which can be redeemed by volunteers at selected online marketplaces, or partnered retail stores [28]. However, this can introduce several problems for the researcher, as it may sidetrack the volunteer from their assigned task, which is to produce high quality research data. Like many social endeavors, bias and privacy of volunteers are also of concern. Specifically, if volunteers feel that their privacy is not being respected, this can prevent them from contributing data. This may lead to digital divide [17], which not only segregates volunteers due to limited computer literacy or Internet access, but also produces serious gaps in data quality.
Perhaps the most critical limitations of all include data credibility, quality, and accuracy [29,30]. These will always exist due to the demographics, motivations, and capabilities of the volunteers involved. As a result, data accuracy issues need to be carefully reviewed, as data are being collected to ultimately improve scientific understanding. Thus, high quality data and related data standards must take precedence. To tackle the combined issues of data credibility, quality, and accuracy, there is a need to establish appropriate methods to verify VGI. One method is to provide volunteers with guidelines on how to keep data quality at an optimum level [26,31]. If volunteers are guided properly, then the data credibility, quality, and accuracy tend to be of high caliber.
The data contributed by volunteers can also be cross-verified with data collected by a researcher, or (if available) through a dataset from an authoritative organization [32]. Ideally, both data sources should complement one another, as previously described with VIEW-IT [25]. An additional method of controlling data accuracy is to have volunteer contributions thoroughly reviewed by several moderators whom have the authority to correct for potential errors before the information is made public—like in Wikipedia [33]. Additionally, Linus’ Law from the world of computer science (“Given enough eyeballs, all bugs are shallow”) can also be applied by researchers to deal with these limitations [34,35]. For example, GitHub (GitHub: Build software better, together— www.github.com), a popular social coding platform, enables programmers from around the world to collaborate and contribute to a large repository of open-source projects. The more programmers that contribute to an open-source project, the more refined the code becomes, which is supported in their mission, “Build software better, together”. In the VGI case of Linus’ Law, this can be adapted to represent the number of point, line, or polygon contributions received from volunteers for a specific map object. This means, that the more contributions over time, the better the data credibility, quality, and accuracy becomes [35]. While this relationship is not linear, in most cases, five contributions or more can lead to a high quality of data representation for an individual map object [35]. After five contributions, the data quality tends to stabilize and remains unchanged.
1.5. Research Objectives
Based on the discussed literature, the goal of the HEAT VGI application is to focus on both the volunteer’s need for simplicity and on the researcher’s need for data credibility, quality, and accuracy. Therefore, the objectives of this paper are to:
- (1)
Develop a simple and intuitive volunteered geographic information (VGI) application using the Google Maps Application Programming Interface (API) by engaging volunteers to correctly classify the roof materials of individual Calgary houses.
- (2)
Verify the volunteered data for its credibility, quality, and accuracy through the implementation of a cross-verification procedure using a private Multiple Listing Services (MLS) dataset provided by the Calgary Real Estate Board (CREB).
- (3)
Update online maps showing the amount of waste heat leaving individual houses and their associated HEAT Scores based on emissivity values for verified roof materials.
In the following Section 2, we present the methodology used to develop this VGI application, which is further divided into four Sub-Sections: (2.1) study area, (2.2) system architecture, (2.3) optimization, and (2.4) data processing. Then, results obtained from this research, such as volunteer contributions, locations of volunteers, classified roofs, updated HEAT Scores, and research limitations are presented in Sections 3. Finally, we conclude this paper in Section 4 by providing recommendations and improvements for future research.
2. Methods
We note that the design, development, and implementation of the HEAT VGI application are iterative processes, as improvements are consistently made based on feedback from volunteers. These are done to provide the best possible volunteer experience and use of their contributions while ensuring high quality data.
2.1. Study Area and Data
The HEAT Phase II pilot project defines and visualizes ∼90 km2 of waste heat leaving 37,914 single dwelling residences in 29 different communities in Calgary, Alberta, Canada. The polygons of these single dwelling residences were extracted from the GIS cadastral data provided by the City of Calgary. In this research, roofs of single dwelling residences are ideal candidates due to the differences in their materials, which range from vintage types such as cedar and metal to more recent composite materials such as asphalt and concrete.
The TIR dataset used in this study was acquired on 13 May 2012, between 12:00 and 4:30 a.m. (Mountain Standard Time) using the Thermal Airborne Broadband Imager 1800 (TABI-1800) [12]. The TABI-1800’s spectral sensitivity ranges from 3.7 to 4.8 µm. It acquires imagery at a swath width of 1800 pixels with a spatial resolution of 50 cm and spectral resolution of 0.05 °C [22]. Acquiring the TIR dataset between midnight and predawn allows minimal influence from the sun, wind, and other microclimatic factors. Moreover, the environment is in a state of thermal equilibrium during this period. Prior to analysis, the following image pre-processing procedures were applied: (I) Object-Based Mosaicing (OBM) to mosaic around flight line joins [10]; (II) Thermal Urban Road Normalization (TURN) to reduce microclimatic variability within flight lines [11]; and (III) Relative Radiometric Normalization (RRN) to normalize the radiometric properties of multiple flight lines so that the final scene appears as if it were acquired under the same environmental conditions and at the same time [36].
2.2. System Architecture
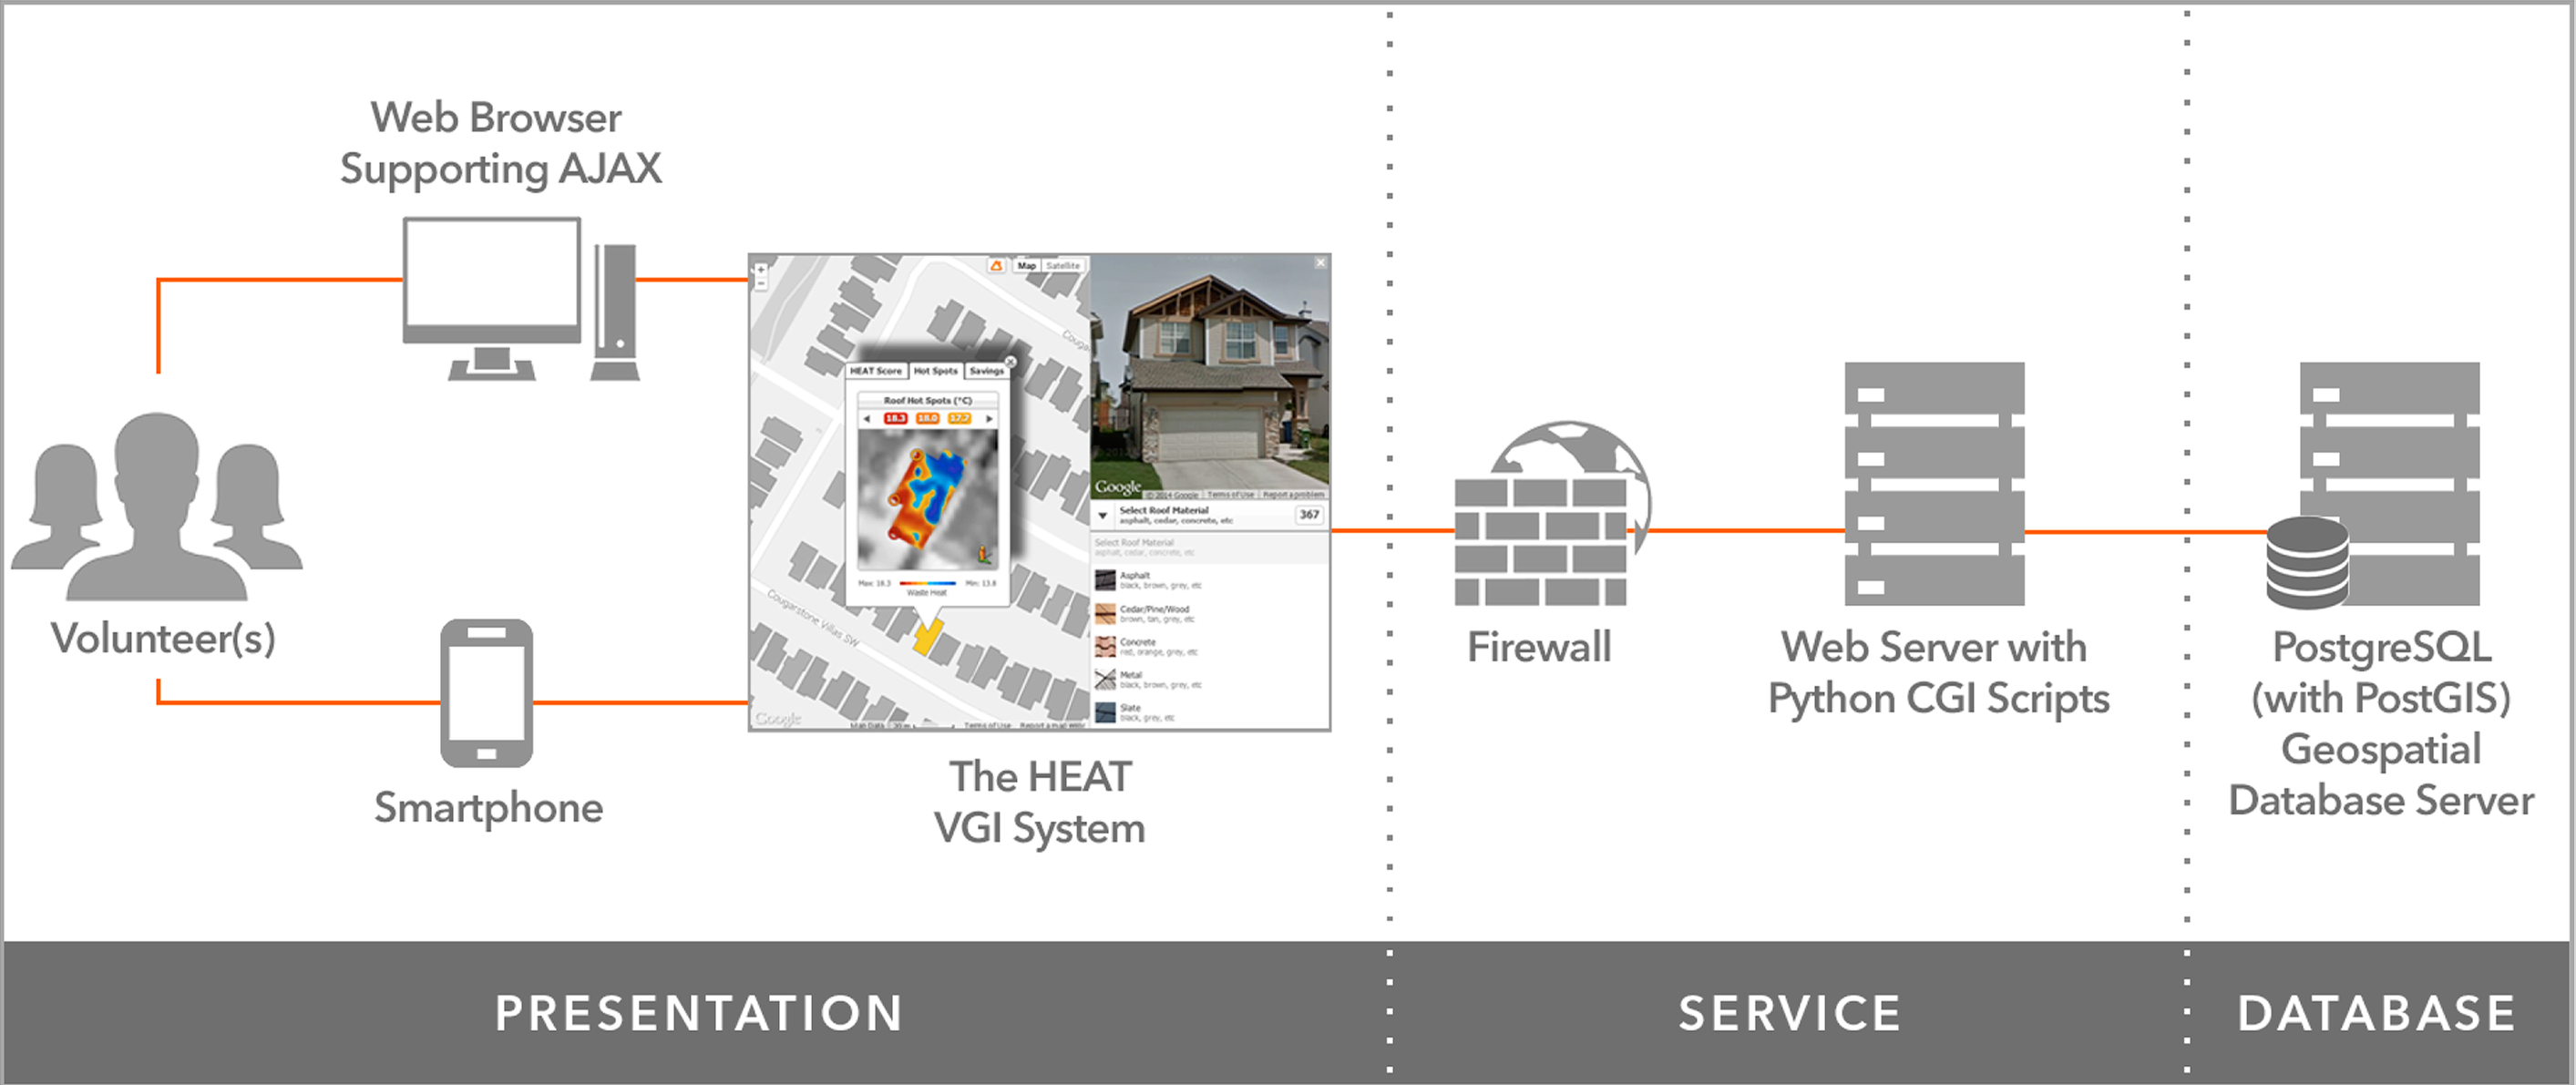
This VGI application was implemented within the existing system architecture of the HEAT project [1]. That is, it adopts the well-known and robust three-tier system architecture that allows developers to create flexible and reusable applications (Figure 1). This architecture uses a deployment technique in which the functionality is separated into three segments and each segment is located on a physically distinct computer. Overall, it consists of a (I) presentation tier; (II) service tier; and (III) database tier.
2.2.1. Presentation Tier
Web and Mapping Technologies
The presentation tier incorporates World Wide Web Consortium (W3C) technologies such as (I) HyperText Markup Language (HTML5), (II) Cascading Style Sheets (CSS3) and (III) JavaScript (JS), in addition to libraries such as (IV) jQuery. MS-Dropdown (MS-Dropdown: add images to dropdown— www.github.com/marghoobsuleman/ms-Dropdown) is also used, as it enables the addition of images in dropdown menus. Though perhaps the most critical component of this tier is the Google Maps API, as it powers this VGI application’s core mapping functionality. The Google Maps API offers numerous customization options for developers. By disabling the majority of the default options, we reduced UI clutter, thus allowing us to add only the minimal map controls for volunteers to navigate in Google’s Street View and Satellite imagery. This enabled volunteers to easily visualize only the necessary details when classifying roof materials. We suggest that the use of Google Street View for classifying roof materials truly makes this VGI application unique. To the best of our knowledge, this has never before been implemented in VGI applications.
User Interface (UI)
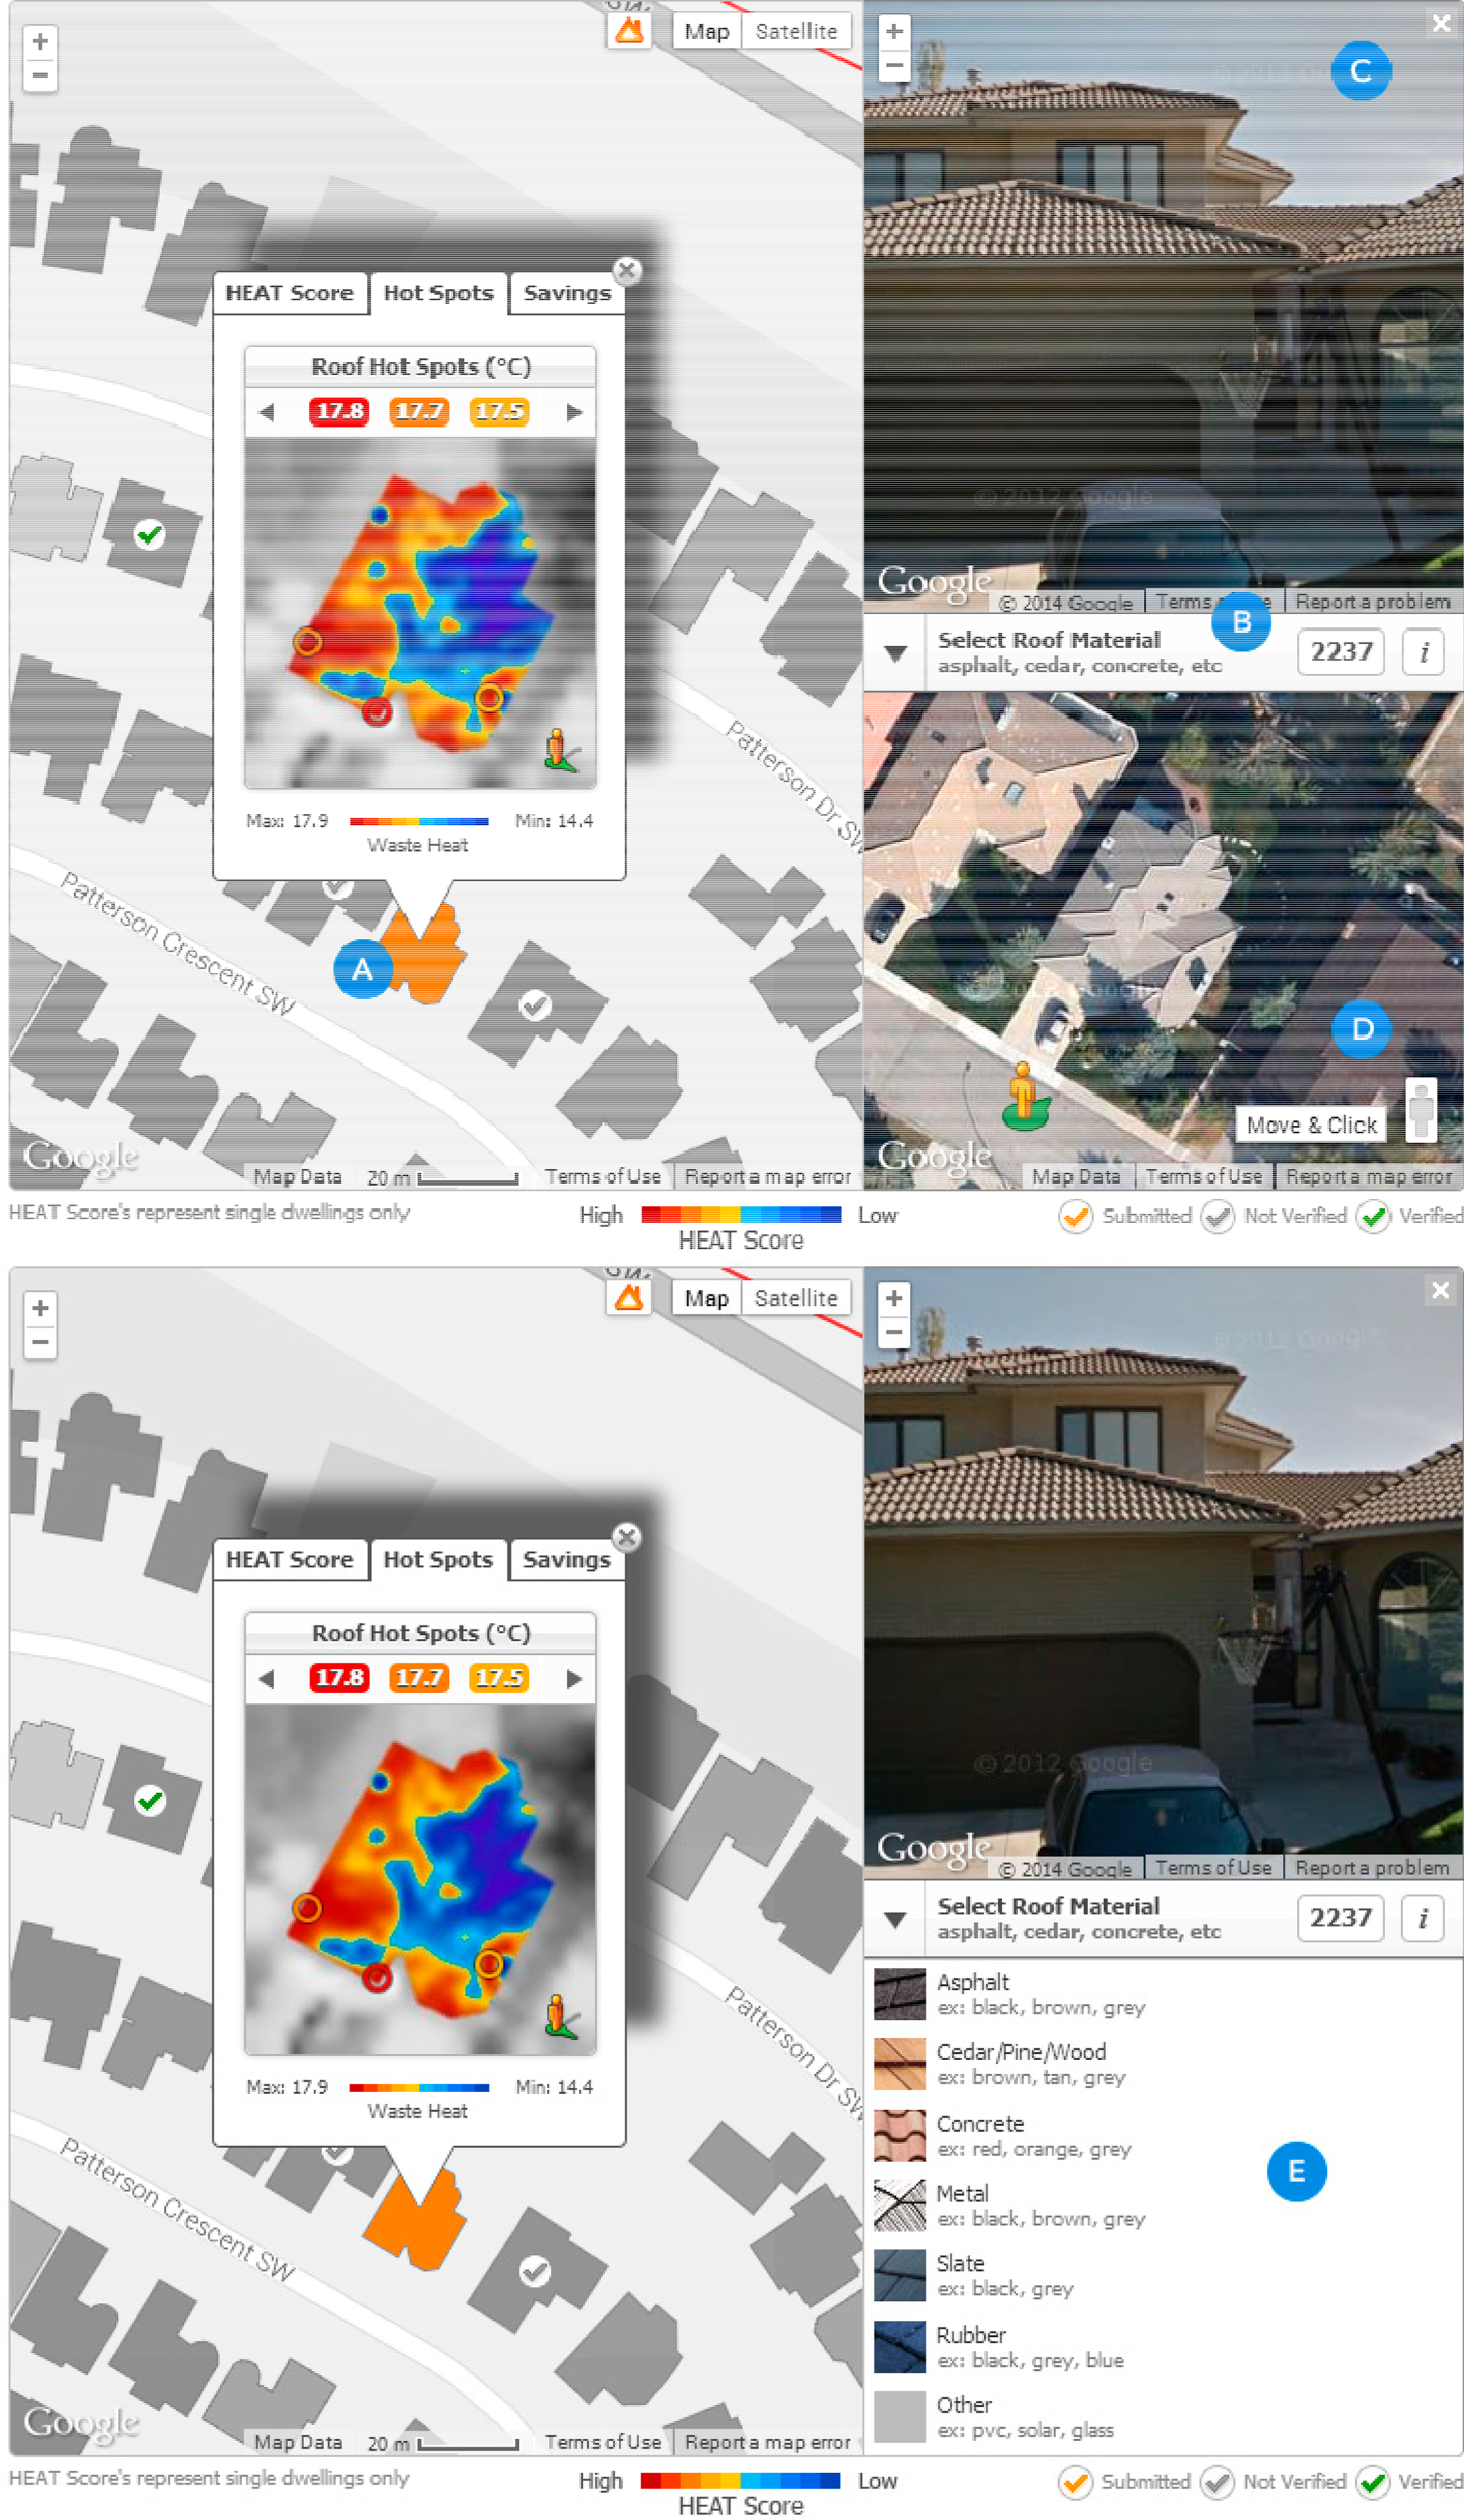
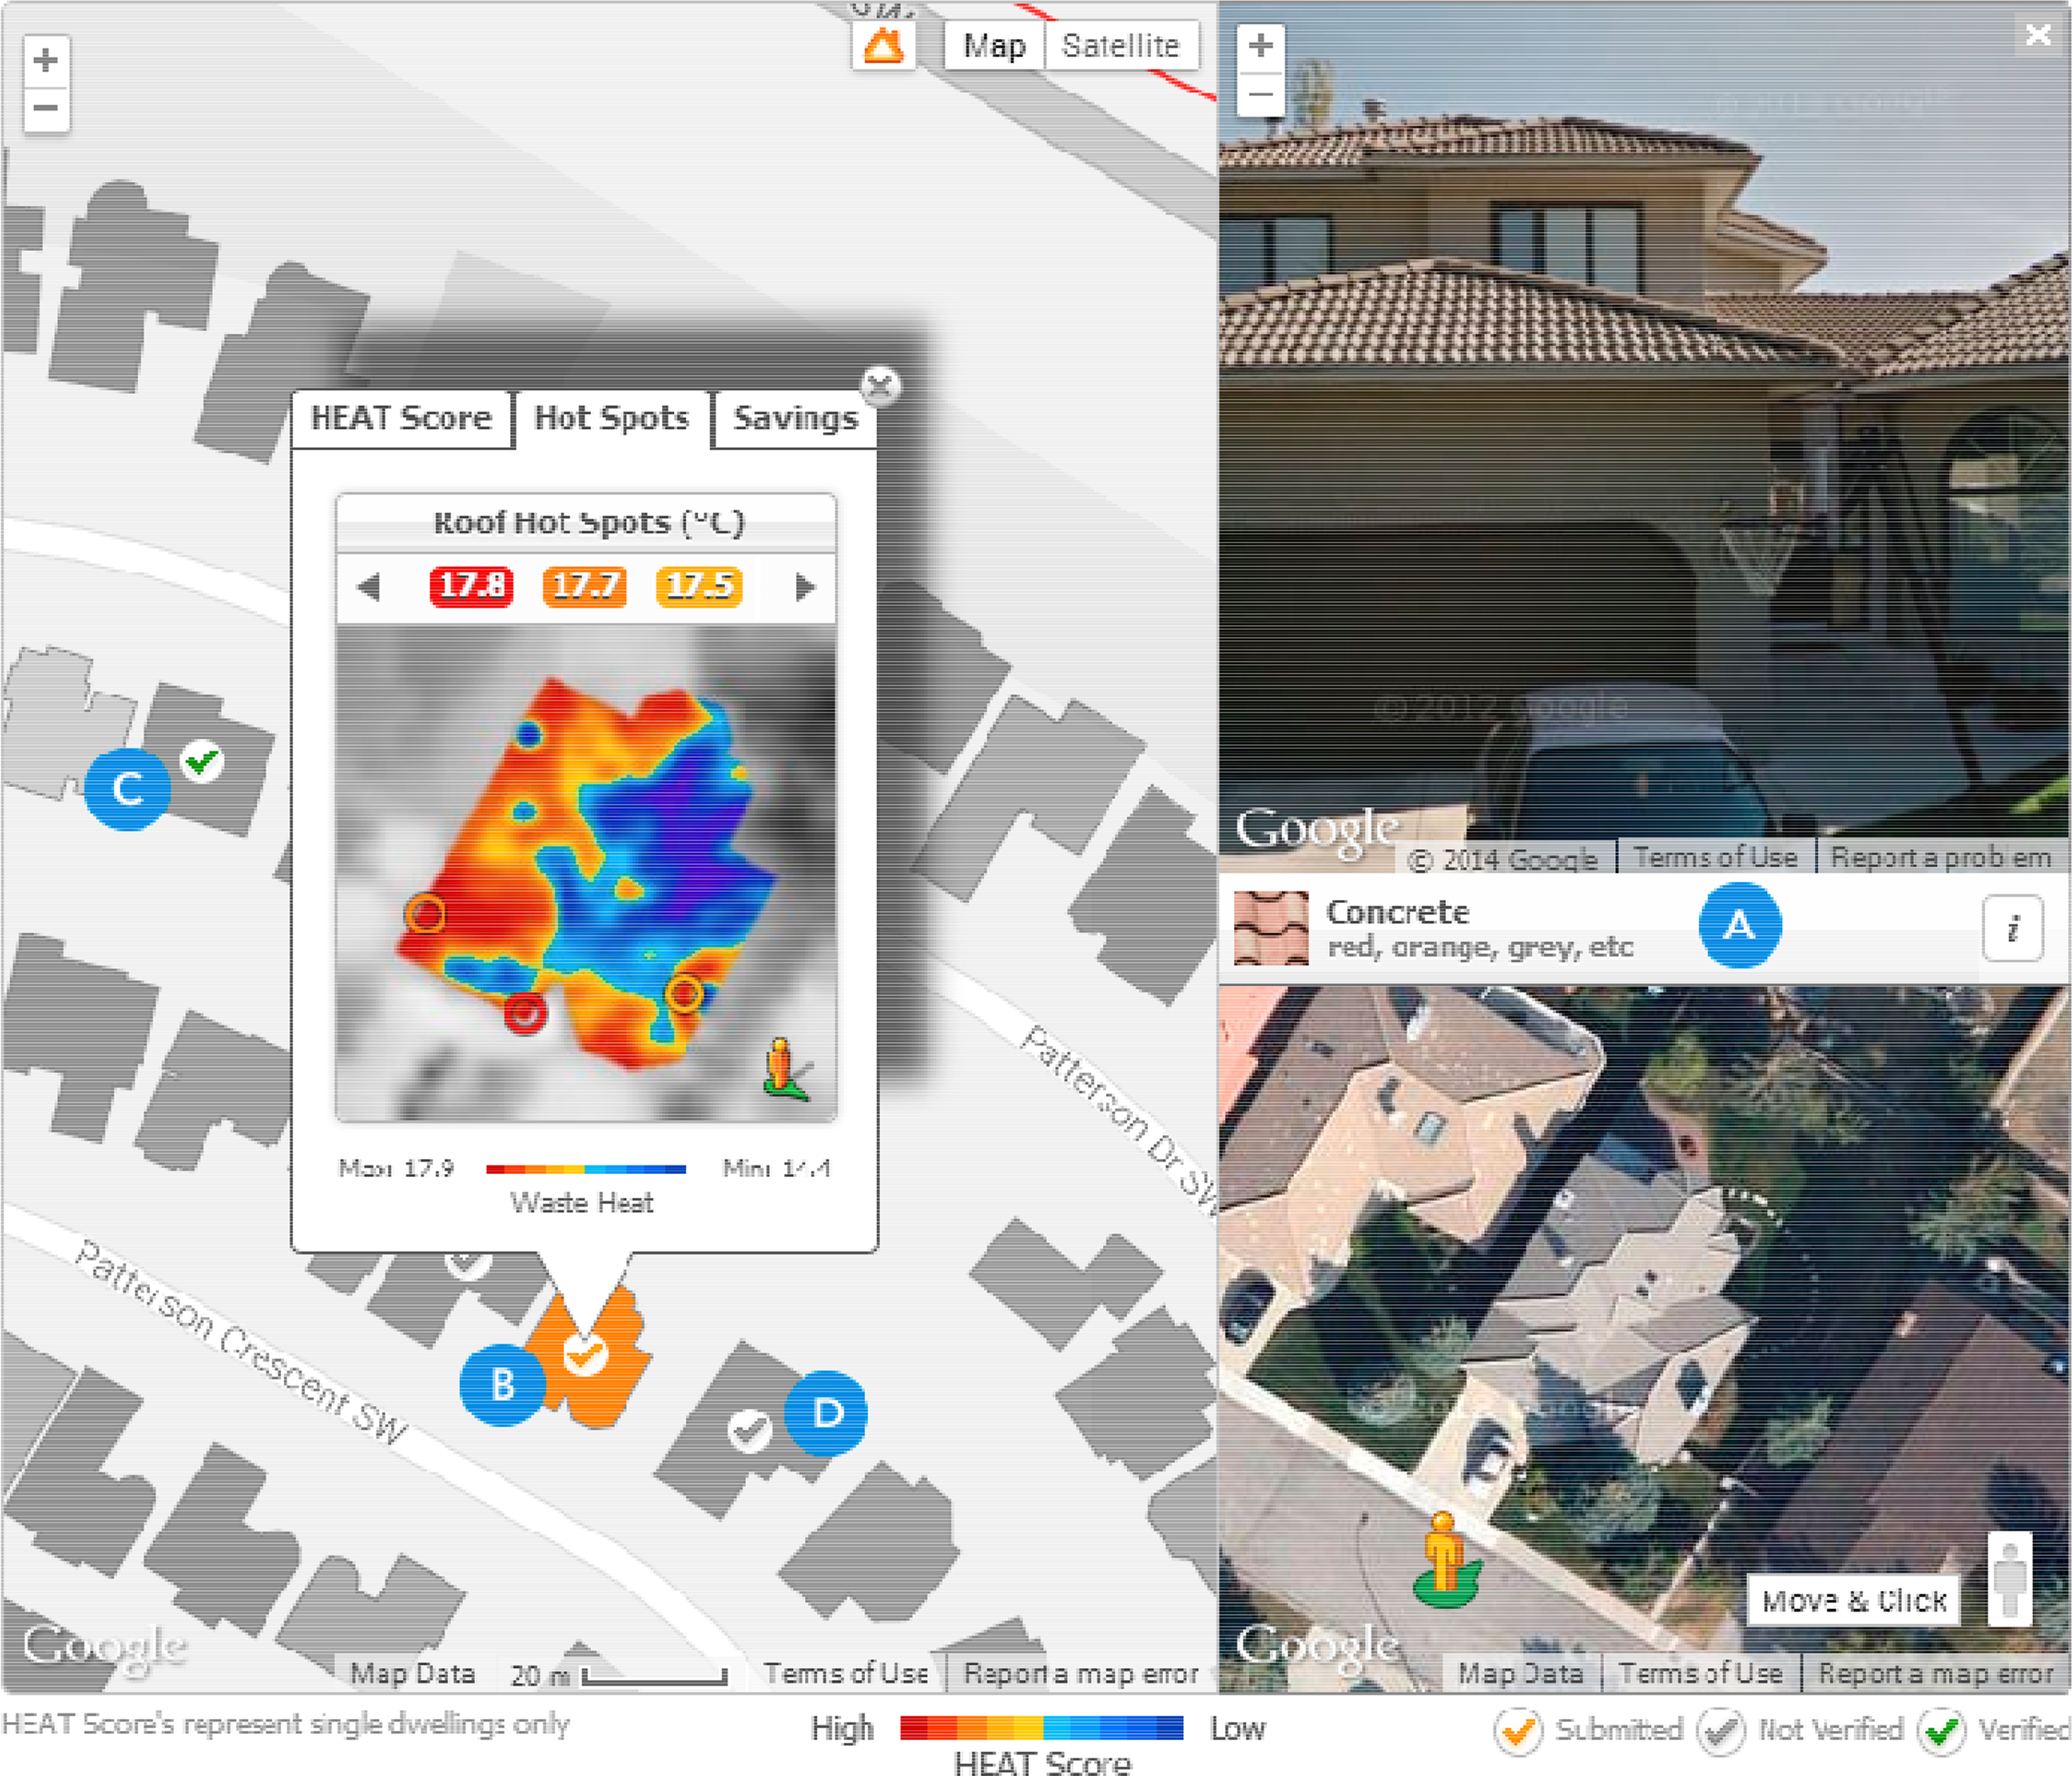
The presentation tier also contains the UI that volunteers interact with during the roof material classification process. Specifically, this dropdown menu layer (Figure 2) is integrated between the Google Street View and Satellite imagery panels, as volunteers rely on these two mapping technologies to investigate and correctly classify the roof material of each house. Once the dropdown menu is clicked, a scrollable list of roof material classes is displayed to the volunteer. Towards the right side, the total number of classified roofs in the study area, and a link to the help file can also be accessed.
It should also be noted that we limit the number of allowable roof material classes for the volunteer. This is a simple, though important technique to control data credibility, quality and accuracy. Furthermore, instead of allowing volunteers to type the roof material, we provide predefined roof material classes. This makes the roof material classification process less prone to volunteer error, and it increases simplicity and utility—thus, supporting a fast and efficient contribution process.
The presentation tier is also responsible for generating a tick mark on the related house polygon once a volunteer has classified the roof material. Upon the first roof material classification, volunteers are displayed an alert box that confirms their contribution and then automatically disappears after three seconds. Both of these methods act as visual feedback mechanisms by informing volunteers about their selection and the verification procedure. In traditional VGI applications, a user typically has to draw a point, line, or polygon for each object on the map. To simplify this process, point geometry is created for the volunteer on the house polygon to reduce positional errors and showcase the locations of verified and unverified roofs. In the early phases of the development, once the volunteer classified the roof material, a tick mark was displayed on the dropdown menu itself to confirm their contribution. However, this did not communicate which roofs had been classified on the map and where? Overall, three types of colored tick marks are displayed to volunteers (Figure 3): (I) a yellow tick mark: roof classification submitted; (II) a green tick mark: roof verified; (III) a grey tick mark: roof unverified.
2.2.2. Service Tier
The service tier consists of custom Common Gateway Interface (CGI) scripts written in the Python programming language. These scripts process requests and send responses back to the presentation tier in the lightweight and data-interchangeable JavaScript Object Notation (JSON) format. Essentially, this tier communicates between both the presentation and database tiers. It is responsible for accepting and verifying volunteer contributions and then storing them inside a geospatial database. The service tier also retrieves the classified roofs and displays them in the presentation tier through the Open Geospatial Consortium (OGC) standardized Keyhole Markup Language (KML) layer in the form of tick marks. It is worth noting that these CGI scripts run on the free and open-source Apache web server, which provides a secure, efficient, and extensible HyperText Transfer Protocol (HTTP) service.
2.2.3. Database Tier
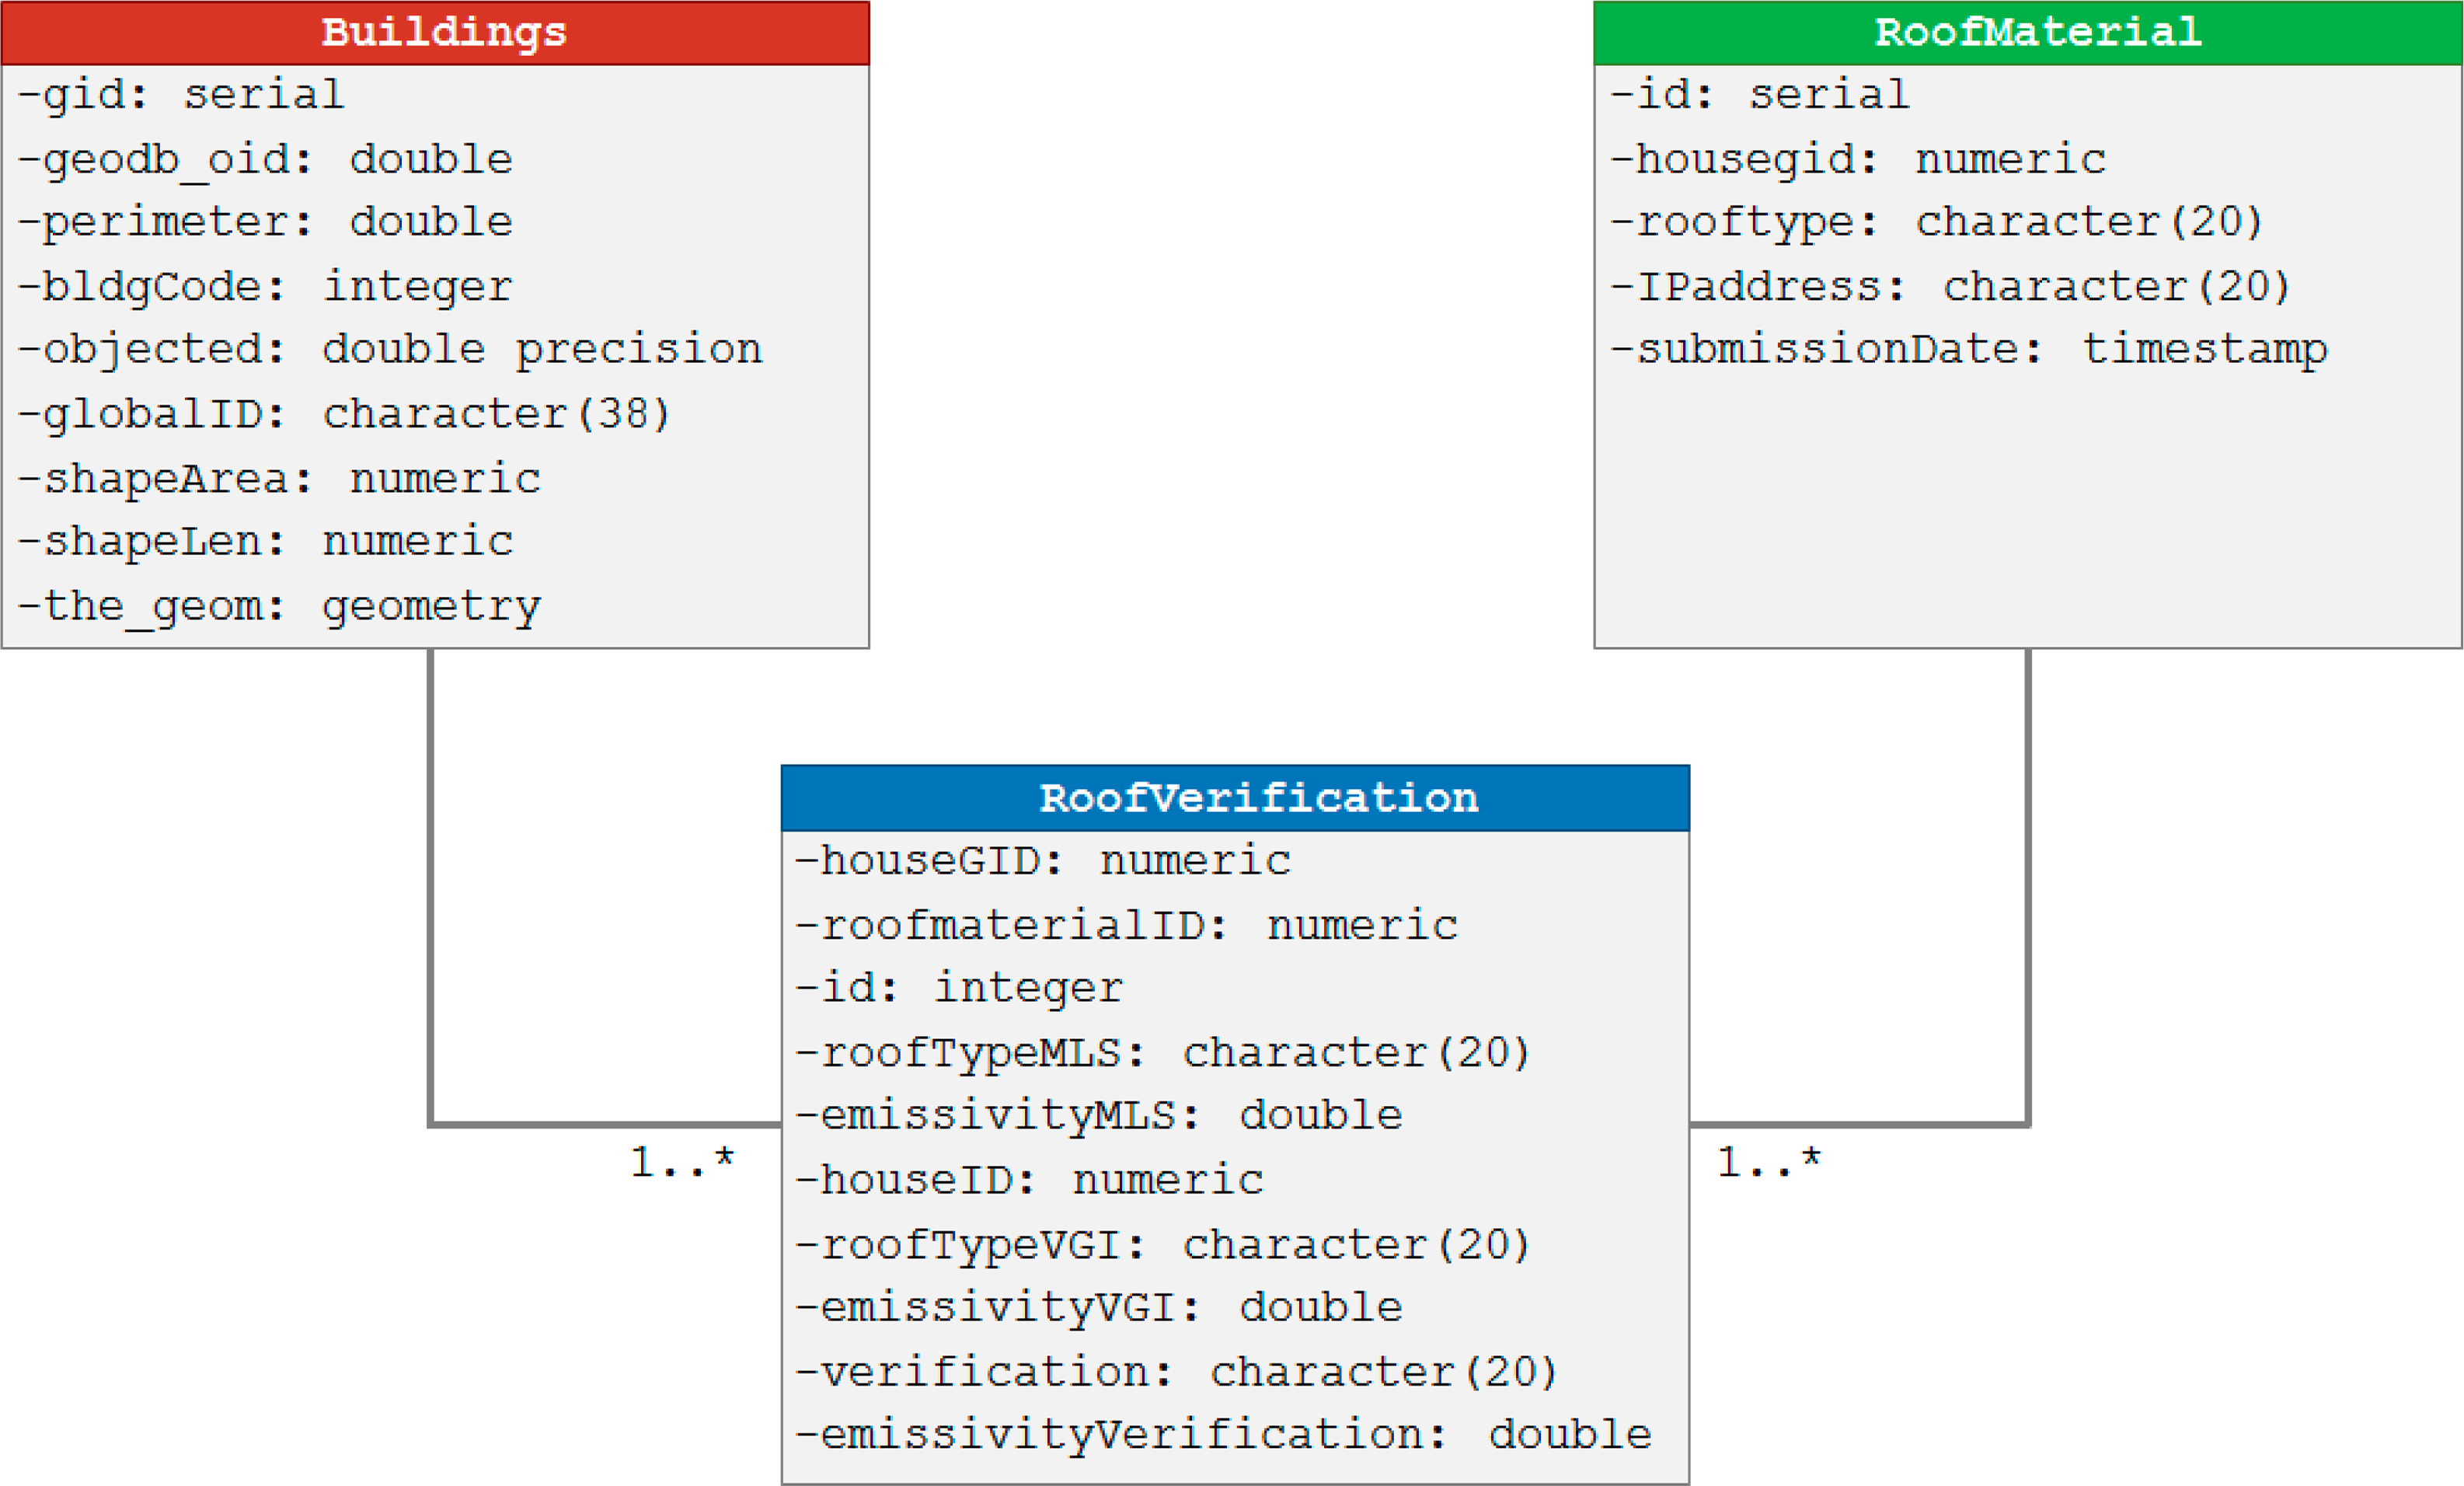
The database tier runs on PostgreSQL, an open-source Relational Database Management System (RDMS). It is being used in conjunction with PostGIS, which adds a spatial component to this database. Two tables were created for this research with each serving a different purpose (Figure 4). The RoofMaterial table stores information about the volunteer’s roof material contributions along with metadata, such as their Internet Protocol (IP) address for geolocation purposes and date and time—all attached to the unique identification (ID) number of a house polygon from the Buildings table. Storing meta data [27] should be seen as another method to control data credibility, quality, and accuracy, in addition to limiting the number of allowable roof material classes for the volunteer. Then, the RoofVerification table is used to validate volunteered roof material contributions against the MLS data.
2.3. Data Processing
2.3.1. Analytics
Structured Query Language (SQL) assisted in generating a Comma-Separated Values (CSV) file from the database containing all the raw volunteered data from May–November 2013. These raw volunteered data included the most frequently classified roof material for each house, meta data, such as the volunteer’s IP address and date and time—all attached to the unique house ID number and its location. Using these raw volunteered data, important analytics were generated including: (I) total number of volunteer contributions; (II) total number of classified roofs; (III) the most active day of contributions, (IV) the most active time of the day for contributions; and (V) total classified roofs per community. A Python script was then written to use MaxMind’s GeoIP (MaxMind was gracious enough to provide 2000+ requests at no cost for this research— www.maxmind.com) web services for batch processing volunteer IP addresses to determine their locations (city, state, and country). MaxMind claims their GeoIP database to be 83%, 90%, and 99.8% accurate at the city, state, and country levels, respectively [37].
2.3.2. Verification Protocol
The GIS cadastral data were spatially joined with the private MLS data for associating roof material information with each house polygon. Once this was achieved, raw volunteered data were combined with GIS and MLS data based on the unique house polygon ID. This allowed us to organize all three different data into one file that consisted of location-specific roof material information for each house. The verification protocol consisting of If and Else conditions was written using Python to label roofs as either verified, or unverified, based on whether they match with the MLS data, which was provided by CREB. New HEAT Scores were then generated [13] based on the verified emissivity values.
3. Results and Discussion
3.1. Volunteer Contributions
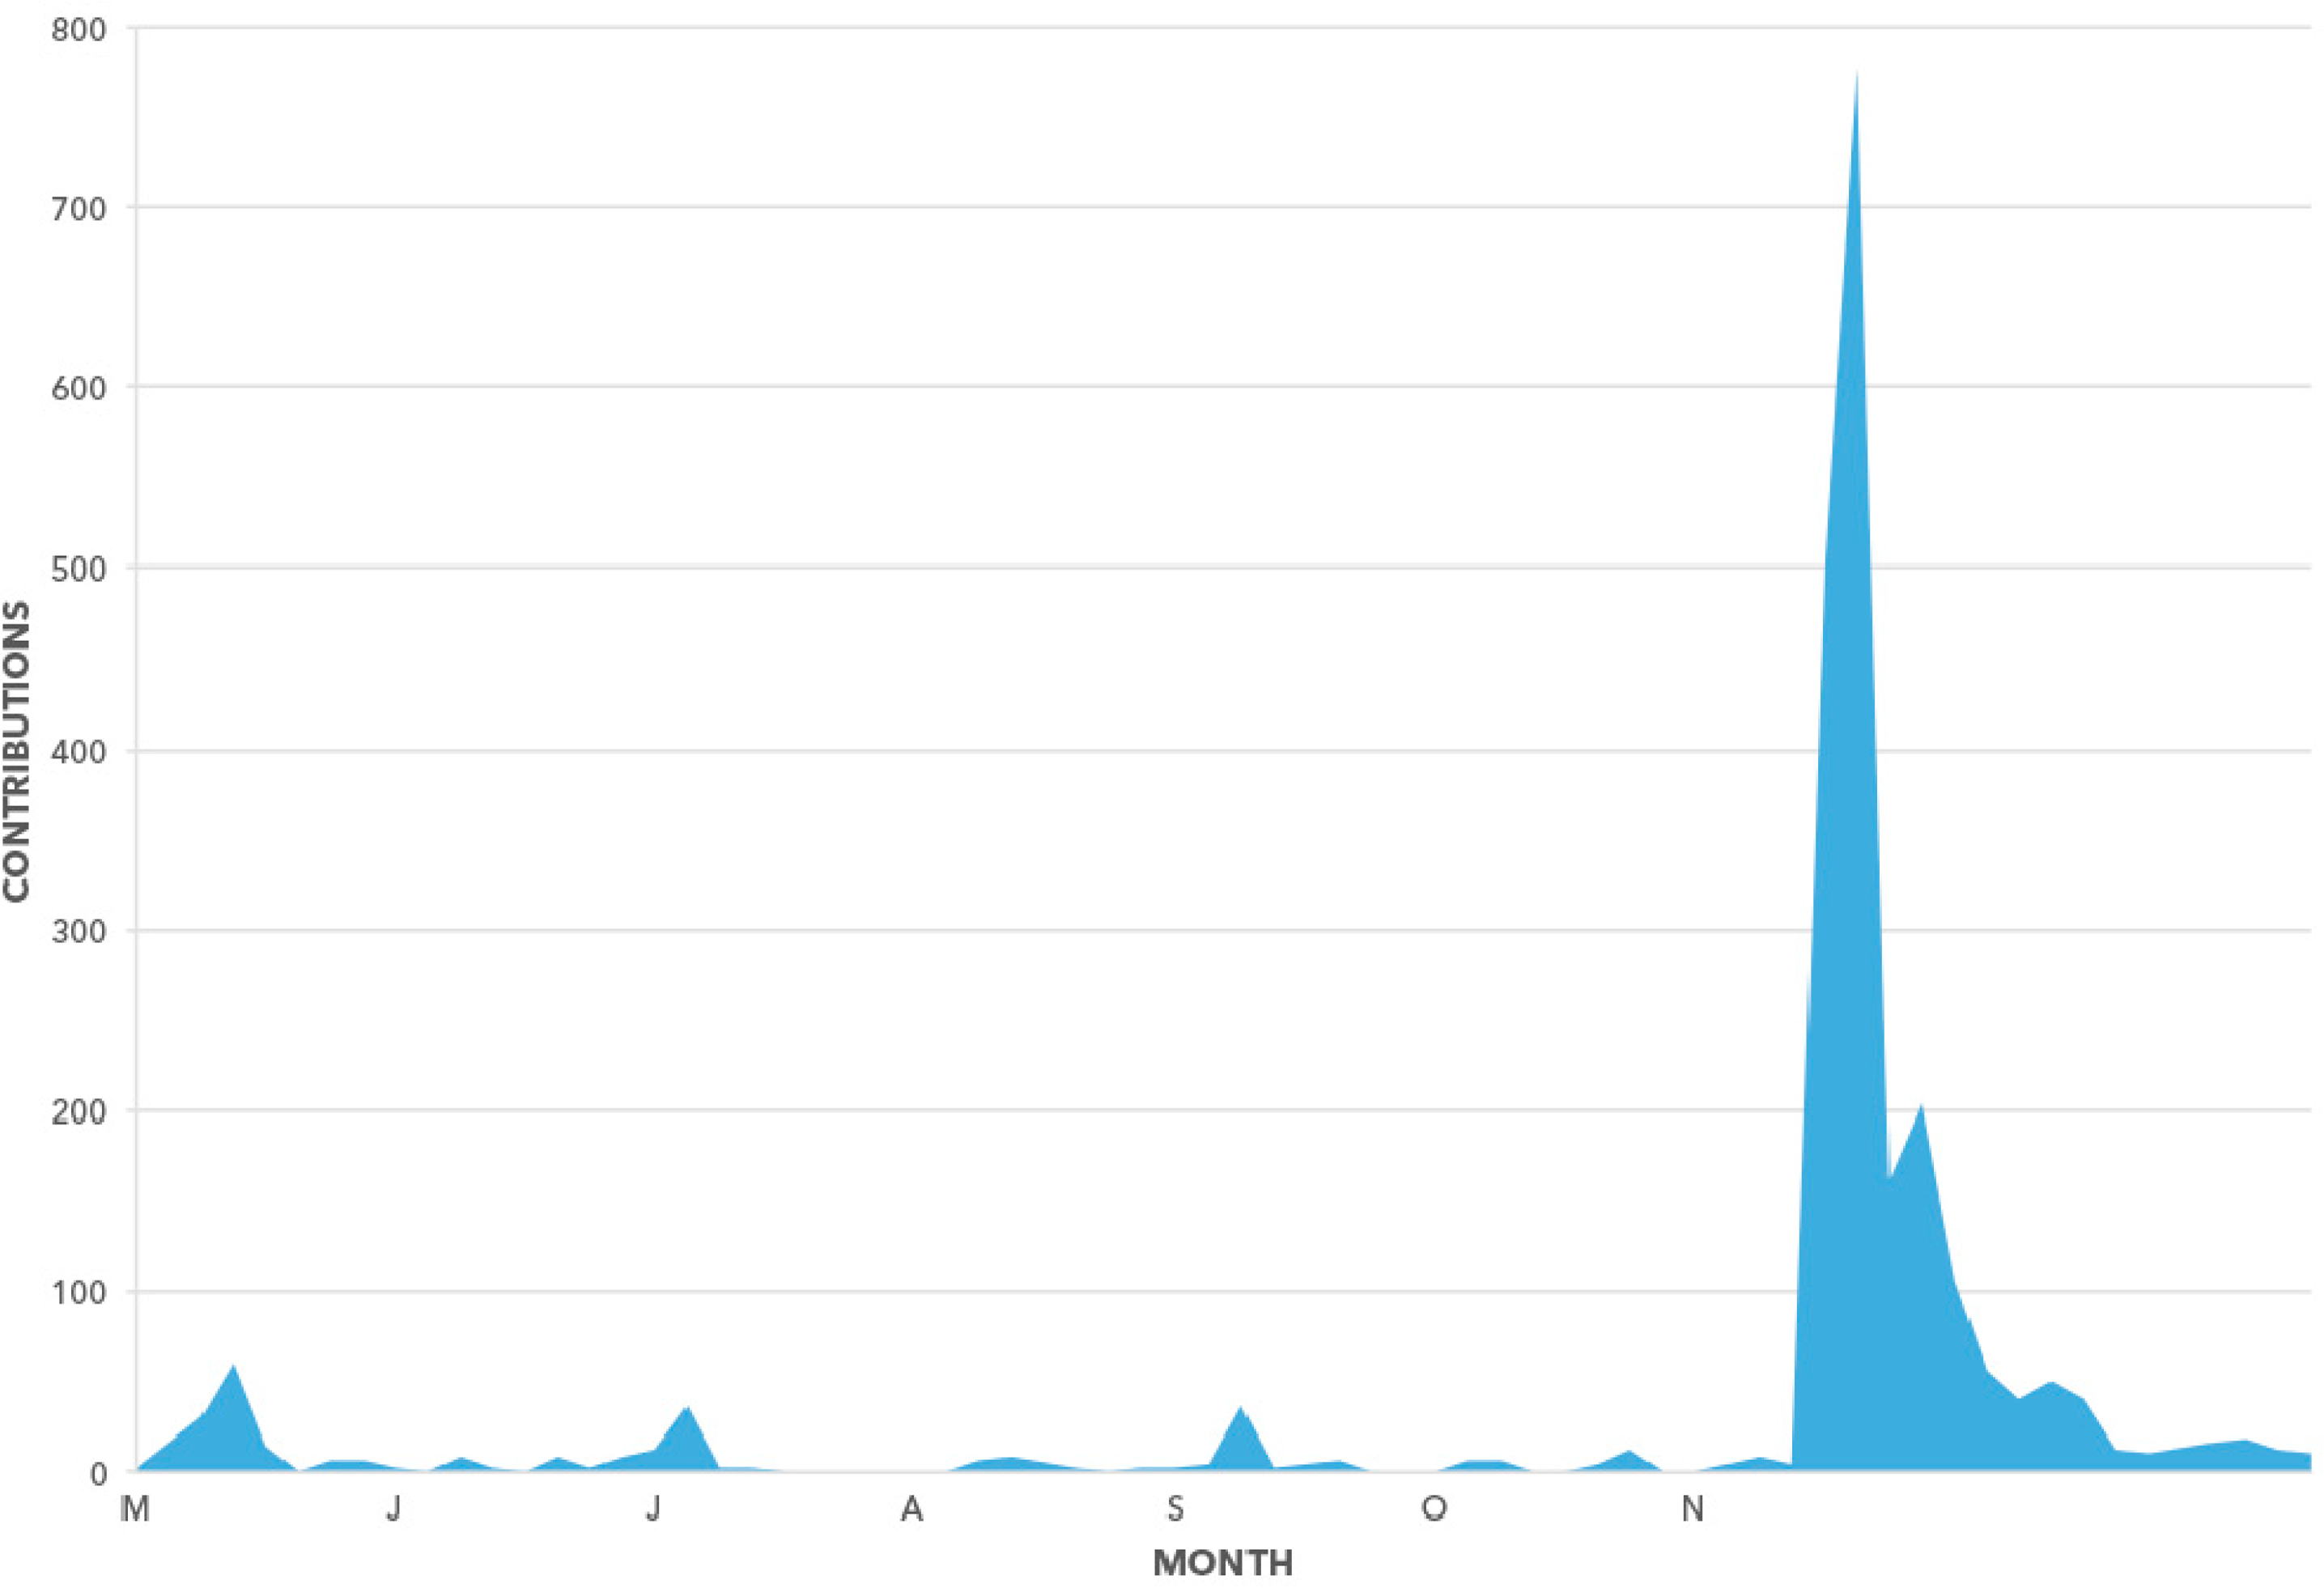
From May–November 2013, 2426 volunteer contributions were received with a mean of 11 contributions per day. Figure 5 shows how volunteer activity varied greatly during this time. Smaller spikes indicate a rise in volunteer contributions during summer and early fall, which can be associated with the HEAT project being presented at various exhibitions and conferences. At these venues, attendees were often educated about this VGI application, which caused the volunteer activity to temporarily increase. In contrast, the larger spike in November demonstrates a surge in the amount of volunteer contributions, coincident with the HEAT project winning the 2013 MIT Climate CoLab grand prize [9], which attracted a large number of volunteers to contribute. From this, we can see how important it is to keep promoting and advertising this VGI application to raise its awareness in the general public for maintaining a steady engagement with volunteers. Additionally, volunteers provided (2426) results in the following classes: asphalt (1369), cedar (397), concrete (367), metal (115), slate (66), rubber (58), and other (54). We note that these data are skewed in the asphalt class, which is appropriate, as we know from MLS data that ∼80% of Calgary roofs are made of this material.
3.2. Locations of Volunteers
It is interesting to note that these 2426 contributions came from 1244 volunteers. While the majority of these volunteers were from Calgary, the HEAT VGI application recorded volunteer participation from around the world including New York, Torino, Madrid, Yekaterinburg, and Roosendaal. The maximum number of roof material contribution made by a single volunteer was 155. An online and interactive time-lapse map highlighting the locations of these volunteers can be accessed at http://cdb.io/1cpHQun.
3.3. Classified Roofs
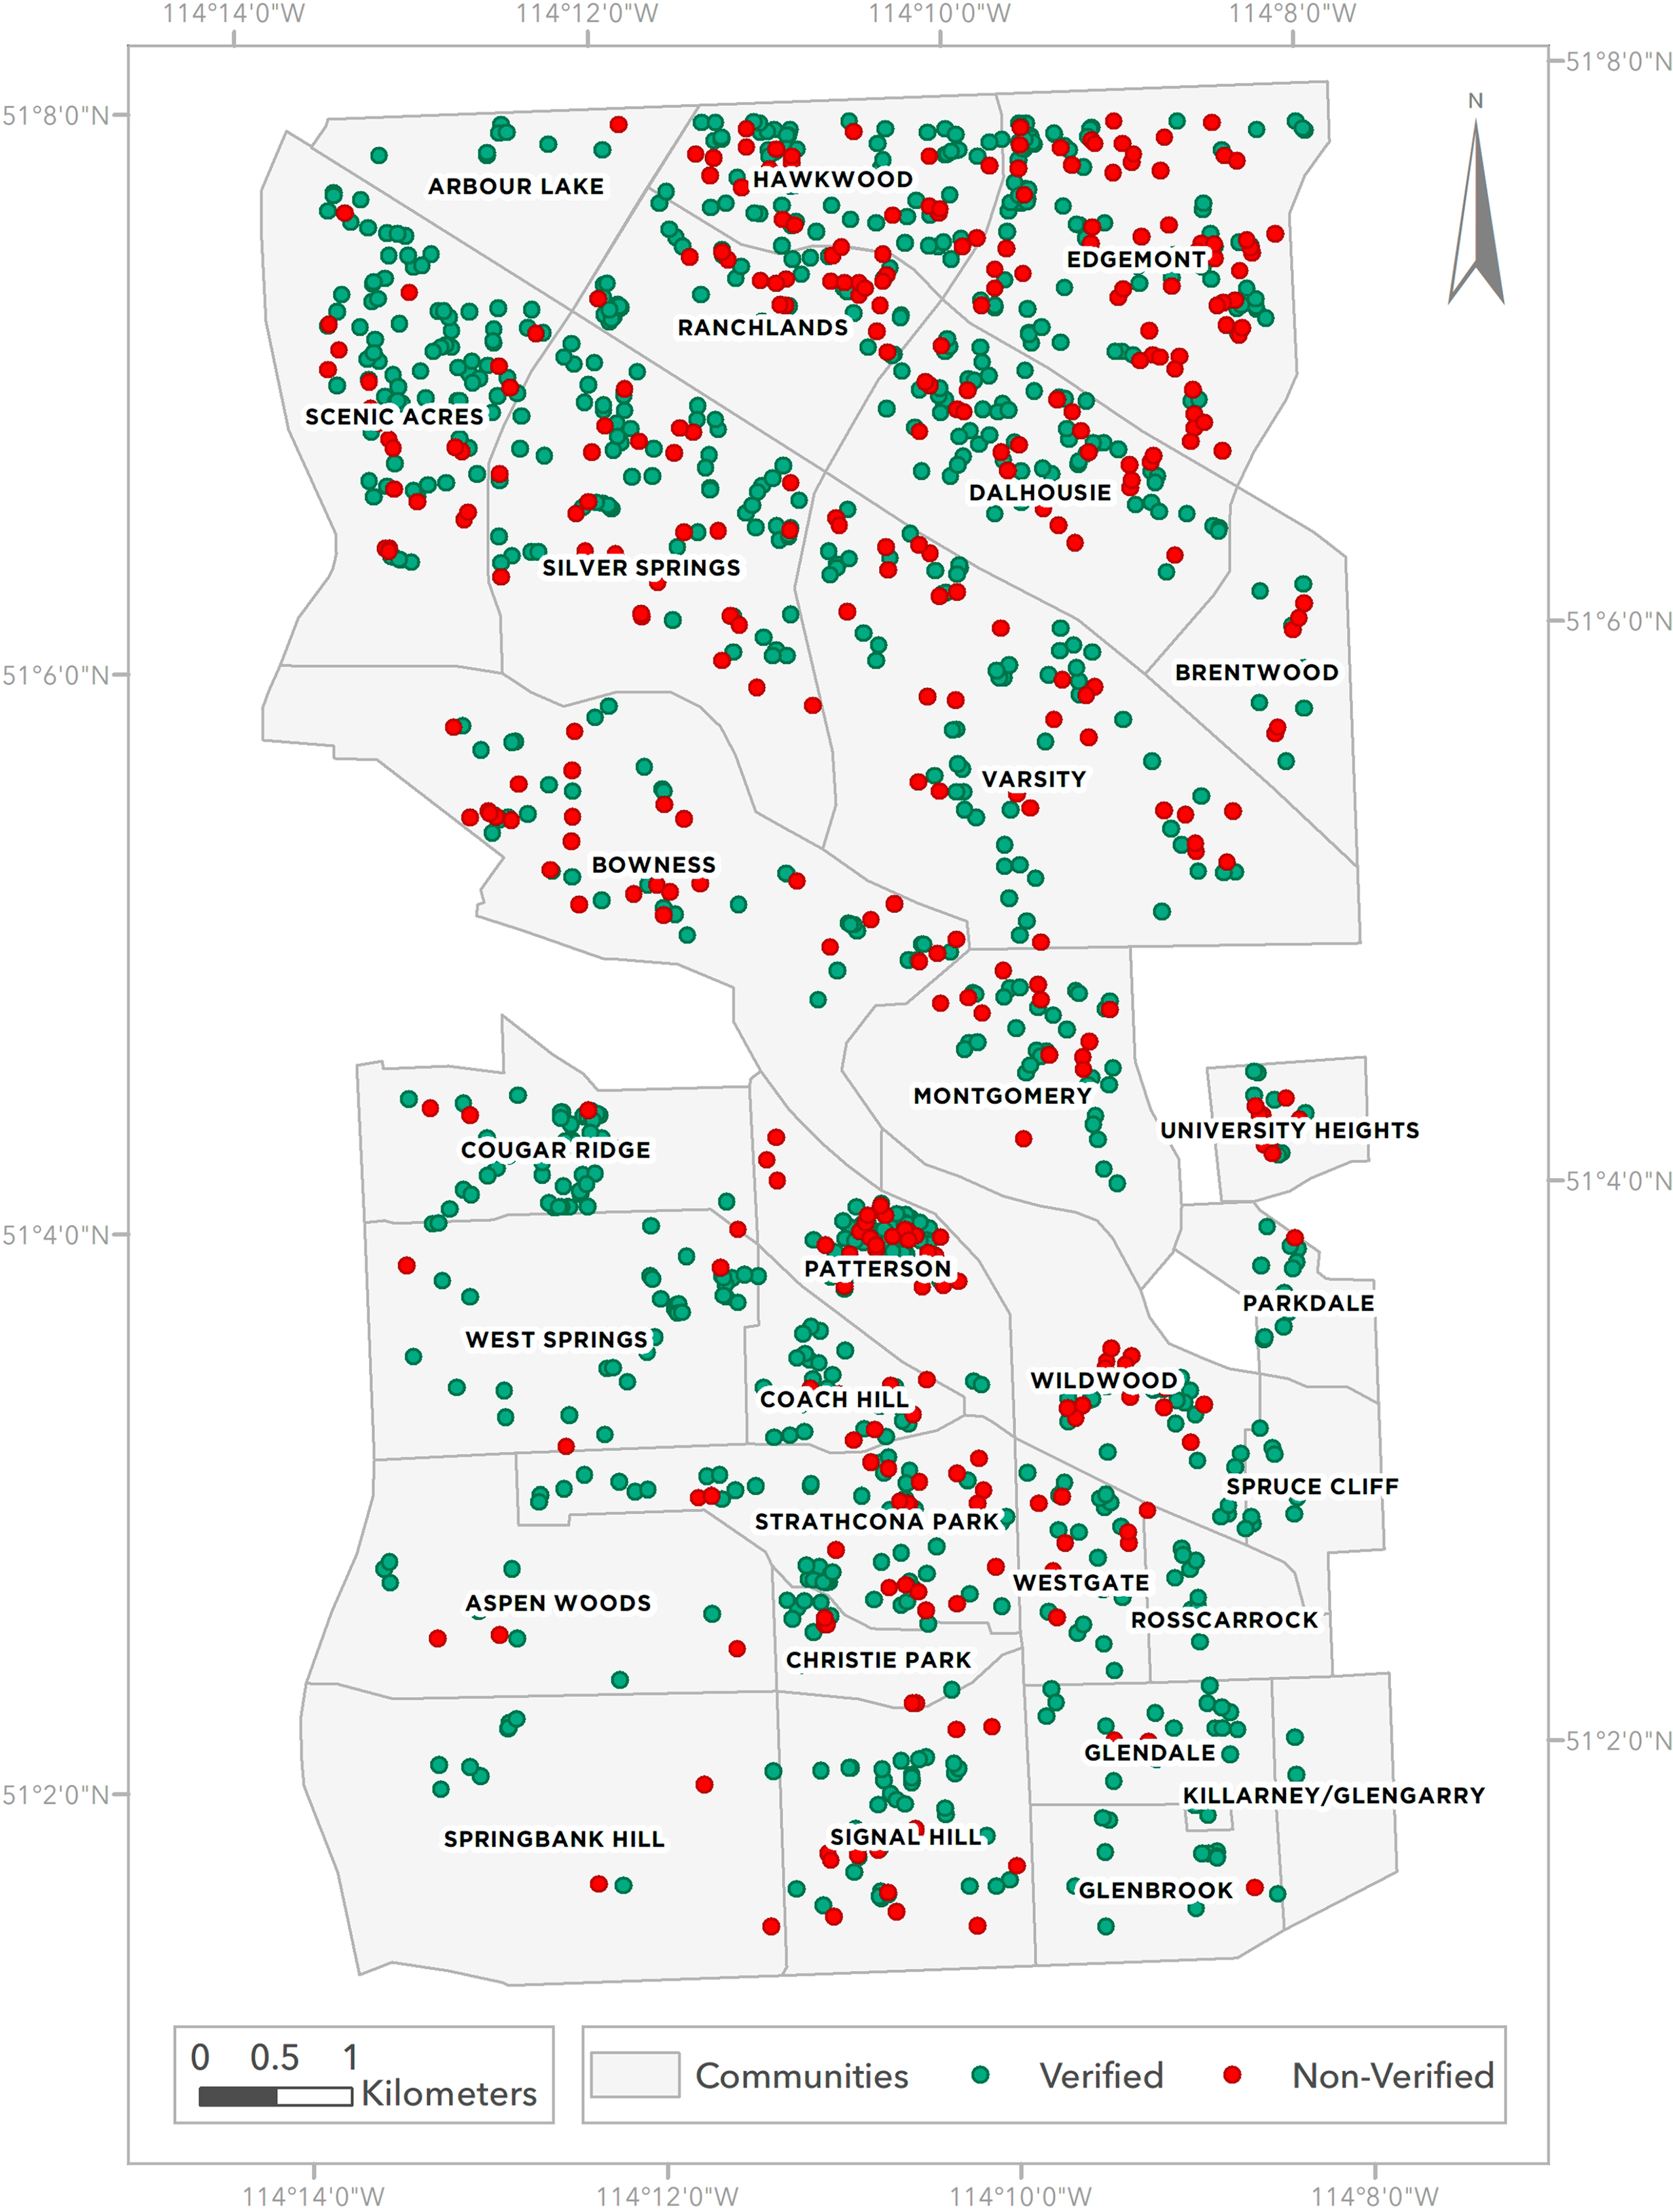
A total of 1244 volunteers classified 1815 unique roofs overall, which represents 5% of the Phase II study area (Figure 6). The difference in volunteer contributions (2426) vs. classified roofs (1815) exists because some volunteers classified the same roofs in their community. We also note that the average contribution per roof is approximately 1.3. This low number of contributions per roof suggests that many of these volunteers were either homeowners only classifying their home’s roof material, or volunteers simply experimenting and testing this VGI application on a randomly chosen home or community. Although the relationship is not linear, the majority of roofs that received greater than, or equal to five contributions had the same material defined in both MLS and VGI data. This provides support to the previously mentioned Linus’ Law (“Given enough eyeballs, all bugs are shallow”).
While these 1815 roofs are distributed throughout the study site, a large cluster of classified roofs can be seen towards the center of the map—in the community of Patterson, as shown in Figure 6. One plausible explanation for this is because Patterson has the highest HEAT Score of all 29 evaluated communities. Thus, we hypothesize that first time volunteers are more likely drawn towards investigating this community—which behavior tends to self-perpetuate, as new volunteers see many roofs already classified with tick marks, and also want to participate. Results also reveal that communities possessing broad range of roof materials experienced a higher number of classifications from volunteers than homogenous communities—suggesting that individuals are drawn to diversity and variability.
From the total classified roofs (1815), 1320 exist in both MLS and VGI data. In addition, 949 roofs are verified as the same material exists in both datasets. This represents a 72% match between the datasets and indicates the level of data quality resulting from this VGI application. We suggest that this percentage could be further increased if it were not for small errors in the MLS data. For example, the MLS data had a roof class REMKS, which according to the provided metadata indicated “See Remarks”. However, no remarks were provided with these data and CREB did not have the associated file. Additionally, several roofs in the MLS data were defined as a blank character, while others had no information (NULL).
3.4. Updated HEAT Scores
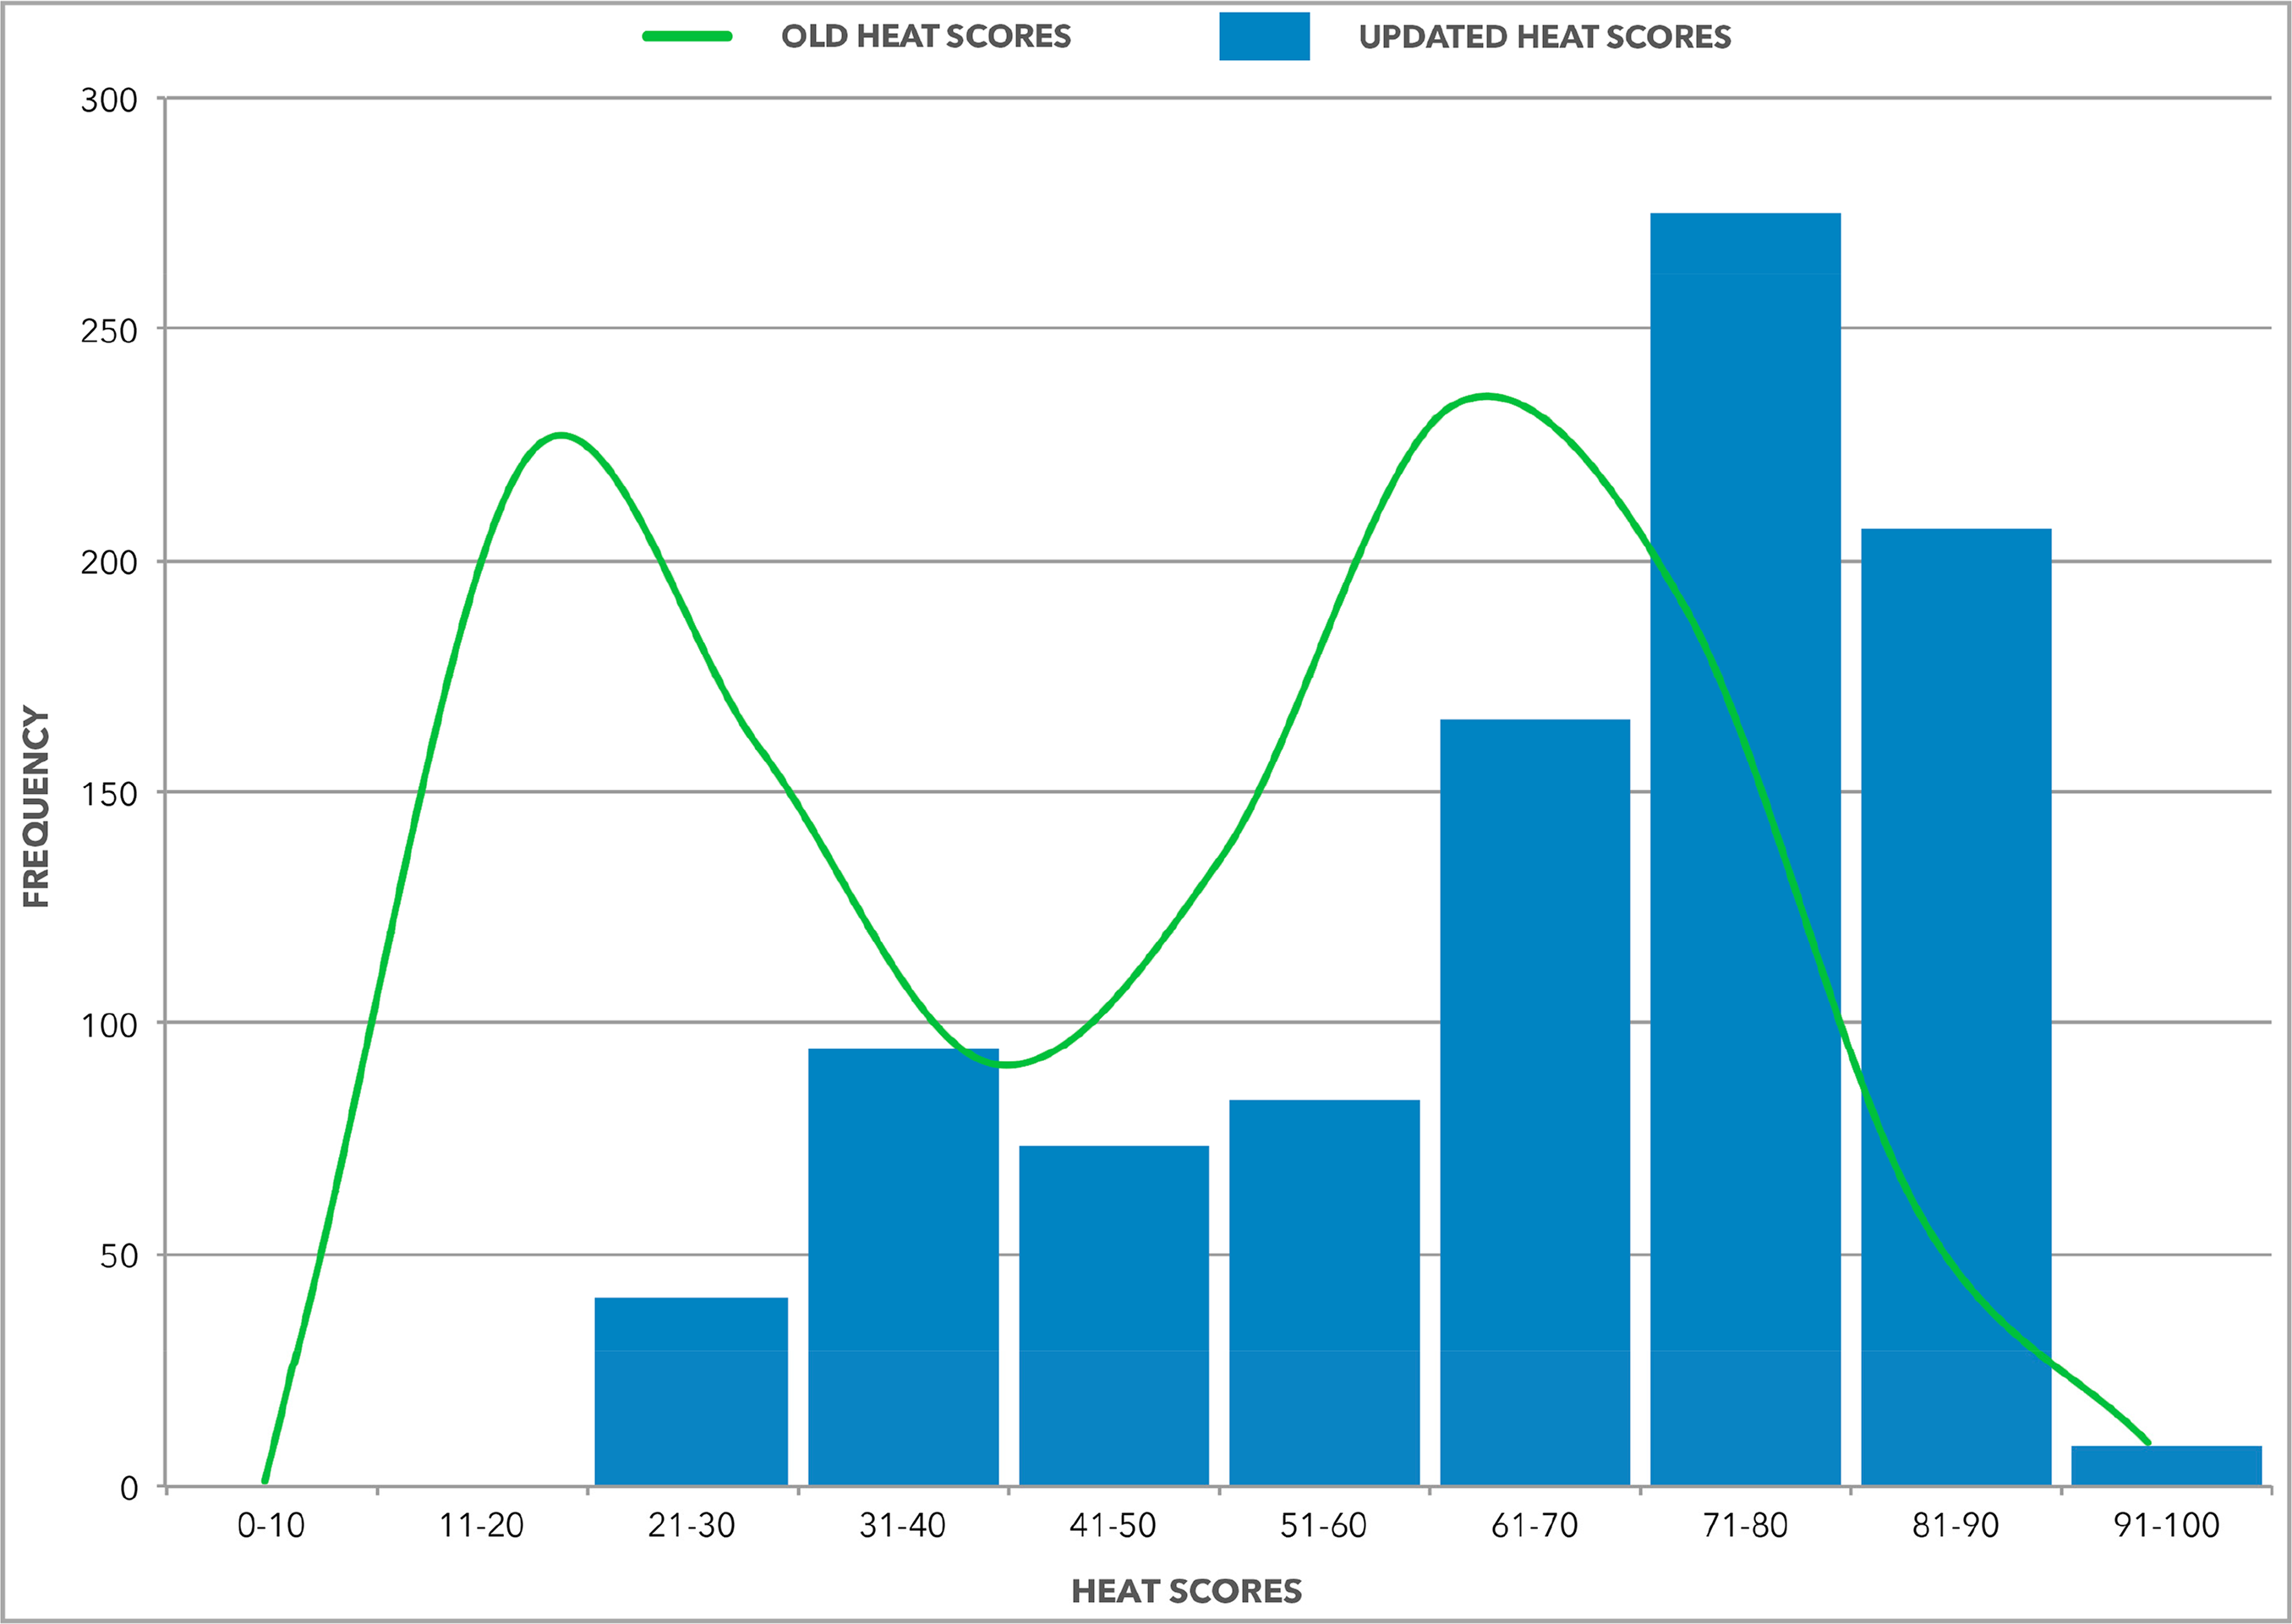
As mentioned in the introduction, by default the HEAT project assumes all roof material in the study area to be asphalt and assigns them an emissivity value of 0.91. Based on the previously presented analysis, HEAT Scores for the total verified roofs (949) shifted from a distinctly multi-modal to a negatively skewed uni-modal distribution, and an increased mean of 51 to 66 (Figure 7).
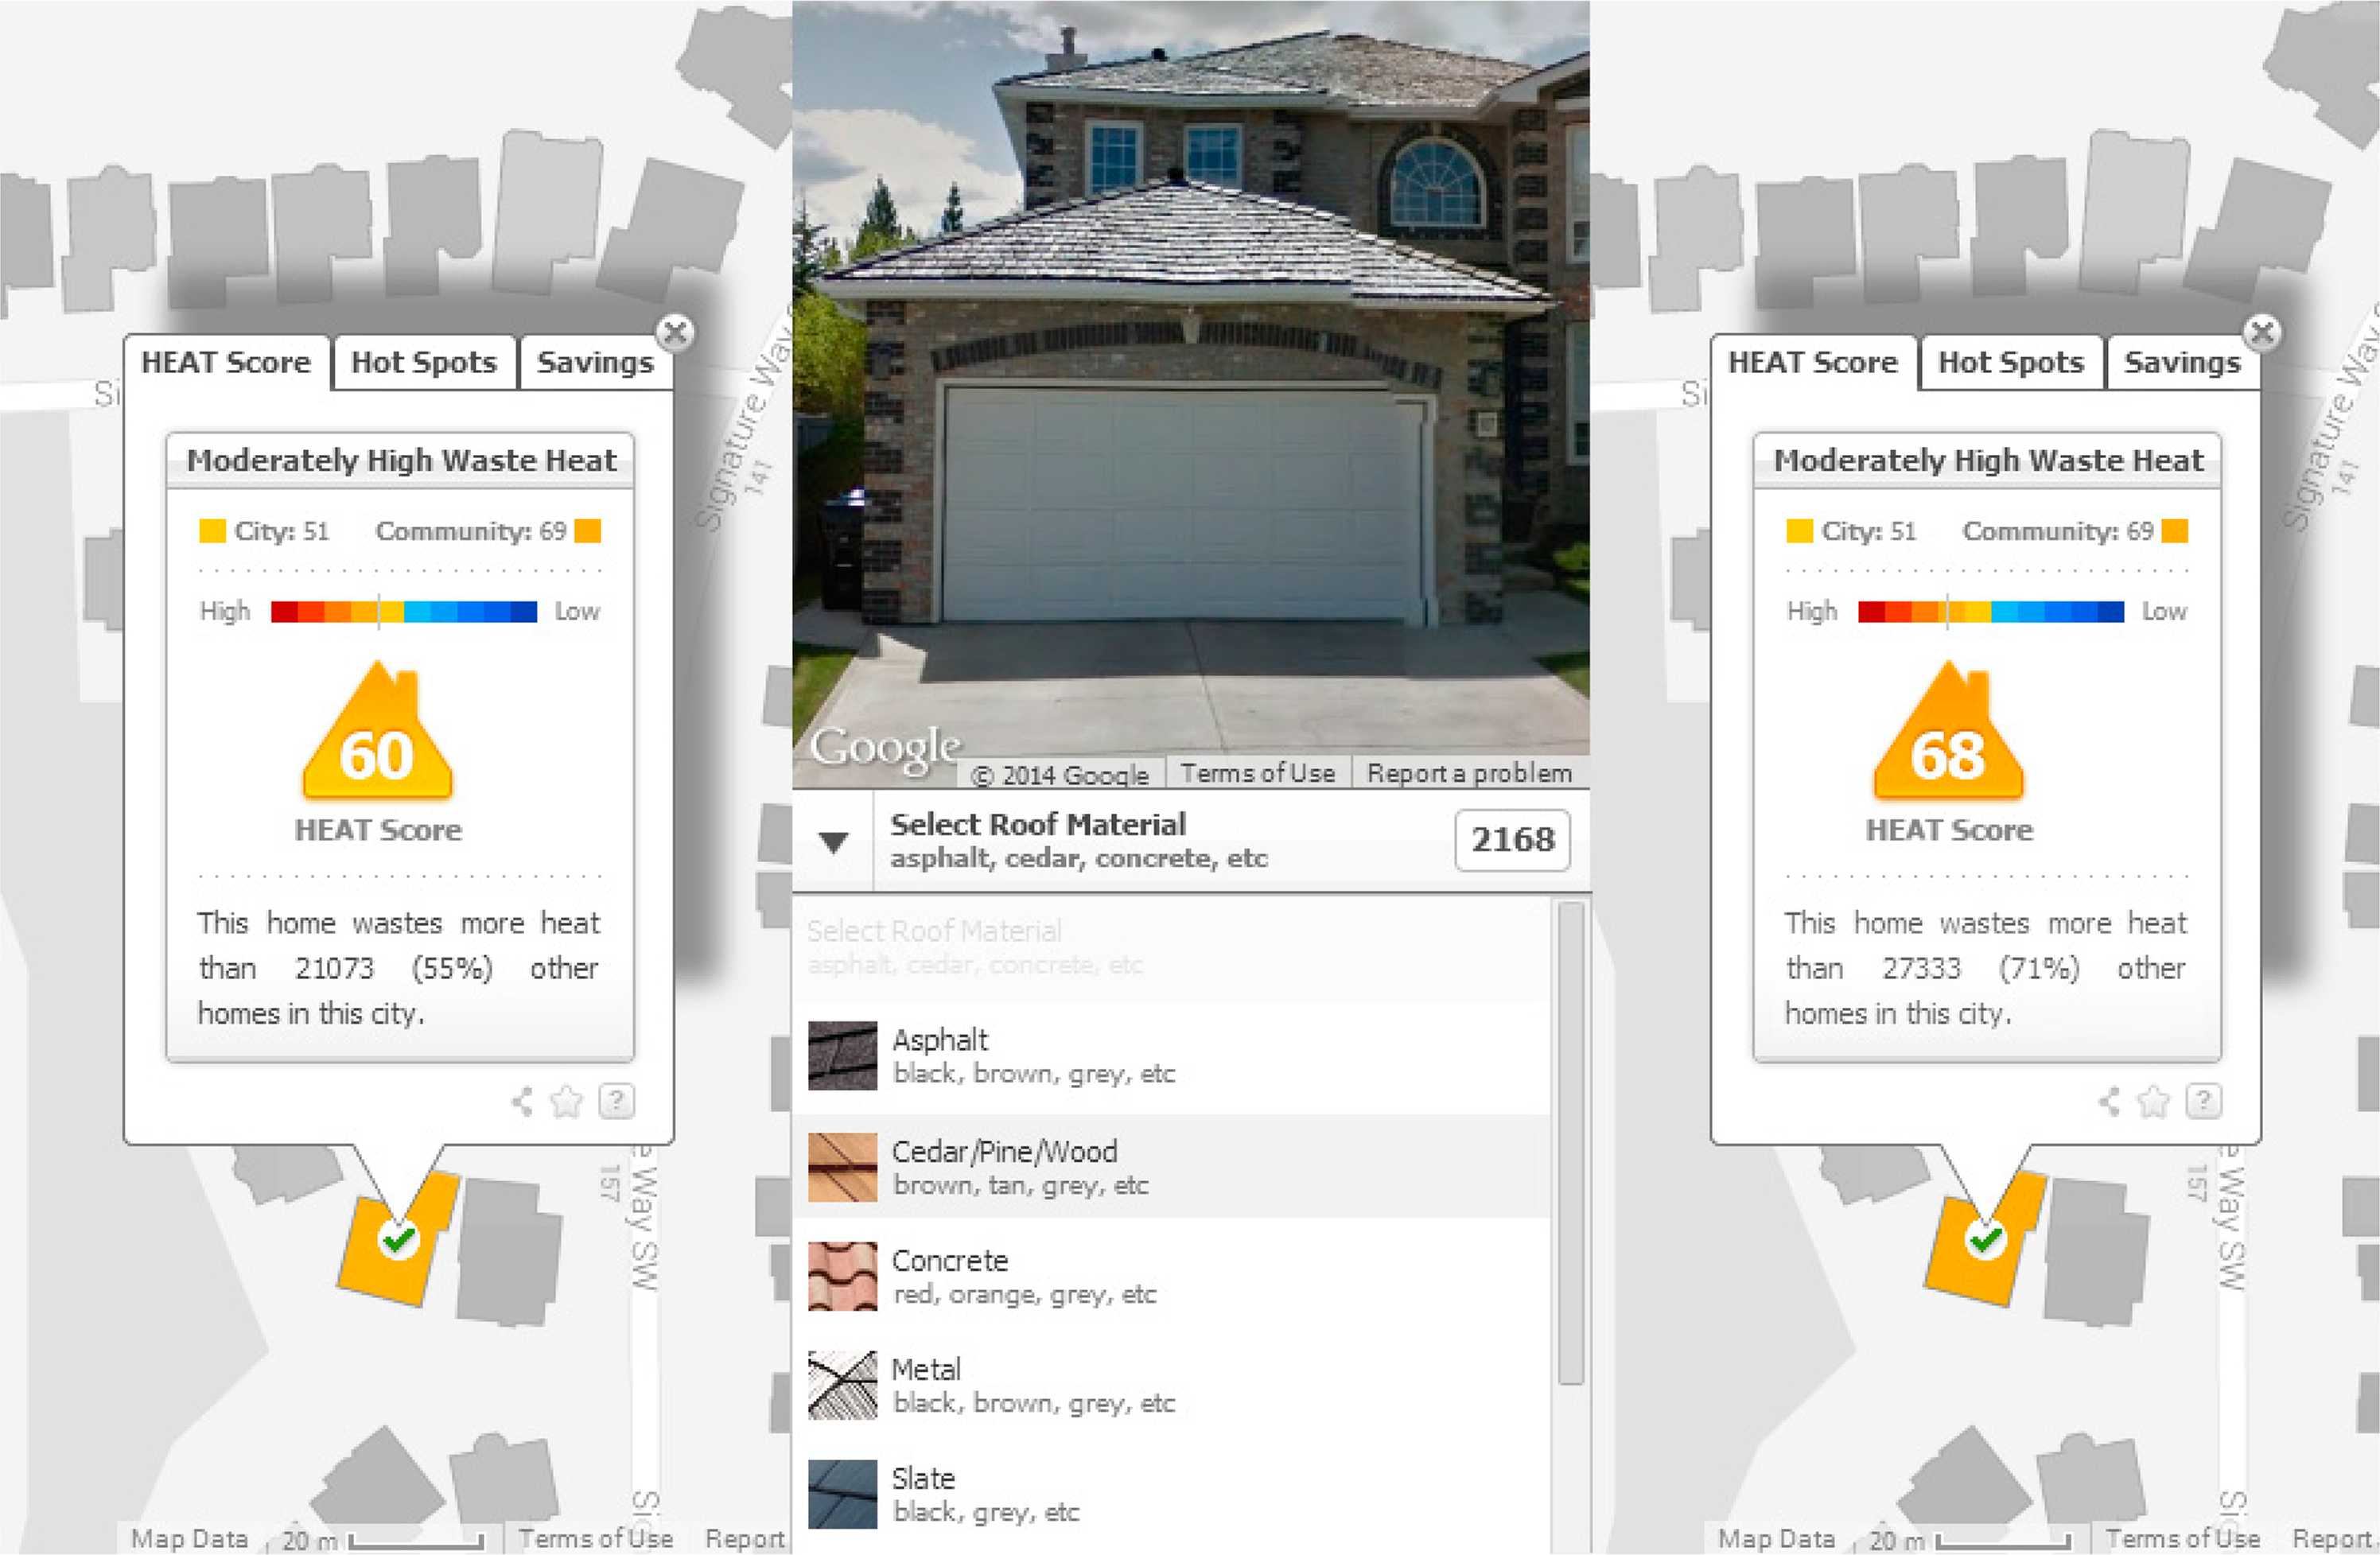
This makes sense, as we know that all homes in Calgary are wasting some heat. However, now this VGI application allows us to accurately calculate emissivity corrected HEAT Scores based on the actual roof material of each house, thereby bringing this energy efficiency metric closer to the reality. For example, when the roof material was updated from asphalt to cedar based on the verified emissivity value, the HEAT Score increased due to corresponding adjustments in the kinetic temperature (Tkin) (Figure 8).
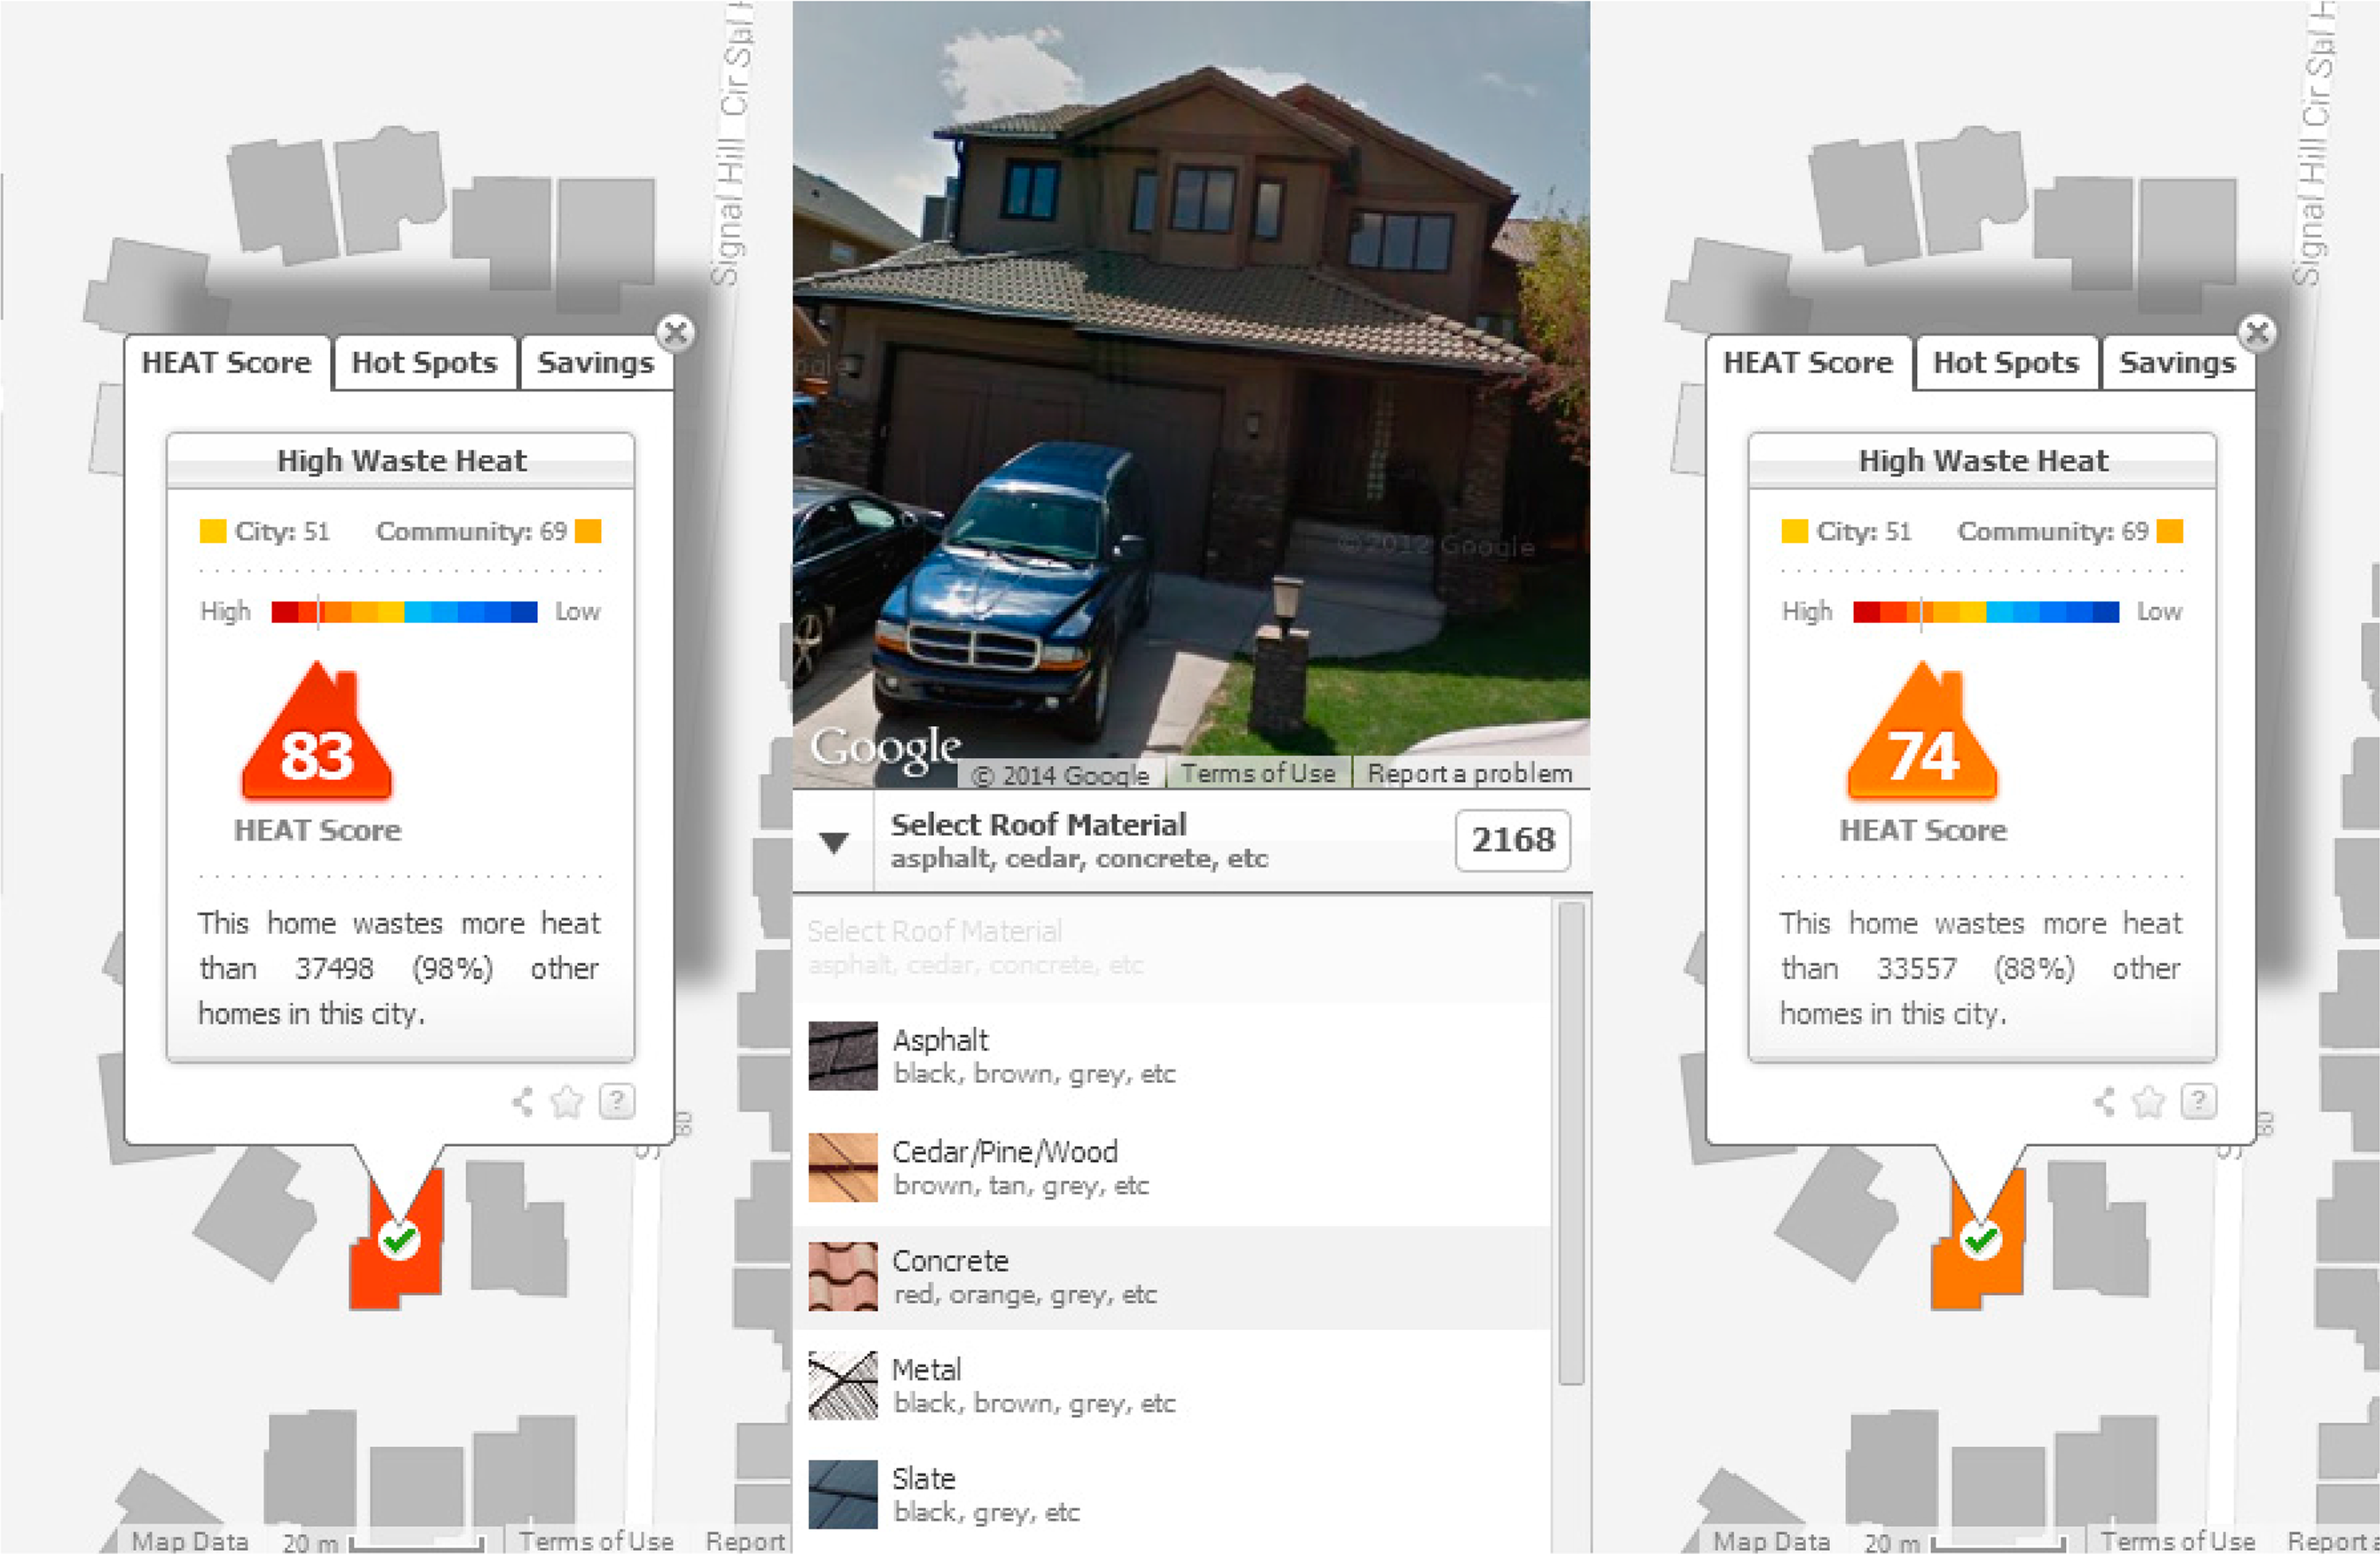
Conversely, when the roof material was updated from asphalt to concrete, the HEAT Score decreased (Figure 9). The fact that some homes may receive an increased HEAT Score due to corrections in their roof material may be of concern for some homeowners. For this, we need to effectively communicate what these results mean, as research has to come full circle with volunteers [23,27]. As this portion of the research is a work-in-progress, it should be noted that these updated HEAT Scores have not yet been made available to the public. Moreover, we are investigating the best methods to communicate this updated information with respective homeowners.
3.5. Volunteer Feedback
As part of the HEAT user engagement process, we received beneficial feedback from 132 (May–November 2013) volunteers through the optional survey (The HEAT project’s optional feedback survey— www.az1.qualtrics.com/SE/?SID=SV_9MPXXtZPzFhbIah), which is currently still active. Volunteers commented on missing roof classes such as Tar and Gravel. Additionally, while the described tick marks reportedly added initial confusion for volunteers (as there was no corresponding explanation in the help file—which has since been amended), the most important feedback was the volunteers’ need to know when they would see an updated HEAT Score for their home. For some, receiving a tick mark acted as a way to feed a mild addiction (or stimulation) while others reported feeling a sense of satisfaction after contributing. Still, others requested a way to remove bad or mistaken roof material classifications. However, no such method currently exists.
3.6. Limitations of the Google Maps API
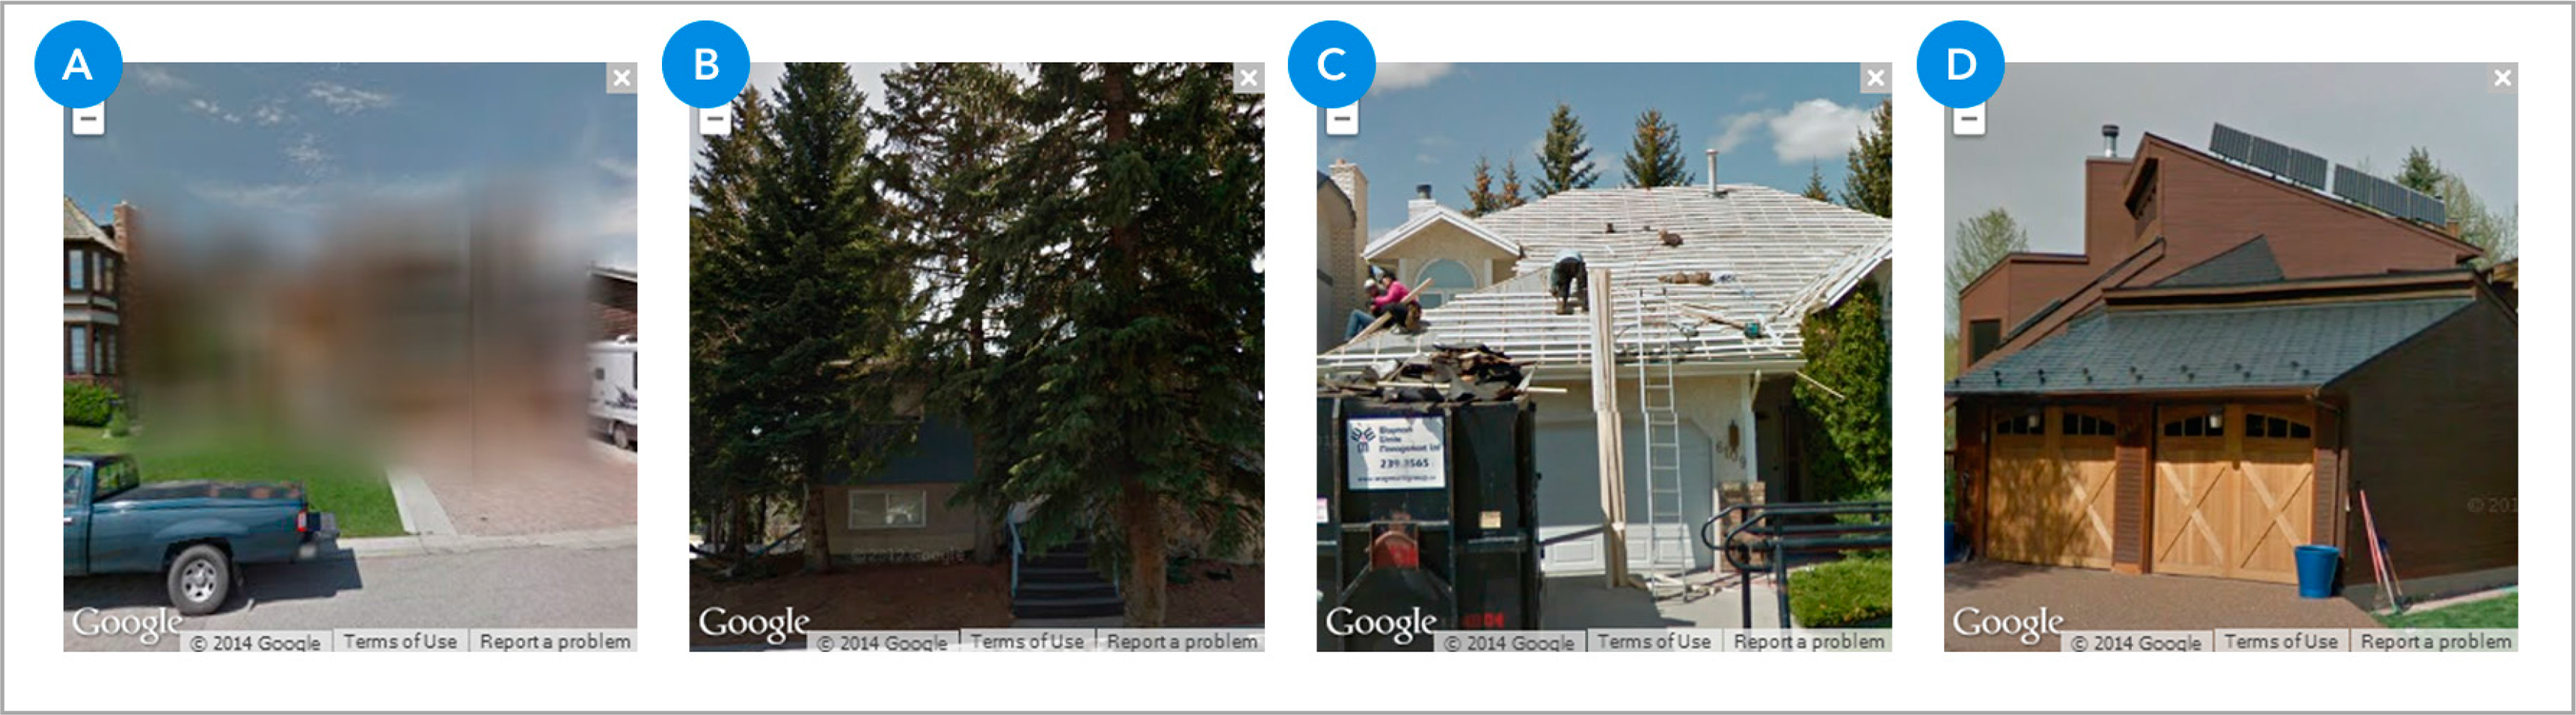
There were several technical challenges present during the time these data were collected by volunteers. Despite the numerous benefits of Google Street View, it still has image quality limitations. In isolated cases, trees surround and obscure many roofs (partially or completely), which makes it difficult for volunteers to identify and classify the roof material. There are also homes that are blurred due to privacy issues and roofs that are either under-construction, or covered by solar panels or composed of esoteric materials (Figure 10). Furthermore, there are issues with the Street View API’s functionality. Specifically, positioning the Street View so that it centers exactly in front of the house can often be a non-trivial task. There are also instances where positioning is inaccurate such as when Street View defaults to image taken from an alley, or across a major highway.
3.7. GEOBIA and Other Applications
The volunteered roof material information collected during this research represents new object-specific geo-intelligence for further improving data quality and illustrating new GEOBIA capabilities. It also meets a recent challenge to the GEOBIA community to incorporate existing GIS objects (i.e., rooftops) within the analytical framework [19]. Similarly, Smith and Morton [21] proposed using existing GIS polygons for classifying object—as they have been shown to improve classification results and segmentation does not have a unique solution. Although the primary objective of this VGI application was to collect roof material information, we suggest that the same user interface could be adapted to generate different geo-intelligence for any point, or polygon map features—especially for home specific information. Furthermore, this new roof information may be spatially integrated with related datasets to provide additional layers of evidence and to ensure more accurate results for different purposes [21]. For example:
- (1)
These volunteered data could be used as training/test datasets for more traditional supervised image classifications (e.g., impervious surfaces)—especially (I) when analysts are unfamiliar with the study area; (II) when the area is not easily accessible; or (III) when field-verification budgets are limited.
- (2)
Given the appropriate privacy permissions, results could be made available to roofing service providers. Specifically, if roof material type were combined with building age, it would be relatively trivial to estimate when a new roof would be needed on which buildings.
- (3)
Results could also be provided to the Calgary Real Estate Board (CREB) as an updated and verified dataset that could be part of an ongoing homes sale-portfolio. For example, if it were combined with the date the roof was installed, along with the service provider contract and warranty, it could be used as evidence of the remaining lifetime of the roof, which could improve house salability, and buyer confidence.
4. Conclusions
This research demonstrated a simple and intuitive HEAT VGI application that used existing GIS cadastral and high-resolution TIR data with the Google Maps API to support urban energy efficiency. To the best of our knowledge, this is the first time that Google Street View has been used for classifying roof materials, or implemented in a VGI application. This research also meets the newly proposed GEOBIA definition of extracting meaningful image-object attributes from remote sensing imagery. This is achieved by incorporating existing GIS vector objects within the analytical framework and engaging the public within a Geoweb environment to provide (new) volunteered geo-intelligence based on unique urban geo-objects (i.e., individual rooftops). Since information on the roof materials of Canadian homes is not readily available in the public domain, thousands of volunteers from around the world have used the HEAT VGI application to classify the roof material of Calgary homes using a combination of Google Street View and Satellite images.
Results demonstrate that the implementation of volunteer requirements and researcher considerations positively influenced the overall quality of the volunteered data—resulting in a 72% match between the MLS and VGI data. We are currently investigating methods for effectively communicating updated HEAT Score results back to volunteers and the general public engaged in this project. We also continue to invest resources to refine the user experience by introducing valuable (user requested) features within the HEAT VGI application. It is envisioned that these refinements will further improve accessibility, participation, and the quality of new volunteered data. This research would not have been possible without the use of high-resolution images provided by the airborne and satellite sensors. Details are necessary because GEOBIA is inherently fine spatial resolution so images must be of high-resolution as well. Moreover, these details allowed the volunteers to visualize the actual roof material of a house.
Future research initiatives will improve on the previously discussed (I) technical limitations of the Google Maps API; (II) explore spatial concepts relating to volunteer’s sphere of experience, or home range to better understand volunteer’s behavior behind the classification of roof materials, and (III) deploy similar VGI applications for creating novel object-specific geo-information products that can be used to benefit new research agendas. The VGI application presented in this paper should not be seen only as a method to collect data. Rather, we have also shown that it is possible to engage citizens in the domain of energy efficiency and support HEAT’s vision to provide free, accurate, and regularly updated waste heat solutions for the world.
Acknowledgments
The authors would like to acknowledge support from The Institute for Sustainable Energy, Environment and Economy (iseee.ca), The City of Calgary (calgary.ca), Tecterra ( tecterra.com), The Alberta Real Estate Foundation (aref.ab.ca), and the Calgary Real Estate Board ( creb.com). We also acknowledge a University of Calgary Award of Excellence in Geospatial Sciences to Bilal Abdulkarim, and a University of Calgary, Eyes High International Doctoral Scholarship, an ISEEE Graduate Scholarship, a Faculty Graduate Research Scholarship and a Geography Excellence Award to Rustam Kamberov. In addition, the authors would like to thank the Department of Geography, and the research team in the Foothills Facility for Remote Sensing and GIScience (F3GISci) at the University of Calgary for their continuous support and encouragement. The opinions and views described in this paper are those of the authors and not necessarily of the supporting organizations.
Author Contributions
Bilal Abdulkarim and Geoffrey J. Hay conceived and designed the research. Bilal Abdulkarim was responsible for the development of the presentation tier and Rustam Kamberov for the service and database tiers. Bilal Abdulkarim also processed and analyzed the data in addition to being the lead author of this paper with writing contributions and corrections by Geoffrey J. Hay and Rustam Kamberov.
Conflicts of Interest
The authors declare no conflict of interest.
References
- Natural Resources Canada. Additional Statistics on Energy. Available online: http://nrcan.gc.ca/publications/statistics-facts/1239 (accessed on 2 August 2014).
- Statistics Canada. Households and the Environment: Energy Use. Available online: http://statcan.gc.ca/pub/11-526-s/2013002/part-partie1-eng.htm (accessed on 2 August 2014).
- Environment Canada. Greenhouse Gas Emissions in Canada. Available online: http://ec.gc.ca/ges-ghg (accessed on 2 August 2014).
- Natural Resources Canada. Energy Efficiency Trends in Canada. Available online: http://oee.nrcan.gc.ca/publications/statistics/trends11/pdf/trends.pdf (accessed on 4 August 2014).
- City of Calgary. The 2020 Sustainability Direction. Available online: http://calgary.ca/CA/cmo/Pages/The-2020-Sustainability-Direction.aspx (accessed on 2 August 2014).
- City of Calgary. Calgary Climate Change Accord. Available online: http://calgary.ca/UEP/ESM/Pages/Climate-change/Calgary-Climate-Change-Accord.aspx (accessed on 2 August 2014).
- City of Calgary. Calgary Community Greenhouse Gas (GHG) Reduction Plan. Available online: http://www.calgary.ca/UEP/ESM/Pages/Climate-change/Community-Greenhouse-Gas-Plan.aspx (accessed on 2 August 2014).
- Hay, G.J.; Kyle, C.; Hemachandran, B.; Chen, G.; Rahman, M.M; Fung, T.S.; Arvai, J.L. Geospatial technologies to improve urban energy efficiency. Remote Sens 2011, 3, 1380–1405. [Google Scholar]
- McCoy, H. HEAT Project Takes Grand Prize at MIT Conference on Global Climate Change. Available online: http://ucalgary.ca/utoday/issue/2013-11-08/heat-project-takes-grand-prize-mit-conference-global-climate-change (accessed on 11 April 2014).
- Rahman, M.M.; Hay, G.J.; Couloigner, I.; Hemachandran, B.; Bailin, J.; Zhang, Y.; Tam, A. Geographic Object-Based Mosaicing (OBM) of high-resolution Thermal Airborne Imagery (TABI-1800) to improve the interpretation of urban image objects. IEEE Geosci. Remote Sens. Lett 2013, 10, 918–922. [Google Scholar]
- Rahman, M.M.; Hay, G.J.; Couloigner, I.; Hemachandran, B. Transforming image-objects into fields: A GEOBIA approach to mitigate radiometric variability within a H-Res Thermal Infrared (TIR) urban scene. Remote Sens 2014, 6, 9435–9457. [Google Scholar]
- ITRES. TABI-1800. Available online: http://itres.com./pdf/TABI-1800.pdf (accessed on 14 February 2014).
- Hemachandran, B. Developing HEAT Scores with H-Res Thermal Imagery to Support Urban Energy Efficiency. Master’s Thesis, University of Calgary, Calgary, AB, Canada. 2013. [Google Scholar]
- Roche, S.; Propeck-Zimmermann, E.; Mericskay, B. GeoWeb and crisis management: Issues and perspectives of volunteered geographic information. GeoJournal 2011, 78, 21–40. [Google Scholar]
- Jensen, J.R. Thermal Infrared Remote Sensing. In Remote Sensing of the Environment: An Earth Resource Perspective, 2nd ed.; Prentice Hall: Upper Saddle River, NJ, USA, 2007; pp. 249–290. [Google Scholar]
- Bankrate. Your Roof and Your Home Insurance. Available online: http://www.bankrate.com/finance/insurance/roof-home-insurance.aspx (accessed on 4 August 2014).
- Goodchild, M.F. Citizens as sensors: The world of volunteered geography. GeoJournal 2007, 69, 211–221. [Google Scholar]
- Castilla, G.; Hay, G.J. Image-objects and geo-objects. In Object-Based Image Analysis—Spatial Concepts for Knowledge-Driven Remote Sensing Applications; Blaschke, T., Lang, S., Hay, G.J., Eds.; Springer-Verlag: Berlin, Germany, 2008; pp. 91–110. [Google Scholar]
- Hay, G.J. GEOBIA—Evolving beyond segmentation. In Proceedings of the 5th International GEOBIA Conference, Thessaloniki, Greece, 24 May 2014.
- Hay, G.J.; Blaschke, T. Forward: Special issue on Geographic Object-Based Image Analysis (GEOBIA). Photogram. Eng. Remote Sens 2010, 76, 121–122. [Google Scholar]
- Smith, G.M.; Morton, R.D. Real world objects in GEOBIA through the exploitation of existing digital cartography and image segmentation. Photogram. Eng. Remote Sens 2010, 76, 163–171. [Google Scholar]
- O’Reilly, T. What is Web 2.0? O’Reilly Media Inc.: Sebastopol, CA, USA, 2005. [Google Scholar]
- Silvertown, J. A new dawn for citizen science. Trends Ecol. Evol 2009, 24, 467–471. [Google Scholar]
- Tweddle, J.C.; Robinson, L.D.; Pocock, M.J.; Roy, H.E. Guide to citizen science: developing, implementing, and evaluating citizen science to study biodiversity and the environment in the UK. Available online: http://www.ceh.ac.uk/products/publications/documents/CitizenScienceGuide.pdf (accessed on 10 February 2014).
- Clark, M.L.; Aide, T.M. Virtual Interpretation of Earth Web-Interface Tool (VIEW-IT) for collecting land-use/land-cover reference data. Remote Sens 2011, 3, 601–620. [Google Scholar]
- Newman, G.; Zimmerman, D.; Crall, A.; Laituri, M.; Graham, J.; Stapel, L. User-friendly web mapping: Lessons from a citizen science website. Int. J. Geogr. Inf. Sci 2010, 24, 1851–1869. [Google Scholar]
- Cooper, C.B.; Dickinson, J.; Phillips, T.; Bonney, R. Citizen science as a tool for conservation in residential ecosystems. Ecol. & Soc 2007, 12. art11.. [Google Scholar]
- Coleman, D.J.; Georgiadou, Y.; Labonte, J. Volunteered geographic information: The nature and motivation of produsers. Int. J. Spat. Data Infrastruct. Res 2009, 4, 332–358. [Google Scholar]
- Flanagin, A.J.; Metzger, M.J. The credibility of volunteered geographic information. GeoJournal 2008, 72, 137–148. [Google Scholar]
- Dasgupta, A. VGI: Democratisation of Geographic Information. Available online: http://geospatialworld.net/Paper/Cover-Stories/ArticleView.aspx?aid=25325 (accessed on 11 February 2014).
- Dickinson, J.L.; Zuckerberg, B.; Bonter, D.N. Citizen science as an ecological research tool: Challenges and benefits. Annu. Rev. Ecol. Evol. Syst 2012, 41, 149–172. [Google Scholar]
- Penor, J.R. Is All Crowdsourced Data Valid for the Geospatial Sector? Available online: http://sensysmag.com/article/columns/28249-is-all-crowdsourced-data-valid-for-the-geospatial-sector.html (accessed on 12 February 2014).
- Goodchild, M.F.; Li, L. Assuring the quality of volunteered geographic information. Spat. Stat 2010, 1, 110–120. [Google Scholar]
- Raymond, E.S. The Cathedral and the Bazaar; O’Reilly Media Inc.: Sebastopol, CA, USA, 2001; p. 19. [Google Scholar]
- Haklay, M.; Basiouka, S.; Antoniou, V.; Ather, A. How many volunteers does it take to map an area well? The validity of Linus’ law to volunteered geographic information. Cartogr. J 2010, 47, 315–322. [Google Scholar]
- Rahman, M.M.; Hay, G.J.; Couloigner, I.; Hemachandran, B.; Bailin, J. A comparison of four relative radiometric normalization techniques for mosaicing H-res multi-temporal thermal infrared flight lines of a complex urban scene. Remote Sens. Environ 2014. in press.. [Google Scholar]
- MaxMind. How Accurate Are Your GeoIP Databases? Available online: http://maxmind.com/en/faq#accurate (accessed on 20 February 2014).


| Roof Material | Emissivity (ɛ) | Tkin (°C) |
|---|---|---|
| Asphalt Shingles | 0.90 | 22.69 |
| Cedar Shakes | 0.86 | 26.07 |
| Concrete Tiles | 0.95 | 18.72 |
| Rubber | 0.93 | 20.27 |
| Slate | 0.96 | 17.95 |
© 2014 by the authors; licensee MDPI, Basel, Switzerland This article is an open access article distributed under the terms and conditions of the Creative Commons Attribution license (http://creativecommons.org/licenses/by/4.0/).
Share and Cite
Abdulkarim, B.; Kamberov, R.; Hay, G.J. Supporting Urban Energy Efficiency with Volunteered Roof Information and the Google Maps API. Remote Sens. 2014, 6, 9691-9711. https://doi.org/10.3390/rs6109691
Abdulkarim B, Kamberov R, Hay GJ. Supporting Urban Energy Efficiency with Volunteered Roof Information and the Google Maps API. Remote Sensing. 2014; 6(10):9691-9711. https://doi.org/10.3390/rs6109691
Chicago/Turabian StyleAbdulkarim, Bilal, Rustam Kamberov, and Geoffrey J. Hay. 2014. "Supporting Urban Energy Efficiency with Volunteered Roof Information and the Google Maps API" Remote Sensing 6, no. 10: 9691-9711. https://doi.org/10.3390/rs6109691