Remote Sensing for Landslide Investigations: An Overview of Recent Achievements and Perspectives


Abstract
: Landslides represent major natural hazards, which cause every year significant loss of lives and damages to buildings, properties and lifelines. In the last decades, a significant increase in landslide frequency took place, in concomitance to climate change and the expansion of urbanized areas. Remote sensing techniques represent a powerful tool for landslide investigation: applications are traditionally divided into three main classes, although this subdivision has some limitations and borders are sometimes fuzzy. The first class comprehends techniques for landslide recognition, i.e., the mapping of past or active slope failures. The second regards landslide monitoring, which entails both ground deformation measurement and the analysis of any other changes along time (e.g., land use, vegetation cover). The third class groups methods for landslide hazard analysis and forecasting. The aim of this paper is to give an overview on the applications of remote-sensing techniques for the three categories of landslide investigations, focusing on the achievements of the last decade, being that previous studies have already been exhaustively reviewed in the existing literature. At the end of the paper, a new classification of remote-sensing techniques that may be pertinently adopted for investigating specific typologies of soil and rock slope failures is proposed.1. Introduction
Landslides are major natural hazards, causing every year enormous “direct” loss in terms of lives, damages to buildings, properties and lifelines [1,2]. In addition, landslides have a relevant “indirect” cost for the society, encompassing loss of productivity, reduction of real estate value, loss of tax revenue, and other induced economic effects [3,4]. Early predictions and warnings are then essential for mitigating such impact, fostering research in this direction. At the same time, the development of new technologies has been the other pillar which gave great support to that. Among these, one of the most important contributions has been the impressive development of remote-sensing techniques since the early 70s. Remote sensing (RS) refers to the science aimed at collecting Earth Observations (EO) by using non-contact techniques [5]. According to this general definition, a variety of different sensors are available today, which may be implemented on ground-based, airborne and spaceborne platforms [6]. Moreover, the integration of RS with sensor networks including geodetic, geological, geotechnical and environmental observations, as well as numerical models seems to be a very promising opportunity to analyse and reduce the landslide risk [7].
Remote sensing for landslide investigation is widely documented in the recent literature. Also, this journal recently published a special issue on this topic [8]. In the two most comprehensive reviews [9,10], applications are categorized into three main groups:
landslide recognition, classification, and post-event analysis;
landslide monitoring (i.e., monitoring the activity of existing landslides); and
landslide susceptibility and hazard assessment.
Each domain has been further subdivided on the basis of the adopted sensor technology. The same sensors and measurements may be employed for different purposes: landslide classification, landslide monitoring or, again, landslide forecasting.
A decade since the latest review of Metternicht et al. [10], this paper would like to deal with the current capabilities of RS in landslide investigation. The authors would like to address future perspectives on the basis of recent achievements and to consider sensors whose data have not been fully exploited up until now.
The first part of this paper will describe the state of the art in the fields of landslide recognition and inventory mapping (Section 2), landslide monitoring, including change detection and deformation measurement (Section 3), and landslide hazard assessment, spatial analysis and prediction (Section 4). In a successive step, an attempt is made to subdivide the most effective and promising applications according to the categories of landslides that may be studied on the basis of each RS technique (Section 5). Landslides are classified here according to the consolidated scheme published in Cruden and Varnes [1] and Varnes [11]. In Section 6, some conclusions will be drawn.
2. Landslide Recognition
The term landslide recognition includes all those activities aimed at recognizing past landslide events that occurred in a specific region. All these techniques allow feeding databases and building inventories for landslides. Malamud et al. [12] defined landslide inventory maps as a spatial distribution of landslides represented at a predefined cartographic scale. According to Mantovani et al. [9], optical images with a scale of about 1:10,000 or above should be used for production of such inventories. In fact, the recognition of landslides involves the investigation over large areas. As a consequence, a variety of slope instabilities are taken into account, usually, all portrayed in a single map. Alternatively, an inventory map for each type of landslide can be built. Landslide maps prepared by collecting historical information on landslide events are called geomorphical inventory maps [12], which can be further classified as historical, event-driven, seasonal or multi-temporal inventories [13].
Preparation of a landslide inventory relies on the following main assumptions [13]: landslide events leave visible marks on the territory, hence visual image interpretation of (stereoscopic) aerial photographs, satellite images, or digital representations of the topographic surface may help the recognition process. The study of variations in terms of image intensity, texture and pattern, shape and lineaments has to be related to the expected ground conditions or landforms associated with possible slope instability processes. Most of these signs are correlated to landslide morphology, which is strictly dependent upon the slope failure type (i.e., fall, flow, slide, complex, compound, see [14]) and the displacement rate of the mass movement [1]. Last but not least, “The past and present are keys to the future” [15]: landslide inventory maps are often used as background for further analysis, i.e., landslide hazard zonation and susceptibility analysis, being failures more likely to occur under the same conditions observed in the past. In addition, multi-temporal inventories can be also used for landslide monitoring, because they show the evolution of landslides over time.
Four main kinds of RS data types are used for landslide recognition: optical, thermal and microwave radar images, and laser scanning data. In such categories of applications, optical and thermal RS are usually accomplished from airborne and spaceborne platforms and rarely from ground-based platforms. Microwave sensors are installed on airborne, spaceborne and ground-based platforms. Laser scanning is implemented in airborne and ground-based platforms.
Conventional methods for building a landslide inventory are field survey and aerial photo interpretation. Advantages and limitations of these two methods were exhaustively presented in previous reviews and are not recalled here [12,13]. Nowadays, the operations on the ground are mainly carried out as support and integration of RS techniques, while in the past they represented the major burden for landslide inventory mapping.
In recent years, research in landslide recognition field has advanced in three main directions: (i) exploitation of high-resolution digital elevation models (HR-DEM’s); (ii) automation of feature extraction and analysis of images, including panchromatic, multispectral, hyperspectral, and synthetic aperture radar (SAR) data; and (iii) integration of different kinds of RS data. These categories will be discussed in the next subsections.
2.1. Optical Passive Sensors for Landslide Recognition
Optical sensors exploit the visible region of the electromagnetic spectrum, including visible, near infrared (NIR), and shortwave infrared systems. Ground-based, airborne and spaceborne platforms are commonly used. Regarding aerial platforms, unmanned aerial systems (UAS), often named as unmanned aerial vehicles (UAV), represent a very promising tool for landslide recognition, because they can be operated at very low height and, consequently, allow better precision and geometric resolution. UAV’s have the capability of reaching areas which are not accessible from ground and difficult to be flown over with manned aircrafts [16–18].
The most widely used optical RS tools are: different types of aerial images, video-cameras, high resolution images (HR) and very high resolution images (VHR) from satellite sensors, multispectral and hyperspectral sensors.
Broadly speaking, optical sensors are suitable for studying shallow instabilities, chiefly rotational and translational slides, earth and debris flows, but there are applications also to investigate complex earth movements thanks to the capability of extracting geomorphic features and the wide ground coverage.
Image interpretation, which can be operated with manual, semi-automatic and automatic approaches, has been traditionally based on aerial photos and then extended to ground-based and satellite images. Aerial photo interpretation (API) in general underwent several transformations and improvements in the last decade: analogue aerial photos have been replaced by digital images that can be directly acquired with digital aerial cameras (DAC, see [19]), characterised by an improved radiometric resolution and a simpler processing chain. Images from digital aerial cameras allow an easier interpretation, especially in dark or shadow areas. Moreover, several cameras allow also the contemporary acquisition of NIR images which can be exploited to compute the vegetation indexes [20], particularly helpful for recognizing deep-seated landslides because they are usually covered by vegetation, whose changes are difficult to be detected by using only the images in the visible spectrum.
The coming of satellite optical imagery opened up new possibilities in the use of visual interpretation for landslide investigation (see a database of operational and future missions by the Geospatial Data Service center of Dutch National Aerospace Laboratory [21]). At the beginning, sensors had a low spatial resolution, in the order of 10–30 m (e.g., Landsat, SPOT 1–4). In the middle of the 90s, starting with IKONOS images, HR and VHR optical sensors were born, characterised by more outstanding properties in terms of spatial resolution, number of multispectral channels, repeat time, image quality, global coverage, and stereo mode [22]. Some papers have been published in recent years on the visual or analytical interpretation of satellite images, mainly based on HR/VHR data [23,24]. Comparison of landslide inventories obtained from aerial photos vs. HR/VHR satellite images showed that the new data source can provide equivalent results even in areas where landslides have left faint signs only [25–27].
Manual visual interpretation of images, including the use of stereo-vision, is efficient anywhere landslides have left any visible signs (e.g., in the case of fresh landslides or in forests where vegetation changed). In fact, in the literature, visual interpretation of optical imagery has proved to be particularly useful for mapping shallow landslides, because after an event the boundaries between depletion, transport, deposition areas and the unaffected terrain are usually distinct. On the other hand, it is very difficult to recognize the boundaries of deep-seated and large complex slope movements, even for fresh failures, being the boundary between the stable terrain and the failed mass often transitional. Moreover, the older the landslide, the more indistinct become the borders. This is due to different causes: local adjustments of the landslide, new slope failures, earth filling, erosion, and land cover changes [12,13].
Stereo-vision, which is one of the most widely used techniques for topographic 3D mapping, represents a basic tool for landslide recognition. Indeed, some landslide features are detectable only with the support of the third dimension. If a couple of stereo-images are available over the study area, stereo-vision is also possible from HR/VHR satellite imagery, see for example [28]. Panchromatic and RGB images can be fused together to exploit the high geometric resolution of the former and the better radiometric information of the latter with a process called pansharpening [22].
Image interpretation is particularly suitable for the back analysis, using pre- and post-event images [24]. Additionally, the constant repeat time of satellite sensors can be exploited to derive multi-temporal and seasonal inventories [25,29–31], which can be considered as a first step towards landslide monitoring [32,33]. Another advantage is the wide coverage offered, which can be, for instance, exploited for investigating deep-seated rockslides [34]. Main drawbacks of visual interpretation are the uncertainty of outputs, the subjectivity and the strict dependency on human expertise.
Recently, many efforts have been made to “automate” RS data interpretation in order to improve the efficiency and to help the experts during the recognition process [35]. Indeed, the extraction of features or the classification of areas where typical signs of landslides are present is generally a complex task, owing to the large number of possible scenarios and variables.
Traditional algorithms for classification of RS data are called pixel-based: they consider the spectral information associated to each pixel without considering correlated signals in the neighbourhood. An example is the image difference method exploited in several studies for change detection [30,32,36–38]. As stated by Martha et al. [39], considering the resolution of HR/VHR data and the typical size and distribution of landslides, pixel-based techniques are highly error prone. Therefore, in the last decade there was an increasing interest in considering the spatial context of every pixel that led to the development of algorithms for object-based landslide recognition, such as object-based image analysis (OBIA) [40]. Semi-automatic algorithms for landform classification of HR/VHR imagery treat landslides as features composed of aggregations of pixels instead of spatially uncorrelated cells. The size of aggregations can be different, but also variable within the same method, as proposed by Lu et al. [41]. In the recent literature, automatic classification of optical images has been applied to orthophoto time series for the recognition of shallow slope instabilities [33]. OBIA stepwise procedure was used on SPOT-5 panchromatic images and orthoimages to map translational and rotational slides and rock slides [42]. In Stumpf et al. [43] a region-based active learning (AL) algorithm, which belongs to supervised classification methods, was performed on multi-temporal VHR optical images to recognize large scale shallow landslides. Automated analysis and visual inspection of HR RapidEye images, integrated to field reconnaissance and historical records, have been exploited to detect and characterize 250 landslides in Southern Kyrgyzstan [44]. The method adopted here for the automatic analysis of multi-temporal HR satellite images is based on the integration of pixel-based and object based techniques, see [45].
An interesting alternative approach is presented in [46]: past landslides are detected on the basis of how they changed a river course. Visual interpretation of QuickBird images was used to this purpose.
Some important research contributions employed automated classification of optical images integrated with other RS data: in Mondini et al. [47] the normalized differential vegetation index (NDVI) was used with other change detection techniques for semi-automatic recognition and mapping of rainfall-induced shallow landslides and back-analysis, integrating pre- and post-event aerial photos, a HR-DEM obtained from airborne laser scanning (ALS), panchromatic VHR and multi-spectral HR data, as well as a previous landslide inventory map. OBIA technique was employed also for the detection of typhoon-triggered landslides, using images taken from a fixed-wing UAV equipped with a consumer grade camera and a Global Positioning System (GPS) receiver [48].
Surface visualization using 2D shaded relief images or 3D perspective view, fully integrated within most GIS and RS software systems, has become a core tool for the analysis of landscapes and landforms [49]. Nowadays, geographic WEB portals like Google Earth® or Bing MapsTM provide free 3D models, employable in the initial stage of landslide investigation, or even for extracting information on previous landslides [50,51] or validating inventories and databases. WEB portals also allow the publication of crowd-sourcing geospatial data [52] which could be useful to collect fresh information on landslides and help civil protection and governmental agencies. An example of this application is the platform Ushahidi, which was tested during Haiti earthquake [53].
In the literature, many authors coupled one satellite optical images and a DEM (e.g., from ALS) to obtain the so called pseudo stereo-vision, helpful for visual landslide detection analysis, like soil slips, debris slides, and debris flows [44,54]. An attempt to map rock falls is reported in [55]. In Alkevli and Ercanoglu [56] rotational earth slide flows (generally earth flows and some debris flows), and complex failures are mapped. DEM’s can be also derived from the application of dense image matching techniques [57] to HR/VHR satellite imagery [58], if ALS data are not available. Currently the major problem is related to the low precision achievable, which mainly depends on the GSD. Such precision may allow the application to fast moving landslides, where a large volume of earth or rock is moving.
Another promising data source in the category of optical passive sensors is given by hyperspectral images, gathered from both spaceborne and airborne sensors. The main difference between multispectral and hyperspectral sensors is the fact that in a single observation multispectral sensors generate three to six spectral bands ranging from visible to NIR [59], while hyperspectral sensors commonly may collect more than 200 spectral bands from visible to short-wave infrared (VSWIR).
Aim of hyperspectral RS in the geologic field is to quantitatively map the Earth surface composition (in terms of mineralogy or lithology) or to quantify rock or soil chemistry and physics by using spectral absorption features (see the review in [60]). In the last 30 years, several hyperspectral airborne and spaceborne sensors were developed by space agencies and by commercial companies, like NASA’s AVIRIS (Airborne Visible/Infrared Imaging Spectrometer), the Finnish AISA (Airborne Imaging Spectrometer for Applications), GERIS (Geophysical Environment Research Imaging Spectrometer) and DAIS (Digital Airborne Imaging Spectrometer), the Australian HYMAP (Hyperspectral MAPper). There are some satellite missions planned for the next years: EnMAP (Environmental Mapping and Analysis Program), where GFZ and DLR (German Research Center for Geoscience and German Aerospace Center, respectively) are developing a high spatial resolution (30 m) and off-nadir (30°) pointing feature hyperspectral sensor (expected launch in 2017), for fast target revisit (less than 3 days); NASA’s HyspIRI mission (Hyperspectral Infrared Imager, planned launch 2020), a low Earth orbit satellite hyperspectral sensor with a 60 m resolution at nadir, aimed at studying the world’s ecosystems and natural disasters by checking the type of vegetation and its health.
Since many sensors are still under development, in the literature there are few applications of hyperspectral sensors to landslide investigations. Despite that, there are some valuable contributions: for instance the application of principal component analysis (PCA) in hyperspectral data, correlated with results coming from digital terrain model (DTM) analysis, has been demonstrated to be a proper system to identify depletion and accumulation zones [61]. In Rudd et al. [62], hyperspectral AVIRIS imagery classified through an artificial neural network (ANN) was employed in debris-flow initiation analysis. In Ferrato et al. [63], a comparison between the use of hyperspectral and multispectral images for land classification is presented. In the literature, the integration of hyperspectral and ALS data was applied to measure parameters such as soil moisture content, vegetation coverage and surface roughness that can be correlated with slope instabilities [64].
2.2. Thermal Infrared Remote Sensing
Thermal infrared (TIR) imagery information applied to natural hazards is very transient, because changes in temperature in terrain and vegetation occur over daily and seasonal cycles, and are influenced by the weather, soil, climate, relief, slope aspect, and land-use practices [65]. TIR satellite missions seem to be more attractive in other research domains, for instance the analysis of the influences of urbanization on urban heat [66]. In the Landsat TM series, TIR sensors may provide images at 120 m resolution while ETM+ may reach 60 m but it has suffered from a well-known problem with the scan line corrector since 2003. Under the Copernicus programme (formerly GMES) of European Space Agency (ESA), Sentinel constellation will provide also TIR information through Sentinel-3, whose launch is planned for 2015 [67]. Other planned missions like NASA’s Hyperspectral Infrared Imager [68] still need several years to be launched. As a consequence of the poor resolution of TIR data from space, no detailed analyses over small landslides can be accomplished. However, also in the case of large and giant landslides spanning over several square kilometers, the available resolutions (500 m GSD for the TIR channel of Sentinel-3) cannot provide any outlook over processes related to slope failures.
Thermal IR data can be used to measure the relative difference of land surface temperature (LST) [69] in the different parts of a slope, which can be related to soil moisture and groundwater circulation. Both might be indicators of high hydrogeological risk [70]. Soil saturation is one of the most important factors in determining stability conditions and the activation of slope movements, especially shallow landslides, and should be evaluated together with real-time rainfall data for early-warning purpose. Both spaceborne and airborne TIR sensors (HCMM, Landsat TM/TM+, AVHRR, MODIS, ASTER, TIMS, ATM, MIVIS) can be used to collect observations on soil humidity. Another opportunity to derive LST is given by passive microwave RS data [71]: this data source is not affected by cloud cover, smoke and aerosol effects, as thermal RS is. On the other hand, further studies are needed to understand how to derive LST on a large scale [72].
Thermal IR imagery from ASTER have been successfully applied to map glacier related hazards, like rock/ice avalanches [73]. Rock slopes are particularly suitable to be studied by means of thermal RS data: some experiments have been recently carried out on the use of hand-held TIR cameras for mapping fractures in deep-seated rock slides and unstable cliffs (see an example in [74]). Limitations of this method are due to the still small resolution of such sensors, which can be used only for local applications, and the complexity of data interpretation. Indeed, a model relating observed surface temperature, water circulation and rock stability is difficult to establish. Coupling a TIR camera with a terrestrial laser scanner has recently revealed to be a great support for rock fall analysis, because it improves the spatial location of the thermal process [75].
2.3. Microwave Sensors
In landslide investigation, the most widely used microwave (or radar) sensor is Synthetic Aperture Radar (SAR), an active system capable of recording the electromagnetic echo backscattered from the Earth’s surface and of arranging it in a 2D complex value (amplitude and phase) image map. Spatial dimensions of such a map are the sensor-target distance, called line-of-sight (LOS), and the platform’s flight direction (see [76]), or azimuth. SAR sensors are implemented on spaceborne, airborne and ground-based platforms. Being an active sensor, the image acquisition is independent from the natural illumination and cloud coverage. For the purpose of landslide recognition, satellite SAR sensors are used, which operate in one of three bands: C-band (λ = 5.6 cm), L-band (λ = 23.6 cm) and X-band (λ = 3.1 cm). An up-to-date overview of past, current and future sensor missions along with their main properties is reported in [77].
The most important technique for exploiting SAR data in the geological field is interferometry (InSAR), which calculates the interference pattern caused by the phase difference between two radar images gathered at distinct times [78]. The phase difference contains multiple contributes (terrain roughness and topography, atmospheric effects, noise) and the possible ground displacement component in the LOS direction. Different solutions have been developed for modelling and filtering out unwanted effects in order to extract the displacement component by using differential InSAR (DInSAR) [77]. SAR images are affected by temporal and geometric decorrelation due to the non-simultaneous acquisitions. If corresponding pixels in SAR images do not feature a sufficient coherence value, it is not possible to compute a meaningful phase difference. Advanced DInSAR (A-DInSAR) techniques have been developed to improve the coherence of SAR images [79]. The basic concept here is to exploit long stacks of SAR images collected with the same sensor and possibly under the same geometry, to remove errors which worsen the quality of the final deformation maps. This approach has been also termed as multi-temporal interferometry (MTI) in [77], which thoroughly deals with this subject. Among MTI techniques, Permanent/persistent Scatterer Interferometry (PSInSARTM/PSI) since Ferretti et al. [80] has been successfully applied to detect surface displacements of slow landslides [81]. PSI may overcome the limitations due to the lack of coherence by identifying stable natural reflectors (coherent targets—CTs), which are coherent over long time intervals and allow a millimetre precision estimate of relative target velocity along the LOS. Unfortunately, the cost to pay when limiting the analysis to CTs is that some surfaces may not provide any points, for example in the case of vegetated areas, regions subjected to disruption and erosion between data acquisitions, and deep slopes. Buildings, infrastructures and rock outcrops are good scattering surfaces that may provide enough CTs, conversely [82]. Alternatively, the Small Baseline Subset (SBAS) [83] and similar methods do not limit the analysis to CT points, but they compute differential interferograms for multiple pairs of SAR images featuring the best values for the spatial baseline. On the other hand, the precision of detected displacements is inferior to PSI, but in some applications a better overview of wide-area deformation processes may be achieved. On the other hand, a recent trend goes in the direction of coupling multiple techniques and different kinds of SAR data to better exploit the properties of each of them (see, e.g., [84]).
The availability of ground displacements from InSAR processing may be exploited for two main purposes: the recognition of the area where active landslides are moving (see this subsection) and tracking the evolution of a failure process along time (also referred to as monitoring, see Section 3). In addition, InSAR processing can also help in the characterization of landslide deformations, see [85].
DInSAR techniques may indirectly provide indication on the state of activity of slow landslides (e.g., deep-seated gravitational slope deformation—DSGD) and this information can be integrated in existing landslide inventories [86]. In addition, DInSAR is helpful for locating the occurrence of new slope instabilities such as rotational and translational slides, rockslides, deep-seated landslide and flows [4,86–91]. MTI has been also used to recognize rockslides in [92], where both PSI and SBAS have been applied.
In the last decade, PSI has been also adopted for landslide inventory updating and landslide activity assessment. The main benefits of this analysis are multiple: better definition of boundaries of already detected mass movements, information about the state of activity and detection of previously unknown unstable areas. For example, in the framework of ESA-SLAM project, PSI was coupled with aerial and satellite optical image interpretation in order to update a landslide inventory [87]. An interesting spatial statistical approach, called Persistent Scatterers Interferometry Hotspot and Cluster Analysis (PSI-HCA) was presented by [91] with the aim of developing an automatic procedure for slow-moving landslides recognition (see also [93]).
A wide review of different experiences on the application of landslide recognition using MTI at regional, catchment and local scales are reported together with in-depth critical analysis in [77]. The authors proposed some guidelines for the application and the interpretation of MTI outcomes, including the preliminary mapping of SAR visibility based on topography and land cover, the use of multiple data geometry and the complementary integration of medium- and high-resolution SAR images, the selection of reference points (InSAR may provide only relative displacements that need to be related to one or more stable points), an accurate “manual” analysis of results to be cross-checked with other ground-based observations, GNSS observations, geological data, and geotechnical models, see [94].
Although native SAR imagery have been poorly exploited for landslide recognition, in the literature there are also some significant experiences of their application, both for updating landslide inventory maps and for mapping single and large landslides. In particular, textural analyses and interferometric techniques applied on SAR images were adopted by geomorphologists for characterising rockslides [93] and landslide debris from post-event images [78].
The presence of long archives of C-band (ESA ERS-1/2 and ENVISAT, Canadian RADARSAT-1/2) and L-band (Japanese J-ERS, ALOS PALSAR-1/2) data allows covering in an almost continuous manner most of the Earth’s surface since 1992. It seems quite promising the advent of the latest generation C-band (ESA Sentinel-1 satellites and the completion of Canadian constellation RADARSAT) and L-band (Japanese ALOS PALSAR-2 and SAOCOM constellation of two satellites) data, which will provide a global coverage at a much shorter revisit time (at the weekly rather than monthly level) over the next decade. This property could be exploited to map faster ground failure processes. The existing and the future high-resolution data in X-band (German TerraSAR-X 1/2 and Italian COSMO-SkyMED-1/2) can be useful for analysing local slopes, even though their applicability looks more interesting for landslide monitoring.
2.4. Airborne and Terrestrial Laser Scanning
The word laser defines sensors emitting a beam (or a pulse series) of highly collimated, directional, coherent and in-phase electromagnetic radiation. Instruments placed on airborne platforms are called airborne laser scanners (or LiDAR) and offer wide scale coverage. Ground-based sensors are usually named terrestrial laser scanners and help in local scale investigation. In Jaboyedoff et al. [95], a comprehensive review of laser scanning techniques applied to landslide investigations can be found.
After processing, airborne laser scanning (ALS) data may be resampled and filtered to produce HR-DEMs, see [96]. Thanks to the multiple-echo or the full-waveform capability, filtering of vegetation is a quite simple task that results in modelling the bare terrain also in densely forested areas [96,97]. Hence, the HR-DEMs derived from ALS allow the experts to detect new landslides and to correct the boundaries of known ground failures, as well as to improve field-survey-based inventories of landslides under forests in hilly vegetated regions [98–100]. This approach cannot be applied to rock faces, which have a complex morphology. This limitation can be overcome using a NIR camera for the automatic recognition of vegetation, as done by [101].
Hill-shaded visualizations derived from ALS HR-DEM’s help delineate morphological features of landslides [49]. Mainly, two different methods are applied for landslide detection: (1) the heuristic visual analysis of the topographic surface; and (2) the semi-automatic recognition of morphometric features [94].
In case (1), the use of HR-DEMs is comparable to 3D visualization of stereo aerial photos or HR/VHR data [102]. Here, the 3D effect is replaced by using contour lines, shaded-relief images, slope maps, or other kinds of visualization techniques describing the terrain derivative. ALS HR-DEMs can be also used to generate pseudo-stereoscopic images with the integration of texture from aerial or satellite images. Not many significant studies have been accomplished to compare inventories obtained from LiDAR data with the ones from aerial photo interpretation (API). In the literature, different types of slope instabilities have been mapped by means of ALS data: deep-seated landslides [103], complex landslides [104], rockslides [105], and shallow landslides [106].
The approach (2) consists in the semi-automatic analysis of morphometric features, for instance curvature or roughness of topography, for the recognition of different types of landslides [107–110].
Many authors demonstrated that the automatic extraction of geomorphic features from ALS-derived HR-DEMs (see [111]) is a precise and powerful tool for mapping and assessment of shallow landslides and bank erosion, by means of statistical analysis of the variability of the landform curvature [112]; deep-seated landslides, through supervised classification methods [113] or standard signal processing techniques [114]; and debris flows, with differenced ALS data [115]. Exploitation of the automated analysis of ALS data was used for post-event analysis, for instance mapping of earthquake-triggered shallow landslides [116], and detection of typhoon-triggered landslides [117]. Airborne laser scanning can be feasibly integrated with other RS techniques, such as aerial images, for geomorphological mapping and potential channelized debris flow location [118].
Terrestrial laser scanning (TLS) systems are composed by a laser rangefinder incorporated into a ground-based platform. The most used techniques for TLS data interpretation are 3D point cloud analysis and generation of HR-DEMs. In the literature, there are few applications of TLS techniques for landslide recognition, while it has been widely applied to landslide characterization and monitoring, especially for rock falls [94,119–122] and rockslides [105], or measurement of channels after debris flow disasters [123,124]. In Viero et al. [125], TLS was used for recognizing rotational slides that were partial reactivations of an old DSGD located in the Italian Alps. Terrestrial laser scanning was also employed for multi-temporal recognition of landslides [126].
Integration of data from TLS, field surveys and other techniques, e.g., laser rangefinder binocular and GPS, has proved to be suitable for building an inventory of rainfall-induced landslides, mainly shallow soil slides, shallow compound slide-earth flows, and translational slides [127]. Laser scanning integrated with UAV platforms proved to be helpful in rockslide detection [128]. RS techniques such as ALS, TLS and high-resolution photogrammetry were coupled with traditional field surveys to do a better quantitative characterization of rock fall source areas and to better understand the variables and the processes involved [129].
A last observation: in the literature there is lack of investigation on the use of bathymetric LiDAR sensors for the recognition of subaqueous landslides [130]: although some extended campaigns have been carried out to characterise them by means of geophysical techniques (see, e.g., [131]) and with high-resolution multi-beam bathymetry (see a review in [13]), few applications for detection and modelling of subaqueous landslides can be found in the literature, see [132].
2.5. Discussion
In Figure 1, an overview of RS techniques adopted for landslide inventory mapping is presented and in Table 1 the related literature contributions are listed. Visual interpretation and geomorphic feature extraction from ground-based and airborne photogrammetry, HR/VHR satellite data and HR-DEMs generated from ALS data sets seem to be the most suitable methods for landslide recognition and mapping.
In the last decade, manual techniques were more and more abandoned in favour of semi-automatic or fully automatic algorithms, which are faster and cheaper than traditional approaches. In addition, they also feature an adequate level of quality for the most applications [13]. At the current state of the art, the majority of the proposed solutions are still more semi-automatic than fully automatic.
While pixel-based automatic algorithms have been largely exploited for landslide recognition based on classification and change detection methods applied to optical images (mostly in the visible and NIR spectral bands), they have also shown important limitations owing to the neglected information from the neighborhood. To overcome this problem, the trend goes in the direction of object-based techniques that seem to be really encouraging for the future. They may also integrate other kinds of multi-spectral information, or merge images and topographic data as in the pseudo-stereoscopic images.
Research attention should be paid to the use of optical images acquired with digital aerial cameras for detailed studies in small regions. Moreover, most cameras may gather images in both visible and NIR wavelengths, whose information may be jointly exploited in automatic methods (e.g., for computing vegetation indices).
The availability of large archives of declassified satellite photographs dating back to the 60s gives now a great opportunity to carry out retrospective studies on past landslides. The main limitations of such data is their low resolution (tens of metres), but some data sets of high-resolution images are expected to be delivered soon.
Generally, more attention should be paid to pre-processing stage, especially when using analytical methods integrating more data sources, whose geometric and radiometric registration should be done with high care. Operations like image registration [133,134], pan-sharpening [22], and image ortho-rectification strictly influence the quality of final products obtained with semi-automatic methods [45], while they are less influential in heuristic techniques.
InSAR has also found its application to landslide inventory mapping: this technique is capable of providing information about the state of activity of slow landslides, information that can be integrated in the existing inventories [86]. The combination of InSAR with other techniques, for example API as proposed in [135], may help the landslide recognition process.
Airborne laser scanning data are very helpful for detection of DSGD, rotational and translational slides, thanks to some successful efforts in automatic geomorphic feature extraction from ALS HR-DEM’s. Automatic extraction of geomorphic features was proven efficient in terms of time consumption and validity also for landslide crowns and bank erosion mapping, although with some limitations in areas with complex morphology, where also other surface features not related to slope instabilities could be detected. Further developments should go towards the automatic extraction of the objects’ shapes [111].
3. Landslide Monitoring
The authors acknowledge the definition of landslide monitoring previously given in Mantovani et al. [9] and Matternicht et al. [10], i.e., the comparison of whatsoever landslide conditions over time [136].
There are two main approaches to the problem: (1) the qualitative assessment of the general conditions of a landslide-prone slope along time; and (2) the quantitative measurement of ground deformation and surface point displacements (also addressed as deformation measurement), variation of geotechnical or geophysical parameters, measurement of water table level, and the like [137]. RS techniques measure quantitatively changes on the surface of slopes, which are primary indicators to understand the development of landslides and to look for correlations with triggering factors [87].
Three main kinds of RS data are mainly used for this purpose: optical images from any available platforms; spaceborne and ground-based microwave data; ALS and TLS data [138].
3.1. Optical Remote Sensing
Optical remote sensing is mainly used (i) to give an overview on the development of the general conditions of a landslide and (ii) to measure ground deformations. Satellite and airborne sensors are mainly used for purpose (ii), because the GSD may be too large for detecting small ground displacements. In addition, some stable ground control points (GCP’s) are required to set up a permanent reference system to precisely compare data gathered at different times. Ground-based cameras are generally preferred for measuring deformations (ii), because of the small GSD and the chance to be implemented into fixed monitoring systems without relevant problems about image geo-referencing. UAV platforms carrying digital cameras have been already proved to be an interesting trade-off between ground-based and manned airborne/spaceborne data sets. Indeed, they may provide a smaller GSD together with a comprehensive nadir-looking view of the landslide scene.
Traditionally, visual analysis and image interpretation of optical images taken at different times has been adopted for the analysis of change detection during the landslide’s life. On the other hand, only a qualitative analysis may be accomplished in this way [134].
The measurement of deformations requires a series of repeated images which need to be accurately registered to allow the precise comparison of corresponding areas. One technique that has been successfully applied is digital image correlation (DIC) or optical-flow tracking [139], which may provide 2D displacements on the topographic surface on the basis of a single sequence of images. In Debella and Gilo [140], Least Squares Matching (LSM, see [57]) has been applied to evaluate the horizontal surface displacements of slow-moving landslides from repeated optical images (airborne and QuickBird data). Other applications where DIC techniques were applied along with HR/VHR satellite image (SPOT, QuickBird, OrbView, EROS) are reported in [141–143]. In case a HR-DEM of the area is available, 2D surface displacements obtained from single-camera systems can be projected onto the 3D surface to obtain a more realistic visualization of the deformation field [144]. Displacements in the image plane can be evaluated with accuracy of about 0.2 pixels [81,138], to be scaled in the object space. On the other hand, the result strictly depends on the quality and the geometry of image acquisition, thus it is not possible to weigh a precise reference value.
If 3D reconstruction is needed, at least a pair of stereo-images is required at any observation epochs to enable the application of photogrammetric techniques.
In the case of large landslides, monitoring could be afforded through the computation of volumes from photogrammetric stereo-plotting [145] or by comparing multi-temporal DEMs obtained from automatic surface reconstruction techniques. A precision of a few centimetres can be obtained when terrestrial images are used, depending on the average camera-slope distance. On one hand, there are systems based on fixed high-resolution optical cameras, developed for permanent monitoring over small areas of active landslides characterized by annual decimetre-level displacements, see [146]. Previtali et al. [147] described the repeated acquisition of images using a non-fixed camera along with a multi-station network. Here, the stability of the reference system is not guaranteed by the stable camera setup but using a set of GCPs. On the other hand, there are systems that exploit aerial photographs and VHR satellite imagery to cover wider areas, [141,148]. High-resolution optical images gathered from cameras carried onboard UAV systems have been exploited to detect deformations or changes over large areas [15,128].
Eventually, optical images can be integrated to other techniques, like Global Navigation Satellite System (GNSS) and geophysics investigations (see, e.g., [149] for deep-seated landslide analysis), or to TLS [121].
Although in the literature there are some significant contributions, the use of optical images for slope instability monitoring has three main disadvantages, disregarding the platform and the specific sensor adopted. A first disadvantage is the strong dependency from meteorological and illumination conditions. Secondly, automatic image matching techniques for surface reconstruction or tracking points suffer from the presence of vegetation. Airborne laser scanning (see next Subsection 3.3), instead, is more efficient for this purpose, having the capability of penetrating the vegetation layer and to gather the bare ground surface. Last but not least, the accuracy and resolution of the observed displacements depend on either the geometry along with images have been acquired, the GSD and the availability of suitable images along time. This problem becomes even more critical when stereo-images are required for 3D reconstruction.
3.2. Microwave Remote Sensing
In the last 25 years, microwave RS has been widely exploited for computing slow ground deformations coupled with differential interferometric data processing techniques (DInSAR). An introduction to radar sensors and principal processing techniques has been already reported in Subsection 2.3. Here, the author would like to give a general insight and review the main achievements and future perspectives of the application of microwave RS to landslide monitoring, since some comprehensive reviews are already available in the literature [77,150].
DInSAR techniques are very suitable for monitoring slow-moving landslides, because they are capable of measuring millimetre scale deformations, thanks to sensitivity in the order of a little fraction of the radar wavelength (from centimetres to a few tens of centimetres depending on the adopted band). Additionally, the availability of long time-series (or stacks) of historical SAR images allows investigating the evolution of a geological process over time. Unfortunately, this high potential in general cannot be completely exploited in real applications due to some limitations of DInSAR methods (see [79]), which can be grouped into: (i) sensor dependent; (ii) topography dependent; and (iii) signal processing technique dependent. Group (i) collects issues related to the repeat time and the phase (λ) of the radar signal: the revisit time in the case of ERS and ENVISAT satellites is 35 days, while with the most recent sensors it is shortened up to 2 days (e.g., COSMO-SkyMed data); the phase ambiguity defines the maximum deformation size (dmax = 0.25λ) that can be measured between two successive passes (dmax = 14 mm and dmax = 8 mm for C-band and X-band sensors that are commonly adopted), limiting the application of DInSAR techniques to monitor slow landslides. In some cases, where the direction of displacements along LOS is already known, this information may be used to partially fix the ambiguity and extend the detectable deformation up to 0.5λ. Regarding topography (ii), the applicability of DInSAR may be prevented on the steep slopes or narrow valleys, where the radar visibility might be reduced, or when layover or shadowing might occur [76]. The last limitation (iii) is due to signal decorrelation, mainly due to noise in the signal phase and to image registration.
As addressed in Crosetto et al. [151], a further advancement in DInSAR processing has been achieved with the so called Advanced DInSAR (A-DInSAR), also defined as MTI (see subsection 2.3), which can be applied if long stack of SAR images is available over the same area. In the application for monitoring the evolution of a landslide over time the Permanent/persistent Scatterer Interferometry (PSInSARTM/PSI) has been the most popular technique up until now. PSI requires a long stack of images (at least 15 according to [152]). The knowledge of LOS direction is exploited to decompose the displacement of every coherent target (CT, see Subsection 2.3) into the vertical and horizontal components in East-West direction, being the latter less accurate. Indeed, satellites are running along a quasi-polar orbit from North-to-South and vice versa, and because of the side-looking angle of the sensor, any places can be illuminated two times along the ascending and descending paths. The analysis of both series, although has to be independently carried out, may enrich the knowledge of the East-West component of the displacement vector. On the other hand, no information in the North-South direction can be derived from interferometric analyses. Recently, some authors developed PSI techniques to improve the horizontal component of displacement, for example by combining sparse points from ascending and descending orbits in a neighbourhood [153]. Usually CTs are extracted on natural or manmade features; see a few examples in [154]. In some cases, artificial corner reflectors can be placed to track points in specific positions [155–157].
Up until today, several PSI techniques have been developed by different groups in addition to original PSInSARTM [80], see [158–162]. The trend of most recent developments is to enlarge the number of extracted CTs in areas with low coherence such as mountain slopes, which are often overgrown by vegetation and may be subject to frequent changes and disruption on the surface. Consequently, a combination of different complementary A-DInSAR methods and SAR images may help this purpose.
The application of PSI for landslide monitoring has been demonstrated to be quite successful since the beginning [163]. The recent literature reports several experiences on the use of A-DInSAR (including PSI) for monitoring different types of landslides: permafrost slide instability [164]; slow moving landslides, [165–171], and soil creep movements [172]. Also, a successful application for monitoring of complex rock mass movements is reported in [173].
As an alternative to InSAR, surface points may be tracked using sub-pixel image correlation techniques in the radar intensity image, in a similar way than with optical images (see Subsection 3.1). This approach may provide point displacements in a plane that is orthogonal to the LOS direction. Although a lower precision is achievable (approx. 0.1 pixel size), this non-interferometric approach may overcome four drawbacks of InSAR techniques: (i) the need of areas showing high coherence over time; (ii) the limitation to measure unambiguous displacements (dmax = 0.25λ); (iii) the dependency of the interferometric phase on the atmospheric conditions; and (iv) the impossibility of tracking surface displacements in the North-South direction. On the other hand, the current availability of high-resolution X-band SAR images gives higher relevance to non-interferometric techniques. For example, Raucoules et al. [174] presented the application to the measurement of surface displacements of La Vallette landslide (France), based on TerraSAR-X high-resolution data. The chance to obtain 3D deformations by combining ascending and descending tracks is reported in [175], while [176] discussed the combination with DInSAR methods.
Several papers also report about the integration with in-situ sensors, GNSS networks, photogrammetry and ALS [177–180]. Some research works specifically focused on the interpretation of results with respect to physical process and in-situ sensor observations [31,173,181,182]. Indeed, the comparison and cross-validation with reliable and accurate data is of paramount importance to assessing the quality of InSAR outputs, as discussed in [77]. On the other hand, some efforts have done to cope with the intrinsic validation of these data, e.g., by exploiting the data redundancy offered by long stacks [183].
The recent high-resolution SAR constellations offer data with unprecedented capability for landslide monitoring. First of all, the shorter revisiting time of latest X-band sensors (2, 4, 8, and 16 days for COSMO-SkyMed, depending on the image acquisition mode, 11 days for TerraSAR-X), C-band RADARSAT-2 (24 days) and recently launched Sentinel-1 (6 or 12 days) allows to follow faster landslides [184] and to reduce the time needed for early-warning purposes. Moreover, it permits building interferometric stacks more quickly. Some first applications are reported in [169–171,185] for TerraSAR-X and in [186] for COSMO-SkyMed data.
Many research projects have been funded, in particular by the European Union, on the implementation of InSAR techniques into standard public bodies’ practices for public security and protection from natural hazards, e.g., the Terrafirma project of GMES service (Global Monitoring for Environment and Security) of ESA [187]; the DORIS project funded by the 7th Framework Program of European Union [188]; and the SLAM project of ESA [87].
Ground-based SAR (GBSAR) systems (see [189]) have been proven to be useful tools for landslide monitoring [4]. Since the first sensors appeared at the end of the 90s, unstable slopes have been one the most important targets of this technology [190,191]. GBSAR allows overcoming the main drawbacks of satellite-based InSAR, because the repeating time is drastically shortened, by up to a few minutes: in fact, it has the capability to monitor slow displacements that occur over long periods as well as rapid movements (up to 1 m/day), see [192]. Displacements at the sub-millimetre level can be measured between two successive passes. The point density is quite high, being possible to obtain measurements on areas of a few square metres, with an operational range up to 1–2 km, with a related increase of the atmospheric disturbance [189]. The short revisiting time makes long stacks of SAR images available, which can be processed with A-DInSAR algorithms. On the other hand, the main drawbacks are: (1) the strong influence of vegetation, limiting the application to bare rock or sparse vegetated slopes; and (2) the complexity of system logistics, being current instruments still cumbersome. Indeed, the radar sensor can be used in two different modalities, depending on the velocity of the observed landslide. In the case of faster landslides, a permanent installation is required, where a single GBSAR is dedicated to monitoring a specific slope. For example, in front of the “Ruinon” landslide (Alta Valtellina, Italy) the GBSAR instrument LISAlab (Linear SAR) permanently monitors the DSGD [191,193]. In the case of slower landslides, the system is re-positioned in the observation station, where a basement should be fixed to the ground to allow the precise setup at any epochs.
Several applications on different types of landslides have been accomplished in Italy: complex movements [190,194]; slow moving landslides [195]; DSGDs [192,196,197]; and volcano slope instabilities [198]. In some cases, permanent GBSAR installations are used in the current practice of landslide monitoring, not only for scientific purpose. In other cases, the instrument is placed only for a limited period to cope with emergency situations [199]. Other authors have investigated the integration of GBSAR to other sensors (e.g., with TLS, see [200]) to gather observation on both surface and subsurface [201].
As in the case of satellite SAR processing non-interferometric techniques based on sub-pixel image correlation have been applied along with GBSAR data [202].
3.3. Airborne and Terrestrial Laser Scanning
The basic principle for both ALS and TLS systems when used for monitoring purposes is to derive HR-DEMs of at least two epochs, in order to subtract them and to obtain distances between data sets [94]. Monitoring through laser scanning has the main advantage of providing the complete displacement field for the whole landslide body, not limited to single-point measurements as in the case of in-situ sensors. The main limitation is related to the velocity of the landslide under observation, which defines the accuracy of point measurements. Hence, the use of ALS is quite limited, being the accuracy of ALS derived HR-DEM (approx. ±15 cm) lower if compared to the one obtainable from TLS measurements (about ±1.5 cm at 100 m).
Time series analysis of HR-DEMs from airborne photogrammetry and ALS were adopted to quantify mass wasting processes during landslide reactivation events of large scale roto-translational earth slides–earth flows [203] and river bank erosion, which can be source of debris flow [204]. HR-DEMs from ALS data were suitable to be integrated with hyperspectral airborne images for monitoring an active, large earth flow with a rapid to moderate displacement rate [62]. Three-dimensional ALS data have been also employed for the characterization of rock mass: in [205] a semi-automatic approach for estimating the orientation and position of rock mass discontinuities from ALS data is proposed.
More popular has become TLS, as reviewed in [95,206]. Since Bitelli et al. [207], TLS has been widely applied for monitoring landslide displacements by comparing the surfaces gathered at different epochs. Broadly speaking, TLS is applicable when the velocity of surface displacements is compatible with instrumental precision, see [208,209]. The capability of monitoring slow-moving landslide using TLS was assessed by [210]. The presence of vegetation, which prevents the acquisition of the bare rock, might affect the application in mountain areas: to get rid of this drawback, recently some authors investigated instruments with full-waveform capability, which seems to be the main way to cope effectively with the problem [211,212]. An alternative approach proposed by Alba et al. [213] is based on the integration of a laser scanner and a low-cost NIR camera to be used for vegetation filtering on the basis of a vegetation index. In Baldo et al. [214], a complex translational landslide consisting in widespread badlands and rapidly evolving mudflows was monitored by means of an experimental system based on integrated TLS and GPS.
Application of TLS have been carried out for monitoring displacements in rock slopes [215] when these can be decomposed into solid blocks and each of them can rigidly move [105,125,216,217], or when displacements are larger than the instrumental precision [218–220]. The employment of TLS becomes more challenging when the sought deformations are closer or inferior than the instrumental precision. One approach is to exploit the data redundancy given by the high-density of laser point clouds for smoothing noise by means of filtering or interpolation with regular surfaces [144,221–225]: this roadmap seems very promising, although, until now, it has been tested on small case studies, synthetic data or rock samples.
In Ghuffar et al. [226], an application of 3D flow tracking is introduced to cope with the analysis of 3D deformation dynamics of a landslide triggered by river erosion at the toe.
Another precursory indicator of rockslides and rock falls is the evaluation of the total amount of fallen blocks between two or more epochs [119–121,227]. According to Abellán et al. [215], only a few research works used TLS to study precursory signs in the period prior to the final collapse. These mainly entail the detection of some precursory rock fall events [228,229], the measurement of pre-failure deformation [218], or the observation of micro-seismic events [119,201,230]. In fact, increase of fragmental rock fall activity might be a precursory signal of major events (see, e.g., [228]), while decrease might be a sign of stabilization [229]. In Stock et al. [129], this task was achieved by integrating 3D data coming from TLS surveys and high-resolution images captured from terrestrial cameras. Results from [217,222] showed that TLS could be applied to detect millimetre scale displacements prior to a rock fall event. Detection of the most active areas might be also pursued by using mobile laser scanning (see [229,231]). In [123,232], the quantification of debris flow between two observation epochs was accomplished. Moreover, TLS and ALS can be combined for the quantification of a high-magnitude debris flow event [233].
As mentioned at Section 2.2, in [75] TLS and the transient infrared thermography were coupled to determine time variation of heating and cooling on the rock surface, allowing to improve the quality of the 3D rock mass geometry obtained from laser scanning.
3.4. Discussion
Figure 2 and Table 2 give an overview of RS techniques applied for landslide monitoring and the related literature contributions. The blockbuster role undoubtedly goes to A-DInSAR, whose application to this field, however, is still complementary to other sensors. This limitation is due to some well-known intrinsic problems of A-DInSAR (phase ambiguity, influence of atmospheric effects, temporal decorrelation), whose major consequence is that the location of observed areas cannot be discretionally chosen. On the other hand, results from A-DInSAR may provide a useful overview in many landslide scenarios.
More work should be done on the assessment of data quality of InSAR outputs, as well as on the integration of different satellite data sources and ground-based data into geospatial sensor networks [234]. In particular, satellite A-DInSAR is a suitable method for monitoring large areas affected by slow landslides, while GBSAR is more efficient for continuous monitoring of small sites. Future work should be done on the interpretation of “area-based” deformations they provide, and on the incorporation into early-warning systems. Eventually, the integration of “area-based” observations into the numerical modelling of slope mechanic is an interesting open field for future research, as already stated by some authors [235,236].
Among optical sensors, terrestrial imagery is a powerful and relatively low-cost tool, depending on the complexity of the permanent monitoring installation, if required. Thanks to automatic sub-pixel DIC, the 2D surface displacement field is built from the correlation of two or more optical images taken at different epochs. On the other hand, such systems suffer from the environmental conditions and they cannot operate at night and in the case of snow cover or fog.
Great impulse has been given in recent years on the comparison of HR-DEMs obtained from RS data, like optical aerial and satellite HR/VHR stereo-images as well as laser scanning. In particular, TLS systems have become important tools for reconstructing site-specific HR-DEMs, thanks to the high accuracy, high spatial and temporal resolution (as needed), coupled with easy data acquisition and transportability. The use of TLS data has been very effective for monitoring displacements in rock slopes affected by rockslides, rock falls and topples. Meanwhile, coupling surface observations from TLS to geophysical methods, like micro-seismic emissions, helped offer a more comprehensive outlook on slopes which are prone to rock falls [119,201].
4. Landslide Hazard Analysis and Prediction
The term hazard defines the probability of occurrence of a potentially damaging phenomenon within a specified period and within a given area [15]. Most hazard maps are still of qualitative nature and concentrate on determining the susceptibility, which can be seen as a relative indicator of the spatial probability of landslide occurrence [237].
Previous works investigated the role of RS and geographic information necessary for landslide susceptibility mapping as well as for hazard and vulnerability assessment [9,10,238].
In the literature, there are several modelling approaches to ascertain landslide hazards, which can be organized into four main categories of models [14,238–244]:
Landslide inventories;
Heuristic methods;
Geo-statistical approaches (data derived models); and
Deterministic approaches (physically-based models).
The aim of such models is to identify a relationship between landslide occurrence and predisposing or triggering factors [9,239]. This represents the input for the model that simulates the relationship between factors and landslide occurrence.
In the literature, landslide inventories are considered by many authors as the first step of hazard assessment and as elementary landslide hazard maps [9,10,30,37,58,238]. Information should include the state of activity, the prevalent type of slope movement, the primary direction of displacement, the estimated thickness of material involved in the failure process, and the historical records of known activity per each landslide [245]. Other authors derive triggering factors and frequency–magnitude relations from landslide inventories [246] using statistical models based on the frequency of past landslides [12,29,244,247]. In addition, the ground deformation field obtained from A-DinSAR techniques may be used for quantitative hazard and risk assessment of slow-moving landslides; see [248].
The choice of the appropriate model also depends on the scale of the problem and on the available data sets. The first three categories (i,ii,iii) are suitable for regional scale analyses, while deterministic approaches (iv), such as numerical modelling, equilibrium limit, and similar methods are more appropriate for local scale analyses, due to the huge input data that are needed.
Indeed, sometimes it is not possible to apply deterministic models because of the lack of necessary input [246].
Main categories of landslide predisposing factors are [14,15,237,247,249]:
Geomorphology: terrain mapping units, landslide inventory maps;
Topography (or morphometry): slope angle, slope aspect, elevation and curvature profile;
Geology: geological units, lithology, lineaments and tectonic structures;
Land cover: land use, vegetation cover, vegetation indices;
Hydrology: soil moisture, drainage system; and
Anthropogenic factors: transportation infrastructure, quarrying and mining, dams and reservoirs.
The relevance of the different predisposing factors in landslide susceptibility and hazard assessment depends on the considered landslide mechanism [249].
Earthquakes, heavy rainfall, snow and glacier melting, road cuts and other anthropogenic reasons, represent triggering factors, which may change over a short time frame [1,246]. Indeed, while predisposing factors are static, triggering factors introduce a temporal dimension [246]. Precipitation is considered as the main triggering factor. Some authors consider rainfall annual prediction also as a landslide hazard predisposing factor [250], because it is treated as an event with stationary probability over time. On the other hand, the effects of climate change have altered the time distribution of heavy-rain precipitations and storms, with intensification of anomalous and unpredictable events.
The contribution of RS to landslide hazard assessment (see [182]) consists in deriving various parameters related to landslide predisposing and triggering factors, as presented in the following Subsections 4.1 and 4.2. In addition, RS is largely used for detecting meteorological conditions and to forecast rainfalls and other severe events at global and regional scales (see Subsection 4.2) and for model validation (Subsection 4.3).
4.1. Predisposing Factors
4.1.1. Geomorphology
The first aspect to consider is geomorphology, in terms of terrain mapping units and past landslides. Indeed, a mandatory task for reliable landslide susceptibility assessment is the selection of an appropriate terrain subdivision, i.e., a mapping unit. Each parcel should feature homogenous properties under one or more predefined criteria [239,251]. The spatial resolution of sensors adopted in non-contact techniques is another important factor to consider in the definition of the mapping units. Even the choice of DEM resolution may be restricted by data availability and should always be done in the context of a specific analysis [252]. For example, in deterministic models HR grids may provide more accurate depiction of locations where landslides occurred, but they may also generate zones of addicted instability [253].
Geo-statistical approaches, like logistic regression, are sensitive to the number of cells included in the model [34]. All available methods to obtain the mapping units may be classified into one of the following seven groups: (i) grid cells, (ii) terrain units, (iii) unique condition units, (iv) slope units, (v) geo-hydrological units, (vi) topographic units, and (vii) political or administrative units [254].
4.1.2. Topography
Geo-processing techniques implemented in GIS environments allow the computation of some significant topographic terrain attributes, like slope angle, aspect, elevation and curvature profile on the basis of DTM processing [58,108,255]. Slope gradient is the most influencing factor for landslide hazard assessment and susceptibility mapping [239,246]: at local scales, it affects the concentration of moisture and the pore water pressure; at larger scales, it controls the regional hydraulic conditions [256]. On the other hand, in the research of [257], the slope curvature is suggested as the main topographic parameter for stability analysis, especially for earth flow and earth slides in clay soils.
Consequently, the real problem is the availability of up-to-date DTMs, for example from regional or national mapping agencies, geological services, or previous projects. If such digital models are not already available, a specific survey is required, an operation that may lead to a significant increase in the economic cost. Airborne photogrammetry and ALS are the most suitable techniques to provide DEMs with sufficient resolution and accuracy to afford landslide hazard analysis and assessment [25,58].
Generally, in hazard analysis the requirements for the DTMs are less severe than in the applications for recognition and monitoring of landslides: a spatial grid of the DEM in the range 2–10 m and a vertical accuracy in the order of ±1 m may suffice, depending on the characteristics of the specific site. Stereo HR/VHR optical data may be a valid alternative to generate DEMs for the purpose under discussion in this section. InSAR techniques may be used to provide medium resolution DEM’s [258]. ALS HR-DEMs are characterised by a higher spatial resolution (up to 1 m) and they can be exploited for extracting morphometric features even under forest, using both the heuristic visual analysis of the topographic surface and the semi-automatic recognition of morphometric landslide features [98,99,103,104,256,259]. In Dehls et al. [260], the combined use of satellite and ground-based InSAR has been applied for the classification of hazards in unstable rock slopes.
4.1.3. Geology
Interesting geological parameters are geological units, lithology, lineaments and tectonic structures. Since it is very difficult to obtain these features from RS data, in the literature they are derived from existing geological maps of the investigated area, which usually pay the disadvantage of having a small scale (in the order of 1:250,000). Selection of a proper scale is crucial to evaluate these parameters, as discussed in [9]. For instance, lineaments may be extracted from aerial photographs using edge enhancement and filtering techniques followed by field verifications [256]. Alternatively, Landsat ETM (Enhanced Thematic Mapper) images with 30 m × 30 m spatial resolution can be used to this purpose [261]. Hyperspectral sensors can give data on the earth surface composition [60].
4.1.4. Land Cover
Land cover, and particularly the change of land use, is an indicator of the state of the soil surface. Specifically, vegetated and bare soils have to be discriminated, just because erosion and runoff affect the bare soil. As said in Section 2.1, landslide-prone regions can be defined in areas of disturbed vegetation that can be recognized using vegetation indices [20,256]. These indices are usually evaluated from optical satellite images: for instance, Landsat ETM and SPOT [247].
Landsat MSS (MultiSpectral Scanner), TM (Thematic Mapper) and ETM may provide information on land use [247]. Some popular ready-to-use land cover maps are the ones in the CORINE (CoORdination of Information on the European Environment) series, which cover the area of the European Union [262] since 1990. Updates were made in 2000 and 2006, while the latest 2012 update is still under production. Other similar projects are under development in other countries. For example, in 2012 the National Geomatics Center of China released a first version of the 30 m land cover map of the whole Earth [263]. Other land cover maps are available for regional areas. The most severe problems when using these land cover maps are their reliability, depending on the data quality, the adopted methods for production, and the validation process.
4.1.5. Hydrology
Among the hydrologic parameters, soil moisture and saturation are the most influential in slope stability assessment. Therefore, such parameters together with real-time rainfall data are useful for both landslide monitoring and early warning. Both spaceborne and airborne thermal infrared (TIR) sensors (HCMM, Landsat TM/TM+, AVHRR, MODIS, ASTER, TIMS, ATM, MIVIS) can collect observations on soil humidity, as well as passive microwave RS, as discussed in [71]. For instance, [264] employed MODIS land cover information, while in [265] a soil water index (SWI) was derived by the ASCAT (Advanced SCATterometer) sensor onboard the MetOp (Meteorological Operational) satellite.
One of the most commonly used parameters defined in this class is the distance from drainage system. These data are obtained in a GIS environment by analysing geological maps, DEMs, land use maps and orthophotos [35,266].
4.1.6. Anthropogenic Factors
In the literature, anthropogenic factors are seen both as predisposing and triggering factors. For example, road-cuts are one of the most important anthropogenic causative factors of slope instability. The traditional method in most GIS-based studies considers the effect of roads on landslides through the definition of a buffer around them [237,267].
Other typical predisposing factors that are the consequence of human activities are related to quarrying and mining works. Artificial reservoirs and related hydraulic infrastructures may also result in the instability of slopes because of the infiltration of water.
4.2. Triggering Factors
Precipitation is one of the main landslide triggering factors that can be measured directly or indirectly. The former entails the use of rain gauges. The latter is based on RS techniques including optical sensors placed on geosynchronous satellites and radar images taken from polar and near-polar satellites. To the first group belong GOES (Geostationary Operational Environment Satellites), GMS (Geostationary Meteorological Satellite), and Meteosat. Examples of polar and near-polar satellites are: PR (Precipitation Radar), TRMM (Tropical Rainfall Measurement Mission), TRMM-TMI (TRMM Microwave Imager), SSMI (Special Sensor Microwave/Imager), AMSR (Advanced Microwave Scanning Radiometer) and AMSR/E (AMSR for EOS), NASA-EOS, the EOS Aqua satellite, and weather satellites from the Defense Meteorological Satellite Program of the National Oceanic and Atmospheric Administration (NOAA) of the United States [268]. Meteorological models, such as EPS (Ensemble Prediction Systems), LEPS (Limited area Ensemble Precipitation System) or deterministic LAM forecasts (Limited-Area Meteorological Models) are fed with rainfall radar data to predict precipitation fields [269]. All precipitation estimates contain uncertainty [270]: rain gauges provide a better estimate of the punctual precipitation amounts but do not output information on the spatial pattern, whilst radar rainfall estimates offer higher spatial coverage and are able to detect the spatial-temporal pattern of the observed precipitation field. On the other hand, they are not completely satisfactory in estimating the correct precipitation amount [249]. The prediction of rainfall intensity can benefit from correction of the effects due to local topography, as demonstrated in [271].
Physically-based models for landslide susceptibility can incorporate rainfall as a dynamic input of the model [272,273]. The use of ground-based meteorological radars for rainfall prediction and early warning in near real-time landslide forecasting is a very promising application. In the literature, some examples are reported, where rainfall estimates are combined with a deterministic landslide model and also with data from other triggering factors [269,274–277].
Seismic triggering factor is usually implemented into a landslide model by means of a peak ground acceleration (PGA) map with a 10% exceedance probability in 50 years. Such model could be used as input in infinite slope modeling [237]. Such PGA maps are available for most of the seismically affected regions through the Global Seismic Hazard Assessment Project [278]. In the literature, there are some models for earthquake-induced landslides (see a review in [279]), where PGA maps are used as input of the model [280,281]. The validation of the results showed that the ensemble model could provide good prediction rates.
4.3. Model Validation
Remote-sensing data may also contribute to the calibration of landslide hazard models. Once a model is established, data related to past events are used in a training area to calibrate the model through back analysis.
In a wide scale model (i.e., landslide inventories, heuristic methods and geo-statistical approaches), a visual or automated geometrical validation may be accomplished by comparing the known landslide location data with the landslide susceptibility map in terms of boundaries, area, area ratio, or pixel fraction, see [247].
In the case of local scale models, monitoring data can be useful for calibrating physically-based landslide hazard models [282,283]. As demonstrated in the previous sections, SAR sensors have become an effective way to investigate and manage landslide hazards. Although their prevalent application is for landslide monitoring, also in landslide prediction SAR data have been exploited. For instance, Bai et al. [280] carried out the calibration of a 1D infinite slope model by using the back analysis of continuous GBSAR measurements. Indeed, monitoring information of very-slow landslides can feed numerical models for prediction and for highlighting some active failure processes. For example, GBSAR data can provide precise knowledge on the boundaries of the landslide and the evolution in space and time [284]. Also at a wider scale, landslide hazard databases can be enriched by landslide activity information given by PSI [285].
4.4. Discussion
Application of RS for landslide hazard analysis and susceptibility mapping have undergone an impressive development in recent years. Indeed, their aim is the most important one in landslide investigations, being both landslide inventory mapping and indirect monitoring to forecast future failures and to mitigate their consequences, when possible. On the other hand, the three phases of landslide studies are intrinsically related. Landslide hazard assessment utilizes data from landslide recognition—mainly landslide inventory maps—which represent a static input. Then, data from landslide monitoring may provide a dynamic input or used for validating the hazard model.
In landslide hazard analysis, there is not a prevailing technique but very often data integration plays a fundamental role. On the other hand, here the data processing stage is more important than data collection.
In Figure 3, the generic workflow of the process for landslide hazard assessment is reported. Remote sensing techniques give three main contributions: (1) information on predisposing factors, (2) triggering factors, and (3) model calibration. In Table 3, the literature contributions on the use of RS technique for collecting information on predisposing factors are reported.Nowadays, the numerical codes are considered the most capable methodology for landslide hazard analysis at local scale. Unfortunately, numerical codes are very often unable to consider the high accuracy of data derived from RS. For instance, the HR-DEMs generated from laser scanning must be resampled at reduced resolution to feed some numerical models. Therefore, new efforts must be conducted in order to integrate sensors and computational tools.
Future research work should be addressed on the improvement of data integration. An effective approach to landslide forecasting should go through the integration of RS techniques into spatial sensors networks [234], which are able to gather various kinds of information from contact sensors, geotechnical sensors, and multi-platform RS techniques. Several authors followed this approach: RS and geotechnical instruments are employed to define the surface movements, while geophysical methodologies are applied to characterize the subsurface [7,286,287]. The use of multi-sensor data needs the development of an interface able to merge and integrate all information. The definition of sensor interfaces and communication protocols are very complex issues due to the different algorithms used for processing data from specific sensors. In this scenario, RS methods can be useful to recognize ongoing failure processes, to provide a general overview, and to locate specific areas where in-depth closer investigations are needed. One of the new frontiers of research is a major automation of this process, in order to replace the manual approach.
5. Remote-Sensing Techniques for Specific Landslide Types
Among the contributions considered in this review, here the authors would like to highlight the achievements in the analysis of specific types of landslides as classified in Varnes [11]. This classification, dating back to 1978 but still currently used worldwide, has been recently revised by Hungr et al. [288] to keep into consideration the achievements of recent studies and a better alignment between geological and geotechnical subdivision of soil types. On the other hand, this new organization of landslide types needs to be consolidated and has not been adopted here.
Table 4 shows a summary of RS tools applied to different types of landslides.
5.1. Falls
Terrestrial laser scanning (TLS) has proved to be the paramount technique for recognition, assessment and monitoring of rock falls and rock slides [215]. It can be employed for measuring precursory displacements prior to failure and for evaluating the total amount of fallen rock between two or more epochs. Of course, the application of TLS may be effective only if the unstable areas are already known and measurements are timely acquired.
Terrestrial laser scanning can be also employed to detect the slope geomorphology and to define the joint sets in the rock mass. Promising but not yet fully exploited is the automation of laser scan point cloud processing, which may allow the detailed characterization of rock joint set with higher performance compared to standard manual survey [119]. Recently, a new approach for semi-automatic calculation of the orientations and position of rock mass discontinuities from 3D ALS data has been presented [205].
Hand-held TIR cameras are helpful for mapping fractures in deep-seated rock slides and unstable cliffs [74]. Integration with TLS may be used to improve the spatial location of TIR data [75]. Meanwhile, integration of TLS to GBSAR and other measurement sensors seems to be promising, as discussed in [201].
5.2. Deep-Seated Landslides
Vegetation indices are particularly helpful for recognizing deep-seated landslides [20]. In general, optical images are not specifically suitable for the analysis of this type of slope failures, because they are usually covered by vegetation. On the other hand, they offer the advantage of the wide coverage that may be exploited for large investigations, such as deep-seated rockslides [34]. Automation of the recognition procedures and the integration of optical sensors with other RS techniques has proved to be very effective [42,141,172].
Airborne laser scanning (ALS) data found wide application in mapping deep-seated landslide [103], thanks to the multiple-echo or the full-waveform capability, which can be exploited for filtering overgrown vegetation and modelling the bare terrain also in forested slopes [98–100]. Automatic algorithms have been applied to this task, such as supervised classification methods [113] or standard signal processing techniques [114]. At the local scale, TLS was used for recognizing rotational slides that were partial reactivations of old DSGDs [125].
Persistent Scatterer SAR interferometry (PSI) is very suitable for monitoring large areas affected by deep-seated slow-moving landslides [156,166,171]. In the literature, there are some case studies in which deformations of slow-moving landslides have been measured with GBSAR [192,195–197].
5.3. Shallow Landslides
Expectations from RS in the analysis of shallow landslides are quite large because of the difficulty of using field data. This concern is chiefly due to the rapidity and the spatial diffusion of such kinds of slope failures.
Optical sensors are suitable for studying shallow soil instabilities, thanks to the capability of extracting geomorphic features and the wide coverage [27]. Visual interpretation has proved to be particularly useful for mapping, because after an event the boundaries usually are well distinct. Also, some automatic and semi-automatic classification algorithms have been tested in recent years [33,43,45,117]. The use of VHR satellite images (e.g., Formosat, Geo-Eye, Pleiades, World-View) has been demonstrated to offer good performance for the detection of shallow landslides and the creation of databases of susceptible areas [289].
The automated analysis of ALS data was used for post-event analysis, for instance for mapping earthquake- or typhoon-triggered shallow landslides [116,117]. Coupling ALS data and other RS tools may help the recognition of shallow landslides. ALS DEMs together with high-resolution orthoimagery have proved to be suitable for mapping rainfall- and earthquake-induced landslides [280]. The integration of HR-DEMs from ALS data, aerial photos, TLS data, field surveys, laser rangefinder binocular and GNSS observations found application for inventory of rainfall-induced landslides [45,127]. The visual interpretation of shaded-relief maps, slope maps and contour maps derived from a HR-DEM based on LiDAR data was applied to create a catalogue of shallow landslides in [106].
In the literature, rainfall-induced shallow landslides, are predicted using empirical rainfall thresholds or spatially distributed, physically based numerical models [273–277,290]. There have ben attempts to forecast them through models, which consider both predisposing factors, e.g., landform curvature [111] and the main triggering factor, i.e., rainfall [269].
5.4. Flows
Coupling one satellite optical image and a DEM (e.g., from ALS) to obtain pseudo-stereovision was helpful to recognize soil slips, debris slides, and debris flows, including their source, travel, and depositional areas [54,55].
Airborne laser scanning is feasible to be integrated with other RS techniques, such as aerial images, for geomorphological mapping and potential channelized debris flow location [118]. ALS data have been also integrated to hyperspectral images to monitor an earthflow [61]. Many research works demonstrated the potentiality of automatic extraction of geomorphic features from ALS HR-DEMs, including the detection of debris flow as well, see, e.g., [115].
Terrestrial laser scanning has been applied in debris flow characterization, e.g., for the measurement of channels after an event [123,124]. Regarding monitoring applications, TLS allows the quantification of debris flow between two observation epochs [123,232]. The combination of TLS and ALS for the quantification of a high-magnitude debris flow event has been proposed by [233].
Remote rainfall measurements have been also exploited for early warning of debris flows, see [276].
The analysis of erosion phenomena deserves a separate mention, which may contribute to the creation of debris flow in rivers and hence they may result in sediment supply being involved in subsequent landslides [226] or debris flows [291]. Estimation of eroded volumes is not straightforward: in the literature, there are some empirical formulae aimed at furnishing the magnitude of the sediment supply, but the best approach is to quantify it by means of laser scanning and photogrammetry [121,122,129,204,235].
Among the considered research contributions, there is a lack of automatic procedures to study debris and earth flows.
5.5. Complex and Compound Landslides
As for debris flow, pseudo-stereovision may help map rotational earth-slide flows (generally earth flows and some debris flows) as well as complex failures [56]. Digital image correlation (DIC) techniques can be applied to this type of landslide both at the local and regional scale, allowing the monitoring of landslides characterized by displacements of a few tens of decimetres per year at an affordable cost [144].
Microwave sensors have been also successfully used for monitoring of complex mass movements [172,174]. In recent years, GBSAR has been applied not only for monitoring of slow-moving landslides, but also for complex movements [190,194].
The time-series analysis of ALS HR-DEMs was used to quantify mass wasting processes during landslide reactivation events of large scale roto-translational earth slides/earth flows [203]. The integration of TLS with GNSS gave promising results for monitoring complex translational landslide [214].
Also, in the case of complex landslides, automatic procedures are less popular.
6. Discussion
In Section 5, the available methods for landslide investigation have been split according to the application to different typologies of slope failures. This new organization of the existing approaches has two principal purposes. The first one is to give to readers an overview of remote-sensing techniques and data that can be applied to specific slope instability problems. The second one goes in the direction of overcoming the traditional classification followed in previous reviews, since Mantovani et al. [9], and also implemented in the first part of this article. The limitation of the application-driven classification of remote-sensing is chiefly the fact that the same method may be used for multiple purposes and sometimes there is not a distinct separation between recognition, monitoring and hazard assessment of landslides. For example, multi-temporal landslide inventory mapping can be also seen as a monitoring application, according to the broad definition of “landslide monitoring” given in Delacourt et al. [6]. Similarly, deformation measurement is going to be more and more strictly integrated into the modelling phase (data assimilation) and thus connected to hazard prediction, see [292]. If the application-driven classification was fully suitable in the first decades when remote sensing was applied to landslide studies, nowadays the authors suggest that the previous rationale should be revised.
Additionally, the study of a landslide may be viewed under another two aspects: the spatial scale and the temporal scale. The spatial scale, i.e., the total area of the investigated landslide, is an important task in geomorphology, see [9]. The same holds for the choice of the sensors to adopt, including remote sensing. Therefore, for a regional problem, spaceborne InSAR and airborne laser scanning seem to be the most promising techniques. Instead, for a single slope ground-based InSAR or terrestrial laser scanning are the more appropriate solutions. On the other hand, also the temporal scale plays a relevant role in monitoring applications. Indeed, a creep process typical of deep seated gravitational landslides can be monitored by sensors with a long revisit time (weeks or months), such as SAR satellites. On the other hand, faster unstable phenomena such as rock falls need sensors with a shorter revisit time or continuous acquisition, like ground-based InSAR and terrestrial laser scanning. As a consequence, also the concept of real-time monitoring depends on the velocity of the geo-process to analyse. A slow landslide may be observed in real-time by using remotely sensed data with monthly revisit time, if these are enough to timely describe its dynamics.
Spatial and temporal scales are also strictly related to the economic sustainability of any application of remote sensing. In the case of satellite data, this mainly depends on three major components: the purchase of data, the cost of processing (this refers to software and hardware when data processing can be afforded by the users, or to the company fee when it is out-sourced), and the cost of man work. In the case of ground-based sensors, the cost of data is frequently replaced by the cost for buying or renting the required instruments. It is evident how much the sustainability of a specific technique depends upon the scale of the problem to study. In addition, the cost of the data sets may vary from sensor to sensor and is related to the required rate of observations needed to carry out timely investigations. In recent years, a general reduction of the data cost can be observed and new missions (like ESA Sentinel) will deliver data for free. It is difficult to analyse the economic sustainability of any remote-sensing techniques adopted for landslide investigations, a task that would require a specific study. On the other hand, the cost of a given methodology may limit the extension of the investigated area. For example, high-resolution and very high-resolution imagery (for optical or SAR sensors) are still quite expensive, so that their use may be bounded to a selected area where the landslide risk is higher due to the presence of vulnerable targets. A wider region could be investigated by using medium-resolution observations, whose cost is generally much lower or nought, with the aim to detect the critical areas to be focused in more detail using higher-resolution data. The analysis of direct and indirect costs related to landslides is also important to justify the economic investments in remote-sensing studies.
The new frontier in landslide investigation relies in the integration of different remote-sensing techniques among them and with contact sensors to form geospatial sensors networks [234]. Indeed, each single technique may not be informative in any situation and multiple sensors are required to provide a more complete framework of observations. Also, coupling with precise meteorological data and numerical models seems to be a promising strategy to obtain a more effective understanding of landslide mechanisms and then providing more reliable long-term predictions.
The development of automatic procedures for processing, analysing and understanding remote-sensing observations is another important task to focus on in the future. This will be more and more relevant to cope with the large amount of data obtainable from the future space missions which are specifically devised for Earth Observation (e.g., ESA Sentinel mission).
7. Conclusions
In this paper, an overview on the use of remote-sensing techniques for landslide investigations has been presented, with special emphasis on the achievements of the latest 10 years, and it remarks on those techniques that seem to be really promising in the future but still require further development. According to [9], the employed techniques have been divided into three main categories of applications: landslide recognition, monitoring, and a third group encompassing hazard zonation, susceptibility mapping and failure prediction. Furthermore, a new subdivision based on the typology of the landslide under investigation has been introduced in Section 5.
Remote sensing has been demonstrated to be useful for different purposes in the landslide risk analysis. In particular, recent improvements seemed very promising in the prediction of new events, which is the real challenge of the engineering geology scientists. This issue is generally quite complex and only in a few cases a real understanding of the slope can be achieved. Consequently, remote sensing may contribute to defining pre-alarm and alarm thresholds as well as in the reconstruction of a physical model close to reality—that is the starting point for understanding the slope stability and to design mitigation measures—if possible.
A last remark starts from considerations reported in Scaioni [8]: in many countries, remote-sensing techniques are now cast to a large extent into the regular practice of public institutions dealing with geo-hazard management. On one side, this is a research direction that needs great efforts in the future, to let the Landslide Science follow-up on downstream services in order to be beneficial to the society. On the other side, only if remote-sensing techniques are continuously used, they will lead to setting up long archives of data and outcomes of analyses, which is the only way to have a deeper and trustful understanding of physical processes leading to landslides.
Glossary
| ALS | Airborne Laser Scanner |
| CT | Coherent Targets |
| DAC | Digital Aerial Cameras |
| DEM | Digital Elevation Model |
| DIC | Digital Image Correlation |
| DInSAR | Differential InSAR |
| DSGD | Deep-Seated Gravitational-slope Deformation |
| DTM | Digital Terrain Model |
| GBSAR | Ground-Based InSAR |
| GCP | Ground Control Point |
| GNSS | Global Navigation Satellite System |
| GPS | Global Positioning System |
| GSD | Ground Sample Distance |
| HR | High Resolution |
| InSAR | Interferometric SAR |
| IR | InfraRed |
| LOS | Line of Sight |
| LSM | Least Squares Matching |
| MTI | Multi-Temporal Interferometry |
| NDVI | Normalized Differential Vegetation Index |
| NIR | Near-InfraRed |
| PSI | Persistent Scatterer Interferometry |
| RS | Remote sensing |
| SAR | Synthetic Aperture Radar |
| TIR | Thermal InfraRed |
| TLS | Terrestrial Laser Scanning |
| UAV | Unmanned Aerial Vehicle |
| VHR | Very-High Resolution |
Acknowledgments
Acknowledgments go to 863 National High Technology Research and Development Program of China (No. 2012AA121302) and the 973 Basic National Research Program of China (No. 2013CB733204). The authors would like also to thank all the anonymous reviewers who gave important suggestion on how to improve the quality and the completeness of this review.
Authors Contribution
Marco Scaioni was in charge of writing the introduction and the discussion subsections. He took care of the technical aspects of Remote Sensing data and methods described in the paper, while the other authors contributed with their experience on the applications for landslide investigation. Laura Longoni organized the article according to a new classification based on landslide typologies. Valentina Melillo was in charge of browsing the existing literature and scrutinizing the relevant contributes. She also wrote the first draft of the main sections of the paper and carried out the final editing. Monica Papini wrote the conclusions, contributed to the revision of the full manuscript and to the discussion subsections. The authors equally contributed to write this article.
Conflicts of Interest
The authors declare no conflict of interest.
References
- Cruden, D.M.; Varnes, D.J. Landslides types and processes. In Landslides: Investigation and Mitigation; Transportation Research Board Special No. 247; Turner, A.K., Schuster, R.L., Eds.; National Academy Press: Washington, DC, USA, 1996; pp. 36–75. [Google Scholar]
- Klose, M.; Highland, L.; Damm, B.; Terhorst, B. Estimation of direct landslide costs in industrialized countries: Challenges, concepts, and case study. In Landslide Science for a Safer Geoenvironment; Sassa, K., Canuti, P., Yin, Y., Eds.; Springer: Berlin, Germany, 2014; Volume 2, pp. 661–667. [Google Scholar]
- Schuster, R.L. Socioeconomic significance of landslides. In Landslides: Investigation and Mitigation; Transportation Research Board Special No. 247; Turner, A.K., Schuster, R.L., Eds.; National Academy Press: Washington, DC, USA, 1996; pp. 12–35. [Google Scholar]
- Canuti, P.; Casagli, N.; Ermini, L.; Fanti, R.; Farina, P. Landslide activity as a geoindicator in Italy: Significance and new perspectives from remote sensing. Environ. Geol 2004, 45, 907–919. [Google Scholar]
- Lillesand, T.M.; Kiefer, R.W. Remote Sensing and Image Interpretation; John Wiley & Sons: New York, NY, USA, 1979; p. 612. [Google Scholar]
- Delacourt, C.; Raucoules, D.; Le Mouélic, S.; Carnec, C.; Feurer, D.; Allemand, P.; Cruchet, C. Observation of a large landslide on la reunion island using differential SAR interferometry (JERS and Radarsat) and correlation of optical (SPOT 5 and Aerial) Images. Sensors 2009, 9, 616–630. [Google Scholar]
- Qiao, G.; Lu, P.; Scaioni, M.; Xu, S.; Tong, S.; Feng, T.; Wu, H.; Chen, W.; Tian, Y.; Wang, W.; et al. Landslide investigation with remote sensing and sensor network: From susceptibility mapping and scaled-down simulation towards in situ sensor network design. Remote Sens 2013, 5, 4319–4346. [Google Scholar]
- Scaioni, M. Editorial: Remote sensing for landslide investigations: From research into practice. Remote Sens 2013, 5, 5488–5492. [Google Scholar]
- Mantovani, F.; Soeters, R.; van Westen, C.J. Remote sensing techniques for landslide studies and hazard zonation in Europe. Geomorphology 1996, 15, 213–225. [Google Scholar]
- Metternicht, G.; Hurni, L.; Gogu, R. Remote sensing of landslides: An analysis of the potential contribution to geo-spatial systems for hazard assessment in mountainous environments. Remote Sens. Environ 2005. [Google Scholar]
- Varnes, D.J. Slope movements: Types and processes. In Landslide Analysis and Control; Transportation Research Board Special No. 176; Schuster, R.L., Krizek, R.J., Eds.; National Academy Press: Washington, DC, USA, 1978; pp. 11–33. [Google Scholar]
- Malamud, B.D.; Turcotte, D.L.; Guzzetti, F.; Reichenbach, P. Landslide inventories and their statistical properties. Earth Surf. Processes 2004, 29, 687–711. [Google Scholar]
- Guzzetti, F.; Mondini, A.C.; Cardinali, M.; Fiorucci, F.; Santangelo, M.; Chang, K.-T. Landslide inventory maps: New tools for an old problem. Earth Sci. Rev 2012, 112, 42–66. [Google Scholar]
- Soeters, R.; van Westen, C.J. Slope instability recognition, analysis, and zonation. In Landslides: Investigation and Mitigation; Transportation Research Board Special No. 247; Turner, A.K., Schuster, R.L., Eds.; National Academy Press: Washington, DC, USA, 1996; pp. 129–177. [Google Scholar]
- Varnes, D.J. IAEG Commission on landslides and other mass-movements. In Landslide Hazard Zonation: A Review of Principles and Practice; The UNESCO Press: Paris, France, 1984; p. 63. [Google Scholar]
- Colomina, I.; Molina, P. Unmanned aerial systems for photogrammetry and remote sensing: A review. ISPRS J. Photogramm. Remote Sens 2014, 92, 79–97. [Google Scholar]
- Nex, F.; Remondino, F. UAV for 3D mapping applications. Appl. Geomat 2014, 6, 1–15. [Google Scholar]
- Niethammer, U.; James, M.R.; Rothmund, S.; Travelletti, J.; Joswig, M. UAV-based remote sensing of the Super-Sauze landslide: Evaluation and results. Eng. Geol 2012, 128, 2–11. [Google Scholar]
- Petrie, G.; Smillie, K. Airborne digital imaging sensors and systems. In Advances in Photogrammetry, Remote Sensing and Spatial Information Sciences; Baltsavias, E., Li, Z., Chen, J., Eds.; CRC Press, Taylor & Francis Group: Boca Raton, FL, USA, 2008; pp. 45–62. [Google Scholar]
- Vohora, V.K.; Donoghue, S.L. Application of remote sensing data to landslide mapping in Hong Kong. Int. Arch. Photogramm. Remote Sens. Spat. Inf. Sci 2004, 35/B4, 489–493. [Google Scholar]
- Geospatial Data Service Center of Dutch National Aerospace Laboratory. Database of Satellite Sensors, Comprehensive of Future Planned Launches, Available online: http://gdsc.nlr.nl/FlexCatalog/catalog.html (accessed on 23 September 2014).
- Santurri, L.; Carlà, R.; Fiorucci, F.; Aiazzi, B.; Baronti, S.; Cardinali, M.; Mondini, A. Assessment of very high resolution satellite data fusion techniques for landslide recognition. Int. Arch. Photogramm. Remote Sens. Spat. Inf. Sci 2010, 38/B7, 492–496. [Google Scholar]
- Barlow, J.; Franklin, S.; Martin, Y. High spatial resolution satellite imagery, DEM derivatives, and image segmentation for the detection of mass wasting processes. Photogramm. Eng. Remote Sens 2006, 72, 687–692. [Google Scholar]
- Tsai, F.; Hwang, J.-H.; Chen, L.-C.; Lin, T.-H. Post-disaster assessment of landslides in southern Taiwan after 2009 Typhoon Morakot using remote sensing and spatial analysis. Nat. Hazard. Earth Syst 2010, 10, 2179–2190. [Google Scholar]
- Fiorucci, F.; Cardinali, M.; Carlà, R.; Rossi, M.; Mondini, A.C.; Santurri, L.; Ardizzone, F.; Guzzetti, F. Seasonal landslide mapping and estimation of landslide mobilization rates using aerial and satellite images. Geomorphology 2011, 129, 59–70. [Google Scholar]
- Marcelino, E.V.; Formaggio, A.R.; Maeda, E.E. Landslide inventory using image fusion techniques in Brazil. Int. J. Appl. Earth Obs 2009, 11, 181–191. [Google Scholar]
- Gao, J.; Maro, J. Topographic controls on evolution of shallow landslides in pastoral Wairarapa, New Zealand, 1979–2003. Geomorphology 2010, 114, 373–381. [Google Scholar]
- Murillo-García, F.G.; Fiorucci, F.; Alcántara-Ayala, I. The development of a detailed landslide inventory for a temperate region in Mexico by using very high resolution (VHR) satellite stereo-images. In Landslide Science for a Safer Geoenvironment; Sassa, K., Canuti, P., Yin, Y., Eds.; Springer: Berlin, Germany, 2014; Volume 2, pp. 821–828. [Google Scholar]
- Guzzetti, F.; Reichenbach, P.; Cardinali, M.; Galli, M.; Ardizzone, F. Probabilistic landslide hazard assessment at the basin scale. Geomorphology 2005, 72, 272–299. [Google Scholar]
- Galli, M.; Ardizzone, F.; Cardinali, M.; Guzzetti, F.; Reichenbach, P. Comparing. Landslide inventory maps. Geomorphology 2008, 94, 268–289. [Google Scholar]
- Guzzetti, F.; Cardinali, M.; Reichenbach, P.; Cipolla, F.; Sebastiani, C.; Galli, M.; Salvati, P. Landslides triggered by the 23 November 2000 rainfall event in the Imperia Province, Western Liguria, Italy. Eng. Geol 2004, 73, 229–245. [Google Scholar]
- Cheng, K.S.; Wei, C.; Chang, S.C. Locating landslides using multi-temporal satellite images. Adv. Space Res 2004, 33, 96–301. [Google Scholar]
- Wiegand, C.; Rutzinger, M.; Heinrich, K.; Geitner, C. Automated extraction of shallow erosion areas based on multi-temporal ortho-imagery. Remote Sens 2013, 5, 2292–2307. [Google Scholar]
- Ghosh, S.; van Westen, C.; Carranza, E.J.M.; Jetten, V.G.; Cardinali, M.; Rossi, M.; Guzzetti, F. Generating event-based landslide maps in a data-scarce Himalayan environment for estimating temporal and magnitude probability. Eng. Geol 2012, 128, 49–62. [Google Scholar]
- Borghuis, A.M.; Chang, K.; Lee, H.Y. Comparison between automated and manual mapping of typhoon-triggered landslides from SPOT-5 imagery. Int. J. Remote Sens 2008, 28, 1843–1856. [Google Scholar]
- Lee, S.; Lee, M.J. Detecting landslide location using KOMPSAT 1 and its application to landslide-susceptibility mapping at the Gangneung area, Korea. Adv. Space Res 2006, 38, 2261–2271. [Google Scholar]
- Nichol, J.; Wong, M.S. Detection and interpretation of landslides using satellite images. Land Degrad. Dev 2005, 16, 243–255. [Google Scholar]
- Lacroix, P.; Zavala, B.; Berthier, E.; Audin, L. Supervised method of landslide inventory using panchromatic SPOT5 images and application to the earthquake-triggered landslides of Pisco (Peru, 2007, Mw8.0). Remote Sens 2013, 5, 2590–2616. [Google Scholar]
- Martha, T.R.; Kerle, N.; Jetten, V.; van Westen, C.; Vinod Kumar, K. Characterising spectral, spatial and morphometric properties of landslides for semi-automatic detection using object-oriented methods. Geomorphology 2010, 116, 24–36. [Google Scholar]
- Blaschke, T. Object based image analysis for remote sensing. ISPRS J. Photogramm. Remote Sens 2010, 65, 2–16. [Google Scholar]
- Lu, P.; Stumpf, A.; Kerle, N.; Casagli, N. Object-oriented change detection for landslide rapid mapping. IEEE Geosci. Remote Sens. Lett 2011, 8, 701–705. [Google Scholar]
- Moine, M.; Puissant, A.T.; Remaitre, A.; Bogaard, T. Detection of landslides from aerial and satellite images with a semi-automatic method. Application to the Barcelonnette basin (Alpes-de-Haute-Provence, France). In Landslides Processes—From Geomorphologic Mapping to Dynamic Modelling; Malet, J.P., Remaître, A., Bogaard, T., Eds.; CERG Editions: Strasbourg, France, 2009; pp. 63–68. [Google Scholar]
- Stumpf, A.; Lachiche, N.; Malet, J.P.; Kerle, N.; Puissant, A. Active learning in the spatial domain for remote sensing image classification. IEEE Trans. Geosci. Remote Sens 2014, 52, 2492–2507. [Google Scholar]
- Golovko, D.; Roessner, S.; Behling, R.; Wetzel, H.-U.; Kaufmann, H. GIS-based integration of heterogeneous data for multi-temporal landslide inventory. In Landslide Science for a Safer Geoenvironment; Sassa, K., Canuti, P., Yin, Y., Eds.; Springer: Berlin, Germany, 2014; Volume 2, pp. 799–804. [Google Scholar]
- Behling, R.; Roessner, S.; Kaufmann, H.; Kleinschmit, B. Automated spatiotemporal landslide mapping over large areas using rapideye time series data. Remote Sens 2014, 6, 8026–8055. [Google Scholar]
- Othman, A.A.; Gloaguen, R. River courses affected by landslides and implications for hazard assessment: A high resolution remote sensing case study in NE Iraq–W Iran. Remote Sens 2013, 5, 1024–1044. [Google Scholar]
- Mondini, A.C.; Guzzetti, F.; Reichenbach, P.; Rossi, M.; Cardinali, M.; Ardizzone, F. Semi-automatic recognition and mapping of rainfall induced shallow landslides using satellite optical images. Remote Sens. Environ 2011, 115, 1743–1757. [Google Scholar]
- Rau, J.Y.; Jhan, J.P.; Lo, C.F.; Lin, Y.S. Landslide mapping using imagery acquired by a fixed-wing UAV. Int. Arch. Photogramm. Remote Sens. Spat. Inf. Sci 2011, 38/1-C22, 195–200. [Google Scholar]
- Mitasova, H.; Harmon, R.S.; Weaver, K.J.; Lions, N.J.; Overton, M.F. Scientific visualization of landscapes and landforms. Geomorphology 2012, 137, 122–137. [Google Scholar]
- Sato, H.P.; Harp, E.L. Interpretation of earthquake-induced landslides triggered by the 12 May 2008, M7.9 Wenchuan earthquake in the Beichuan area, Sichuan Province, China, using satellite imagery and Google Earth. Landslides 2009, 6, 153–159. [Google Scholar]
- Dagdelender, G.; Nefeslioglu, H.A.; Gokceoglu, C. Landslide inventory of the eastern part of the Gallipoli Peninsula (Canakkale, Turkey). In Landslide Science for a Safer Geoenvironment; Sassa, K., Canuti, P., Yin, Y., Eds.; Springer: Berlin, Germany, 2014; Volume 2, pp. 793–797. [Google Scholar]
- Heipke, C. Crowdsourcing geospatial data. ISPRS J. Photogramm. Remote Sens 2012, 65, 550–557. [Google Scholar]
- Heinzelman, J.; Waters, C. Crowdsourcing Crisis Information in Disaster-Affected Haiti; Special Report No. 252; United States Institute of Peace: Washington, DC, USA, 2010. [Google Scholar]
- Haeberlin, Y.; Turberg, P.; Retière, A.; Senegas, O.; Parriaux, A. Validation of SPOT 5 satellite imagery for geological hazard identification and risk assessment for landslides, mud and debris flows in Matagalpa, Nicaragua. Int. Arch. Photogramm. Remote Sens. Spat. Inf. Sci 2004, 35/B1, 273–278. [Google Scholar]
- Bajracharya, B.; Bajracharya, S.R. Landslide mapping of the Everest region using high resolution satellite images and 3D visualization. In Proceedings of the Mountain GIS e-Conference, Kathmandu, Nepal, 14–25 January 2008.
- Alkevli, T.; Ercanoglu, M. Assessment of ASTER satellite images in landslide inventory mapping: Yenice-Gökçebey (Western Black Sea Region, Turkey). B Eng. Geol. Environ 2011, 70, 607–617. [Google Scholar]
- Grün, A. Development and status of image matching in photogrammetry. Photogramm. Rec 2012, 27, 36–57. [Google Scholar]
- Nichol, E.J.; Shaker, A.; Wong, M.-S. Application of high-resolution stereo satellite images to detailed landslide hazard assessment. Geomorphology 2006, 76, 68–75. [Google Scholar]
- Jensen, J.R. Introductory to Digital Image Processing: A Remote Sensing Perspective; Prentice Hall Series in Geographic Information Science: Upper Saddle River, NJ, USA, 2007; p. 318. [Google Scholar]
- Van der Meer, F.D.; van der Werff, H.M.A.; van Ruitenbeek, F.J.A.; Hecker, C.A.; Bakker, W.H.; Noomen, MF.; van der Meijde, M.; Carranza, E.J.M.; Boudewijn de Smeth, J.; Woldai, T. Multi- and hyperspectral geologic remote sensing: A review. Int. J. Appl. Earth Obs 2012, 14, 112–128. [Google Scholar]
- Sterzai, P.; Vellico, M.; Berti, M.; Coren, F.; Corsini, A.; Rosi, A.; Mora, P.; Zambonelli, F. Innovative integrated airborne and wireless systems for landslide monitoring. In Proceedings of the International Symposium GeoInformation for Disaster Management (GI4DM), Torino, Italy, 2–4 February 2010.
- Rudd, L.P. Using AVIRIS Hyperspectral Imagery to Study the Role of Clay Mineralogy in Colorado Plateau Debris-Flow Initiation. Order N. 318797. Ph.D. Thesis, Department of Geosciences, University of Arizona, Tucson, AZ, USA. 2005, 248. [Google Scholar]
- Ferrato, L.J.; Forsythe, K.W. Comparing hyperspectral and multispectral imagery for land classification of the Lower Don River, Toronto. J. Geogr. Geol 2013, 5. [Google Scholar] [CrossRef]
- Smailbegovic, A.; Mendenhall, M.; Clark, J; Gray, K; Wooten, R. Hyperspectral image and signal processing: Evolution in remote sensing. In Proceedings of the 3rd Work, WHISPERS, Lisbon, Portugal, 6–9 June 2011.
- Primer on Natural Hazard Management in Integrated Regional Development; Dept. of Regional Development and Environment, Executive Secretariat for Economic and Social Affairs, Organization of American States: Washington D.C., USA, 1991; p. 412.
- Weng, Q. Thermal infrared remote sensing for urban climate and environmental studies: Methods, applications, and trends. ISPRS J. Photogramm. Remote Sens 2009, 64, 335–344. [Google Scholar]
- European Space Agency. Copernicus, ESA’s Sentinel Satellites: Sentinel-3. Available online: http://www.esa.int/Our_Activities/Observing_the_Earth/Copernicus/Sentinel-3 (accessed on 25 September 2014).
- Nichol, J.E.; King, B.A.; Quattrochi, D.; Dowman, I.; Ehlers, M.; Ding, X. Policy document on earth observation for urban planning and management. Photogramm. Eng. Remote Sens 2007, 73, 973–979. [Google Scholar]
- Quattrochi, D.A.; Luvall, J.C. Thermal infrared remote sensing for analysis of landscape ecological processes: Methods and applications. Landsc. Ecol 1999, 14, 577–598. [Google Scholar]
- Bison, P.; Grinzato, E.; Pasuto, A.; Silvano, S. Thermal IR remote sensing in landslide survey. In Proceedings of the 6th International IAEG Congress, Balkema, Rotterdam, The Netherlands, 6–10 August 1990; 2, pp. 873–878.
- Shi, J.C.; Du, Y.; Du, J.Y.; Jiang, L.M.; Chai, L.N.; Mao, K.B.; Xu, P.; Ni, W.J.; Xiong, C.; Liu, Q.; et al. Progresses on microwave remote sensing of land surface parameters. Sci. China Ser. D 2012, 55, 1052–1078. [Google Scholar]
- Nichol, J. An emissivity modulation method for spatial enhancement of thermal satellite images in urban heat island analysis. Photogramm. Eng. Remote Sens 2009, 75, 547–556. [Google Scholar]
- Kääb, A.; Wessels, R.; Haeberli, W.; Huggel, C.; Kargel, J.S.; Khalsa, S.J.S. Rapid ASTER imaging facilitates timely assessment of glacier hazards and disasters. Eos Trans. Am. Geophys. Union 2003, 84, 117–121. [Google Scholar]
- Baroň, I.; Bečkovský, D.; Míča, L. Application of infrared thermography for mapping open fractures in deep-seated rockslides and unstable cliffs. Landslides 2014, 11, 15–27. [Google Scholar]
- Squarzoni, C.; Calgaro, A.; Teza, G.; Acosta, C.A.T.; Pernito, M.A.; Bucceri, N. Terrestrial laser scanning and infrared thermography in rock fall prone slope analysis. Geophys. Res. Abstr 2008, 10. EGU2008-A-09254. [Google Scholar]
- Ferretti, A.; Monti-Guarnieri, A.; Prati, C.; Rocca, F.; Massonet, D. InSAR Principles: Guideline for SAR Interferometry Processing and Interpretation; ESA Publication: Noordwijk, The Netherlands, 2007. [Google Scholar]
- Wasowski, J.; Bovenga, F. Investigating landslides and unstable slopes with satellite multi temporal interferometry: Current issues and future perspectives. Eng. Geol 2014, 174, 103–138. [Google Scholar]
- Yonezawa, C.; Watanabe, M.; Saito, G. Polarimetric decomposition analysis of ALOS PALSAR observation data before and after a landslide event. Remote Sens 2012, 4, 2314–2328. [Google Scholar]
- Crosetto, M.; Crippa, B.; Biescas, E. Early detection and in-depth analysis of deformation phenomena by radar interferometry. Eng. Geol 2005, 79, 81–91. [Google Scholar]
- Ferretti, A.; Prati, C.; Rocca, F. Permanent Scatterers in SAR interferometry. IEEE Geosci. Remote Sens 2001, 39, 8–20. [Google Scholar]
- Casson, B.; Delacourt, C.; Allemand, P. Contribution of multi-temporal sensing images to characterize landslide slip surface—Application to the La Clapiere Landslide (France). Nat. Hazard. Earth Syst 2005, 5, 425–437. [Google Scholar]
- Frattini, P.; Crosta, G.B.; Allievi, J. Damage to buildings in large slope rock instabilities monitored with the PSInSARTM Technique. Remote Sens 2013, 5, 4753–4773. [Google Scholar]
- Berardino, P.; Fornaro, G.; Lanari, R.; Sansosti, E. A new algorithm for surface deformation monitoring based on small baseline differential SAR interferograms. IEEE Geosci. Remote Sens 2002, 40, 2375–2383. [Google Scholar]
- Crosetto, M.; Monserrat, O.; Cuevas, M.; Crippa, B. Spaceborne differential SAR interferometry: Data analysis tools for deformation measurement. Remote Sens 2011, 3, 305–318. [Google Scholar]
- Tantianuparp, P.; Shi, X.; Zhang, L.; Balz, T.; Liao, M. Characterization of landslide deformations in three gorges area using multiple InSAR data stacks. Remote Sens 2013, 5, 2704–2719. [Google Scholar]
- Righini, G.; Pancioli, V.; Casagli, N. Updating landslide inventory maps using Persistent Scatterer Interferometry (PSI). Int. J. Remote Sens 2012, 33, 2068–2096. [Google Scholar]
- Farina, P.; Colombo, D.; Fumagalli, A.; Marks, F.; Moretti, S. Permanent scatters for landslide investigations: Outcomes from the ESA-SLAM project. Eng. Geol 2006, 88, 200–217. [Google Scholar]
- Reidel, B.; Walther, A. InSAR processing for the recognition of landslides. Adv. Geosci 2008, 14, 189–194. [Google Scholar]
- Guzzetti, F.; Manunta, M.; Ardizzone, F.; Pepe, A.; Cardinali, M.; Zeni, G.; Reichenbach, P.; Lanari, R. Analysis of ground deformation detected using the SBAS-DInSAR technique in Umbria, Central Italy. Pure Appl. Geophys 2009, 166, 1425–1459. [Google Scholar]
- Hölbling, D.; Füreder, P.; Antolini, F.; Cigna, F.; Casagli, N.; Lang, S. A semi-automated object-based approach for landslide detection validated by persistent scatterer interferometry measures and landslide inventories. Remote Sens 2012, 4, 1310–1336. [Google Scholar]
- Lu, P.; Casagli, N.; Catani, F.; Tofani, V. Persistent scatterers interferometry hotspot and cluster analysis (PSI-HCA) for detection of extremely slow-moving landslides. Int. J. Remote Sens 2012, 33, 466–489. [Google Scholar]
- Lauknes, T.S.; Piyush Shanker, A.; Dehls, J.F.; Zebker, H.A.; Henderson, I.H.C.; Larsen, Y. Detailed rockslide mapping in northern Norway with small baseline and persistent scatterer interferometric SAR time series methods. Remote Sens. Environ 2010, 114, 2097–2109. [Google Scholar]
- Lu, P.; Bai, S.; Casagli, N. Investigating spatial patterns of persistent scatterer interferometry point targets and landslide occurrences in the Arno River Basin. Remote Sens 2014, 6, 6817–6843. [Google Scholar]
- Akbarimehr, M.; Motagh, M.; Haghshenas-Haghighi, M. Slope stability assessment of the sarcheshmeh landslide, Northeast Iran, investigated using InSAR and GPS observations. Remote Sens 2013, 5, 3681–3700. [Google Scholar]
- Jaboyedoff, M.; Oppikofer, T.; Abellán, A.; Derron, M.H.; Loye, A.; Metzger, R.; Pedrazzini, A. Use of LIDAR in landslide investigations: A review. Nat. Hazard 2012, 61, 1–24. [Google Scholar]
- Pirotti, F.; Guarnieri, A.; Vettore, A. State of the art of ground and aerial laser scanning technologies for high-resolution topography of the earth surface. Eur. J. Remote Sens 2013, 46, 66–78. [Google Scholar]
- Pirotti, F.; Guarnieri, A.; Vettore, A. Ground filtering and vegetation mapping using multi-return terrestrial laser scanning. ISPRS J. Photogramm. Remote Sens 2013, 76, 56–63. [Google Scholar]
- Borkowski, A.; Perski, Z.; Wojciechowski, T.; JóźkóW, G.; Wójcik, A. Landslides mapping in Roznow Lake vicinity, Poland using airborne laser scanning data. Acta Geodyn. Geomater 2011, 8, 325–333. [Google Scholar]
- Razak, K.A.; Straatsma, M.W.; van Westen, C.J.; Malet, J.-P.; de Jong, S.M. Airborne laser scanning of forested landslides characterization: Terrain model quality and visualization. Geomorphology 2011, 126, 186–200. [Google Scholar]
- Van Den Eeckhaut, M.; Poesen, J.; Verstraeten, G.; van Acker, V.; Nyssen, J.; Moeyersons, J.; van Beek, L.P.H.; Vandekerckhove, L. The use of LIDAR-derived images for mapping old landslides under forest. Earth Surf. Process 2007, 32, 754–769. [Google Scholar]
- Alba, M.; Barazzetti, L.; Roncoroni, F.; Scaioni, M. Filtering vegetation from terrestrial point clouds with low-cost near infrared cameras. Ital. J. Remote Sens 2012, 43, 55–75. [Google Scholar]
- Heritage, G.L.; Large, A.R.G. Laser Scanning for the Environmental Sciences; Wiley-Blackwell: London, UK, 2009. [Google Scholar]
- Agliardi, F.; Crosta, G.B.; Zanchi, A.; Ravazzi, C. Onset and timing of deep-seated gravitational slope deformations in the eastern Alps, Italy. Geomorphology 2009, 103, 113–129. [Google Scholar]
- Corsini, A.; Cervi, F.; Daehne, A.; Ronchetti, F. Coupling geomorphic field observation and LIDAR derivatives to map complex landslides. In Landslides Processes—From Geomorphologic Mapping to Dynamic Modelling; Malet, J.P., Remaître, A., Bogaard, T., Eds.; CERG Editions: Strasbourg, France, 2009; pp. 15–18. [Google Scholar]
- Oppikofer, T.; Jaboyedoff, M.; Blikra, L.; Derron, M.-H.; Metzger, R. Characterization and monitoring of the Åknes rockslide using terrestrial laser scanning. Nat. Hazard. Earth Syst 2009, 9, 1003–1019. [Google Scholar]
- Đomlija, P.; Bernat, S.; Mihalić Arbanas, S.; Benac, Č. Landslide inventory in the area of Dubračina River Basin (Croatia). In Landslide Science for a Safer Geoenvironment; Sassa, K., Canuti, P., Yin, Y., Eds.; Springer: Berlin, Germany, 2014; Volume 2, pp. 837–842. [Google Scholar]
- Glenn, N.F.; Streuker, D.R.; Chadwick, D.J.; Thackray, G.D.; Dorsch, S.J. Analysis of LiDAR derived topographic information for characterizing and differentiating landslide morphology and activity. Geomorphology 2006, 73, 131–148. [Google Scholar]
- Ardizzone, F.; Cardinali, M.; Galli, M.; Guzzetti, F.; Reichenbach, P. Identification and mapping of recent rainfall-induced landslides using elevation data collected by airborne LiDAR. Nat. Hazard. Earth Syst 2007, 7, 637–650. [Google Scholar]
- Borlat, C.; Epard, J.L.; Jaboyedoff, M. Use of a laser-DTM for geological survey, structural interpretation and update of existing maps: Example in the Jura Mountains (Switzerland). Geophys. Res. Abstr 2007, 9. SRef-ID: 1607-7962/gra/EGU2007-A-07424. [Google Scholar]
- Sato, H.P.; Yagi, H.; Moarai, M.; Iwahashi, J.; Sekiguchi, T. Airborne LIDAR data measurement and landform classification mapping in Tomari-no-tai landslide area, Shirakami Mountains, Japan. In Progress in Landslide Science; Sassa, K., Fukuoka, H., Wang, F., Wang, G., Eds.; Springer: Berlin, Germany, 2007; pp. 237–249. [Google Scholar]
- Van Asselen, C.J; Seijmonsbergen, A.C. Expert-driven semi-automated geomorphological mapping for a mountainous area using a laser DTM. Geomorphology 2007, 78, 309–320. [Google Scholar]
- Tarolli, P.; Sofia, G.; Dalla Fontana, G. Geomorphic features extraction from high resolution topography: Landslide crowns and bank erosion. Nat. Hazard 2012, 61, 65–83. [Google Scholar]
- Kasai, M.; Ikeda, M.; Asahina, T.; Fujisawa, K. LiDAR-derived DEM evaluation of deep-seated landslides in a steep and rocky region of Japan. Geomorphology 2009, 113, 57–69. [Google Scholar]
- Booth, A.M.; Roering, J.J.; Perron, J.T. Automated landslide mapping using spectral analysis and high-resolution topographic data: Puget Sound lowlands, Washington, and Portland Hills, Oregon. Geomorphology 2009, 109, 132–147. [Google Scholar]
- Bull, J.M.; Miller, H.; Gravley, D.M.; Costello, D.; Hikuroa, D.C.H.; Dix, J.K. Assessing debris flows using LIDAR differencing: 18 May 2005 Matata event, New Zealand. Geomorphology 2010, 124, 75–84. [Google Scholar]
- Chigira, M.; Duan, F.; Yagi, H.; Furuya, T. Using an airborne laser scanner for the identification of shallow landslides and susceptibility assessment in an area of ignimbrite overlain by permeable pyroclastics. Landslides 2004, 1, 203–209. [Google Scholar]
- Rau, J.Y.; Chang, K.-T.; Shao, Y.-C.; Lau, C.-C. Semi-automatic shallow landslide detection by the integration of airborne imagery and laser scanning data. Nat. Hazard 2012, 61, 469–480. [Google Scholar]
- Huat, L.T.; Ali, F. Application of airborne laser scanning and ortho-rectified photograph in geomorphological mapping works. Electron. J. Geotech. Eng 2012, 17H, 1015–1023. [Google Scholar]
- Longoni, L.; Arosio, D.; Scaioni, M.; Papini, M.; Zanzi, L.; Roncella, R.; Brambilla, D. Surface and subsurface non-invasive investigations to improve the characterization of a fractured rock mass. J. Geophys. Eng 2012, 9, 461–472. [Google Scholar]
- Rosser, N.J.; Petley, D.N.; Lim, N.; Dunning, S.; Allison, R.J. Terrestrial laser scanning for monitoring the process of hard rock coastal cliff erosion. Q. J. Eng. Geol. Hydrogeol 2005, 38, 363–375. [Google Scholar]
- Lim, M.; Petley, D.N.; Rosser, N.J.; Allison, R.J.; Long, A.J.; Pybus, D. Combined digital photogrammetry and time-of-flight laser scanning for monitoring cliff evolution. Photogramm. Rec 2005, 20, 109–129. [Google Scholar]
- Abellán, A.; Calvet, J.; Vilaplana, J.; Blanchard, J. Detection and spatial prediction of rock falls by means of terrestrial laser scanner monitoring. Geomorphology 2010, 119, 162–171. [Google Scholar]
- Oppikofer, T. Detection Analysis Monitoring of Slope Movements by High-Resolution Digital Elevation Models. Ph.D. Thesis, Institute of Geomatics and Analysis of Risks, Faculty of Geosciences and Environment, University of Lausanne, Lausanne, Switzerland. 2009. [Google Scholar]
- Theules, J.I.; Loye, A.; Liébault, F.; Laigle, D.; Jaboyedoff, M. Sediment budget of a debris flow event in the French Prealps. In Proceedings of the American Geophysical Union, Fall Meeting, San Francisco, CA, USA, 14–18 December 2009.
- Viero, A.; Teza, T.; Massironi, M.; Jaboyedoff, M.; Galgaro, A. Laser scanning-based recognition of rotational movements on a deep seated gravitational instability: The Cinque Torri case (North-Eastern Italian Alps). Geomorphology 2010, 122, 191–204. [Google Scholar]
- Pesci, A.; Teza, G.; Casula, G.; Loddo, F.; de Martino, P.; Dolce, M.; Obrizzo, F.; Pingue, F. Multitemporal laser scanner-based observation of the Mt. Vesuvius crater: Characterization of overall geometry and recognition of landslide events. ISPRS J. Photogramm. Remote Sens 2011, 66, 327–336. [Google Scholar]
- Santangelo, M.; Cardinali, M.; Rossi, M.; Mondini, A.C.; Guzzetti, F. Remote landslide mapping using a laser rangefinder binocular and GPS. Nat. Hazard. Earth Syst. Sci 2010, 10, 2539–2546. [Google Scholar]
- Eisenbeiss, H. The autonomous mini-helicopter: A powerful platform for mobile mapping. Int. Arch. Photogramm. Remote Sens. Spat. Inf. Sci 2008, 37/B1, 977–983. [Google Scholar]
- Stock, G.M.; Bawden, G.W.; Green, J.K.; Hanson, E.; Downing, G.; Collins, B.D.; Bond, S.; Leslar, M. High-resolution three-dimensional imaging and analysis of rock falls in Yosemite Valley, California. Geosphere 2011, 7, 573–581. [Google Scholar]
- Strasser, M.; Jia, Y.; Yamada, Y.; Urgeles, R. Introduction: Landslides in coastal and submarine environments. In Landslide Science for a Safer Geoenvironment; Sassa, K., Canuti, P., Yin, Y., Eds.; Springer: Berlin, Germany, 2014; Volume 3, pp. 545–548. [Google Scholar]
- Gardner, J.V.; Field, M.E.; Twichell, D.C. Geology of the United States Seafloor: The View from Gloria; Cambridge University Press: Cambridge, UK, 1996. [Google Scholar]
- Ceramicola, S.; Tinti, S.; Zaniboni, F.; Praeg, D.; Planinsek, P.; Pagnoni, G.; Forlin, E. Reconstruction and tsunami modeling of a submarine landslide on the Eolian margin of Calabria (Mediterranean Sea). In Landslide Science for a Safer Geoenvironment; Sassa, K., Canuti, P., Yin, Y., Eds.; Springer: Berlin, Germany, 2014; Volume 3, pp. 557–562. [Google Scholar]
- Le Moigne, J.; Netanyahu, N.S.; Eastman, R.D. Image Registration for Remote Sensing; Cambridge University Press: Cambridge, UK, 2011; p. 484. [Google Scholar]
- Barazzetti, L.; Scaioni, M.; Gianinetto, M. Automatic co-registration of satellite time series via least squares adjustment. Eur. J. Remote Sens 2014, 47, 55–74. [Google Scholar]
- Strozzi, T.; Ambrosi, C.; Raetzo, H. Interpretation of aerial photographs and satellite SAR interferometry for the inventory of landslides. Remote Sens 2013, 5, 2554–2570. [Google Scholar]
- Sassa, K.; Tsuchiya, S.; Ugai, K.; Wakai, A.; Uchimura, T. Landslides: A review of achievements in the first 5 years (2004–2009). Landslides 2009, 6, 275–286. [Google Scholar]
- Angeli, M.; Pasuto, A.; Silvano, S. A critical review of landslide monitoring experiences. Eng. Geol 2000, 55, 133–147. [Google Scholar]
- Delacourt, C.; Allemand, P.; Berthier, E.; Raucoules, D.; Casson, B.; Grandjean, P.; Pambrun, C.; Varel, E. Remote-sensing techniques for analysing landslide kinematics: A review. Bull. Soc. Géol. Fr 2007, 178, 89–100. [Google Scholar]
- Baker, S.; Scharstein, D.; Lewis, J.P.; Roth, S.; Black, M.J.; Szeliski, R. A database and evaluation methodology for optical flow. Int. J. Comput. Vis 2011, 92, 1–31. [Google Scholar]
- Debella-Gilo, M.; Kääb, A. Measurement of surface displacement and deformation of mass movements using Least Squares Matching of repeat high resolution satellite and aerial images. Remote Sens 2012, 4, 43–67. [Google Scholar]
- Delacourt, C.; Allemand, P.; Casson, B.; Vadon, H. Velocity field of the “La Clapiere” landslide measured by the correlation of aerial and QuickBird satellite images. Geophys. Res. Lett 2004, 31. [Google Scholar] [CrossRef]
- Casson, B.; Baratoux, D.; Delacourt, D.; Allemand, P. Seventeen years of the “La Clapiere” landslide evolution analysed from ortho-rectified aerial photographs. Eng. Geol 2003, 68, 123–139. [Google Scholar]
- LePrince, S.; Berthier, E.; Ayoub, F.; Delacourt, C.; Avouac, J.-P. Monitoring earth surface dynamics with optical imagery. Eos Trans. Am. Geophys. Union 2008, 89, 1–5. [Google Scholar]
- Travelletti, J.; Delacourt, C.; Allemand, P.; Malet, J.-P.; Schnittbuhl, J.; Toussaint, R.; Bastard, M. Correlation of multi-temporal ground-based optical images for landslide monitoring: Application, potential and limitations. ISPRS J. Photogramm. Remote Sens 2012, 70, 39–55. [Google Scholar]
- Van Westen, C.J.; Getahun, F.I. Analyzing the evolution of the Tessina Landslide using aerial photographs and digital elevation models. Geomorphology 2003, 54, 77–89. [Google Scholar]
- Roncella, R.; Forlani, G.; Fornari, M.; Diotri, F. Landslide monitoring by fixed-base terrestrial stereo-photogrammetry. ISPRS Ann. Photogramm. Remote Sens. Spat. Inf. Sci 2014, 2/5, 297–304. [Google Scholar]
- Previtali, M.; Barazzetti, L.; Scaioni, M. Accurate 3D surface measurement of mountain slopes through a fully automated imaged-based technique. Earth Sci. Inf 2014, 7, 109–122. [Google Scholar]
- Stumpf, A.; Malet, J.P.; Allemand, P.; Ulrich, P. Surface reconstruction and landslide displacement measurements with Pléiades satellite images. ISPRS J. Photogramm. Remote Sens 2014, 95, 1–12. [Google Scholar]
- Brückl, E.; Brunner, F.K.; Kraus, K. Kinematics of a deep-seated landslide derived from photogrammetric, GPS and geophysical data. Eng. Geol 2006, 88, 149–159. [Google Scholar]
- Colesanti, C.; Wasowski, J. Investigating landslides with space-borne Synthetic Aperture Radar (SAR) interferometry. Eng. Geol 2006, 88, 173–199. [Google Scholar]
- Crosetto, M.; Crippa, B.; Biescas, E.; Monserrat, O.; Agudo, M.; Fernández, P. State-of-the-art of land deformation monitoring using SAR interferometry. Photogramm. Fernerkund 2005, 6, 497–510. [Google Scholar]
- Wasowski, J.; Bovenga, F.; Florio, N.; Gigante, G. PSInSAR for the investigation of unstable slopes and landslides. In Proceedings of the 1st Landslide Forum, Tokyo, Japan, 18–21 November 2008; pp. 653–655.
- Cigna, F.; Bianchini, S.; Casagli, N. How to assess landslide activity and intensity with Persistent Scatterer Interferometry (PSI): The PSI-based matrix approach. Landslides 2012, 10, 267–283. [Google Scholar]
- Tofani, V.; Raspini, F.; Catani, F.; Casagli, N. Persistent Scatterer Interferometry (PSI) technique for landslide characterization and monitoring. Remote Sens 2013, 5, 1045–1065. [Google Scholar]
- Allievi, J.; Prati, C.; Rocca, F.; Savio, G.; Arrigoni, M.; Zanoletti, L. Combined use of artificial and permanent scatterers. In Proceedings of the ESA ENVISAT Symposium, Salzburg, Austria, 6–10 September 2004.
- Ye, X.; Kaufmann, H.; Guo, X.F. Landslide monitoring in the Three Gorges area using D-InSAR and corner reflectors. Photogramm. Eng. Remote Sens 2004, 70, 1167–1172. [Google Scholar]
- Crosetto, M.; Gili, J.A.; Monserrat, O.; Cuevas-Gonzales, M.; Corominas, J.; Serral, D. Interferometric SAR monitoring of the Vallcebre landslide (Spain) using corner reflectors. Nat. Hazard. Earth Syst. Sci 2013, 13, 923–933. [Google Scholar]
- Hooper, A.; Segall, P.; Zebker, H. Persistent scatterer interferometric synthetic aperture radar for crustal deformation analysis, with application to Volcan Alcedo, Galapagos. J. Geophys. Res 2007, 112, 2156–2202. [Google Scholar]
- Wegmüller, U.; Werner, C.; Strozzi, T.; Wiesmann, A. Multi-temporal interferometric point target analysis. In Proceedings of the Multi-Temp Conference, Ispra, Italy, 16–18 July 2003.
- Crosetto, M.; Biescas, E.; Duro, J.; Closa, J.; Arnaud, A. Generation of advanced ERS and Envisat interferometric SAR products using the Stable Point Network technique. Photogramm. Eng. Remote Sens 2008, 74, 443–451. [Google Scholar]
- Ferretti, A.; Fumagalli, A.; Novali, F.; Prati, C.; Rocca, F.; Rucci, A. A new algorithm for processing interferometric data-stacks: SqueeSARTM. IEEE Trans. Geosci. Remote Sens 2011, 49, 3460–3470. [Google Scholar]
- Perissin, D.; Wang, T. Repeat-pass SAR interferometry with partially coherent targets. IEEE Trans. Geosci. Remote Sens 2012, 50, 271–280. [Google Scholar]
- Hilley, G.E.; Bürgmann, R.; Ferretti, A.; Novali, F.; Rocca, F. Dynamics of slow-moving landslides from permanent scatterer analysis. Science 2004, 304, 1952–1955. [Google Scholar]
- Singhroy, V.; Coutre, R.; Alasset, P.-J.; Poncos, V. InSAR monitoring of landslides on permafrost terrain in Canada. In Proceedings of the IGARSS, Barcelona, Spain, 23–27 July 2007; pp. 2451–2454.
- Cascini, L.; Fornaro, G.; Peduto, D. Analysis at medium scale of low-resolution DInSAR data in slow-moving landslide-affected areas. ISPRS J. Photogramm. Remote Sens 2009, 64, 598–611. [Google Scholar]
- Herrera, G.; Notti, D.; Garcia-Davalillo, J.C.; Mora, O.; Cooksley, G.; Sanchez, M.; Arnaud, A.; Crosetto, M. Analysis with C- and X-band satellite SAR data of the Portalet landslide area. Landslides 2011, 8, 195–206. [Google Scholar]
- Herrera, G.; Gutiérrez, F.; García-Davalillo, J.C.; Guerrero, J.; Notti, D.; Galve, J.P.; Fernández-Merodo, J.A.; Cooksley, G. Multi-sensor advanced DInSAR monitoring of very slow landslides: The Tena Valley case study (Central Spanish Pyrenees). Remote Sens. Environ 2013, 120, 31–43. [Google Scholar]
- Lei, L.; Zhou, Y.; Li, J.; Bürgmann, R. Application of PS-INSAR to monitoring Berkeley landslides. J. Beijing Univ. Aeronaut. Astronaut 2012, 38, 1224–1226. [Google Scholar]
- Lei, L.; Zhou, Y.; Bürgmann, R. Monitoring of slow-moving landslides in the Berkeley Hills with TerraSAR-X data. In Proceedings of the IGARSS, Honolulu, HI, USA, 25–30 July 2012; pp. 230–232.
- Notti, D.; Davalillo, J.C.; Herrera, G.; Mora, O. Assessment of the performance of X-band satellite radar data for landslide mapping and monitoring: Upper Tena Valley case study. Nat. Hazard. Earth Syst 2010, 10, 1865–1875. [Google Scholar]
- Liao, M.S.; Tang, J.; Wang, T.; Balz, T.; Zhang, L. Landslide monitoring with high-resolution SAR data in the three Gorges region. Sci. China Ser. D 2012, 55, 590–601. [Google Scholar]
- Žibret, G.; Komac, M.; Jemec, M. PSInSAR displacements related to soil creep and rainfall intensities in the Alpine foreland of western Slovenia. Geomorphology 2012, 175–176, 107–114. [Google Scholar]
- Delgado, J.; Vicente, F.; García-Tortosa, F.; Alfaro, P.; Estévez, A.; Lopez-Sanchez, J.M.; Tomás, R.; Mallorquí, J.J. A deep seated compound rotational rock slide and rock spread in SE Spain: Structural control and DInSAR monitoring. Geomorphology 2011, 129, 252–262. [Google Scholar]
- Raucoules, D.; de Michele, M.; Malet, J.-P.; Ulrich, P. Time-variable 3D ground displacements from high-resolution synthetic aperture radar (SAR). Application to La Valette landslide (South French Alps). Remote Sens. Environ 2013, 139, 198–204. [Google Scholar]
- De Michele, M.; Raucoules, D.; de Sigoyer, D.; Pubellier, J.; Chamot-Rooke, N. Three-dimensional surface displacement of the 2008 May 12 Sichuan earthquake (China) derived from synthetic aperture radar: Evidence for rupture on a blind thrust. Geophys. J. Int 2010, 183, 1097–1103. [Google Scholar]
- Fan, J.; Lin, H.; Xia, Y.; Zhao, H.; Guo, X.; Li, M. Mapping the deformation of shuping landslide using DInSAR and offset tracking methods. In Landslide Science for a Safer Geoenvironment; Sassa, K., Canuti, P., Yin, Y., Eds.; Springer: Berlin, Germany, 2014; Volume 2, pp. 319–324. [Google Scholar]
- Peyret, M.; Djamour, Y.; Rizza, M.; Ritz, J.F.; Hurtrez, J.E.; Goudarzi, M.A.; Nankali, H.; Chèry, J.; Le Dortz, K.; Uri, F. Monitoring of a large slow Kahrod landslide in Alborz mounatin range (Iran) by GPS and SAR interferometry. Eng. Geol 2008, 100, 131–141. [Google Scholar]
- Strozzi, T.; Delaloye, R.; Kääb, A.; Ambrosi, C.; Perruchoud, E.; Wegmüller, U. Combined observations of rock mass movements using satellite SAR interferometry, differential GPS, airborne digital photogrammetry, and airborne photography interpretation. J. Geophys. Res 2010, 115, 2156–2202. [Google Scholar]
- Yin, Y.; Zheng, W.; Liu, Y.; Zhang, J.L.; Li, X.C. Integration of GPS with InSAR to monitoring of the Jiaju landslide in Sichuan, China. Landslides 2010, 9, 359–365. [Google Scholar]
- Calò, F.; Calcaterra, D.; Iodice, A.; Parise, M.; Ramondini, M. Assessing the activity of a large landslide in southern Italy by ground-monitoring and SAR interferometric techniques. Int. J. Remote Sens 2012, 33, 3512–3530. [Google Scholar]
- Meisina, C.; Zucca, F.; Notti, D.; Colombo, A.; Cucchi, A.; Savio, G.; Giannico, C.; Bianchi, M. Geological interpretation of PSInSAR data at regional scale. Sensors 2008, 8, 7469–7492. [Google Scholar]
- Tofani, V.; Segoni, S.; Agostini, A.; Catani, F.; Casagli, N. Technical note: Use of remote sensing for landslide studies in Europe. Nat. Hazard. Earth Syst 2013, 13, 299–309. [Google Scholar]
- Raucoules, D.; Bourgine, B.; Michele, M.; Le Gozannet, G.; Closset, L.; Bremmer, C.; Veldkamp, H.; Tragheim, D.; Bateson, L.; Crosetto, M.; et al. Validation and intercomparison of persistent scatterers interferometry: PSIC4 project results. J. Appl. Geophys 2009, 68, 335–347. [Google Scholar]
- Wegmüller, U.; Walter, D.; Spreckels, V.; Werner, C. Nonuniform ground motion monitoring with TerraSAR-X persistent scatterer interferometry. IEEE Geosci. Remote Sens 2010, 48, 895–904. [Google Scholar]
- Rauste, Y.; Latet, H.B.; Wan Ibrahim Wam Mohd, M.; Lönnqvist, A.; Häme, T. TerraSAR-X data in cut slope soil stability monitoring in Malaysia. IEEE Geosci. Remote Sens 2012, 50, 3354–3363. [Google Scholar]
- Bovenga, F.; Wasowski, J.; Nitti, D.O.; Nutricato, R.; Chiaradia, M.T. Using COSMO/SkyMed X-band and ENVISAT C-band SAR interferometry for landslides analysis. Remote Sens. Environ 2012, 119, 272–285. [Google Scholar]
- Pancioli, V.; Raetzo, H.; Campolmi, T.; Casagli, N. Terrafirma landslide services for Europe based on space-borne InSAR data. In Proceedings of the 1st Landslide Forum, Tokyo, Japan, 18–21 November 2008; pp. 81–84.
- Del Ventisette, C.; Ciampalini, A.; Manunta, M.; Calò, F.; Paglia, L.; Ardizzone, F.; Mondini, A.C.; Reichenbach, P.; Mateos, R.M.; Bianchini, S.; et al. Exploitation of large archives of ERS and ENVISAT C-Band SAR data to characterize ground deformations. Remote Sens 2013, 5, 3896–3917. [Google Scholar]
- Monserrat, O.; Crosetto, M.; Luzi, G. A review of ground-based SAR interferometry for deformation measurement. ISPRS J. Photogramm. Remote Sens 2014, 93, 40–48. [Google Scholar]
- Tarchi, D.; Casagli, N.; Fanti, R.; Leva, D.; Luzi, G.; Pasuto, A. Landslide monitoring by using ground-based SAR interferometry: An example of application to the Tessina landslide in Italy. Eng. Geol 2003, 68, 15–30. [Google Scholar]
- Antonello, G.; Casagli, N.; Farina, P.; Fortuny, J.; Leva, D.; Nico, G.; Sieber, A.J.; Tarchi, D. Ground-based SAR interferometry for monitoring mass movements. Landslides 2004, 1, 21–28. [Google Scholar]
- Bozzano, F.; Cipriani, I.; Mazzanti, P.; Prestininzi, A. Displacement patterns of a landslide affected by human activities: Insights from ground-based InSAR monitoring. Nat. Hazard 2011, 59, 1377–1396. [Google Scholar]
- Del Ventisette, C.; Casagli, N.; Fortuny-Guasch, J.; Tarchi, D. Ruinon landslide (Valfurva, Italy) activity in relation to rainfall by means of GBInSAR monitoring. Landslides 2012, 9, 497–509. [Google Scholar]
- Luzi, G.; Pieraccini, M.; Mecatti, D.; Noferini, L.; Macaluso, G.; Galgaro, A.; Atzeni, C. Advances in ground based microwave interferometry for landslide survey: A case study. Int. J. Remote Sens 2006, 27, 2331–1350. [Google Scholar]
- Noferini, L.; Pieraccini, M.; Mecatti, D.; Macaluso, G.; Atzeni, C.; Mantovani, M.; Marcato, G.; Pasuto, A.; Silvano, S.; Tagliavini, F. Using GB-SAR technique to monitor slow moving landslide. Eng. Geol 2007, 95, 88–98. [Google Scholar]
- Barla, G.; Antolini, F.; Barla, M.; Mensi, E.; Piovano, G. Monitoring of the Beauregard landslide (Aosta Valley, Italy) using advanced and conventional techniques. Eng. Geol 2010, 116, 218–235. [Google Scholar]
- Casagli, N.; Catani, F.; Del Ventisette, C.; Luzi, G. Monitoring, prediction, and early warning using ground-based radar interferometry. Landslides 2010, 7, 291–301. [Google Scholar]
- Nolesini, T.; Di Traglia, F.; Del Ventisette, C.; Moretti, S.; Casagli, N. Deformations and slope instability on Stromboli volcano: Integration of GBInSAR data and analog modeling. Geomorphology 2013, 180–181, 242–254. [Google Scholar]
- Del Ventisette, C.; Intrieri, E.; Luzi, G.; Casagli, N.; Fanti, R.; Leva, D. Using ground based radar interferometry during emergency: The case of the A3 motorway (Calabria Region, Italy) threatened by a landslide. Nat. Hazard. Earth Syst 2011, 11, 2483–2495. [Google Scholar]
- Teza, G.; Pesci, A.; Genevois, R.; Galgaro, A. Characterization of landslide ground surface kinematics from terrestrial laser scanning and strain field computation. Geomorphology 2008, 97, 424–437. [Google Scholar]
- Arosio, D.; Longoni, L.; Papini, M.; Scaioni, M.; Zanzi, L.; Alba, M. Towards rockfall forecasting through observing deformations and listening to microseismic emissions. Nat. Hazard. Earth Syst 2009, 9, 1119–1131. [Google Scholar]
- Monserrat, O.; Moya, J.; Luzi, G.; Crosetto, M.; Gili, J.A.; Corominas, J. Non-interferometric GB-SAR measurement: Application to the Vallcebre landslide (eastern Pyrenees, Spain). Nat. Hazard. Earth Syst 2013, 13, 1873–1877. [Google Scholar]
- Corsini, A.; Borgatti, L.; Cervi, F.; Dahne, A.; Ronchetti, F.; Sterzai, P. Estimating mass-wasting processes in active earth slides- earth flows with time series of High-Resolution DEMs from photogrammetry and airborne LiDAR. Nat. Hazard. Earth Syst 2009, 9, 433–439. [Google Scholar]
- Thoma, T.; Gupta, S.C.; Bauer, M.E.; Kirchoff, C.E. Airborne laser scanning for riverbank erosion assessment. Remote Sens. Environ 2005, 95, 493–501. [Google Scholar]
- Riquelme, A.; Abellán, A.; Tomás, R.; Jaboyedoff, M. A new approach for semi-automatic rock mass joints recognition from 3D point clouds. Comput. Geosci 2014, 68, 38–52. [Google Scholar]
- Teza, G.; Galgaro, A.; Zaltron, N.; Genevois, R. Terrestrial laser scanner to detect landslide displacement field: A new approach. Int. J. Remote Sens 2007, 28, 3425–3446. [Google Scholar]
- Bitelli, G.; Dubbini, M.; Zanutta, A. Terrestrial laser scanning and digital photogrammetry techniques to monitor landslide bodies. Int. Arch. Photogramm. Remote Sens. Spat. Inf. Sci 2004, 38, 246–251. [Google Scholar]
- Shan, J.; Toth, C.K. Topographic Laser Scanning and Ranging. Principles and Processing; Taylor & Francis Group: Boca Raton, FL, USA, 2009. [Google Scholar]
- Vosselman, G.; Maas, H.-G. Airborne and Terrestrial Laser Scanning; Whittles Publishing: Dunbeath, Caithness, Scotland, UK, 2010. [Google Scholar]
- Prokop, A.; Panholzer, H. Assessing the capability of terrestrial laser scanning for monitoring slow moving landslides. Nat. Hazard. Earth Syst 2009, 9, 1921–1928. [Google Scholar]
- Barbarella, M.; Fiani, M. Landslide monitoring using terrestrial laser scanner: Georeferencing and canopy filtering issues in a case study. Int. Arch. Photogramm. Remote Sens. Spat. Inf. Sci 2012, 39/B5, 157–162. [Google Scholar]
- Guarnieri, A.; Pirotti, F.; Vettore, A. Comparison of discrete return and waveform terrestrial laser scanning for dense vegetation filtering. Int. Arch. Photogramm. Remote Sens. Spat. Inf. Sci 2012, 39/B7, 511–516. [Google Scholar]
- Alba, M.I.; Barazzetti, L.; Scaioni, M.; Rosina, E.; Previtali, M. Mapping infrared data on terrestrial laser scanning 3D models of buildings. Remote Sens 2011, 3, 1847–1870. [Google Scholar]
- Baldo, M.; Bicocchi, C.; Chiocchini, U.; Giordani, D.; Lollino, G. LIDAR monitoring of mass wasting processes: The Radicofani landslide, Province of Siena, Central Italy. Geomorphology 2009, 105, 193–201. [Google Scholar]
- Abellán, A.; Oppikofer, T.; Jaboyedoff, M.; Rosser, N.J.; Lim, M.; Lato, M.J. Terrestrial laser scanning of rock slope instabilities. Earth Surf. Process 2013, 39, 80–97. [Google Scholar]
- Monserrat, O.; Crosetto, M. Deformation measurement using terrestrial laser scanning data and leastsquares 3D surface matching. ISPRS J. Photogramm. Remote Sens 2008, 63, 142–154. [Google Scholar]
- Abellán, A.; Vilaplana, J.; Calvet, J.; García-Sellés, D.; Asensio, E. Rock fall monitoring by Terrestrial Laser Scanning—Case study of the basaltic rock face at Castellfollit de la Roca (Catalonia, Spain). Nat. Hazard. Earth Syst 2011, 11, 829–841. [Google Scholar]
- Oppikofer, T.; Jaboyedoff, M.; Keusen, H.R. Collapse at the eastern Eiger flank in the Swiss Alps. Nat. Geosci 2008, 1, 531–535. [Google Scholar]
- Biasion, A.; Bornaz, L.; Rinaudo, F. Laser scanning applications on disaster management. In Proceedings of the 1st International Symposium on Geo-information for Disaster Management (Gi4DM), Delft, The Netherlands, 21–23 March 2005.
- Pesci, A.; Teza, G.; Casula, G.; Fabris, M.; Bonforte, A. Remote sensing and geodetic measurements for volcanic slope monitoring: Surface variations measured at northern flank of La Fossa Cone (Vulcano Island, Italy). Remote Sens 2013, 5, 2238–2256. [Google Scholar]
- Bertacchini, E.; Capra, A.; Castagnetti, C.; Rivola, R. Investigating an active rockslide by long-range laser scanner: Alignment strategy and displacement identification. In Proceedings of the FIG Working Week, Rome, Italy, 6–10 May 2012.
- Abellán, A.; Jaboyedoff, M.; Oppikofer, T.; Vilaplana, J. Detection of millimetric deformation using a terrestrial laser scanner: Experiment and application to a rock fall event. Nat. Hazard. Earth Syst 2009, 9, 365–372. [Google Scholar]
- Jaboyedoff, M.; Oppikofer, T.; Locat, A.; Locat, J.; Turmel, D.; Robitaille, D.; Demers, D.; Locat, P. Use of ground-based LIDAR for the analysis of retrogressive landslides in sensitive clay and of rotational landslides in river banks. Can. Geotech. J 2009, 46, 1379–1390. [Google Scholar]
- Wu, J.; Gilliéron, P.-Y.; Merminod, B. Cell-BasedAutomatic deformation computation by analyzing terrestrial LIDAR point clouds. Photogramm. Eng. Remote Sens 2012, 78, 317–329. [Google Scholar]
- Scaioni, M.; Roncella, R.; Alba, M.I. Change detection and deformation analysis in point clouds: Application to rock face monitoring. Photogramm. Eng. Remote Sens 2013, 79, 441–456. [Google Scholar]
- Ghuffar, S.; Székely, B.; Roncat, A.; Pfeifer, N. Landslide displacement monitoring using 3D range flow on airborne and terrestrial LiDAR data. Remote Sens 2013, 5, 2720–2745. [Google Scholar]
- Rabatel, A.; Deline, P.; Jaillet, S.; Ravanel, L. Rock falls in high-alpine rock walls quantified by terrestrial LiDAR measurements: A case study in the Mont Blanc area. Geophys. Res. Lett 2008, 35. [Google Scholar] [CrossRef]
- Rosser, N.J.; Lim, N.; Petley, D.N.; Dunning, S.; Allison, R.J. Patterns of precursory rockfall prior to slope failure. J. Geophys. Res 2007, 112. [Google Scholar] [CrossRef]
- Pedrazzini, A.; Oppikofer, T.; Jaboyedoff, M.; Guell, I; Pons, M.; Chantry, R.; Stampfli, E. Assessment of rockslide and rockfall problems in an active quarry: Case study of the Arvel quarry (western Switzerland). In Proceedings of the European Rock Mechanics Symposium (EUROCK 2010), Lausanne, Switzerland, 15–18 June 2010; pp. 593–596.
- Amitrano, D.; Grasso, J.R.; Senfaute, G. Seismic precursory patterns before a cliff collapse and critical point phenomena. Geophys. Res. Lett 2005, 32, L08314. [Google Scholar]
- De Agostino, M.; Lingua, A.; Piras, M. Rock face surveys using a LiDAR MMS. Ital. J. Remote Sens 2012, 44, 141–151. [Google Scholar]
- Scheidl, C.; Rickenmann, D.; Chiari, M. The use of airborne LiDAR data for the analysis of debris flow events in Switzerland. Nat. Hazard. Earth Syst 2008, 8, 1113–1127. [Google Scholar]
- Bremer, M.; Sass, O. Combining airborne and terrestrial laser scanning for quantifying erosion and deposition by a debris flow event. Geomorphology 2012, 138, 49–60. [Google Scholar]
- Li, D.; Tong, Q.; Li, R.; Gong, J.; Zhang, L. Current issues in high-resolution earth observation technology. Sci. China Ser. D 2012, 55, 1043–1051. [Google Scholar]
- Dunning, S.A.; Rosser, N.J.; Massey, C.I. The integration of terrestrial laser scanning and numerical modeling in landslide investigations. Q. J. Eng. Geol. Hydrogeol 2010, 43, 233–247. [Google Scholar]
- Xu, J.-J.; Wang, H.-C.; Luo, Y.-Z.; Wang, S.-Q.; Yan, X.-Q. Deformation monitoring and data processing of landslide based on 3D laser scanning. Yantu Lixue/Rock Soil Mech 2010, 31, 2188–2191. [Google Scholar]
- Van Westen, C.J.; Castellanos, E.; Kuriakose, S.K. Spatial data for landslide susceptibility, hazard, and vulnerability assessment: An overview. Eng. Geol 2008, 102, 112–131. [Google Scholar]
- Van Westen, C.J.; Van Asch, T.W.J.; Soeters, R. Landslide hazard and risk zonation—Why is it still so difficult? Bull. Eng. Geol. Environ 2006, 65, 167–184. [Google Scholar]
- Guzzetti, F.; Carrara, A.; Cardinali, M.; Reichenbach, P. Landslide hazard evaluation: A review of current techniques and their application in a multi-scale study, Central Italy. Geomorphology 1999, 31, 181–216. [Google Scholar]
- Carrara, A.; Cardinali, M.; Guzzetti, F.; Reichenbach, P. GIS technology in mapping landslide hazard. In Geographical Information Systems in Assessing Natural Hazards; Carrara, A., Guzzetti, F., Eds.; Kluwer Academic Publisher: Dordrecht, The Netherlands, 1995; pp. 135–176. [Google Scholar]
- Aleotti, P.; Chowdhury, R. Landslide hazard assessment: Summary review and new perspectives. Bull. Eng. Geol. Environ 1999, 58, 21–44. [Google Scholar]
- Chung, C.J.F.; Fabbri, A.G. Validation of Spatial prediction models for landslide hazard mapping. Nat. Hazard 2003, 30, 451–472. [Google Scholar]
- Glade, T.; Crozier, M.J. A review of scale dependency in landslide hazard and risk analysis. In Landslide Risk Assessment; Glade, T., Anderson, M.G., Crozier, M.J., Eds.; John Wiley: New York, NY, USA, 2004; pp. 75–138. [Google Scholar]
- Guzzetti, F.; Galli, M.; Reichenbach, P.; Ardizzone, F.; Cardinali, M. Landslide hazard assessment in the Collazzone area, Umbria, Central Italy. Nat. Hazard. Earth Syst 2006, 6, 115–131. [Google Scholar]
- Wieczorek, G.F. Preparing a detailed landslide-inventory map for hazard evaluation and reduction. Bull. Assoc. Eng. Geol 1984, 21, 337–342. [Google Scholar]
- Dai, F.C.; Lee, C.F.; Nhai, Y.Y. Landslide risk assessment and management: An overview. Eng. Geol 2002, 64, 65–87. [Google Scholar]
- Lee, S. Application of logistic regression model and its validation for landslide susceptibility mapping. Int. J. Remote Sens 2005, 26, 1477–1491. [Google Scholar]
- Lu, P.; Catani, F.; Tofani, V.; Casagli, N. Quantitative hazard and risk assessment for slow-moving landslides from Persistent Scatterer Interferometry. Landslides 2014, 11, 685–696. [Google Scholar]
- Corominas, J.; van Westen, C.; Frattini, P.; Cascini, L.; Malet, J.-P.; Fotopoulou, S.; Catani, F.; van den Eeckhaut, M.; Mavrouli, O.; Agliardi, F.; et al. Recommendations for the quantitative analysis of landslide risk. Bull. Eng. Geol. Environ 2014, 73, 209–263. [Google Scholar]
- Muthu, K.; Petrou, M.; Tarantino, C.; Blonda, P. Landslide possibility mapping using fuzzy approaches. IEEE Trans. Geosci. Remote Sens 2008, 46, 1253–1265. [Google Scholar]
- Rossi, M.; Guzzetti, F.; Reichenbach, P.; Mondini, A.C.; Peruccacci, S. Optimal landslide susceptibility zonation based on multiple forecasts. Geomorphology 2010, 114, 129–142. [Google Scholar]
- Claessens, L.; Heuvelink, G.B.M.; Schoorl, J.M.; Veldkamp, A. DEM resolution effects on shallow landslide hazard and soil redistribution modelling. Earth Surf. Process 2005, 30, 461–477. [Google Scholar]
- Montgomery, D.R.; Greenberg, H.M.; Laprade, W.T.; Nashem, W.D. Sliding in Seattle: Test of a model of shallow landsliding potential in an urban environment. In Land Use and Watersheds: Human Influence on Hydrology and Geomorphology in Urban and Forest Areas; Wigmosta, M.S., Burges, S.J., Eds.; American Geophysical Union: Washington, DC, USA, 2013; pp. 59–73. [Google Scholar]
- Van den Eeckhaut, M.; Reichenbach, P.; Guzzetti, F.; Rossi, M.; Poesen, J. Combined landslide inventory and susceptibility assessment based on different mapping units: An example from the Flemish Ardennes, Belgium. Nat. Hazard. Earth Syst 2009, 9, 507–521. [Google Scholar]
- Miyagi, T.; Hamasaki, E. Risk evaluation of landslide topographic area by aerial photointerpretation. In Landslide Science for a Safer Geoenvironment; Sassa, K., Canuti, P., Yin, Y., Eds.; Springer: Berlin, Germany, 2014; Volume 2, pp. 491–497. [Google Scholar]
- Ayalew, L.; Yamagishi, H. The application of GIS-based logistic regression for landslide susceptibility mapping in the Kakuda-Yahiko Mountains, Central Japan. Geomorphology 2005, 65, 15–31. [Google Scholar]
- Ohlmacher, G.C. Plan curvature and landslide probability in regions dominated by earth flows and earth slides. Eng. Geol 2007, 91, 117–134. [Google Scholar]
- Dong, Y.; Zhang, F.; Gao, Z.; Kuai, Z. Regional landslide forecasting model using interferometric SAR images. J. Cent. South Univ. Technol 2008, 15, 168–173. [Google Scholar]
- Schulz, W.H. Landslide susceptibility revealed by LIDAR imagery and historical records, Seattle, Washington. Eng. Geol 2007, 89, 67–87. [Google Scholar]
- Dehls, J.F.; Rune Lauknes, T.; Hermanns, R.L.; Bunkholt, H.; Grydeland, T.; Larsen, Y.; Eriksen, H.Ø.; Eiken, T. Use of satellite and ground based InSAR in hazard classification of unstable rock slopes. In Landslide Science for a Safer Geoenvironment; Sassa, K., Canuti, P., Yin, Y., Eds.; Springer: Berlin, Germany, 2014; Volume 2, pp. 389–392. [Google Scholar]
- Erener, A.; Düzgün, H.S.B. Analysis of landslide hazard mapping methods: Regression models versus weight rating. Int. Arch. Photogramm. Remote Sens. Spat. Inf. Sci 2008, 37/B8, 277–282. [Google Scholar]
- Al-Hassideh, A.; Bill, R. Land cover changes in the region of Rostock—Can Remote Sensing and GIS help to verify and consolidate official census data? Int. Arch. Photogramm. Remote Sens. Spat. Inf. Sci 2008, 37/B8, 27–34. [Google Scholar]
- Gong, P.; Wang, J.; Yu, L.; Zhao, Y.C.; Zhao, Y.Y.; Liang, L.; Niu, Z.G.; Huang, X.M.; Fu, H.H.; Liu, S.; et al. Finer resolution observation and monitoring of global land cover: First mapping results with Landsat TM and ETM+ data. Int. J. Remote Sens 2012, 34, 2607–2654. [Google Scholar]
- Hong, Y.; Adler, R.; Huffman, G. Use of satellite remote sensing data in the mapping of global landslide susceptibility. Nat. Hazard 2007, 43, 245–256. [Google Scholar]
- Brocca, L.; Ponziani, F.; Moramarco, T.; Melone, F.; Berni, N.; Wagner, W. Improving landslide forecasting using ASCAT-Derived soil moisture data: A case study of the torgiovannetto landslide in central Italy. Remote Sens 2012, 4, 1232–1244. [Google Scholar]
- Lee, S.; Pradhan, B. Probabilistic landslide hazards and risk mapping on Penang Island, Malaysia. J. Earth Syst. Sci 2006, 115, 661–672. [Google Scholar]
- Bai, S.; Lv, G.; Wang, J.; Zhou, P.; Ding, L. GIS-based rare events logistic regression for landslide-susceptibility mapping of Lianyungang, China. Environ. Earth Sci 2011, 62, 139–149. [Google Scholar]
- Hsu, K.; Sorooshian, S.; Gao, X.; Braithwaite, D.; Agha Kouchak, A. Monitoring global precipitation using satellites. SPIE Newsroom 2012. [Google Scholar] [CrossRef]
- Segoni, S.; Leoni, L.; Benedetti, A.I.; Catani, F.; Righini, G.; Falorni, G.; Gabellani, S.; Rudari, R.; Silvestro, F.; Rebora, N. Towards a definition of a real-time forecasting network for rainfall induced shallow landslides. Nat. Hazards Earth Syst. Sci 2009, 9, 2119–2133. [Google Scholar]
- Yilmaz, K.K.; Hogue, T.S.; Hsu, K.; Sorooshian, S.; Gupta, H.V.; Wagener, T.K. Intercomparison of rain gauge, radar, and satellite-based precipitation estimates with emphasis on hydrologic forecasting. J. Hydrometeorol 2005, 6, 497–517. [Google Scholar]
- Liu, J.-K.; Shih, P.T. Topographic correction of wind-driven rainfall for landslide analysis in central Taiwan with validation from aerial and satellite optical images. Remote Sens 2013, 5, 2571–2589. [Google Scholar]
- Iwahashi, J.; Kamiya, I.; Yamagishi, H. High-resolution DEMs in the study of rainfall- and earthquake-induced landslides: Use of a variable window size method in digital terrain analysis. Geomorphology 2012, 153–154, 29–38. [Google Scholar]
- Hong, Y.; He, X.; Cerato, A.; Zhang, K.; Hong, Z.; Liao, Z. Predictability of a physically-based model for rainfall-induced shallow landslides: Model development and case studies. In Modern Technologies for Landslide Investigation and Prediction; Scaioni, M., Ed.; Springer: Berlin, German, 2014. [Google Scholar]
- Hong, Y.; Adler, R.; Huffman, G. Evaluation of the potential of NASA multi-satellite precipitation analysis in global landslide hazard assessment. Geophys. Res. Lett 2006, 33. [Google Scholar] [CrossRef]
- Hong, Y.; Adler, R.; Huffman, G. Experimental global prediction system for rainfall-triggered landslides using satellite remote sensing and geospatial datasets. IEEE Trans. Geosci. Remote Sens 2007, 45, 1671–1680. [Google Scholar]
- Baum, R.L.; Godt, J.W. Early warning of rainfall-induced shallow landslides and debris flows in the USA. Landslides 2010, 7, 259–272. [Google Scholar]
- Liao, Z.H.; Hong, Y.; Kirschbaum, D.; Chun, L. Assessment of shallow landslides from Hurricane Mitch in central America using a physically based model. Environ. Earth Sci 2012, 66, 1697–1705. [Google Scholar]
- Giardini, D.; Grunthal, G.; Shedlock, K.M. The GSHAP Global Seismic Hazard Map. Ann. Geofis 1999, 42, 1225–1230. [Google Scholar]
- Wasowski, J.; Keefer, D.K.; Lee, C.T. Toward the next generation of research on earthquake-induced landslide. Current issues and future challenges. Eng. Geol 2011, 122, 1–8. [Google Scholar]
- Bai, S.; Wang, J.; Zhang, Z.; Cheng, C. Combined landslide susceptibility mapping after Wenchuan earthquake at the Zhouqu segment in the Bailongjiang Basin, China. Catena 2012, 99, 18–25. [Google Scholar]
- Umar, Z.; Pradhan, B.; Ahmad, A.; Jebur, M.N.; Tehrany, M.S. Earthquake induced landslide susceptibility mapping using an integrated ensemble frequency ratio and logistic regression models in West Sumatra Province, Indonesia. Catena 2014, 118, 124–135. [Google Scholar]
- Herrera, G.; Fernández-Merodo, J.A.; Mulas, J.; Pastor, M.; Luzi, G.; Monserrat, O. A landslide forecasting model using ground based SAR data: The Portalet case study. Eng. Geol 2009, 105, 220–230. [Google Scholar]
- Bozzano, F.; Cipriani, I.; Mazzanti, P.; Prestininzi, A. A field experiment for calibrating landslide time-of-failure prediction functions. Int. J. Rock Mech. Min 2014, 67, 69–77. [Google Scholar]
- Gigli, G.; Fanti, R.; Canuti, P.; Casagli, N. Integration of advanced monitoring and numerical modeling techniques for the complete risk scenario analysis of rockslides: The case of Mt. Beni (Florence, Italy). Eng. Geol 2011, 120, 48–59. [Google Scholar]
- Brugioni, M.; Mazzanti, B.; Montini, G.; Sulli, L. Use of SAR interferometry for landslide analysis in the Arno river basin. In Proceedings of the 2nd World Landslide Forum, Rome, Italy, 3–7 October 2011.
- Meisina, C.; Zucca, F.; Fossati, D.; Ceriani, M.; Allevi, J. Ground deformation monitoring by using the Permanent Scatterers Technique: The example of the Oltrepo Pavese (Lombardia, Italy). Eng. Geol 2006, 88, 240–259. [Google Scholar]
- Hu, H.; Fernandez-Steeger, T.M.; Dong, M.; Azzam, R. Numerical modeling of LiDAR-based geological model for landslide analysis. Automat. Constr 2012, 24, 184–193. [Google Scholar]
- Hungr, O.; Leroueil, S.; Picarelli, L. The Varnes classification of landslide types, an update. Landslides 2014, 11, 167–194. [Google Scholar]
- Zilioli, D.; Meisina, C.; Bordoni, M.; Zucca, F. Rainfall-triggered shallow landslides mapping through Pleiades images. In Landslide Science for a Safer Geoenvironment; Sassa, K., Canuti, P., Yin, Y., Eds.; Springer: Berlin, Germany, 2014; Volume 2, pp. 325–329. [Google Scholar]
- Vennari, C.; Gariano, S.L.; Antronico, L.; Brunetti, M.T.; Iovine, G.; Peruccacci, S.; Terranova, O.; Guzzetti, F. Rainfall thresholds for shallow landslide occurrence in Calabria, southern Italy. Nat. Hazard. Earth Syst 2014, 14, 317–330. [Google Scholar]
- Radice, A.; Giorgetti, E.; Brambilla, D.; Longoni, L.; Papini, M. On integrated sediment transport modelling for flash events in mountain environments. Acta Geophys 2012, 60, 191–213. [Google Scholar]
- Arbanas, Z.; Faisal Fathani, T.; Shoaei, Z.; Chae, B.-G.; Tommasi, P. Introduction: Monitoring, prediction and warning of landslides. In Landslide Science for a Safer Geoenvironment; Sassa, K., Canuti, P., Yin, Y., Eds.; Springer: Berlin, Germany, 2014; Volume 2, pp. 539–544. [Google Scholar]


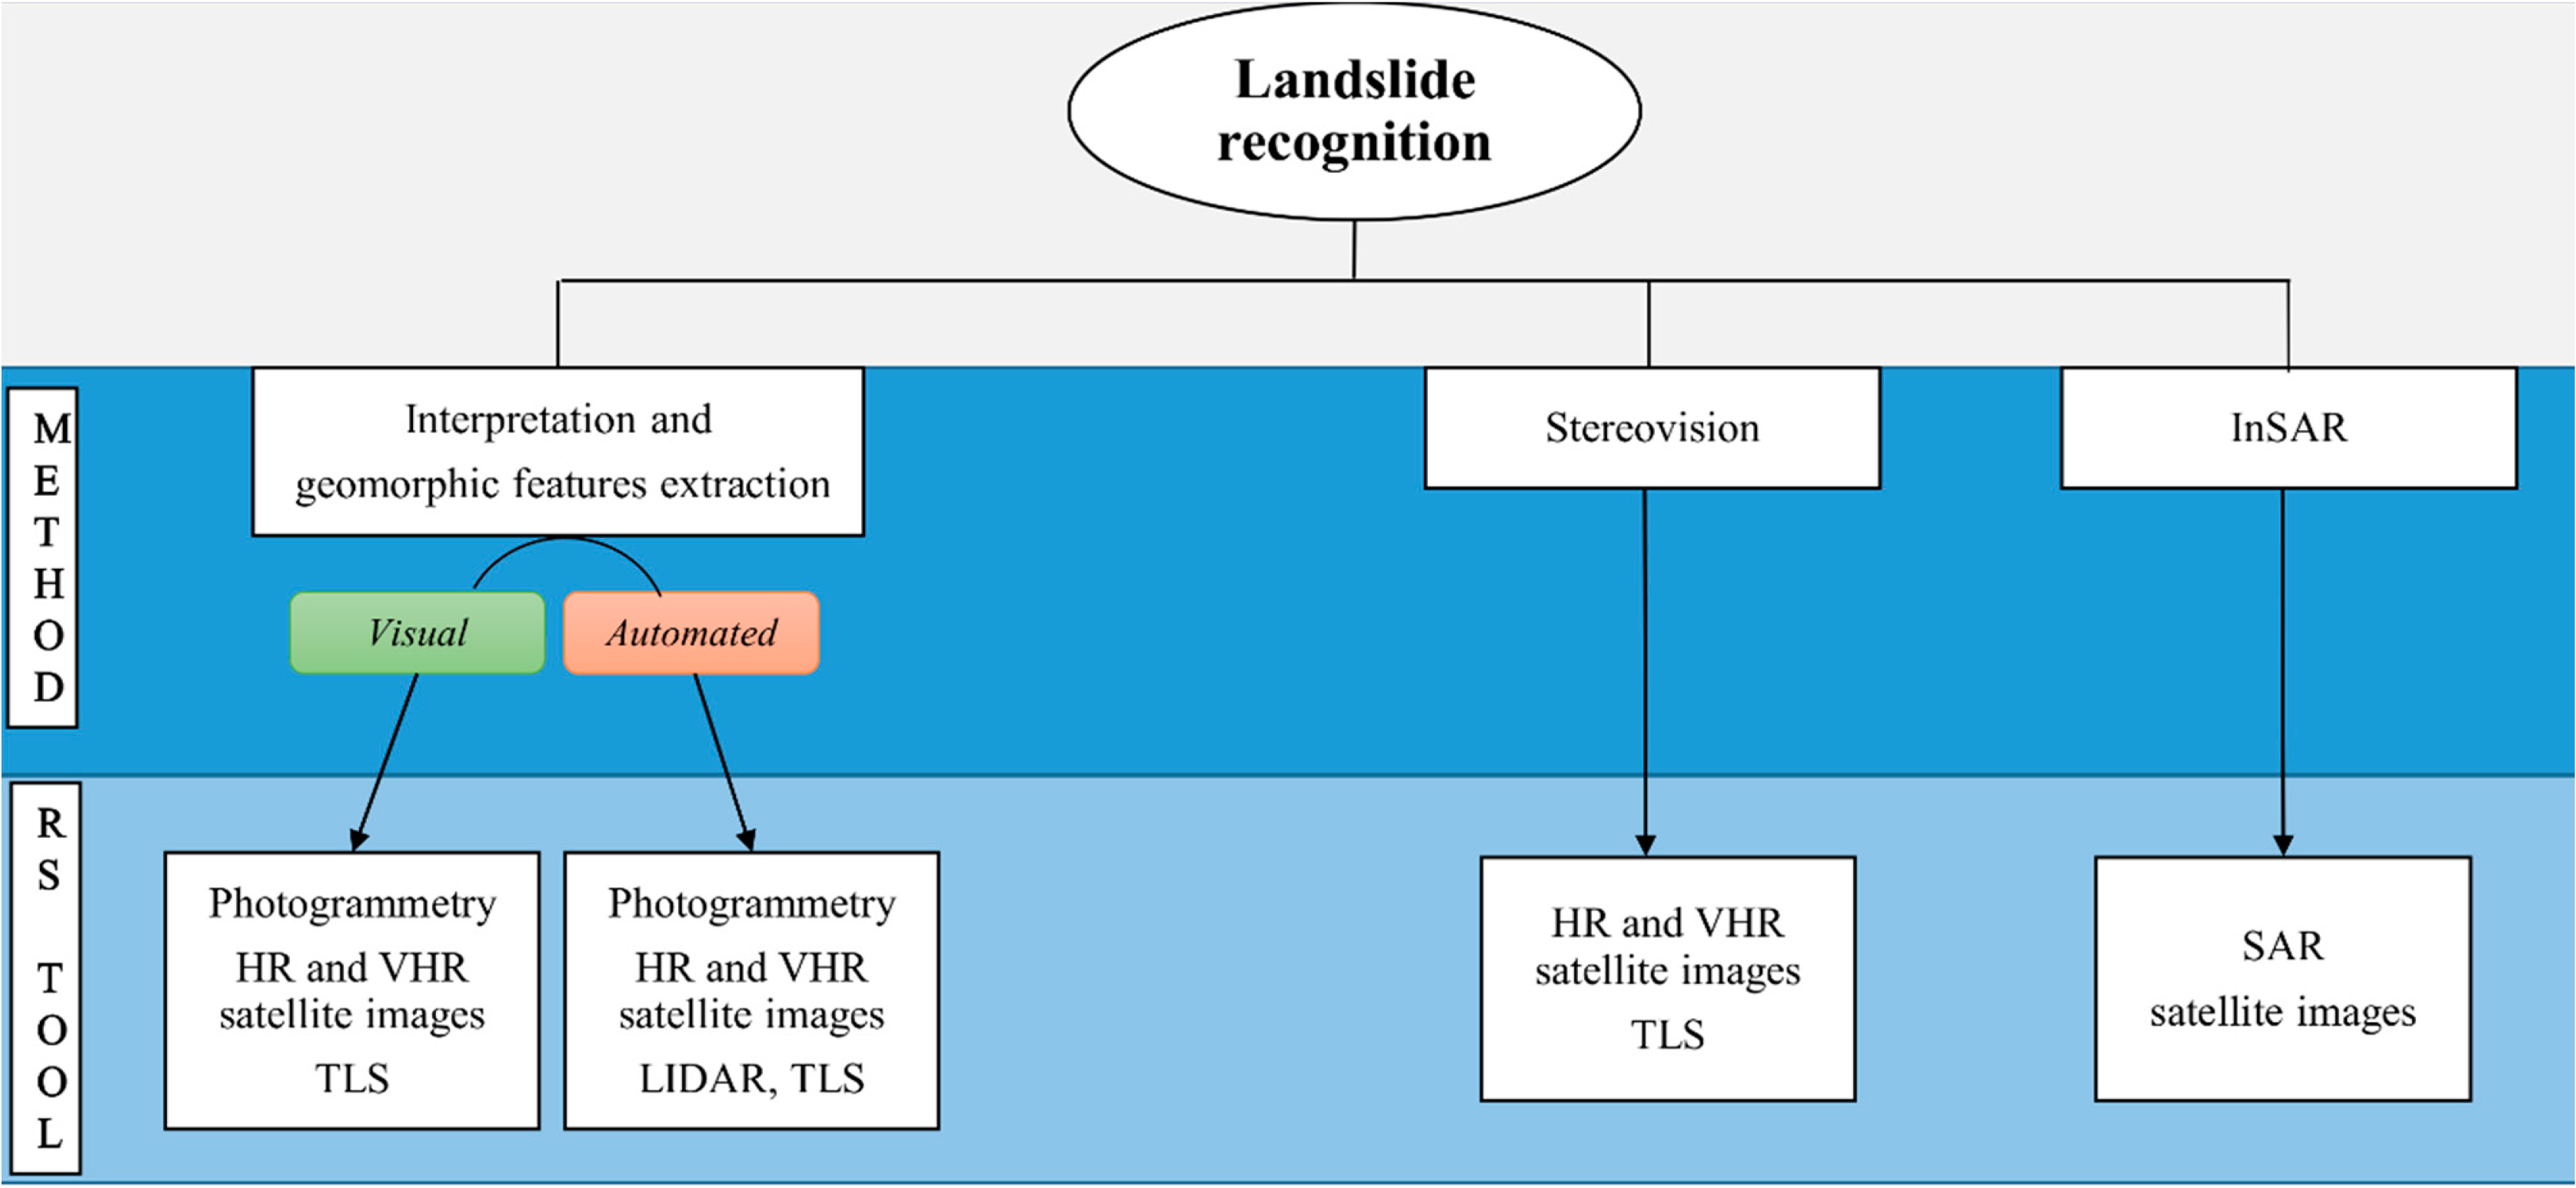
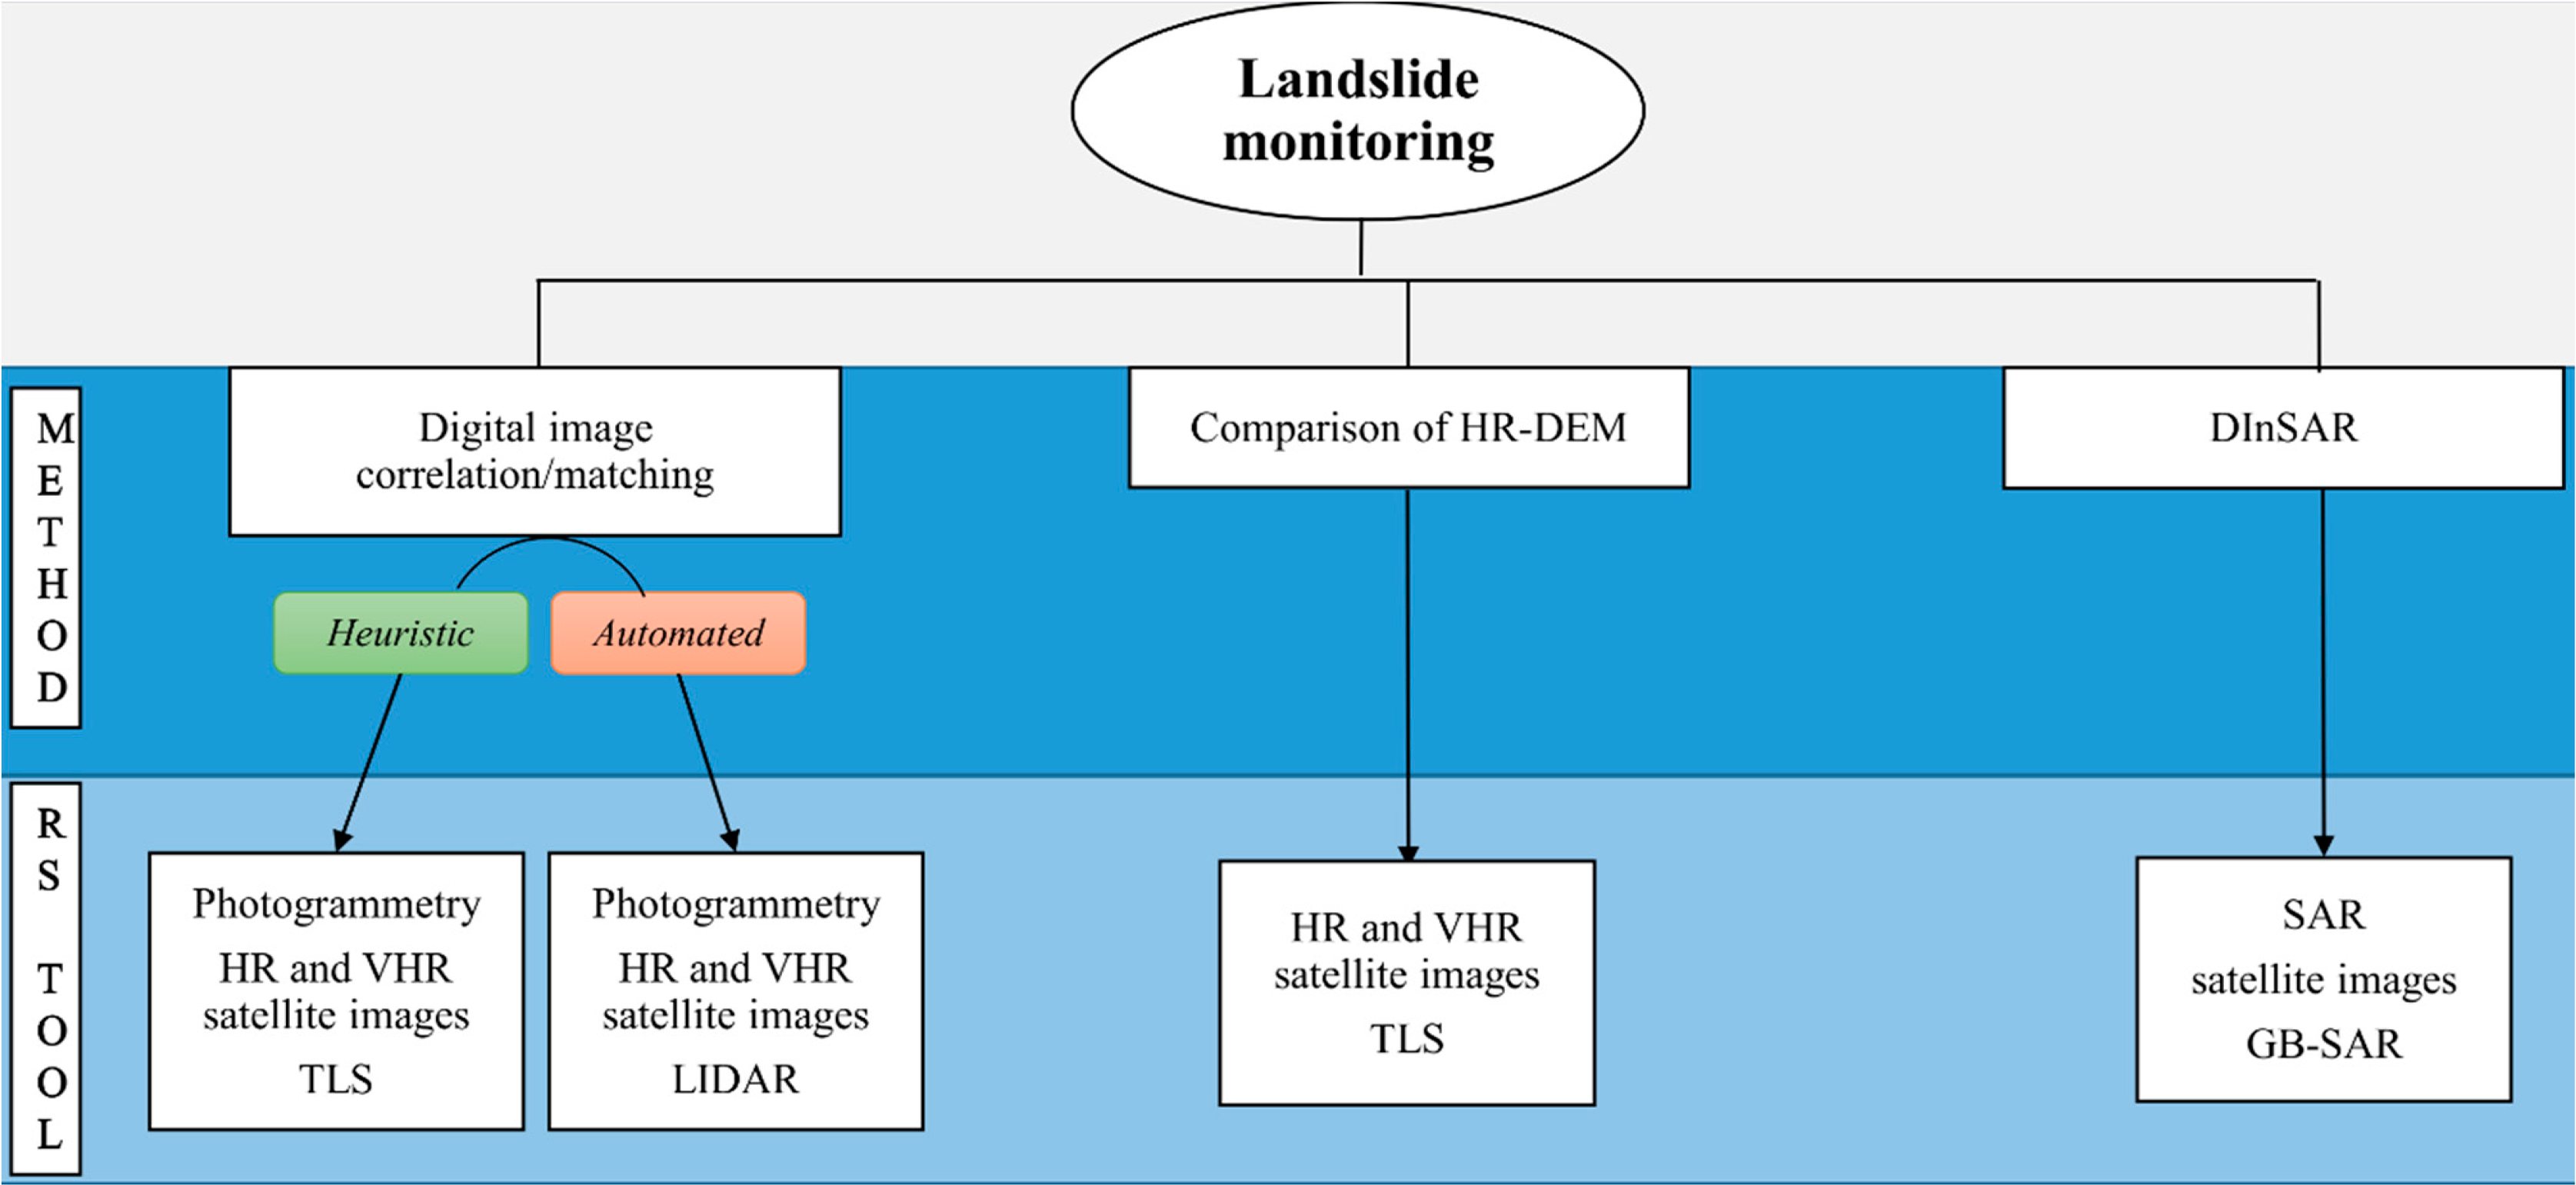
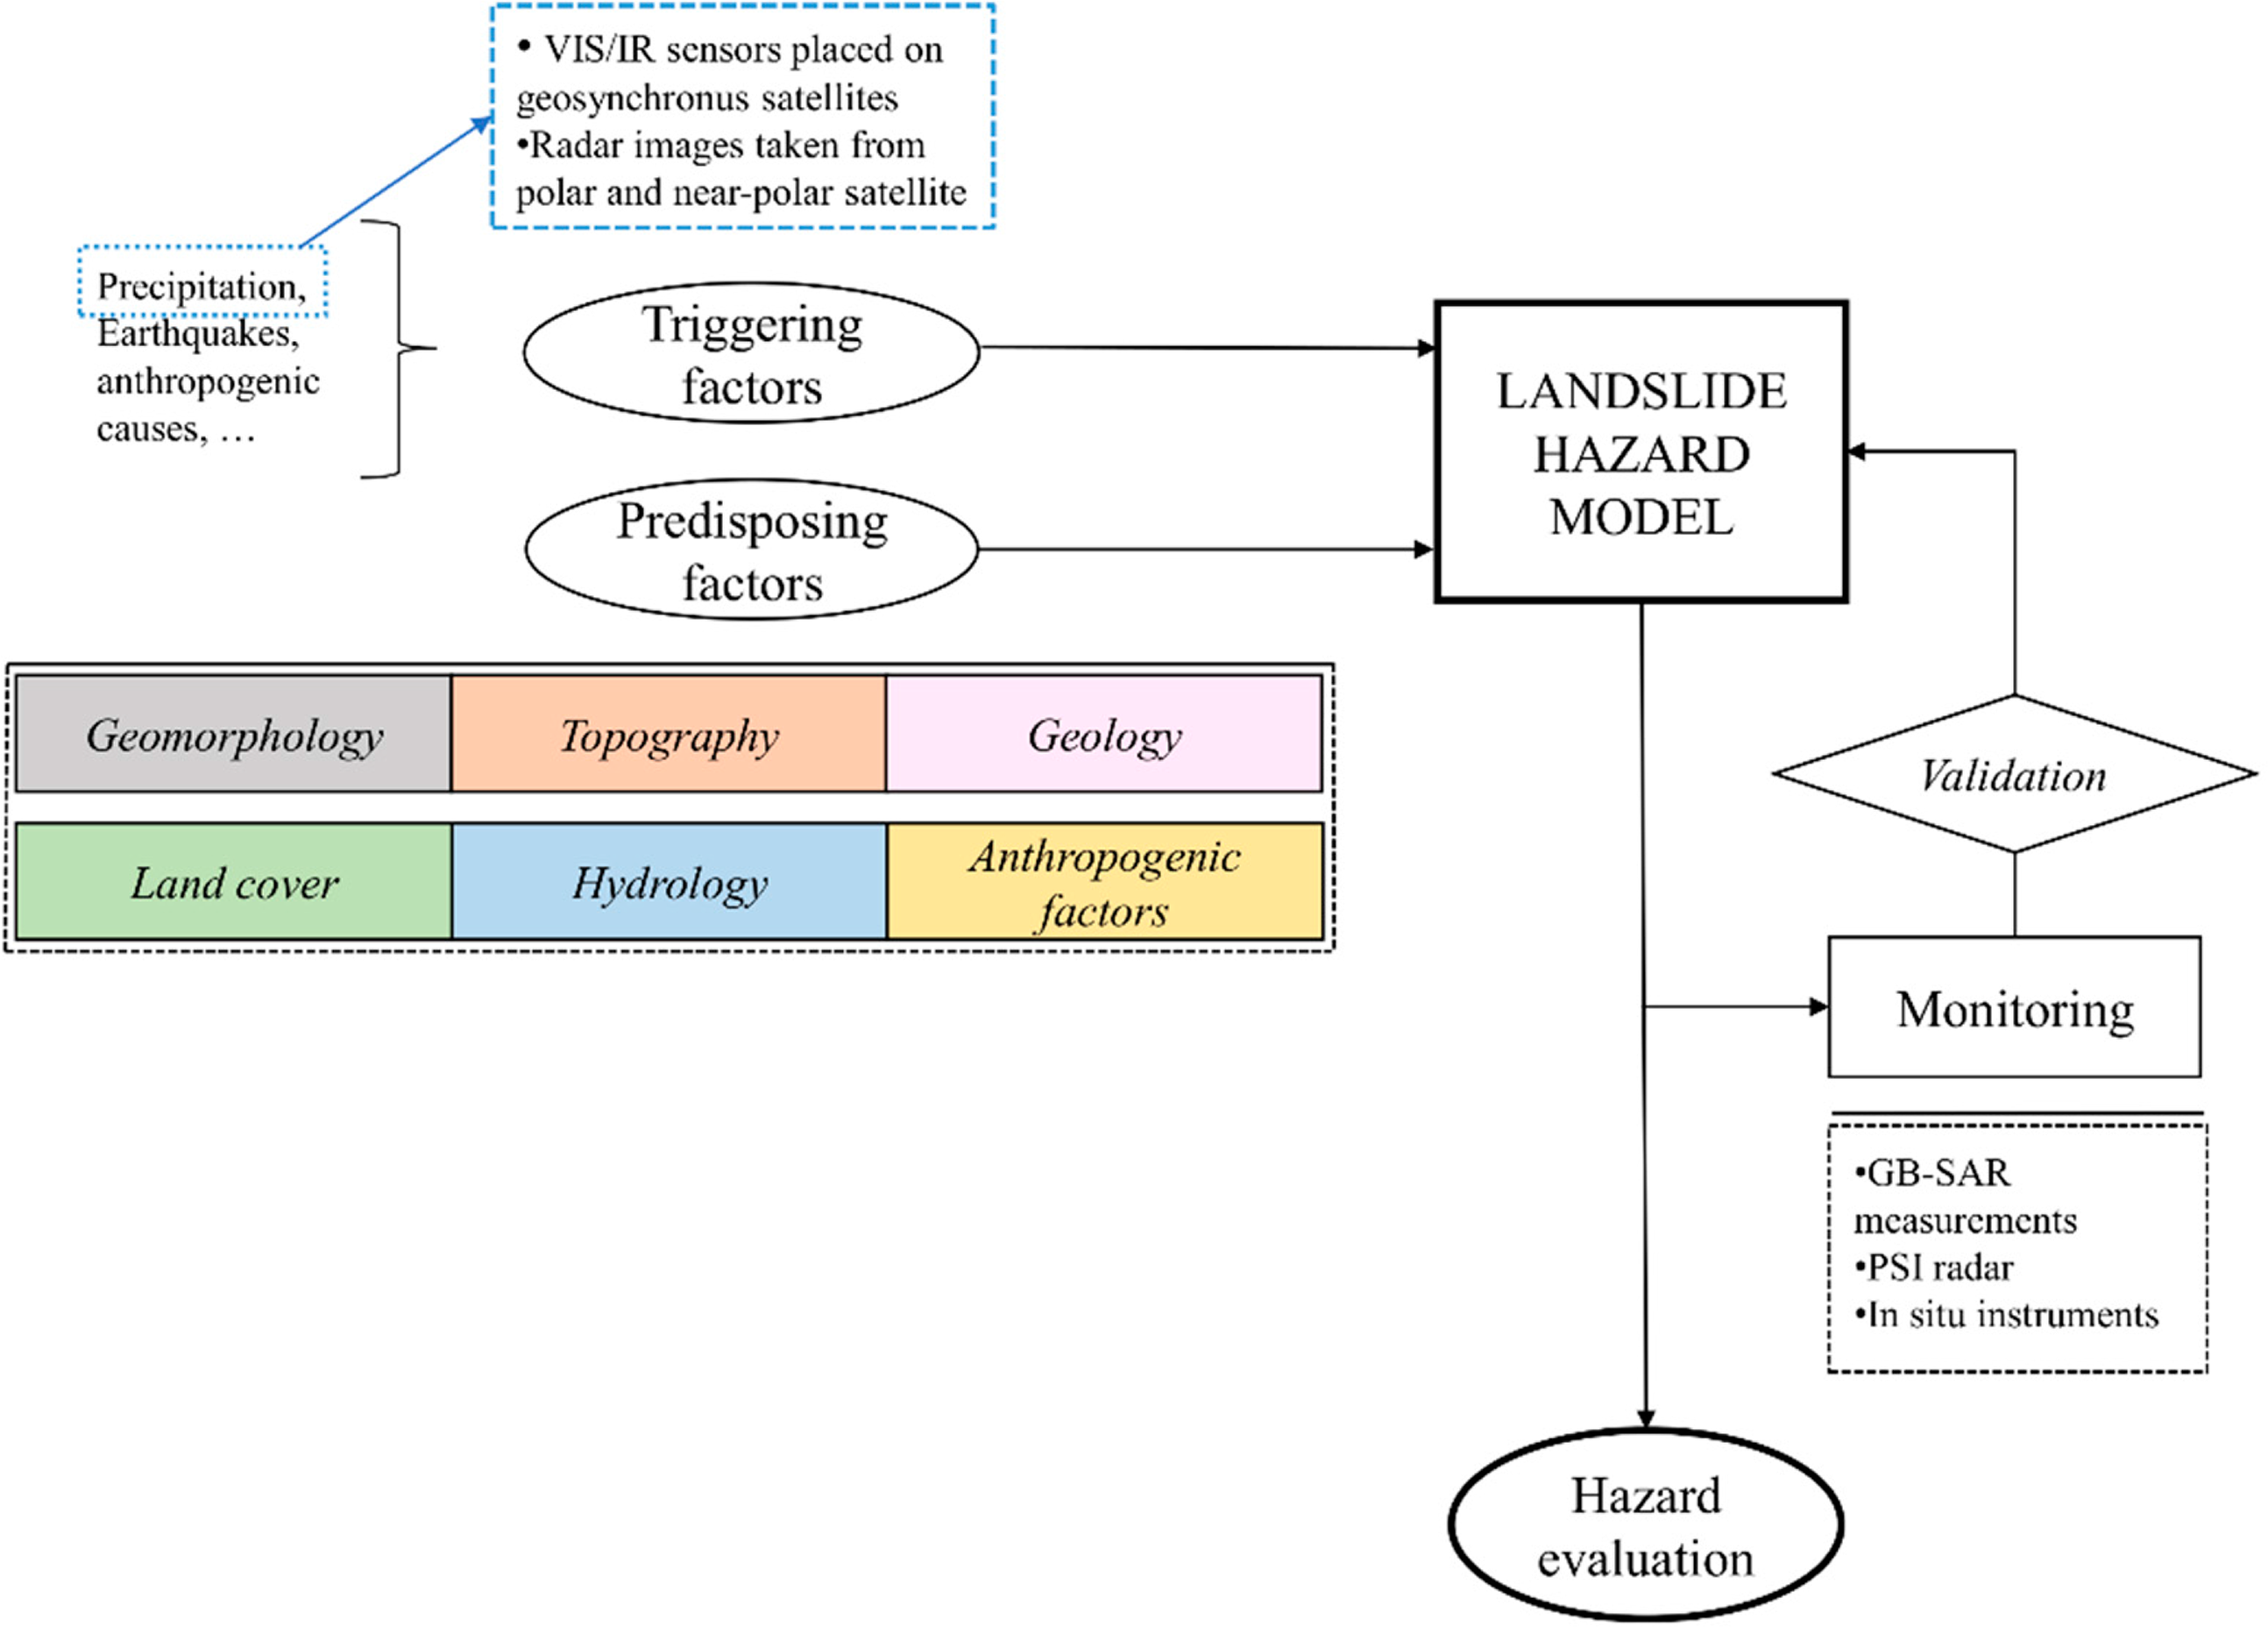
| Landslide Recognition | |||
|---|---|---|---|
| Method | RS Tool | Authors | |
| Visual interpretation & geomorphic features extraction | Manual | Aerial photogrammetry and HR/VHR satellite images | Marcelino et al. 2009 [26]; Tsai et al. 2010 [24]; Gao & Maroa, 2010 [27]; Fiorucci et al. 2011 [25]; Ghosh et al. 2012 [34]; Murillo-García et al. 2014 [28]; Dagdelender et al. 2014 [51]; Othman & Gloaguen, 2013 [46] |
| Laser scanning | Agliardi et al. 2009 [103]; Corsini et al. 2009 [104]; Oppikofer et al. 2009 [105] | ||
| Automated/Semi-automated | Aerial photogrammetry | Eisenbeiss, 2008 [128]; Rau et al. 2011 [48]; Wiegand et al. 2013 [33] | |
| HR/VHR satellite images | Cheng et al. 2004 [32]; Barlow et al. 2006 [23]; Moine et al. 2009 [42]; Blaschke, 2010 [40]; Lu et al. 2011 [41]; Mondini et al. 2011 [47]; Lacroix et al. 2013 [38] | ||
| Airbornelaser scanning | Chigira et al. 2004 [116]; Glenn et al. 2006 [107]; Ardizzone et al. 2007 [108]; Borlat et al. 2007 [109]; Sato et al. 2007 [110]; Van Asselen & Seijmonsbergen, 2007 [111]; Booth et al. 2009 [114]Kasai et al. 2009 [113]; Bull et al. 2010 [115]; Huat et al. 2012 [118]; Rau et al. 2012 [117]; Tarolli et al. 2012 [112] | ||
| Terrestrial laser scanning | Rosser et al. 2005 [120]; Lim et al. 2005 [121]; Squarzoni et al.2008 [75]; Oppikofer et al. 2009 [105,123]; Abellán et al. 2010 [122]; Stock et al. 2011 [129]; Jaboyedoff et al. 2012 [95]; Longoni et al. 2012 [119]; Viero et al. 2012 [125]; Pesci et al. 2012 [126] | ||
| Stereovision | HR/VHR satellite images | Haeberlin et al. 2004 [54]; Bajracharya & Bajracharya, 2008 [55]; Alkevli & Ercanoglu, 2011 [56] | |
| SAR Interferometry | Spaceborne InSAR | Ferretti et al. 2001 [80]; Farina et al. 2006 [87]; Reidel & Walter, 2008 [88]; Guzzetti et al. 2009 [89]; Lauknes et al. 2010 [92]; Yonezawa et al. 2012 [78]; Hölbling et al. 2012 [90]; Lu et al. 2012 [91]; Righini et al. 2012 [86]; Lu et al. 2014 [93] | |
| Landslide Monitoring | |||
|---|---|---|---|
| Method | RS tool | Authors | |
| Digital Image correlation/matching | Heuristic | Aerial photogrammetry | Kääb, 2000 [73]; Travelletti et al. 2012 [144] |
| Aerial photogrammetry and HR/VHR satellite images | Delacourt et al. 2004 [141] | ||
| Automated | Aerial photogrammetry | Brückl et al. 2006 [149]; Eisenbeiss, 2008 [128]; Niethammer et al. 2012 [18] | |
| Aerial photogrammetry and HR/VHR satellite images | Debella-Gilo & Kääb, 2012 [140] | ||
| HR/VHR satellite images | Barazzetti et al. 2014 [134] | ||
| Comparison of HR-DEM | HR/VHR satellite images | Brückl et al. 2006[149]; Eisenbeiss, 2008 [128] | |
| Airbornelaser scanning | Baldo et al. 2009 [214]; Corsini et al. 2009 [104]; Sterzai et al. 2010 [61] | ||
| Terrestrial laser scanning | Bitelli et al. 2004 [207]; Prokop & Panholzer, 2009 [210]; Pesci et al. 2013 [220] | ||
| SAR Interferometry | Ground-based InSAR | Tarchi et al. 2003 [190]; Canuti et al. 2004 [4]; Luzi et al. 2006 [194]; Noferini et al. 2007 [195]; Arosio et al. 2009 [201]; Barla et al. 2010 [196]; Casagli et al. 2010 [197]; Nolesini et al. 2010 [198]; Del Ventisette et al. 2012 [199] | |
| Spaceborne InSAR | Ferretti et al. 2001 [80]; Crosetto et al. 2005 [79]; Hilley et al. 2004 [163]; Cascini et al. 2009 [165]; Notti et al. 2010 [170]; Lei et al. 2012 [168,169]; Delgado et al. 2011[173]; Herrera et al. 2011 [166]; 2013 [167]; Liao et al. 2012 [171]; Žibret et al. 2012 [172] | ||
| Landslide Hazard Model | ||
|---|---|---|
| Predisposing Factors | RS tool | Authors |
| Geomorphology | DEM resolution | Claessens et al. 2005 [252]; Van de Eeckhaut et al. 2009 [254] |
| Landslide inventory maps | Nichol & Wong, 2005 [37]; Nichol et al. 2006 [58] | |
| Topography | DEM from optical aerial and VHR satellite images | Nichol et al. 2006 [58]; Fiorucci et al. 2011 [25] |
| InSAR DEM | Dong et al. 2008 [258] | |
| HR-DEM from ALS | Schulz, 2007 [259]; Agliardi et al. 2009 [103]; Corsini et al. 2009 [104]; Borkowski et al. 2011 [98]; Razak et al. 2011 [99] | |
| Geology | Satellite optical images | Erener & Düzgün, 2008 [261] |
| Hyperspectral sensors | Van der Meer et al. 2012 [60] | |
| Land cover | NDVI from optical satellite images | Vohora & Donoghue, 2004 [20]; Ayalew & Yamagishi, 2005 [256]; Lee, 2005 [247]; Al-Hassideh & Bill, 2008 [262]; Gong et al. 2012 [263] |
| Hydrology | Spaceborne and airborne thermal infrared (TIR) | Hong et al. 2007 [264], Brocca et al. 2012 [265] |
| Geological maps, DEMs, land use maps and orthophotos | Lee & Lee, 2006 [36]; Lee & Pradhan, 2006 [266] | |
| Anthropogenic factors | Buffering | Van Westen et al. 2008 [237]; Bai et al. 2011 [267] |
| RS Tool | Platform | Phase | Author(s) | Automation | Integration |
|---|---|---|---|---|---|
| Falls | |||||
| TLS | T | R | Abellán et al. 2010 [122]; Stock et al. 2010 [129]; Jaboyedoff et al. 2012 [95]; Longoni et al. 2012 [119] | N | N |
| M | Rosser et al. 2005 [120]; Abellán et al. 2009 [222]; 2011 [217]; 2013 [215]; Pedrazzini et al. 2010 [229] | N | N | ||
| TIR | T | R | Squarzoni et al. 2008 [75]; Baroň et al. 2014 [74] | N | Y |
| GBSAR | T | M | Arosio et al. 2009 [201] | N | Y |
| Slides | |||||
| Deep seated landslides | |||||
| APh | A | R | Moine et al. 2009[42]; Ghosh et al. 2012 [34] | Y | Y |
| M | Brückl et al. 2006 [149] | N | Y | ||
| HR/VHR | S | M | Delacourt et al. 2004 [141]; 2007[138]; Debella-Gilo and Kääb, 2011 [140] | Y | Y |
| UAV | A | M | Eisenbeiss, 2008 [128] | N | Y |
| InSAR | S | R | Lauknes et al. 2010 [92]; Righini et al. 2012 [86] | N | N |
| M | Hilley et al. 2004 [163], Peyret et al. 2008 [177]; Cascini et al. 2009 [165]; Notti et al. 2010 [170]; Lei et al. 2012 [168]; 2012 [169]; Herrera et al. 2011 [166]; 2013 [167] | N | N | ||
| GBSAR | T | M | Noferini et al. 2007 [195]; Barla et al. 2010 [196]; Casagli et al. 2010 [197]; Del Ventisette et al. 2012 [199] | N | N |
| ALS | A | R | Van den Eeckhaut et al. 2007 [100]; Agliardi et al. 2009 [103]; Kasai et al. 2009 [113]; Booth et al. 2009 [114] | N | N |
| TLS | T | R | Eisenbeiss 2008 [128] | N | N |
| R | Squarzoni et al. 2008 [75]; Viero et al. 2012 [125] | N | Y | ||
| M | Oppikofer et al. 2009 [105]; Prokhop & Panholzer et al. 2009 [210] | N | N | ||
| Shallow landslides | |||||
| APh | A | R | Wiegand et al. 2005 [33]; Santangelo et al. 2010 [127]; Rau et al. 2011 [117]; Ghosh et al. 2012 [34]; Zilioli et al. 2014 [289] | Y | N |
| HR/VHR | S | R | Tsai et al. 2009 [24]; Mondini et al. 2011 [47] | Y | Y |
| ALS | A | R | Tarolli et al. 2012 [112] | N | N |
| TLS | T | R | Santangelo et al. 2010 [127] | N | Y |
| InSAR | S | R | Lauknes et al. 2010 [92] | N | N |
| Flows | |||||
| APh | A | M | Kääb, 2000 [73] | N | Y |
| InSAR | S | R | Yonezawa et al. 2011 [78] | N | N |
| ALS | A | R | Bull et al. 2010 [115]; Huat et al. 2012 [118] | N | Y |
| M | Corsini et al. 2009 [203]; Sterzai et al. 2010 [61] | N | Y | ||
| TLS | T | R | Oppikofer et al. 2009 [123]; Theules et al. 2009 [124] | N | N |
| M | Oppikofer et al. 2009 [123] | N | N | ||
| Complex and compound landslides | |||||
| APh | A | M | Van Westen & Getahun, 2003 [145] | N | N |
| UAV | A | M | Travelletti et al. 2012 [144] | N | Y |
| ALS | A | R | Corsini et al. 2009 [104]; Sterzai et al. 2010 [61] | N | Y |
| M | Baldo et al. 2009 [214]; Corsini et al. 2009 [203] | N | Y | ||
| InSAR | S | M | Farina et al. 2006 [87]; Casagli et al. 2009 [197]; Delgado et al. 2011 [173]; Raoucoules et al. 2013 [174] | N | N |
| GBSAR | T | M | Tarchi et al. 2003 [190]; Luzi et al. 2006 [194] | N | N |
© 2014 by the authors; licensee MDPI, Basel, Switzerland This article is an open access article distributed under the terms and conditions of the Creative Commons Attribution license (http://creativecommons.org/licenses/by/4.0/).
Share and Cite
Scaioni, M.; Longoni, L.; Melillo, V.; Papini, M. Remote Sensing for Landslide Investigations: An Overview of Recent Achievements and Perspectives. Remote Sens. 2014, 6, 9600-9652. https://doi.org/10.3390/rs6109600
Scaioni M, Longoni L, Melillo V, Papini M. Remote Sensing for Landslide Investigations: An Overview of Recent Achievements and Perspectives. Remote Sensing. 2014; 6(10):9600-9652. https://doi.org/10.3390/rs6109600
Chicago/Turabian StyleScaioni, Marco, Laura Longoni, Valentina Melillo, and Monica Papini. 2014. "Remote Sensing for Landslide Investigations: An Overview of Recent Achievements and Perspectives" Remote Sensing 6, no. 10: 9600-9652. https://doi.org/10.3390/rs6109600