Remote Sensing Image Interpretation for Urban Environment Analysis: Methods, System and Examples

Abstract
: Remote sensing imagery has been widely used in urban growth and environment analysis with many effective and advanced strategies being developed. However, most of these approaches are separated from each other. There is an urgent need to combine different modules into some practical processing chains. Firstly, we present a comprehensive analysis of key processing chains in applying remote sensing images to urban environment analysis from such aspects as Land Use/Land Cover (LULC), urban landscape ecology, Urban Heat Islands (UHIs), vegetation and water monitoring, change detection, urban ecological security assessment and urban environmental mapping. Secondly, an integrated system, namely Urban Environment Analysis System (UEAS), is implemented based on the aforementioned processing chains to analyze urban environment using multi-temporal and multi-source remotely sensed data. Several case studies are demonstrated to confirm the effectiveness of the integrated system and the combined processing chains. The contributions of this paper lie in introducing ensemble learning to urban environment remote sensing, combining remote sensing derived information with thematic models for urban environment assessment, and developing an integrated system for urban environment analysis.1. Introduction
Effective and sustainable urban management increasingly requires advanced techniques to obtain various and up-to-date information on the pattern, state, characteristics, and development of an urban environment [1]. Remotely sensed imagery is an effective data source for urban environment analysis that is inherently suited to provide information on urban land cover characteristics and their changes over time at various spatial and temporal scales [2–6]. In the past decades, remote sensing has been widely used in various applications, such as urban structure extraction, urbanization monitoring, change detection, and so on [5,7–13]. With the development and innovations in data, technologies, and theories in the wider arena of earth observation, urban remote sensing has rapidly gained popularity among a wide variety of communities from many aspects such as Land Use/Land Cover (LULC) mapping, Urban Heat Islands (UHIs) analysis, impervious surface area estimation and urban ecological security assessment [12].
Many algorithms and models have been developed to analyze urban environment [5–13]. However, they are usually implemented with independent functions in separate modules. Since different remotely sensed images have various spatial, temporal, spectral, and radiometric characteristics, it is challenging to produce accurately thematic information and quantitative indicators using only one model. Therefore, it is important to combine some useful but separated modules into efficient processing chains, re-organize different image processing tasks from the viewpoint of urban environment analysis, and integrate remote sensing derived thematic information with thematic models for practical uses. In this paper, we present a comprehensive analysis of key techniques for remote sensing analysis of urban environment, such as LULC, urban landscape ecology, UHIs, vegetation and water extraction, change detection and urban ecological security assessment. After that, an integrated system, namely Urban Environment Analysis System (UEAS), is implemented for the analysis of urban expansion and environmental changes using multi-temporal and multi-source remotely sensed data.
The contributions of this paper are: (1) proposing practical image processing chains for urban environment analysis by re-organizing and combining generally different and separate tools; (2) applying ensemble learning to an urban area to improve the performance of image classification and change detection; (3) combining remote sensing derived information with thematic models for urban environment assessment and (4) developing an integrated system for urban environment analysis using multi-source and multi-temporal remotely sensed images.
The rest of this paper is organized as follows. A systematic review of key techniques for urban environment analysis is presented in Section 2. In Section 3, several key processing chains are proposed. The implementation of UEAS is briefly introduced in Section 4. In addition, we also provide several studies conducted by UEAS. Finally, Section 5 concludes the work with some remarks.
2. Key Elements and Approaches for Remote Sensing Analysis for Urban Environment
2.1. LULC Classification and Change Detection over the Urban Area
Image classification and change detection are two of the most popular techniques for monitoring LULC in urban areas. Remote sensing image classification or change detection is a complex process which requires consideration of many factors. The major steps include selection of remotely sensed data, determination of a proper classification or detection system, image preprocessing, feature selection/extraction, selection of suitable classification or detection approaches, post-classification processing and accuracy assessment [14]. A suitable classification or detection system and remotely sensed imagery should be chosen according to the characteristic of images, land cover types, atmospheric condition, the objective of study, and the capacity of hardware and software. Generally speaking, classification and change detection techniques can be grouped into two main categories: supervised and unsupervised. The former needs a number of samples for training the supervised classifier or detector according to prior knowledge of the study area and used dataset. Representative methods include Post-Classification Comparison (PCC) [15], Support Vector Machine (SVM) [16] and Artificial Neural Network (ANN) [17]. The latter directly derives spectral clusters and extracts ground changes without support from ground samples. Typical algorithms consist of Iterative Self Organizing Data Analysis (ISODATA), K-means for classification, image differencing [18], Principal Component Analysis (PCA) [19], and Change Vector Analysis (CVA) for change detection [20].
2.2. Urban Heat Islands
Land Surface Temperature (LST) is an important parameter and plays a significant role in urban environment analysis, climate change, and ecology monitoring [10]. Remote sensing has been viewed as one of the most effective tools for LST inversion and urban heat islands analysis. Thermal Infrared (TIR) data are used to retrieve LST by measuring Top Of Atmosphere (TOA) radiances [21]. Various approaches, including radiative transfer and split-window techniques, etc., have been developed and extensively used in the literature [22,23]. In this paper, Mono-Window Algorithm (MWA), Single-Channel Algorithm (SCA) and improved Temperature and Emissivity Separation algorithm (TES) are used to retrieve LST from Landsat TM and ASTER TIR channels. The details of these approaches can be found in [22–24].
2.3. Vegetation and Water Body Extraction over the Urban Area
Vegetation and water extraction are significant activities in determining water balance, estimating geomorphological change and are meaningful in many applications such as urban planning, disaster assessment, flood forecasting, and wetland conservation [25–29]. Vegetation extraction approaches can be divided into the following groups: vegetation indexes, classification, vegetation abundances, and greenness component derived from K-T transform. Among them, Normalized Difference Vegetation Index (NDVI) is the most popular one.
The commonly used algorithms for the extraction of water bodies can be grouped as follows: classification algorithms, band thresholds, and indexes based methods [30]. The most widely used one is Normalized Difference Water Index (NDWI). Wang et al. utilized MDWI for rapid water information extraction in China coastal zones [31]. Ruan et al. applied NDVI, NDWI and single band density slicing methods for water extent extracting [32]. Cui et al. used NDWI to remove the humidity effect in the LST retrieval process [33]. Water information extracted by NDWI is mixed with other non-water information, especially in the case of urban areas. Modified NDWI (MNDWI) is more suitable with respect to NDWI when the major part of the image is the built-up area. Ratio index models have an advantage for water body extraction for the dense river network, numerous ponds and the manmade interference region [32,34].
2.4. Evaluation of Urban Landscape and Ecology
Landscape pattern is the spatial arrangement of landscape elements in different sizes and shapes. It affects ecological processes such as transfer of substances, energy, and information, resulting in alteration of the landscape function. Analyzing landscape pattern can be used to study landscape spatial structure change. Landscape pattern is a measure of an ecosystem’s ability to prove habitat, prevent environmental degradation, and support other natural processes. In order to study the pattern change, different landscape metrics, including diversity index, shape index, patch density, mean of patch area distribution, and the landscape fractal dimension, are often adopted [35].
2.5. Urban Ecological Security Assessment
Ecological security is a recent concept, but because of its short history, it has no universally accepted definition, parameters, or appropriate research methods [36–38]. Scientists have adopted both broad and narrow concepts. Broad concepts comprise natural, economic, and social ecological security, while narrow concepts include ecosystems which are influenced by the natural aspect of human activities in specific areas [39]. Ecological security should be assessed on different scales. Global scale means processes of global change, regional scale means processes in specific areas and urban scale represents urban development. Increasing concerns over “urban ecological security” are now giving priority to strategies with regard to reconfiguring cities and their infrastructures to secure their ecological and material reproductions [40].
Different models are adopted in ecological security evaluation, such as the Pressure-State-Response (PSR) model, the Environment-Society-Economy (ESE) model and the Environment-Resource (ER) model [41]. In particular, the PSR model has been applied most widely in many fields due to its advantages, such as easy-to-use structure, understandable and neutral descriptions of environmental systems, flexible adjustment in spatial scales, easy extension, and synthetic considerations.
2.6. Urban Environmental Mapping
Ecological unit mapping has become one of the primary contents of urban and rural ecological planning [42]. On the basis of the city information, urban ecological unit mapping is used to divide ecological units into different elements (for instance, public land use, buildings, vegetation, roads and water bodies) and to record their spatial and attribute data [43].
The methodologies for ecological unit mapping can be roughly divided into three categories: selective mapping for focus areas, regional mapping based on typical samples, and whole region mapping based on remote sensing [44]. On the support by Geographic Information System (GIS) and Remote Sensing (RS) technologies, the major steps for urban environmental unit mapping include [43]: data collection; the preliminary interpretation of remotely sensed data (tone or color, shadow, size, shape, texture, pattern); site information collection, and field investigation; the classification of ecological units and validation; and field verification for ecological unit maps.
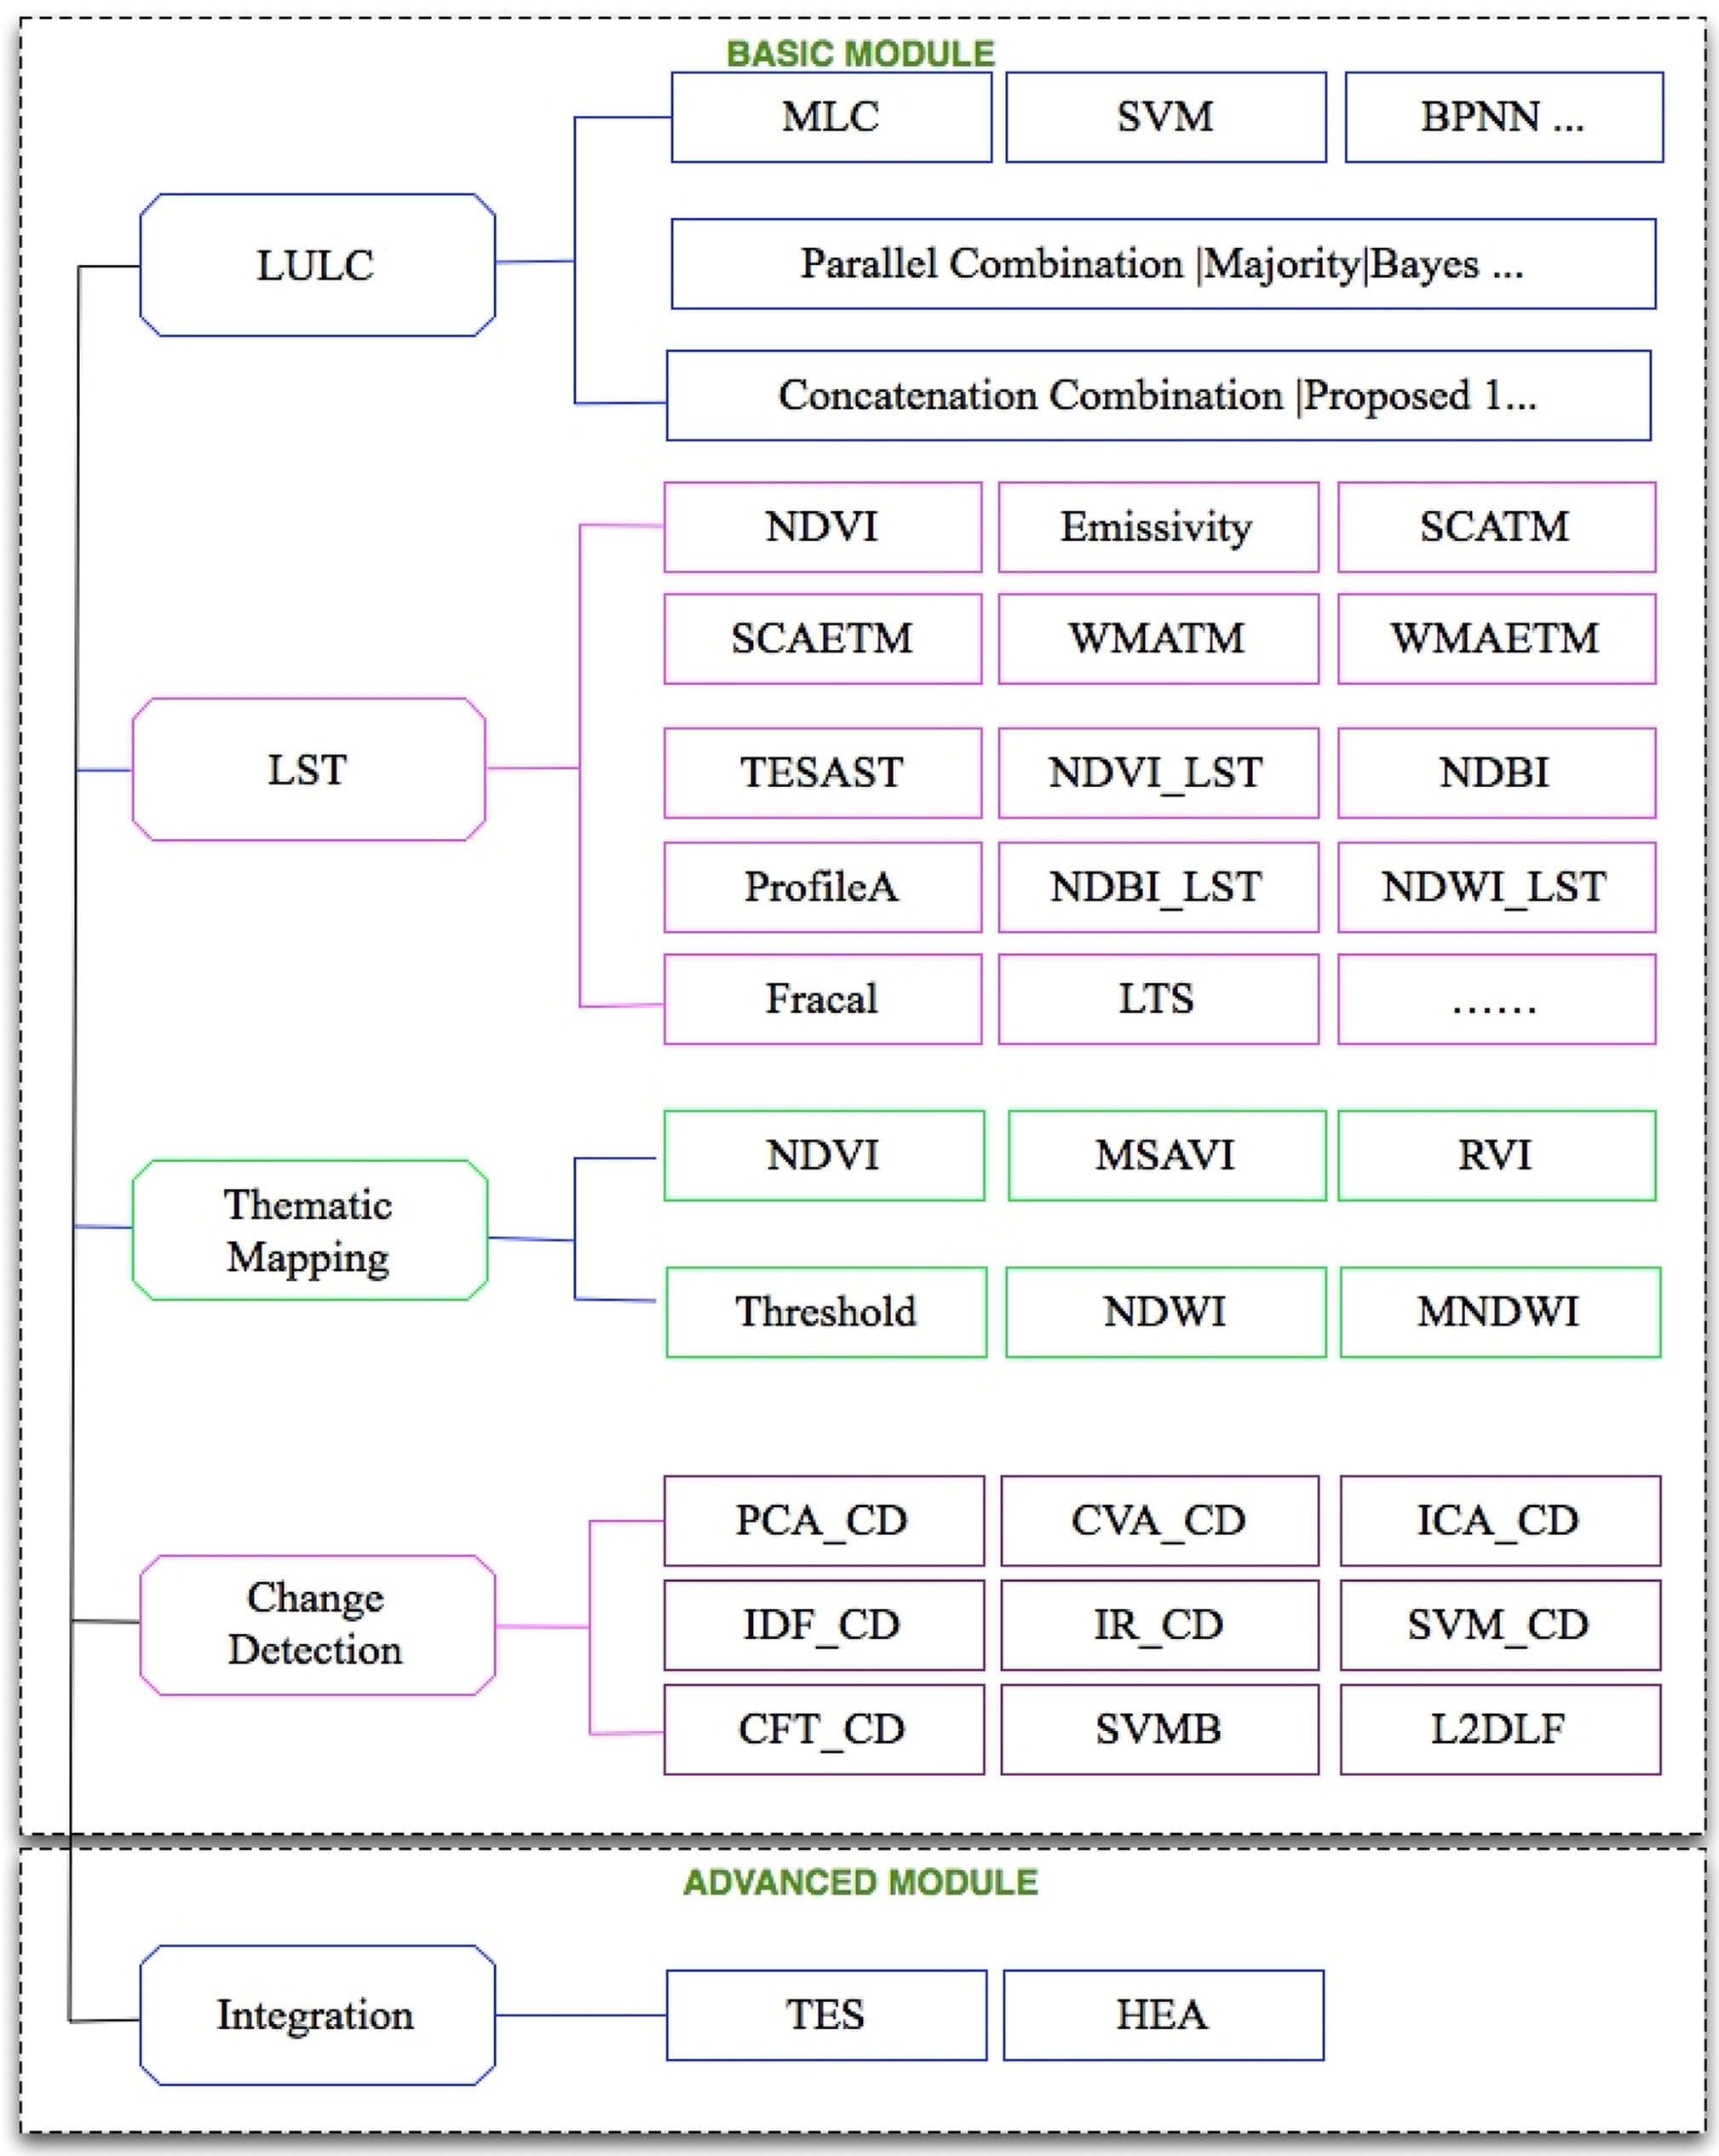
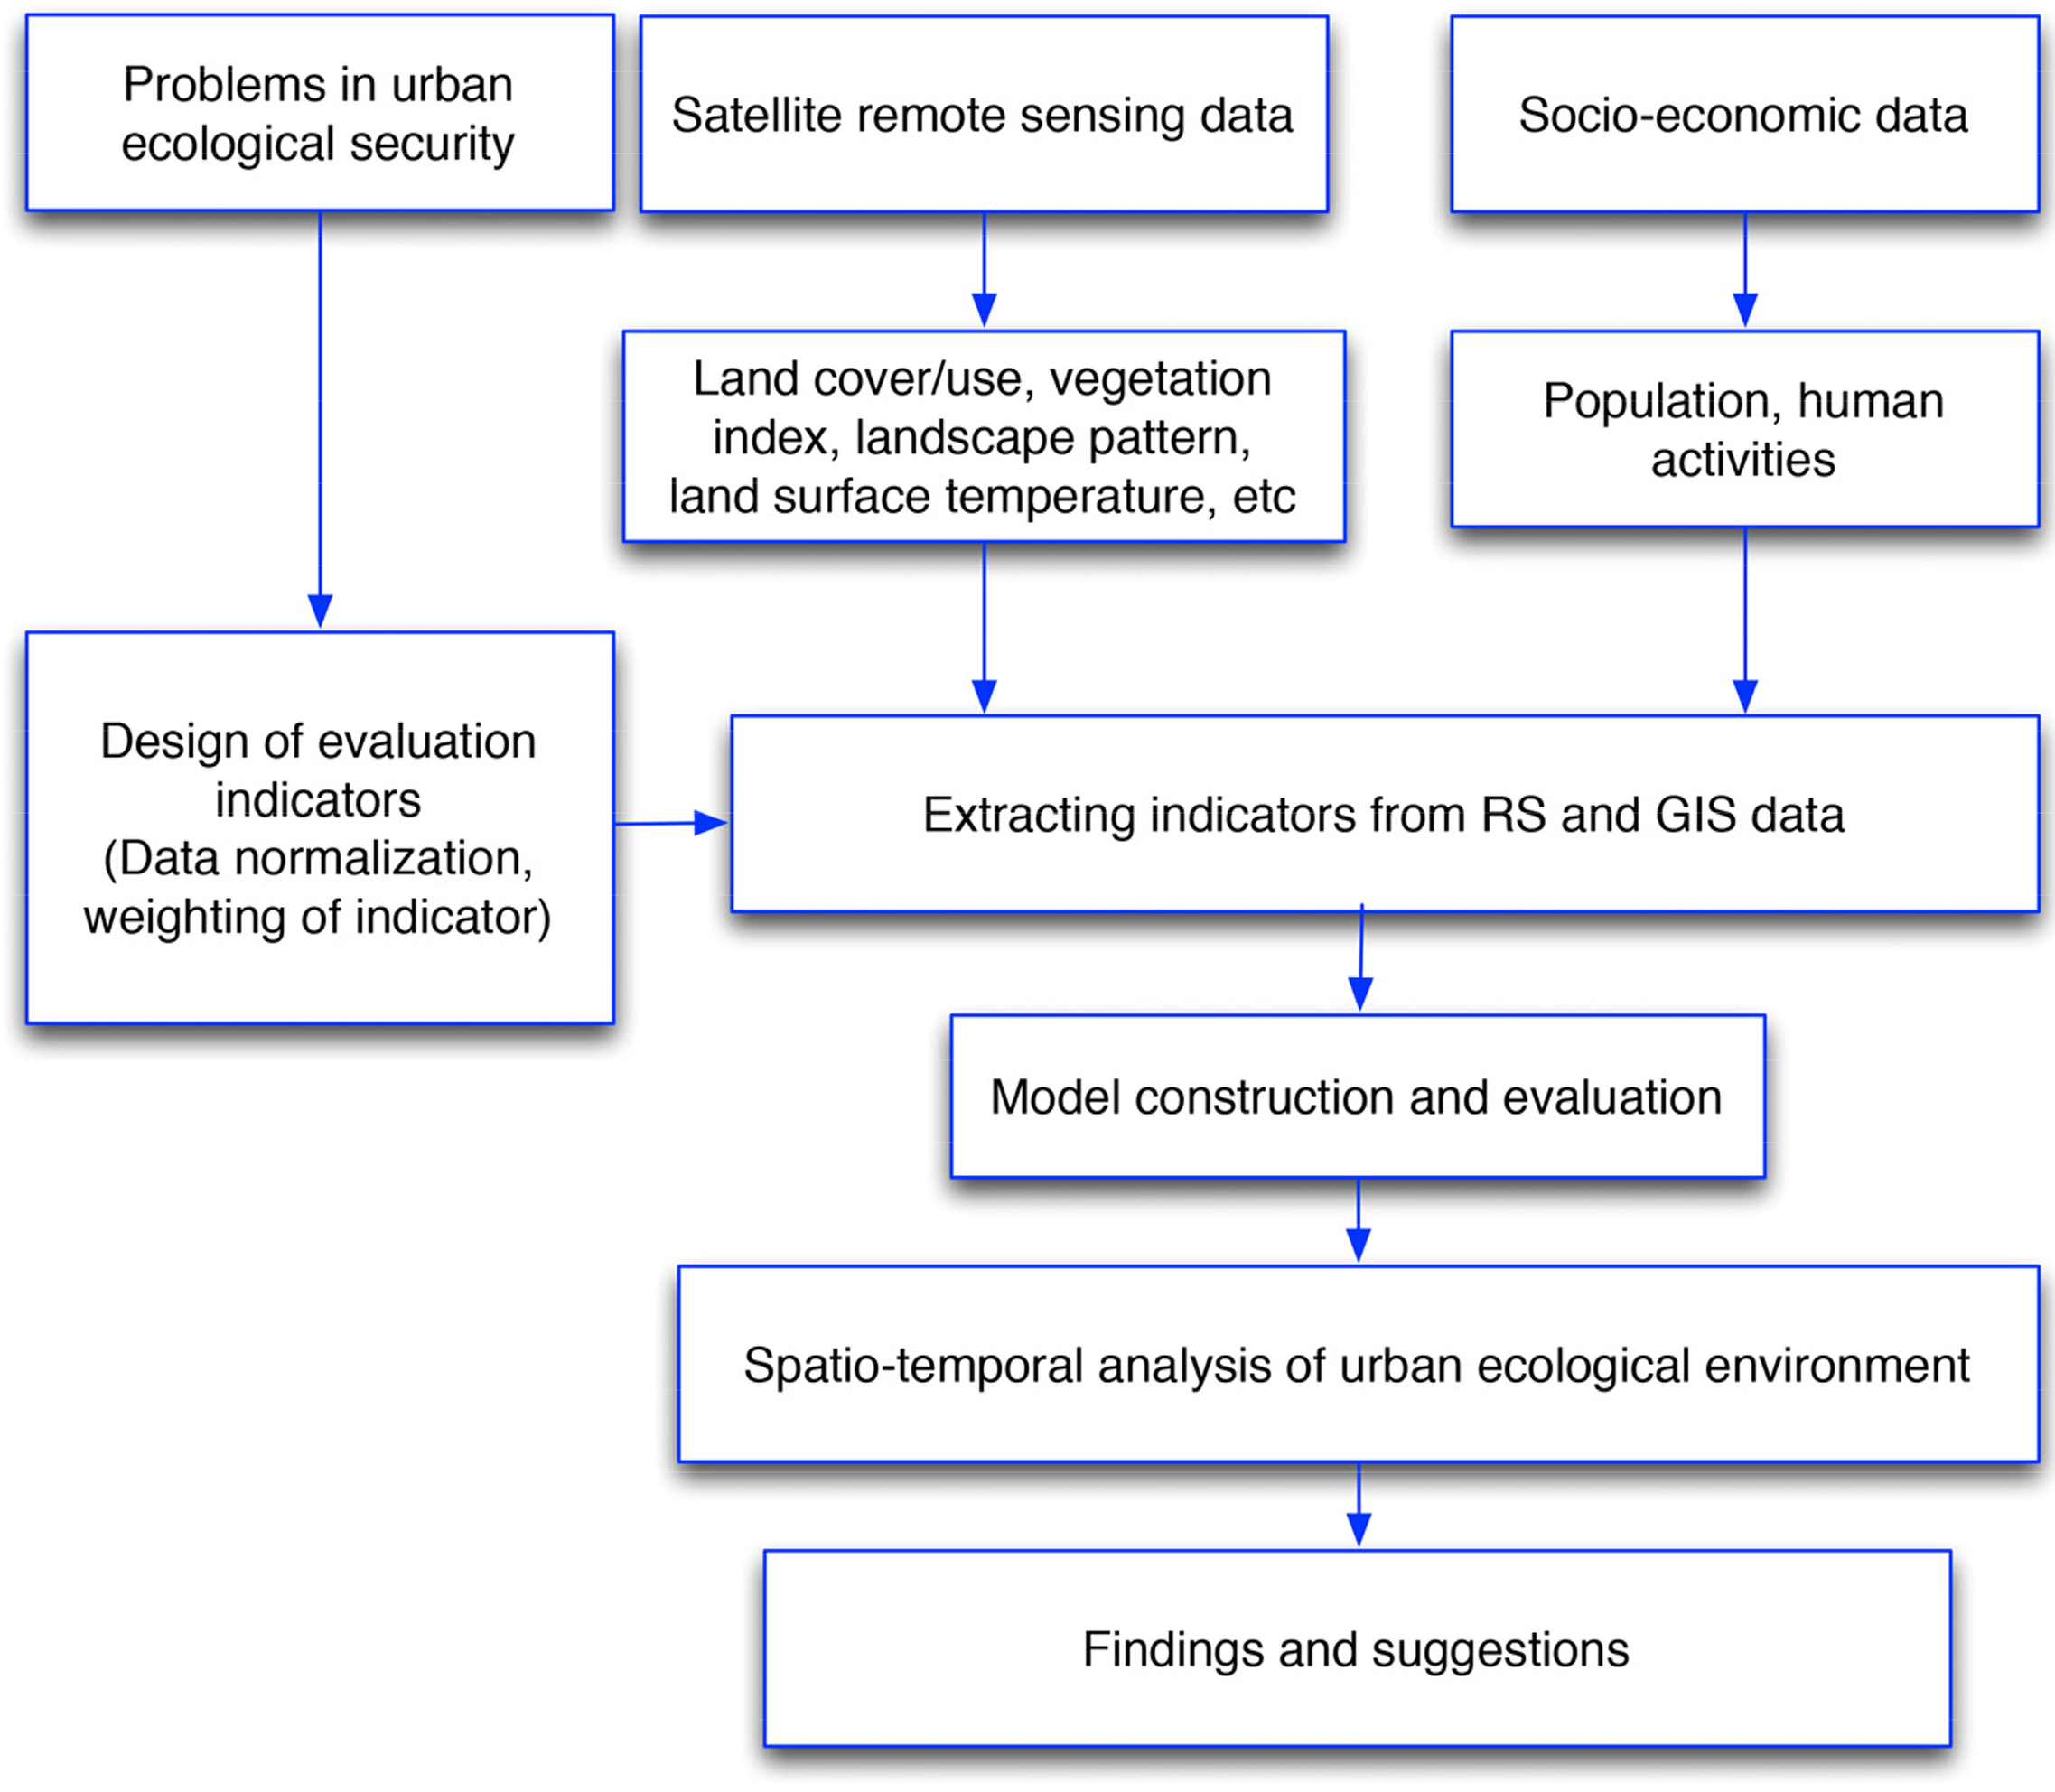
In order to address the requirements of urban environment remote sensing, a systematic chart summarizing the approaches in different modules used for urban environment analysis is shown in Figure 1. These modules are given specialized names of LULC, LST (corresponding to UHIs), thematic mapping, change detection and integration.
3. Design of Effective Remote Sensing Image Processing Chains for Urban Environment Analysis
As we discussed before, most of the tools and algorithms are separated. In order to process remote sensing data more effectively, we managed to combine different modules and re-organize related tasks to form some processing chains for urban remote sensing. These processing chains will be implemented in our integrated system.
LULC: LULC maps can be produced by both single classifiers and classifier ensembles. The main topologies of classifier ensembles are concatenation, parallel and hierarchical combination. Concatenation combination treats the former classification results as an input of the next classifier. Parallel combination methods integrate the individual classification results without any mutual interaction, to be combined according to certain algorithms. Hierarchical ones combine both concatenation and parallel classifier configurations. More details can be seen in [45,46]. The parallel and concatenation combination algorithms are realized in the LULC module.
UHIs: In this processing chain, UHIs maps, UHIs distribution status and relationship between LST and different indexes are necessary. NDVI is one of the primary functions during UHI inversion routines. It is given by the formula as, NDVI = (NIR – RED)/(NIR + RED), where NIR and RED are near infrared and red channel of remotely sensed data, respectively. Emissivity could be calculated by the NDVI map or classification map. For UHIs analysis, LST profiles from two directions along north to south or east to west can be derived. LST retrieval algorithms include MWA, SCA, the radiative transfer equation, and the TES are implemented.
Vegetation and water extraction: In this processing chain, the methods for vegetation and water extraction are realized. These approaches include Modified Soil Adjusted Vegetation Index (MSAVI), threshold, NDVI, NDWI, and MNDWI [47,48].
Chang detection: There are three processing chains in the change detection module: Coarse To Fine Change Detection (CTF_CD), SVM based CD, and Fusion based CD. In the CTF_CD, two groups of CD methods can be selected. One is the coarse data change detection suitable for low spatial resolution images, including the PCA, CVA and Independent Component Analysis (ICA) techniques. The other is the fine data change detection designed for high spatial resolution images, including image differencing, ratio and SVM techniques. In the SVM based CD, two-date remote sensing imageries are used to automatically generate the difference image. Furthermore, the training set is imported to train an SVM detector to generate the final CD map. In the Fusion based CD submenu, there are two levels of fusion operations. The former is the pixel/feature level in which the original multi-date remote sensing data are directly imported to generate the result. The latter is the decision level fusion in which the results should be produced by combing the previous pixel/feature fusion results.
Model integration: In this advanced module, LULC processing chain, LST retrieval processing chain and UHIs analysis functions are integrated as automatic/semi-automatic workflow processing with few manual interventions. Two processing chains, including NDVI based and classification based techniques for LST retrieval, are integrated to predict and simulate urban thermal environment. A PSR model and a weighted summation model are integrated with remote sensing derived information to conduct some thematic assessment to urban environment.
4. Software System and Case Applications
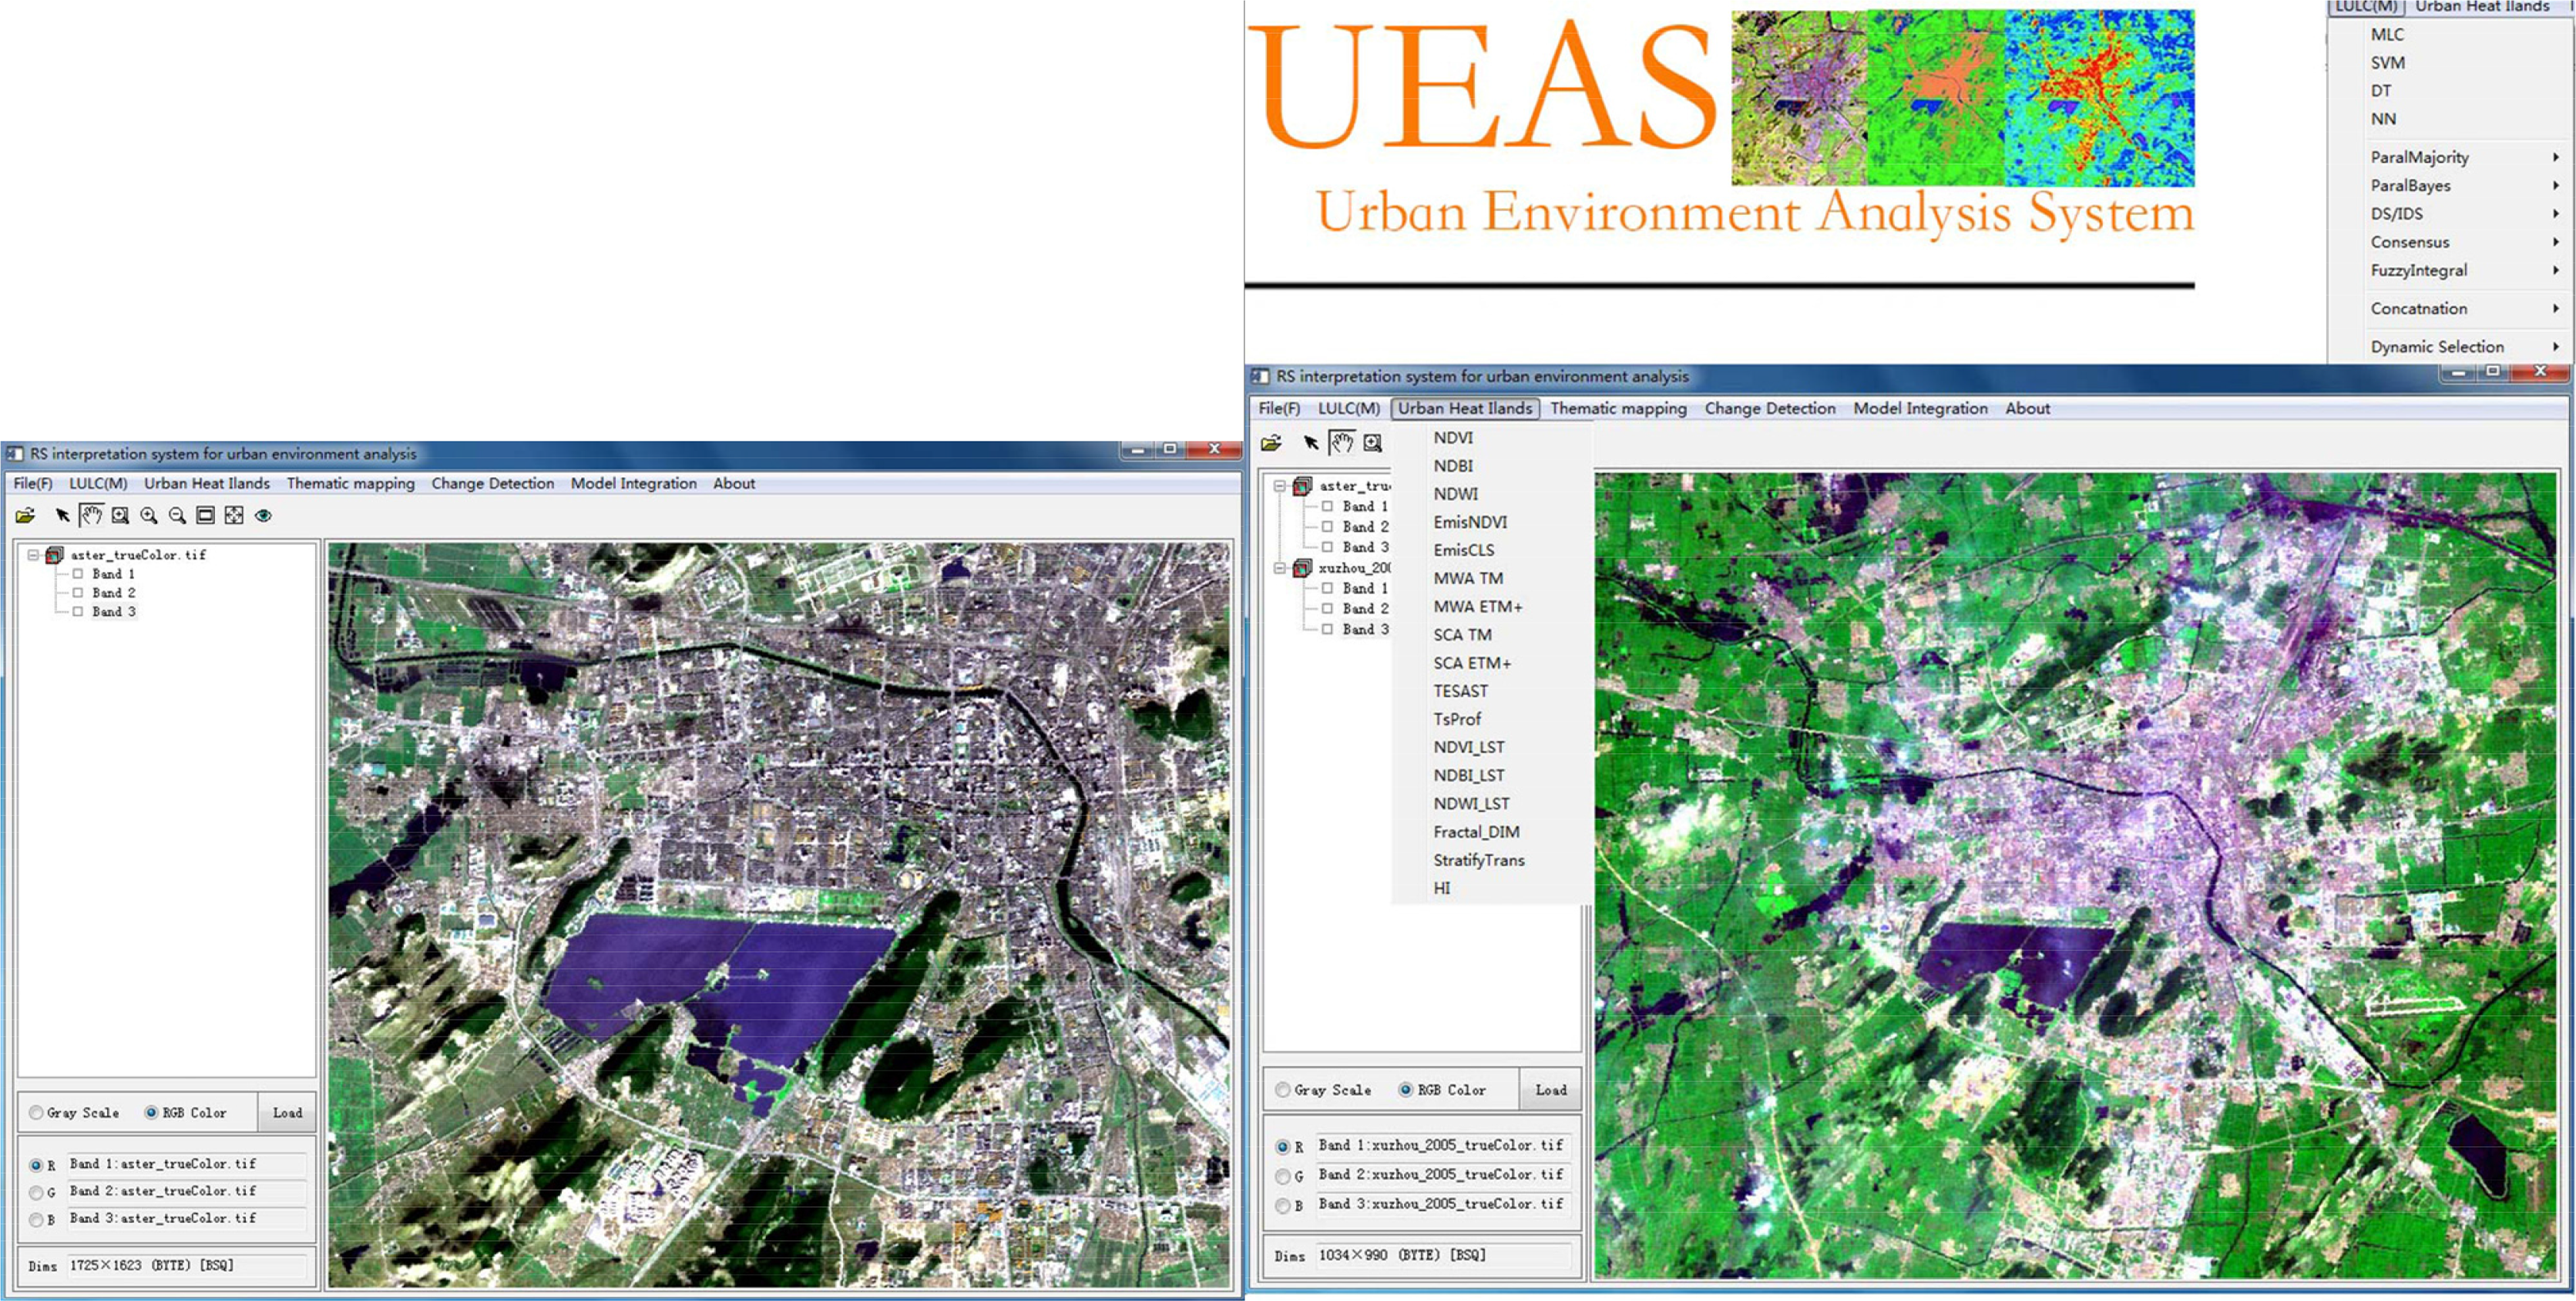
Based on the aforementioned analysis, we developed a software system, namely the Urban Environment Analysis System (UEAS), including basic modules and advanced modules for urban environment analysis. These software routines were developed mainly by Interactive Data Language (IDL) ( http://www.exelisvis.com/language/en-US/Company/CompanyHome.asp IDL introduction link). A part of them is combined with ENVI functions. The main functional modules embodied as menu items include (1) LULC: MLC, SVM, BPNN, parallel and concatenation classifier ensemble strategy; (2) UHIs: NDVI, Emissivity, SCA algorithm for Landsat TM data (SCATM), WMA algorithm for Landsat TM data (WMATM), NDBI_LST (relationship between Normalized Difference Built-up Index and Land Surface Temperature analysis); (3) water body and vegetation extraction: threshold, NDVI, NDWI, MNDWI; (4) change detection: PCA_CD, SVM_CD, CTF_CD; (5) model integration: TES (Thermal environmental simulation). A screenshot of user interface is shown as Figure 2.
The UEAS is realized with a collection of IDL source files. In order to run these scripts, installation of a virtual machine of IDL 8.x or later is required. The freely distributed virtual machine can be downloaded from the homepage of EXELISVIS ( http://www.exelisvis.com). Output binary data are saved as Tagged Image File Format (TIFF) images, which are easy to open using professional remote sensing software or universal image processing software.
In the following subsections, several applications on two typical study areas are applied to demonstrate the effectiveness of the developed system. Multi-source remote sensing images with different spatial and spectral resolutions are used.
4.1. Land Cover Classification Using the Ensemble Learning Method
Ensemble learning aims at combining the outputs of individual learners to improve the performance of pattern recognition. Since it is difficult to select a best classifier for urban land cover classification, it is advantageous to employ ensemble learning to remote sensing image classification. Different classifiers are viewed as individual learners and their outputs are combined by some specific combination rules [14,46]. QuickBird multi-spectral image (four spectral bands, spatial resolution: 2.44 m) is used as experimental data. There are five classes of interest: water, built-up area, green area, vegetation, and barren soil. A study area is located in the northern suburb of Xuzhou city along the urban and rural connecting areas with an image size of 500 × 500. In addition to the original multi-spectral bands, textural features (mean and variance) extracted by Gray Level Co-occurrence Matrix (GLCM) are treated as the classification input.
In our first experiment, the classification performances of Bagging and AdaBoost with three unstable classifiers, including J48 decision tree (J48DT), RBF neural network (RBFNN) and MLP neural network (MLPNN), were investigated. Bagging applies sampling with replacement to obtain independent training samples for individual classifiers. Boosting changed the weights of training samples according to the results of the previous trained classifiers, focusing on the wrong classified samples, making the final result by a weight vote rule. Overall accuracies of single and ensemble classifiers are summarized in Table 1. It can be seen from Table 1 that AdaBoost is superior to Bagging. In comparisons of the three base classifiers, the accuracies of AdaBoost are increased by 3.25, 1.94 and 2.25 percentage points. Furthermore, we studied the influence of bootstrapped sample size of Bagging to classification performance. Here, we chose four sample sizes: 25%, 50%, 75% and 100%. The general trend is that the overall accuracies increase slightly (less than 1%) when the sampling rate rises. The accuracy of RBFNN is a bit unsteady under different sampling rates. This may be due to the fact that the number iterations of RBFNN are not enough (only 10 in the experiment).
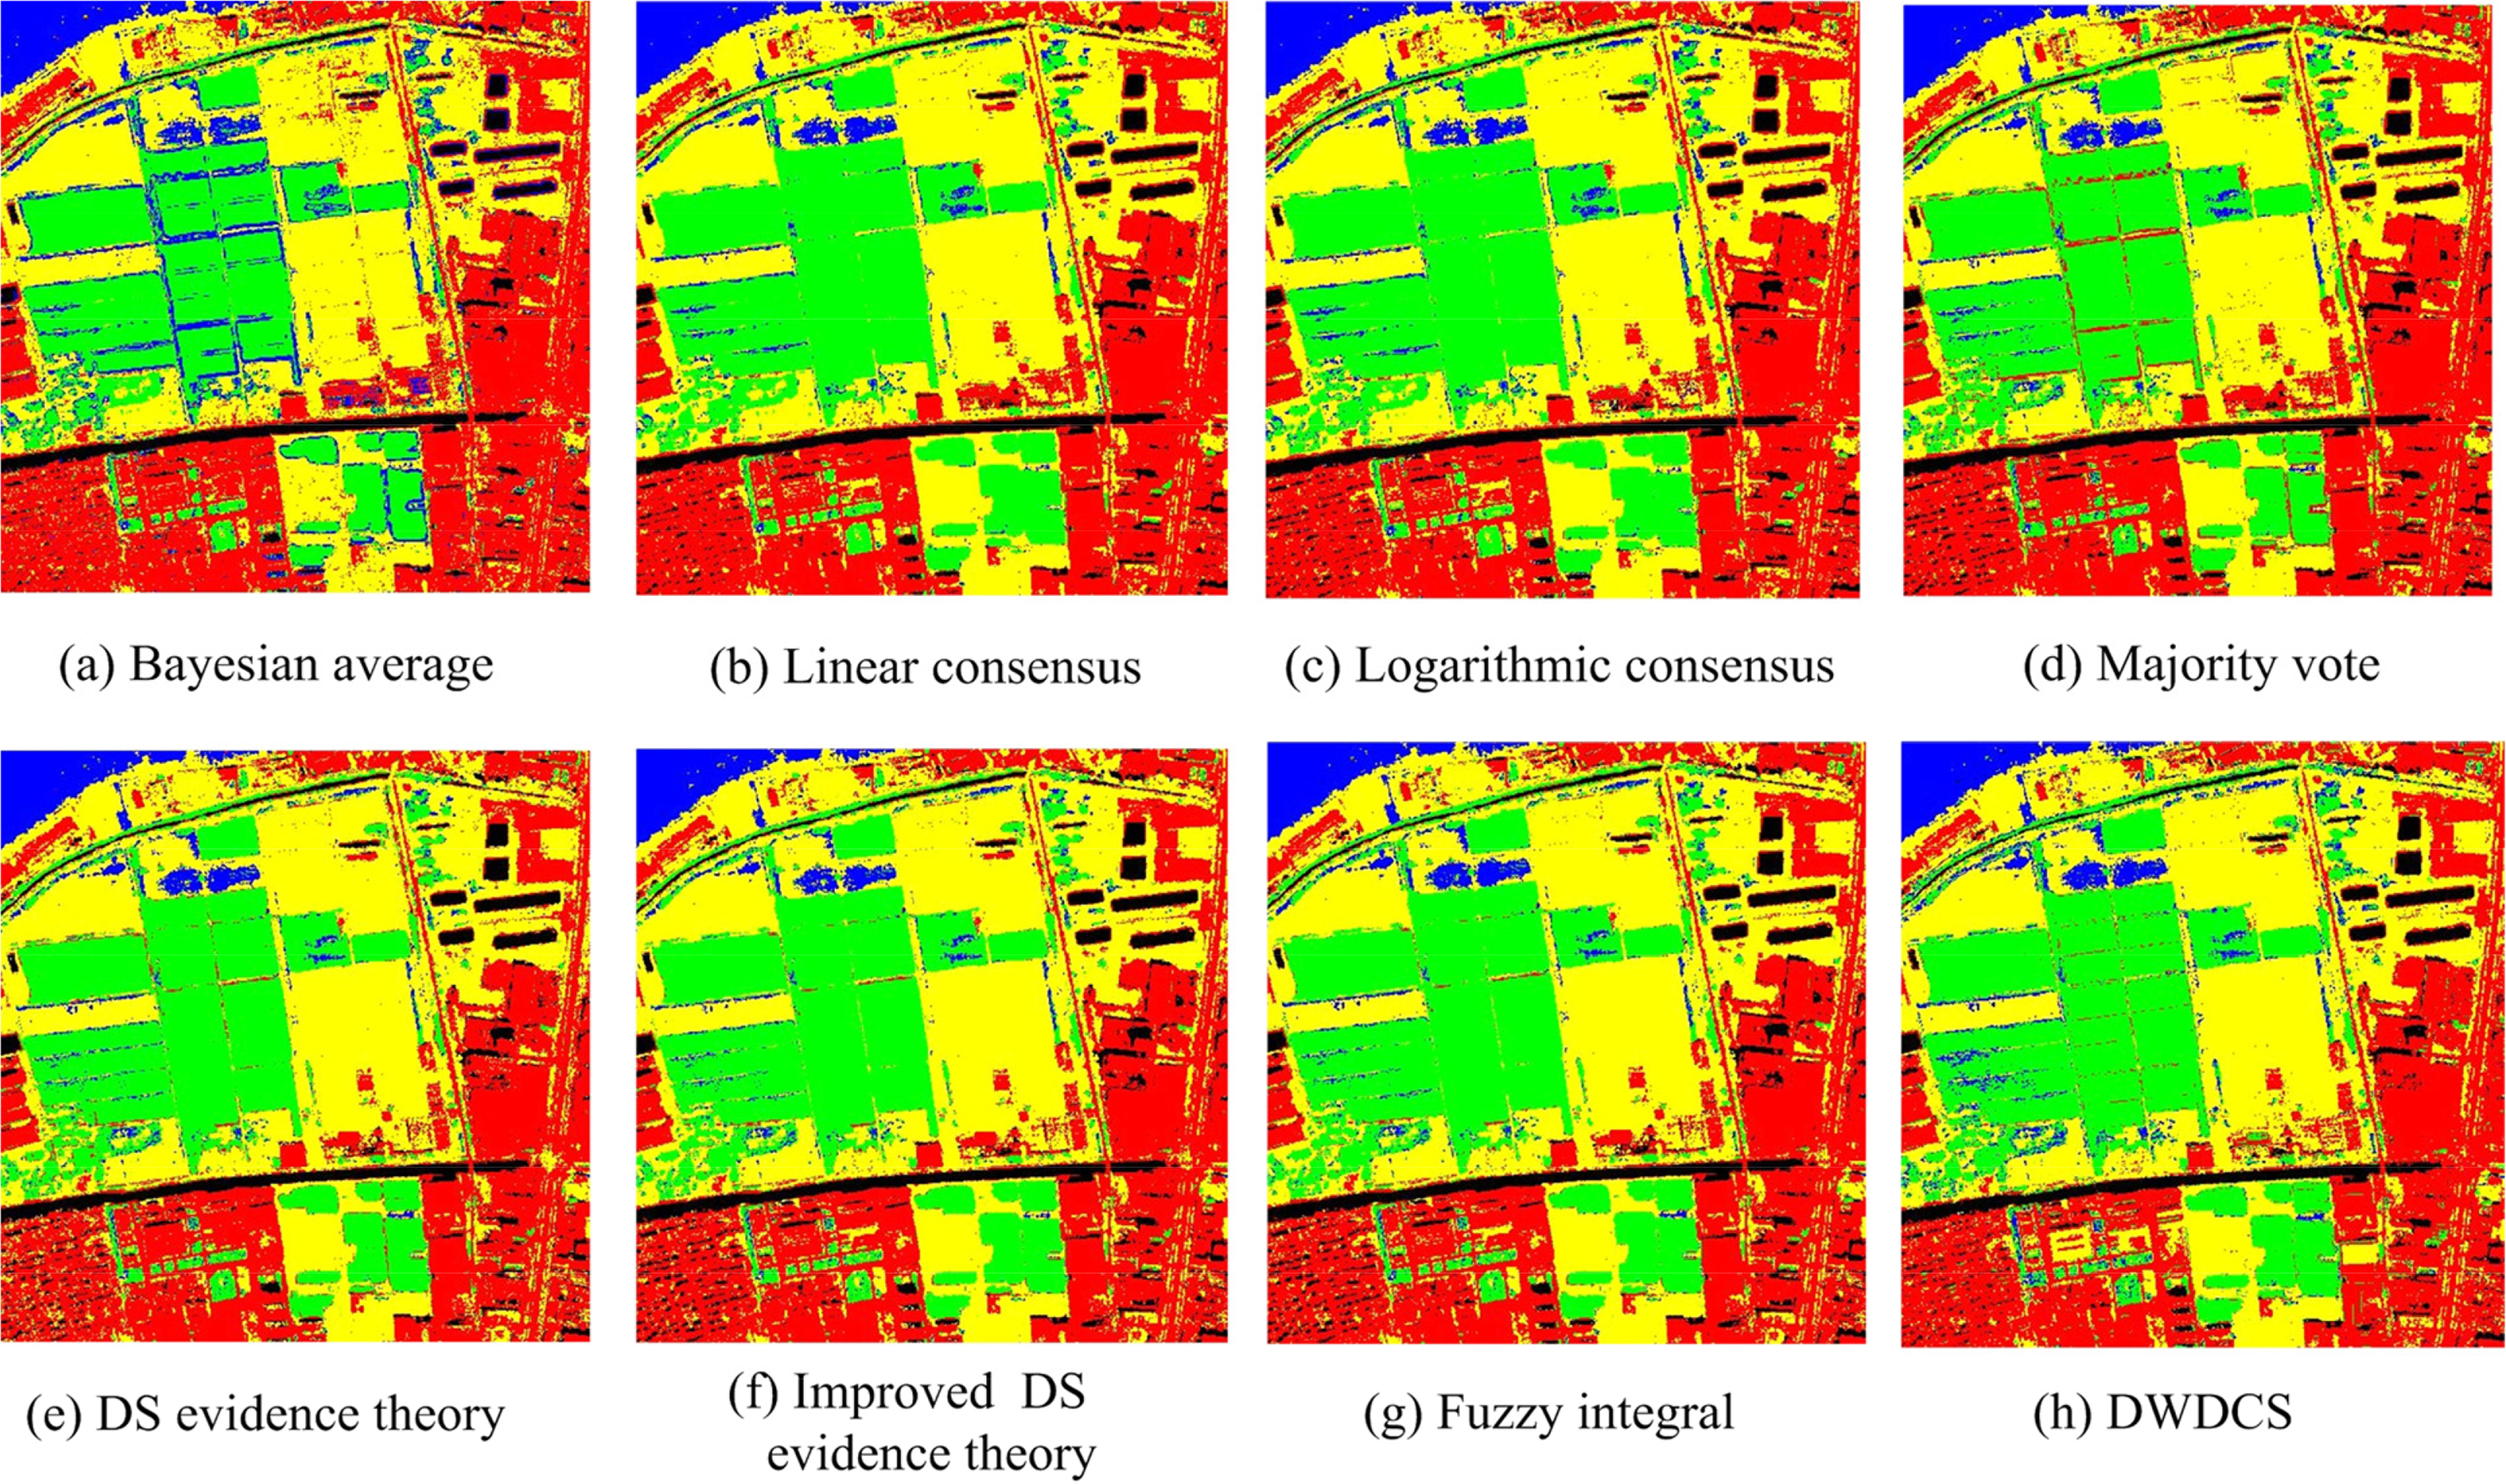
In the second experiment, eight parallel combination algorithms including majority vote, Bayesian average, logarithmic consensus, linear consensus, evidence theory, improved evidence theory, fuzzy integral and distance weighted dynamic classifier selection (DWDCS), were used to assess the performance. Different member classifiers were applied to different parallel combination methods. For Bayesian average, logarithmic consensus and linear consensus, the member classifiers are MLC, SVM, MLPNN, RBFNN and SFH-ARTMAP. The member classifiers for others are SVM, MLPNN, RBFNN, MEDC and J48DT. Figure 3 presents the classification results of MCS on parallel combination. Their accuracy statistics are shown in Table 2. Among the individual classifiers, SVM classifier achieves the highest accuracy of 93.49%. Compared to SVM classifier, the Bayesian average achieves an accuracy of 94.99%, with improvement of 1.5%; Majority vote and fuzzy integral improve the accuracy from 93.49%–94.74% and 93.49%–94.37%, respectively. Other parallel combination approaches improve the accuracy slightly with an improvement of 0.28%–1%. The “local” ensemble method (DWDCS) results in 93.98% accuracy with an improvement of 0.49%. In conclusion, accuracies of the parallel combination approaches all yield higher classification accuracies than individual classifiers under different theoretical backgrounds.
4.2. Modeling and Analysis of the Urban Thermal Environment
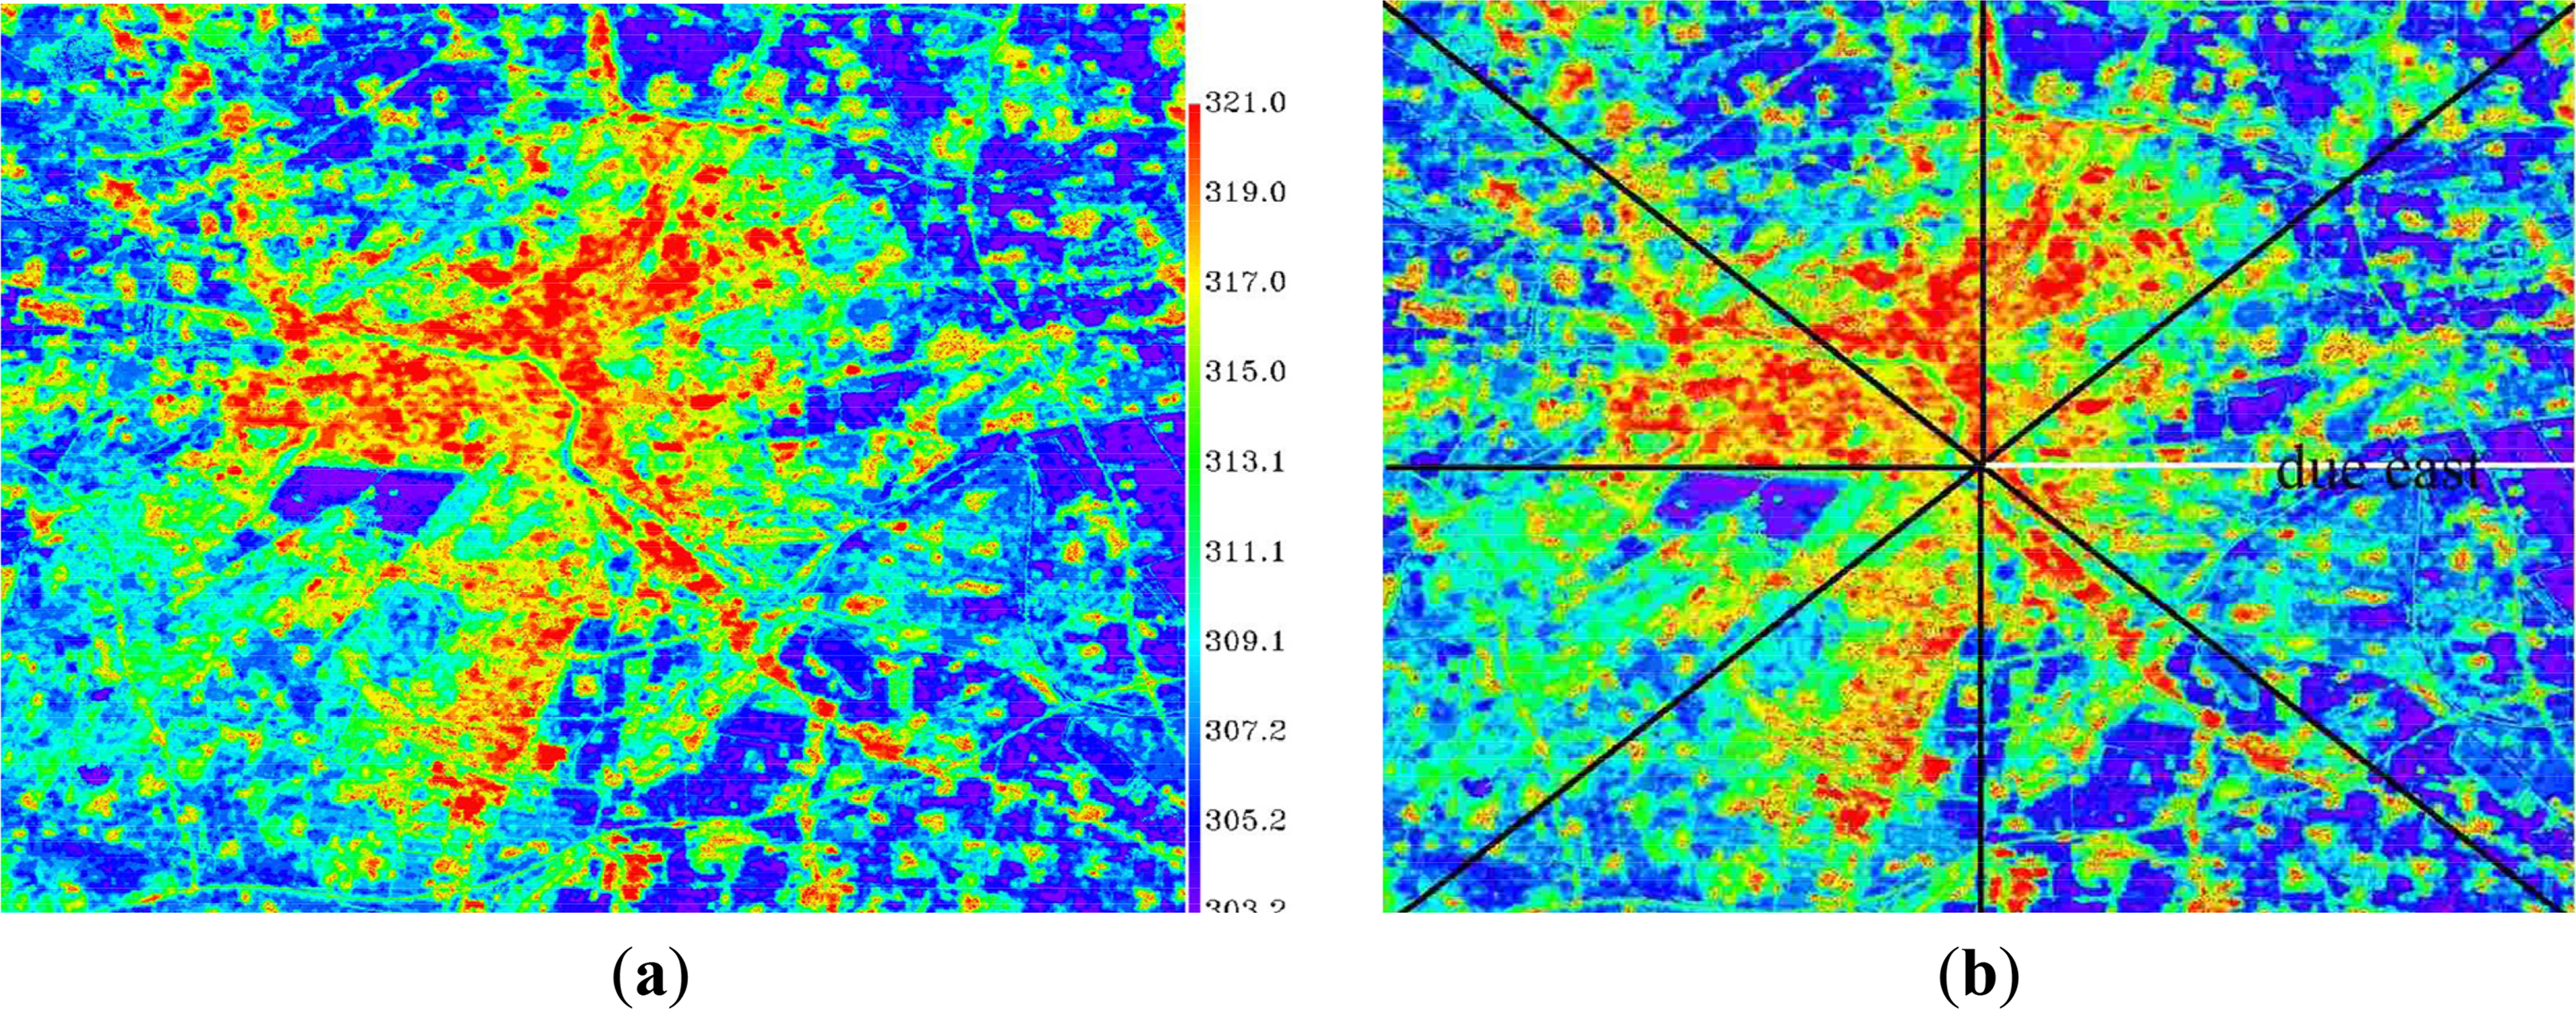
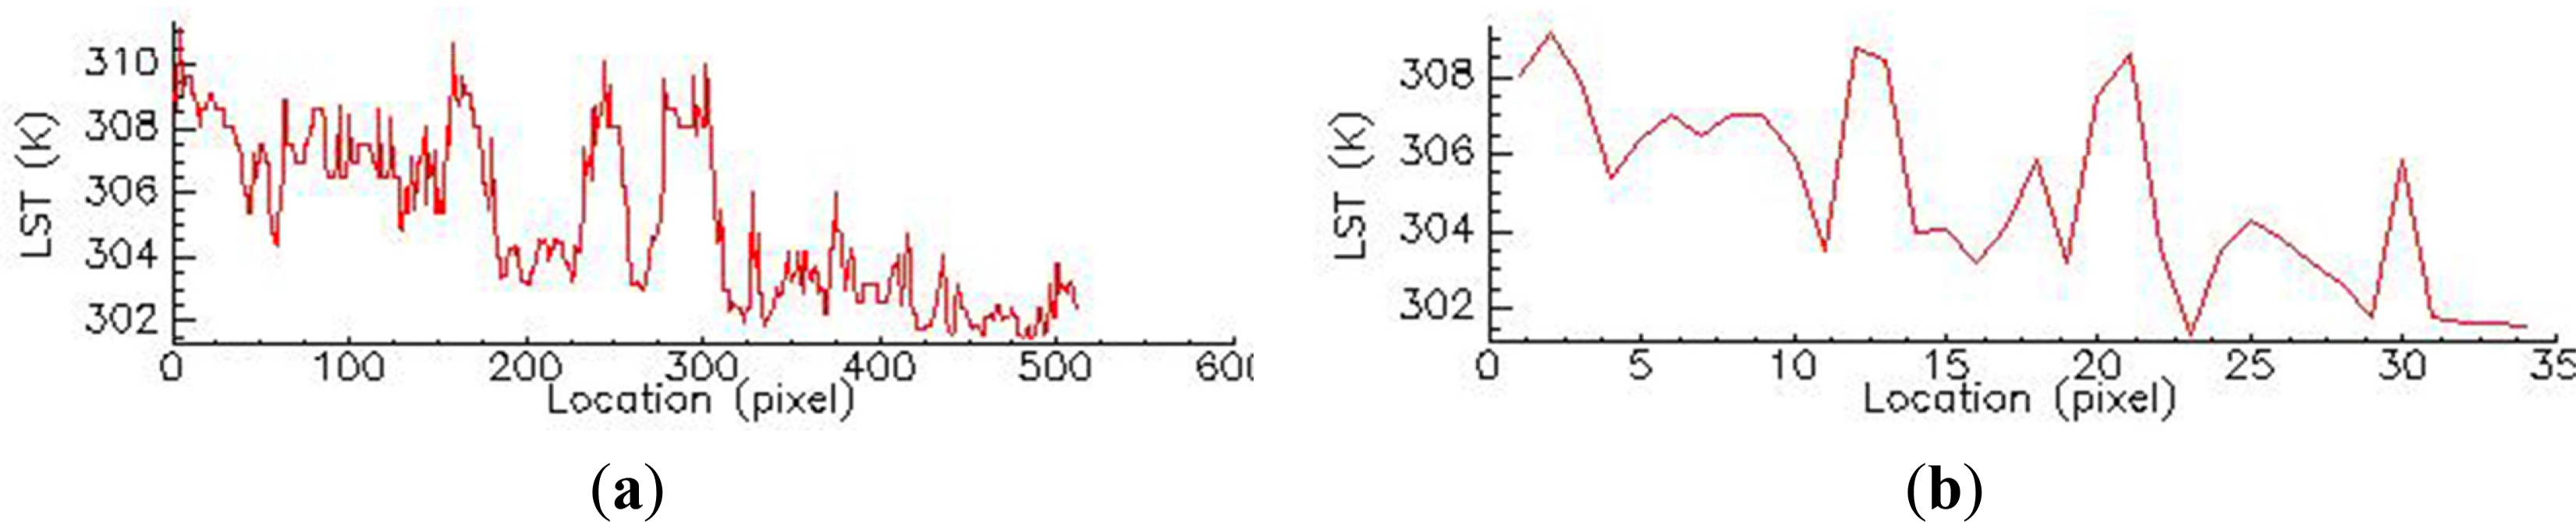
LST is retrieved from Landsat TM image using the developed MWA and SCA algorithms. The result is shown as Figure 4. In order to illustrate the change distribution of UHIs, eight transects are presented in the image (Figure 4). Temperature profiles with different directions from the city center are calculated for analysis (Figure 5).
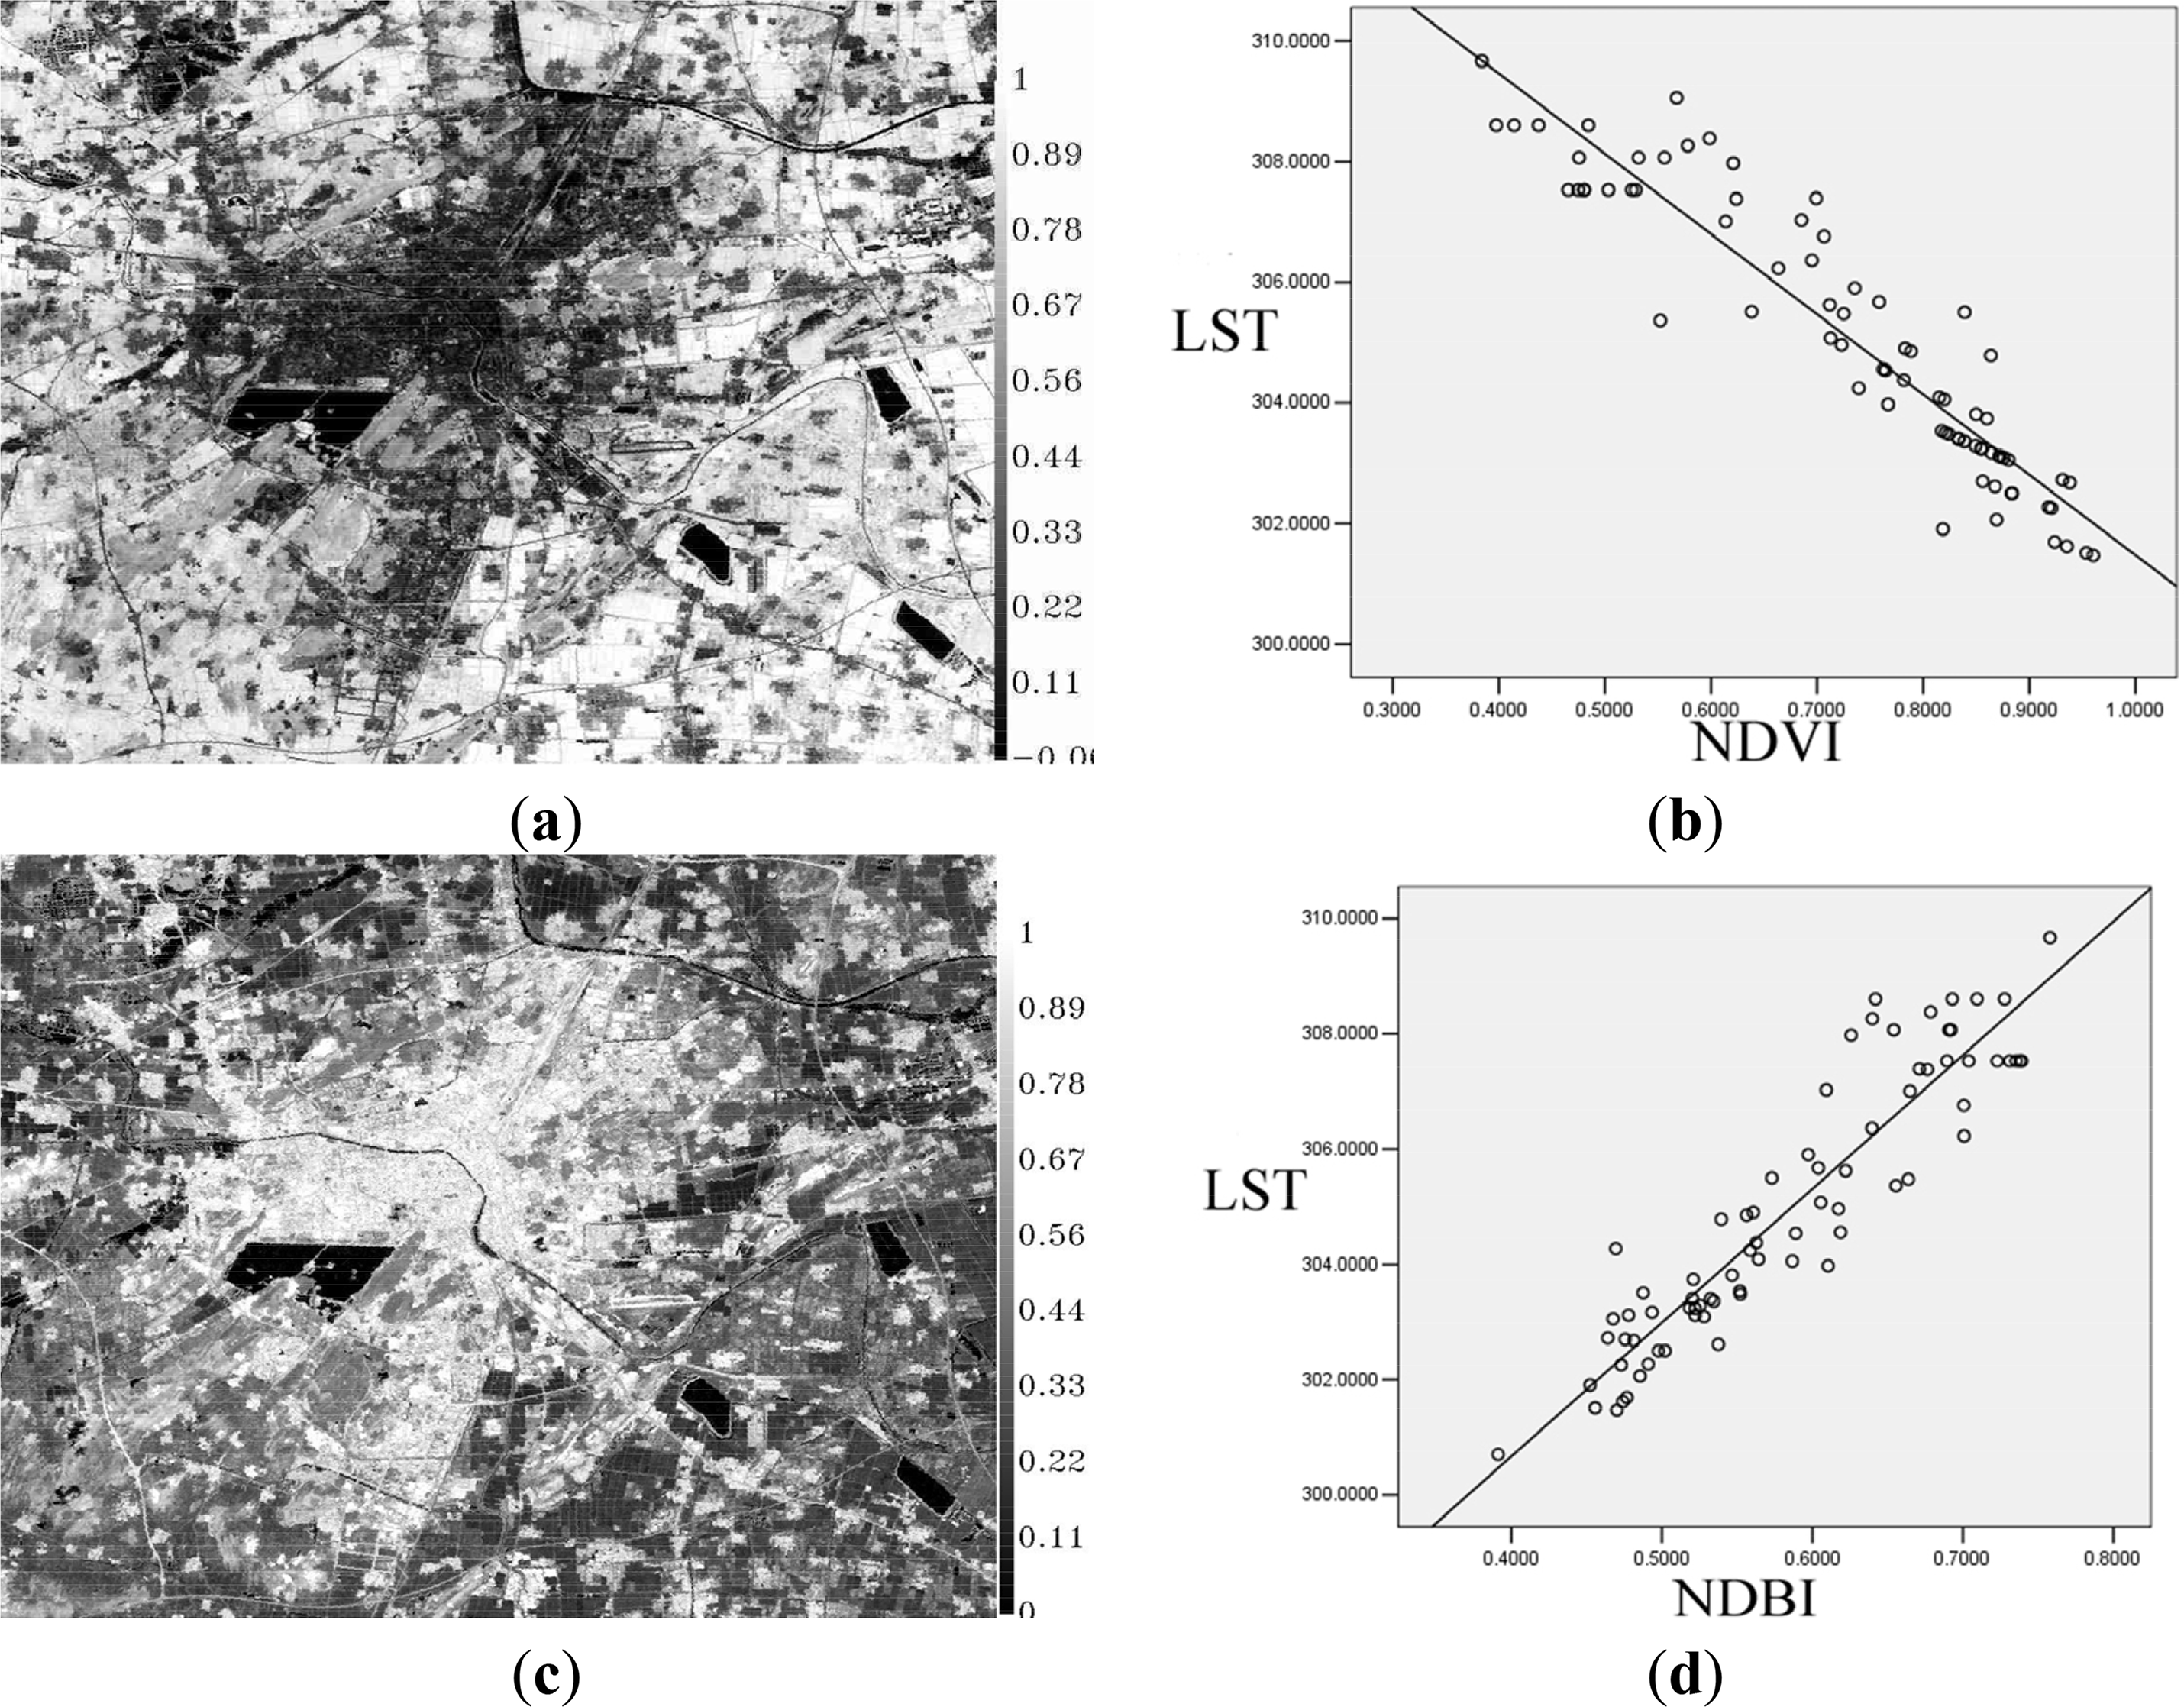
NDVI, NDBI maps and the relationship between average LST values and land cover types could be analyzed with the routine NDVI, NDBI, NDVI_LST and NDBI_LST. The results derived by these routines are shown as Figure 6. Both NDVI and NDBI maps are reduced to 60 m/pixel in order to match the spatial resolution of LST map. Figure 6a,c shows the spatial distribution of NDVI and NDBI, respectively. Bright areas express high NDVI (NDBI) values while low dark areas mean low NDBI (NDVI) values. Figure 6b indicates that there is a strong negative linear relationship between LST and NDVI. Figure 6d shows that there is a strong positive linear relationship between LST and NDBI.
4.3. Ecological Security Assessment
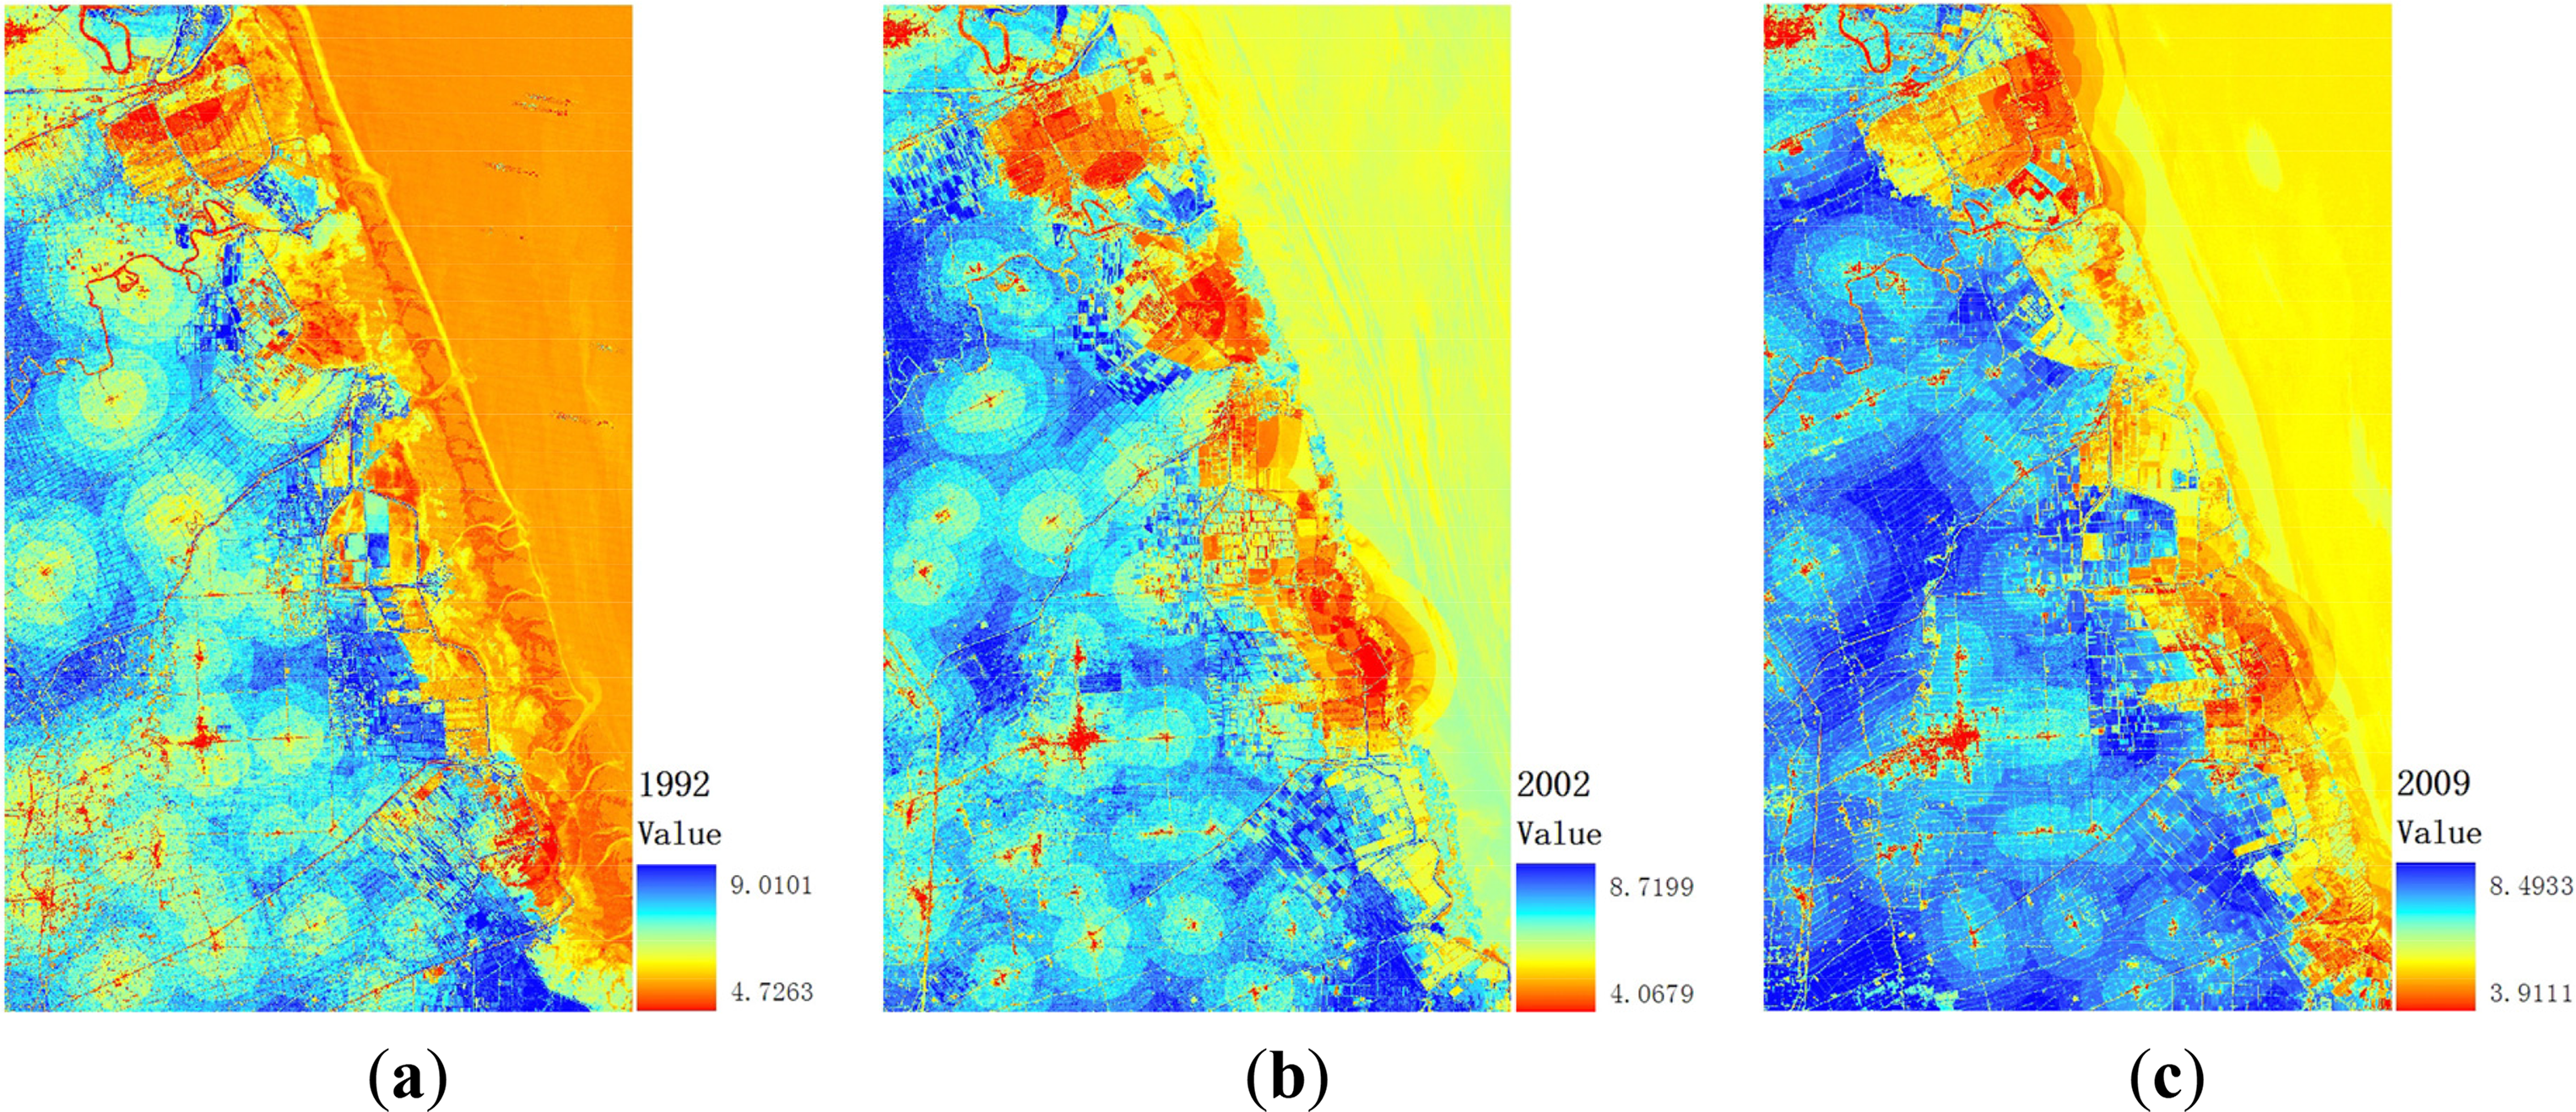
Ecological security assessment is implemented by an integration of remote sensing derived indicators, a PSR model and a weighted summation model. The PSR model is based on the concept of causality and includes three different types of indicators: pressure indicators, state indicators and response indicators [49]. The technical flow is demonstrated in Figure 7. A case study of urban security assessment on Xuzhou City has been published in [50]. Another case study of coastal wetland in Yancheng City, Jiangsu Province, P. R. China, is used to demonstrate the PSR model. Landsat TM/ETM+ data captured on 7 June 1992, 26 May 2002, 11 September 2000 and 13 May 2009 are selected as data sources for ecological security evaluation.
Several indicators such as land cover, landscape structure, vegetation coverage, land surface temperature, and distribution of pollution sources can be derived from remotely sensed images. Other indicators such as groundwater, population density and statistical data are also used in the evaluation process. All data are normalized and organized in GIS. The indicators in the PSR model are overlapped with corresponding weights to obtain evaluation results of urban ecological security. Table 3 illustrates different types of indicators and their corresponding weights. Different analytical methods have been developed to investigate the dynamic change and spatial pattern of urban ecological security. The assessment results are reported in Figure 8 and Table 4. Based on the results, it is concluded that the ecological security situation of cost wetland in Yancheng city is mainly in a critical security state and the regions identified as “unsecure” present an increasing tendency due to rapid urbanization and coastal development. It is important for local government agencies or municipal bureaus to take ecological security information into account in their decision-making as reasonably as possible.
4.4. Simulation and Prediction of Urban Thermal Environment
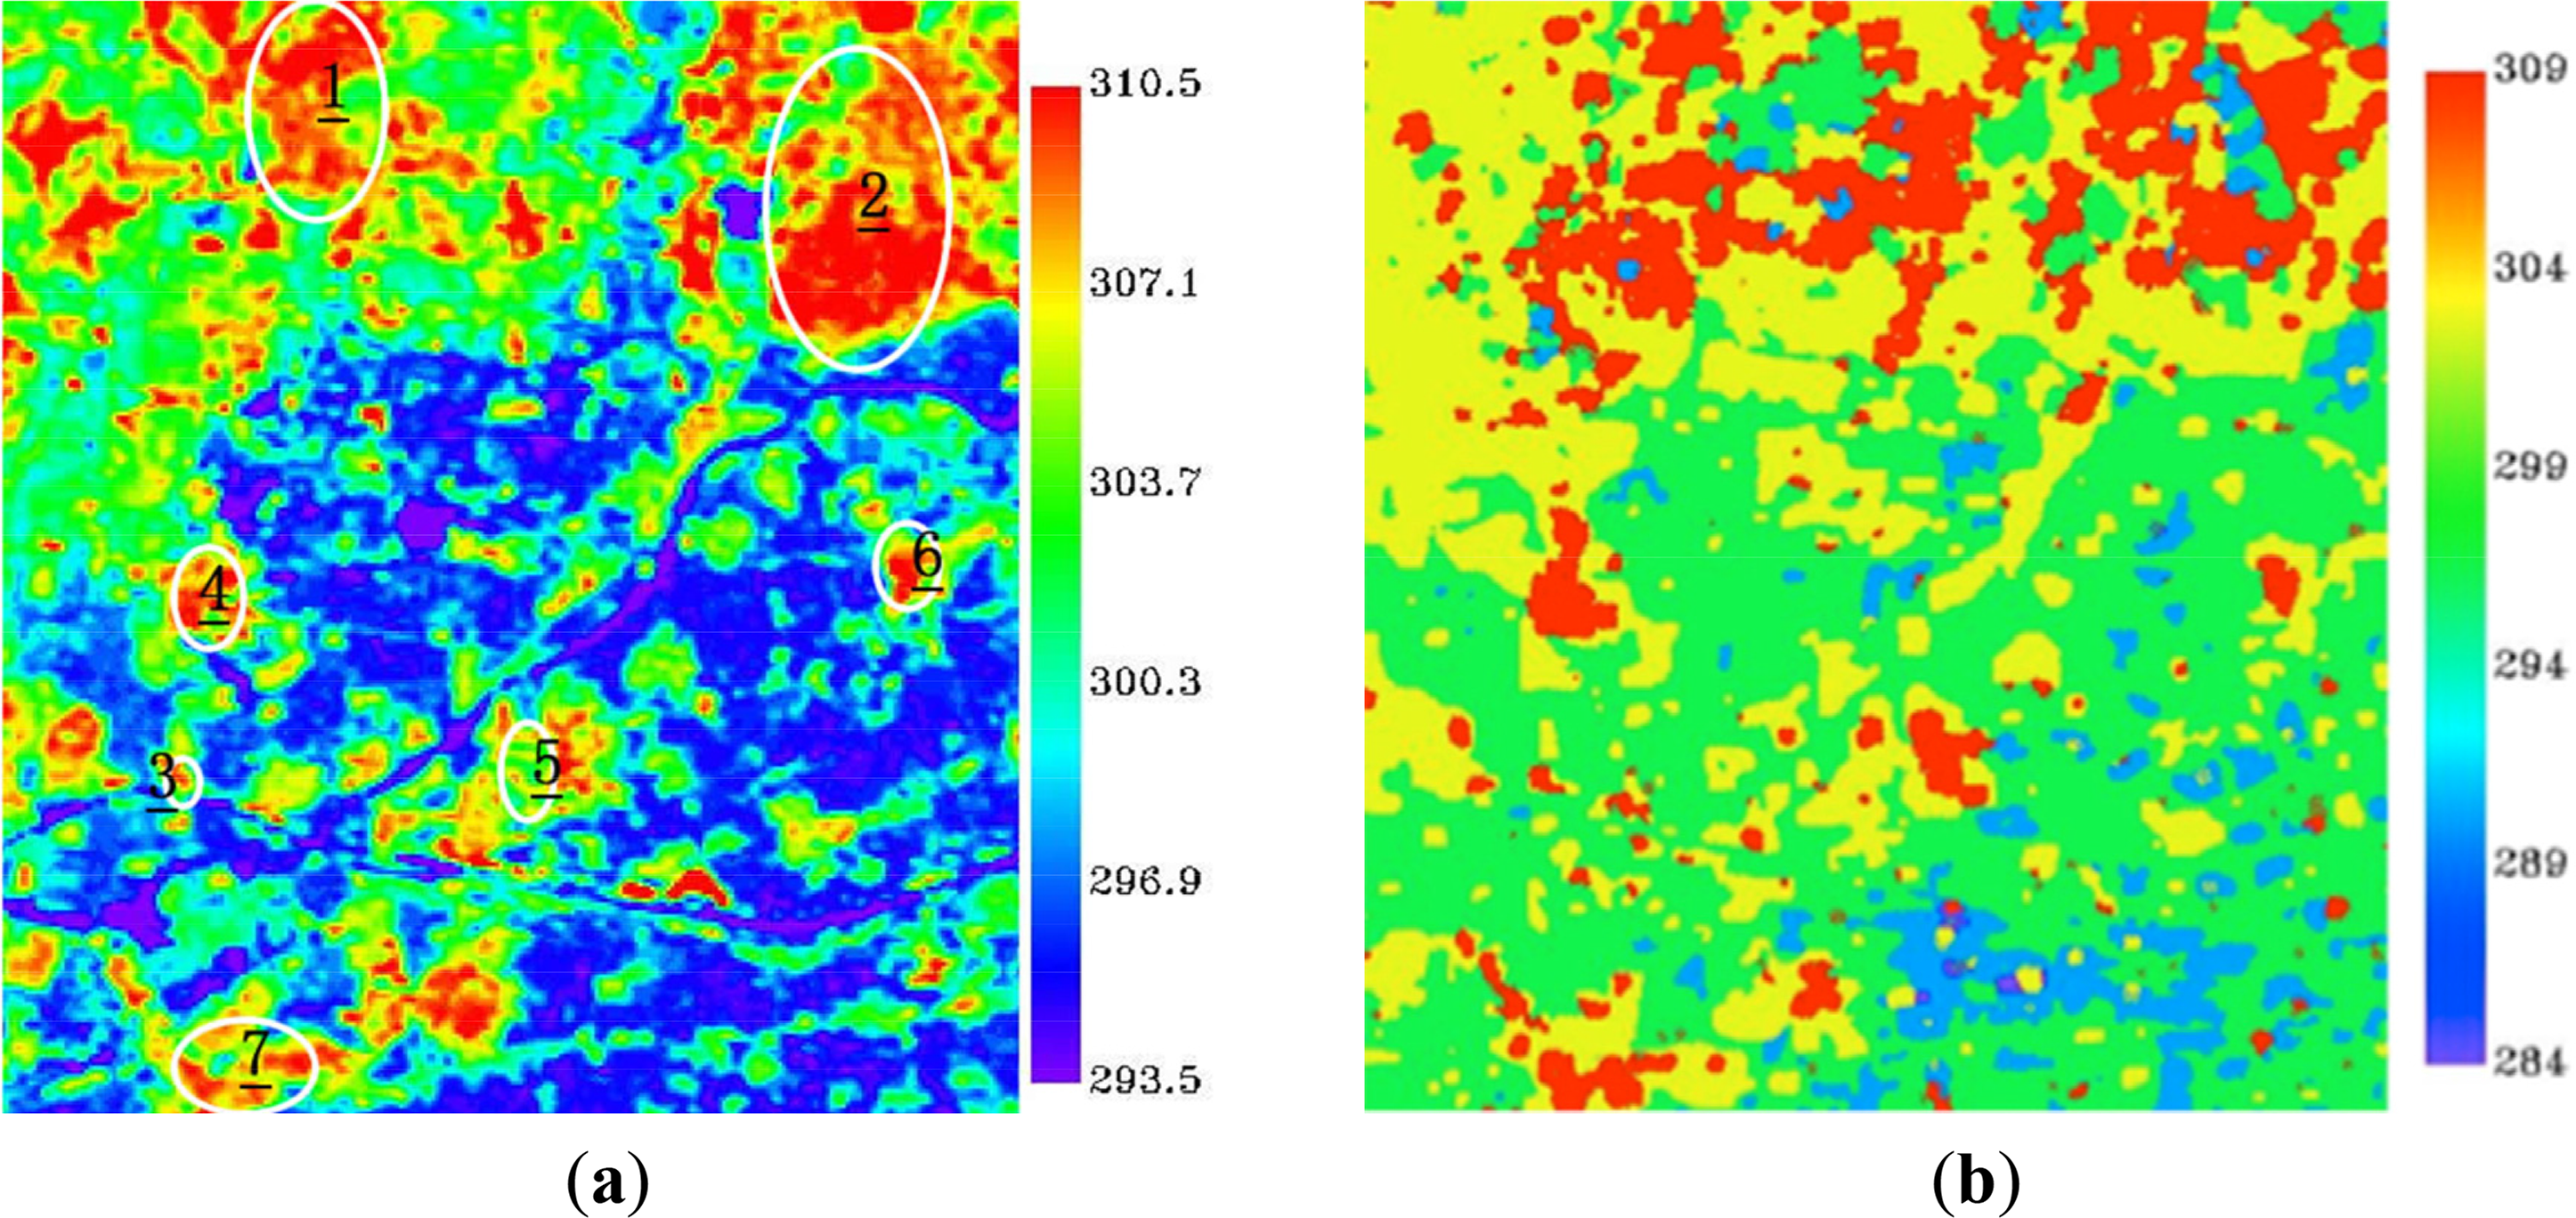
Landsat TM/ ETM+ images obtained from 26 March 1995, 3 April 2001 and 14 May 2007 were chosen to test the system for simulation and prediction. Firstly, the SCA method was selected to retrieve UHIs distribution maps from thermal infrared bands. The result is shown in Figure 9a. Circles in Figure 9a represent UHIs in the test area. In order to simulate the trend of UHIs, the quantitative UHIs distribution map should be transformed into a qualitative one. In this case, it is transformed to a temperature anomaly map. Anomaly values are average values of temperature. The anomaly value Jt,i on the position of “i” at time “t” is given by Jt,I = Tt,I − Ti, Tt,i is the temperature value on the position of “i” at time “t” and Ti is an average value of the temperature on the position of “i” [51]. Then thermal environmental trends were simulated by the Cellular Automata (CA)_Markov model. Processing chains for trend simulation using the CA_Markov model include initial data acquisition and preprocessing, determining the rules of cellular transformation and simulation. The UHIs map of 2007, which is shown in Figure 9b, is simulated on the basis of UHIs distribution maps obtained from 1995 and 2001. Accuracies of simulation maps could be assessed based on the contrast of the true UHIs map and the simulated map.
5. Conclusions
In order to promote the applications of remote sensing for urban environment analysis, it is important to bridge the requirements of urban environment and the capabilities of image processing, making the advanced remote sensing image processing tools and algorithms applicable to practical urban environment analysis. In this paper, different approaches of remotely sensed data processing for urban environment analysis are integrated into some practical processing chains. The advanced UEAS are successfully implemented with the motivation of automatically/semi-automatically environment monitoring and analysis for LULC, UHIs, water body, change detection, landscape ecology, and ecological security aspects, which meet requirements of urban environment analysis. The preliminary results conducted by several case studies are encouraging. The developed system is a reasonable supplement to existing commercial tools. This system is very useful and convenient for urban environment analysis, decision-making support using multi-temporal and multi-source remotely sensed data.
Despite the advantages of the processing chains and the developed system, the ecological security evaluation and landscape analysis modules still depend on extra open source/free software, and other missing points need to be further investigated in the near future.
Acknowledgments
This work was funded by the Jiangsu Provincial Natural Science Foundation under Grant No. BK2012018, the National Natural Science Foundation of China under Grant No. 41171323, the Fundamental Research Funds for the Central Universities and the Priority Academic Program Development of Jiangsu Higher Education Institutions (PAPD). The authors would like to thank the Editor who handled our manuscript, the Anonymous Reviewers for their insightful comments and Xiyan He for her careful revisions, which improved the technical content and presentation of our manuscript.
Author Contributions
Peijun Du led the research work, proposed the idea and structure of this manuscript, wrote the introduction and conclusion parts, and integrated the contributions from all authors as a whole. Pei Liu integrated the modules and codes, tested the package elements and wrote LST and urban thermal environment parts. Junshi Xia implemented the LULC classification methods, wrote the corresponding part and revised the full paper. Li Feng collaborated with Peijun Du to integrate the work from different authors, and made the literature review on urban landscape ecology and ecological security assessment. Sicong Liu contributed to urban change detection and presentation improvement. Kun Tan was the co-leader of the group and involved in the algorithm implementations through the paper. Liang Cheng evaluated the system by some case studies and collaborated with Peijun Du on the production of this paper.
Conflicts of Interests
The authors declare no conflict of interest.
References
- Esch, T.; Taubenbock, H.; Heldens, W.; Thiel, M.; Wurm, M.; Geiss, C.; Dech, S. Urban Remote sensing—How can earth observation support the sustainable development of urban environments? Proceedings of the 15th International Conference on Urban Planning, Regional Development and Information Society, Vienna, Austria, 18–20 May 2010; pp. 837–847.
- Barnsley, M.J.; Barr, S.L. A graph based structural pattern recognition system to infer urban land use from fine spatial resolution land cover data. Environ. Urban Syst 1997, 21, 209–225. [Google Scholar]
- Mesev, V. Remote sensing of urban systems: Hierarchical integration with GIS. Comput. Environ. Urban Syst 1997, 21, 175–187. [Google Scholar]
- Lo, E.; Nazikian, R; Stutman, D; Choe, W.; Kaita, R. Calibration and test of the tangential phase contrast imaging diagnostic on CDX-U. Rev. Sci. Instrum 1997, 68, 1206–1216. [Google Scholar]
- Gamba, P.; Herold, M. Global Mapping of Human Settlement-Experiences, Datasets and Prospects; CRC Press: Boca Raton, FL, USA, 2009. [Google Scholar]
- Phinn, S.; Stanford, M.; Scarth, P.; Murray, A.T.; Shyy, P.T. Monitoring the composition of urban environments based on the Vegetation-Impervious Surface-Soil (VIS) model by subpixel analysis techniques. Int. J. Remote Sens 2002, 23, 4131–4153. [Google Scholar]
- Wilson, J.S.; Clay, M.; Martin, E; Stuckey, D.; Vedder-Risch, K. Evaluating environmental influences of zoning in urban ecosystems with remote sensing. Remote Sens. Environ 2003, 86, 303–321. [Google Scholar]
- Dell’Acqua, F.; Gamba, P. Discriminating urban environments using multi-scale texture and multiple SAR images. Proceedings of the 2003 IEEE Workshop on Advances in Techniques for Analysis of Remotely Sensed Data, New York, NY, USA, 27–28 October 2003; pp. 308–314.
- Weng, Q; Quattrochi, D.A. Urban Remote Sensing; CRC Press: Boca Raton, FL, USA, 2007. [Google Scholar]
- Weng, Q.H. Thermal infrared remote sensing for urban climate and environmental studies: Methods, applications, and trends. ISPRS J. Photogram. Remote Sens 2009, 64, 335–344. [Google Scholar]
- Rashed, T. Remote Sensing of Urban and Suburban Areas; Springer: Berlin, German, 2010. [Google Scholar]
- Yang, X. Remote Sensing and Geospatial Technologies for Coastal Ecosystem Assessment and Management; Springer: Berlin, German, 2011. [Google Scholar]
- Liang, B.; Weng, Q.H. Assessing urban environmental quality change of Indianapolis, United States, by the remote sensing and GIS integration. IEEE J. Sel. Top. Appl. Earth Obs. Remote Sens 2011, 4, 43–55. [Google Scholar]
- Lu, D.S.; Weng, Q.H. A survey of image classification methods and techniques for improving classification performance, review article. Int. J. Remote Sens 2007, 28, 823–870. [Google Scholar]
- Castellana, L.; D’Addabbo, A.; Pasquariello, G. A composed supervised/unsupervised approach to improve change detection from remote sensing. Pattern Recognit. Lett 2007, 28, 405–413. [Google Scholar]
- Nemmour, H.; Chibani, Y. Multiple support vector machines for land cover change detection: An application for mapping urban extensions. ISPRS J. Photogram. Remote Sens 2006, 61, 125–133. [Google Scholar]
- Woodcock, C.E.; Macomber, S.A.; Pax-Lenney, M.; Cohen, W.B. Monitoring large areas for forest change using Landsat: Generalization across space, time and Landsat sensors. Remote Sens. Environ 2001, 78, 194–203. [Google Scholar]
- Sohl, T.L. Change analysis in the United Arab Emirates: An investigation of techniques. Photogram. Eng. Remote Sens 1999, 65, 475–484. [Google Scholar]
- Celik, T. Unsupervised change detection in satellite images using principal component analysis and and k-means clustering. IEEE Geosci. Remote Sens. Lett 2009, 6, 772–776. [Google Scholar]
- Bovolo, F.; Bruzzone, L. A. Theoretical framework for unsupervised change detection based on change vector analysis in the polar domain. IEEE Trans. Geosci. Remote Sens 2007, 45, 218–236. [Google Scholar]
- Liu, H.; Weng, Q.H. Scaling effect on the relationship between landscape pattern and land surface temperature: A case study of Indianapolis, United States. Photogram. Eng. Remote Sens 2009, 75, 291–304. [Google Scholar]
- Jimenez-Munoz, J.C; Sobrino, J.A. A generalized single-channel method for retrieving land surface temperature from remote sensing data. J. Geophys. Res. Atmos 2003, 108, 4688–4697. [Google Scholar]
- Qin, Z.; Karnieli, A.; Berliner, P. A mono-window algorithm for retrieving land surface temperature from Landsat TM data and its application to the Israel-Egypt border region. Int. J. Remote Sens 2001, 22, 3719–3746. [Google Scholar]
- Gillespie, A.; Rokugawa, S.; Matsunaga, T.; Cothern, J.S.; Hook, S.; Kahle, A.B. A temperature and emissivity separation algorithm for Advanced Spaceborne Thermal Emission and Reflection Radiometer (ASTER) images. IEEE Trans. Geosci. Remote Sens 1998, 36, 1113–1126. [Google Scholar]
- Stow, D.A.; Hope, A.; McGuire, D.; Verbyla, D. Gamon. Remote sensing of vegetation and land-cover change in Arctic Tundra Ecosystems. Remote Sens. Environ 2004, 89, 281–308. [Google Scholar]
- Coca, F.E. Vegetation cover seasonal changes assessment from TM imagery in a semi-arid landscape. Int. J. Remote Sens 2004, 25, 3451–3476. [Google Scholar]
- Buyantuyev, A.; Wu, J.; Wu, C. Gries, Estimating vegetation cover in an urban environment based on Landsat ETM imagery: A case study in Phoenix, USA. Int. J. Remote Sens 2007, 28, 269–291. [Google Scholar]
- Sokol, J.; NcNairn, H.; Pultz, T.J. Case studies demonstrating the hydrological applications of C-band multipolarized and polarimetric SAR. Can. J. Remote Sens 2004, 30, 470–483. [Google Scholar]
- Yuan, X.; Sarma, V. Automatic urban water-body detection and segmentation from sparse ALSM data via spatially constrained model-driven clustering. IEEE Geosci. Remote Sens. Lett 2011, 8, 73–77. [Google Scholar]
- Subramaniam, S.; Babu, A.V.S.; Roy, P.S. Automated water spread mapping using ResourceSat-1 AWiFS data for water bodies information system. IEEE J. Sel. Top. Appl. Earth Obs. Remote Sens 2011, 4, 205–215. [Google Scholar]
- Juanle, W.; Xu, Y.; Jia, W.; Deng, F. Study on urbanization information rapid extraction technique in China coastal zone area based on remote sensing: Case in Yancheng City, Jiangsu Province, China. Proceedings of the 2010 International Conference on Multimedia Technology (ICMT), Ningbo, China, 29–31 October 2010.
- Ruan, R.; Zhang, L. Discrepancy of extraction of standing water between index methods and TM5 thresholding. Intell. Syst 2010, 3, 331–334. [Google Scholar]
- Cui, H.; Yuan, L. Study on thermal environmental distribution in coastal city using ASTER data. Proceedings of 2009 Joint Urban Remote Sensing Event, Shanghai, China, 22–25 May 2009.
- Chao, Z.; Sheng, M. Study on extraction methods for water information in Nantong city, China using Landsat ETM+ data. Proceedings of 2011 International Conference on Remote Sensing, Environment and Transportation Engineering (RSETE), Nanjing, China, 24–26 June 2011; pp. 771–774.
- Leitao, A.B.; Miller, J.A.J.; McGarigal, K. Measuring Landscapes: A Planner’s Handbook; Island Press: Washington, DC, USA, 2006. [Google Scholar]
- Xiao, D.; Chen, W. On the basic concepts and contents of ecological security. Chin. J. Appl. Ecol 2002, 13, 354–358. [Google Scholar]
- Innocent, N.M.; Ge, J.W.; Samake, M. An assessment and evaluation of the ecological security in a human inhabited protected area at Korup, south western Cameroon: Linking satellite, ecological and human socioeconomic indicators. J. Am. Sci 2009, 5, 43–53. [Google Scholar]
- Pirages, D.; DeGeest, T. Ecological Security: An Evolutionary Perspecative on Globalization; Rowman Littlefield Publishers: Lanham, MD, USA, 2003. [Google Scholar]
- Pirages, D.; Cousins, K. From Resource Scarcity to Ecological Security Exploring New Limits to Growth; MIT Press: Cambridge, MA, USA, 2008. [Google Scholar]
- Hodson, M.; Marvin, S. “Urban ecological security”: A new urban paradigm?”. Int. J. Urban Reg. Res 2009, 33, 193–215. [Google Scholar]
- Zhao, Q.; Yang, Z.F. Advances in assessment methods for the urban ecological security in China. Environ. Infor. Arch 2007, 5, 234–240. [Google Scholar]
- Löfvenhaft, K.; Björn, C.; Ihse, M. Biotope patterns in urban areas: A conceptual model integrating biodiversity issues in spatial planning. Landsc. Urban Plan 2002, 58, 223–240. [Google Scholar]
- Jun, Z. Research on Urban Biotope Mapping and Protection Plan Based on GIS and RS. B.Sc. Thesis. Shanxi Normal University, Taiyuan, China, June 2005. [Google Scholar]
- Li, X.U. Regional Ecological Environment Modeling and Cartography Based on GIS and RS. Ph.D. Thesis. Shandong University of Science and Technology, Qingdao, China, June 2009. [Google Scholar]
- Du, P.; Xia, J.; Zhang, W.; Tan, K.; Liu, Y.; Liu, S. Multiple classifier system for remote sensing image classification: A review. Sensors 2012, 12, 4764–4792. [Google Scholar]
- Ranawana, R.; Palade, V. Multi-Classifier systems: Review and a roadmap for developers. Int. J. Hybrid. Intell. Syst 2006, 3, 1–41. [Google Scholar]
- Xu, H. Modification of Normalised Difference Water Index (NDWI) to enhance open water features in remotely sensed imagery. Int. J. Remote Sens 2006, 27, 3025–3033. [Google Scholar]
- Gao, B. NDWI A normalized difference water index for remote sensing of vegetation liquid water from space. Remote Sens. Environ 1996, 58, 257–266. [Google Scholar]
- Hua, Y.E.; Yan, M.A.; Limin, D. Land ecological security assessment for Bai autonomous prefecture of Dali based using PSR model. Energy Proc 2011, 5, 2172–2177. [Google Scholar]
- Du, P.; Xia, J.; Du, Q.; Luo, Y.; Tan, K. Evaluation of the spatio-temporal pattern of urban ecological security using remote sensing and GIS. Int. J. Remote Sens 2012, 34, 848–863. [Google Scholar]
- Chen, Z.; Shao, Q.; Yang, H. Comparison of the sea surface temperature anomalies models of the northwest pacific ocean at different time intervals. Geo-Inf. Sci 2006, 9, 31–36. [Google Scholar]


| Base Classifier | J48 DT | MLPNN | RBFNN |
|---|---|---|---|
| Base classifier | 92.42% | 93.49% | 92.83% |
| Bagging(25% samples) | 94.22% | 94.20% | 93.76% |
| Bagging(50% samples) | 94.55% | 95.27% | 93.39% |
| Bagging(75% samples) | 94.30% | 94.91% | 93.40% |
| Bagging(100% samples) | 94.93% | 95.09% | 93.36% |
| AdaBoost | 95.67% | 95.43% | 95.35% |
| Combination Strategy | OA | Kappa | Combination Strategy | OA | Kappa |
|---|---|---|---|---|---|
| Bayesian average | 94.99% | 0.94 | Evidence theory | 93.76% | 0.92 |
| Logarithmic consensus | 93.77% | 0.92 | Improved evidence theory | 94.18% | 0.93 |
| Linear consensus | 94.37% | 0.93 | Fuzzy integral | 94.37% | 0.90 |
| Majority vote | 94.74% | 0.93 | DWDCS | 93.98% | 0.92 |
| Target | Criteria | Indicators | Weights |
|---|---|---|---|
| Ecological Security Assessment | Pressure (0.2024) | Population density | 0.1212 |
| Human disturbance | 0.0812 | ||
| State (0.5503) | Vegetation index | 0.1361 | |
| Degree of dominance | 0.0767 | ||
| Degree of fragmentation | 0.1088 | ||
| Fractal dimensionality | 0.0660 | ||
| Vulnerability | 0.0514 | ||
| Ecological elasticity | 0.1114 | ||
| Response (0.2473) | Vegetation coverage | 0.1114 | |
| Soil moisture | 0.0747 | ||
| Land surface temperature | 0.0612 | ||
| Average Score of Pressure | Average Score of State | Average Score of Response | Average Score of Ecological Security Score | |
|---|---|---|---|---|
| 1992 | 8.68 | 7.05 | 5.42 | 6.97 |
| 2002 | 8.21 | 6.42 | 5.32 | 6.51 |
| 2009 | 8.04 | 6.69 | 5.57 | 6.68 |
© 2014 by the authors; licensee MDPI, Basel, Switzerland This article is an open access article distributed under the terms and conditions of the Creative Commons Attribution license (http://creativecommons.org/licenses/by/4.0/).
Share and Cite
Du, P.; Liu, P.; Xia, J.; Feng, L.; Liu, S.; Tan, K.; Cheng, L. Remote Sensing Image Interpretation for Urban Environment Analysis: Methods, System and Examples. Remote Sens. 2014, 6, 9458-9474. https://doi.org/10.3390/rs6109458
Du P, Liu P, Xia J, Feng L, Liu S, Tan K, Cheng L. Remote Sensing Image Interpretation for Urban Environment Analysis: Methods, System and Examples. Remote Sensing. 2014; 6(10):9458-9474. https://doi.org/10.3390/rs6109458
Chicago/Turabian StyleDu, Peijun, Pei Liu, Junshi Xia, Li Feng, Sicong Liu, Kun Tan, and Liang Cheng. 2014. "Remote Sensing Image Interpretation for Urban Environment Analysis: Methods, System and Examples" Remote Sensing 6, no. 10: 9458-9474. https://doi.org/10.3390/rs6109458