1. Introduction
Remote characterization and mapping of biodiversity is an important objective at the intersection of remote sensing and ecology. For most areas, ecological field data are too sparse to provide information on biodiversity patterns over the landscape and regional scales relevant to conservation assessment and land management planning. Remote sensing can provide spatially continuous information on variation in landscape morphology, vegetation structure, and other biodiversity covariates over large areas, allowing for the extrapolation of local biodiversity information to these scales [
1–
3].
Approaches for mapping biodiversity may focus on quantifying the distributions of individual species or on mapping emergent properties of ecological communities, such as alpha diversity (generally expressed as the local species richness, or number of species found within a site), or beta diversity (the difference in species composition among sites). The majority of studies have focused on mapping species distributions [
4] and alpha diversity (e.g., [
5–
8]), while the estimation of beta diversity has received less attention (but see [
9–
11]). Beta diversity is a particularly useful metric that relates the species composition of a local area to the diversity of a region [
12], and provides information on the spatial variation in species composition. This information supports many scientific and applied goals; for example, it can provide valuable information on the ecological processes governing species distributions, or it can inform the placement of field surveys or conservation sites for the greatest biodiversity coverage [
13].
Airborne remote sensing can provide the spatial and spectral resolution to support remote species identification of individual tree crowns (e.g., [
14–
16]). This technology, along with sophisticated classification methods, has been successfully used in mapping individual tree crowns among 16 African savanna species classes with nearly 80% accuracy [
17]. From the identified vegetation within a landscape, it is possible to construct and analyze the beta diversity among sites [
18]. This approach has the advantage of delivering data on the distributions of individual species, resulting in easily interpreted community composition maps. However, creating a classification model to identify species requires the collection of a large number of field-identified crowns to train the model. This requirement precludes the use of classification models in many real-world situations in which extensive field-based training data are not available.
Because much of the useful information contained in plant community data consists of the compositional differences among sites, we asked whether it is possible to estimate these differences directly while circumventing the species identification step. This may be possible by examining the spectral variation of the vegetation. The spectral variation hypothesis proposed by Palmer
et al. [
19,
20] relates the spectral variation of a site to its ecosystem heterogeneity. This principle has been used to estimate local species richness (e.g., [
7]) and the beta diversity among sites [
9–
11] in forest ecosystems. However, these studies were conducted using multispectral satellite data with a spatial resolution larger than the objects (tree crowns) primarily responsible for the spectral variation among sites. It is unclear how to use spectral variation to effectively estimate species turnover among sites for high spatial and spectral resolution imagery.
Our objective was to develop a method for estimating the beta diversity among sites from high spatial resolution airborne data. Using hyperspectral data gathered by the Carnegie Airborne Observatory over an African savanna and more than 800 field-identified crowns, we tested alternative methods for using the spectral variation among sites to estimate species turnover. We then used the best unsupervised model to estimate the beta diversity and to produce maps of community compositional variation within three savanna landscapes. We compared these results to those obtained using a supervised species classification approach. If information on community compositional variation can be obtained without the use of training data, this would greatly extend the applications of airborne remote sensing for mapping biodiversity. This would also have implications for the use of high spatial and spectral resolution satellite imagery that may be developed and deployed in the future.
2. Methods
2.1. Imaging Spectrometer Data
The Carnegie Airborne Observatory (CAO) Alpha system [
21] was operated over several landscapes within Kruger National Park, South Africa, in April–May 2008. This system combined three instrument subsystems into a single airborne package: (i) a High-fidelity Imaging Spectrometer (HiFIS), (ii) a Light Detection and Ranging (LiDAR) scanner, and (iii) a Global Positioning System-Inertial Measurement Unit (GPS-IMU). The CAO HiFIS subsystem provided spectroscopic images consisting of 72 bands in the visible-near infrared spectral region between 384.8 and 1,054.3 nm. The GPS-IMU subsystem provided three-dimensional positioning and altitude data for the CAO-Alpha system for accurate projection of HiFIS data onto the land surface. The HiFIS was a pushbroom imaging array with 1,500 cross-track pixels, flown at an altitude of 2 km providing 1.12 m pixel resolution. Although the 3-D structural information provided by the LiDAR subsystem was not directly used in this analysis, the vegetation height information was used for the accurate orthorectification of the spectral data.
Radiance data from the imaging spectrometer were converted to surface reflectance using the atmospheric correction software ACORN 5BatchLi (Imspec LLC, Palmdale, CA, USA) with a MODTRAN look-up table to compensate for Rayleigh scattering and aerosol opticals. To correct for differences in cross-track reflectance due to differences in view angle—or bidirectional reflectance distribution function (BRDF) effects—the reflectance data were adjusted with a semi-empirical kernel-based BRDF model [
17].
Over 1,000 individual tree and shrub crowns were identified to species within the overflight area in 2008 and 2009. Identified crowns were georeferenced in the field with a hand-held GPS unit (GS50 Leica Geosystems Inc., (Norcross, GA, USA). These crowns were located within the images and their corresponding pixels were extracted to construct a library of species spectral characteristics. Prior to analysis, the crown spectral data were filtered to include only well-lit leafy vegetation pixels with NDVI ≥ 0.5 and mean near infrared (850–1,050 nm) reflectance ≥ 20%. This resulted in a total of 879 crowns representing 43 species, with a mean of 19.1 pixels per crown.
2.2. Simulated Communities
Simulated ecological communities were created from the field-identified crown spectra to evaluate different models for estimating the beta diversity among samples. To produce a variety of pairwise beta diversity values between samples, the species composing these communities were organized along an imaginary environmental gradient. For each simulation, 20 species were randomly selected from the species list, then 300 individual crowns were selected from among the pool of crowns belonging to those 20 species. Each species was randomly assigned a niche optimum value along the imaginary gradient. The individuals of each species were distributed along the gradient according to a normal density function with the mean equal to the species optimum value and a standard deviation equal to one-fifth the length of the gradient. Once all 300 crowns were assigned a position along the gradient, 10 samples, each containing 30 individuals, were created by cutting the gradient at every 10th percentile. Over all 300 individuals, the simulated communities had a mean of 19 species (not all of the 20 initially selected species had crowns selected for the sample) and species abundances were approximately log-normally distributed.
We used the Bray-Curtis dissimilarity index [
22] to measure beta diversity among samples. The Bray-Curtis dissimilarity index is calculated by the formula
where
BCij is the Bray-Curtis distance between samples
i and
j, and
xis and
xjs are the abundances of species
s in samples
i and
j, respectively. Bray-Curtis distance ranges between zero and one, where a value of zero means that two sites have identical species composition and a value of one means that two sites share no species in common. The simulation procedure produced pairwise Bray-Curtis distances among samples which were relatively evenly distributed between ∼0.2 and 1.
To compare the performance of alternate models, a simulated community was created and the true Bray-Curtis distances among samples were calculated based on the species identities of the crowns. A given model or model variant was applied to the simulated community, creating the model-generated distances among samples. As a measure of model performance, the Pearson correlation coefficient, or r-value, was calculated between the true Bray-Curtis distances and the model-generated distances. This was repeated 100 times to obtain a distribution of r-values for each model or model variant.
2.3. Unsupervised Methods for the Estimation of Beta Diversity
For the first unsupervised model we tested whether the beta diversity among samples could be estimated from the Euclidian distances between spectra from the different samples. This was calculated as the mean of all the pairwise Euclidian distances among the pixels of two different sample units. This model is referred to here as the Euclidian distance model.
The second unsupervised model involved clustering pixels into homogenous groups. Rather than clustering the pixels within the simulated community directly, a more general clustering was performed in which a random sample of 1,000 pixels (with NDVI ≥ 0.5 and mean NIR reflectance ≥ 20%) was drawn from the entire CAO-mapped area. These pixels were clustered into groups using k-means clustering (k = 40) and all pixels within the simulated community were assigned to the group with the nearest centroid. The Bray-Curtis distances among samples in the community were then calculated using pixel cluster assignments in place of their species identity. Because the configuration of the cluster centroids will vary due to the random selection of pixels from the landscape and the k-means solution, this process was repeated 200 times and the average Bray-Curtis distance over all 200 iterations was used as the model-generated distance metric. This model is referred to as the multiple clustering model.
We investigated the factors influencing the performance of beta diversity estimates produced by the multiple clustering model. The influence of the value of k, which is often chosen arbitrarily when conducting k-means clustering, was investigated by assessing the performance of the method over three additional values of k (10, 20, and 60). Significant differences in performance were assessed by taking the differences among the r-values obtained by each k for each iteration. The change in performance between two values of k was considered to be significant if the inner 95% of these differences did not overlap with zero.
We also investigated the relative contributions of the two main sources of variation in the performance of the multiple clustering model: variation from the clustering of the pixels chosen to represent the landscape and variation from the simulated community. More specifically, the former is the variation introduced by the random selection of pixels from the landscape along with the configurations of the 200 sets of cluster centroids, and the latter is the variation introduced by the particular species and crowns chosen to produce the simulated community and their placement along the imaginary gradient. A trial (100 iterations, k = 40) was performed in which the random selection of pixels from the landscape and the configuration of the 200 cluster sets were held constant while producing a new simulated community for each iteration. Another trial was performed in which the simulated community was held constant while taking a new random draw of pixels from the landscape and re-creating the 200 sets of cluster centroids for each iteration. We compared the variation in the r-values from these trials to evaluate the contributions of these factors to the model accuracy.
2.4. Supervised Species Classification for the Estimation of Beta Diversity
Supervised classification of crowns to species using support vector machines (SVM) has proven very successful for this data set [
17,
18]; therefore, we compared the unsupervised methods for estimating beta diversity with estimates produced from SVM-predicted species identities. SVM is a classification technique known for its good performance classifying new data based on relatively small amounts of training data [
15,
23–
25]. To create the SVM classification, the crown spectra were grouped into 15 species classes, each having more than 100 pixels and at least 15 crowns (
Table 1). The spectra that did not belong to one of these 15 species classes were grouped into an “other” class so that new data to be classified were not forced into one of the 15 named species groups. For the SVM, we used a radial basis function kernel and the model was optimized by an exhaustive grid search for the cost and gamma parameters resulting in the best cross-validated classification accuracy. The accuracy of the SVM in assigning a pixel to the correct species class was estimated to be 67.5% based on five-fold crown-level cross-validation (see below).
To produce SVM-predicted species identities for each pixel from the crown spectra dataset, one fifth of the crowns were removed from the full set of 879 crowns to form the test dataset, and the remaining four fifths of the crown spectra formed the training dataset. The splitting of the crowns into test and training datasets was stratified by class so that each class had proportional representation in the set of training crowns. An SVM was constructed with the training data and used to predict the species identity of the test pixels. This was repeated five times such that the species identity was predicted for every pixel using four fifths of the data that did not contain any pixels from the same crown. Simulated communities were produced from the crowns, and the Bray-Curtis distances among sample units were calculated based on the SVM-predicted species identities of the pixels. Prior to calculating the Bray-Curtis distances, pixels assigned to the “other” class were discarded as it is unknown whether two pixels of this class belong to the same or different species. The overall pixel classification accuracy for the entire dataset was recorded for each iteration as well as the correlation between the true Bray-Curtis distances and the SVM-estimated Bray-Curtis distances.
2.5. Landscape Comparison of the Multiple Clustering Model and SVM
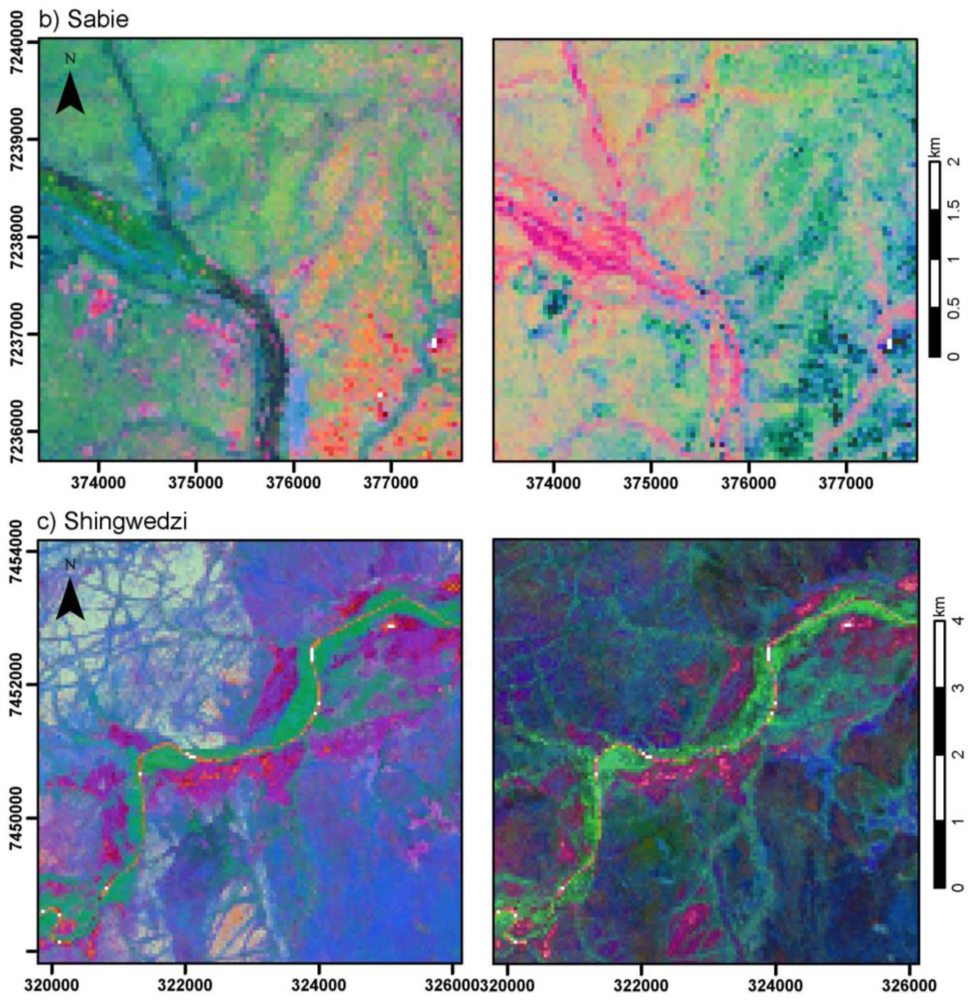
We compared the outcomes of applying the unsupervised multiple clustering model and the supervised SVM classification model to estimate the beta diversity within three landscapes of Kruger National Park. The landscapes represent three different overflight areas of the CAO, are located in different areas of the park, and contain distinct woody plant communities [
26]. The three landscapes were the Nwaswitshaka landscape located in the southwestern portion of the park, the Sabie landscape located on the Sabie River in the south-central portion of the park, and the Shingwedzi landscape located in the northern portion of the park [
27]. The sizes of the focal landscapes used for this comparison were 52.7 km
2, 18.8 km
2, and 40.3 km
2 for Nwaswitshaka, Sabie, and Shingwedzi, respectively.
The same filter used on the field-identified crowns to extract only well-lit, leafy vegetation pixels (NDVI ≥ 0.5 and mean NIR reflectance ≥ 20%) was applied to each landscape, which masks out bare ground, grass, and senescent vegetation in this area. Each landscape was divided into 0.25 ha quadrats. For the SVM classification, a final SVM was created using the entire set of field-identified crowns. For the multiple clustering model, the creation of 200 sets of cluster centroids (k = 40) was performed separately for each landscape. One thousand quadrats were randomly selected from each landscape and the pairwise Bray-Curtis distances among quadrats were estimated using both methods. We evaluated the concordance between the two methods by calculating the r-value between the pairwise estimated Bray-Curtis distances from the two methods for these 1,000 quadrats.
Beta diversity maps were created for each landscape using both SVM and the multiple clustering model. These maps were created by ordinating the quadrats in three-dimensional space based on the estimated pairwise Bray-Curtis distances. We used non-metric multidimensional scaling (NMDS) as the ordination method, which places samples in n-dimensional Euclidian space in a way that preserves the rank-order of the original pairwise distances as closely as possible [
28,
29]. Because the landscapes contained a very large number of quadrats, making direct ordination via NMDS computationally onerous, NMDS was performed on the subset of 1,000 quadrats and the ordination results were extended to all remaining quadrats using k nearest neighbors [
13]. For the combination of NMDS and knn, the closest five neighbors among the 1,000 NMDS-ordinated quadrats were found for each remaining quadrat, and the scores along each of the three ordination axes were assigned to the remaining quadrats as the weighted mean of the scores of the five nearest neighbors. The weight
w of the
jth neighbor with respect to quadrat
i was given by the formula
where
BCij is the Bray-Curtis dissimilarity between quadrats
i and
j, and
k is the number of neighbors used (here,
k = 5). The position of each quadrat in three-dimensional ordination space was translated into an RGB color by assigning the scores along each of the three axes to intensity of red, green, and blue. The resulting color maps display the estimated beta diversity among quadrats: two quadrats with similar color have low estimated Bray-Curtis distance; however, the absolute color of a given quadrat is irrelevant.
Species classification using SVM, NMDS, and handling of raster data were performed using the “e1071” [
30], the “vegan” [
31], and “raster” [
32] packages, respectively, of the R programming language [
33].
3. Results
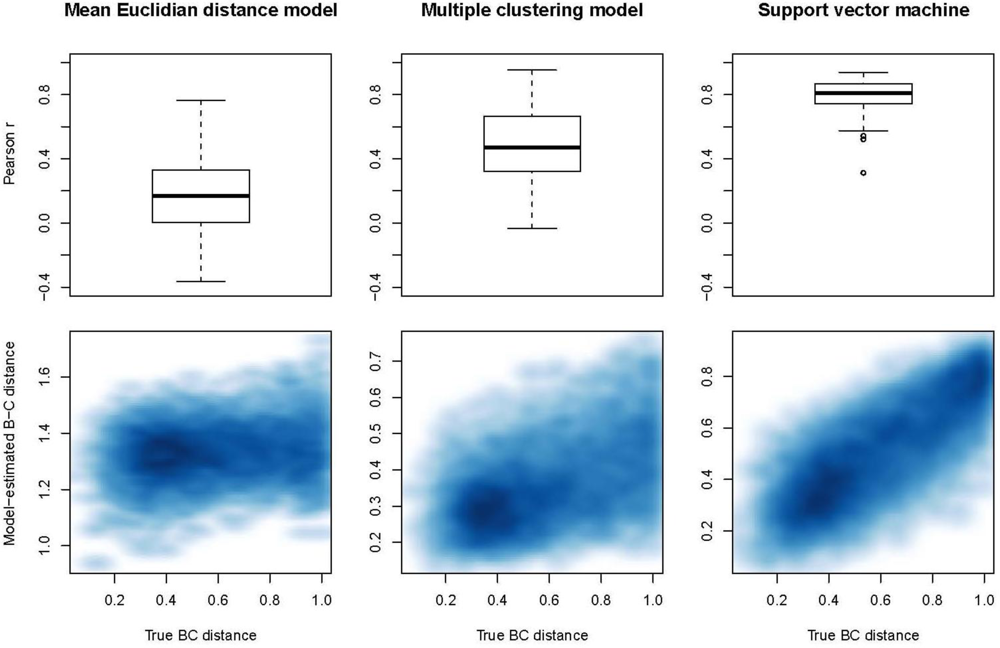
The unsupervised multiple clustering model performed better than the Euclidian distance model (
Figure 1). The mean r-value between the true Bray-Curtis distance and the distance estimated by the multiple clustering model was 0.483 (±0.022 SE), while the mean r-value between the true Bray-Curtis distance and the mean Euclidian distance was 0.165 (±0.024 SE). However, the multiple clustering model did not perform as well as the supervised species classification approach for this dataset. SVM had the best performance and the lowest variability in performance with a mean r-value of 0.789 (±0.011 SE) between the true Bray-Curtis distance and the distance estimated from SVM-predicted species identities.
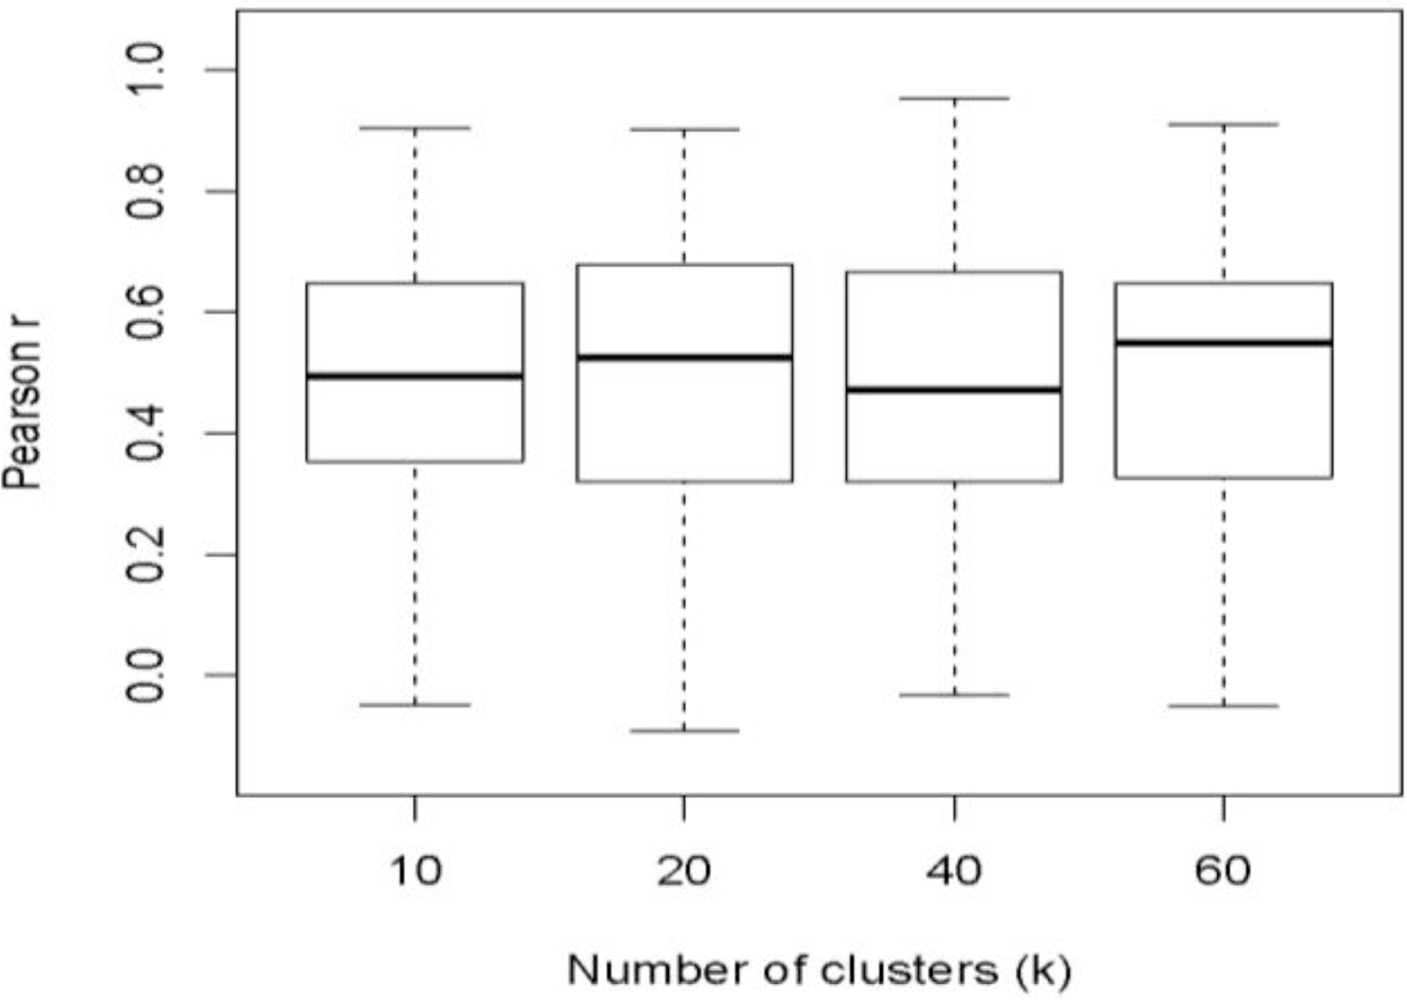
The performance of the multiple clustering model was insensitive to the number of clusters used in the k-means algorithm: there were no significant differences in the r-values among models using different k values over the range of k values tested (
Figure 2). The performance of the k-means clustering method (k = 40) in estimating the beta diversity of the simulated communities had considerable variation (
Figure 1), with a standard deviation of 0.224 among the r-values. When the configuration of the 200 sets of cluster centroids was held constant and the composition of the simulated community was allowed to vary, the variation in the r-values was very similar (SD = 0.221). Conversely, when the simulated community was held constant while recreating the 200 sets of cluster centroids each iteration, the variation in the r-values was extremely small (SD = 0.0016).
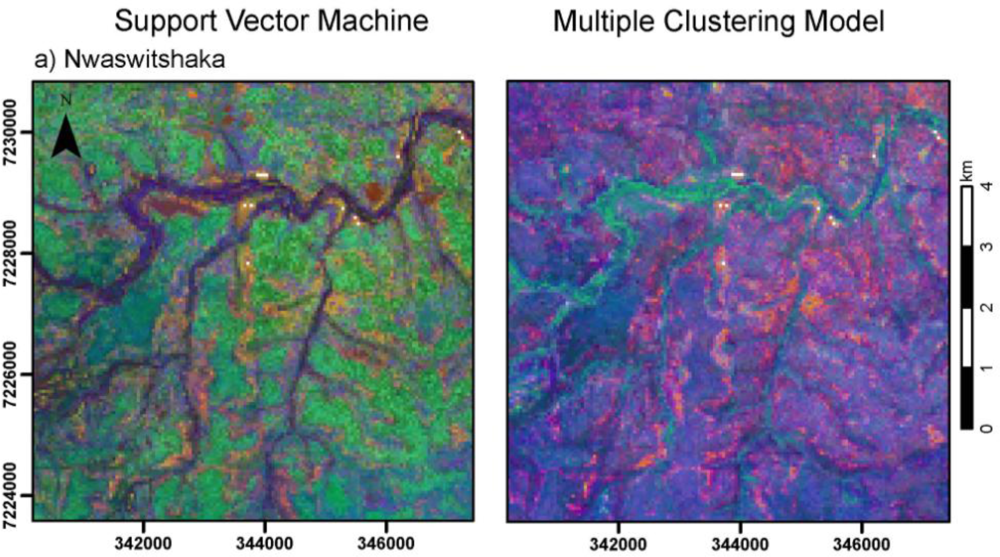
For the focal savanna landscapes, the beta diversity estimates produced by the unsupervised multiple clustering model were similar to those produced by SVM. The r-values for the pairwise correlation between the Bray-Curtis distances estimated by the two methods were 0.632 for Nwaswitshaka, 0.822 for Sabie, and 0.700 for Shingwedzi. Accordingly, the beta diversity maps of the savanna landscapes produced by the two methods showed similar spatial patterns in species compositional variation (
Figure 3). However, for Shingwedzi, the SVM identified a broad difference in species composition between the left and right halves of the image that was not apparent in the image produced by the multiple clustering model (
Figure 3(c)).
4. Discussion
The multiple clustering model proposed here allows a rapid assessment of the spatial arrangement of the biodiversity of a region. This method vastly outperformed the other unsupervised method based on the mean Euclidian distance among pixels, but did not obtain accuracies as high as those obtained using a supervised species classification approach. When applied to African savanna landscapes, the multiple clustering model provided beta diversity estimates similar to those obtained from a supervised species classification approach without the use of training crowns.
The unsupervised multiple clustering model capitalizes on the spectral variation of vegetation to identify differences that correspond more closely to real changes in species composition. This model treats the spectral variation of the vegetation in a way that corresponds to a realistic model of how this variation is produced: as the outcome of a mixture of different groups (species), which are more spectrally similar within a group than among groups [
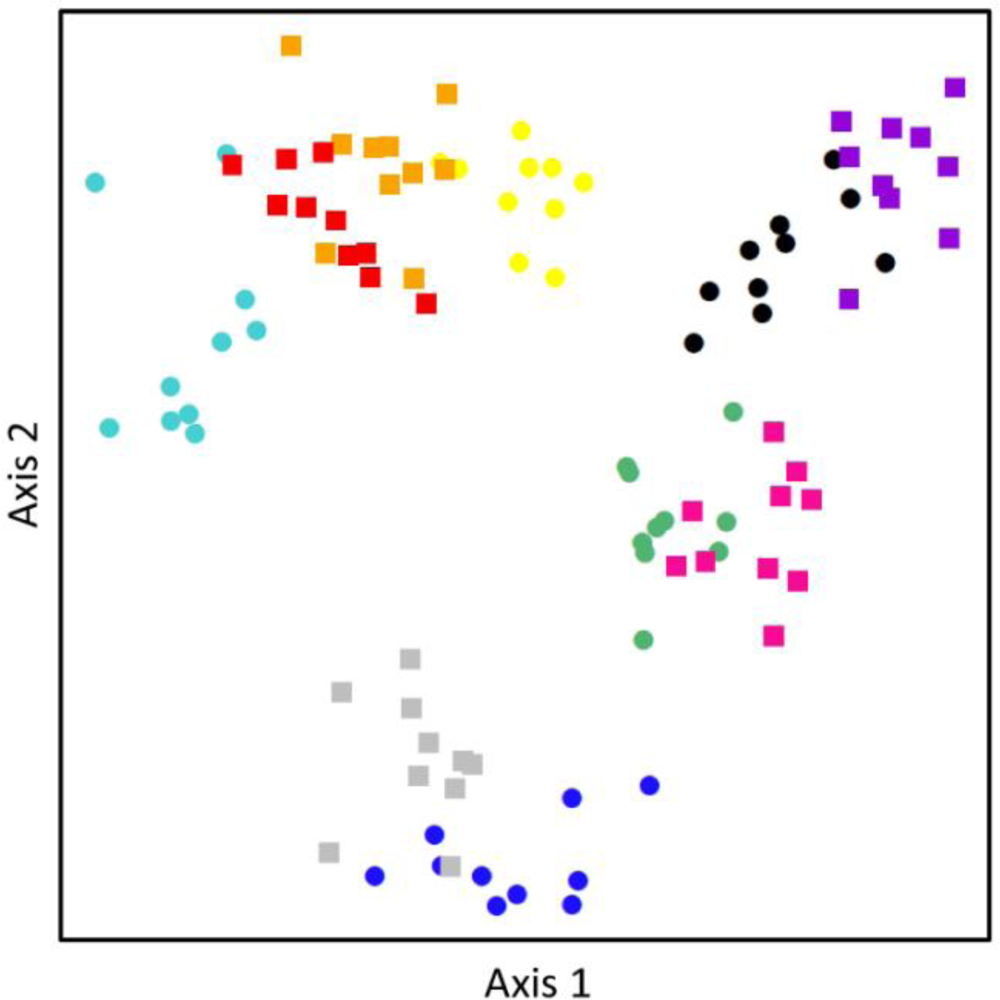
34]. In this conceptual model (illustrated in
Figure 4), the spectra of different sites may occupy the same general spectral space. A distance measure related to differences in the overall distribution of the sites in spectral space (such as the Euclidian distance model here) is therefore unlikely to bear much relationship to the species turnover among sites. However, clustering the spectra into smaller groups may reveal patterns in the groups found at different sites. This process may be seen as mimicking the grouping of spectra by species, from which the compositional dissimilarity may be estimated.
The variability in the performance of the multiple clustering model was barely affected when the 200 sets of cluster centroids was held constant, but decreased enormously when the simulated community was held constant. This indicates that the variation in the performance of the multiple clustering model results almost entirely from differences in the species composition of the simulated communities, and thus the accuracy in estimating the beta diversity of a region is highly dependent on the particular species present. This is unsurprising as we expect the spectral differences among species to greatly influence our ability to tease them apart using any approach. The very small amount of variability in accuracy introduced by the set of reference clusters used in the multiple clustering model indicates that 200 sets of clusters, each constructed from 1,000 pixels, was sufficient to represent the variability introduced by the individual k-means clustering outcomes. Therefore, it is the particular species and their arrangement, rather than the particular clustering outcomes, which accounts for nearly all of the variability in the multiple clustering model performance.
A supervised species classification approach that makes use of training crowns increases the accuracy of the beta diversity estimates for this dataset. This no doubt occurs because a large training dataset makes it possible to construct well-informed groups of spectra corresponding to real species. A drawback of the species classification approach is that it may not be possible to create spectral libraries for all species of interest, especially for species-rich ecosystems. This causes much of the spectral information contained in the vegetation to be discarded: approximately 50% of the bright, leafy pixels in the focal savanna landscapes were classified as belonging to the “other” class, which then could not be used to estimate the beta diversity among sites. The accuracy of a species classification model in assigning objects to the correct class and the proportion of vegetation that does not fit into one of the known species classes are constrained by the quantity and distribution of training data. For this dataset, containing many training crowns, the SVM approach produced good beta diversity estimates despite a large amount of vegetation pixels that were discarded as “other”. However, decreases in accuracy and loss of species classes will, at some point, become severe as training data become scarcer. For these reasons, unsupervised methods for characterizing vegetation biodiversity may be an attractive alternative to supervised methods when training data are scarce.
According to the spectral variation hypothesis, the spectral variation of a site is related to its environmental heterogeneity, and this may give an indication of its species richness [
19,
20]. An extension of this idea is that the spectral variation among sites may give an indication of their ecological dissimilarity, or beta diversity. Previous studies have investigated the relationship between spectral distance and beta diversity using satellite data (e.g., [
9,
11,
35]). These studies used the spectral distance among sites in Euclidian spectral space (generally for few Landsat bands) to relate to differences in species composition among sites. However, taking the Euclidian distance among sites in spectral space is not suitable for high spatial and spectral resolution airborne imaging spectrometer data. We found that clustering these data into discrete entities makes the most of the sub-canopy-resolution spectral signatures for the estimation of beta diversity among sites.


