Article

A Downscaling Method for Improving the Spatial Resolution of AMSR-E Derived Soil Moisture Product Based on MSG-SEVIRI Data

Institute of Mountain Hazards and Environment, Chinese Academy of Sciences, Chengdu 610041, China
*
Author to whom correspondence should be addressed.
Remote Sens. 2013, 5(12), 6790-6811; https://doi.org/10.3390/rs5126790
Submission received: 27 September 2013 / Revised: 15 November 2013 / Accepted: 26 November 2013 / Published: 6 December 2013

Abstract

:
Soil moisture is a vital parameter in various land surface processes, and microwave remote sensing is widely used to estimate regional soil moisture. However, the application of the retrieved soil moisture data is restricted by its coarse spatial resolution. To overcome this weakness, many methods were proposed to downscale microwave soil moisture data. The traditional method is the microwave-optical/IR synergistic approach, in which land surface temperature (LST), vegetation index and surface albedo are key parameters. However, due to the uncertainty in absolute LST estimation, this approach is partly dependent on the accuracy of LST estimation. To eliminate the impacts of LST estimation, an improved downscaling method is proposed in this study to downscale Advanced Microwave Scanning Radiometer on the Earth Observing System (AMSR-E) Land Parameter Retrieval Model (LPRM) soil moisture product with visible and thermal data of Meteosat Second Generation (MSG)—Spinning Enhanced Visible and Infrared Imager (SEVIRI). Two temperature temporal variation parameters related to soil moisture, including mid-morning rising rate and daily maximum temperature time, are introduced in the proposed method to replace LST. The proposed method and the traditional method are both applied to the Iberian Peninsula area for July and August 2007. Comparison of the two results shows that the coefficient of determination (R-squared) has an average improvement of 0.08 and the root mean square error has a systematic decrease. The downscaled soil moisture by the proposed method was validated by REMEDHUS soil moisture network in the study area, and site specific validation gets poor correlation between the two datasets because of the low spatial representativeness of site measurement for one MSG-SEVIRI pixel. Although the comparisons at 15 km and network scale show an improvement over the site specific comparison, it is found that the downscaling method systematically degrades the accuracy in soil moisture data, with a R-squared of 0–0.4 and 0.218 for the downscaled data set against 0.7–0.8 and 0.571 for AMSR-E data at 15 km scale and the network scale respectively.

1. Introduction

In a variety of scientific disciplines, soil moisture is very important for groundwater recharge, agriculture, soil chemistry, etc. It greatly influences hydrological and agricultural processes on land surface [13], runoff generation [4], drought development [5] and many other processes [6,7]. By partly governing the partitioning of the mass and energy fluxes between the land and atmosphere, soil moisture also has an important influence on the climate system from local to global scale, and it has been recognized as an Essential Climate Variable (ECV) by the Global Climate Observing System (GCOS) in 2010.
Compared with conventional ground based techniques, satellite remote sensing methods are playing a more and more important role to determine surface soil moisture because of their advantages of spatial coverage and high frequency. Many efforts have been contributed by utilizing information from different types of remote sensing methods to obtain a correct understanding of soil moisture distribution at different spatial and temporal scales during the last decades [813]. Generally, optical/IR and microwave technologies are the most common ways for soil moisture monitoring. For optical/IR methods, the basic principle is that land surface temperature (LST) is sensitive to surface soil water content due to its impact on surface heating process under bare soil or sparse vegetation cover conditions. However, the increase of vegetation cover makes the relationship more complex because it blocks the retrieval of information from soil surface. Although this kind of algorithm can provide fine spatial resolution for soil moisture estimation, there is no direct relationship between the remotely sensed information and soil moisture, and the method is highly affected by cloud cover. For microwave technology, a promising quantitative technique has been demonstrated to retrieve soil moisture due to it having a physically based relationship between the land surface emission and soil moisture. Furthermore, the microwave signal can penetrate cloud and vegetation canopy to a certain extent and provides all-weather and continuous monitoring of surface soil moisture conditions. However, because of the man-made emitters on the ground, on aircraft or space borne systems, the data collection is contaminated by Radio Frequency Interference (RFI). At L-band, the area affected by interference sources is larger than at higher frequencies.
Up to now, a number of passive microwave satellite sensors have been launched to derive surface soil moisture at global scale, such as Nimbus Scanning Multi-channel Microwave Radiometer (SMMR), Special Sensor Microwave/Imager (SSM/I), Tropical Rainfall Measuring Mission Microwave Imager (TMI), Advanced Microwave Scanning Radiometer on the Earth Observing System (AMSR-E) and Soil Moisture and Ocean Salinity satellite (SMOS). Additionally, the Soil Moisture Active and Passive (SMAP) program by National Aeronautics and Space Administration (NASA) is scheduled for launching in 2014 to provide measurements of the land surface soil moisture with near-global revisit coverage of 2 to 3 days [14,15]. However, due to the low natural emittance capacity in the microwave spectral region, all spaceborne systems are currently limited to large scale observations with a typical spatial resolution of tens of kilometers. The coarse resolution is adequate for many global applications, but not enough for regional studies with the resolution of 1 to 10 km. The coarse resolution soil moisture products hardly satisfy the needs of various hydro-climatological and agricultural applications [16,17]. Meanwhile, soil moisture usually presents heterogeneous spatial distribution at this fine resolution because of the variation of ground conditions such as topography, soil physical properties, rainfall distribution, land use, and irrigation. Therefore, it is urgent to develop a practical method for getting accurate high-resolution soil moisture data on the basis of the microwave soil moisture products.
Many studies were conducted to improve the spatial resolution of microwave soil moisture estimated by the combination of the higher resolution optical/IR satellite data [1822]. Considering the impact of soil moisture on LST and vegetation, a unique relationship was proposed by Gillies and Carlson [23] for the estimation of regional patterns of surface soil moisture availability with NDVI and LST by using a Soil Vegetation Atmosphere Transfer (SVAT) model. The theory can be referred to as the so-called “universal triangle” concept. Based on this theory, Chauhan et al. [18] disaggregated the SSM/I microwave soil moisture into higher resolution soil moisture in conjunction with the Advanced Very High Resolution Radiometer (AVHRR) NDVI, surface albedo and LST data. The predicted soil moisture results at high resolution agree well with low resolution results in both magnitude and spatio-temporal patterns. Similar studies were done by Hossain and Easson [24] and Choi and Hur [21] using the AMSR-E soil moisture product and optical/infrared imagery from MODIS. To strengthen the relationship between land surface parameters and soil moisture, Piles et al. [20] added SMOS brightness temperatures to the aforementioned regression model. The application of the method showed that the soil moisture variability was effectively captured at 10 km and 1 km spatial scales without a significant degradation of the root mean square error, and the bias was significantly reduced from 0.09 m3/m3 to 0 m3/m3 at 1 km spatial scale comparing with the original method. In addition to the polynomial fitting method, Merlin et al. [25] developed a downscaling algorithm by using a semi-empirical soil evaporative efficiency model to link microwave-derived soil moisture with red, near-infrared and thermal-infrared data. An improved and robust disaggregation algorithm was developed by Merlin et al. [26] to better represent the nonlinearities between microwave-derived soil moisture and the soil evaporative efficiency by using three different formulations of fractional vegetation cover, three different models of soil evaporative efficiency, and four different downscaling relationships. Kim and Hogue [22] also proposed a downscaling method (UCLA method) based on the soil wetness (SW) developed by Jiang and Islam [27]. A simple ratio was constructed between the MODIS-derived SW and the mean of MODIS-based SW within each AMSR-E pixel, and it was used to obtain the soil moisture at MODIS spatial scale. The method was compared with Chauhan method [18] and Merlin method [25], and it had good performance as Merlin method with spatial correlation improved from 0.08 to 0.27 and 0.34 respectively.
A recent review of the downscaling approaches was provided in Merlin et al. [28], and the downscaling approaches were divided into polynomial fitting method and evaporation-based method. From the overview of previous downscaling methods, it is obvious that most of them focus on downscaling microwave soil moisture with MODIS or AVHRR polar orbit satellite data. But for geostationary satellite data, few works have been done. In contrast with polar orbit satellite data, the geostationary satellite data can provide continuous observation of the land surface with a frequency of an hour or less. Daily cycle of LST variation can be accurately depicted by geostationary satellite data, which brings a good opportunity to understand land surface energy and water exchange. As indicated the study of Wetzel et al. [29], the morning rise of LST could be approximated as a linear process, and it has the clearest soil moisture signal under clear sky conditions. Zhao and Li [30] confirmed this conclusion, and developed a simple linear model to estimate bare surface soil moisture with two LST temporal parameters (the LST mid-morning slope normalized by the difference of the NSSR and Local time when maximum LST occurs). In this paper, an improved method is proposed for downscaling microwave soil moisture product with geostationary satellite data. This approach is applied to AMSR-E soil moisture product combined with Spinning Enhanced Visible and Infrared Imager (SEVIRI) data onboard the Meteosat Second Generation (MSG) satellite. Intercomparison is conducted to evaluate the performance of the proposed method with the approach presented by Chauhan et al. [18].

2. Study Area and Dataset
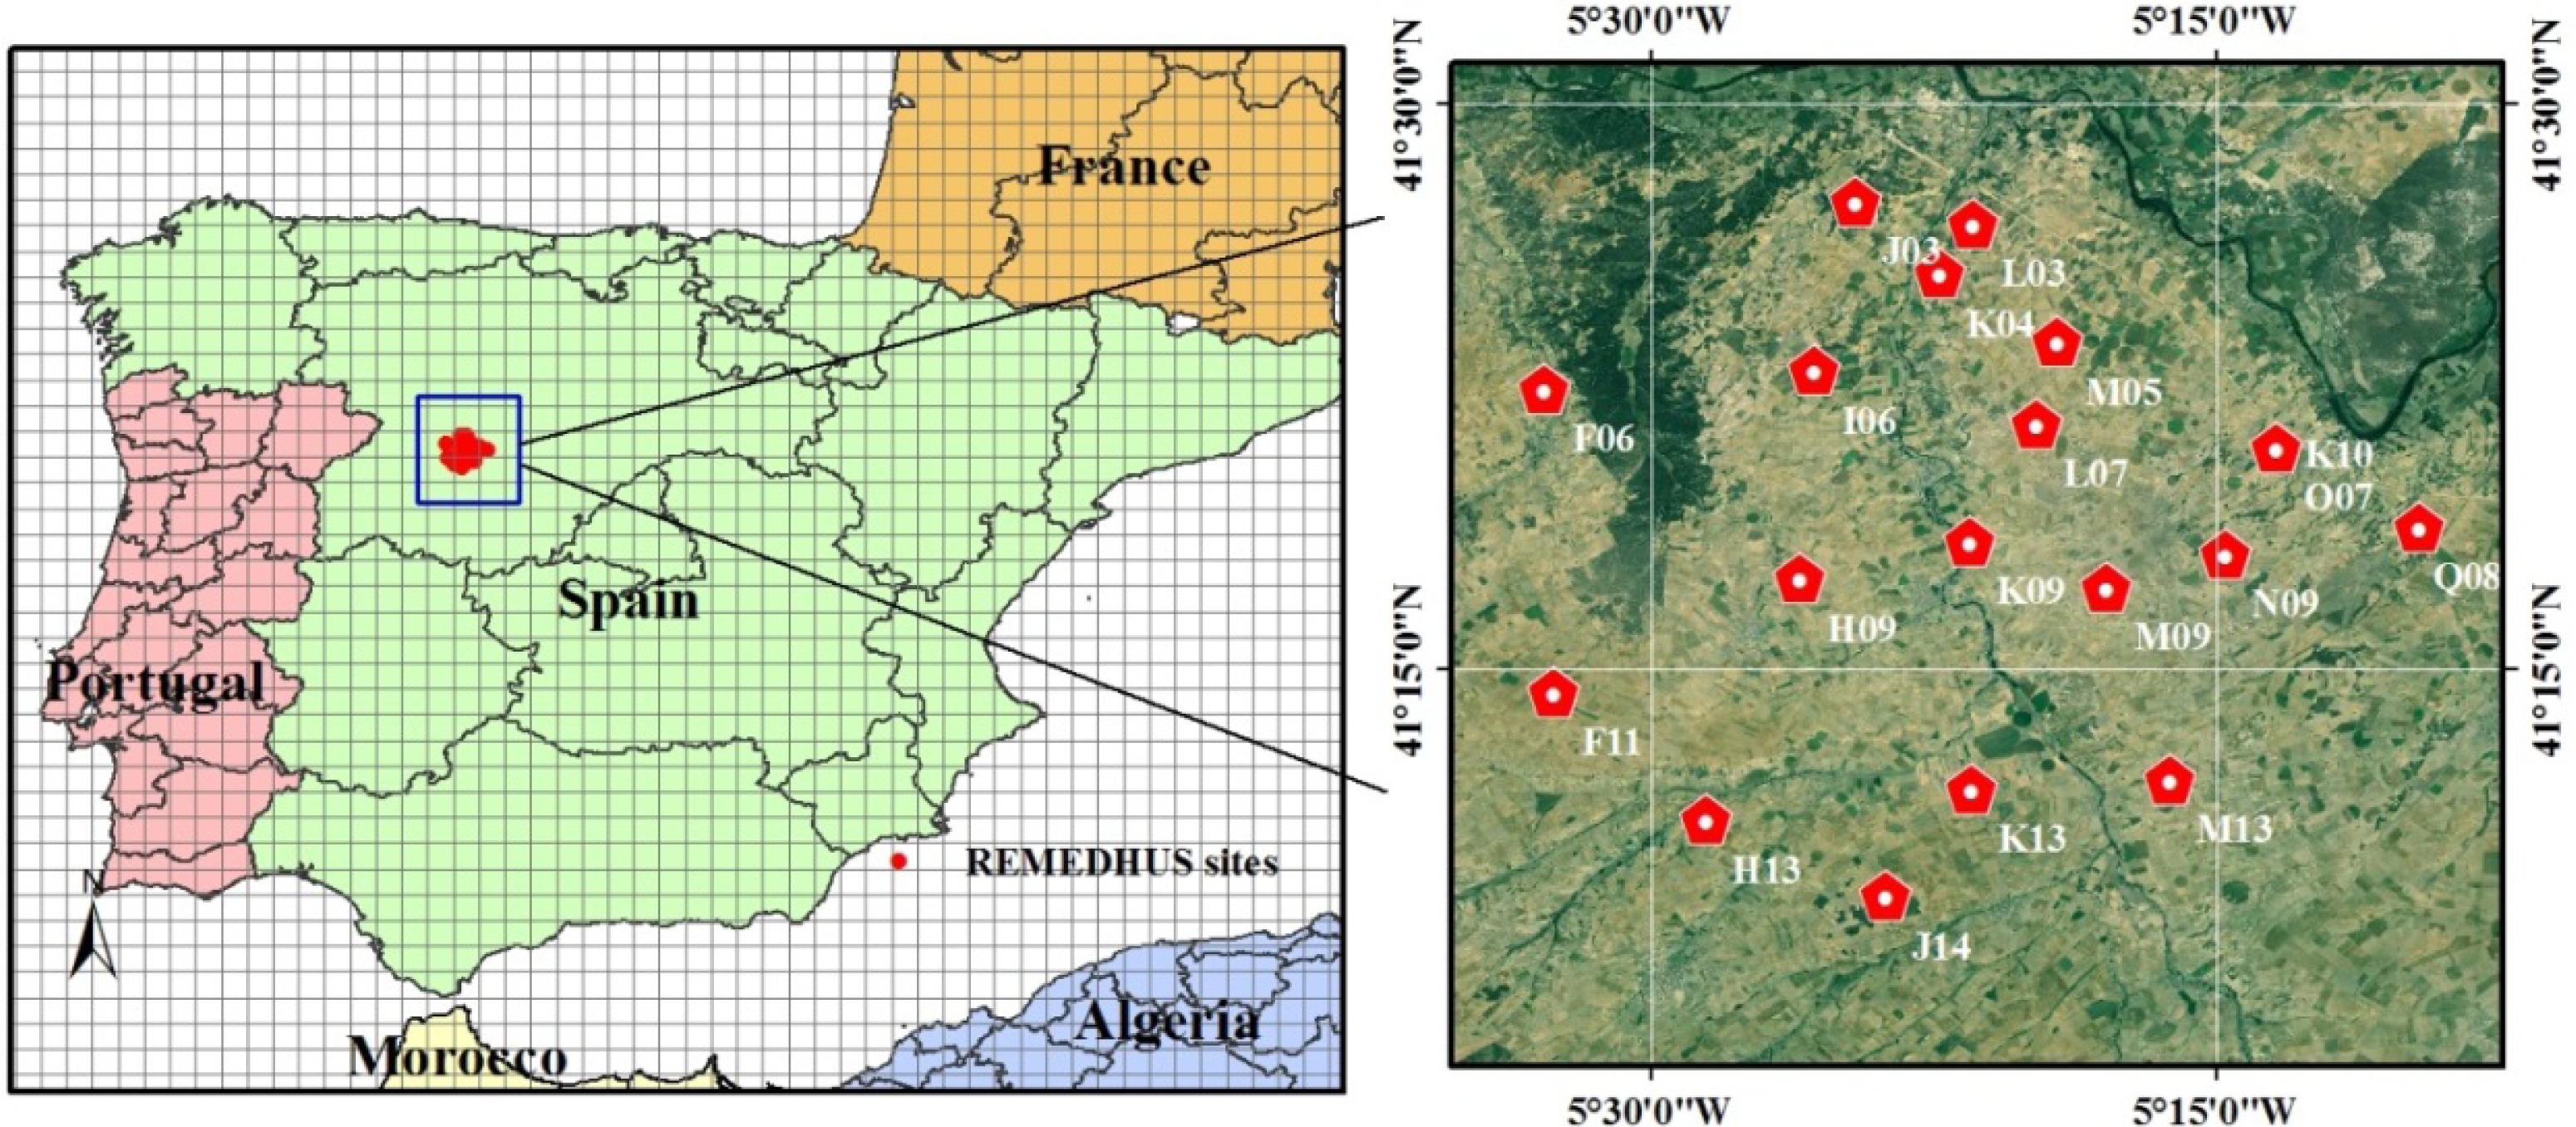
2.1. Study Area

The Iberian Peninsula was selected as the study area which has clearer sky condition than other European areas, and there is a Cal/Val site (REMEDHUS) in this region with 19 soil moisture monitoring stations (Figure 1). The stations are located in a central semiarid sector of the Duero basin, and the soil moisture observations in these stations have been widely used in calibration and validation experiments [3134]. For the REMEDHUS region, it is almost a flat area (less than 10% slope) with its elevation ranges from 700 to 900 m. The main land use type is cropland. Piles et al. [35] disaggregated passive L-band airborne soil moisture with Landsat VIS/IR data in this region to get fine resolution soil moisture data. These studies confirmed the reliability of the soil moisture data collected in these stations. The top layer (0–5 cm) soil moisture data were downloaded from the International Soil Moisture Network ( http://ismn.geo.tuwien.ac.at/) to validate the derived downscaled soil moisture at MSG resolution level.

2.2. AMSR-E Derived Soil Moisture Data

The AMSR-E sensor is one of the six sensors aboard the Aqua satellite launched in 2002. It is a passive microwave radiometer with six bands ranging from 6.9 GHz to 89 GHz at HH-VV polarization, and it is modified from the Advanced Earth Observing Satellite-II (ADEOS-II) AMSR. The sensor observations are used to monitor atmospheric, land, oceanic, and cryospheric parameters including precipitation, sea surface temperatures, ice concentrations, snow water equivalent, surface wetness, wind speed, atmospheric cloud water, and water vapor.
Several algorithms were developed to derive near-surface soil moisture from AMSR-E microwave brightness temperatures via a land-surface radiative transfer model that accounts for the contribution of soil moisture, soil temperature, and vegetation to passive microwave emissions. These approaches include the standard algorithm provided by NASA [36], the Land Parameter Retrieval Model (LPRM) developed by the “Vrije Univeristeit Amsterdam” in collaboration with NASA [37] and the algorithm developed at the Japanese Aerospace Exploration Agency (JAXA) [38]. Among the different AMSR-E soil moisture algorithms, the LPRM is based on a forward radiative transfer model to retrieve surface soil moisture with C- or X-band radiances as input, and its product is believed to have better agreement with in situ soil moisture observation [3941]. Therefore, AMSR-E LPRM soil moisture products was chosen for this study, and the detail information about the LPRM algorithm of retrieving soil moisture can be found in Owe et al. [37] and Owe et al. [39].
The level 3 daily ascending LPRM soil moisture products of July and August 2007 were downloaded from http://gcmd.nasa.gov. This level 3 dataset provides surface soil moisture, land surface (skin) temperature, and vegetation water content. The ascending time is 13:30 equatorial local crossing time. The product is resampled on a 0.25 degree resolution grid.

2.3. MSG-SEVIRI Data
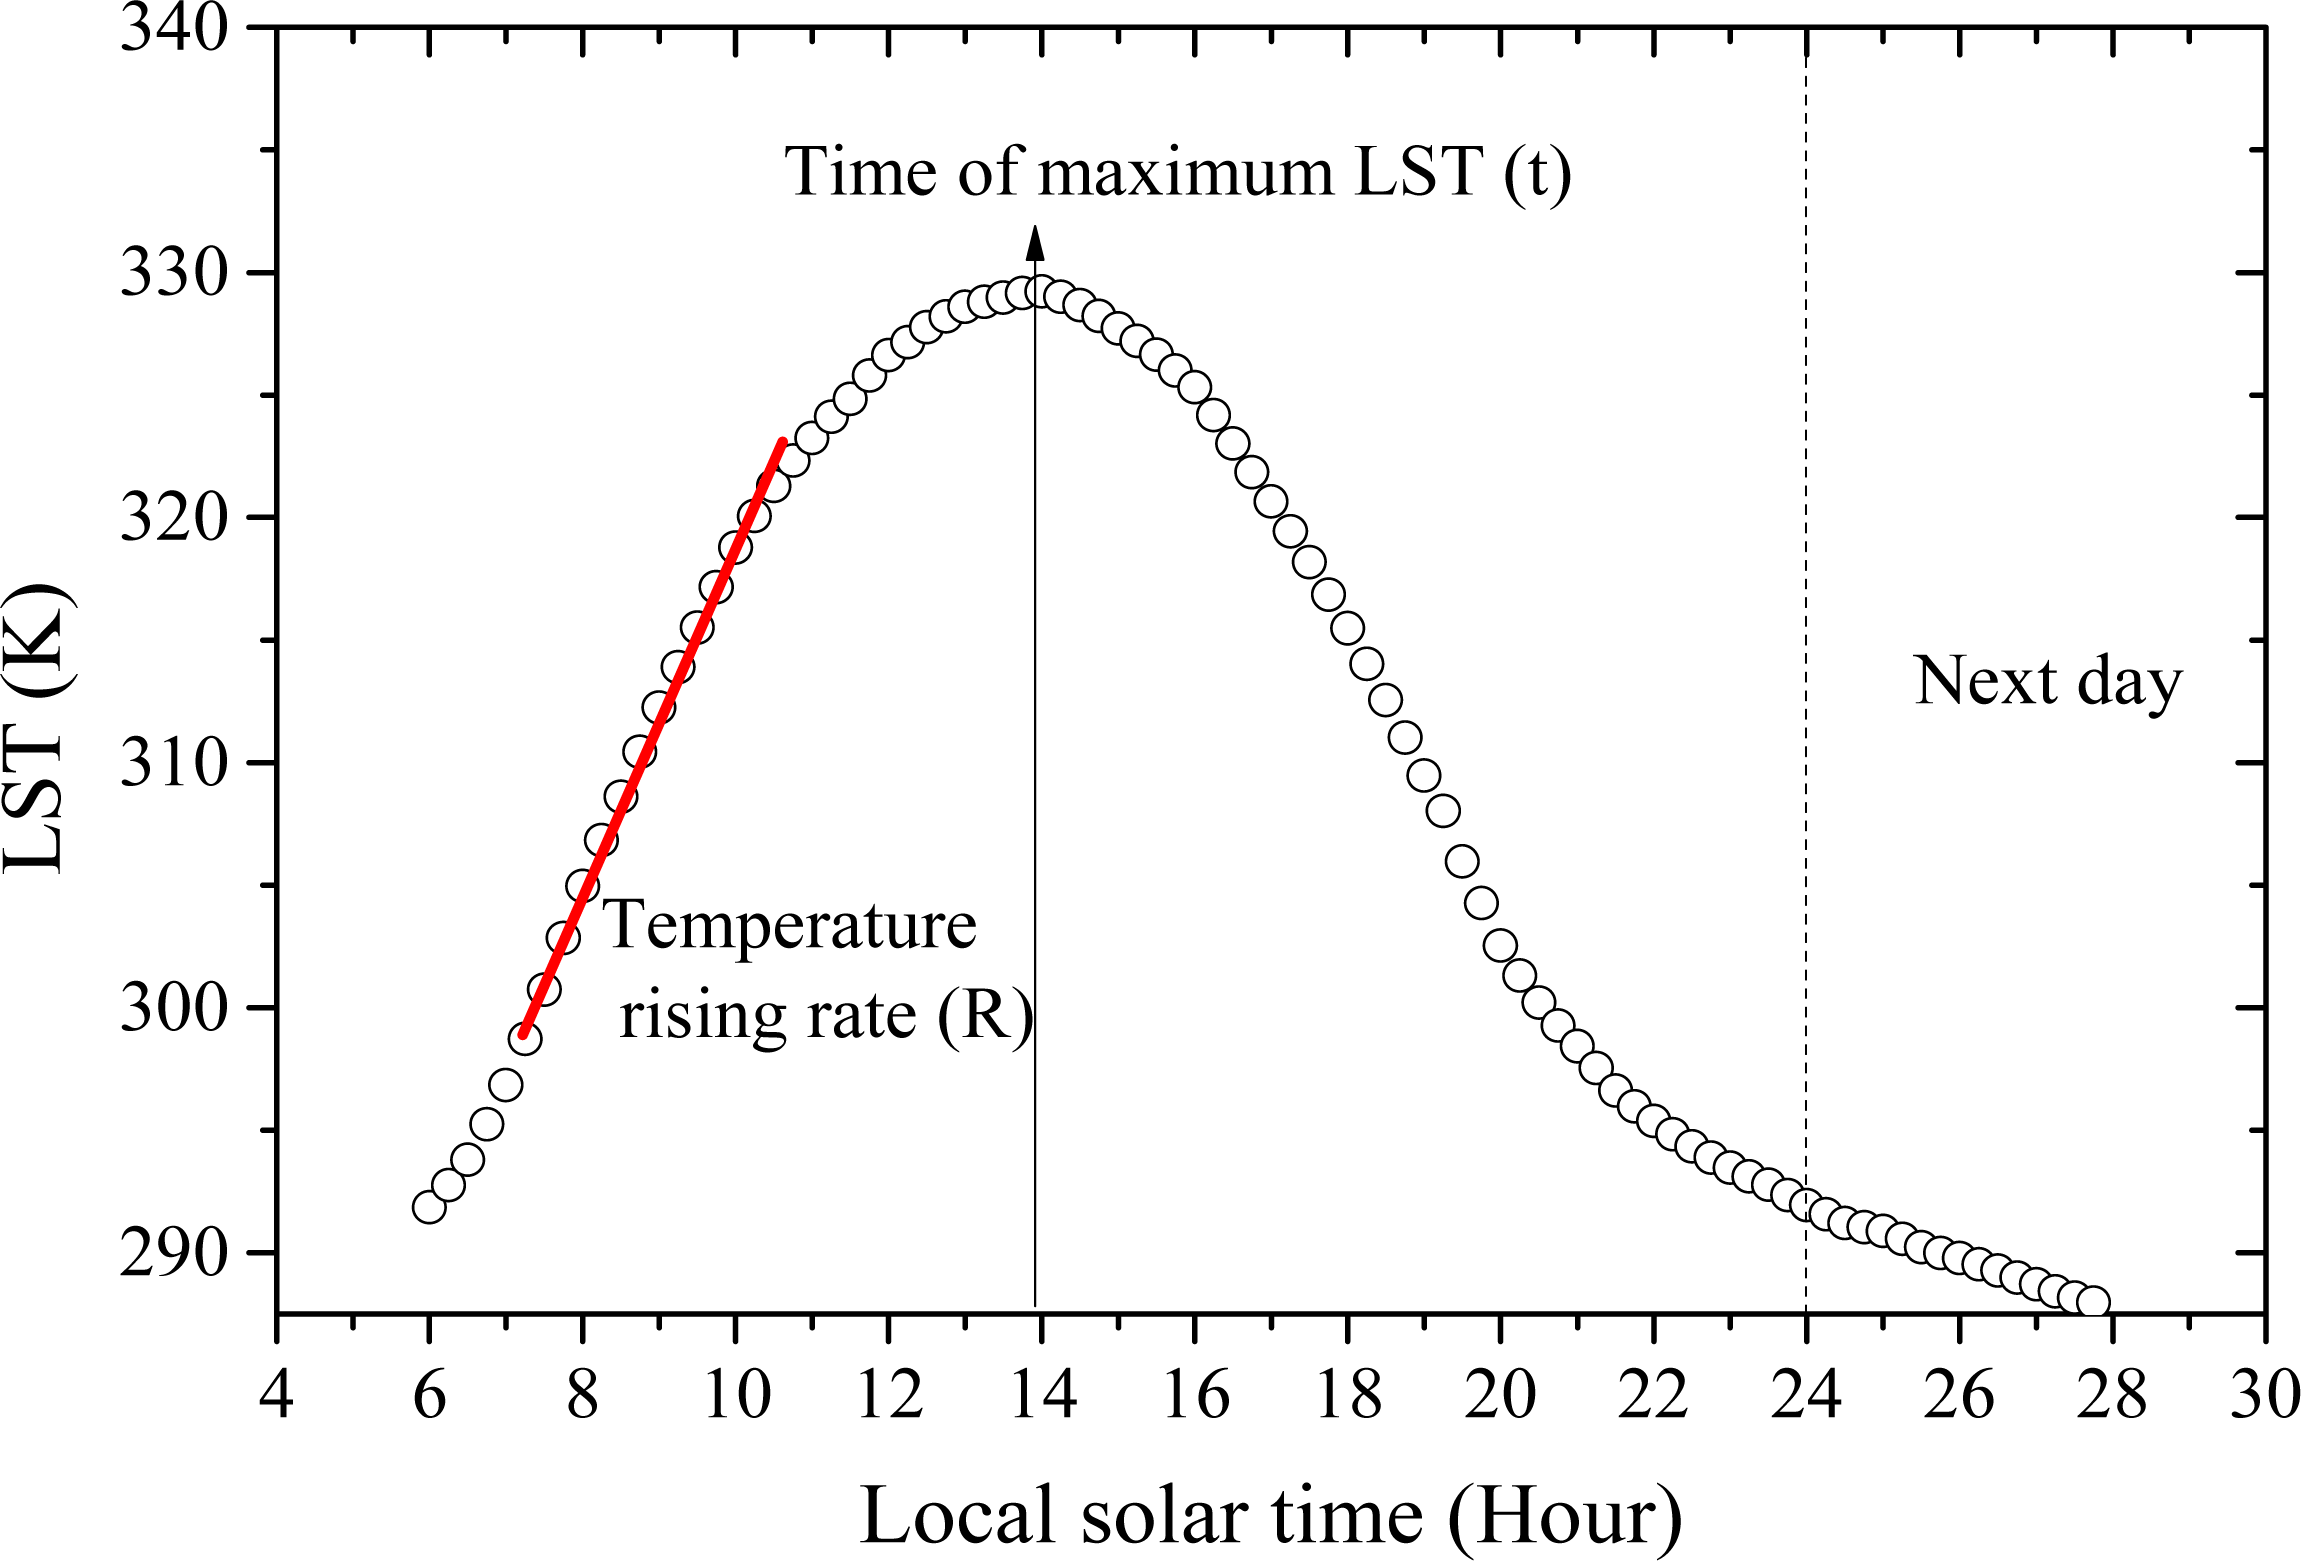
MSG is a new generation geostationary satellite which was developed by the European Space Agency (ESA) and EUMETSAT. Its main payload is SEVIRI and it provides 15-min observations of the electromagnetic radiation from the land surface and atmosphere in 12 spectral bands from visible to infrared spectrum, enabling the quantitative estimation of LST, leaf area index (LAI), fraction of vegetation cover (FVC), albedo and many other land surface parameters. These products have a sub nadir spatial resolution of 3 km that deteriorates towards the poles, reducing to an average of 5 km for the E-W direction over the European continent. While for N-S direction, the resolution has a big change from less than 5 km in the south to up to 11 km in the north. In this study, 15-min LST, daily FVC and daily surface albedo products of July and August 2007 were downloaded from the Land Surface Analysis Satellite Applications Facility with the same period as the AMSR-E product (LSA SAF, https://landsaf.meteo.pt/). Detail information about the retrieval algorithms can be referred to their product user manuals provided in the website.

3. Methodology

One popular downscaling method is based on the triangle space among soil moisture, NDVI and LST. As presented by Gillies and Carlson [23], a quantitative interpretation of the triangle space was made by varying the surface temperature, soil moisture availability and vegetation index (or vegetation cover) in the SVAT simulation. An inverse modeling scheme was developed to build the relationship among soil moisture availability, vegetation index (or vegetation cover) and surface temperature. The inverse method was written as:
M 0 = p = 0 2 q = 0 2 α pq T * ( p ) N * ( q )
where M0 is the soil moisture availability, T* and N* are the normalized temperature NDVI respectively based on their maximum and minimum values.
Chauhan et al. [18] modified this method to disaggregate the microwave soil moisture data. In the modified method (Equation (2)), microwave-derived soil moisture (M) replaced the soil moisture availability (M0) in Equation (1). Considering the impact of soil moisture on surface albedo (A), normalized surface albedo (A*) was added to the regression model to strengthen the relationship.
M = i = 0 2 j = 0 2 k = 0 2 α i , j , k T * ( i ) N * ( j ) A * ( k )
In this above equation, the high order (more than two) terms are ignored. Therefore, there are ten unknown coefficients to be determined. The disaggregation consists of three steps. The first step is the derivation of T*, N* and A* at the coarse resolution level of microwave data by aggregating their values from optical/IR data at fine resolution level. The second step is to get the regression coefficients (αi,j,k) with the Microwave soil moisture data and the three parameters. In the last step, the estimated regression models, including the regression coefficients, are then applied to estimate the fine resolution soil moisture data. This method is referred as “Chauhan 2003” in the following text.
In the “Chauhan 2003” method, instantaneous LST is utilized as an important parameter relating to soil moisture. However, the accuracy of the instantaneous LST is considerably influenced by atmospheric condition and surface emissivity. The uncertainty of LST estimation would directly influence the accuracy of the downscaling results. Compared with the absolute LST value, the temporal change of LST seems to have better relationship with soil moisture, and it is also less sensitive to LST estimation error. Therefore, the mean error in the thermal information will decrease if the temperature change information is used instead of an absolute temperature [42]. Based on the findings of Zhao and Li [30], two temperature temporal change parameters related to soil moisture (mid-morning temperature rising rate and maximum temperature time) were introduced in the proposed method. The normalized LST on the right side of Equation (2) is replaced by normalized mid-morning temperature rising rate (R*) and normalized maximum temperature time (t*). Vegetation fraction cover (FVC) is used to represent the influences of vegetation on soil moisture as what normalized NDVI does. The last parameter is the normalized surface albedo (A*). Thus, the expression of the improved approach is:
M = i = 0 2 j = 0 2 k = 0 2 l = 0 2 β i , j , k , l R * ( i ) t * ( j ) FVC ( k ) A * ( l )
Similar as the “Chauhan 2003” method, the high order (more than two) terms are ignored in the regression. The equation can be expanded as a second order multivariable polynomial (Equation (4)) with 15 unknown coefficients.
M = β 0 , 0 , 0 , 0 + β 1 , 0 , 0 , 0 R * + β 0 , 1 , 0 , 0 t * + β 0 , 0 , 1 , 0 FVC + β 0 , 0 , 0 , 1 A * + β 2 , 0 , 0 , 0 R * ( 2 ) + β 0 , 2 , 0 , 0 t * ( 2 ) + β 0 , 0 , 2 , 0 FVC ( 2 ) + β 0 , 0 , 0 , 2 A * ( 2 ) + β 1 , 1 , 0 , 0 R * t * + β 1 , 0 , 1 , 0 R * FVC + β 1 , 0 , 0 , 1 R * A * + β 0 , 1 , 1 , 0 t * FVC + β 0 , 1 , 0 , 1 t * A * + β 0 , 0 , 1 , 1 FVC A *
Under clear sky condition, the temperature mid-morning rising process can be approximated to a linear process during the period from about 8 a.m. to about 11 a.m. in local time (Figure 2). Therefore, the rising rate (R) was calculated from the linear regression between mid-morning temperatures and their observation times. Its unit is K/h. The normalized value (R*) is defined as:
R * = R R min R max R min
where Rmax and Rmin are the maximum and minimum rising rate at the same day respectively.
Under clear sky condition, the diurnal evolution of LST can be described as a harmonic variation (cosine function) and an exponential attenuation function for the daytime and night-time respectively [43]. Therefore, the maximum temperature time (t) can be easily derived through the cosine function fitting using the daytime temperatures from one hour after sunrise to one hour before sunset (Figure 2). Maximum and minimum temperature times are used to get the normalized maximum temperature time (t*):
t * = t t min t max t min
In the disaggregation, a second order polynomial fitting is performed to calculate the coefficients (βi,j,k,l) which are applied to fine resolution satellite data to derive the fine resolution soil moisture data. Because the regression is conducted for each day, the coefficients are specific of the day and the scene observed by satellite.

4. Results and Analysis

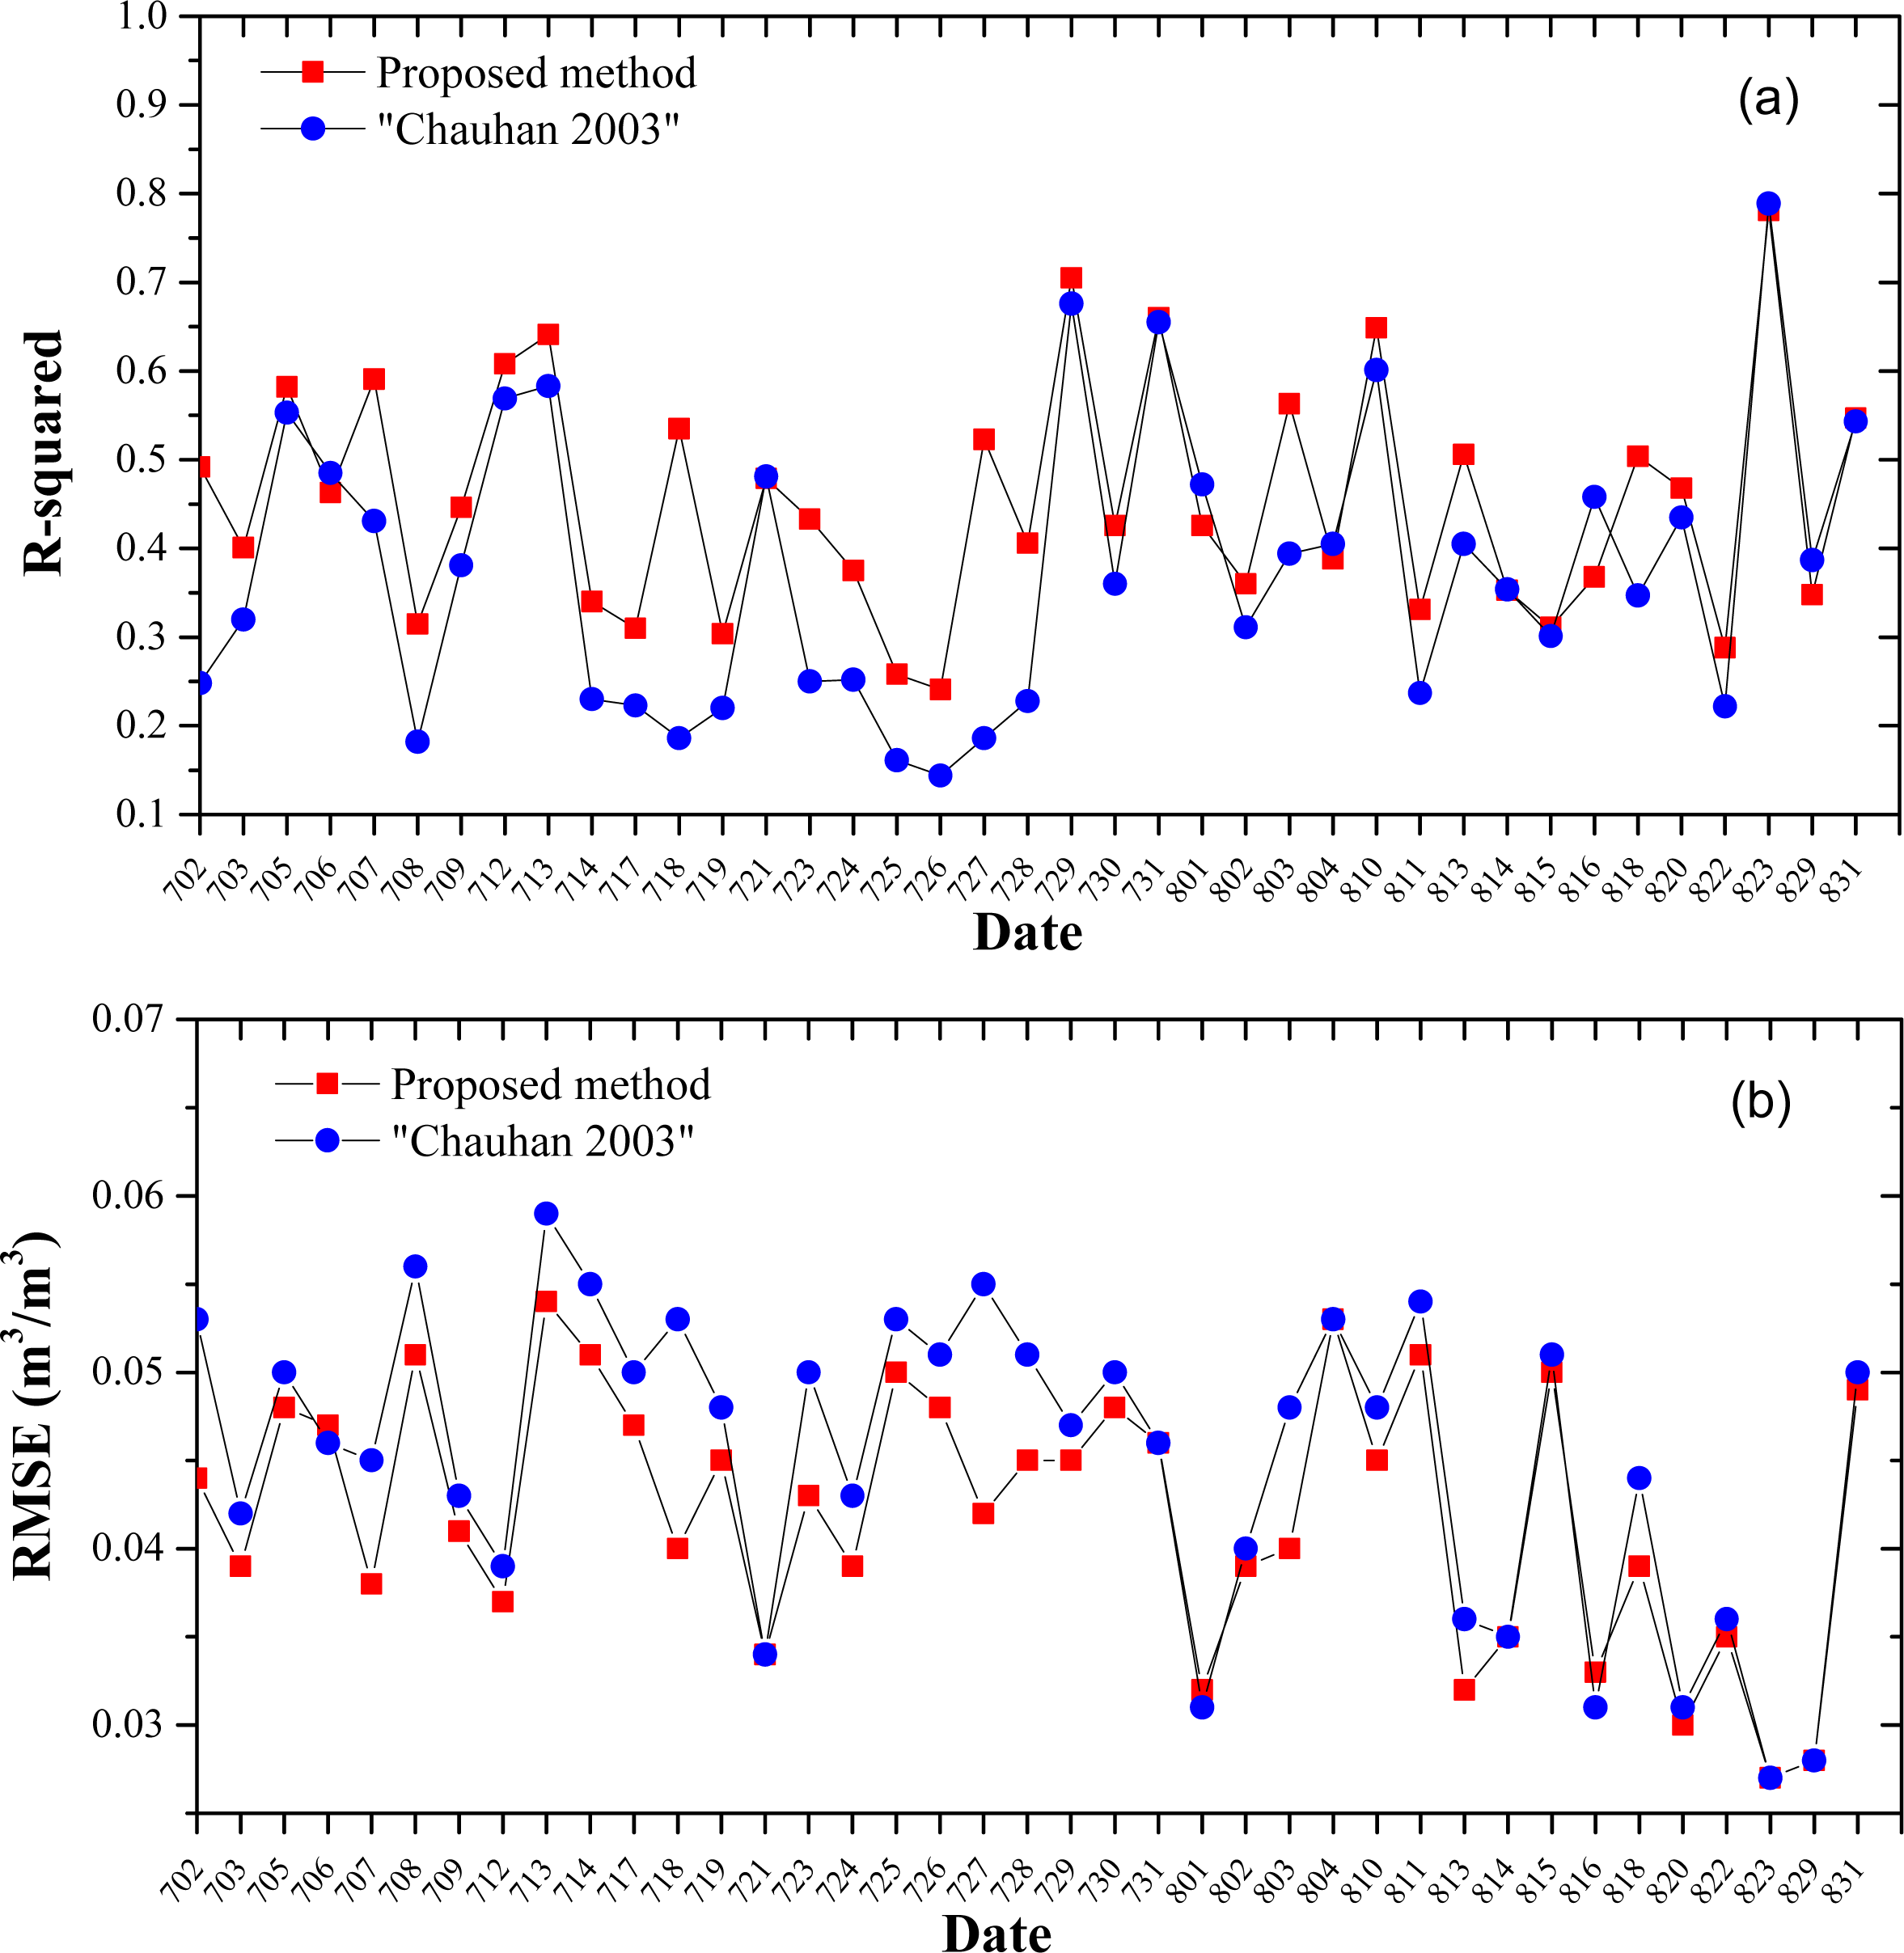
4.1. Algorithms Comparison
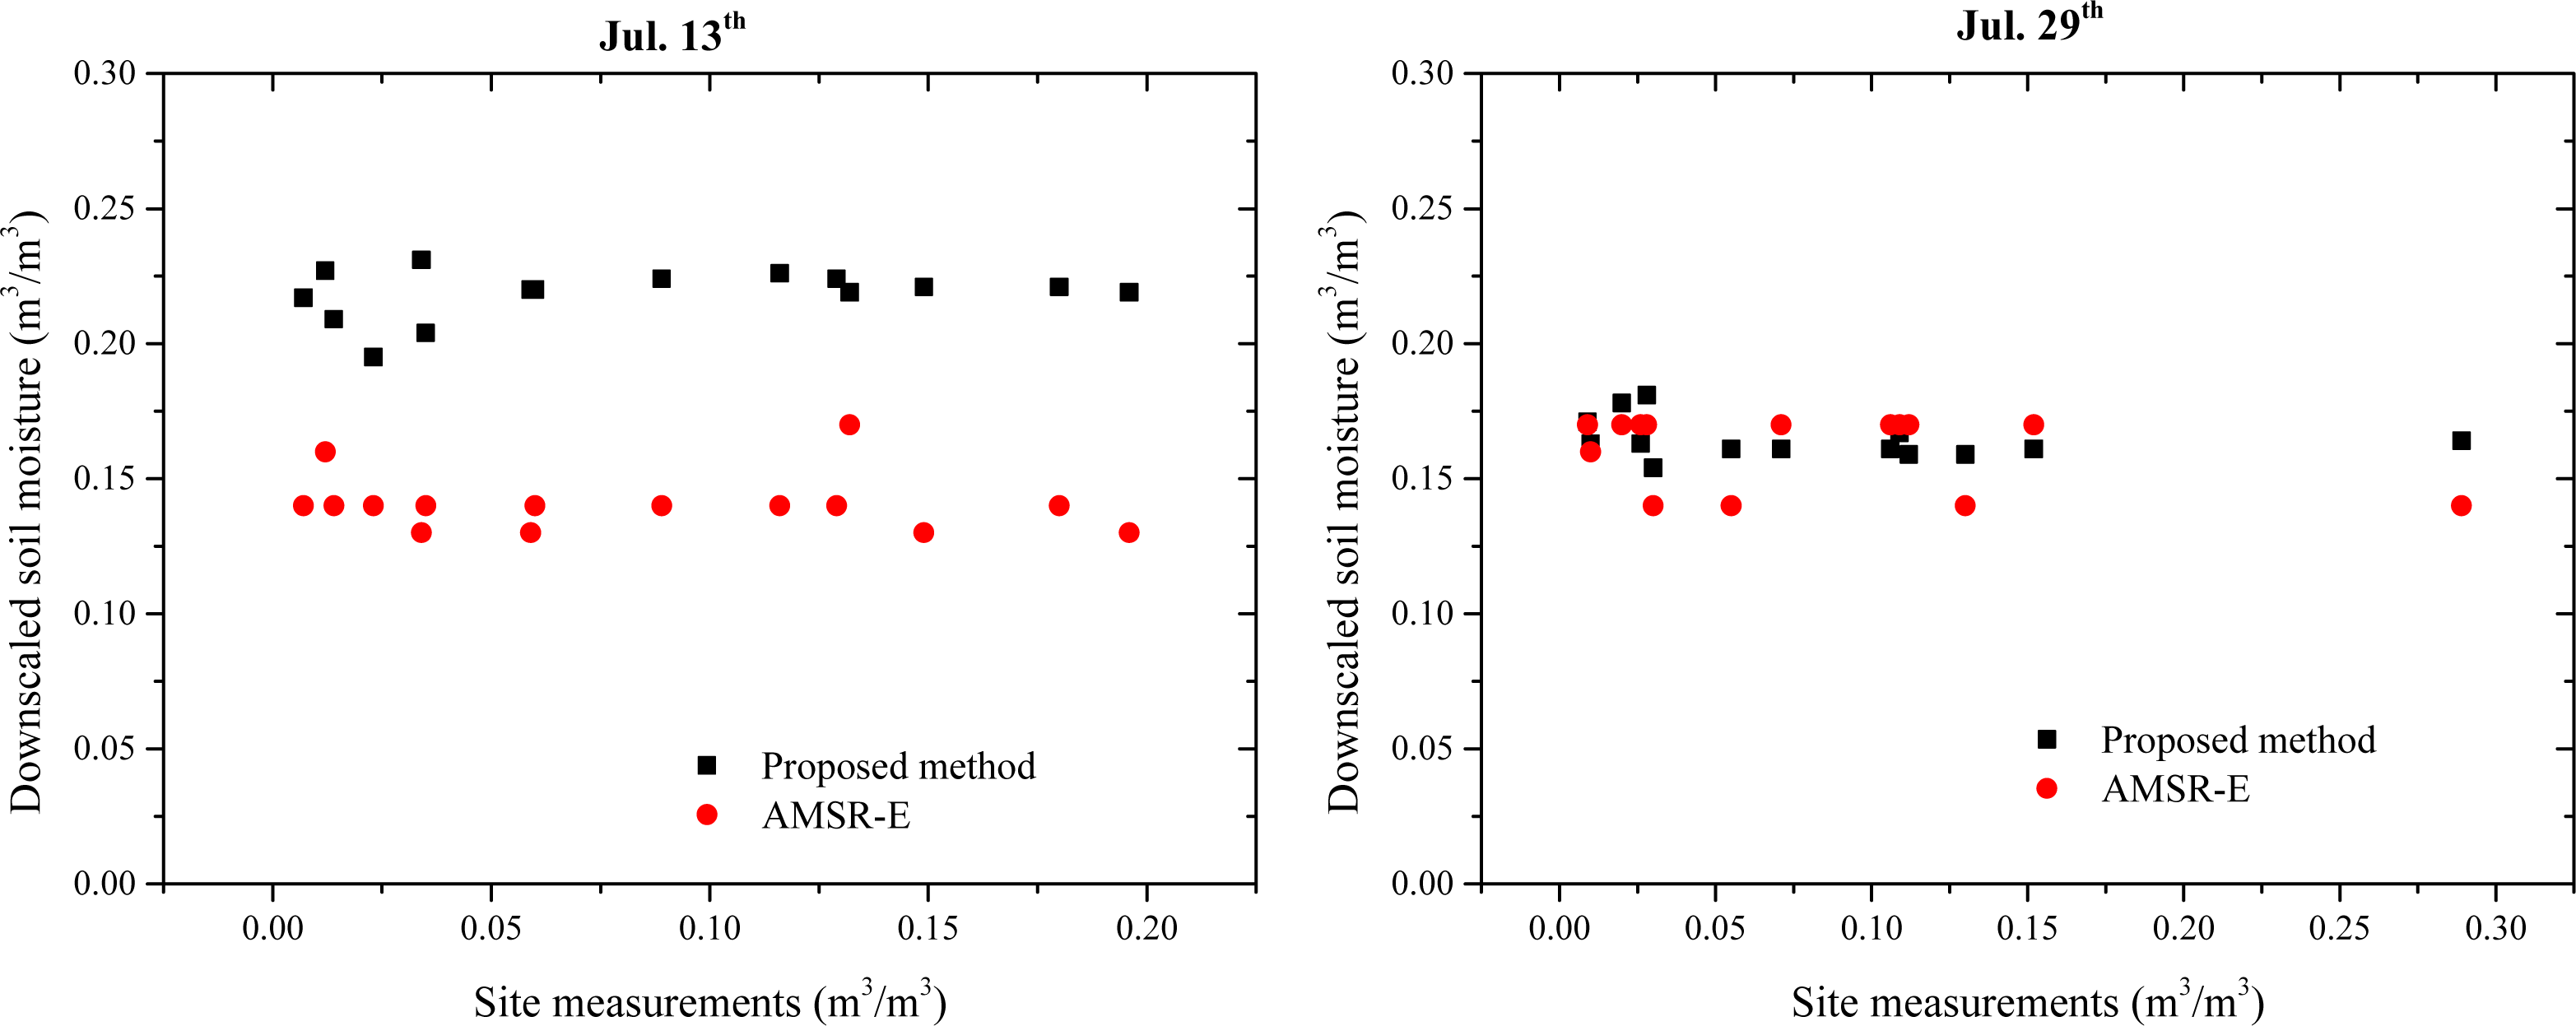
The proposed downscaling algorithm and the “Chauhan 2003” method were applied to the AMSR-E soil moisture product and MSG SEVIRI data over the whole Iberian Peninsula for the period of July and August 2007 respectively. For MSG-SEVIRI data, cloud free daytime were firstly identified by controlling the number of cloud cover times no more than 10 in daytime. Based on the latitude and longitude of both dataset, the corresponding relationships between pixels in MSG-SEVIRI data and pixels in AMSR-E soil moisture data are constructed. Then, the MSG-SEVIRI images (LST, FVC and albedo) were aggregated into the same size of AMSR-E soil moisture data according to the corresponding relationship. The average method was used in the aggregation process. Meanwhile, the aggregation should obey the rule that for a given AMSR-E pixel, its corresponding MSG-SEVIRI pixels should be all cloud free land pixels. The pixel contaminated by cloud was excluded from the downscaling process. Therefore, due to the influences of cloud cover and the scan gap of AMSR-E sensor, the number of the integrated pixels might be different for each day.
As shown in Equations (2) and (3), the unknowns for these two methods are 10 and 15 respectively. To get robust regression results, the number of the integrated pixels should well exceed the unknown number. Consequently, the two methods were used to the days with more than 100 integrated pixels.
After the MSG-SEVIRI images aggregated into AMSR-E scale, the aggregated time series of LSTs were then used to fit the temperature temporal change parameters (R and t), which were useful in the downscaling model construction. Polynomial fitting was performed for the parameters in Equations (2) and (3) against the AMSR-E soil moisture data. Figure 3 shows the regression results of days with enough cloud free pixels using Equations (2) and (3). The R-squared and root mean square error (RMSE) of the predicted soil moisture versus AMSR-E soil moisture are listed in this figure.
As shown in Figure 3, the regression statistics (R-squared and RMSE) vary greatly in different days for both methods. The time series comparison between R-squared and RMSE for two methods obviously suggests the better performance of the proposed method than the “Chauhan 2003” method. The R-squared of these days have a large increase for the proposed method especially for some days like 18 July, 27 July, 3 August and 18 August. Their R-squareds change from 0.186 to 0.535, 0.186 to 0.523, 0.394 to 0.563, and 0.347 to 0.504 respectively. In addition, most of the R-squareds of the proposed method are above 0.4, and the average improvement of R-squared in these days is 0.08. The mean R-squared of the proposed method is 0.454 for these two months. These results indicate that the proposed method is capable to explain a higher proportion of the variance in soil moisture than the “Chauhan 2003” method. There is an obvious decrease for the RMSEs on comparing the results of the proposed method with those of the “Chauhan 2003” method, and most of the RMSEs of the proposed method are below 0.05 m3/m3, with a mean value of 0.042 m3/m3.
The regression coefficients βi,j,k,l of the proposed method were determined by the regression analysis, and they were then applied to the MSG-SEVIRI data. Soil moisture was derived by combining with the parameters R, t, FVC and A for all these days. Figure 4 shows an example of the AMSR-E soil moisture data and the downscaled soil moisture on 5 July with the spatial resolution of 5 km. The regression result was derived for this day with R-squared of 0.582 and RMSE of 0.048 m3/m3 respectively. Figure 4 illustrates that the estimated fine resolution soil moisture data (Figure 4b) have similar spatial pattern and quantitative values with the coarse resolution microwave soil moisture data (Figure 4a). The histograms of both coarse and fine resolution data in Figure 5 confirm the dependable performance of the downscaling method. Distributions of the soil moisture data are very similar, and the mean value of AMSR-E soil moisture data (0.274 m3/m3) is close to that of the downscaled soil moisture (0.271 m3/m3). Obviously, from the spatial resolution difference, the fine resolution soil moisture data have much more detail information about soil moisture distribution over the study area than the coarse soil moisture data, which is helpful for the analysis of land surface energy exchange and hydrological process. However, the value ranges of both data reveal some uncertainty for the downscaled soil moisture data. The minimum value is bigger than that of microwave soil moisture data, and it can be reflected from the color map shown in Figure 4. The extremely dry area in the middle of the study area is not captured in the fine resolution data. It is attributed to the reason that the soil moisture values of most pixels in the study area are with a relatively high value (more than 0.15 m3/m3), and the low value pixels show small influences on the polynomial fitting results, which results the overestimation of low value pixels in the downscaling result.

4.2. Validation

Due to the high spatial heterogeneity of soil moisture over land surface, it is difficult to validate the remotely sensed soil moisture especially for the microwave soil moisture product and mid-resolution soil moisture data. Because they usually represent the effective value at a big footprint, while the field observation only gets soil moisture measurements at point scale. Average values from field observations usually assume linearity for each of them, while many land processes are not at all linear. For soil moisture spatial distribution, it is highly affected by land surface conditions such as soil type, vegetation cover, terrain, human activity and many others. Therefore, there is a big difference between their spatial representiveness. This issue has been widely discussed by researchers [3446]. It is suggested that ground-based validation should be regarded as a close approximation but not an absolute value.
Before the validation of the downscaled fine resolution soil moisture data, the accuracy of the AMSR-E soil moisture product should be examined. The previous study conducted by Wagner et al. [32] discussed the performance of the AMSR-E LPRM product. Although there was relatively small interval for the in situ measurements when compared with AMSR-E products, good agreement was found between the normalized values of the LPRM derived soil moisture and the averaged in situ soil moisture for the whole network. The correlation coefficient and the RMSE of relative error were 0.83% and 14.6% respectively for the data of the period 1 January to 1 May 2004.
Similar to the study of Wagner et al. [32], the averaged AMSR-E soil moisture data of the network was compared with the averaged in situ soil moisture measurements for the period of July and August 2007 at the AMSR-E overpass time. The absolute value comparison is shown in Figure 6. The remotely sensed soil moisture is systematically larger than the in situ observation with a bias of 0.076 m3/m3. The R-squared is 0.571 and RMSE is 0.078 m3/m3, and the correlation coefficient is close to that of [32]. Although the RMSE is relatively large (0.078 m3/m3) for the linear fit, the close relationship can be easily observed with the R-squared of 0.571. This indicates that the AMSR-E soil moisture product can effectively monitor the trend of surface soil moisture, and it approves the conclusion drawn by Wagner et al. [32].
Based on the understanding of the correlation between AMSR-E soil moisture product and the in situ measurements, site specific validation was conducted between the downscaled fine resolution soil moisture from the proposed method and the “Chauhan 2003” method with site measurements. 19 sites were available during this period, and their locations in the downscaled soil moisture data with the image size of 350 by 200 are shown in Figure 7. Almost each site has one specific pixel in the downscaled soil moisture data. Only site K10 and O07 share the same pixel, and the average value of these two sites was used to represent the pixel measurement.
Figure 8 shows the statistics of the site by site validation. The R-squareds of both methods keep to low values, and the RMSEs are of relatively higher values comparing with the measurements. From the methods comparison, it is found that the proposed method shows better performance than the “Chauhan 2003” method. For some sites, the R-squareds of the proposed method are obviously higher than those of the “Chauhan 2003” method. The RMSE is also a little smaller for the proposed method than that of the original one.
The site by site comparison certificates the improvement of the proposed method on the original one. However, because of the low R-squared (from 0 to 0.226) and the high RMSE (from 0.044 m3/m3 to 0.191m3/m3), there is still a poor correlation between the downscaled soil moisture by the proposed method and the in situ measurements. Additional validation should be focused on the downscaled soil moisture using the proposed method.
Except the temporal trend validation at each site, spatial correlation analysis was also conducted on a daily basis. The downscaled soil moisture data using the proposed method at each site were compared with the site measurement at the same day. Four typical days (13 July, 27 July, 31 July, and 10 August) with relatively high R-squared in Equation (3) regression were selected. The AMSR-E soil moisture data was also included in the comparison with the assumption that the soil moisture distribution in each pixel is uniform. Figure 9 presents the validation results for these four days. In the comparison, sites covered by cloud are excluded. It is found that similar variation trend can be observed for the downscaled soil moisture data and AMSR-E soil moisture data, and the downscaled soil moisture data is systematically higher than the latter one especially on 13 July and 31 July. The similar trend also reflects the high correlation between the downscaled soil moisture and the AMSR-E soil moisture in these days. However, the scatter plots illustrate that there is almost no correlation for these two datasets with site measurements. The downscaled soil moisture data by the proposed method are almost flat and exhibit very small spatial variation in the REMEDHUS network as the AMSR-E soil moisture product.
The above validation work shows that the downscaled soil moisture data is poorly correlated with in situ soil moisture measurements at site specific and daily specific scale, and the reason is mainly attributed to the differences between the spatial representiveness of the two dataset. The spatial resolution of MSG-SEVIRI data in the study area is 5 km. This region is a flat area with common land use type and the site located pixels have FVC values with small differences as illustrated in Figure 7. Therefore, those pixels should have similar soil moisture condition. This conclusion should be more powerful because there is no obvious rainfall event in most days of July and August 2007 until 26 August. The event can be observed in the time series of soil moisture measurements of 19 sites presented in Figure 10. From this figure, it is found that the soil moisture measurements of these sites exhibit great variation. In the same day, the field observations vary from close to 0.0 m3/m3 to more than 0.2 m3/m3. It is not realistic for this area of violent soil moisture variation if the point measurement is capable to represent soil moisture condition of the MSG-SEVIRI pixel. Consequently, a single measurement in one MSG-SEVIRI pixel in this region cannot fully represent the real soil moisture of the whole pixel. The big difference between the spatial representiveness of the downscaled soil moisture and the in situ measurements confirms that the validation work for the downscaled soil moisture cannot be done straight-forward. That is why the previous researches [3234] validate the microwave soil moisture estimation using the averaged value of entire network. Furthermore, the penetration depth of microwave signal also considerably influences the estimated soil moisture, which might induce the inconsistency between the remotely sensed soil moisture and in situ measurement.
To further evaluate the downscaled soil moisture data and overcome the low spatial representiveness of one measurement in one MSG-SEVIRI pixel, comparison was conducted by two directions at two larger spatial scale: (1) Aggregate the downscaled soil moisture to 3 × 3 MSG-SEVIRI pixels scale and compare the averaged values; (2) Compare the averaged downscaled soil moisture and the averaged in situ observations of the entire network.
In the first direction, it is found that some sites assemble in an area about 3 × 3 MSG-SEVIRI pixel size (15 km scale) in Figure 7. Therefore, three bigger pixels (P1, P2, and P3) are formed as shown in Figure 6 with white boxes. Four sites are included in each box. The downscaled soil moisture values in each box were aggregated to get the soil moisture value of each box. Meanwhile, the AMSR-E soil moisture product was also used to get the soil moisture of the boxes by assuming that soil moisture is uniform within the AMSR-E pixel at the MSG-pixel scale. The two different values were then compared with the averaged soil moisture measurements in the same box, and the cloud cover pixels were excluded in the comparison. In addition, to partly remove the influence of the model uncertainty, the days with the R-squared of the regression using Equation (3) above 0.4 were only taken into account in the comparison. Figure 11 shows the scatter plots of the averaged soil moisture for the three boxes. It is clear that the averaged downscaled soil moisture data shows better correlation relationship with the average site measurements than the comparison at site specific scale. The downscaled soil moisture is more systematically overestimated than the AMSR-E soil moisture data when compared with in situ measurements. The downscaled soil moisture aggregated at 15 km scale keep to relatively high values with the range from 0.12 m3/m3 to 0.25 m3/m3. For P1 and P2, positive correlation can be observed for downscaled soil moisture and AMSR-E soil moisture data with in situ measurements. However, the R-squareds of the downscaled soil moisture data are lower than those of the AMSR-E product. For P3, the R-squared is close to 0 due to the impact of two obvious outliers: one outlier comes from the overestimation for aggregated downscaled soil moisture at dry surface condition on 18 August according to the positive correlation line, and another is from the underestimation for aggregated downscaled soil moisture after the rainfall event on 31 August. When the two outliers are excluded from the analysis, the R-squared is improved to the same level (0.4) as P1 and P2.
In addition to the comparison at 15 km scale, validation work was also conducted to compare the averaged downscaled soil moisture and the averaged in situ observations of the entire network. Due to the influences of cloud cover, the number of the averaged values of downscaled soil moisture is smaller than that of the microwave soil moisture. Figure 12 presents the comparison result. The scatter plot shows that the downscaled soil moisture can also represent the soil moisture deficiency, but it has weaker correlation with the averaged in situ measurements than microwave soil moisture like previous comparison at 15 km scale. It overestimates the soil moisture with a bias of 0.108 m3/m3, and the RMSE is 0.109 m3/m3. The overestimation is coincident with the comparison result of AMSR-E soil moisture data versus the in situ measurements but has bigger value. The scatter plot is also more disperse with smaller R-squared of 0.218 than that in Figure 6. Meanwhile, there is still one outlier who is due to the underestimation compared with the regression trend for the averaged downscaled soil moisture on 31 August, and the exclusion of the outlier will improve the R-squared to 0.272.
In general, the averaged downscaled soil moisture at these two larger scales shows similar relationship with averaged in situ soil moisture as AMSR-E soil moisture data. Compared with the site by site validation, the averaged value comparisons show better correlation. Because the averaged in situ measurements include four or tens of land surface soil moisture measurements at 15 km scale or network scale respectively and these sites are with different land surface condition in the flat terrain area, they have better spatial representiveness of the soil moisture condition at the corresponding scale than the single point measurement in one MSG pixel.
However, from above comparison at 15 km and network scale, it is evident that the R-squareds of the downscaled soil moisture are smaller than the results of AMSR-E soil moisture data versus in situ measurements. The AMSR-E soil moisture data show better ability to monitor the temporal variation of land surface soil moisture condition, although the downscaled soil moisture has better correlation results than the comparison at the site specific scale. Obviously, several unavoidable limitations cause the disagreement between the downscaled soil moisture and in situ measurements at large scale. It is mainly attributed to two factors: one comes from the uncertainty of microwave soil moisture which exists in both downscaled soil moisture data and AMSR-E soil moisture data, and another is the uncertainty of the downscaling method. Note that there are errors in the polynomial fitting process, and these errors are propagated to the downscaled soil moisture data. Their effect can be shown from the relatively small R-squared in the validation results in Figures 11 and 12.

4.3. Error Analysis

Overall, the algorithms comparison and validation indicate the better performance of the proposed method to downscale soil moisture than the “Chauhan” method. However, except the estimation error in LST and FVC for MSG-SEVIRI data, several error sources should be pointed out.
The first error source is the algorithm of AMSR-E LPRM product. The downscaling method is based on the AMSR-E soil moisture data. The uncertainty in AMSR-E LPRM algorithm also will influence the accuracy of the downscaled soil moisture data. Meanwhile, although many studies have approved its better ability to capture surface soil moisture variation than other models, there are still some abnormal values existing in the product with the soil moisture value close to 0 (0.01 or 0.02) m3/m3 or close 100% m3/m3. These abnormal values would partly influence the fitting results between the product and the variables in Equation (3), and distort the downscaled soil moisture.
The second error source is the difference between detection depths of thermal infrared temperature and microwave brightness temperature. The sensing depth of AMSR-E brightness temperature is 1–2 cm, whereas that of the MODIS thermal infrared band is 1 mm. As indicated by [20,21], the thermal regimes of 1–2 cm and of 0–1 mm (skin) are quite different. The thermal infrared skin temperature is significantly affected by the ambient environment. The usage of skin temperature in the algorithm could then lead to misrepresentation of spatial and temporal variability of the underlying soil temperature with a certain depth.
The third error source is the atmospheric forcing differences. The study area is the Iberian Peninsula, and it is the second-largest peninsula in Europe, with an area of approximately 582,000 km2. The terrain differences and latitude change forms the different atmospheric environment in this region. The proposed method is based on the triangle method, and the atmospheric forcing condition is assumed to be uniform in the study area. To derive the fine resolution soil moisture data of this peninsula, the impact of atmospheric forcing differences were not considered in present study. Although the good fitting result partly explained the minor influence of the atmospheric forcing differences to the downscaling result, it is still an unignored error source.
The model uncertainty is also an error source. In the validation results, the downscaled soil moisture shows poorer correlation against in situ measurements at 15 km and network scale than the AMSR-E product. The model uncertainty propagates it into the downscaled soil moisture and influences the final comparison results.
Finally, the measurement uncertainty may be the other error source. For some sites, there are some soil moisture measurements with quite small and abnormal values (below 0.01 m3/m3), and these would influence the evaluation of the downscaled soil moisture to some extent.

5. Conclusions

A method based on the second order multivariable polynomial fitting method [18] was presented in this study to downscale microwave soil moisture data. Considering the close relationship between the temperature temporal variation and surface soil moisture, two parameters (mid-morning temperature rising rate and daily temperature maximum time) were introduced in the proposed method. The proposed method and the traditional method were applied to AMSR-E LPRM soil moisture product and MSG-SEVIRI. Fine resolution soil moisture was derived for the Iberian Peninsula area in July and August 2007. The polynomial fitting results indicate that the proposed method has better performance than the traditional one. The R-squared has an average improvement of 0.08 and the RMSE had an obvious decrease, and most of the RMSEs are lower than 0.05m3/m3, which meet the application requirement.
The downscaled soil moisture by the proposed method was validated by in situ observations collected by REMEDHUS network at different scales. Due to the low spatial representiveness of site measurement at MSG-SEVIRI scale, the site specific validation shows poor correlation results. However, it has better performance than the “Chauhan 2003” method. Although additional comparisons at 15 km and network scale find the averaged downscaled soil moisture is positive correlated with in situ measurements with a good improvement on the R-squared than that of site specific comparison, the R-squareds of the downscaled soil moisture data are systematically smaller than the comparison results of AMSR-E soil moisture product. The R-squareds are degraded from 0.7–0.8 and 0.571 for AMSR-E data to 0–0.4 and 0.218 for the downscaled soil moisture at 15 km and network scale respectively.
In general, a new soil moisture downscaling method has been proposed by utilizing the temporal information imbedded in the high frequency land surface observations from geostationary satellite to improve the spatial resolution of microwave soil moisture product. According to the validation results in spatial and temporal correlation, further work is still needed to improve both representiveness and reduce the uncertainty in the downscaling.

Acknowledgments

The authors would like to thank the anonymous reviewers for their useful comments and suggestions. This research was jointly supported by the “Hundred Talents” Project, the Key Research Program (KZZD-EW-08-01), International Cooperation Partner Program of Innovative Team (Grant No. KZZD-EW-TZ-06) of Chinese Academy of Sciences, National natural science foundation project (41271433) and 2013 Youth foundation of IMHE.

Conflicts of Interest

The authors declare no conflict of interest.

References

  1. Western, A.W.; Zhou, S.L.; Grayson, R.B.; McMahon, T.A.; Bloschl, G.; Wilson, D.J. Spatial correlation of soil moisture in small catchments and its relationship to dominant spatial hydrological processes. J. Hydrol 2004, 286, 113–134. [Google Scholar]
  2. Narasimhan, B.; Srinivasan, R. Development and evaluation of Soil Moisture Deficit Index (SMDI) and Evapotranspiration Deficit Index (ETDI) for agricultural drought monitoring. Agric. For. Meteorol 2005, 133, 69–88. [Google Scholar]
  3. Li, Z.-L.; Tang, R.; Wan, Z.; Bi, Y.; Zhou, C.; Tang, B.; Yan, G.; Zhang, X. A review of current methodologies for regional evapotranspiration estimation from remotely sensed data. Sensors 2009, 9, 3801–3853. [Google Scholar]
  4. Aubert, D.; Loumagne, C.; Oudin, L. Sequential assimilation of soil moisture and streamflow data in a conceptual rainfall-runoff model. J. Hydrol 2003, 280, 145–161. [Google Scholar]
  5. Mallick, K.; Bhattacharya, B.K.; Patel, N.K. Estimating volumetric surface moisture content for cropped soils using a soil wetness index based on surface temperature and NDVI. Agric. For. Meteorol 2009, 149, 1327–1342. [Google Scholar]
  6. Tang, R.; Li, Z.-L.; Tang, B. An application of the Ts–VI triangle method with enhanced edges determination for evapotranspiration estimation from MODIS data in arid and semi-arid regions: Implementation and validation. Remote Sens. Environ 2010, 114, 540–551. [Google Scholar]
  7. Ray, R.L.; Jacobs, J.M.; Cosh, M.H. Landslide susceptibility mapping using downscaled AMSR-E soil moisture: A case study from Cleveland Corral, California, US. Remote Sens. Environ 2010, 114, 2624–2636. [Google Scholar]
  8. Price, J.C. The potential of remotely sensed thermal infrared data to infer surface soil moisture and evaporation. Water Resour. Res 1980, 16, 787–795. [Google Scholar]
  9. Shi, J.C.; Wang, J.; Hsu, A.Y.; Oneill, P.E.; Engman, E.T. Estimation of bare surface soil moisture and surface roughness parameter using L-band SAR image data. IEEE Trans. Geosci. Remote Sens 1997, 35, 1254–1266. [Google Scholar]
  10. Patel, N.R.; Anapashsha, R.; Kumar, S.; Saha, S.K.; Dadhwal, V.K. Assessing potential of MODIS derived temperature/vegetation condition index (TVDI) to infer soil moisture status. Int. J. Remote Sens 2008, 30, 23–39. [Google Scholar]
  11. Zhao, W.; Li, Z.-L.; Wu, H.; Tang, B.-H.; Zhang, X.; Song, X.; Zhou, G. Determination of bare surface soil moisture from combined temporal evolution of land surface temperature and net surface shortwave radiation. Hydrol. Process 2013, 27, 2825–2833. [Google Scholar]
  12. Pardé, M.; Zribi, M.; Wigneron, J.-P.; Dechambre, M.; Fanise, P.; Kerr, Y.; Crapeau, M.; Saleh, K.; Calvet, J.-C.; Albergel, C.; Mialon, A.; Novello, N. Soil moisture estimations based on airborne CAROLS L-band microwave data. Remote Sens 2011, 3, 2591–2604. [Google Scholar]
  13. Naeimi, V.; Leinenkugel, P.; Sabel, D.; Wagner, W.; Apel, H.; Kuenzer, C. Evaluation of soil moisture retrieval from the ERS and Metop Scatterometers in the lower Mekong basin. Remote Sens 2013, 5, 1603–1623. [Google Scholar]
  14. Entekhabi, D.; Njoku, E.G.; O’Neill, P.E.; Kellogg, K.H.; Crow, W.T.; Edelstein, W.N.; Entin, J.K.; Goodman, S.D.; Jackson, T.J.; Johnson, J.; et al. The Soil Moisture Active Passive (SMAP) Mission. Proc. IEEE 2010, 98, 704–716. [Google Scholar]
  15. Seo, D.; Lakhankar, T.; Khanbilvardi, R. Sensitivity analysis of b-factor in microwave emission model for soil moisture retrieval: A case study for SMAP mission. Remote Sens 2010, 2, 1273–1286. [Google Scholar]
  16. Entekhabi, D.; Asrar, G.R.; Betts, A.K.; Beven, K.J.; Bras, R.L.; Duffy, C.J.; Dunne, T.; Koster, R.D.; Lettenmaier, D.P.; McLaughlin, D.B.; et al. An agenda for land surface hydrology research and a call for the second international hydrological decade. Bull. Am. Meteorol. Soc 1999, 80, 2043–2058. [Google Scholar]
  17. Crow, W.T.; Wood, E.F. The value of coarse-scale soil moisture observations for regional surface energy balance modeling. J. Hydrometeorol 2002, 3, 467–482. [Google Scholar]
  18. Chauhan, N.S.; Miller, S.; Ardanuy, P. Spaceborne soil moisture estimation at high resolution: A microwave-optical/IR synergistic approach. Int. J. Remote Sens 2003, 24, 4599–4622. [Google Scholar]
  19. Merlin, O.; Chehbouni, A.G.; Kerr, Y.H.; Njoku, E.G.; Entekhabi, D. A combined modeling and multipectral/multiresolution remote sensing approach for disaggregation of surface soil moisture: Application to SMOS configuration. IEEE Trans. Geosci. Remote Sens 2005, 43, 2036–2050. [Google Scholar]
  20. Piles, M.; Camps, A.; Vall-Llossera, M.; Corbella, I.; Panciera, R.; Ruediger, C.; Kerr, Y.H.; Walker, J. Downscaling SMOS-derived soil moisture using MODIS visible/infrared data. IEEE Trans. Geosci. Remote Sens 2011, 49, 3156–3166. [Google Scholar]
  21. Choi, M.; Hur, Y. A microwave-optical/infrared disaggregation for improving spatial representation of soil moisture using AMSR-E and MODIS products. Remote Sens. Environ 2012, 124, 259–269. [Google Scholar]
  22. Kim, J.; Hogue, T.S. Improving spatial soil moisture representation through integration of AMSR-E and MODIS products. IEEE Trans. Geosci. Remote Sens 2012, 50, 446–460. [Google Scholar]
  23. Gillies, R.R.; Carlson, T.N. Thermal remote sensing of surface soil water content with partial vegetation cover for incorporation into climate models. J. Appl. Meteorol 1995, 34, 745–756. [Google Scholar]
  24. Hossain, A.K.M.A.; Easson, G. Evaluating the Potential of VI-LST Triangle Model for Quantitative Estimation of Soil Moisture using Optical Imagery. Proceedings of IEEE International Geoscience and Remote Sensing Symposium, IGARSS 2008, Boston, MA, USA, 8–11 July 2008; pp. 879–882.
  25. Merlin, O.; Walker, J.P.; Chehbouni, A.; Kerr, Y. Towards deterministic downscaling of SMOS soil moisture using MODIS derived soil evaporative efficiency. Remote Sens. Environ 2008, 112, 3935–3946. [Google Scholar] [Green Version]
  26. Merlin, O.; Al Bitar, A.; Walker, J.P.; Kerr, Y. An improved algorithm for disaggregating microwave-derived soil moisture based on red, near-infrared and thermal-infrared data. Remote Sens. Environ 2010, 114, 2305–2316. [Google Scholar] [Green Version]
  27. Jiang, L.; Islam, S. An intercomparison of regional latent heat flux estimation using remote sensing data. Int. J. Remote Sens 2003, 24, 2221–2236. [Google Scholar]
  28. Merlin, O.; Escorihuela, M.J.; Mayoral, M.A.; Hagolle, O.; Al Bitar, A.; Kerr, Y. Self-calibrated evaporation-based disaggregation of SMOS soil moisture: An evaluation study at 3km and 100m resolution in Catalunya, Spain. Remote Sens. Environ 2013, 130, 25–38. [Google Scholar] [Green Version]
  29. Wetzel, P.J.; Atlas, D.; Woodward, R.H. Determining soil moisture from geosynchronous satellite infrared data: A feasibility study. J. Appl. Meteorol 1984, 23, 375–391. [Google Scholar]
  30. Zhao, W.; Li, Z.-L. Sensitivity study of soil moisture on the temporal evolution of surface temperature over bare surfaces. Int. J. Remote Sens 2013, 34, 3314–3331. [Google Scholar]
  31. Ceballos, A.; Scipal, K.; Wagner, W.; Martinez-Fernandez, J. Validation of ERS scatterometer-derived soil moisture data in the central part of the Duero Basin, Spain. Hydrol. Process 2005, 19, 1549–1566. [Google Scholar]
  32. Wagner, W.; Naeimi, V.; Scipal, K.; Jeu, R.; Martínez-Fernández, J. Soil moisture from operational meteorological satellites. Hydrogeol. J 2007, 15, 121–131. [Google Scholar]
  33. Wagner, W.; Pathe, C.; Doubkova, M.; Sabel, D.; Bartsch, A.; Hasenauer, S.; Bloschl, G.; Scipal, K.; Martinez-Fernandez, J.; Loew, A. Temporal stability of soil moisture and radar backscatter observed by the advanced Synthetic Aperture Radar (ASAR). Sensors 2008, 8, 1174–1197. [Google Scholar]
  34. Sanchez, N.; Martinez-Fernandez, J.; Scaini, A.; Perez-Gutierrez, C. Validation of the SMOS L2 Soil Moisture Data in the REMEDHUS Network (Spain). IEEE Trans. Geosci. Remote Sens 2012, 50, 1602–1611. [Google Scholar]
  35. Piles, M.; Camps, A.; Vall-llossera, M.; Sanchez, N.; Martinez-Fernandez, J.; Monerris, A.; Baroncini-Turricchia, G.; Perez-Gutierrez, C.; Aguasca, A.; Acevo, R.; et al. Soil Moisture Downscaling Activities at the REMEDHUS Cal/Val Site and its Application to SMOS. Proceedings of 2010 11th Specialist Meeting on Microwave Radiometry and Remote Sensing of the Environment (MicroRad), Washington, DC, USA, 1–4 March 2010; pp. 17–21.
  36. Njoku, E.G.; Chan, S.K. Vegetation and surface roughness effects on AMSR-E land observations. Remote Sens. Environ 2006, 100, 190–199. [Google Scholar]
  37. Owe, M.; de Jeu, R.; Walker, J. A methodology for surface soil moisture and vegetation optical depth retrieval using the microwave polarization difference index. IEEE Trans. Geosci. Remote Sens 2001, 39, 1643–1654. [Google Scholar]
  38. Koike, T.; Nakamura, Y.; Kaihotsu, I.; Davva, G.; Matsuura, N.; Tamagawa, K.; Fujii, H. Development of an advanced microwave scanning radiometer (AMSR-E) algorithm of soil moisture and vegetation water conten. Annu. J. Hydraulic Eng. JSCE 2004, 48, 215–229. [Google Scholar]
  39. Owe, M.; de Jeu, R.; Holmes, T. Multisensor historical climatology of satellite-derived global land surface moisture. J. Geophys. Res 2008, 113, F01002. [Google Scholar]
  40. Draper, C.S.; Walker, J.P.; Steinle, P.J.; de Jeu, R.A.M.; Holmes, T.R.H. An evaluation of AMSR–E derived soil moisture over Australia. Remote Sens. Environ 2009, 113, 703–710. [Google Scholar]
  41. Brocca, L.; Hasenauer, S.; Lacava, T.; Melone, F.; Moramarco, T.; Wagner, W.; Dorigo, W.; Matgen, P.; Martínez-Fernández, J.; Llorens, P.; et al. Soil moisture estimation through ASCAT and AMSR-E sensors: An intercomparison and validation study across Europe. Remote Sens. Environ 2011, 115, 3390–3408. [Google Scholar]
  42. Stisen, S.; Sandholt, I.; Nørgaard, A.; Fensholt, R.; Jensen, K.H. Combining the triangle method with thermal inertia to estimate regional evapotranspiration—Applied to MSG-SEVIRI data in the Senegal River basin. Remote Sens. Environ 2008, 112, 1242–1255. [Google Scholar]
  43. Jiang, G.-M.; Li, Z.-L.; Nerry, F. Land surface emissivity retrieval from combined mid-infrared and thermal infrared data of MSG-SEVIRI. Remote Sens. Environ 2006, 105, 326–340. [Google Scholar]
  44. Jackson, T.J.; Cosh, M.H.; Bindlish, R.; Starks, P.J.; Bosch, D.D.; Seyfried, M.; Goodrich, D.C.; Moran, M.S.; Du, J. Validation of Advanced Microwave Scanning Radiometer Soil Moisture Products. IEEE Trans. Geosci. Remote Sens 2010, 48, 4256–4272. [Google Scholar]
  45. Chaurasia, S.; Tung, D.T.; Thapliyal, P.K.; Joshi, P.C. Assessment of the AMSR-E soil moisture product over India. Int. J. Remote Sens 2011, 32, 7955–7970. [Google Scholar]
  46. Su, C.-H.; Ryu, D.; Young, R.I.; Western, A.W.; Wagner, W. Inter-comparison of microwave satellite soil moisture retrievals over the Murrumbidgee Basin, southeast Australia. Remote Sens. Environ 2013, 134, 1–11. [Google Scholar]
Figure 1. Study area shown in Advanced Microwave Scanning Radiometer on the Earth Observing System (AMSR-E) Land Parameter Retrieval Model (LPRM) soil moisture product spatial resolution grid (0.25 degree) and the location of REMEDHUS sites.
Remotesensing 05 06790f1
Figure 2. Sketch map of the locations of mid-morning temperature rising rate and maximum temperature time in land surface temperature (LST) diurnal cycle.
Remotesensing 05 06790f2
Figure 3. R-squared (a) and root mean square error (RMSE) (b) of the modeled soil moisture using the proposed method and “Chauhan 2003” method versus AMSR-E low resolution soil moisture. X-axis presents the month and the day.
Remotesensing 05 06790f3
Figure 4. AMSR-E LPRM soil moisture data (a) and downscaled soil moisture with Meteosat Second Generation (MSG)-Spinning Enhanced Visible and Infrared Imager (SEVIRI) data (b) on 5 July 2007.
Remotesensing 05 06790f4
Figure 5. Histogram of AMSR-E LPRM soil moisture data (a) and downscaled soil moisture with MSG-SEVIRI data (b) on 5 July 2007.
Remotesensing 05 06790f5
Figure 6. AMSR-E soil moisture data over the REMEDHUS region versus in situ soil moisture measurements in July and August 2007.
Remotesensing 05 06790f6
Figure 7. Spatial distribution of REMEDHUS sites in MSG-SEVIRI fraction of vegetation cover (FVC) data in 5 July 2007.
Remotesensing 05 06790f7
Figure 8. Site by site validation results for the downscaled soil moisture using the proposed method and the “Chauhan 2003” method against site measurements: (a) R-squared and (b) RMSE.
Remotesensing 05 06790f8
Figure 9. Daily validation results for the downscaled soil moisture from the proposed method and AMSR-E soil moisture product with site measurements.
Remotesensing 05 06790f9aRemotesensing 05 06790f9b
Figure 10. Time series of soil moisture measurements from 19 sites in the REMEDHUS region in July and August 2007.
Remotesensing 05 06790f10
Figure 11. Comparison for the averaged downscaled soil moisture from the proposed method and AMSR-E product with in situ measurements for P1 (a), P2 (b), and P3 (c) at 15 km spatial resolution scale.
Remotesensing 05 06790f11
Figure 12. Downscaled soil moisture data over the REMEDHUS region versus in situ soil moisture measurements in July and August 2007.
Remotesensing 05 06790f12

