Article

Trends in Spring Phenology of Western European Deciduous Forests

Laboratory of Geo-Information Science and Remote Sensing, Wageningen University, Droevendaalsesteg 3, PB 6708 Wageningen, The Netherlands
*
Author to whom correspondence should be addressed.
Remote Sens. 2013, 5(12), 6159-6179; https://doi.org/10.3390/rs5126159
Submission received: 3 October 2013 / Revised: 12 November 2013 / Accepted: 13 November 2013 / Published: 25 November 2013

Abstract

:
Plant phenology is changing because of recent global warming, and this change may precipitate changes in animal distribution (e.g., pests), alter the synchronization between species, and have feedback effects on the climate system through the alteration of biogeochemical and physical processes of vegetated land surface. Here, ground observations (leaf unfolding/first leaf separation of six deciduous tree species) and satellite-derived start-of-growing season (SOS) are used to assess how the timing of leafing/SOS in Western European deciduous forest responded to climate variability between 2001 and 2011 and evaluate the reliability of satellite SOS estimates in tracking the response of forest leafing to climate variability in this area. Satellite SOS estimates are derived from the Normalized Difference Vegetation Index (NDVI) time series of the Moderate Resolution Imaging Spectroradiometer (MODIS). Temporal trends in the SOS are quantified using linear regression, expressing SOS as a function of time. We demonstrated that the growing season was starting earlier between 2001 and 2011 for the majority of temperate deciduous forests in Western Europe, possibly influenced by regional spring warming effects experienced during the same period. A significant shift of up to 3 weeks to early leafing was found in both ground observations and satellite SOS estimates. We also show that the magnitude and trajectory of shifts in satellite SOS estimates are well comparable to that of in situ observations, hence highlighting the importance of satellite imagery in monitoring leaf phenology under a changing climate.

1. Introduction

Global warming is triggering changes in plant phenology [17] and it is feared that these changes may precipitate devastating changes in animal distribution (e.g., pests), alter the synchronization between species, and have feedback effects on the climate system through the alteration of biogeochemical and physical processes of vegetated land surface [8,9]. However, despite these conceivable but alarming consequences, we do not know where in space and time most intense phenological changes are happening. This is largely because in situ observations on plant phenology are lacking in many parts of the globe, and existing phenological observation networks, for example the Pan European Phenological Network (PEPN) [10] and United States of America National Phenology Network (USA-NPN) [11] only cover a handful of global terrestrial ecosystems. In a global context, these existing phenological observations only give a limited picture of how plant phenology is responding to global warming. Furthermore, ground observations on plant phenology from existing networks, i.e., USA-NPN, and PEPN are generally point-based observations covering only few selected individuals of some plant species. This data collection set-up makes extrapolation of phenological changes observed at individual or species level to the ecosystem level a more challenging exercise. Hence it becomes extremely difficult to use these observations to spatially and temporally quantify the feedback effects of the observed phenological shifts on biogeochemical and physical processes.
In response to the challenges associated with in situ phenological observations, methods have been developed to extract phenological metrics, i.e., start-of-season (SOS), from the time series of satellite vegetation indices [1214]. Although phenological information derived from satellite data, commonly referred to as land surface phenology (LSP) [15,16], is not identical to plant phenology, it is generally considered to be closely related [1720]. Phenological metrics, i.e., SOS derived from time series of satellite vegetation indices are therefore used as proxy measures of plant phenology. In this paper we used the term phenology to refer to LSP.
Phenological metrics derived from satellite data allow one to analyse for phenological shifts in a more temporally and spatially explicit way for example [19,2125], and present the phenological changes at ecosystem/landscape level, hence addressing spatial limitation associated with in situ observations from phenological networks. It is for this reason satellite data are seen as an important and reliable information source that can help us to better understand how plant phenology is responding to global warming on a large scale [8]. However, we should, however, be careful when interpreting changes in plant phenology detected from satellite data because phenological metrics from satellite data can be highly inaccurate and temporally inconsistent with ground observations [19]. Amongst others, the accuracy of phenological metrics derived from satellite data in relation to in situ observations is highly depended on the method used to extract the metrics [19] and the heterogeneity of the landscape [26]. In some parts of USA, temporal trends (negative and positive) were only found in the satellite derived SOS ensemble metrics from two methods (HANTS and Midpointpixel) that produced relatively more accurate SOS metrics, but no trend was found in the ground observations [19]. Of recent, temporal trends were detected over China in the satellite SOS estimates [27,28], but no results were reported in regard to ground observations. However, a study focusing on leaf unfolding dates of broadleaf deciduous forest in Northern China found significant spatial and temporal correlations between ground observations and satellite SOS estimates [29], but temporal trend analysis on SOS was not done. Based only on satellite SOS estimates, significant shifts in SOS of one to several months have been reported around the Andes Mountains in South America [30]. In Africa, significant trends in vegetation phenology have been documented in the Soudan region, though these trends were not validated with ground observations [31]. Based on satellite data, SOS were found to have advanced in Europe [32], but the results were not landcover type-specific. A global analysis of vegetation phenology shows that satellite-based phenological estimates provide realistic estimates of the several phenological events (e.g., SOS) [33], however in a global context the validation of satellite-based phenological estimates was based only on spatially limited network of phenological stations, and temporal phenological shifts were also not quantified. Lack of ground observations to validate the phenological changes detected from satellite-derived metrics will continue to cast uncertainty on the phenological changes detected from satellite data, and the use of multimethods to retrieve phenological metrics [19,28] is not likely to remove this uncertainty. Without in situ observations, it remains difficult to show that the phenological changes detected from satellite data are real changes, especially when it is not known if the method (e.g., Midpointpixel) being employed to extract phenological metrics is capable of producing metrics with phenological changes commensurate with that in in situ observations (e.g. leaf unfolding and first-leaves separation).
As a way forward, we propose that one should first look at how phenological changes in satellite SOS estimates agree with the changes in the in situ observations at locations where in situ observations are available before applying the analysis to areas where no in situ observations exist. In this way, we can assess whether or not the method being employed to extract satellite SOS estimates is capable of producing metrics with phenological changes commensurate with that in in situ observations. This approach can increase our confidence in the phenological changes detected from satellite SOS estimates, though the classical point vs. pixel comparison problem remains eminent [19].
Clearly, in situ point observations and satellite SOS estimates are conceptually different measures of plant phenology. Leaf unfolding and first-leaves separation, which we used here, are phenological stages during when plants are opening/separating their leaves as part of leaf development stage, and as such they might not be spectrally detectable from space. Satellite SOS estimates, in our context, are approximations of time (in days) when NDVI has reached 50% of its maximum during the growing season. Data noise and smoothing can influence the maximum NDVI value at a particular pixel, and subsequently influence the SOS estimate. Under-story vegetation might start greening earlier than the trees, and this greening can be spectrally detectable, thus potentially influencing the SOS estimates. Furthermore we cannot claim that one or few phenological point observations falling within a pixel are somewhat representative of the phenology in a pixel. The focus should not be on establishing if in situ point observations and satellite SOS estimates are measuring a similar phenological event because these are two different measures. Instead, the focus should be to find out if the temporal trends of in situ point observations and satellite SOS estimates are similar. In this way, the analysis would not suffer from differences rooted in the conceptual meanings, measurement approaches and spatial scale of measurements between in situ point observations and satellite SOS estimates. However, in principle, satellite SOS estimates provide spatially and species-averaged information on the start of leafing [3]. Therefore, we can still refer to satellite SOS estimates and leaf unfolding/first-leaves separation observations as measures of SOS/leafing, but in the context of their respective meanings.
In this work, we investigated how the timing of leafing in western European deciduous forest responded to temperature variation between 2001 and 2011, and evaluated the reliability of satellite SOS estimates by comparing the temporal trends in satellite SOS estimates to that observed in in situ observations. We started by analysing temporal trends in the in situ observations of leaf unfolding/first-leaves separation of individual deciduous tree species, and satellite SOS estimates at pixels where point in situ observations on leaf unfolding/first leaves separation of individual deciduous tree species were available. We then applied the trend analysis on the satellite SOS estimates for the entire study area. Finally, we analysed for trends in air temperature to determine if the temperature dynamics between 2001 and 2011 support the results obtained from trend analysis in satellite SOS estimates and in situ observations. Satellite SOS estimates were extracted from the Normalized Difference Vegetation Index (NDVI) time series of the Moderate Resolution Imaging Spectroradiometer (MODIS) using Midpointpixel method. Our overall goal was to assess how temperature variability is influencing the SOS in Western European deciduous forests, and to evaluate how well we can monitor this influence with MODIS images. By comparing trends in satellite SOS estimates to that in ground observations first at locations where in situ observations are available before applying the analysis method over the entire study area constitutes the novelty of our work. We focused on the deciduous forest because of its well-defined seasonality in leaf phenology which would serve well as a sort of barometer for change in climate. Leafing and SOS terms are used interchangeably in this paper to refer to ground observations and satellite SOS estimates.

2. Materials and Methods

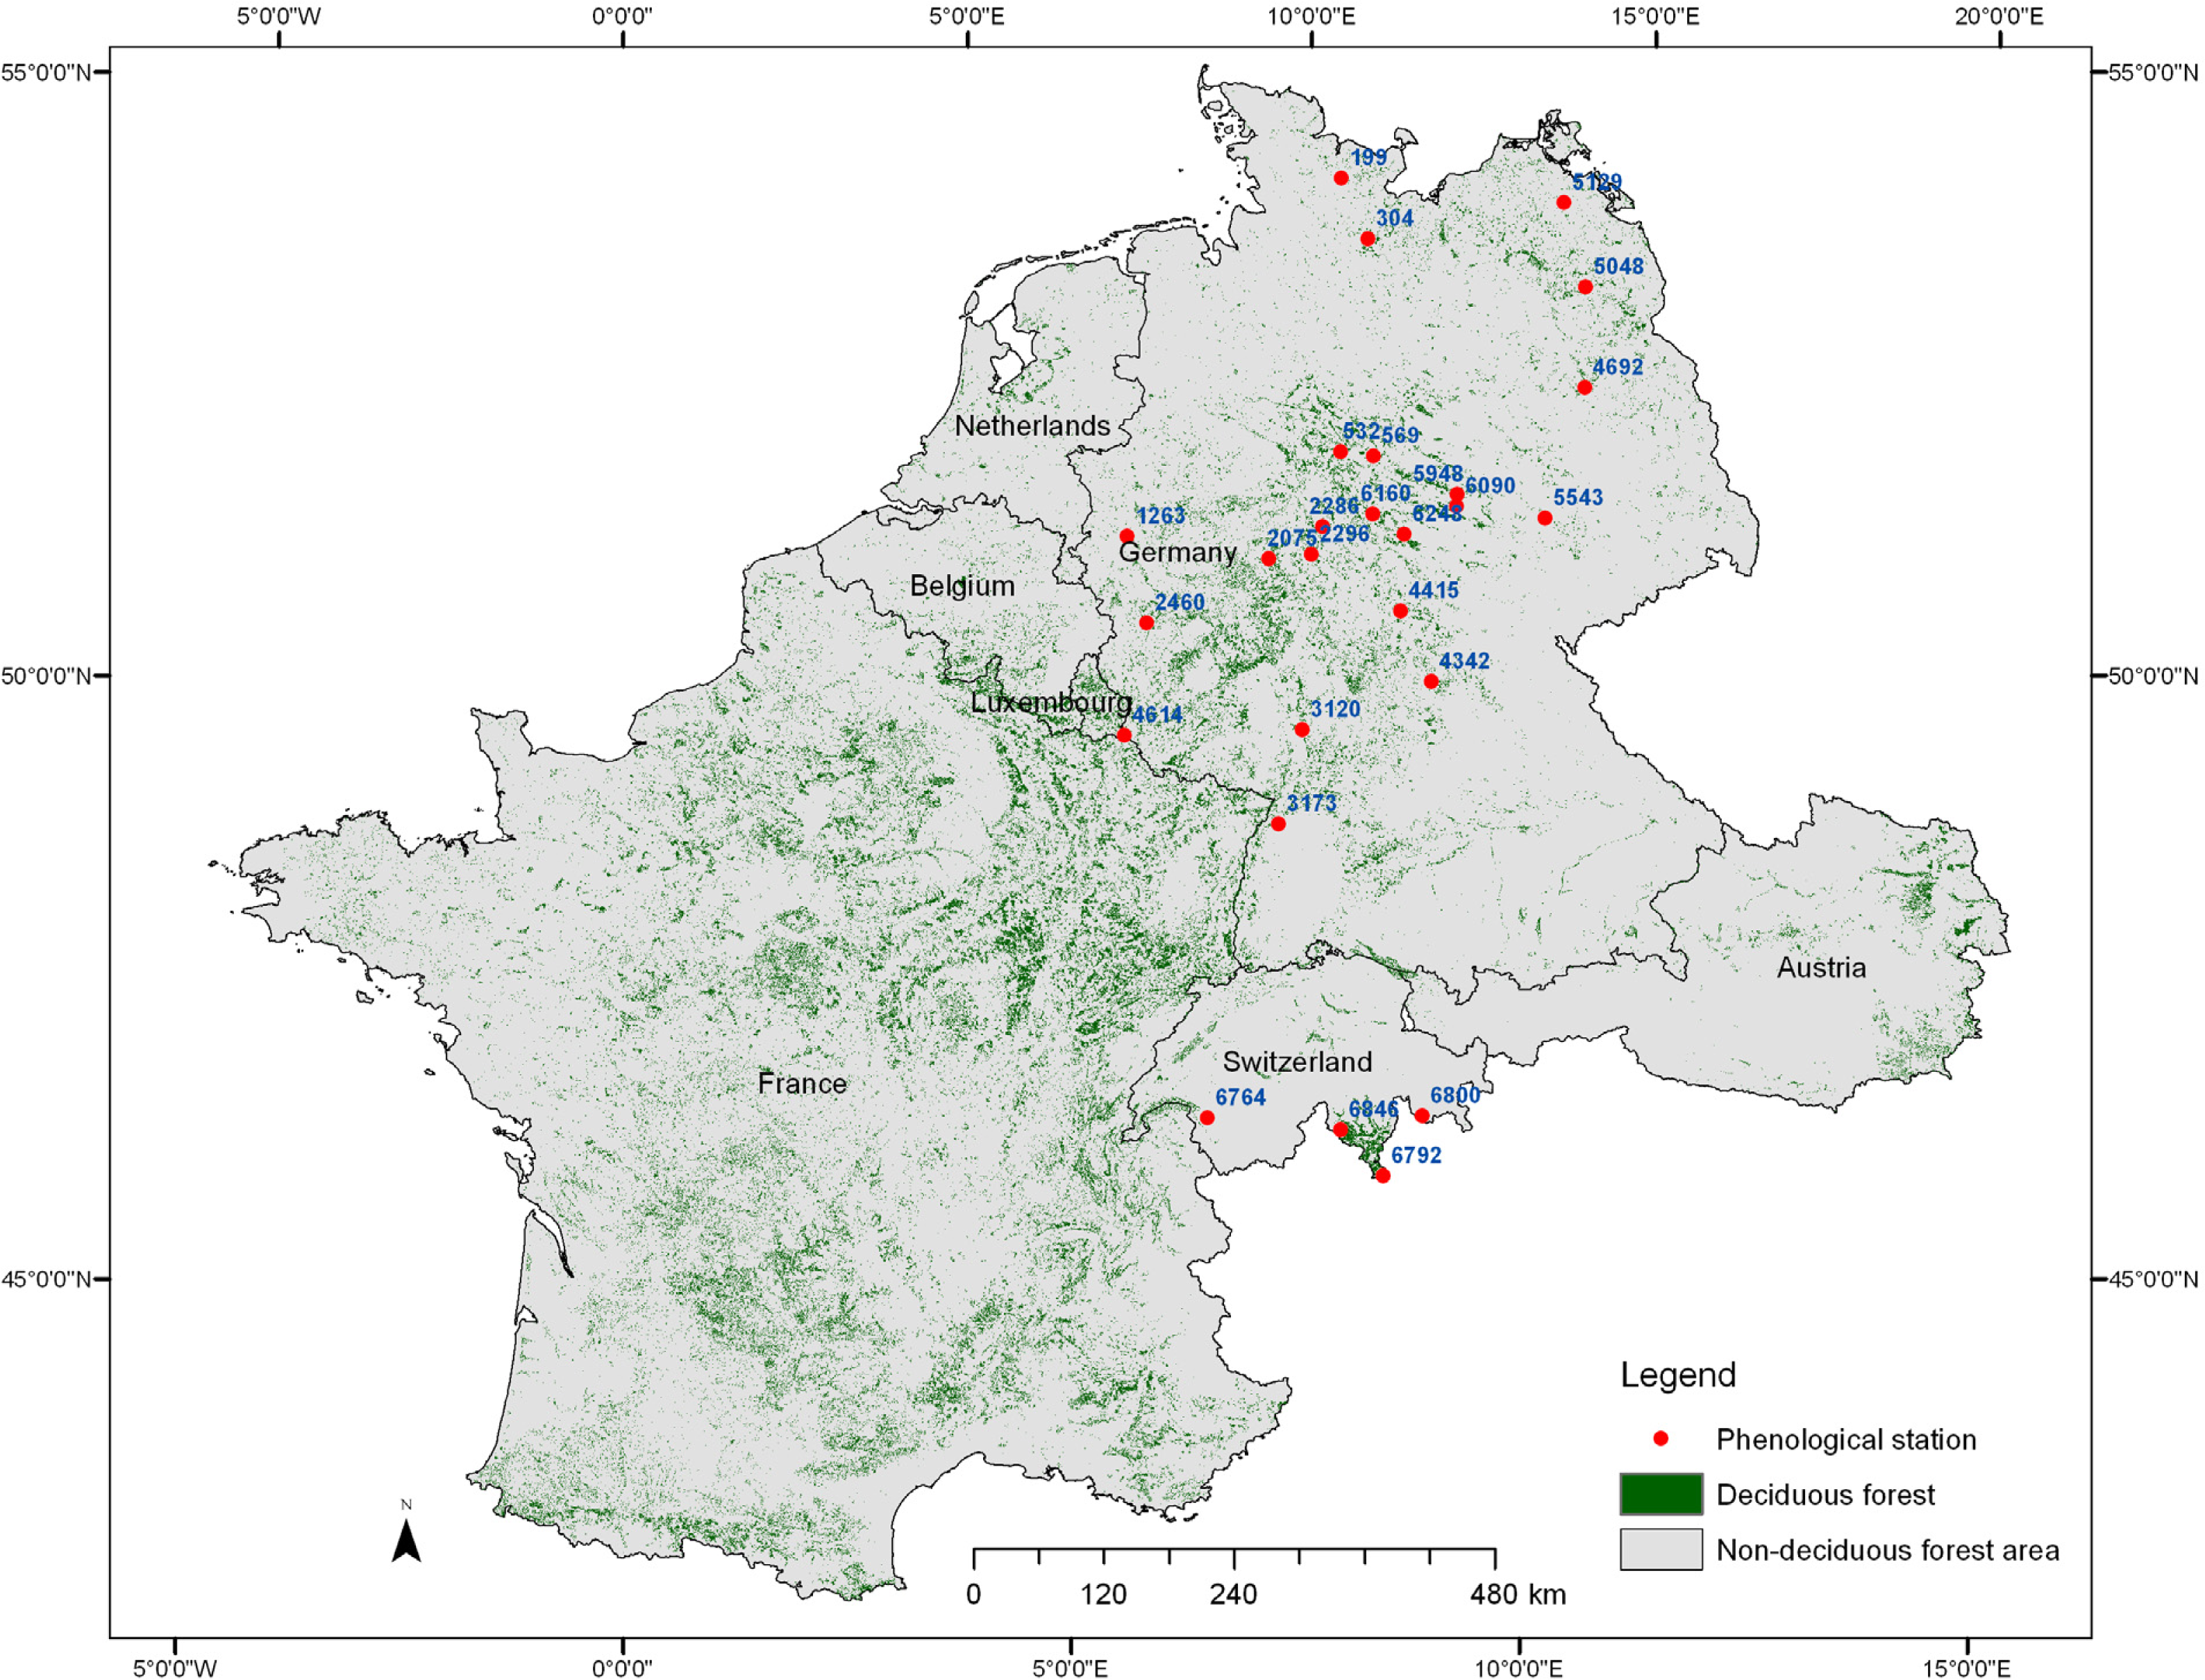
2.1. Study Area and Data

We assessed for temporal trends in the SOS of deciduous forests of Western Europe (55°N and 5°W and 42°N and 17°E) during the period of 2001 through 2011 to better understand how climate variability influenced the timing of forest’s leafing. The climate in the study area is largely temperate with the growing season (greening) starting mainly around April. Air temperature is one of the key factors controlling the timing of when the vegetation starts leafing in this area [13]. We selected the deciduous forest because of its well-defined seasonality in leaf phenology which would serve well as a sort of bio-indicator for change in climate. Figure 1 shows the distribution of deciduous forest in Western Europe. We chose Western Europe as our study area for two reasons. First, it is in the northern hemisphere where climatic warming was reportedly the highest between 1995 and 2006 [34]. Second, ground observations on phenological events are available and easily accessible, hence enabling for validation of satellite derived metrics.
Deciduous forests were identified from CORINE landcover map of 2006. This land cover map with spatial resolution of 250 m × 250 m was sourced from The European Topic Centre on Land Use and Spatial Information [35].
We used in situ observations sourced from the Pan European Phenological Database [36] and satellite SOS estimates derived from MODIS NDVI to assess for trends in the timing of deciduous forest leafing in Western Europe. In situ point observations on leaf unfolding/first leaves separation of six individual deciduous tree species (Alnus glutinosa, Betula pendula, Fagus sylvatica, Fraxinus excelsior, Larix decidua and Quercus robur) were used as measures of SOS and their trends were subsequently used to validate trends in the satellite SOS estimates. We focused on these species for two reasons. First, they were among the 20 dominant tree species in Europe [37]. Second, some of their phenological events particularly the leaf unfolding /first leaves separation were regularly recorded during the period of interest (2001–2011). Leaf unfolding was frequently recorded for all species except for Larix decidua. The frequently recorded phenological event for Larix decidua was the first leaves separation. Frequently recorded phenological events covering our study period were only available for Germany and Switzerland, thus limiting the validation only to deciduous forests in these countries. Figure 1 shows the location of 26 phenological stations where phenological events for deciduous tree species used in this study were recorded. Not all species were recorded at each of these stations. Out of 26 stations, phenological events for Betula pendula were recorded at 23 of them; Alnus glutinosa at 15, Fagus sylvatica at 20, Larix decidua at 25, Quercus robur at 17 and Fraxinus excelsior was recorded at 18 stations. The maximum number of species recorded per station was six.
We also assessed for trends in air temperature to better understand and interpret the dynamics in the leafing of the deciduous forest. We used a gridded (0.25° × 0.25°) daily mean temperature dataset [38] sourced from the database of European Climate Assessment & Dataset Project [39] for this purpose.

2.2. Estimating SOS from Satellite Data

Satellite sensors, i.e., MODIS are designed to continuously record spectral radiances reflected by earth surface into space. When corrected for atmospheric influence, we can calculate spectral indices from these recorded spectral radiances which can then be used as reliable indicators of earth surface condition over time. Normalised Difference Vegetation Index (NDVI), calculated from red and near infrared (NIR) spectral radiances as (NIR − RED)/(NIR + RED) [40], is one of such indices. The value of NDVI ranges between −1 and 1 by design and is known to correlate positively and strongly with vegetation productivity [41]. As such, NDVI can be used as a good proxy measure of the start and the end of vegetation growing season. In this study, we extracted the SOS metrics from MODIS NDVI 16-day composite (MOD13Q1) dataset covering the period of 2001 through 2011. This dataset is distributed with a spatial resolution of about 231.65 m × 231.65 m. MOD13Q1 contains NDVI and pixel reliability layers. We used NDVI data points with reliability of 0 and 1 in our analysis, and applied the respective quality flags to mask out data points of poor quality. However, the NDVI time series remained noisy, characterized by negative outliers which possibly are a result of factors such as cloud contamination, atmospheric scatter and snow effect but were not captured by data quality flags. As a remedial approach, we removed the negative NDVI outliers. The outliers were removed using Equation (1). Each outlier (xt) was replaced with the average value of its two immediate temporal neighbours −(xt+1) and (xt−1) if the differences between xt and xt−1, and xt and xt+1 are less than −1% of xt−1 and xt+1, respectively (Equation (1)). The −1% ensures that the chance of removing outliers which may be related to real fluctuations in the vegetation activity is minimized.
x t = x t 1 + x t + 1 2 { if x t x t 1 < 0.01 x t 1 & x t x t + 1 < 0.01 x t + 1 }
Although outliers are removed, generally the NDVI time series remains noisy which is not ideal for estimation of SOS. We applied Savitzky-Golay filter to smoothen the NDVI time series of each pixel. Savitzky-Golay filter is commonly used to smooth the NDVI time series in order to reduce noise in the data (e.g., [42,43]).The smoothed NDVI time series (with 16-days interval) was then interpolated to daily values using the cubic spline method. The next step was to normalise the NDVI data points for each year, at each pixel separately based on Equation (2) [12,19]:
NDVI ratio = ( NDVI NDVI min ) / ( NDVI max NDVI min )
where NDVI is the NDVI value for each day in the time series of each pixel; NDVImax is the maximum NDVI value for such pixel during the growing season, and the NDVImin is the minimum NDVI value for such pixel, found between the beginning of growing season and the NDVImax. The NDVIratio values range between 0 and 1. Next we estimated SOS from MODIS NDVI time series for each year using Midpointpixel method [12,19].The SOS is the day of the year (DOY) between the first date in the time series and the date of the maximum NDVI in which the NDVIratio value first exceeds 0.5 [12,19]. Based on the comparison of several SOS methods over North America, Midpointpixel method was found to produce SOS metrics more consistent with in situ observations than other methods [19]. The code used to extract the SOS metrics from MODIS NDVI is implemented in open-source software environment is freely available on request from the authors.

2.3. Correlation Analysis

Correlation analysis is a good measure of statistical relationships between random variables. In temperate regions, phenological events, especially the timing of leafing, are largely controlled by spring temperature [5,8] thus statistical relationships between temperature and the timing of leafing is expected. Here we use spearman correlation, a non-parametric measure of statistical dependence [44], to quantify statistical relationships between spring (March–May) temperature and the timing of leaf unfolding/first leaves separation of six individual deciduous tree species and satellite SOS estimates. Spearman correlation has been used in plant phenology studies to determine relationships between ground observations and satellite SOS estimates [19].We correlated pixel-based values of temperature with point-based in situ observations of leaf unfolding/first leaves separation across phenological stations and MODIS-pixel based SOS estimates. Because spring warming is known to lead to early leafing in temperate vegetation [2,3], a negative correlation between temperature and ground observations of leaf unfolding/first leaves separation and satellite SOS estimates is expected if there has been an increase in spring temperature. We also calculated the correlation between ground observations of leaf unfolding/first leaves separation and satellite SOS estimates. The correlation analysis between in situ observations of leaf unfolding/first leaves separation and satellite SOS estimates would give an indication of how accurate the satellite SOS estimates are. A positive correlation between ground observations of leaf unfolding/first leaves separation and satellite SOS estimates would therefore be expected if there is a good correspondence between these two phenological measures. However, we should be careful when using correlation as a measure of the accuracy for the satellite SOS estimates in relation to ground observations especially when we are correlating point-based observations with pixel-based estimates because the classical point vs. pixel comparison problem remains eminent [19]. For pixels where a point measurement is highly unrepresentative of the entire pixel, the correlation between point measurements and pixel-based estimates is likely to be minimal or even opposite of what would be expected. In our correlation analyses, we tested the significance of the correlation at 5% threshold.

2.4. Trends Analysis

Temporal shifts in the timing of phenological events can be estimated by means of trend analysis (e.g., [19]). Here we use simple linear model to assess for temporal shift in the timing of leaf unfolding/first leaves separation of six individual deciduous tree species, and satellite SOS estimates. We regressed the timing (in Julian days) of leaf unfolding/first leaves separation or satellite SOS estimates on time. We used the linear trend to determine if deciduous forests in Western Europe shifted the timing of leafing during the period of 2001 through 2011. A negative trend would be indicative of a shift to early leafing, and vice-versa. We evaluated the reliability of satellite SOS estimates by comparing the temporal trends in satellite SOS estimates to that observed in ground observations. We carried out this evaluation by comparing the trend at the pixel level to that of corresponding point observations. At stations where more than one species were recorded, we analysed for a trend in the leafing of each species because we do not know the proportion of each of the species at the pixel corresponding to such station. In this way, we can determine if the trend in the leafing of all species recorded at such station agrees with the trend in satellite SOS estimates. Next, the trend analysis was applied to satellite SOS estimates covering the entire study area. We determined the magnitude of trend during the study period by multiplying the slope coefficient of the fitted model by the length of the time series. Because the shift to early leafing has been linked largely to climatic warming, especially in temperate regions [1,3], we assessed trends in air temperature also using simple linear model to better understand temperature dynamics during the study period. The mean temperature was regressed on time. Warming during study period should lead to early leafing. We adopted the approach used by NASA [45] to assess for trends in air temperature by focusing on mean annual temperature and mean temperatures for different seasons: winter (December–February), spring (March–May), summer (June–August), and autumn (September–November). Furthermore, the trend analysis was only done if there were at least 8 values in the time series in order to avoid testing for trends based on too few data points. For all trend analyses in this study, a trend was considered to be significant at 5% threshold. However, slope coefficients estimated using linear regression can be substantially influenced by one or few observations [46], potentially resulting in spurious trends.
In our analysis, we also used Mann-Kendall trend test, a non-parametric methods which is known to be reliable and robust against non-normality and missing values [47,48] to quantify temporal trends in the timing of leafing and air temperature. The results from Mann-Kendall trend analysis were largely in agreement with that from linear regression analysis. Because we were also interested in expressing the phenological shifts in understandable unit of measurements (e.g., days), only results from linear regression are presented.

3. Results

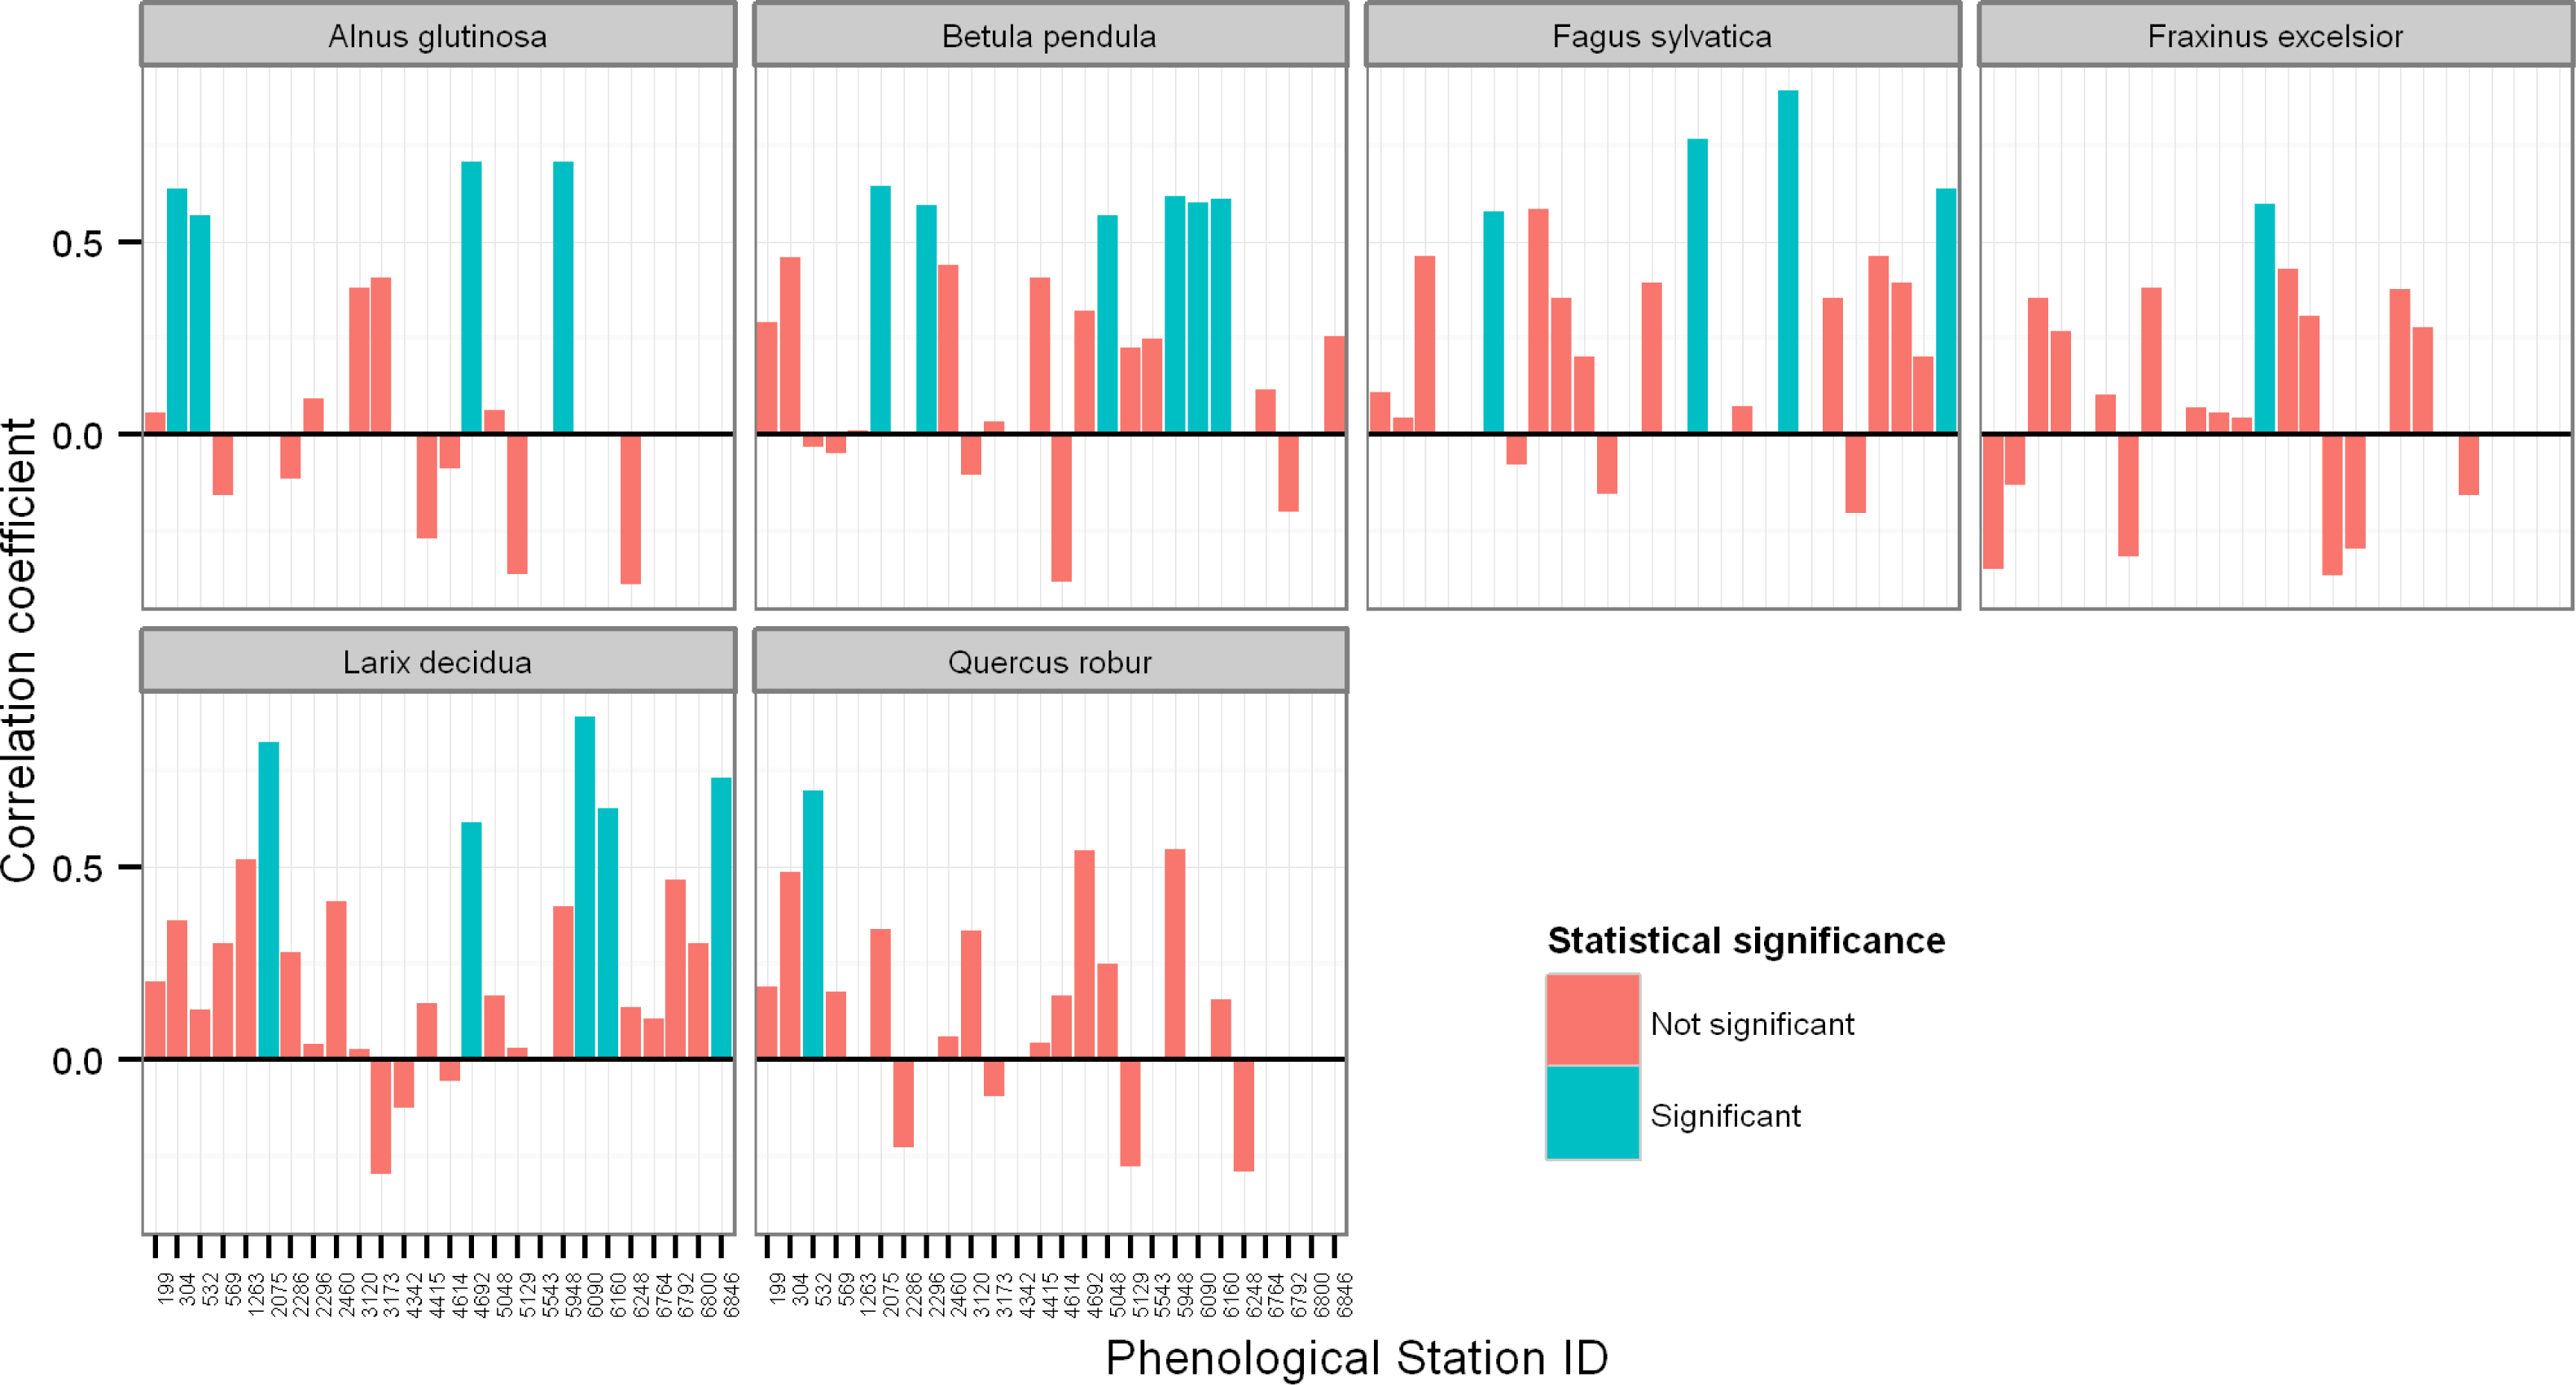
3.1. Relationship between Ground Observations and Satellite SOS Estimates

The timing of leaf unfolding/first leaf separation of six deciduous tree species was correlated to satellite SOS estimates using spearman’s rank correlation to determine the accuracy for the satellite SOS estimates in relation to ground observations. The correlation coefficients per phenological station are shown in Figure 2. Here we observe that satellite SOS estimates were only positively and significantly correlated (p < 0.05) to ground observations at few phenological stations. For all phenological stations, no significant negative correlation between satellite SOS estimates and ground observations was observed (Figure 2). Significant correlation between ground observations and satellite SOS estimates was mainly observed for the Alnus glutinosa, Betula pendula, Fagus sylvatica and Larix decidua. For each of all other species, the timing of leafing was only significantly correlated to satellite SOS estimates at one phenological station.

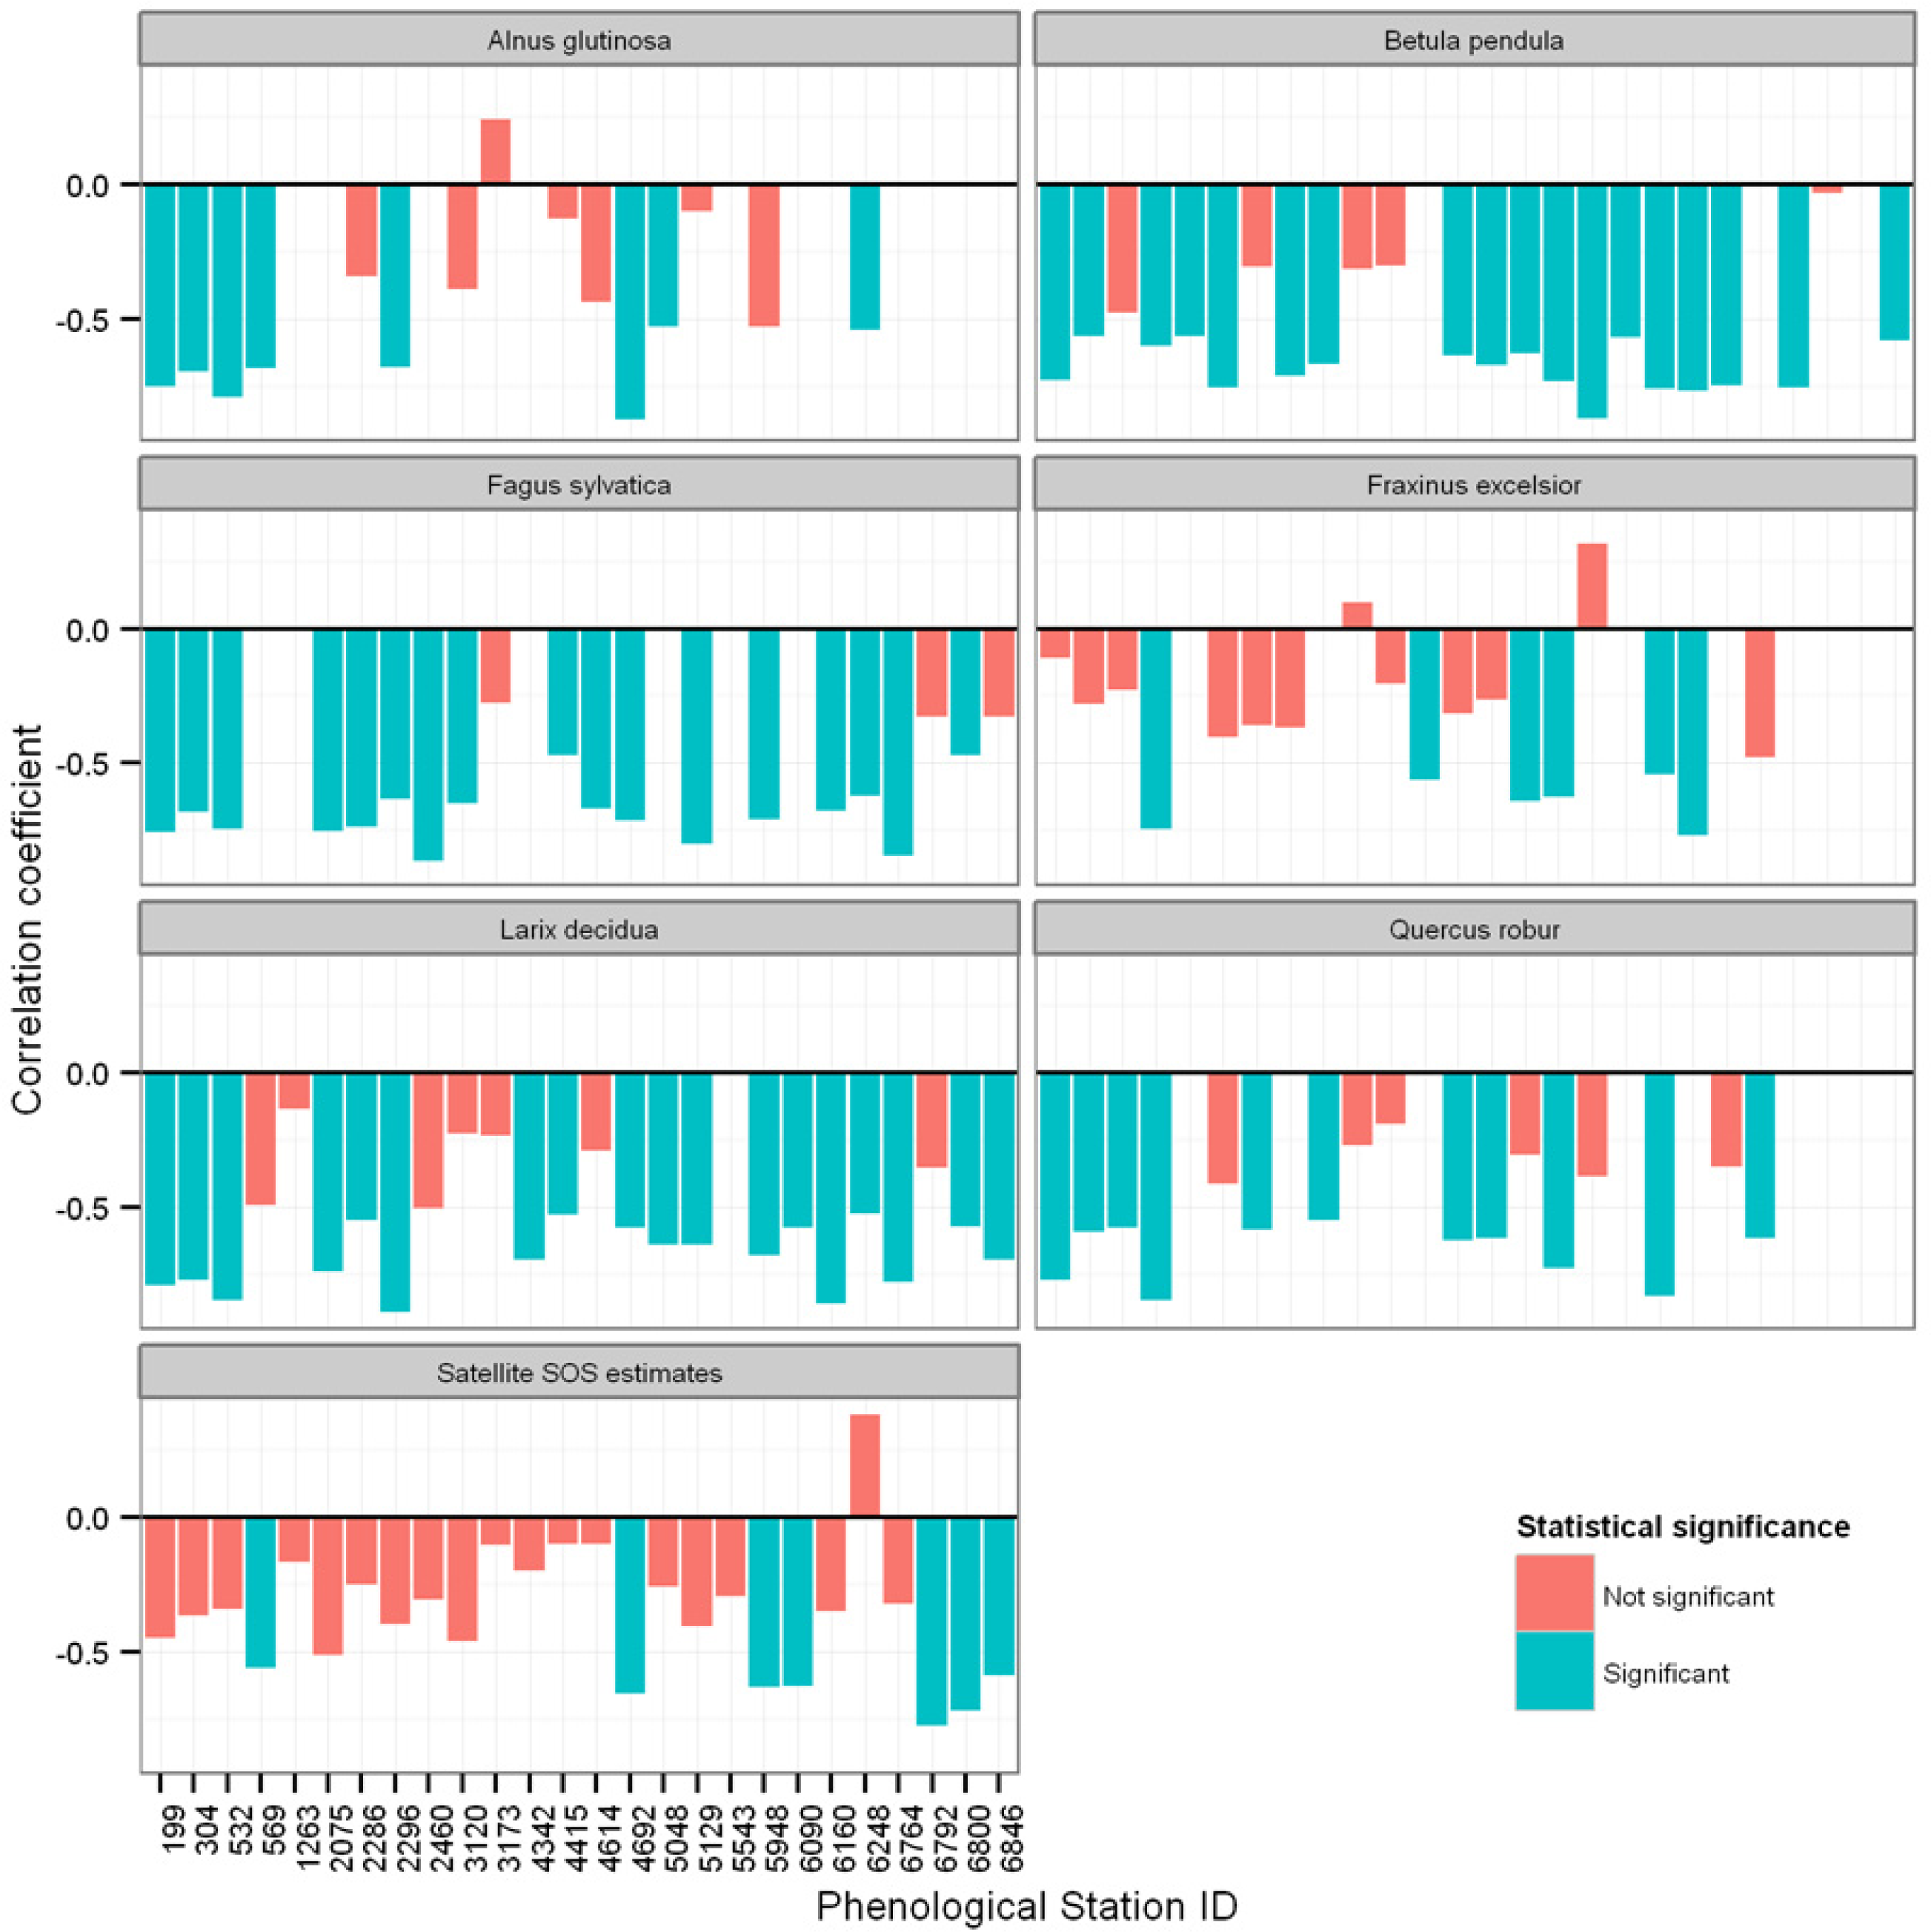
3.2. Relationships between Ground Observations, Satellite SOS Estimates, and Spring Temperature

Statistical relationships between the timing of leaf unfolding/first leaf separation of six deciduous tree species, satellite SOS estimates and spring temperature were quantified using spearman’s rank correlation. The correlations coefficients per phenological station are presented in Figure 3. Our results show that the timing of leaf unfolding/first leaf separation of six deciduous tree species was negatively and significantly correlated (p < 0.05) to spring temperature at most of phenological stations, except for Fraxinus excelsior of which the correlation was only significant at 33% of the stations. The timing of leaf unfolding/first leaf separation of all other species showed significant correlation to spring temperature at more than 50% of stations where the species were recorded. When not considering statistical significance, the ground observations of Betula pendula, Fagus sylvatica, Larix decidua, and Quercus robur were negatively correlated to spring temperature at all phenological stations (Figure 3). Satellite SOS estimates were also negatively and significantly correlated to spring temperature, but only at 27% of the pixels corresponding to phenological stations. However, when not considering statistical significance, correlation coefficients between satellite SOS estimates and spring temperature were negative at 25 out 26 of the pixels corresponding to phenological stations (Figure 3). At phenological stations, no significant positive correlation to spring temperature was recorded, both for ground observations and satellite SOS estimates.

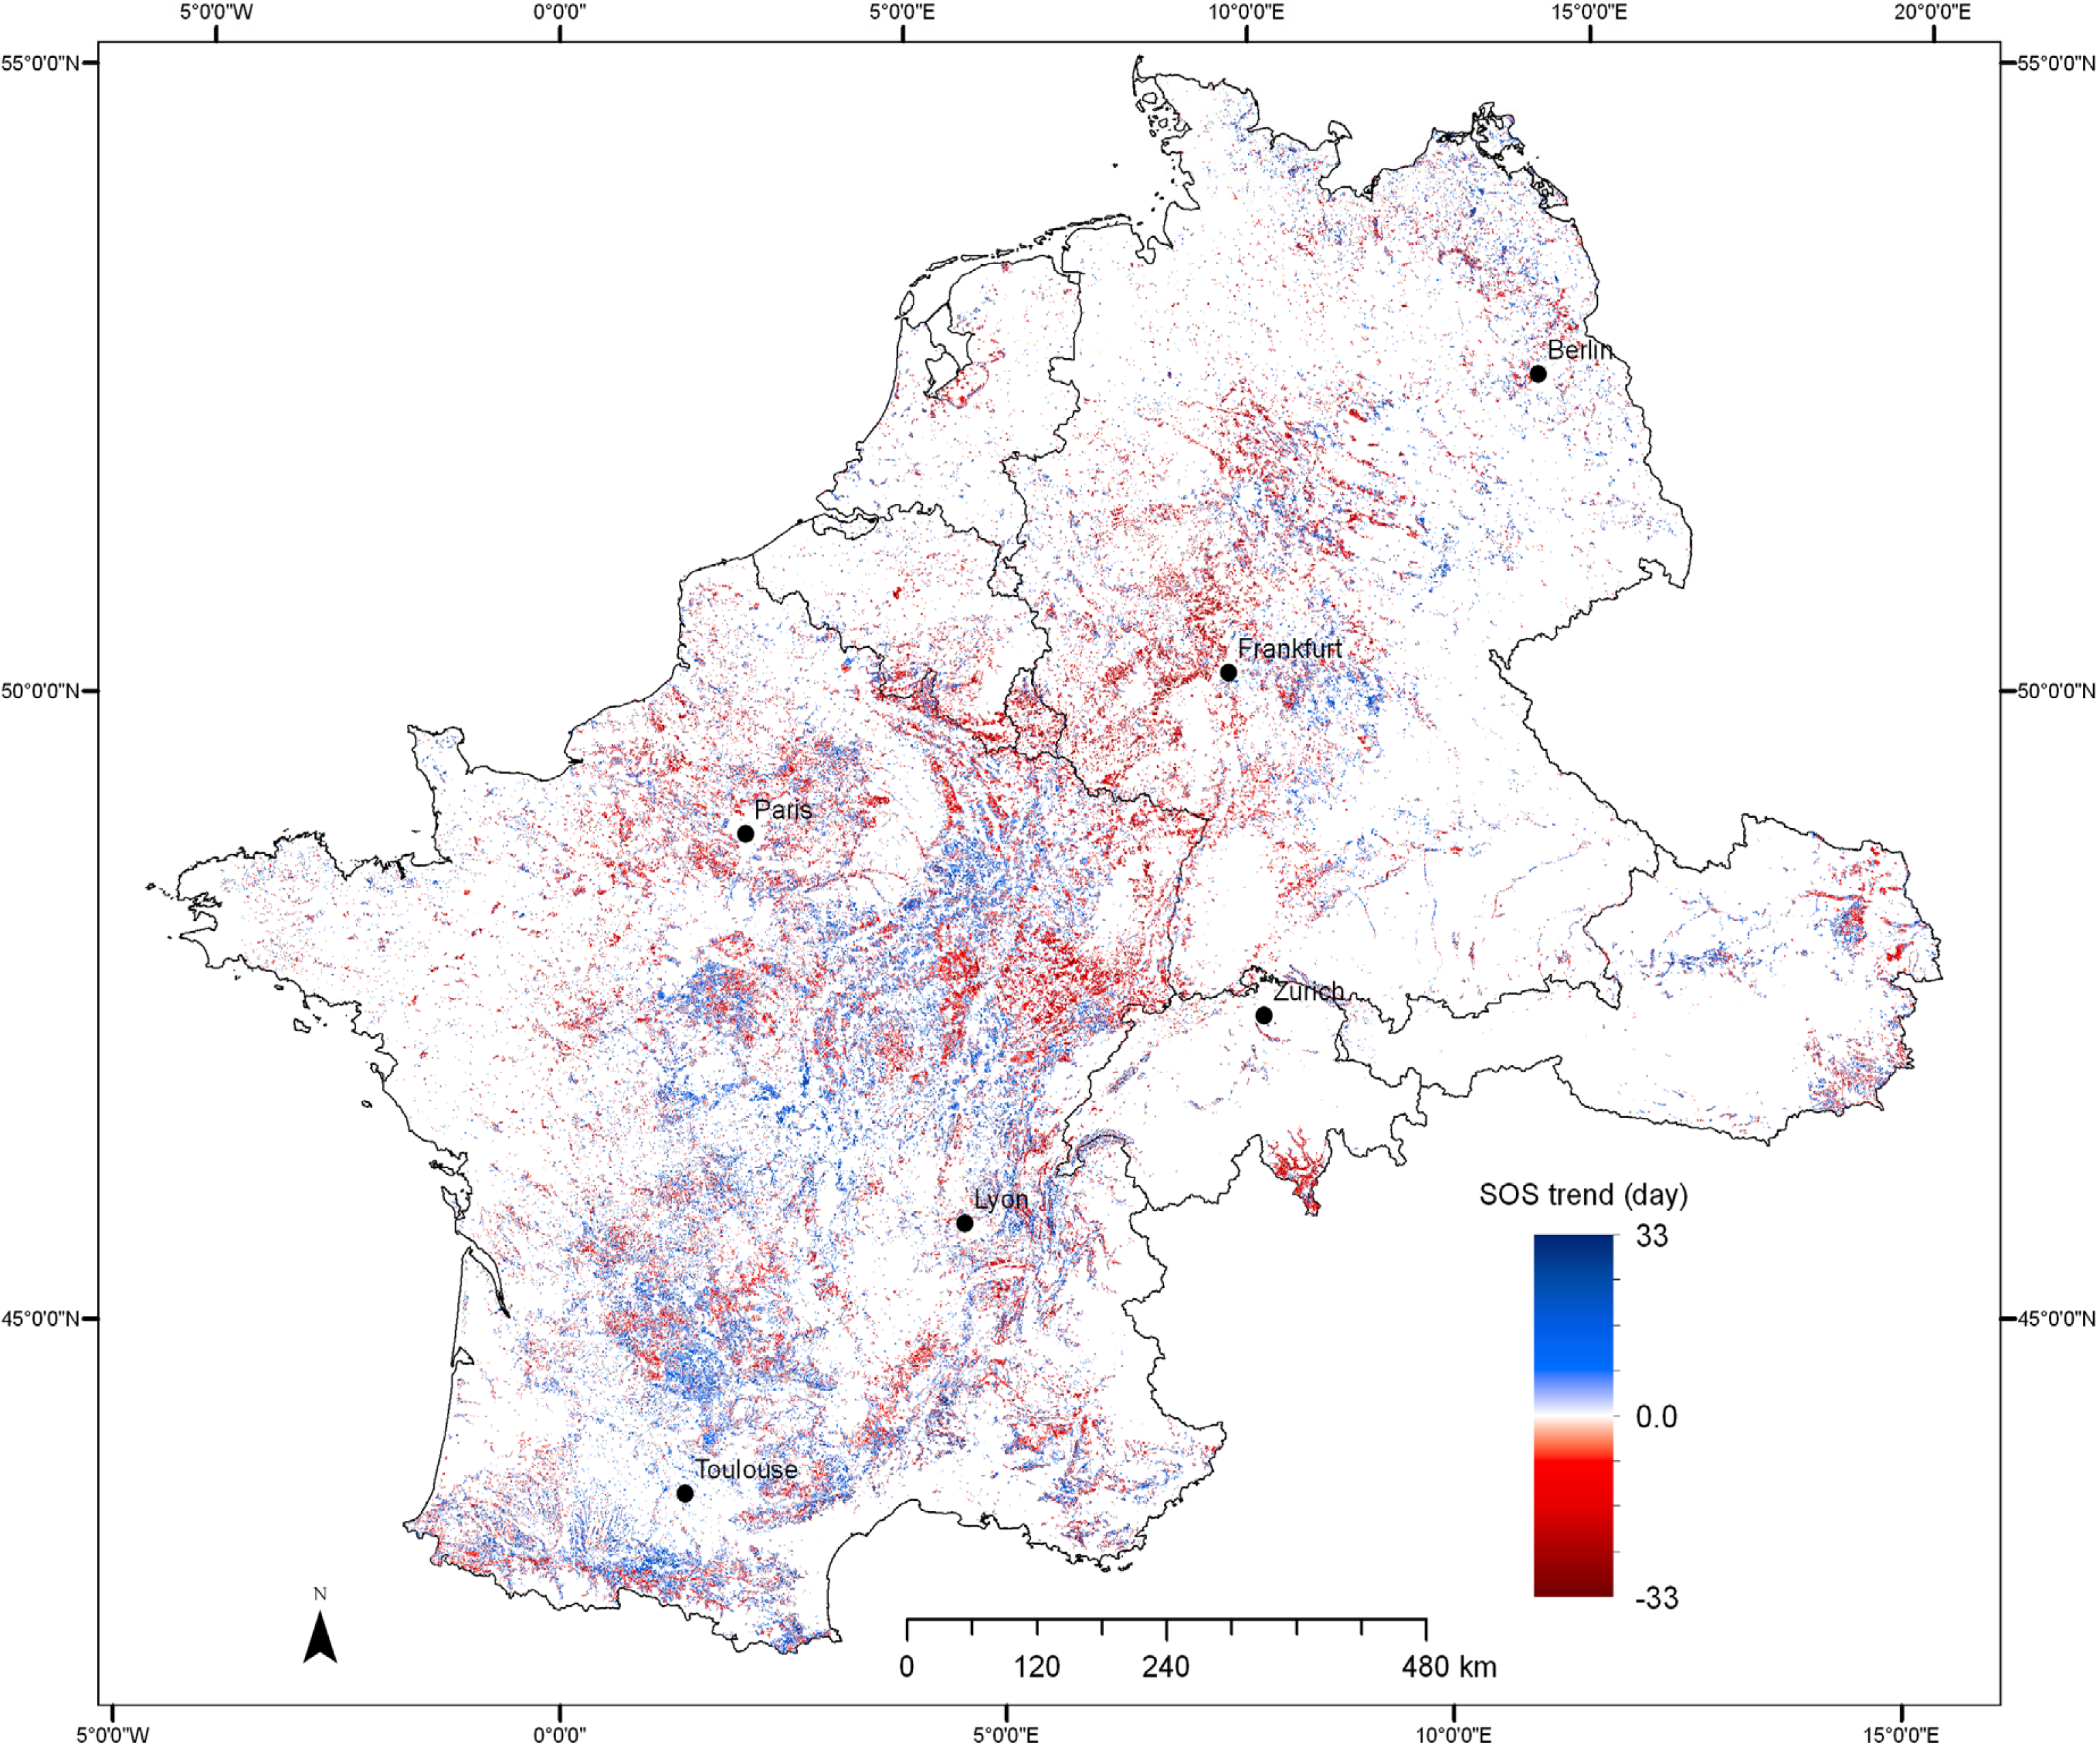
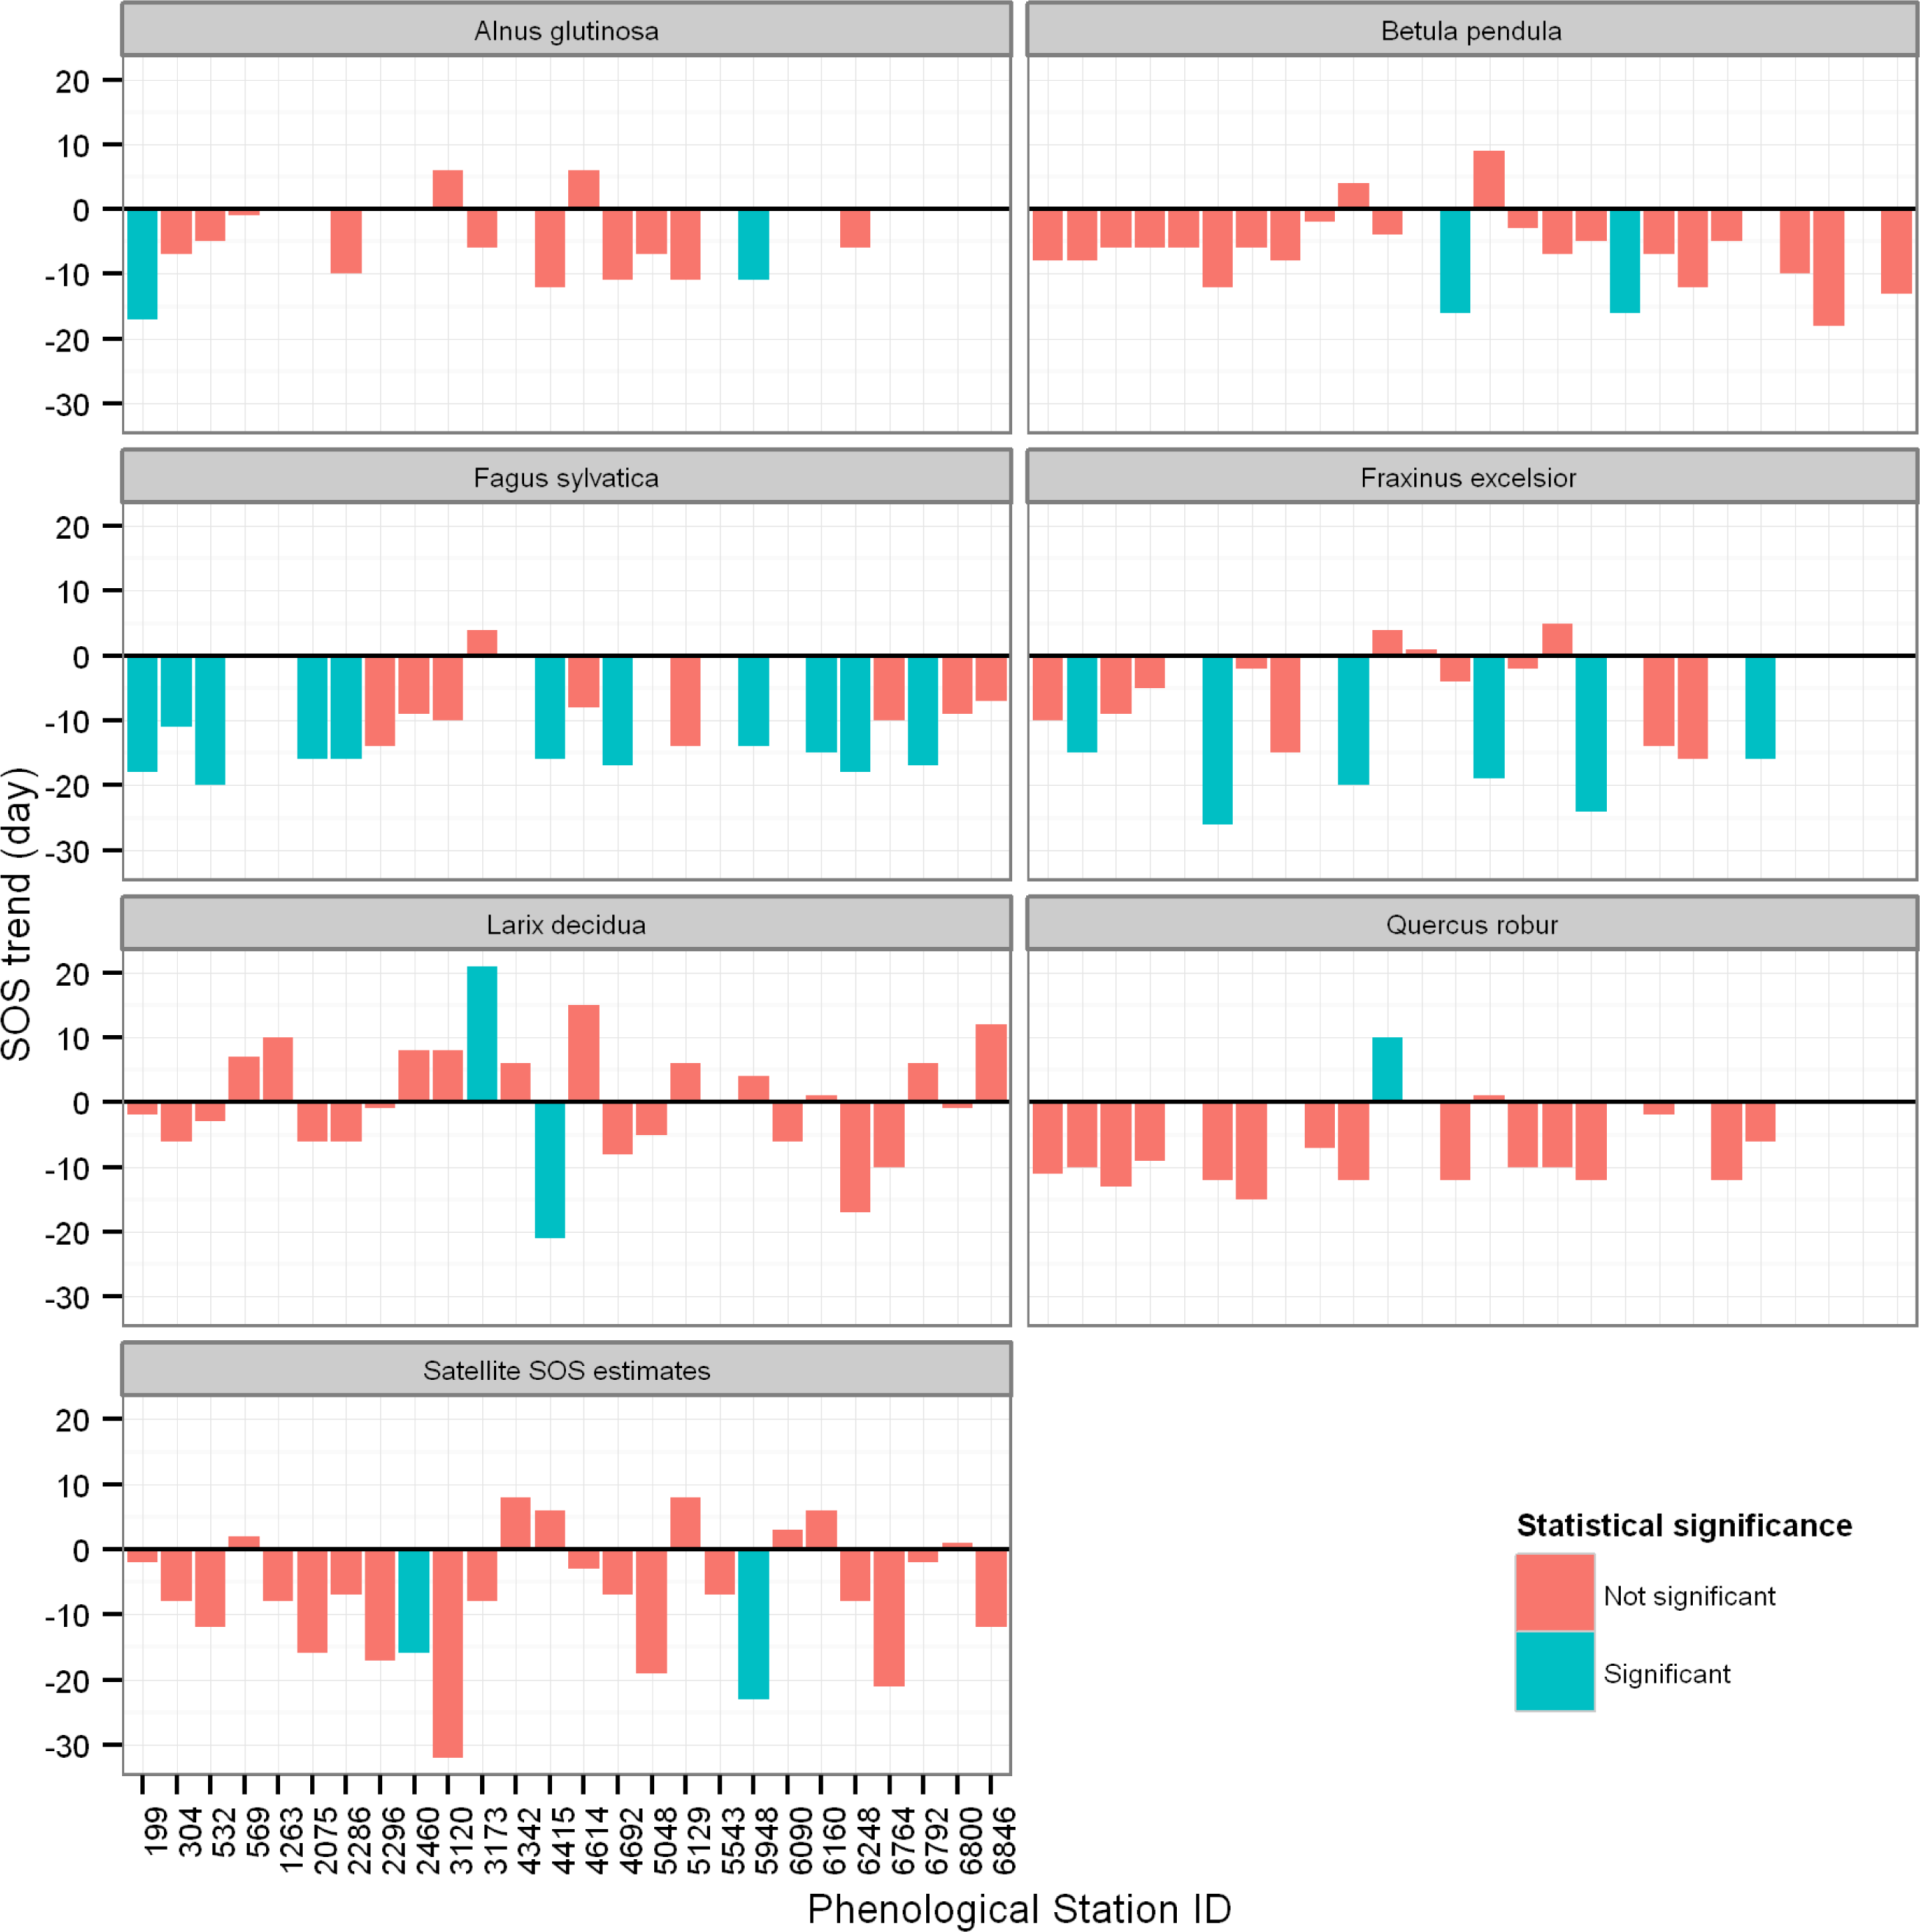
3.3. Trends in SOS of Deciduous Forest

In this study, we assessed for temporal shifts in the timing of leaf unfolding/first leaves separation of six individual deciduous tree species based on in situ observations. The results are presented in Figure 4 and are expressed as total number of days (days/(11 yr)) the timing of leaf unfolding/first leaves separation has shifted between 2001 and 2011. Days with a negative sign imply that species were leafing early. We find that all tree species we focused on did experience early leafing at more than 80% of phenological stations where they were documented, except for Larix decidua which recorded early leafing only at 52% of the stations. Across the phenological stations, and during entire study period, the shift to early leafing ranged from 2 to 16 days for Betula pendula, 1–17 days for Alnus glutinosa, 7–20 days for Fagus sylvatica, 1–21 days for Larix decidua, 2–15 days for Quercus robur, and Fraxinus excelsior experienced the shift to early leafing ranging from 2 to 26 days. Some species experienced delayed leafing too, especially Larix decidua (Figure 4). When using a 5% significance threshold, we observe statistically significant shifts to early leafing in ground observations, but this pattern was mainly prevalent for Fagus sylvatica which recorded statistically significant shift to early leafing at about 55% of the phenological stations, followed by Fraxinus excelsior with 33%. All other tree species did experience statistically significant shift to early or later leafing at least at one of the phenological stations.
In the next step, we looked at how changes in satellite SOS estimates agree with the change in the in situ observations at locations where in situ observations are available. The SOS shifts at pixels corresponding to phenological stations are shown in Figure 4. For satellite SOS estimates, statistically significant shift to early SOS (p < 0.05) was only recorded at two phenological stations (ID: 2460 and ID: 5948). However, when statistical significance is not taken in account, more than 70% of pixels corresponding to phenological stations have recorded negative slope coefficient (Figure 4). Generally, this pattern of high prevalence of negative slope coefficient observed from the trend analysis of satellite SOS estimates is largely similar to that of ground observations.
In a final step, we applied the SOS trend analysis on the satellite SOS estimates over the entire study area. The results are presented in Figure 5. From this analysis, we observe that about 62.8% of pixels (deciduous forest) have recorded a negative slope coefficient suggestive of shift to early SOS during the period of 2001 through 2011, whereas 37.9% recorded a positive slope coefficient indicative of shift to later SOS. The remaining pixels (<0.5%) recorded a slope coefficient of zero. This high prevalence (62.8%) of negative slope coefficients in the satellite SOS estimates over the study area is in line with what has been observed in ground observations at phenological stations. When we tested if the slope coefficients were significantly different from zero at 5% threshold, we found only 6.3% of pixels (deciduous forest) to have experienced a negative trend in the SOS, and 1.7% a positive trend. In the next section, we present the results for trend analysis in air temperature.

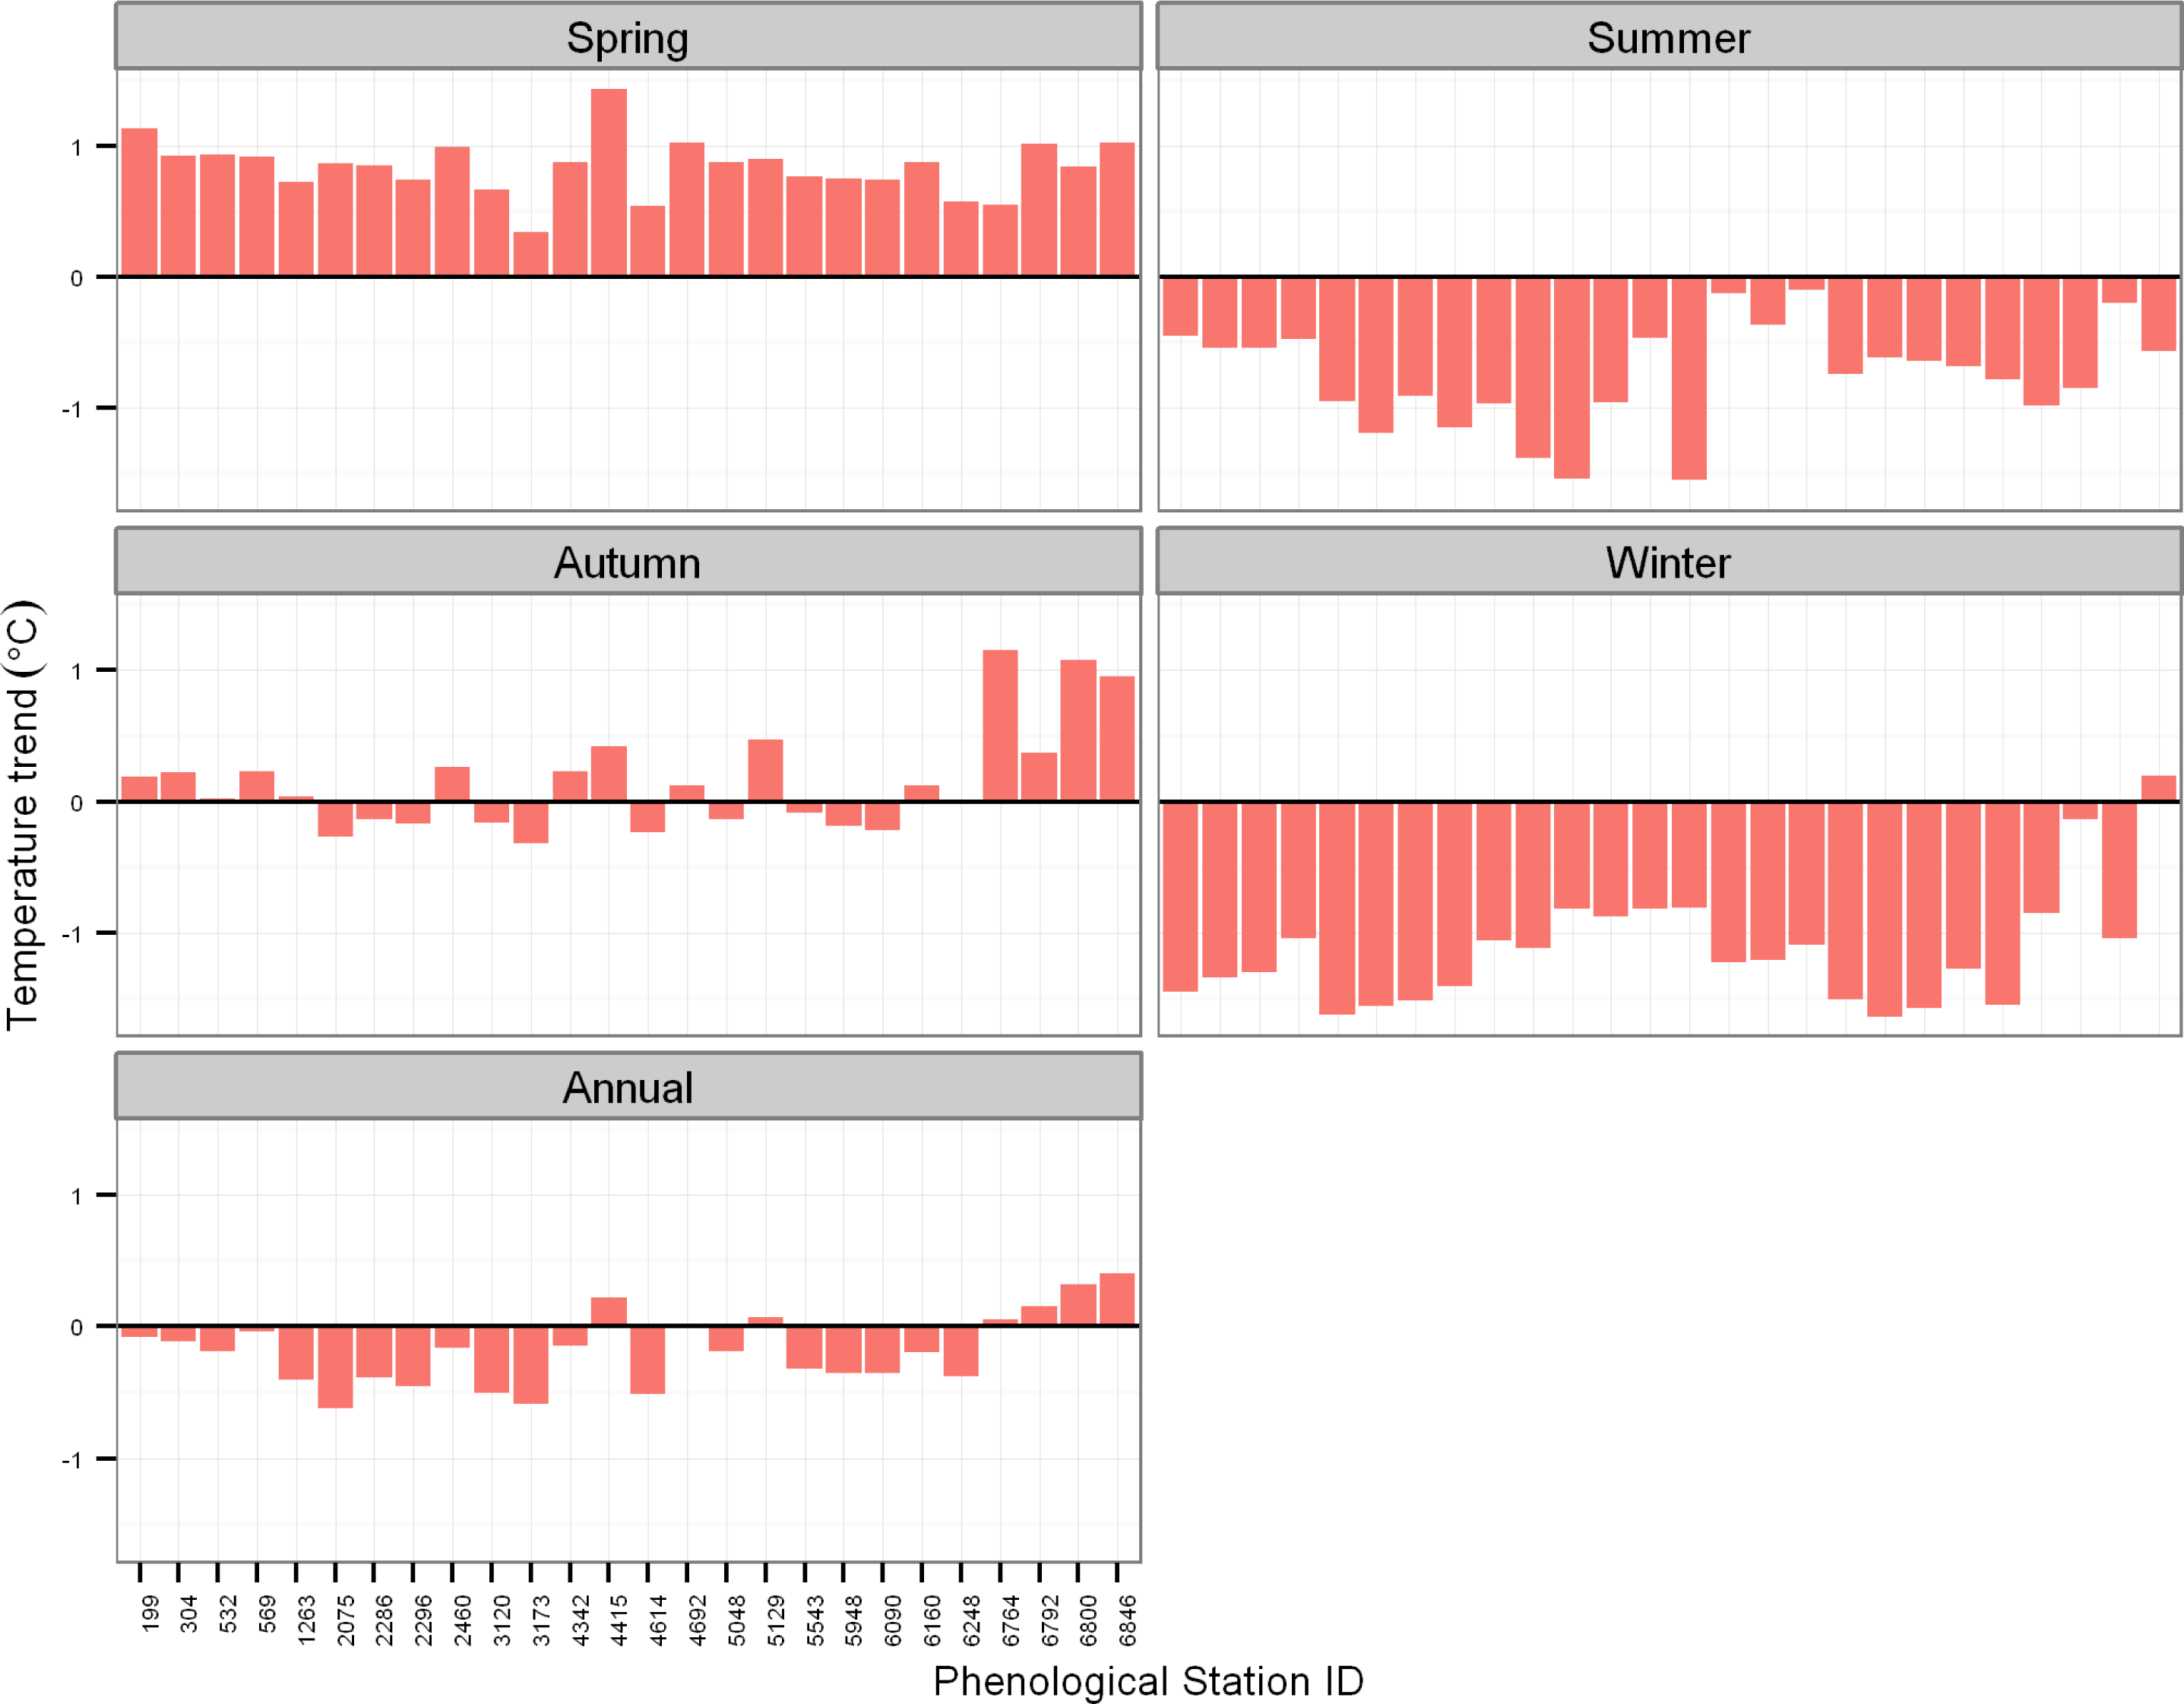
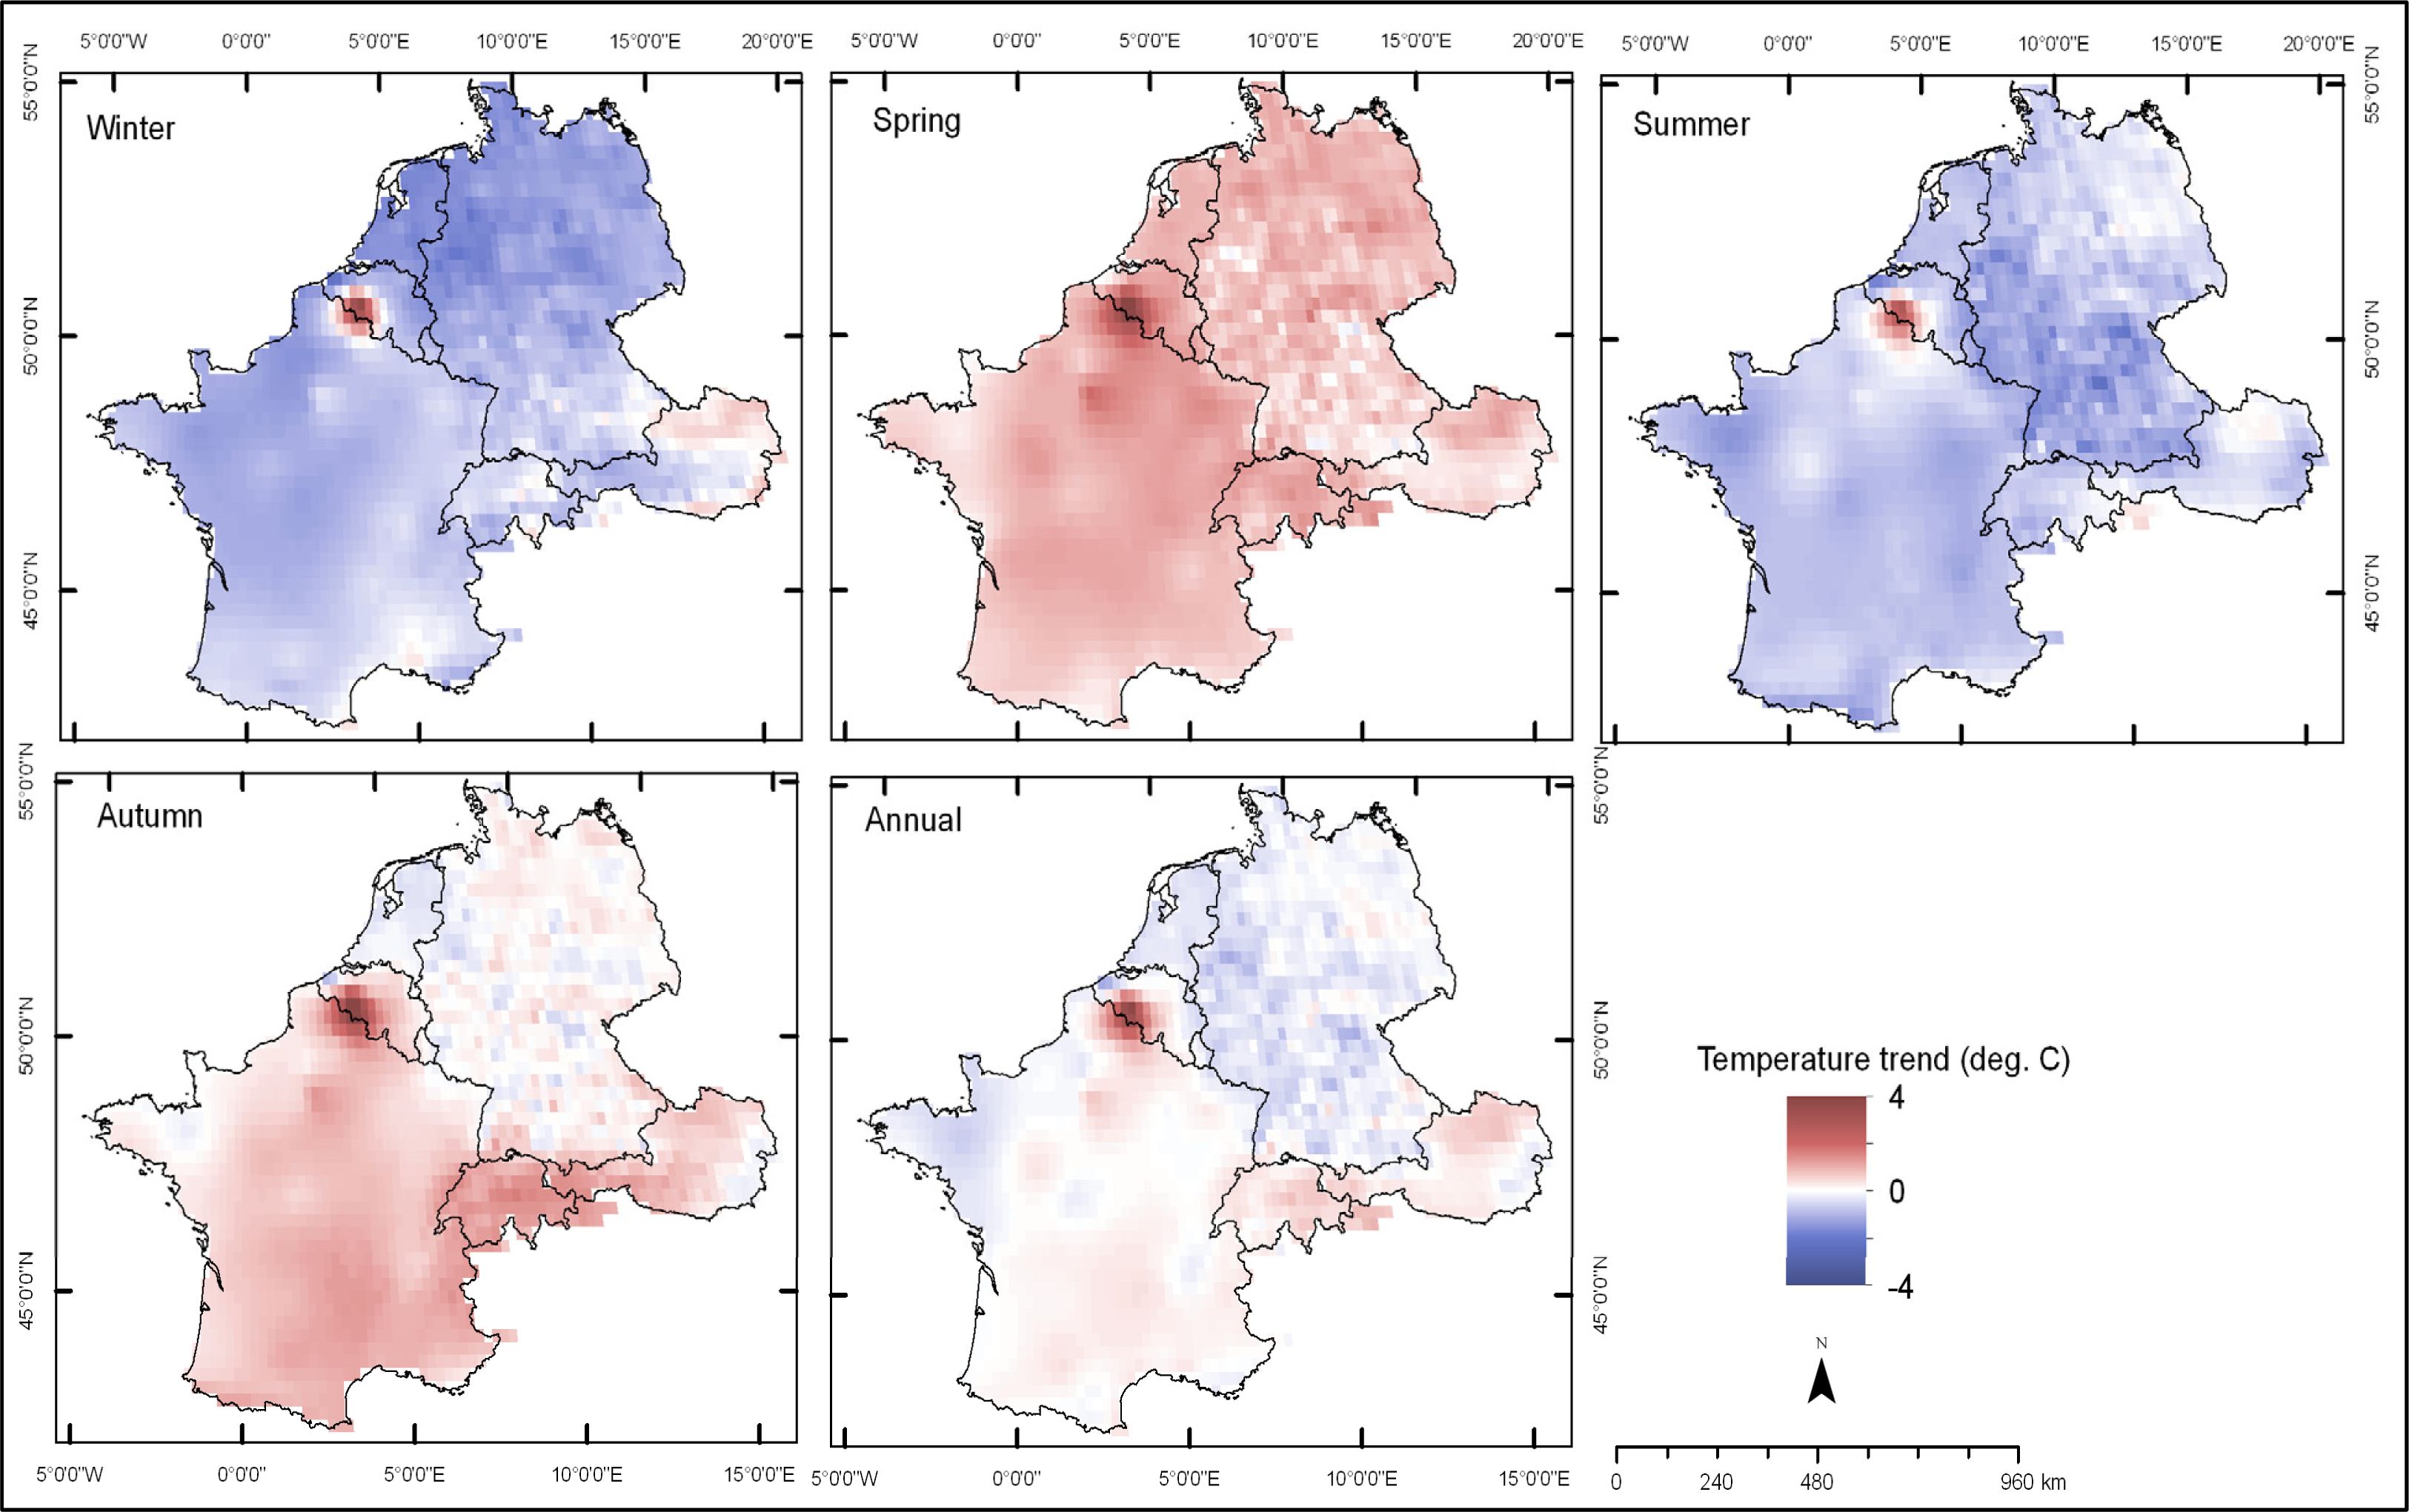
3.2. Trends in Air Temperature

One needs to first understand the temporal dynamics of air temperature in order to better understand the changes in plant phenology for temperate regions. We analysed for temporal trends in air temperature over Western Europe where we studied phenological dynamics in SOS. Figure 6 shows the slopes of linear regression for annual air temperature and temperatures of different seasons (winter (December–February), spring (March–May), summer (June–August), and autumn (September–October) at pixels corresponding to phenological stations. The results are presented as total temperature change (increase/decrease) during the study period. Our results show that there was a widespread positive slope coefficients in air temperature at all pixels only during spring season, with other seasons either showing mainly a negative slope coefficients (e.g., summer and winter) or a combination of both negative and positive slope coefficients (e.g., autumn). All these slope coefficients were not statistically significant.
Across the entire study area, we observe similar pattern in temperature dynamics as at the pixels corresponding to phenological stations (Figure 7) but also not statistically significant. The results imply that, in our study area, the periods of March–May and September–October were generally getting warmer from 2001 through 2011, whereas June–August and December–February periods were getting colder. The annual mean temperature was confounded by both negative and positive slope coefficients proportionally. In temperate regions of Western Europe, the vegetation generally starts to green during the spring (March–May). We therefore observe that there was warming in Western Europe during the period which is critical for vegetation greening. At phenological stations, the increase in air temperature during spring ranged between 0.34 °C and 1.43 °C. Across the study area, the maximum warming during spring was about 4 °C.

4. Discussion

Our analysis of ground observations show that the deciduous tree species we considered shifted the time of leafing during the period of 2001 through 2011. At some locations, we find that the tree species shifted their green-up date by 2–3 weeks during the entire study period. Apart from Larix decidua, the trees species mostly shifted the time of leafing in favour of early leafing. Larix decidua, a deciduous conifer tree species, showed shifts both to early and later leafing proportionally. Statistically significant shifts in the timing of leafing were mainly prevalent for Fagus sylvatica which recorded statistically significant shift to early leafing at about 55% of the phenological stations, followed by Fraxinus excelsior with 33%. We attribute this early leafing to the increase in temperature experienced in the study area during spring season. Though not statistically significant, the increase in air temperature occurred during the period (March–May) which is critical for vegetation greening in temperate regions. We attribute statistically insignificant trend in air temperature to short time series we used thus reducing the power to detect significant changes in temperature. Our correlation analysis, however, showed that the timing of leafing was significantly correlated to spring temperature, and the correlation was largely negative thus suggesting that as the spring temperature was increasing between 2001 and 2011 the deciduous trees were leafing early. Our findings are in agreement with other studies [1,3,49] that plants are now leafing early in Europe because of warming observed in the northern hemisphere in recent years [34]. In Europe, larger shifts in leaf unfolding of species occur in areas which exhibit a stronger warming in the preceding month [50], and Fagus sylvatica is known to show negative trends in leaf unfolding strongly matching the pattern of temperature increase in March [50], thus highlighting the sensitivity of this species to spring temperature changes. We notice from our results that using only annual temperature to determine whether or not warming has occurred at a particular location could conceal important inter-seasonal temperature dynamics. Such concealment could lead to misinterpretation of important changes observed in plant phenology.
Though ground observations provide us with more reliable information on how plant phenology is responding to changes in the climate [50,51], they do not however give spatially explicit information of where phenological changes are occurring due to limited spatial coverage. We evaluated the reliability of satellite SOS estimates in tracking the response of forest leafing to changes in the climate by comparing the temporal trends in satellite SOS estimates to that observed in in situ observations. Our results show that a shift to early leafing observed in ground observations was reflected in the satellite SOS estimates of MODIS pixels corresponding to the phenological stations, despite the fact that field based phenology measurements are conceptually different from satellite based phenology measurements [19]. Clearly, as our results demonstrate, satellite SOS estimates can provide meaningful information about the shifts in leaf phenology, with the magnitude of change comparable to that observed at individual plant level. Our results are therefore a step towards addressing the uncertainty of whether or not the phenological changes detected from satellite images are indeed commensurate with changes in ground observations. To this end, our results give important insights regarding the monitoring of shifts in leaf phenology using satellite images, and re-emphasize the potential of remote sensing for wall-to-wall monitoring of leaf phenology under a changing climate [8].
Across the entire study area and based on satellite SOS estimates, we found only 6.3% of pixels (deciduous forest) to have experienced a negative trend in the SOS, and 1.7% a positive trend. When using ensemble SOS estimates derived from NDVI time series from the Global Inventory Modelling and Mapping Studies Advanced Very High Resolution Radiometer NDVIg dataset estimated using HANTS-FFT and Midpointpixel algorithms, [19] found trends only in about 12% of North America with co-occurrence of both early and later SOS. Therefore, our findings are in line with the findings of White et al. [19]. From ground observations, we observe that Larix decidua showed a shift to both early and later leafing, with later leafing even at locations where other species showed an early leafing (Figure 4). These SOS dynamics in Larix decidua show similar pattern we observed in satellite SOS estimates. Shifts in SOS based on satellite SOS estimates are widely reported in many parts of the globe [17,19,24,25,27,28,52,53], of which some studies documented co-occurrence of early and late SOS [19,27], but factors driving these antagonistic SOS dynamics remain poorly understood. The co-occurrence of early and late SOS in our study area despite widespread positive trend in air temperature during spring season therefore remains a subject of further research. There are however many candidate factors that could explain the co-occurrence of positive and negative trends in SOS in a particular area. For example, co-occurrence of positive and negative trends in SOS can be a result of differences in local conditions [50], i.e., topography. Topographical variations can result into microclimate [51,52] and because the air temperature data set we used was created by interpolating sparse point observations [38], it is possible that air temperature has been underestimated or over-estimated at some locations, especially in mountainous areas—hence affecting the magnitude of the temperature trend derived at such pixels. As such, it is possible that some areas did not experience warming as our results suggest. Some tree species (e.g., Larix decidua) are known to change their timing of leafing by 3–4 days per 100 m elevation, with leaves appearing early at lower elevations [53]. This altitudinal influence on the timing of leafing in Larix decidua may also explain partly the co-occurrence of early and late SOS in our study area. Landcover map accuracy is another issue. Some pixels might have been misclassified as deciduous forest, when they are indeed composed of different landcover types (e.g., forest and cropfields). In addition, here we compared the timing of leafing for individual species to a pixel-based SOS estimate, but species composition can also influence the statistical relationship between ground observations and satellite SOS estimates. SOS estimates at pixels where there are several different species which green-up at different times could show low correlation with ground observations of individual species. Furthermore, estimating temporally consistent SOS for areas where anthropogenic influences (e.g., mowing, crop rotation and irrigation) are continuously occurring may be challenging, and the trends derived on such areas might amount to noise—and not to real trends induced by climatic warming. Including improved landcover maps in the analysis when assessing changes in leaf phenology using remote sensing would be crucial in future studies.
As indicated before, temporal trends in the timing of leafing were estimated by means of linear regression, thus enabling us to easily express the shifts in understandable unit of measurements (days). However, slope coefficients estimated using linear regression can be substantially influenced by one or few observations [46], potentially resulting in spurious shifts. As a way to ensure that the shifts we observed are not spurious, we also used Mann-Kendall trend test (results not shown) which is known to be reliable and robust against non-normality and missing values [47,48] to quantify the trends in ground observations, satellite SOS estimates and air temperature. We found about 95% agreement in terms of change trajectory between Mann-Kendall trend and linear regression results, hence confirming that there were indeed changes in air temperature and the timing of leafing in Western European deciduous forests between 2001 and 2011.
Shifts in phenological phases have global and regional impacts on the climate system via feedback mechanisms of surface albedo, CO2 fluxes and evaporation [50]. There is therefore a need to represent phenology in global biosphere models correctly if we are to improve our understanding of temporal and spatial global carbon dynamics. Our results show that we can extract SOS estimates from satellite data with temporal dynamics similar to that of in situ observations (e.g., leaf unfolding and first-leaves separation). As such, we can use satellite data to evaluate the performance of global biosphere models in simulating temporal dynamics of plant phenology under a changing climate especially in parts of the globe where ground phenological observations are lacking in order to improve our understanding of global carbon dynamics.
Although our results provide spatially detailed information on how deciduous forests in Western Europe are responding to climate variability, we used time series data which are only a decade-long, probably too short to capture changes which are a result of climate change. Also, event such as SOS tend to show high interannual variability [19], therefore an 11-year SOS record might be too short for detecting robust trends, and this short time series might have affected the statistical significance our results because small sample size can reduce the power to detect statistical significance. As we found shifts of up to 3 weeks, these shifts are somewhat larger when compared to those reported by other studies, for instance Stockli & Vidale [32] and Menzel et al. [3], which used much longer time series. However, shifts in spring arrival in this study area are known to show decadal variations, with large shifts recorded during the 1980s and almost no shifts in the 1990s [32]. It is therefore possible that using longer time series covering different decades could lead to a weaker trend in SOS when compared to a decade-longer data. But longer time series are important in diagnosing if the shifts are sustained over time or not. Therefore, the shifts we observed in the leaf phenology of the Western European deciduous forest should be interpreted in the context of short-term variation in the climate, and not in the context of sustained change in the climate. However, though based on shorter time series, the shifts we observed are still important in the context of global change because they can trigger a chain of feedbacks in the climate system and might contribute to long term changes in animal distribution (e.g., pests) synchronization between species [8,9].
As the time series of MODIS images become longer, it will play a key role in understanding how various vegetation types are responding to changes in the climate. Many studies use data from AVHRR sensor to study leaf/surface phenology, for example [19,27,28], probably because of a longer time series spanning over three decades thus providing a long record of vegetation conditions ideal to study the long-term effect of climate variability on vegetation phenology. However, for highly fragmented ecosystems/landscapes, i.e., in Western Europe, vegetation type-specific studies are generally challenging to undertake when using data from AVHRR sensor because the pixel is always likely to be composed of more than one landcover type. Thus, the problem of mixed-pixel effects due to different land cover types within one pixel is inevitable, potentially resulting in less temporally consistent SOS estimated at that pixel. Data from moderate to high spatial resolution satellite sensors (e.g., MODIS, Landsat) will therefore continue to play a key role in providing new insights about leaf phenology under a changing climate, especially in highly fragmented ecosystems. Moreover, with the advent of future new satellites like Proba-V, Sentinel constellation and the Landsat 8, the proof of concept demonstrated here can be applied to further study the effects of climate change on plant phenology. However, harmonised in situ observations of phenological events are also critically needed to improve the validation of satellite SOS estimates.

5. Conclusions

We demonstrated here that the growing season was starting earlier between 2001 and 2011 for majority of temperate deciduous forests in Western Europe, possibly influenced by regional spring warming effects experienced during the same period. We found a significant shift (p < 0.05) to early start-of-season (SOS) of up to 3 weeks both in ground observations and satellites SOS estimates. For ground observations, shift to early leafing was mainly prevalent for Fagus sylvatica which recorded statistically significant shift to early leafing at about 55% of the phenological stations, followed by Fraxinus excelsior with 33%. We showed that ground observations and satellite SOS estimates were negatively correlated (p < 0.05) to spring temperature at phenological stations. We evaluated the reliability of satellite SOS estimates in tracking the response of forest leafing to climate variability by comparing the temporal shift in satellite SOS estimates to that observed in situ observations. Although field based phenology measurements are conceptually different from satellite based phenology measurements, we illustrated the potential to assess changes in leaf phenology from space using satellite data by showing that the magnitude and trajectory of shifts in satellite SOS estimates are comparable to that in in situ observations. However, satellite SOS estimates may conceal significant shift in the SOS occurring at individual species level. We discussed and highlighted the importance of using high spatial and temporal resolutions when studying the shifts in start of the growing season from space, especially in highly fragmented ecosystems to minimize the mixed-pixel problem. With the advent of currently launched Proba-V and future Sentinel-2 and 3 satellites high temporal and spatial resolution data will become available and contribute to a more accurate SOS estimation by eliminating mixed land cover type effects.

Acknowledgments

We are thankful to Rogier de Jong for proof-reading the manuscript and whose comments greatly improved this paper. We are also grateful to the four anonymous reviewers for their careful critiques, and comments, which helped us to considerably improve the manuscript.

Conflicts of Interest

The authors declare no conflict of interest.

References

  1. Menzel, A.; Fabian, P. Growing season extended in Europe. Nature 1999, 397, 659. [Google Scholar]
  2. Badeck, F.-W.; Bondeau, A.; Böttcher, K.; Doktor, D.; Lucht, W.; Schaber, J.; Sitch, S. Responses of spring phenology to climate change. New Phytol 2004, 162, 295–309. [Google Scholar]
  3. Menzel, A.; Sparks, T.H.; Estrella, N.; Koch, E.; Aaasa, A.; Ahas, R.; Alm-Kübler, K.; Bissolli, P.; Braslavska, O.; Briede, A.; et al. European phenological response to climate change matches the warming pattern. Glob. Chang. Biol 2006, 12, 1969–1976. [Google Scholar]
  4. Linkosalo, T.; Hakkinen, R.; Hanninen, H. Models of the spring phenology of boreal and temperate trees: Is there something missing? Tree Physiol 2006, 26, 1165–1172. [Google Scholar]
  5. Peñuelas, J.; Rutishauser, T.; Filella, I. Phenology feedbacks on climate change. Science 2009, 324, 887. [Google Scholar]
  6. Steltzer, H.; Post, E. Seasons and life cycles. Science 2009, 324, 886–887. [Google Scholar]
  7. Polgar, A.C.; Primack, B.R. Leaf-out phenology of temperate woody plants: From trees to ecosystems. New Phytol 2011, 191, 926–941. [Google Scholar]
  8. Peñuelas, J.; Filella, I. Responses to a warming world. Science 2001, 294, 793–795. [Google Scholar]
  9. Post, E.; Pedersen, C.; Wilmers, C.C.; Forchhammer, M.C. Warming, plant phenology and the spatial dimension of trophic mismatch for large herbivores. Proc. R. Soc. B Biol. Sci 2008, 275, 2005–2013. [Google Scholar]
  10. Van Vliet, A.J.H.; de Groot, R.S.; Bellens, Y.; Braun, P.; Bruegger, R.; Bruns, E.; Clevers, J.; Estreguil, C.; Flechsig, M.; Jeanneret, F.; et al. The European phenology network. Int. J. Biometeorol 2003, 47, 202–212. [Google Scholar]
  11. Mayer, A. Phenology and citizen science. BioScience 2010, 60, 172–175. [Google Scholar]
  12. White, M.A.; Thornton, P.E.; Running, S.W. A continental phenology model for monitoring vegetation responses to interannual climatic variability. Glob. Biogeochem. Cy 1997, 11, 217–234. [Google Scholar]
  13. Roerink, J.G.; Menenti, M.; Verhoef, W. Reconstructing cloudfree NDVI composites using Fourier analysis of time series. Int. J. Remote Sens 2000, 21, 1911–1917. [Google Scholar]
  14. Zhang, X.; Friedl, M.A.; Schaaf, C.B.; Strahler, A.H.; Hodges, J.C.F.; Gao, F.; Reed, C.B.; Huete, A. Monitoring vegetation phenology using MODIS. Remote Sens. Environ 2003, 84, 471–475. [Google Scholar]
  15. de Beurs, M.K.; Henebry, M.G. Land surface phenology and temperature variation in the International Geosphere-Biosphere Program high-latitude transects. Glob. Chang. Biol 2005, 11, 779–790. [Google Scholar]
  16. White, A.M.; Nemani, R.R. Real-time monitoring and short-term forecasting of land surface phenology. Remote Sens. Environ 2006, 104, 43–49. [Google Scholar]
  17. de Jong, R.; de Bruin, S.; de Wit, A.; Schaepman, M.E.; Dent, D.L. Analysis of greening and browning trends from global NDVI time-series. Remote Sens. Environ 2011, 115, 692–702. [Google Scholar]
  18. Liang, L.; Schwartz, M. Landscape phenology: An integrative approach to seasonal vegetation dynamics. Landsc. Ecol 2009, 24, 465–472. [Google Scholar]
  19. White, M.A.; de Beurs, K.M.; Didan, K.; Inouye, D.W.; Richardson, A.D.; Jensen, O.P.; John O’keefe, J.; Zhang, G.; Nemani, R.R.; van Leeuwen, W.J.D.; et al. Intercomparison, interpretation, and assessment of spring phenology in North America estimated from remote sensing for 1982–2006. Glob. Chang. Biol 2009, 15, 2335–2359. [Google Scholar]
  20. Kross, A.; Fernandes, R.; Seaquist, J.; Beaubien, E. The effect of the temporal resolution of NDVI data on season onset dates and trends across Canadian broadleaf forests. Remote Sens. Environ 2011, 115, 1564–1575. [Google Scholar]
  21. Myneni, R.B.; Keeling, C.D.; Tucker, C.J.; Asrar, G.; Nemani, R.R. Increased plant growth in the northern high latitudes from 1981 to 1991. Nature 1997, 386, 698–702. [Google Scholar]
  22. Zhang, X.; Friedl, A.M.; Schaaf, C.B. Sensitivity of vegetation phenology detection to the temporal resolution of satellite data. Int. J. Remote Sens 2009, 30, 2061–2074. [Google Scholar]
  23. Verbesselt, J.; Hyndman, R.; Newnham, G.; Culvenor, D. Phenological change detection while accounting for abrupt and gradual trends in satellite image time series. Remote Sens. Environ 2010, 114, 2970–2980. [Google Scholar]
  24. Jeong, S.J.; Ho, C.H.; Gim, H.J.; Brown, M.E. Phenology shifts at start vs. end of growing season in temperate vegetation over the Northern Hemisphere for the period 1982–2008. Glob. Chang. Biol 2011, 17, 2385–2399. [Google Scholar]
  25. Zeng, H.; Jia, G.; Epstein, H. Recent changes in phenology over the northern high latitudes detected from multi-satellite data. Environ. Res. Lett 2011. [Google Scholar] [CrossRef]
  26. Doktor, D.; Bondeau, A.; Koslowski, D.; Badeck, F.-W. Influence of heterogeneous landscapes on computed green-up dates based on daily AVHRR NDVI observations. Remote Sens. Environ 2009, 113, 2618–2632. [Google Scholar]
  27. Wu, X.; Liu, H. Consistent shifts in spring vegetation green-up date across temperate biomes in China, 1982–2006. Glob. Chang. Biol 2013, 19, 870–880. [Google Scholar]
  28. Cong, N.; Wang, T.; Nan, H.; Ma, Y.; Wang, X.; Myneni, B.R.; Piao, S. Changes in satellite-derived spring vegetation green-up date and its linkage to climate in China from 1982 to 2010: A multimethods analysis. Glob. Chang. Biol 2013, 19, 881–891. [Google Scholar]
  29. Luo, X.; Chen, X.; Xu, L.; Myneni, R.; Zhu, Z. Assessing performance of NDVI and NDVI3g in monitoring leaf unfolding dates of the deciduous broadleaf forest in Northern China. Remote Sens 2013, 5, 845–861. [Google Scholar]
  30. Van Leeuwen, W.J.D.; Hartfield, K.; Miranda, M.; Meza, F.J. Trends and ENSO/AAO driven variability in NDVI derived productivity and phenology alongside the Andes mountains. Remote Sens 2013, 5, 1177–1203. [Google Scholar]
  31. Heumann, B.W.; Seaquist, J.W.; Eklundh, L.; Jönsson, P. AVHRR derived phenological change in the Sahel and Soudan, Africa, 1982–2005. Remote Sens. Environ 2007, 108, 385–392. [Google Scholar]
  32. Stockli, R.; Vidale, L.P. European plant phenology and climate as seen in a 20-year AVHRR land-surface parameter dataset. Int. J. Remote Sens 2004, 25, 3303–3330. [Google Scholar]
  33. Zheng, X.; Friedl, M.; Schaaf, C.B. Global vegetation phenology from MODIS: Evaluation of global patterns and comparison with in situ measurements. J. Geophys. Res 2006, 111, G04017. [Google Scholar]
  34. Intergovernmental Panel on Climate Change (IPCC). Climate Change 2007: The Physical Science Basis. Contribution of Working Group I to the Fourth Assessment Report of the Intergovernmental Panel on Climate Change; Solomon, S., Qin, D., Manning, M., Chen, Z., Marquis, M., Averyt, K.B., Tignor, M., Miller, H.L., Eds.; Cambridge University Press: Cambridge, UK/New York, NY, USA, 2007. [Google Scholar]
  35. The European Topic Centre on Land Use and Spatial Information. Available online: http://www.eea.europa.eu/data-and-maps/data/corine-land-cover-2006-raster-1/clc-2006-v13-250m (accessed on 13 February 2013).
  36. Pan European Phenological Database. Available online: http://www.pep725.eu (accessed on 21 February 2013).
  37. Brus, D.J.; Hengeveld, G.M.; Walvoort, D.J.J.; Goedhart, P.W.; Heidema, A.H.; Nabuurs, G.J.; Gunia, K. Statistical mapping of tree species over Europe. Eur. J. For. Res 2011, 131, 145–157. [Google Scholar]
  38. Haylock, M.R.; Hofstra, N.; Klein Tank, A.M.G.; Klok, E.J.; Jones, P.D.; New, M. A European daily high-resolution gridded dataset of surface temperature and precipitation. J. Geophys. Res.: Atmos 2008. [Google Scholar] [CrossRef]
  39. Home European Climate Assessment & Dataset Project. Available online: http://eca.knmi.nl (accessed on 8 July 2012).
  40. Rouse, J.W.; Haas, R.H.; Schell, J.A.; Deering, D.W. Monitoring Vegetation Systems in the Great Plains with ERTS. Proceedings of the Third Earth Resources Technology Satellite-1 Symposium, Greenbelt, MD, USA, 10 December 1973; pp. 3010–3017.
  41. Prince, S.D.; Tucker, C.J. Satellite remote sensing of rangelands in Botswana II. NOAA AVHRR and herbaceous vegetation. Int. J. Remote Sens 1986, 7, 1555–1570. [Google Scholar]
  42. Chen, J.; Jönsson, P.; Tamura, M.; Gu, Z.H.; Matsushita, B.; Eklundh, L. A simple method for reconstructing a high-quality NDVI time-series data set based on the Savitzky–Golay filter. Remote Sens. Environ 2004, 91, 332–344. [Google Scholar]
  43. Jönsson, P.; Eklundh, L. TIMESAT—A program for analyzing time-series of satellite sensor data. Comput. Geosci 2004, 30, 833–845. [Google Scholar]
  44. Spearman, C. The proof and measurement of association between two things. Am. J. Psychol 1904, 15, 72–101. [Google Scholar]
  45. Hansen, J.; Ruedy, R.; Sato, M.; Lo, K. Global surface temperature change. Rev. Geophys 2010, 48, RG4004. [Google Scholar]
  46. Chatterjee, S.; Hadi, S.A. Influential observations, high leverage points, and outliers in linear regression. Stat. Sci 1986, 1, 379–393. [Google Scholar]
  47. Hirsch, R.M.; Slack, J.R.; Smith, R.A. Techniques of trend analysis for monthly water quality data. Water Resourc. Res 1982, 18, 107–107. [Google Scholar]
  48. de Beurs, K.M.; Henebry, G.M. A statistical framework for the analysis of long image time series. Int. J. Remote Sens 2005, 26, 1551–1573. [Google Scholar]
  49. Morin, X.; Roy, J.; Sonié, L.; Chuine, I. Changes in leaf phenology of three European oak species in response to experimental climate change. New Phytol 2010, 186, 900–910. [Google Scholar]
  50. Menzel, A. Phenology: Its importance to the global change community. Clim. Chang 2002, 54, 379–385. [Google Scholar]
  51. Dose, V.; Menzel, A. Bayesian correlation between temperature and blossom onset data. Glob. Chang. Biol 2006, 12, 1451–1459. [Google Scholar]
  52. Brown, M.E.; de Beurs, K.; Vrieling, A. The response of African land surface phenology to large scale climate oscillations. Remote Sens. Environ 2010, 114, 2286–2296. [Google Scholar]
  53. O’Connor, B.; Dwyer, E.; Cawkwell, F.; Eklundh, L. Spatio-temporal patterns in vegetation start of season across the island of Ireland using the MERIS Global Vegetation Index. ISPRS J. Photogramm. Remote Sens 2012, 68, 79–94. [Google Scholar]
  54. Gutiérrez-Jurado, A.H.; Vivoni, R.E. Ecogeomorphic expressions of an aspect-controlled semiarid basin: II. Topographic and vegetation controls on solar irradiance. Ecohydrology 2013, 6, 24–37. [Google Scholar]
  55. Kattel, D.B.; Yao, T. Recent temperature trends at mountain stations on the southern slope of the central Himalayas. J. Earth Syst. Sci 2013, 122, 215–227. [Google Scholar]
  56. Moser, L.; Fonti, P.; Büntgen, U.; Esper, J.; Luterbacher, J.; Franzen, J.; Frank, D. Timing and duration of European larch growing season along altitudinal gradients in the Swiss Alps. Tree Physiol 2009, 30, 225–233. [Google Scholar]
Figure 1. Distribution of deciduous forest in Western Europe, and the phenological stations where phenological events used in this study were recorded.
Remotesensing 05 06159f1
Figure 2. Spearman’s rank correlation between point-based observations of the timing of leaf unfolding/first leaf separation of six deciduous tree species and the corresponding MODIS pixel-based satellite SOS estimates in Western Europe during the period of 2001–2011. The correlation coefficients are classified into two classes, significant or not significant, based on 5% threshold.
Remotesensing 05 06159f2
Figure 3. Spearman’s rank correlation between point-based observations of the timing of leaf unfolding/first leaf separation of six deciduous tree species, satellite SOS estimates and corresponding pixel-based spring temperature in Western Europe during the period of 2001–2011. The correlation coefficients are classified into two classes, significant or not significant, based on 5% threshold.
Remotesensing 05 06159f3
Figure 4. Shift in the timing of leaf unfolding/first leaf separation of six deciduous tree species and the corresponding MODIS pixel-based satellite SOS estimates in Western Europe during the period of 2001–2011. The results are presented as total number of days the timing of leaf unfolding/first leaves separation/satellite SOS estimates have shifted between 2001 and 2011. Negative values imply a shift to early leafing.
Remotesensing 05 06159f4
Figure 5. Trends in satellite SOS estimates of Western European deciduous forest detected between 2001 and 2011 using simple linear model. The results are presented as total number of days the SOS shifted between 2001 and 2011.Negative values imply a shift to early leafing.
Remotesensing 05 06159f5
Figure 6. Change in the annual mean air temperature and mean temperatures of different seasons detected at pixels corresponding to phenological stations in Western Europe during the period of 2001–2011 using a simple linear model. The change in temperature is expressed here as the total change in mean air temperature between 2001 and 2011. Positive values imply an increase in mean air temperature.
Remotesensing 05 06159f6
Figure 7. Change in annual mean air temperature and mean temperatures of different seasons detected over Western Europe during the period of 2001–2011 using a simple linear model. The change in temperature is expressed here as the total change in mean air temperature between 2001 and 2011. Positive values imply an increase in mean air temperature.
Remotesensing 05 06159f7

