Mapping Rural Areas with Widespread Plastic Covered Vineyards Using True Color Aerial Data

1
Politecnico di Bari, via Orabona n.4, I-70125 Bari, Italy
2
ISSIA CNR, via Amendola n. 122/D-O, I-70126 Bari, Italy
*
Author to whom correspondence should be addressed.
Remote Sens. 2012, 4(7), 1913-1928; https://doi.org/10.3390/rs4071913
Submission received: 25 April 2012
/
Revised: 24 May 2012
/
Accepted: 20 June 2012
/
Published: 27 June 2012
Abstract
:Plastic covering is used worldwide to protect crops against damaging growing conditions. This agricultural practice raises some controversial issues. While it significantly impacts on local economic vitality, plasticulture also shows several environmental affects. In the Apulia Region (Italy) the wide-spreading of artificial plastic coverings for vineyard protection has showed negative consequences on the hydrogeological balance of soils as well as on the visual quality of rural landscape. In order to monitor and manage this phenomenon, a detailed site mapping has become essential. In this study an efficient object-based classification procedure from Very High Spatial Resolution (VHSR) true color aerial data was developed on eight test areas located in the Ionian area of the Apulia Region in order to support the updating of the existing land use database aimed at plastic covered vineyard monitoring.
1. Introduction
In some parts of the Mediterranean area, vineyards represent the largest agro-ecosystem and impact on income, employment and environment [1]. As a matter of fact, the Apulia Region (Italy) shows a considerably heterogeneous and fragmented agricultural landscape caused by several environmental and anthropic dynamics. In this area, despite representing an important source of support for local economy, agricultural practices are also one of the causes contributing to soil alteration phenomena [2]. Tilman et al. provided a comprehensive review of the literature in the field of agricultural sustainability and intensive production practices [3].
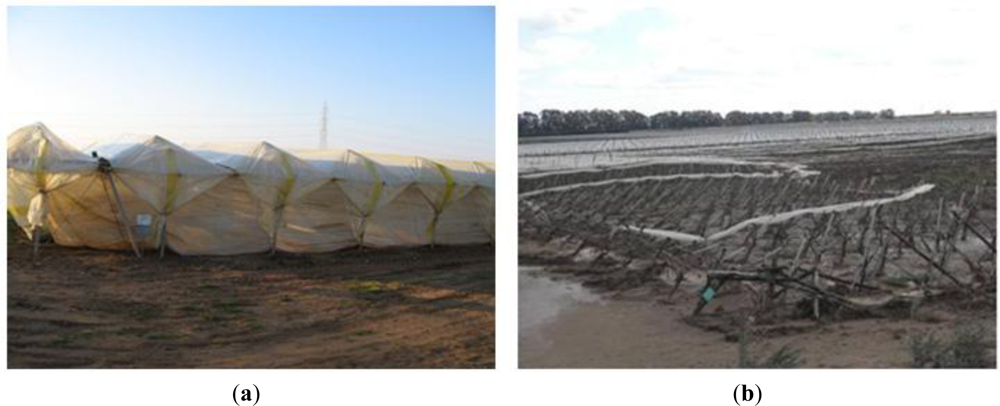
The term plasticulture [4] is used in literature to describe all kinds of plastic plant/soil coverings in agriculture practices. Such coverings range from plastic mulch film, row coverings, high and low tunnels (poly tunnels), to plastic greenhouses [5]. Considering the main agricultural activities typifying the study area, only vineyards covered with plastic sheets for advancing or postponing crop yield were included in this research (Figure 1(a)).
Plastic covering may have a deep impact on soil and groundwater as a consequence of the wide surface impermeabilization altering the condition of surface watercourses which can affect both recharge and quality of groundwaters. This kind of coverage concentrates rainfall along vineyard borders and very narrow spaces between the strips, thus precluding soil wetting and water infiltration in most of the soil below, transforming almost all precipitation in run-off (Figure 1(b)). The consequences of wide plastic covers are worsened by the climate changes recorded within the Region over the last few years, featuring high intensity rainfalls [6]. Moreover, a widespread plastic-covered vineyard affects the environmental and aesthetic quality of rural landscape and natural ecosystem [7].
It is clear that agricultural practices should be adequately monitored, by quantifying land surface characteristics such as land cover type and extent, in order to avoid a confused and uncontrolled development of rural areas and all its negative consequences. Vegetation dynamics are a key factor in quantifying and interpreting the hydrological and erosional response of the land use/covers monitored [8].
In compliancy with EU directive 2007/60/CE, in 2005 the Apulian Regional Basin Authority approved an Hydrogeological Setting Plan (PAI–Piano di Assetto Idrogeologico) identifying areas subject to major hydrogeological hazards—particularly those requiring safeguarding measures—and providing regulations and limitations for land use planning. In relation to flooding, the PAI analyses the main rivers within the basin and delimits areas where overflowing could be expected in case of high discharge events with different return times, ranking them by risk level (namely “Fasce Fluviali A, B, C” in Italian, from the highest to the lowest degree of hazard) Moreover, the Plan identifies safeguard criteria including: strict compliancy to chemical limitations for plant treatment outlets directly or indirectly delivering into the river; control of all agricultural activities through the rigorous application of the “Good Agricultural Practice Code” aimed at reducing the use of fertilizers in the river watershed; enforcement of the hydraulic police for outlets control and elimination of illicit businesses; compliancy to the “Landscape Thematic Territorial Plan”, in terms of protection of fluvial areas’ natural conditions, and to the Minimum Instream Flow index, downstream of dams, as well as control of water drawing for all agricultural uses. As shown in Figure 2, in the PAI the Ionian coastal area was identified as one of the Apulian areas subject to hydrogeological hazards and requiring safeguarding measures for land use.
Among the environmental analysis tools currently available, remote sensing techniques, applied for automatic detection and positioning of plastic-covered vineyards, allow for an accurate analysis that may be helpful in the definition of suitable policies for planning and managing agricultural practices, rural environments and natural ecosystems.
Our main research aim was to assess the accuracy of mapping plastic covered vineyards using an object-based approach based on the limited spectral resolution of true color aerial images. The potential reproducibility of the method was then verified by defining object features that could be used as reliable classification estimators if applied in similar territorial contexts. To such purpose, the areas under study were chosen in view of their similar land use patterns and topography compared to other rural areas of the Apulia region.
For the above purposes, in this study an object-based approach on true color digital aerial data was developed to detect and accurately separate the plastic covered vineyard class from other prevailing classes in the study area. The object-based image analysis was implemented in the eCognition Developer 8.64.1 software [9]. One segmentation with scale factors and variations in shape and compactness weights empirically determined was carried out, selecting parameters which produced the highest classification accuracy. Next, an optimized combination of features producing the largest average minimum distance between the training samples of different classes was implemented for the classification. In order to provide a quantitative assessment of the proposed strategy, the error matrix was employed next on final results. Lastly, results were summarized statistically to analyze quantity disagreement and allocation disagreement.
2. Plasticulture Extraction from Remote Imagery
Mapping plasticulture presents a special challenge mainly due to the spectral characteristics and variety of the agricultural plastic covers being used. Castellano et al. [10] made a comprehensive analysis of the current state-of-the-art of the structural parameters characterizing protection covers, distinguishing type of material, type and dimensions of threads, texture, mesh size, porosity/solidity and weight, as well as radiometric properties like color, transmissivity/reflectivity/shading, physical properties like air permeability, and several mechanical characteristics such as tensile stress, strength, elongation at break and durability. The roofs are generally highly reflective and often cause saturation in the visible bands. As Liu and Mason [11] emphasized, in some cases where plastic sheeting is rather new the growing vegetation inside contributes to the overall reflectance of the greenhouse, while in other cases plastic roofs appear less reflective because they are curved rather than flat.
Carvajal et al. [12] proposed a methodology to identify greenhouses from QuickBird multispectral imagery, based on an Artificial Neural Network algorithm. Arcidiacono et al. [13] developed a model to manage crop-shelter spatial expansion by GIS (Geographical Information System) analyses and an automatic image analysis procedure. Agüera et al. [14] focused on the automatic detection of greenhouse boundaries derived from classification results from QuickBird and IKONOS satellite sensors. Picuno et al. [15] analyzed rural land use by means of a pixel-based supervised classification of multi-temporal Landsat imagery, image processing, vectorialization and GIS analysis tools. Levin et al. [16] emphasized the need for hyperspectral technology, having identified three major absorption features of about 1,218 nm, 1,732 nm and 2,313 nm by means of a field spectrometer. The same authors [16] listed specific aspects characterizing plasticulture recognition, including: the need for high spatial resolution data due to the similarity of plastic covers to other man-made structures; the changing spectral properties of covers due to their seasonal use and, as plastic sheets are semi-transparent, the changing reflectance of vegetation underneath them, which may also affect the spectral signal reaching the sensor; the presence of a multitude of plastic materials which may result in different spectral signatures indicating the same kind of land use.
During the past decade, improvements in the resolution of satellite images have broadened their application in the fields of urban and rural planning, testing methods such as data fusion with aerial photos and digital terrain models (DTMs) and the integration of cartographic objects with GIS data. However, the high spatial resolution of aerial/satellite sensor data does not automatically lead to higher classification accuracy. This is due to the heterogeneity of objects within a scene which may lead to either misclassified pixels or unwanted details [17]. Even though human interpreters can naturally recognize complex patterns and individual land covers (e.g., single vineyards, bare soil parcels, orchards), traditional digital classification algorithms generally encounter serious problems, because they use spectral information (pixel values) alone while ignoring spatial information and groups of pixels that need to be considered together as a sole object [18,19]. The ability to model contextual information, including shape, textural and topological relationships among groups of pixels depending on how the object of interest may be affected by its neighbours, may reduce confusion in the classification process [20]. In many cases, image analysis leads to meaningful objects only when the image is segmented into ‘homogenous’ areas [21]. Therefore, Object Oriented Image Analysis (OBIA) is expected to extract real world objects with not only high classification accuracy but also proper shaping, which is difficult to accomplish using common Pixel Based Classification (PBC) [22]. The user-selected scale factor determines the size of each image object, whereas the parameters of shape and compactness determine the extent of spectral heterogeneity and textural characteristics. On such assumptions, OBIA is able to distinguish transformations from natural to rural land use on the basis of differences in spatial distribution and pattern of land cover forms [23]. Numerous empirical studies in many application fields [24–26] have provided sufficient evidence on the advantages of OBIA over PBC [27] but no significant research has been performed to evaluate the use of OBIA in mapping plasticulture.
3. Methodology
3.1. Study Area and Data
The study area is located within the municipalities of Ginosa, Castellaneta and Palagianello at about 20 km North West from Taranto in the Apulia Region in Southern Italy. The territory shows various landscapes mainly constituted by Karst and rich soil with moderate hills (“Murgia Tarantina”) ranging from 110 to 480 m in altitude alternated with flat territory close to the Ionian Sea. The Mediterranean semi-arid climate (annual mean air temperature 16.28 °C, total annual precipitation 555 mm), characterized by hot and dry summers and moderately cold and rainy winter seasons, facilitates agriculture as the main productive activity. Vineyards, citruses, olives, stone fruits and summer vegetables are the most diffused cultivations in this area.
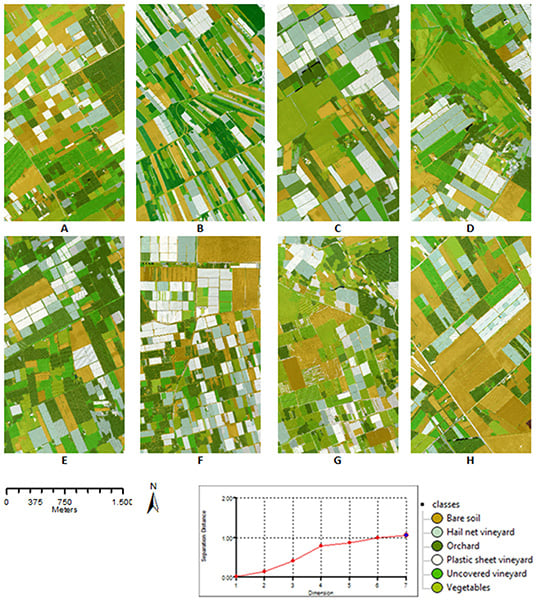
To obtain an efficient identification of plastic covered vineyard types widespread within the Ionian coast, eight 4-km2 areas including the most common types of plastic sheets covers (objects with regular shapes, various sizes and heterogeneous materials of roofs with close vegetation) were studied (Figure 3). In order to examine the transferability of the method from one data set to another, the test sites were deliberately chosen in view of their similar land use patterns and topography compared to other rural areas of the Apulia region (as for example the territory of Rutigliano, South from Bari).
The analysis was conducted on digital true color aerial data characterized by a Ground Sample Distance (GSD) of 20 cm. Data were recorded on 18 August 2006 using an Intergraph®’s Z/I Imaging® Digital Mapping Camera (DMC®) Z. A detailed description of the sensor may be found in Hinz et al. [28]. The imagery was orthorectified according to the WGS 84/UTM Zone 33N Coordinate Reference System (Table 1) and provided by the regional cartographic office of Apulia. The very high spatial resolution RGB imagery on which the proposed approach was based allowed an explicit distinction of rural patterns, simulating the working processes of rapid map production. Moreover, the acquisition date of the imagery processed in this work allowed to evaluate the potential of such historic data and their suitability to before- or after-flooding monitoring. National coverage true color aerial digital data sets with excellent spatial detail are routinely produced, such as every one or two years, for many countries [29]. In multi-temporal analysis they can also be compared with scanned historic aerial photography data for assessing and predicting change based on long-term trends [30]. Moreover, such data were also chosen to facilitate possible change detection analysis with comparable very high spatial resolution satellite (VHSR) data, with the intent of identifying the potential spread of the agricultural practice under study.
Vector data, i.e., 30 training samples (5 for each class) and 120 ground truth samples (20 for each class), were derived for each single image scene by means of visual interpretation based on the 2006 Topographic Map (scale of 1:5,000) which includes detailed land use information available in shapefile format and on site documentation collected in April and July 2011.
3.2. Image Segmentation
Image segmentation allows to separate the image into homogeneous areas that may be aggregated to generate meaningful image object primitives with homogeneous color or spectral behaviour, similar texture and shape [31], serving as best information for further classification or subsequent segmentation processes. Due to the geometric regularity of vineyard parcels (mainly rectangular) in the study area and in order to obtain optimal raw material for image analysis, the following aims were defined at the first phase of the procedure:
- - The segmentation procedure should produce highly homogeneous segments for the visual separation and representation of image regions;
- - Since objects are typically represented on different scales in an image simultaneously, the extraction of meaningful image objects should take into account the scale of the problem to be solved [32].
The choice of parameters are dependent on the type of data, study area and land cover, which gives the segmentation black box characteristics [33]. While this segmentation algorithm allows multiple user defined scales within a relational object hierarchy, only one scale parameter was selected for this research, because we mainly focused on spatial and spectral content of plasticulture land cover.
The preliminary analysis was conducted by visual inspection, which is a common practice in segmentation parameter selection [22,34]. The higher number of scale (e.g., 300) generates larger homogeneous objects (similar to a smaller cartographic or mapping scale), whereas the smaller number of scale (e.g., 100) will lead to smaller objects (larger scale). This is a spatially aggregated scale (more similar pixels or bigger objects vs. less similar pixels or smaller objects). The decision on the level of scale depends on the size of object required to achieve the goal [35].
For these purposes, three different scales (100, 200 and 300) of image segmentation were tested (Figure 4). The following values were consequently established to be appropriate for the best extraction of vineyard object primitives:
The shape parameter wshape was set to 0.5 to balance shape and spectrally homogeneous pixels equally for image segmentation. The compactness parameter wcompactness was set at 0.8 to pay more attention to object compactness and less to smoothness.
As shown in Figure 4, with these parameters the segmentation results well fitted the information class extraction, identifying vineyard edges with good precision.
3.3. Classification Procedure
In order to identify the best parameters useful for classification the eCognition software provides a data mining functionality called Feature Space Optimization (FSO). This tool is an algorithm that compares the features of the selected classes finding the combination of features that produces the largest average minimum distance between the training samples of different classes [9]. In this paper, the term “feature” describes spectral (image bands, band ratios), geometrical (area, compactness, etc.), contextual (difference to neighbor), and textural properties in an OBIA context [36]. For the samples, object statistics of the optimized feature space are calculated, which are then used for classifying all image objects based on their nearest sample neighbours (Nearest Neighbour (NN) classification). In this case the same set of features is applied to all classes (Standard Nearest Neighbour). As in data mining techniques, no correlation is assumed between the input variables. Also, the more the number of variables used, the longer the processing time required for data mining [31].
After segmenting the image into primitive objects, six classes were created: bare soil, orchard, vegetables, plastic sheet vineyard, hail net vineyard, uncovered vineyard. Five training samples for each class uniformly distributed on the aerial data were collected.
In the first phase of the study we explored spectral, geometrical and textural image data characteristics. Such analysis is functional to the preliminary selection of the most representative features based on the layer values in the Nearest Neighbor Feature Space.
Useful spectral information on vegetation can be obtained from the RGB images by means of image transformations and band ratios [37,38]. In the first step, to verify whether spectral information based on a single pixel alone is effective in rural areas with widespread plastic covered vineyards, we used spectra of the six selected classes from ten randomly selected target points (mean DN values of the selected classes in all three RGB bands) to check they could be accurately discriminated.
The target materials of the six classes that we selected were the same as the original land-cover categories used in the object-based classification. Figure 5 shows preliminary spectral analysis executed on 10 random target points taken for each rural land-cover class in the study area. We observed that there were some spectra overlaps among the selected classes, mainly due to surfaces covered by vegetation (orchards, vegetables, uncovered vineyards).
Previous studies [16] found that the best spectral feature for plastic mapping is around 1,732 nm as it does not coincide with spectral features of other materials like minerals, soils, vegetation, etc. In our case, lacking near or medium infrared information and aiming at fully benefiting from available data spectral capabilities, the Visible Atmospherically Resistant Index (VARI) [39] was found as best representative to discriminate vegetation classes from plastic sheet ones among indices entirely based on the visible part of the spectrum:
Based on the work of Kaufman and Tanre [40] and in contrast to the Normalized Difference Vegetation Index (NDVI) [41], which is sensitive to changes for small vegetation fractions and insensitive to changes for moderate and high vegetation fractions, the VARI shows a linear response to vegetation fractioning throughout the entire range with an estimated error of less than 1.
We started the analysis based on FSO including 20 features, emphasizing the spectral, shape and texture components of objects within the 8 test areas. For this purpose, a subset of samples (3 objects for class) was collected in order to be used in the FSO procedure. Finally, the above data mining system selected the following features as the most suitable for separating classes during the classification stage: VARI, Ratio Layer 3, StdDev. Layer 2, StdDev. Layer 3, GLCM Ang. 2nd moment Layer 1, Density, Rectangular fit [9]. In general few features with maximum separability are sufficient for classification, especially if the classification model is to be applied to other image data. For transferability purposes, it is wise to keep the number of features low [42] without the creation of rules strictly related to a single test area within a specific territorial context by means of rigid thresholds.
4. Results
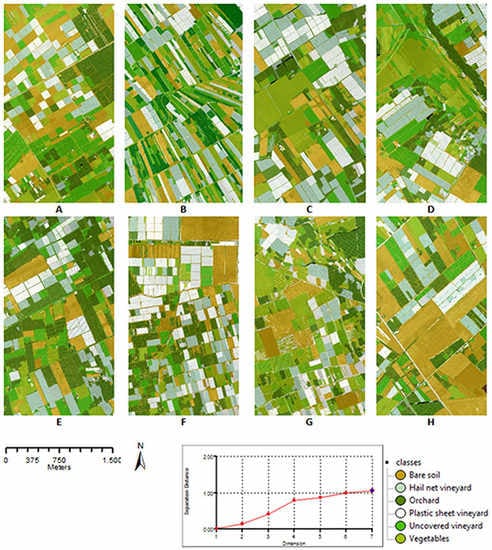
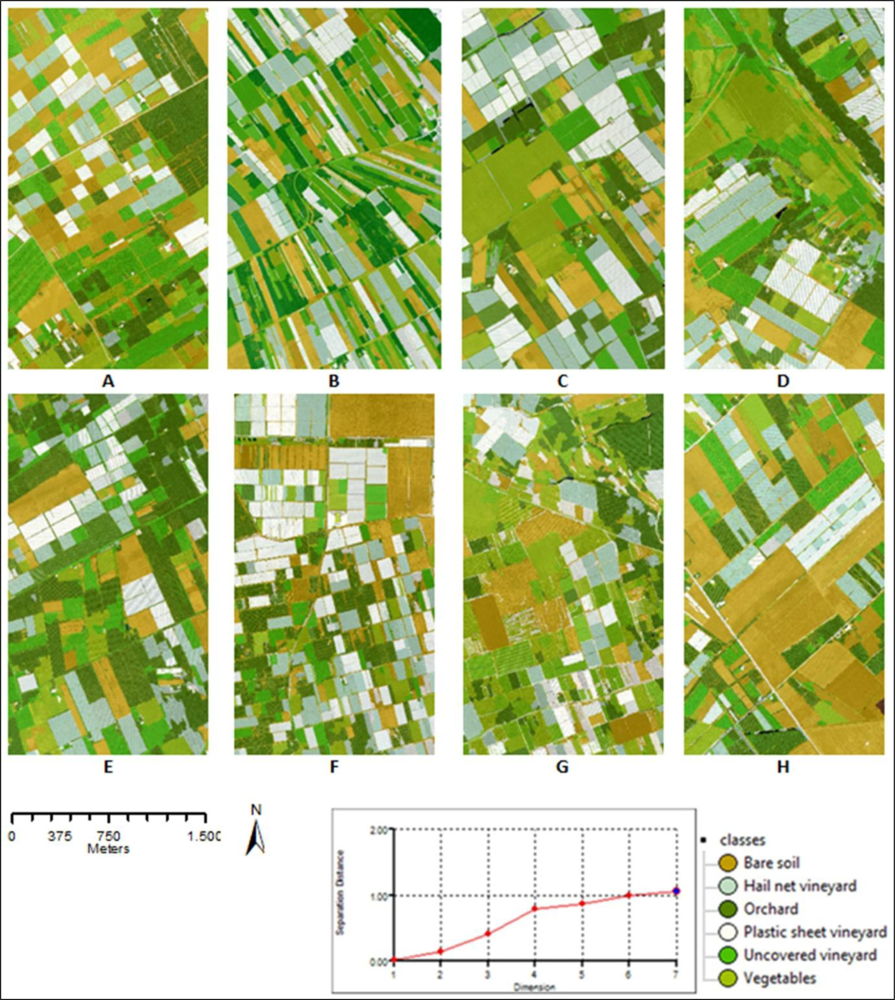
The features selected with the FSO tool are shown in Table 2. Overall, spectral features are more likely to be selected than geometric or textural features. Figure 6 shows the classification results for the eight scenes.
The accuracy assessment of classification results was performed using reference mask images created from visual interpretation and on site documentation. Ground truth locations (20 sample objects for each class, out of all 120 land-cover polygons for each image scene) were randomly covered deriving information by means of visual interpretation based on the 2006 Topographic Map (scale of 1:5,000) provided by the regional cartographic office of Apulia and on site documentation collected in April and July 2011. According to the information gathered from local growers, the agricultural practice of plasticulture did not change between the aerial data acquisition and the on-site surveys.
The error matrix based on objects describing the patterns of mapped classes for the reference data was generated to compare reference information with the 8 classified maps [43]. Table 3 summarizes results related to User’s and Producer’s accuracies for each class of the classification carried out through the FSO tool.
The total accuracy of the classification implemented through Standard Nearest Neighbour classifier with features selected through separability analysis was 90.25%. The plastic sheet vineyard class (here in boldface) was found to have the best classification results.
Results were subsequently summarized statistically to analyse quantity disagreement and allocation disagreement [43].
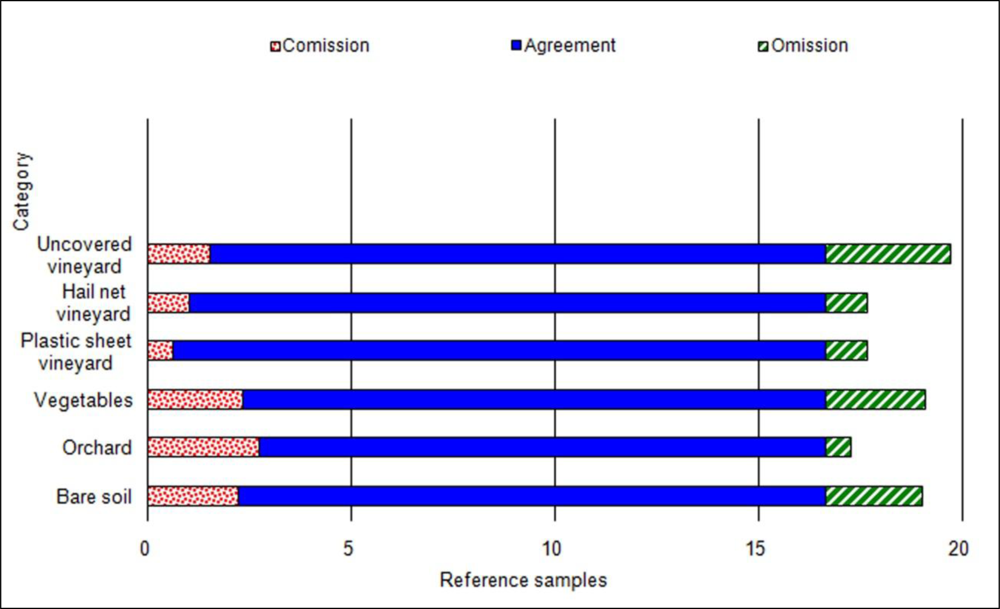
Quantity disagreement is the amount of the difference between the reference information and a map that is due to the less perfect match in the proportions of the categories. The remaining disagreement is allocation disagreement [43]. Figures 7 shows agreement, omission disagreement and commission disagreement by object category summarizing the results obtained for each of the 8 maps.
Agreement for category X is where both the reference information and the map indicate category X. Omission disagreement for category X is where the reference information indicates category X, while the map shows a different category. Commission disagreement for category X is where the map shows category X, but the reference information indicates a different category. Consequently, omission for one category is commission for a different category. If the commission disagreement is greater than the omission disagreement for a particular category, the mapped points show more of that category than the reference points. In this case in all the 8 maps the quantity of orchard was overestimated. Plastic sheet vineyard and hail net vineyard showed the best results among the classes.
The method presented in this study only showed some limitations in terms of under-segmented plots, misclassified objects and missing detections [43].
Cases of under-segmentation, which consists in grouping neighbourhood pixels belonging to different plots with very similar characteristics, can be considered as a side effect of generally poor accuracy in plot edge definition. This poor accuracy is inherent to any segmentation method. For this reason, further research using a different segmentation algorithm or a combination of subsequent segmentation algorithms may give better classification results. An alternative solution could be based on individual plastic-covered vineyard analysis to overcome the poor accuracy of plot edge shaping, although such approach would lose in quickness in the analysis of wide areas.
Cases of misclassified objects are more problematic for two kinds of reasons. The transparency of some plastic sheets causes confusion between green areas and plastic-covered vineyards. In some cases it was not possible to find any features that would perform a clear distinction between plastic sheet vineyards and hail net vineyards. Thus, for misclassified objects and also to solve the vineyards missing detection problem, the use of a combination of contemporary images from different sources could be a further step in improving information extraction.
There are a number of different types of plastic sheets used for covering vineyards available to suit different situations and agricultural requirements. In order to evaluate the effects of artificial coverings on rainfall infiltration changing, further studying based on the identification of the various materials used in vineyard covering through remotely-sensed images seems necessary.
Finally, Feature Space Optimization requires training samples for land use classification, thus prior area knowledge is necessary. The lack of local knowledge or the inability to perform surveys can be a significant limitation to the method.
5. Conclusions
In this paper an object-based classification based on a stepwise approach was proposed.
In order to examine the transferability of the method from one data set to another, the 8 test sites in this study were chosen in view of their similar land use patterns and topography compared to other rural areas of the Apulia region. The method ensures spatial-temporal reproducibility and offers a significant advantage in using largely available image datasets.
The method proved its efficiency in mapping areas with widespread plastic-covered vineyards showing an overall accuracy of 90.25% Best classification results were found on the eight study areas for the plastic sheet vineyard class both in term of User’s-Producer’s accuracies and agreement between the reference data objects and the classified maps.
Based on the above results, it can be safely concluded that the employment of the Feature Space Optimization tool provided the best features combination, based on training samples, for land cover classification and plastic-covered vineyards extraction, without setting thresholds. Thanks to the object-oriented approach and thorough a preliminary segmentation process, vineyards are directly available in a polygonal form. Moreover, potentially vulnerable areas suffering from the impact of the agro-ecosystem natural cycles produced by large plastic coverings can also be readily and critically analysed through GIS.
Future work should focus on testing the transferability of the proposed rule-set in different Mediterranean study sites, in order to draw further conclusions on its potential operational use.
References
- Raclot, D.; Le Bissonnais, Y.; Louchart, X.; Andrieux, P.; Moussa, R.; Voltz, M. Soil tillage and scale effects on erosion from fields to catchment in a Mediterranean vineyard area. Agr. Ecosyst. Environ 2009, 134, 201–210. [Google Scholar]
- Karydas, C.G.; Sekuloska, T.; Silleos, G.N. Quantification and site-specification of the support practice factor when mapping soil erosion risk associated with olive plantations in the Mediterranean island of Crete. Environ. Monit. Assess 2009, 149, 19–28. [Google Scholar]
- Tilman, D.; Cassman, K.G.; Matson, P.A.; Naylor, R.; Polasky, S. Agricultural sustainability and intensive production practices. Nature 2002, 418, 671–677. [Google Scholar]
- Lamont, W.J., Jr. What are the components of a plasticulture vegetable system? HortTechnology 1996, 6, 150–154. [Google Scholar]
- Espi, E.; Salmeron, A.; Fontecha, A.; García, Y.; Real, A. Plastic films for agricultural applications. J. Plast. Film Sheeting 2006, 22, 85–102. [Google Scholar]
- Canora, F.; Fidelibus, M.D.; Sciortino, A.; Spilotro, G. Variation of infiltration rate through karstic surfaces due to land use changes: A case study in Murgia (SE-Italy). Eng. Geol 2008, 99, 210–227. [Google Scholar]
- Kristensen, L.S.; Thenail, C.; Kristensen, S.P. Landscape changes in agrarian landscapes in the 1990s: The interaction between farmers and the farmed landscape. A case study from Jutland, Denmark. J. Environ. Manage 2004, 71, 231–244. [Google Scholar]
- Nunes, A.N.; De Almeida, A.C.; Coelho, C.O.A. Impacts of land use and cover type on runoff and soil erosion in a marginal area of Portugal. Appl. Geogr 2011, 31, 687–699. [Google Scholar]
- Trimble, Ecognition Developer 8.64.1 Release Notes; Trimble GmbH: Munich, Germany, 2011.
- Castellano, S.; Scarascia Mugnozza, G.; Russo, G.; Briassoulis, D.; Mistriotis, A.; Hemming, S.; Waaijenberg, D. Plastic nets in agriculture: A general review of types and applications. Appl. Eng. Agric 2008, 24, 799–808. [Google Scholar]
- Liu, J.G.; Mason, P. Essential Image Processing and GIS for Remote Sensing; Wiley: Hoboken, NJ, USA; p. 2009.
- Carvajal, F.; Crizanto, E.; Aguilar, F.; AGU ERA, F.; Aguilar, M. Greenhouses detection using an artificial neural network with a very high resolution satellite image. Int. Arch. Photogramm. Remote Sens. Spat. Inf. Sci 2006, 36, 37–42. [Google Scholar]
- Arcidiacono, C.; Porto, S. A model to manage crop-shelter spatial development by multi-temporal coverage analysis and spatial indicators. Biosyst. Eng 2010, 107, 107–122. [Google Scholar]
- Agüera, F.; Liu, J. Automatic greenhouse delineation from QuickBird and Ikonos satellite images. Comput. Electron. Agric 2009, 66, 191–200. [Google Scholar]
- Picuno, P.; Tortora, A.; Capobianco, R.L. Analysis of plasticulture landscapes in Southern Italy through remote sensing and solid modelling techniques. Landscape Urban Plan 2011, 100, 45–56. [Google Scholar]
- Levin, N.; Lugassi, R.; Ramon, U.; Braun, O.; Ben-Dor, E. Remote sensing as a tool for monitoring plasticulture in agricultural landscapes. Int. J. Remote Sens 2007, 28, 183–202. [Google Scholar]
- Caprioli, M.; Tarantino, E. Accuracy assessment of per-field classification integrating very fine spatial resolution satellite imagery with topographic data. J. Geospatial Eng 2001, 3, 127–134. [Google Scholar]
- Tarantino, E. Land Cover Classification of QuickBird Multispectral Data with an Object-Oriented Approach. In Management Information Systems 2004: Incorporating GIS and Remote Sensing; Brebbia, C.A., Ed.; WIT Press: Billerica, MA, USA, 2004; Volume 8, pp. 125–134. [Google Scholar]
- Walter, V. Object-based classification of remote sensing data for change detection. ISPRS J. Photogramm 2004, 58, 225–238. [Google Scholar]
- Tso, B.; Mather, P.M. Classification Methods for Remotely Sensed Data; CRC Press: Boca Raton, FL, USA, 2009. [Google Scholar]
- Baatz, M.; Schäpe, A. Multiresolution Segmentation: An Optimization Approach for High Quality Multi-Scale Image Segmentation. In Angewandte Geographische Informationsverarbeitung XII. Beiträge zum AGIT-Symposium Salzburg 2000; Strobl, J, Ed.; Herbert Wichmann Verlag: Karlsruhe, Germany, 2000; pp. 12–23. [Google Scholar]
- Benz, U.C.; Hofmann, P.; Willhauck, G.; Lingenfelder, I.; Heynen, M. Multi-resolution, object-oriented fuzzy analysis of remote sensing data for GIS-ready information. ISPRS J. Photogramm 2004, 58, 239–258. [Google Scholar]
- Caprioli, M.; Tarantino, E. Identification of Land Cover Alterations in the Alta Murgia National Park (Italy) with VHR Satellite Imagery. Int. J. Sustain. Dev. Plan 2006, 1, 261–270. [Google Scholar]
- Hofmann, P.; Strobl, J.; Nazarkulova, A. Mapping green spaces in Bishkek—How reliable can spatial analysis be? Remote Sens 2011, 3, 1088–1103. [Google Scholar]
- Jones, D.; Pike, S.; Thomas, M.; Murphy, D. Object-based image analysis for detection of Japanese knotweed sl taxa (polygonaceae) in Wales (UK). Remote Sens 2011, 3, 319–342. [Google Scholar]
- Polychronaki, A.; Gitas, I.Z. Burned area mapping in greece using SPOT-4 HRVIR images and object-based image analysis. Remote Sens 2012, 4, 424–438. [Google Scholar]
- Blaschke, T. Object based image analysis for remote sensing. ISPRS J. Photogramm 2010, 65, 2–16. [Google Scholar]
- Hinz, A.; Heier, H. The Z/I imaging digital camera system. Photogramm. Rec 2000, 16, 929–936. [Google Scholar]
- Groom, G.; Mücher, C.; Ihse, M.; Wrbka, T. Remote sensing in landscape ecology: Experiences and perspectives in a European context. Landscape Ecol 2006, 21, 391–408. [Google Scholar]
- Okeke, F.; Karnieli, A. Methods for fuzzy classification and accuracy assessment of historical aerial photographs for vegetation change analyses. Part I: Algorithm development. Int. J. Remote Sens 2006, 27, 153–176. [Google Scholar]
- Navulur, K. Multispectral Image Analysis Using the Object-Oriented Paradigm; CRC Press: Boca Raton, FL, USA, 2006. [Google Scholar]
- Hay, G.J.; Blaschke, T.; Marceau, D.J.; Bouchard, A. A comparison of three image-object methods for the multiscale analysis of landscape structure. ISPRS J. Photogramm 2003, 57, 327–345. [Google Scholar]
- Gao, Y.; Kerle, N.; Mas, J.F. Object-based image analysis for coal fire-related land cover mapping in coal mining areas. Geocarto Int 2009, 24, 25–36. [Google Scholar]
- Pal, N.R.; Pal, S.K. A review on image segmentation techniques. Pattern Recog 1993, 26, 1277–1294. [Google Scholar]
- Myint, S.W.; Gober, P.; Brazel, A.; Grossman-Clarke, S.; Weng, Q. Per-pixel vs. object-based classification of urban land cover extraction using high spatial resolution imagery. Remote Sens. Environ 2011, 115, 1145–1161. [Google Scholar]
- Laliberte, A.; Browning, D.; Rango, A. A comparison of three feature selection methods for object-based classification of sub-decimeter resolution UltraCam-L imagery. Int. J. Appl. Earth. Obs. Geoinf 2011, 15, 70–78. [Google Scholar]
- Tarantino, E.; Figorito, B. Extracting buildings from true color stereo aerial images using a decision making strategy. Remote Sens 2011, 3, 1553–1567. [Google Scholar]
- Sibiryakov, A. House Detection from Aerial Color Images; Internal Report; Institute of Geodesy and Photogrammetry: Mandelbachtal, Germany, 1996. [Google Scholar]
- Gitelson, A.A.; Kaufman, Y.J.; Stark, R.; Rundquist, D. Novel algorithms for remote estimation of vegetation fraction. Remote Sens. Environ 2002, 80, 76–87. [Google Scholar]
- Kaufman, Y.J.; Tanre, D. Atmospherically resistant vegetation index (ARVI) for EOS-MODIS. IEEE Trans. Geosci. Remote Sens 1992, 30, 261–270. [Google Scholar]
- Rouse, J.; Haas, R.; Schell, J.; Deering, D. Monitoring vegetation systems in the Great Plains with ERTS. Proceedings of the Third ERTS Symposium, Washington, WA, USA, 10–14 December 1973; NASA SP-351. NASA: Washington, WA, USA, 1973; 1, pp. 309–317. [Google Scholar]
- Nussbaum, S.; Niemeyer, I.; Canty, M. SEATH—A New Tool for Automated Feature Extraction in the Context of Object-Based Image Analysis. Proceedings of 1st International Conference on Object-Based Image Analysis (OBIA 2006), Salzburg, Austria, 4–5 July 2006.
- Delenne, C.; Durrieu, S.; Rabatel, G.; Deshayes, M. A Local Fourier Transform Approach for Vine Plot Extraction from Aerial Images. In Object-Based Image Analysis; Blaschke, T., Lang, S., Hay, G.J., Eds.; Springer-Verlag: Berlin, Germany, 2008; pp. 443–456. [Google Scholar]
Figure 1.
(a) Typical plastic-covered vineyard in the Ionian area of the Apulia Region; (b) Floods effects on vineyards.
Figure 1.
(a) Typical plastic-covered vineyard in the Ionian area of the Apulia Region; (b) Floods effects on vineyards.

Figure 2.
Ionian coastal areas requiring safeguarding measures according to the Hydrogeological Setting Plan (PAI).
Figure 2.
Ionian coastal areas requiring safeguarding measures according to the Hydrogeological Setting Plan (PAI).
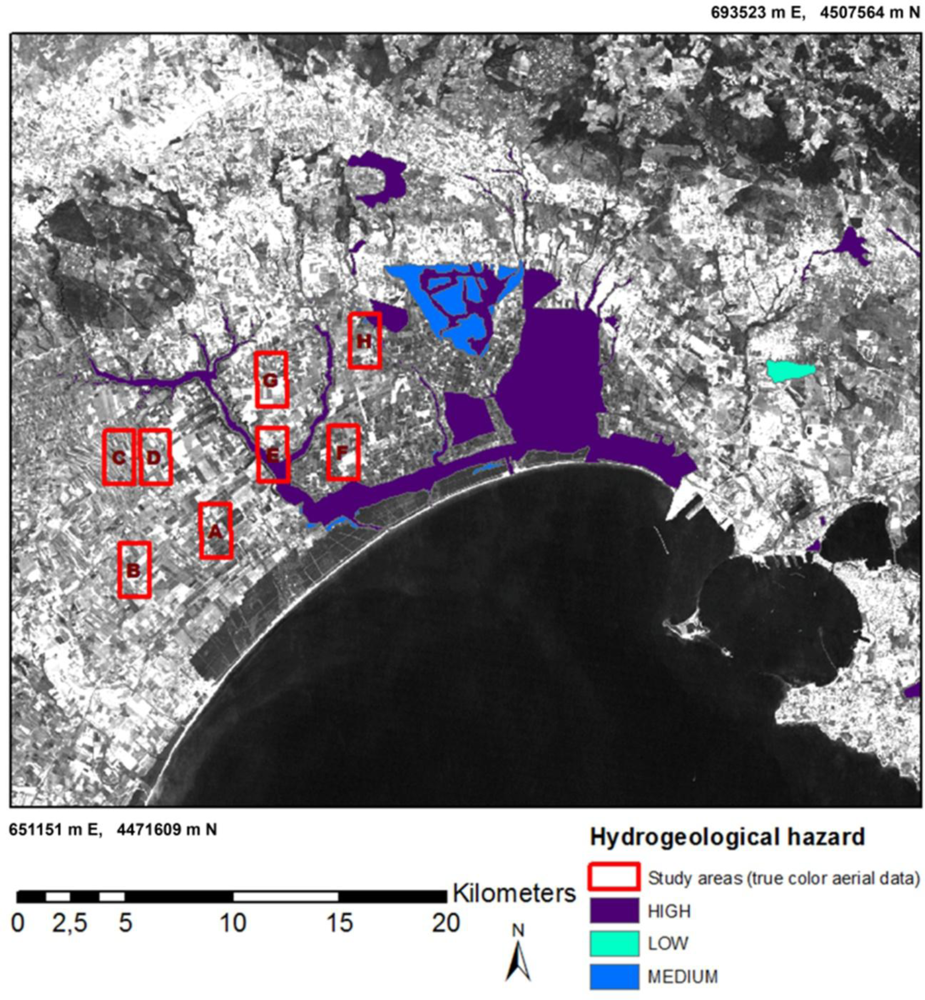
Figure 3.
The 8 study areas with the widespread use of plastic sheet vineyards (grey/silver) as shown by the true-color aerial data.
Figure 3.
The 8 study areas with the widespread use of plastic sheet vineyards (grey/silver) as shown by the true-color aerial data.

Figure 4.
Examples of segmentation results on a subset data belonging to study area F with Scale parameters of 100, 200 and 300.
Figure 4.
Examples of segmentation results on a subset data belonging to study area F with Scale parameters of 100, 200 and 300.

Figure 5.
Spectral profiles based on the Red, Green and Blue bands of 10 random target points. Each line represents a random point for the respective rural land-cover classes used in the object-based classification.
Figure 5.
Spectral profiles based on the Red, Green and Blue bands of 10 random target points. Each line represents a random point for the respective rural land-cover classes used in the object-based classification.
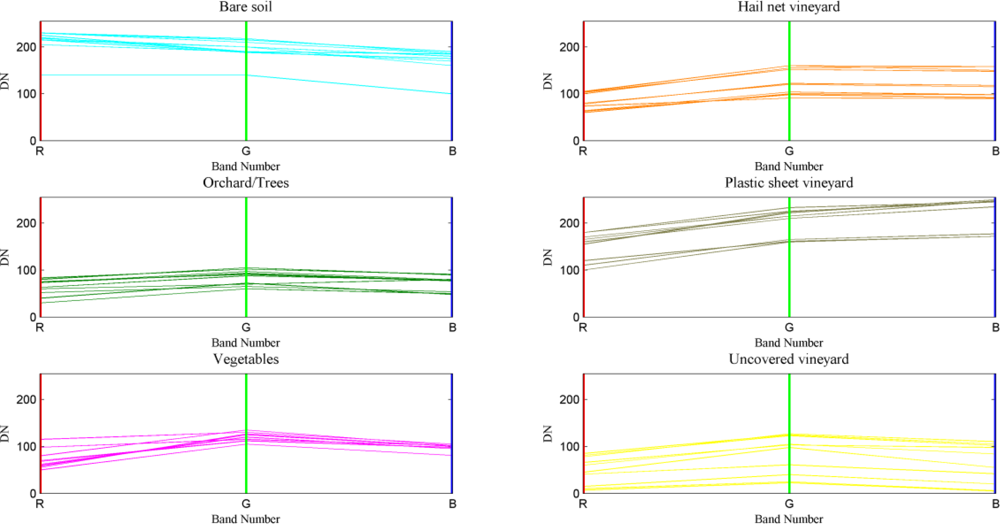
Figure 6.
Classification results based on 7 features with maximum separation distance of 1.06 within the FSO tool.
Figure 6.
Classification results based on 7 features with maximum separation distance of 1.06 within the FSO tool.

Figure 7.
Total disagreement between the reference data objects (960 polygons) and the 8 classified maps.
Figure 7.
Total disagreement between the reference data objects (960 polygons) and the 8 classified maps.


| ID Study Area | ID Frame | EST | NORD |
|---|---|---|---|
| A | B047_30 | 660679 | 4484457 |
| B | B046_24 | 656189 | 4487862 |
| C | B049_24 | 657840 | 4487862 |
| D | B049_27 | 663339 | 4487990 |
| E | B049_37 | 666638 | 4488074 |
| F | B049_43 | 663267 | 4491482 |
| G | B058_38 | 667646 | 4493305 |
| H | B049_45 | 656867 | 4482635 |
Table 2.
Features resulted using the Feature Space Optimization (FSO) procedure from 20 input features related to the spectral, shape and texture components of objects within the 8 test areas.
| Features | Description | ||
|---|---|---|---|
| Computed features based on spectral information | VARI | (Green − Red) /(Green + Red − Blue) | |
| Spectral information | Ratio Layer 3 (Red) | Amount of the image layer 3 contribution to the total brightness. | |
| StdDev. Layer 2 (Green) | Calculated from the image layer 2 intensity values of all pixel forming an image object. | ||
| StdDev. Layer 3 (Red) | Calculated from the image layer 3 intensity values of all pixel forming an image object. | ||
| Texure (after Haralick) | GLCM Ang. 2nd moment Layer1 (Blue) |
| |
| Generic shape features | Density | Number of pixels forming the image object divided by its approximated radius, based on the covariance matrix. | |
| Rectangular fit | Ratio of the area inside the fitting equi-areal rectangle divided by the area of the object outside the rectangle. | ||
Table 3.
User’s (U) and Producer’s (P) accuracies of land cover classification based on the Standard Nearest Neighbour classifier with features selected through separability analysis (Feature Space Optimization).
| Classification for each study area | Reference | |||||||||||||||
|---|---|---|---|---|---|---|---|---|---|---|---|---|---|---|---|---|
| A | B | C | D | E | F | G | H | |||||||||
| U (%) | P (%) | U (%) | P (%) | U (%) | P (%) | U (%) | P (%) | U (%) | P (%) | U (%) | P (%) | U (%) | P (%) | U (%) | P (%) | |
| Bare soil | 80 | 88 | 70 | 100 | 95 | 90 | 80 | 100 | 85 | 77 | 100 | 80 | 85 | 90 | 85 | 77 |
| Orchard | 80 | 100 | 85 | 100 | 85 | 100 | 90 | 95 | 90 | 95 | 80 | 100 | 90 | 100 | 80 | 80 |
| Vegetables | 85 | 70 | 100 | 80 | 80 | 88 | 90 | 86 | 85 | 91 | 85 | 100 | 100 | 100 | 70 | 74 |
| Plastic sheet vineyard | 90 | 100 | 100 | 95 | 100 | 95 | 100 | 100 | 100 | 91 | 90 | 100 | 100 | 83 | 90 | 90 |
| Hail net vineyard | 100 | 90 | 95 | 100 | 95 | 95 | 100 | 100 | 90 | 100 | 100 | 91 | 80 | 100 | 90 | 90 |
| Uncovered vineyard | 100 | 90 | 100 | 83 | 95 | 83 | 95 | 79 | 75 | 75 | 100 | 91 | 90 | 90 | 75 | 79 |
| Overall Accuracy (%) | 89 | 92 | 93 | 93 | 88 | 93 | 91 | 83 | ||||||||
| Total Accuracy (%) = 90.25 | ||||||||||||||||
Share and Cite
MDPI and ACS Style
Tarantino, E.; Figorito, B. Mapping Rural Areas with Widespread Plastic Covered Vineyards Using True Color Aerial Data. Remote Sens. 2012, 4, 1913-1928. https://doi.org/10.3390/rs4071913
AMA Style
Tarantino E, Figorito B. Mapping Rural Areas with Widespread Plastic Covered Vineyards Using True Color Aerial Data. Remote Sensing. 2012; 4(7):1913-1928. https://doi.org/10.3390/rs4071913
Chicago/Turabian StyleTarantino, Eufemia, and Benedetto Figorito. 2012. "Mapping Rural Areas with Widespread Plastic Covered Vineyards Using True Color Aerial Data" Remote Sensing 4, no. 7: 1913-1928. https://doi.org/10.3390/rs4071913