Article

Building Extraction from High Resolution Space Images in High Density Residential Areas in the Great Cairo Region

by
Ibrahim F. Shaker
1,
Amr Abd-Elrahman
2,*,
Ahmed K. Abdel-Gawad
3 and
Mohamed A. Sherief
4
1
Department of Public Works, Faculty of Engineering, Ain Shams University, Cairo, Egypt
2
School of Forest Resources and Conservation, University of Florida, Plant City, FL 33563, USA
3
Engineering Research Division, National Research Center, Cairo, Egypt
4
ESRI North East Africa, Cairo, Egypt
*
Author to whom correspondence should be addressed.
Remote Sens. 2011, 3(4), 781-791; https://doi.org/10.3390/rs3040781
Submission received: 10 February 2011 / Revised: 22 March 2011 / Accepted: 31 March 2011 / Published: 12 April 2011

Abstract

:
This study evaluates a methodology for using IKONOS stereo imagery to determine the height and position of buildings in dense residential areas. The method was tested on three selected sites in an area of 8.5 km long by 7 km wide and covered by two overlapping (97% overlap) IKONOS images. The images were oriented using rational function models in addition to ground control points. Buildings were identified using an algorithm that utilized the Digital Surface Model (DSM) extracted from the images in addition to the image spectral properties. A digital terrain model was used with the DSM created from the IKONOS stereo imagery to compute building heights. Positional accuracy and building heights were evaluated using corner coordinates extracted from topographic maps and surveyed building heights. The results showed that the average building detection percentage for the test area was 82.6% with an average missing factor of 0.16. When the image rational polynomial coefficients were used to build the image model, results showed a horizontal accuracy of 2.42 and 2.39 m Root Mean Square Error (RMSE) for the easting and northing coordinates, respectively. When ground control points were used, the results improved to the sub-meter level. Differences between building heights extracted from the image model and the corresponding heights obtained through traditional ground surveying had a RMSE of 1.05 m.

1. Introduction

Building extraction from high resolution satellite imagery has been an active research topic for the last two decades. Particularly, the extraction of three-dimensional (3D) building information from high resolution imagery using aerial photos [1], high resolution satellite images [2,3,4], and combined LiDAR and aerial image data [5,6,7] has been popular. Due to their high resolution, panchromatic aerial images have been used as a single data source [8,9]. The methods used in these studies involved algorithms for edge detection, line extraction, and building construction from primitive features. However, building detection techniques utilizing aerial images have generally suffered due to low temporal resolution and the high cost of image acquisition missions.
High resolution satellite images such as IKONOS, QuickBird, and GeoEye provide the needed high temporal resolution lacking in aerial image acquisition missions. Fraser et al. [10] compared buildings extracted from IKONOS imagery with those obtained using black and white aerial photographs. Thomas et al. [11] concluded that high-resolution imagery is a valuable tool for mapping urban areas and extracting land cover information. Sohn and Dowman [12] proposed an automatic method of extracting buildings in densely urban areas from IKONOS imagery. They detected detached buildings, however, accuracy was lacking. Others have developed algorithms utilizing feature optimization, linking edge chain, and graph matching algorithms (e.g., [13,14,15,16]) to construct objects from feature primitives. Building extraction algorithms solely based on high-resolution satellite imagery demonstrate the need for auxiliary data sources, especially those involving 3D information about the scene.
The advent of LiDAR data has opened a new phase of building detection and city surface modeling research. LiDAR provides point clouds that significantly improve the accuracy of building detection [17,18] and highlight the importance of surface information on the building modeling and extraction process. Although the results obtained using LiDAR data are promising, it is still expensive and needs significant editing and computing power. This makes generating Digital Surface Models (DSM) from high resolution satellite imagery a cost effective alternative.
Ridley et al. [19] evaluated the potential for generating a national mapping database of maximum building heights using DSM extracted from 1 m aerial imagery. Satellite imagery based on combining supervised shape classification with unsupervised image segmentation was presented by [20]. This approach utilized a threshold segmentation technique that has been modified to identify specific shapes on which it has been trained to recognize. Croioru and Doytsher [21] presented a model-based building extraction technique that relied on the detection of building corners. Buildings were detected using pose clustering, a voting technique where right-angle corners are used as voting elements. The voting process was constrained by detection errors in shadowed regions.
In this research, we developed a method for automatic building extraction that is contingent upon image classification and a digital surface model extracted from IKONOS stereo imagery. We tested the developed method in high residential density areas that differ in building material, proximity, and orientation. We examined the accuracy of the automatically extracted building heights against corresponding heights acquired using ground surveying techniques. Our method shows a great potential for use in applications involving 3D city modeling such as the detection of elevation violations in aviation flying zones or medium-scale map updating.

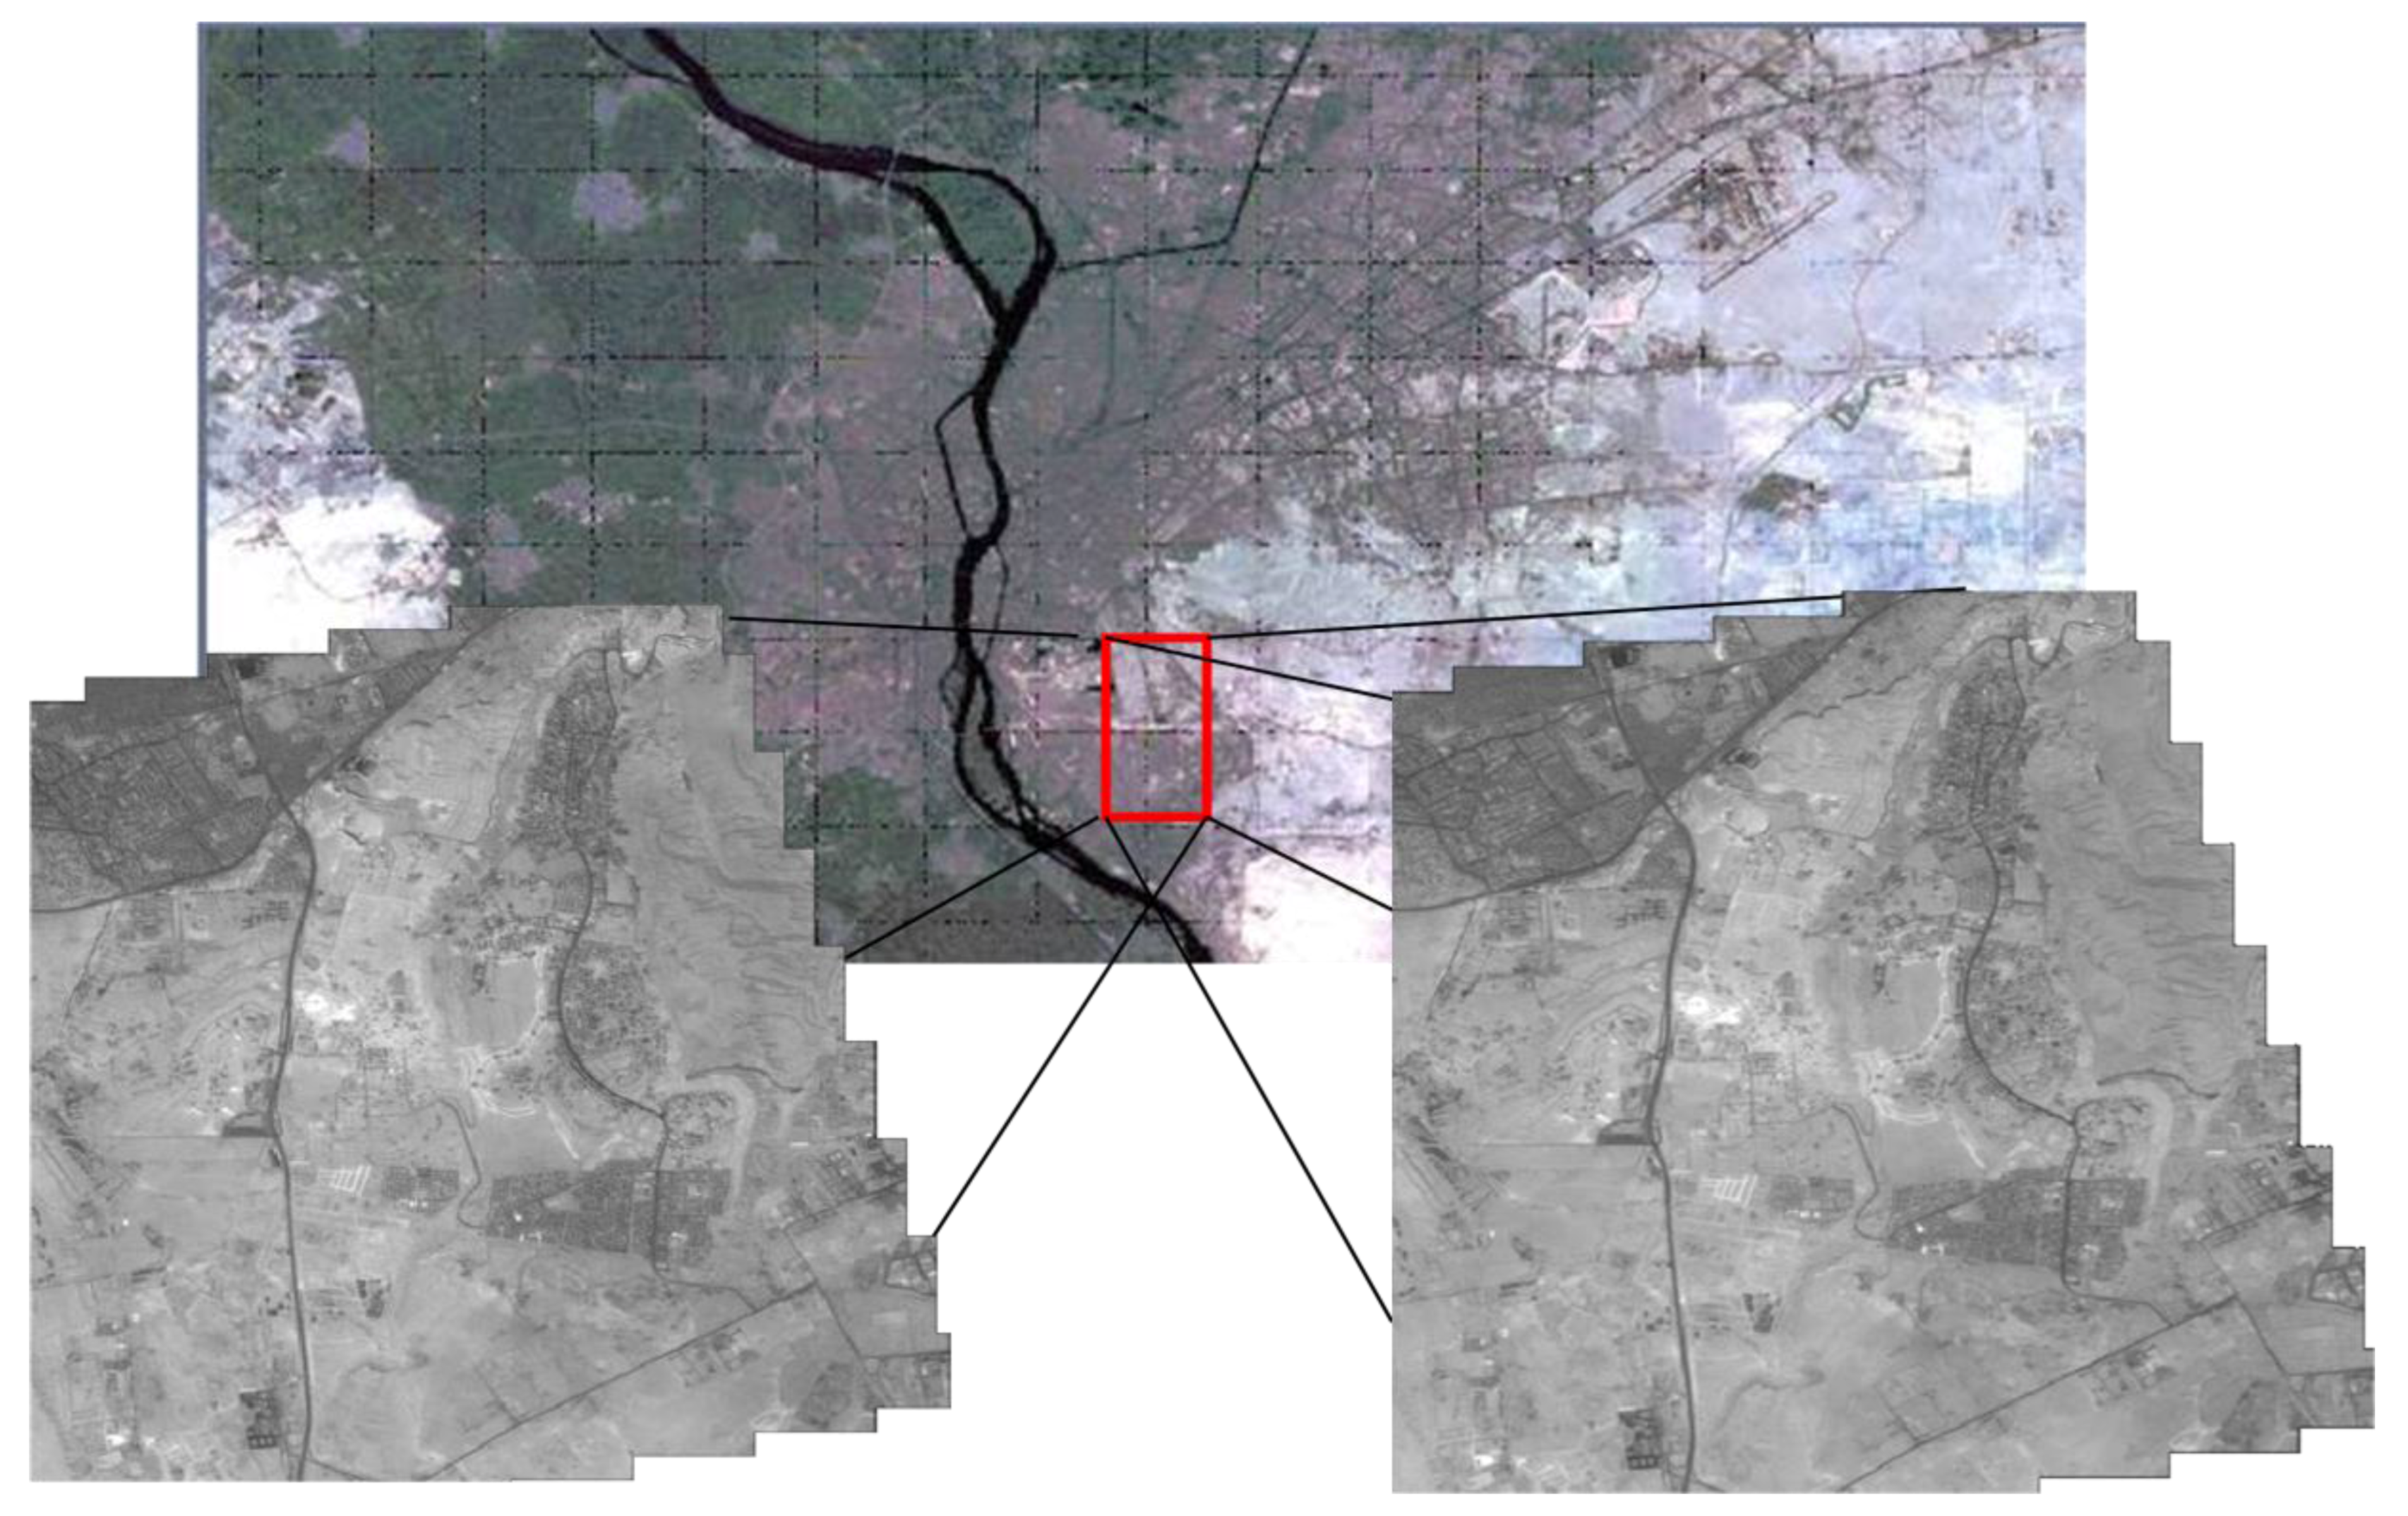
2. Study Area and Used Data
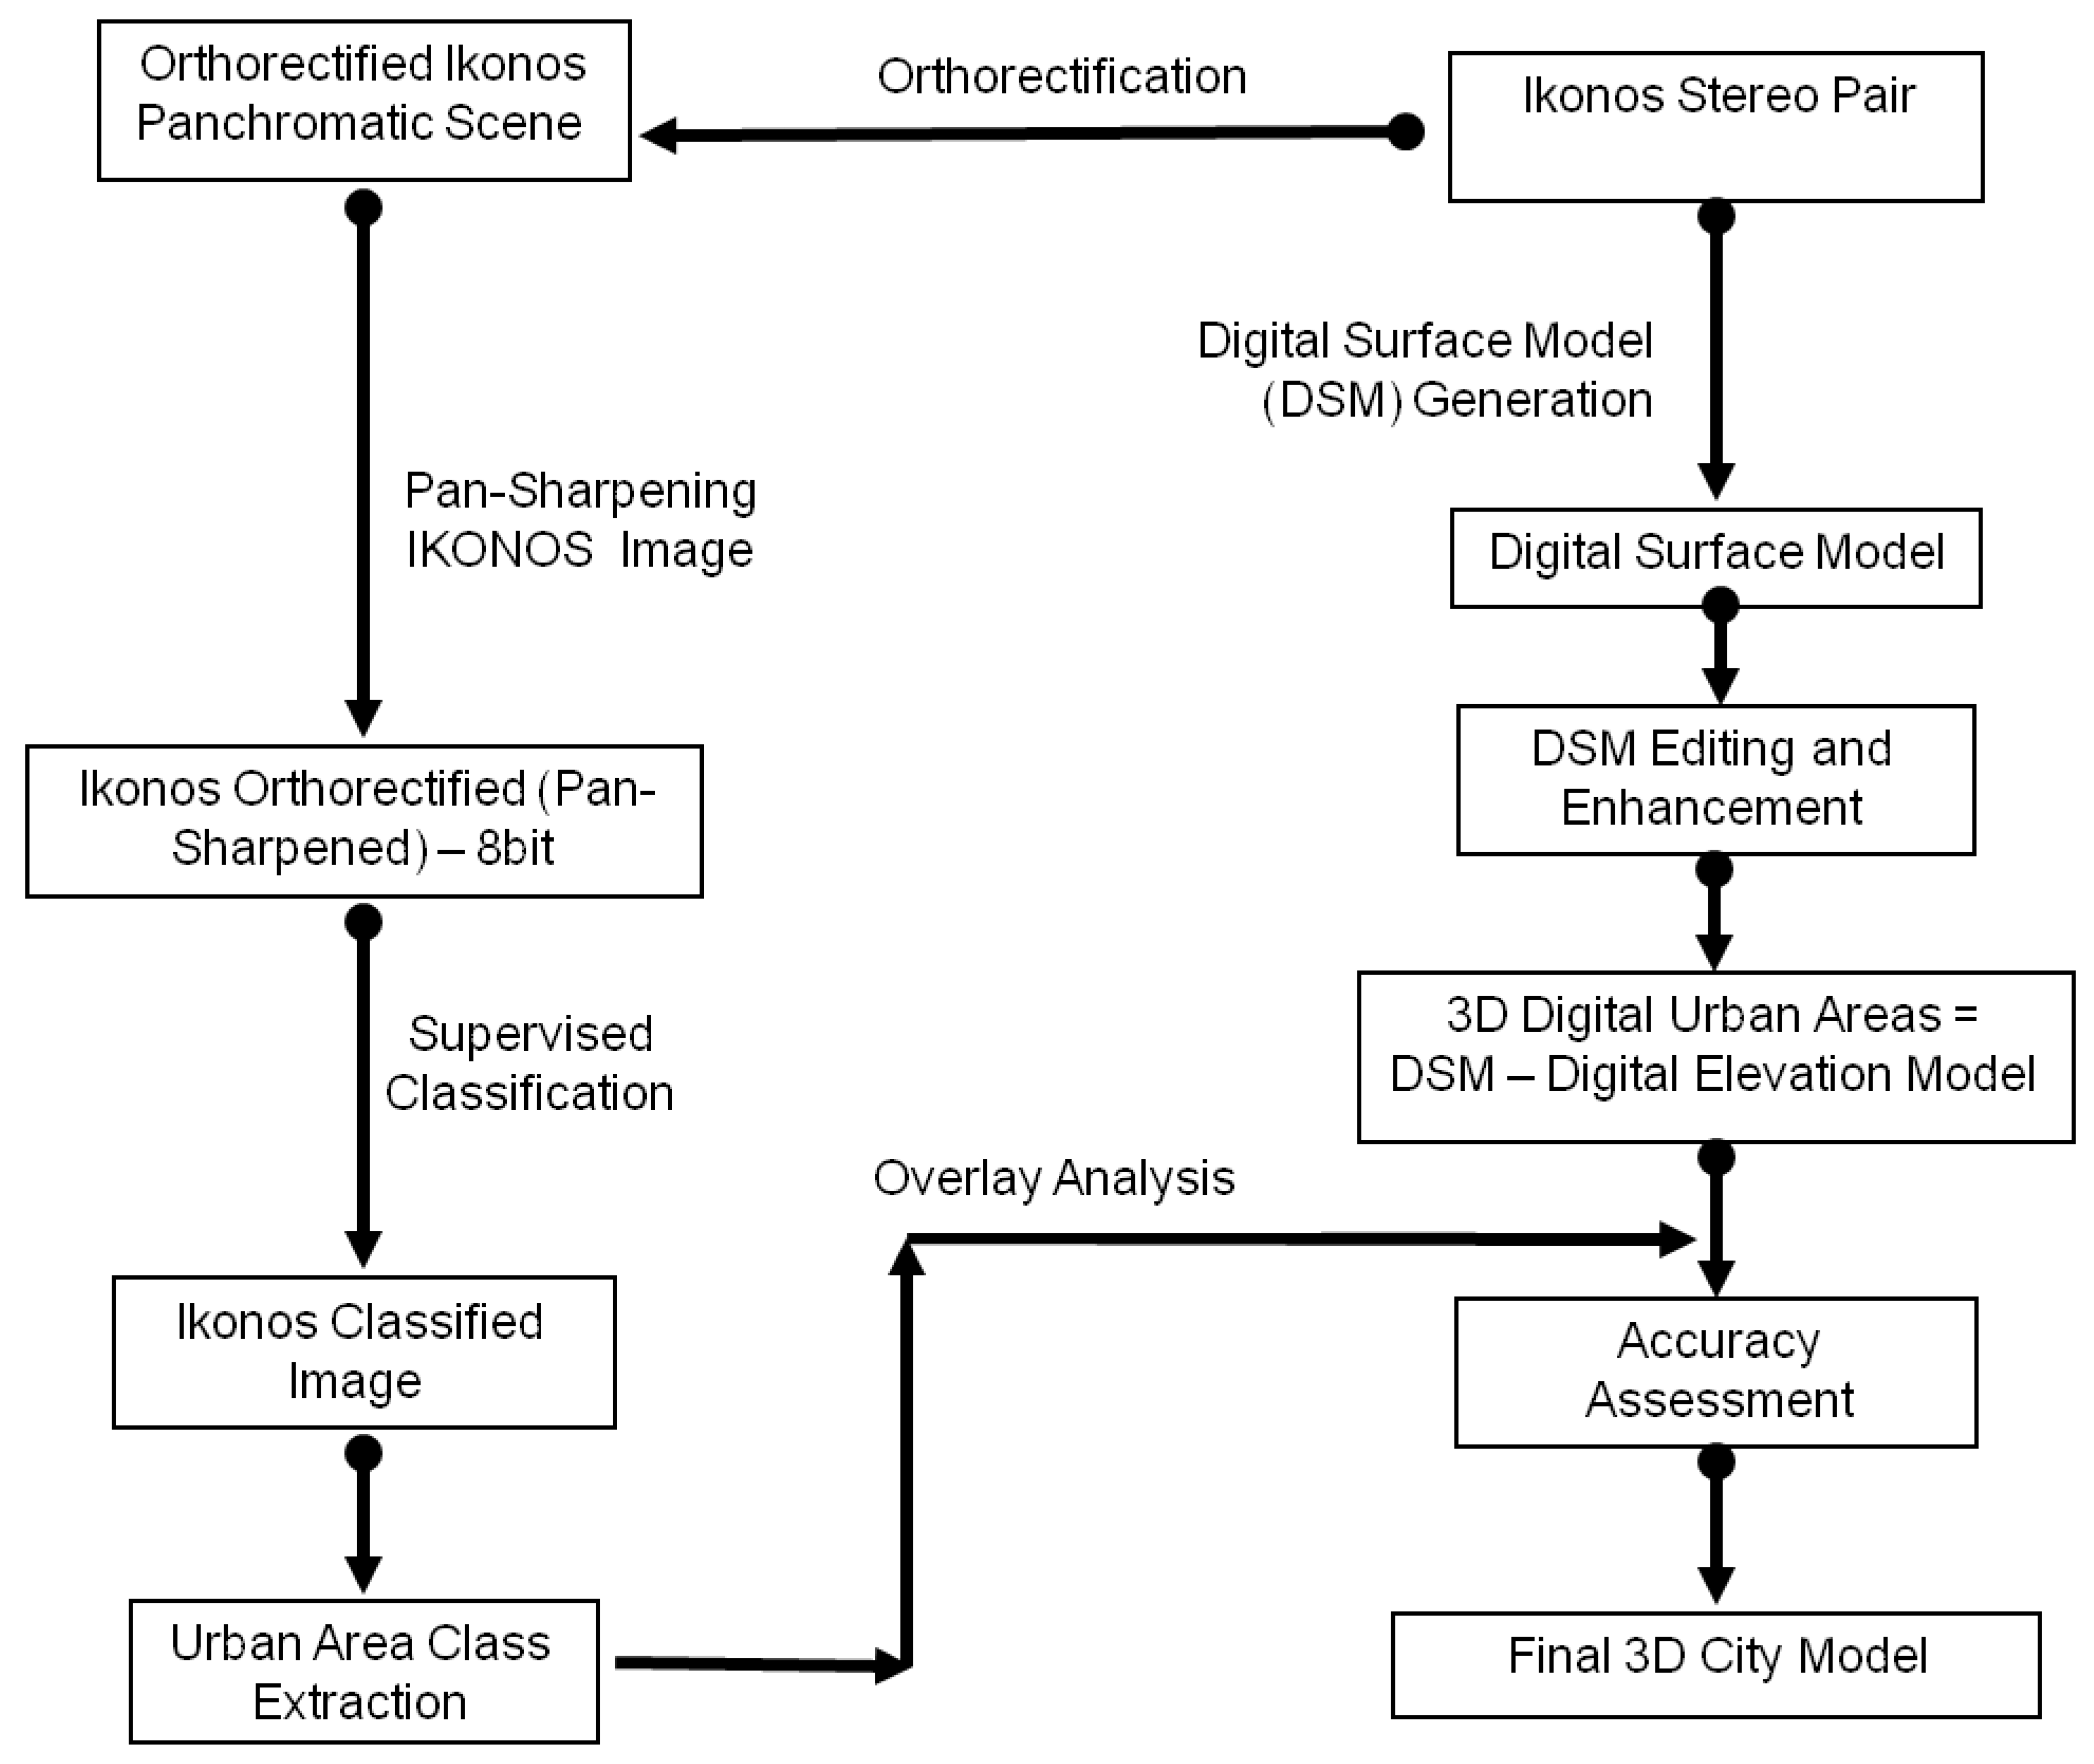
Four sets of data were used. The first set consisted of two panchromatic stereo pairs of IKONOS-GEO imagery (Carterra Product: Precision Specifications) (Figure 1). The stereo images covered an area 8 km × 7.5 km in Katamia, east of the Great Cairo area, with a 97.3% overlap as shown in Figure 1. For the second data set, ten ground control points (GCP) were surveyed in the study area using differential GPS with sub- meter accuracy. The third data set included vertical control points collected using a ground surveying technique. The points were surveyed by a trigonometric surveying technique using a 5-s SOKKIA total station (2 mm ± 2 ppm). The datum of the above data sets was the Egyptian elevation datum and the coordinates were in the Egyptian Transverse Mercator (ETM) form. The coordinates and levels of these points were projected to the Universal Transverse Mercator (UTM) coordinate system. The fourth data set was an Egyptian Survey Authority (ESA) 1:5,000 topographic map re-projected to UTM WGS84, from ETM form, to unify the coordinate systems of the data sets.
Figure 1. Study area and the two IKONOS stereo images of the study area (Katamia, Cairo) used in this research.
Remotesensing 03 00781 g001
Three different building blocks (sites) in the study area were selected. The blocks were composed of multi-story residential buildings with different heights. One of the factors affecting site selection was its elevation and topographic characteristics. The first two blocks were selected on Almoqatam Hill, while the third site was selected in the nearby Al Maadi, a flat area. The elevations at these three sites ranged from 40 to 270 m above mean sea level with site one and site three as the highest and lowest, respectively.

3. Methodology

The methodology developed in this research uses elevation and spectral characteristics to define buildings. A stereo pair of IKONOS images was used to build a digital surface model. The difference between this model and the digital terrain model of the study area should highlight elevations of man-made features. This information was integrated with the results of an automatic classification of the pan-sharpened multispectral IKONOS imagery to classify the building features. Figure 2 shows a flow chart of the steps adopted in the developed method.
Figure 2. Flowchart of building detection methodology from IKONOS satellite imagery.
Remotesensing 03 00781 g002

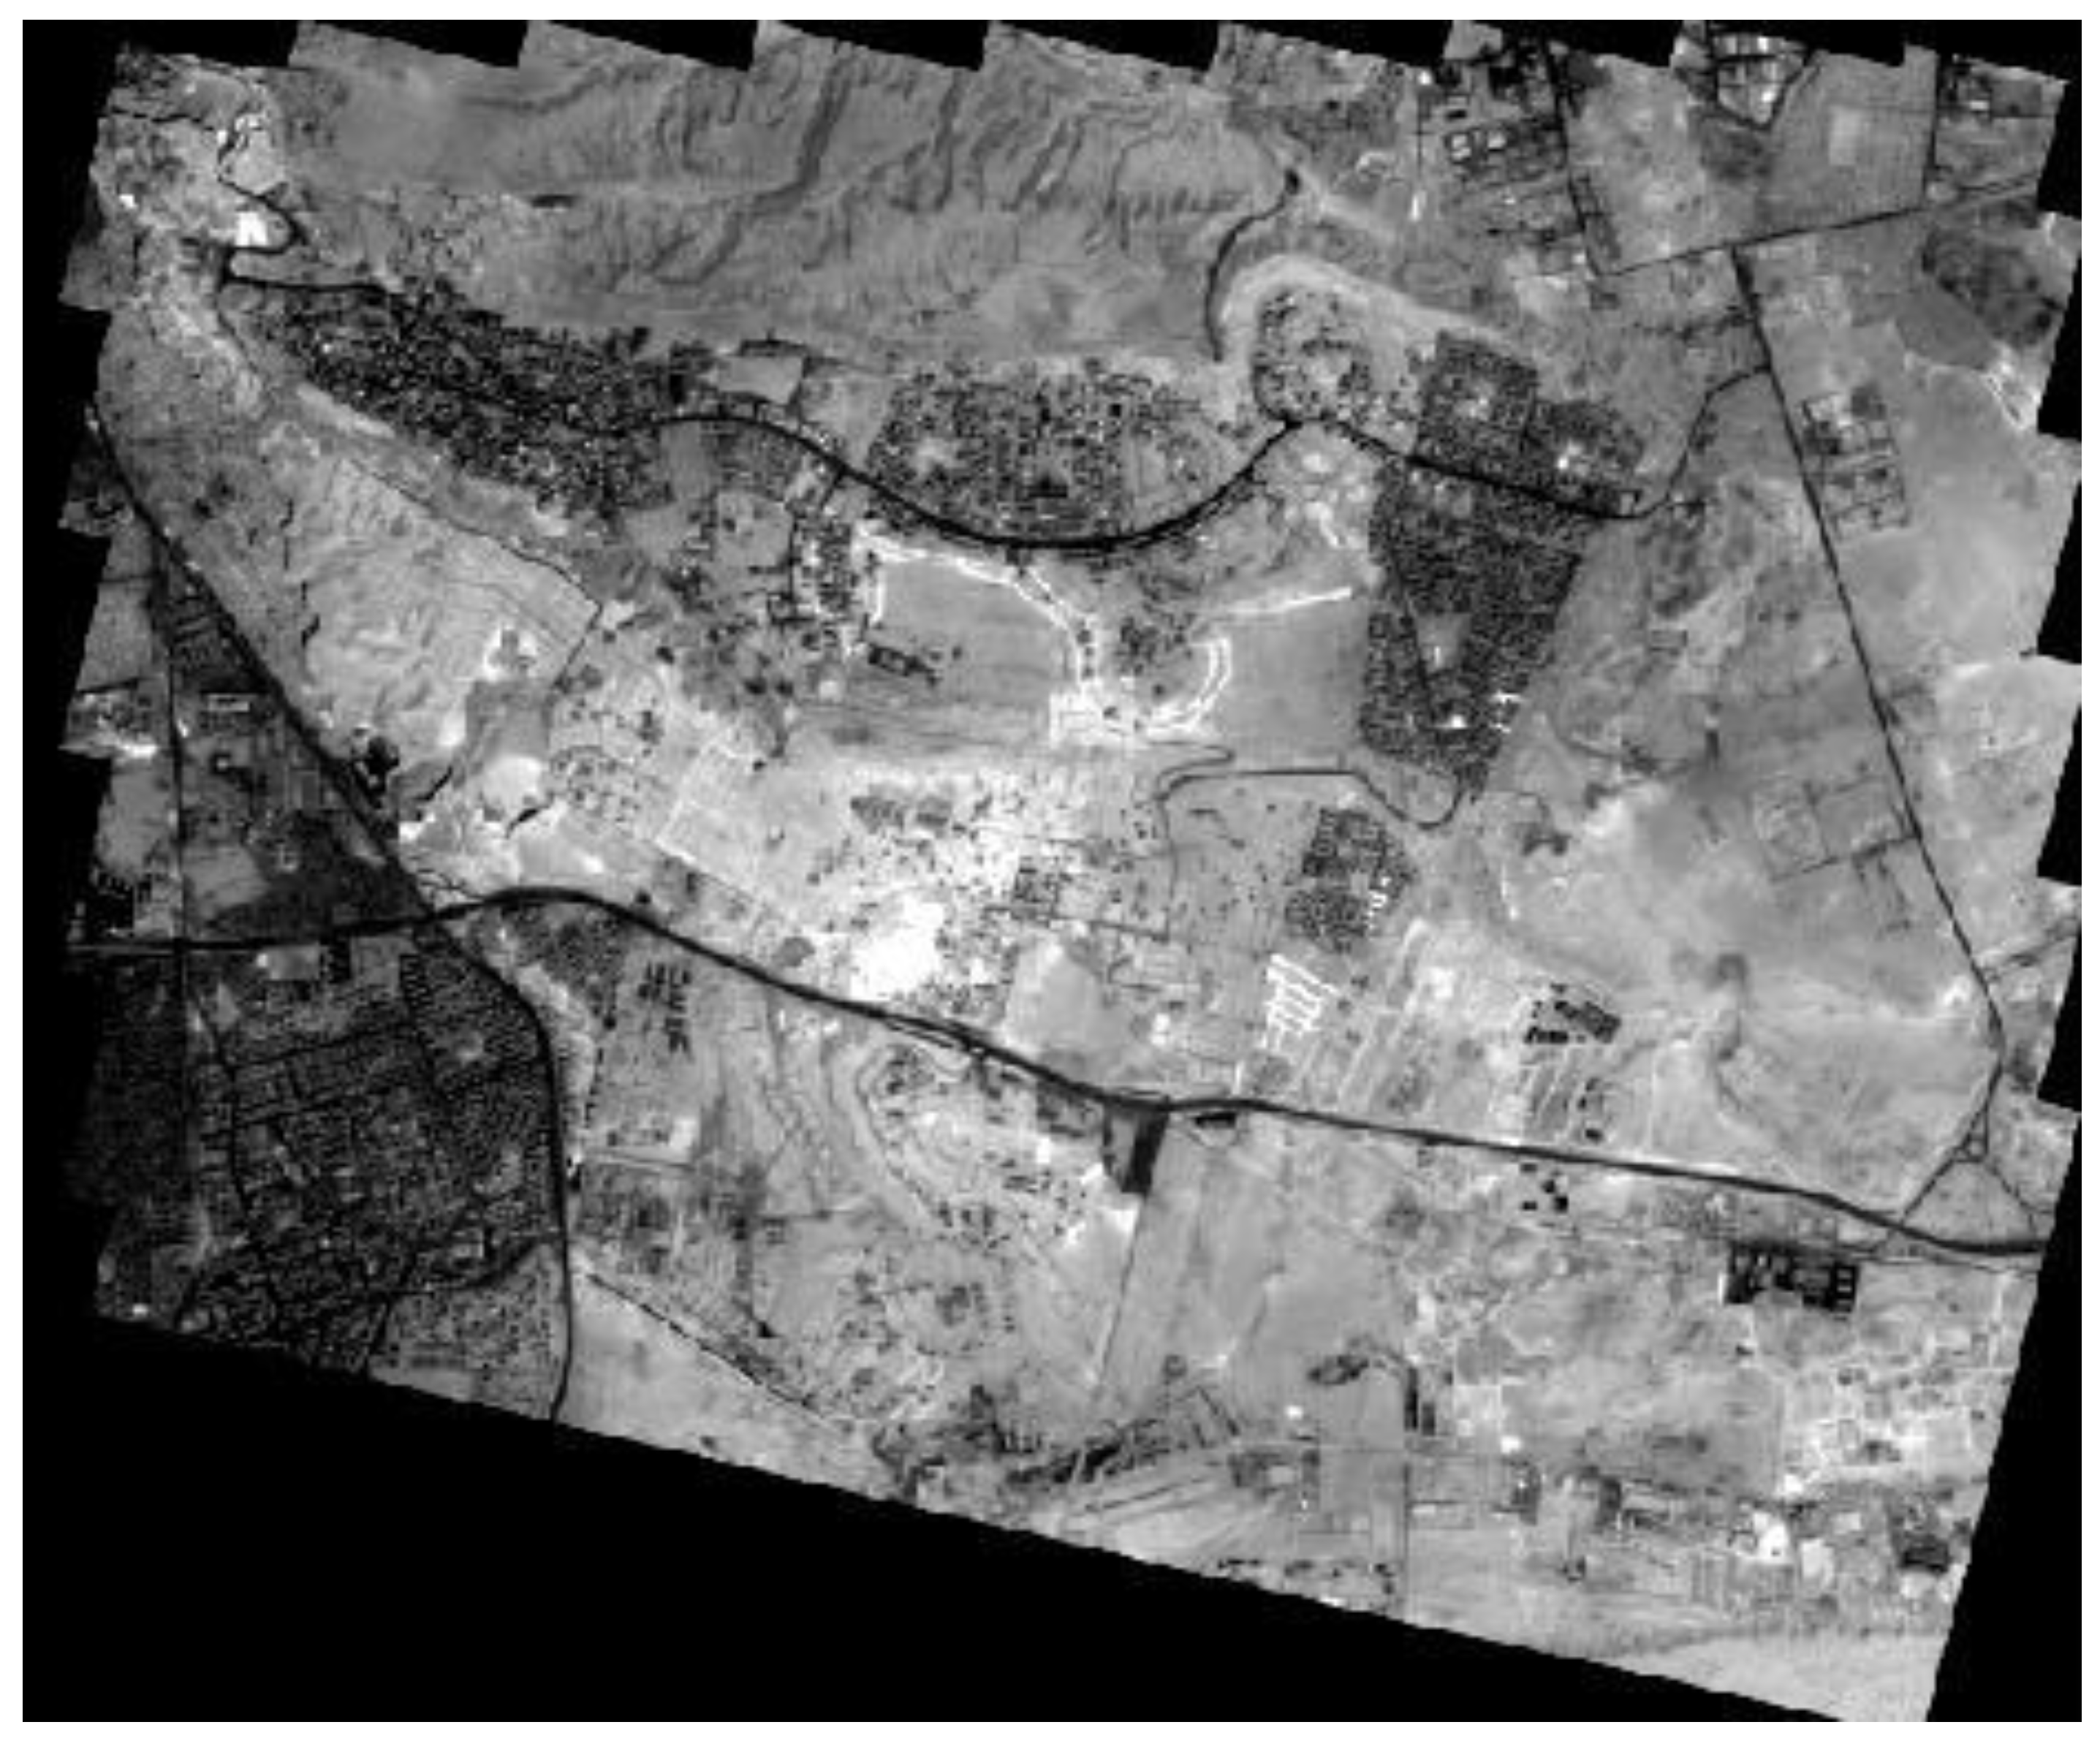
3.1. Digital Surface Model and Orthoimage Creation

The acquired IKONOS stereo images have an approximate positional error of 50 m, partly due to datum difference between the image geodetic datum (WGS84) and the Egyptian National datum (ETM). To correct for geometric distortions and relief displacement, we created an orthoimage basemap for building extraction using the image geometric models. Each of the two overlapping IKONOS images was used in this context. An image geometric model consists of one metadata and two Rational Polynomial Coefficient (RPC) files, or more generically Rational Function Models (RFM) [22,23] are a series of coefficients used to describe the relationship between the image during acquisition and ground coordinate system. The RPC data was used to process the IKONOS images without the need for ground control points (GCP). A digital surface model of the study area was created through area-based (signal based) matching technique, which determines the correspondence between two image areas according to the similarity of their gray level values using a 3 × 3 square correlation window. The technique was applied in the Leica Photogrammetry Suite (LPS) software. Figure 3 shows part of the digital surface model created. The image geometry models of the satellite images were utilized in the LPS algorithm to orthorectify the IKONOS satellite images. Figure 4 shows the orthoimage created from the left IKONOS image. The orthorectified image was used with the IKONOS multispectral image to produce a pan-sharpened one-meter resolution colored IKONOS image.
Figure 3. Digital surface model of the three blocks created from IKONOS stereo model.
Remotesensing 03 00781 g003
Figure 4. Orthoimage created using image geometry model coefficients and ground control points.
Remotesensing 03 00781 g004

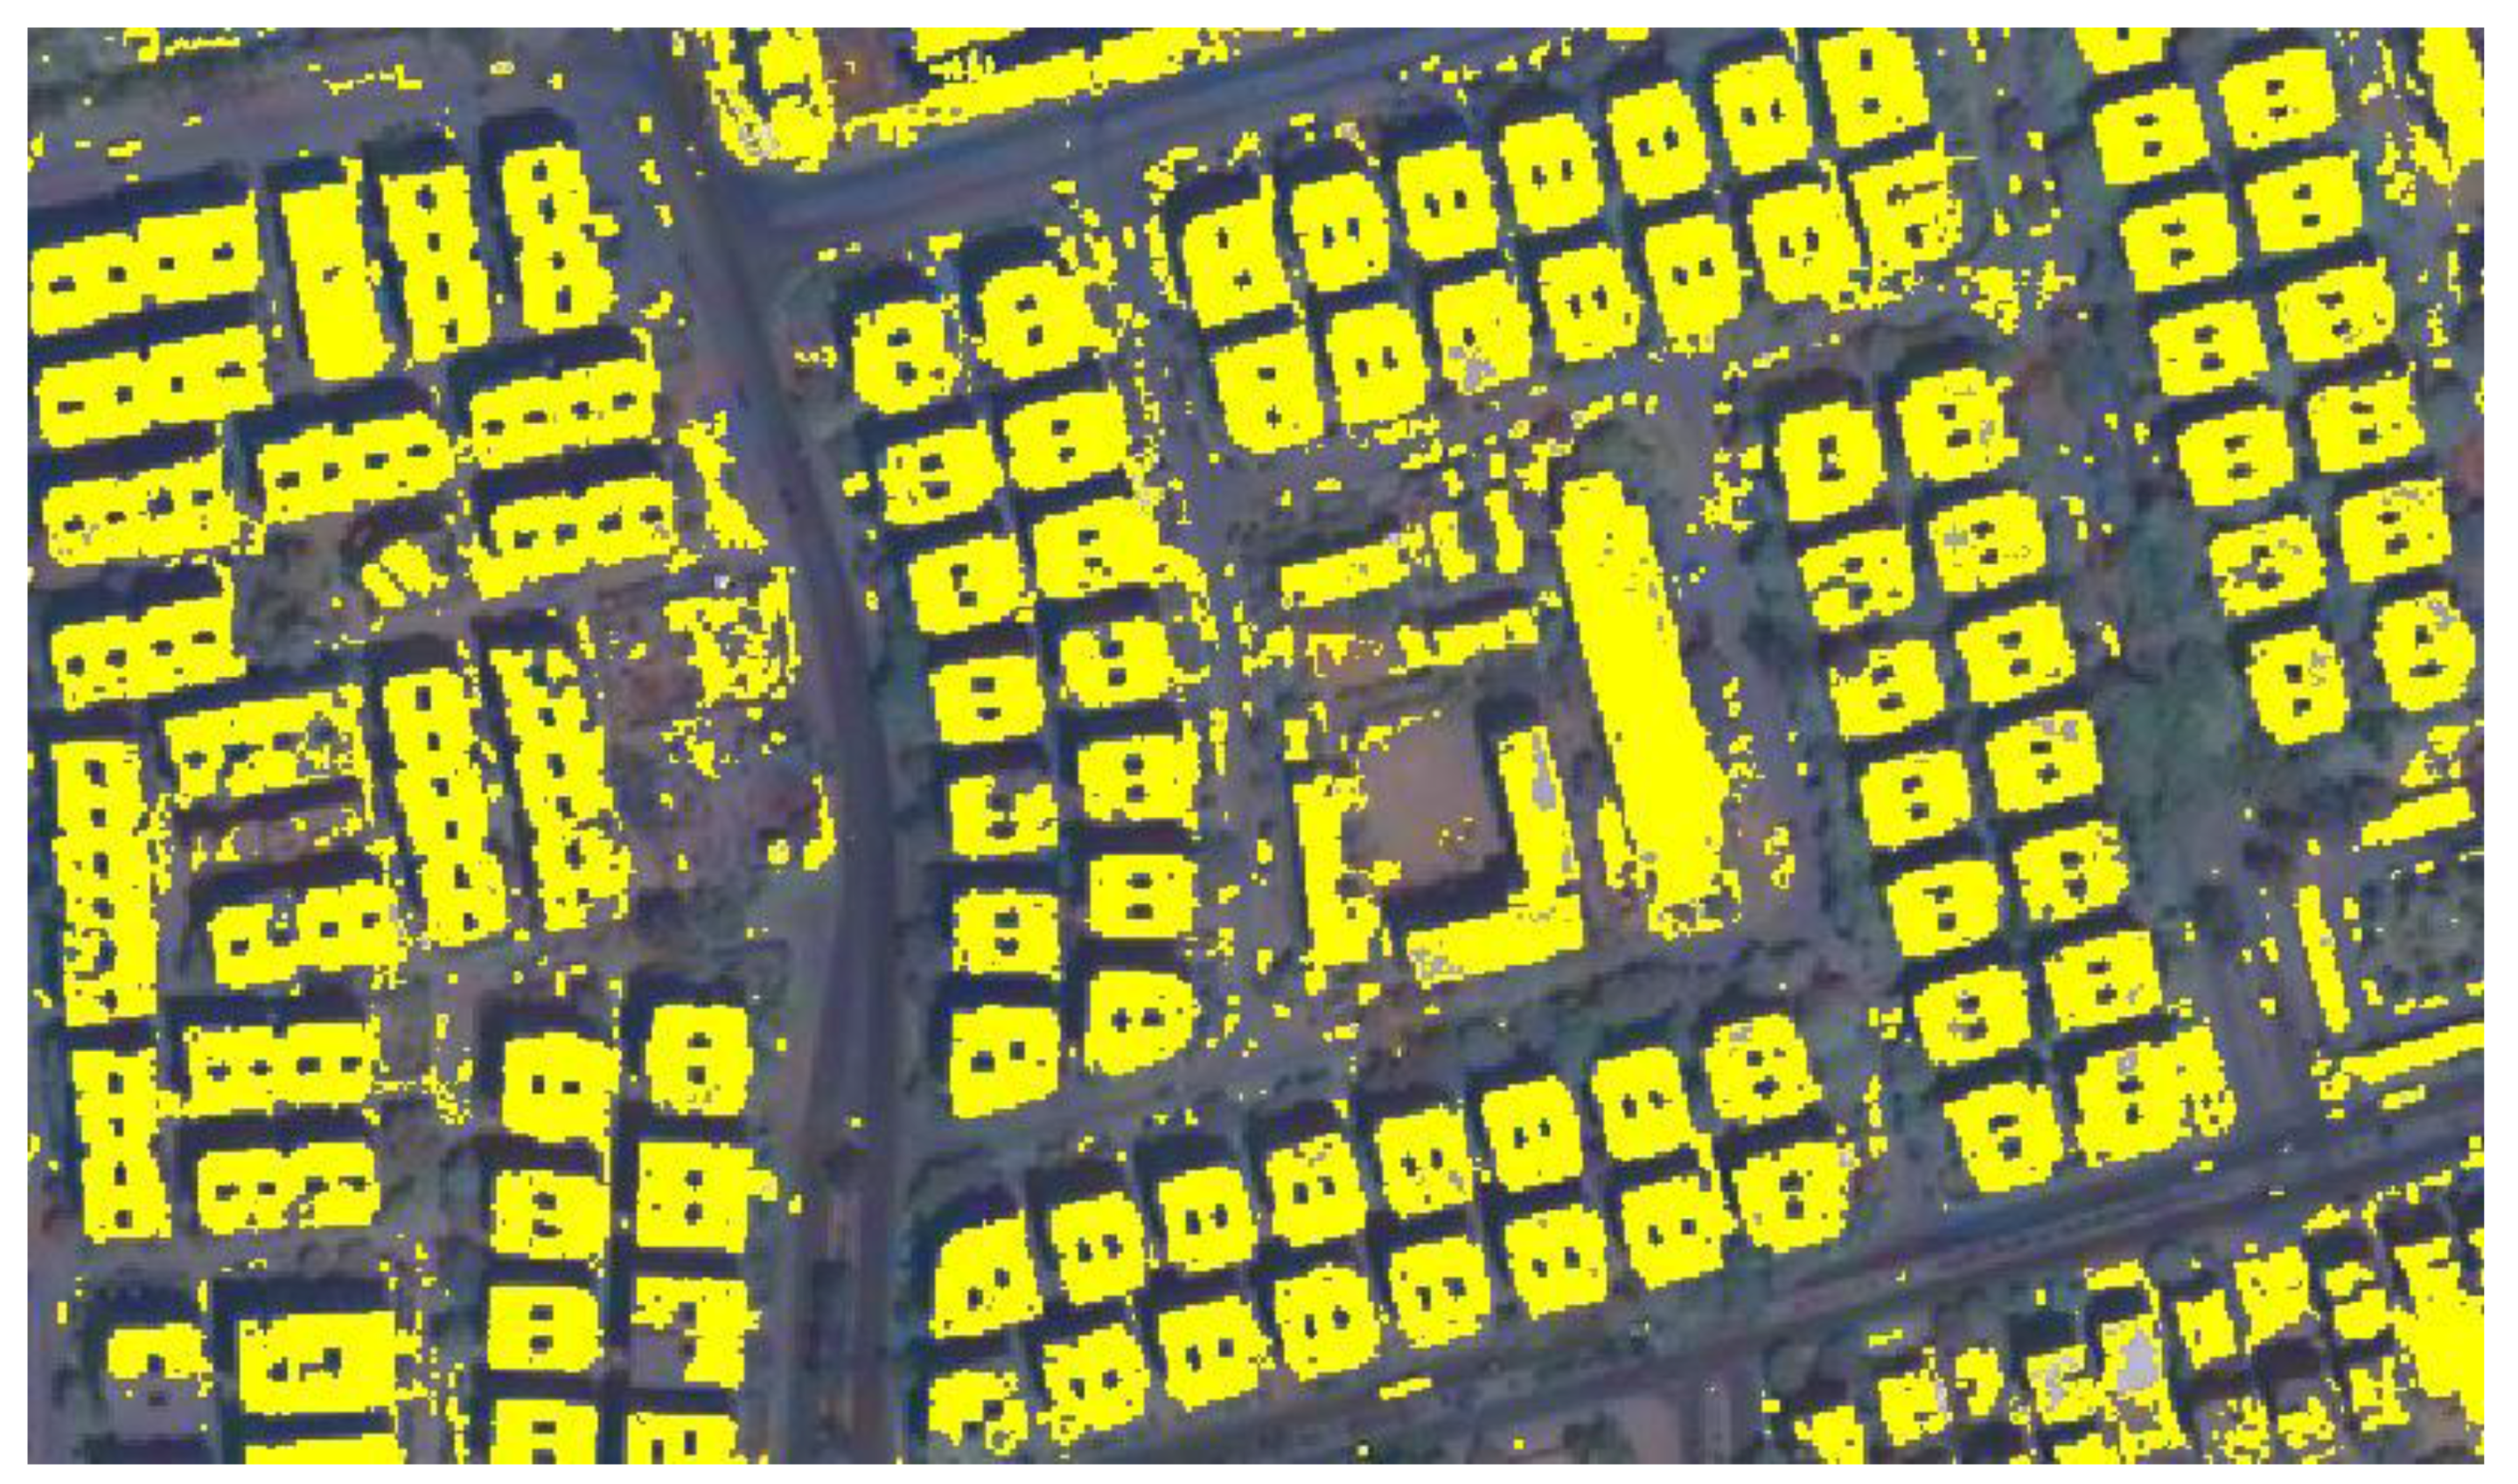
3.2. Building Detection Using Image Classification and DSM

A 1-m resolution pan-sharpened multispectral image was created using the IKONOS panchromatic and multispectral orthoimages. Buildings were detected through a supervised classification process applied on the pan-sharpened multispectral image. Training sets were collected from the image for four different classes (bare soil, building, vegetation, and roads) and a Maximum Likelihood classifier was applied. The resulting image was filtered by a majority filter to eliminate small, isolated batches. The classes were aggregated to form two classes: buildings and others as shown in Figure 5.
Figure 5. Buildings identified from image classification shown in yellow.
Remotesensing 03 00781 g005
The DSM created in Section 3.1 was compared to the Digital Terrain Model (DTM) representing the ground elevations (excluding above ground features) of the study area. The DTM was generated from the Shuttle Radar Topography Mission (SRTM) 90-m resolution data (http://www2.jpl.nasa.gov/srtm/). The ‘Buildings’ class, resulting from the image classification, was overlaid with the buildings layer, identified by the difference in elevation between the DSM and the DTM surfaces. In this step, high priority was given to the image classification results to exclude the incorrect elevation values produced from the automatic DSM creation step due to image matching and interpolation errors. The resulting image was used in an edge detection algorithm to define building outlines. Both boundary outlines and elevations were used to assess the accuracy of the developed method.

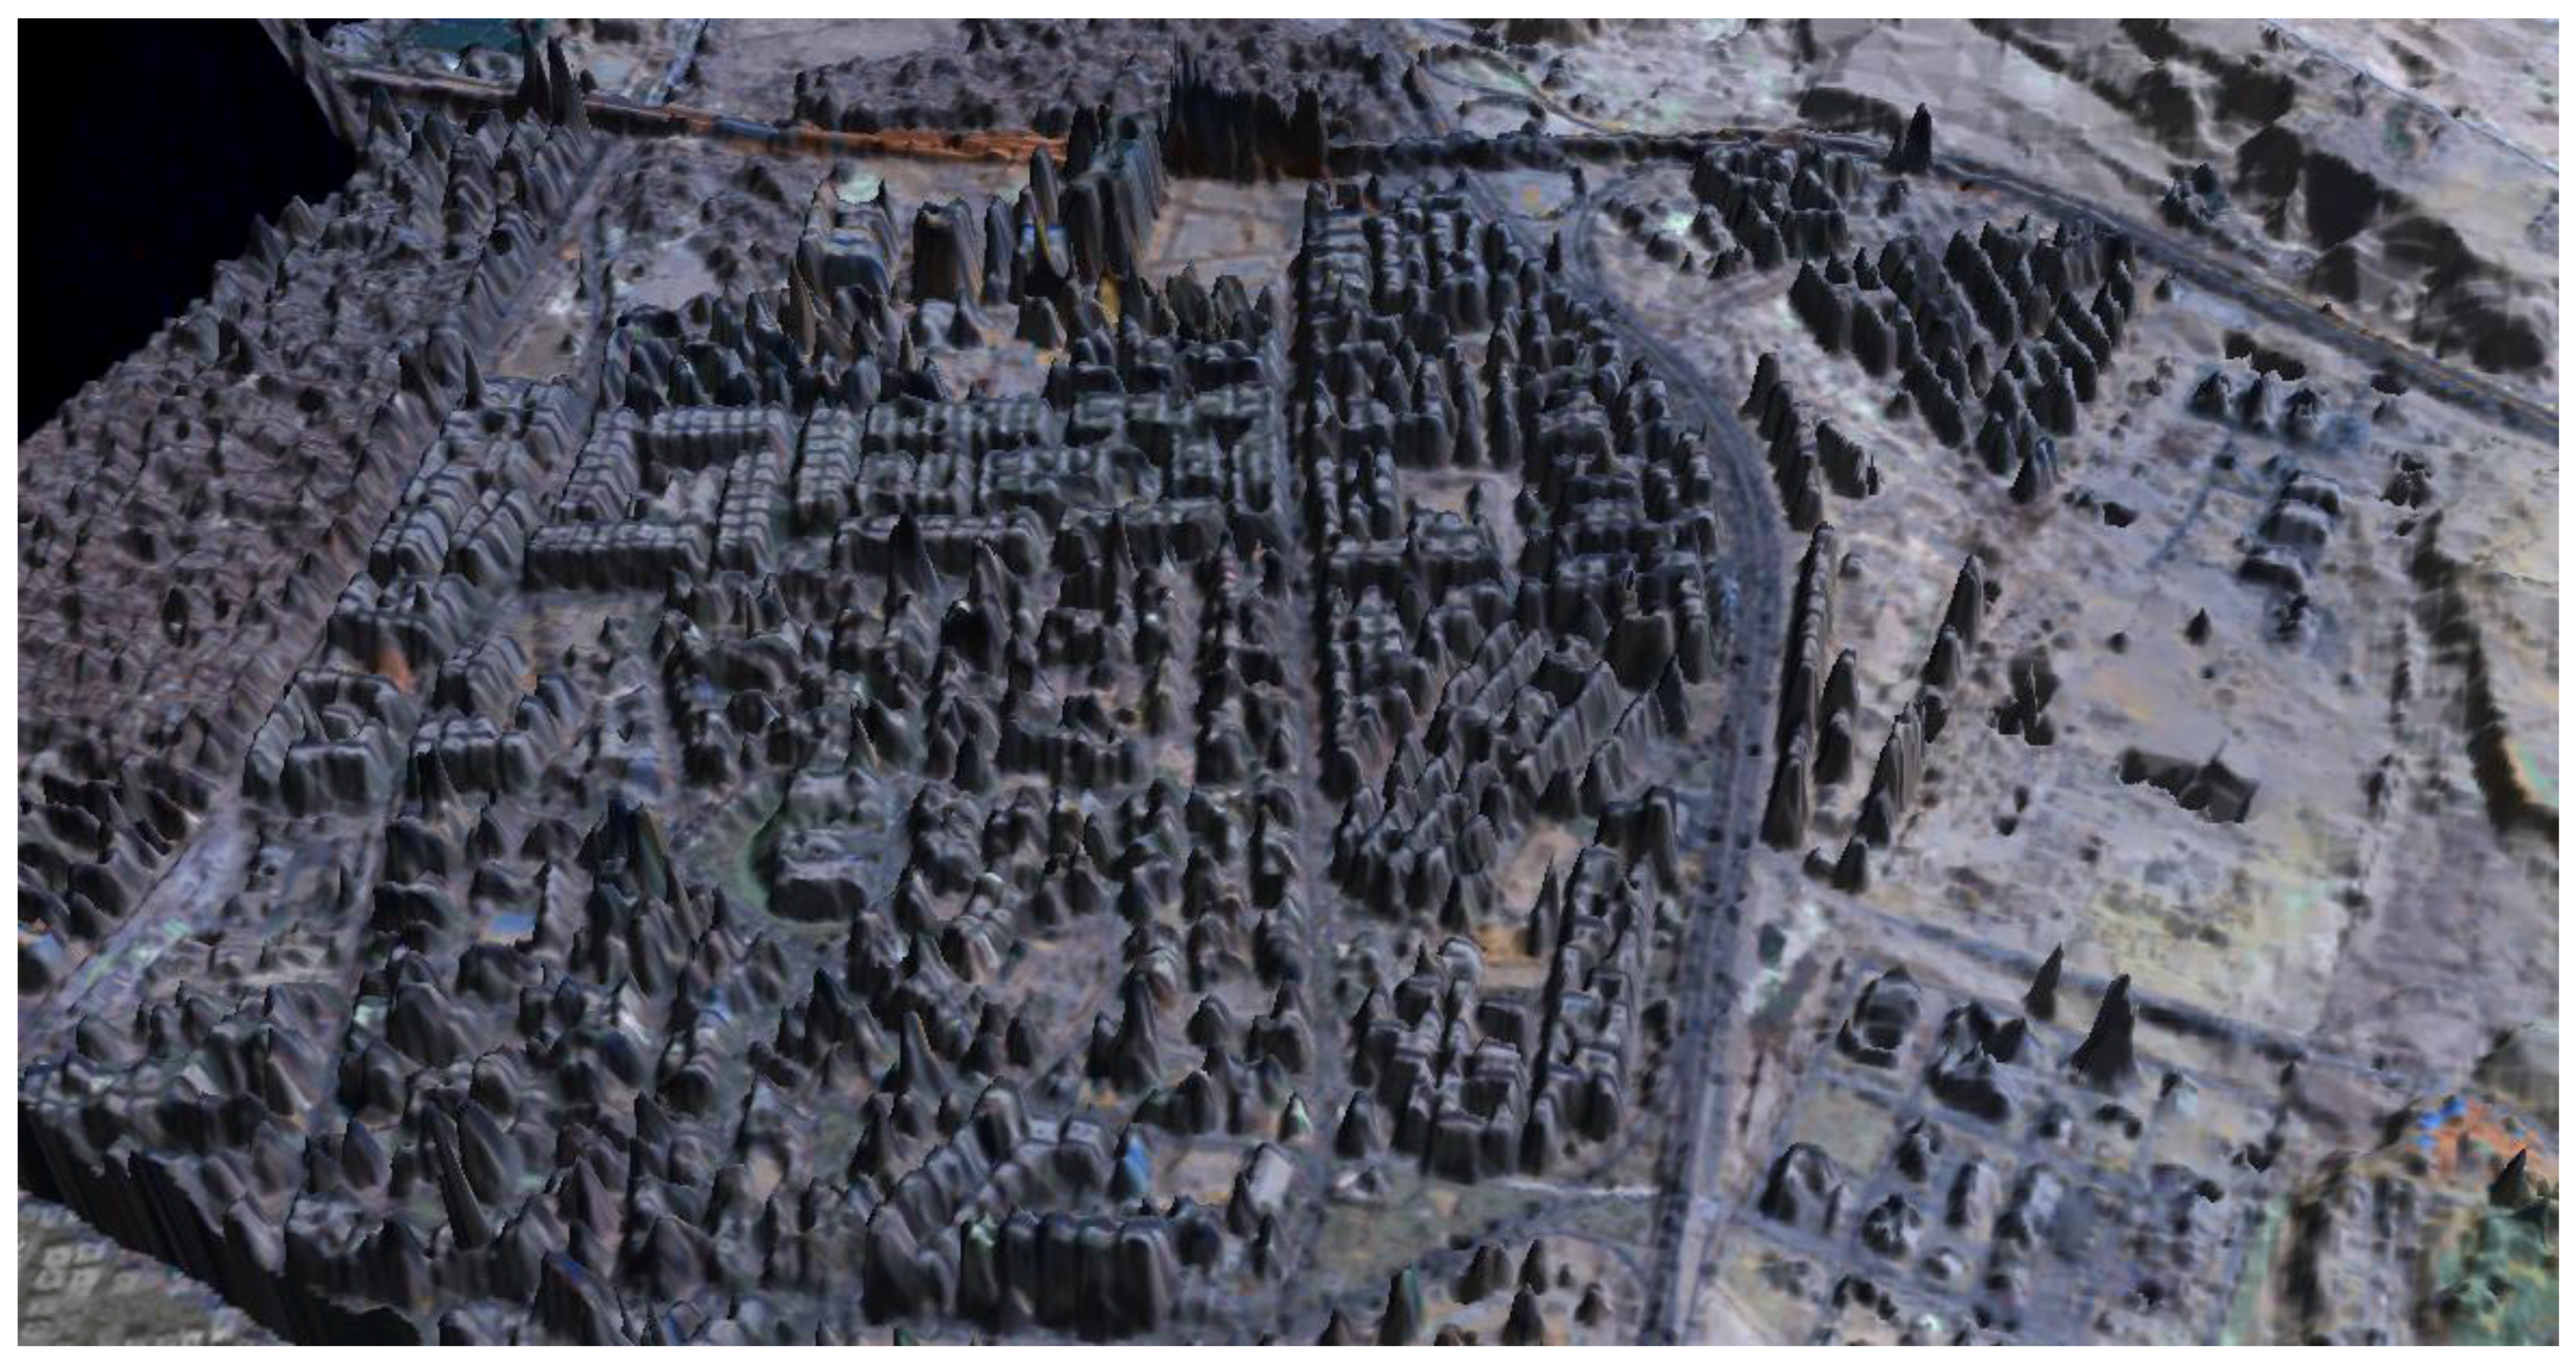
4. Results and Analysis

To evaluate the accuracy of the developed methodology, we examined the building detection accuracy followed by an evaluation of the planimetric position and height estimation accuracy of the detected buildings.

4.1. Accuracy Assessment of Building Extraction

Building detection accuracy was assessed using a procedure adopted by [24]. In this procedure, the buildings defined automatically by our developed method were compared with the buildings detected manually by visual inspection. Every building in the output image was either marked as True Positive, True Negative, False Positive, or False Negative using the following category definitions:
  • True Positive (TP): Both the automated and manual methods classified the area as building.
  • True Negative (TN): Both the automated and manual methods classified the area as non-building.
  • False Positive (FP): Only the automated method classified the area as building.
  • False Negative (FN): Only the manual classification classified the area as building.
Once the number of buildings belonging to each category is determined, the performance of the developed method was evaluated using the following statistical measures:
  • Branching Factor: FP/TP
  • Miss Factor: FN/TP
  • Building Detection Percentage: 100 × TP/(TP + FN)
The ‘branching factor’ is a measure of the commission error where the developed method incorrectly labeled building areas, while the ‘miss factor’ is a measure of omission error, where our method incorrectly labeled building pixels as background. The ‘building detection percentage’ gives the percentage of building pixels correctly labeled by the automated process.
The results of the quality assessment for the three tested sites are given in Table 1. Table 1 shows branching factor and building detection percentage for the three blocks in the test area were found to be 8.54 and 82.6, respectively. On the other hand, the average missing factor was found to be 0.16 with the lowest value for Block 1 and the highest for Block 2. These values demonstrate that the building extraction approach performs moderately given the nature of the high density residential landscape of the tested blocks. This also suggests a consistency in the accuracy of the SRTM digital terrain model, which was used with the digital surface models to detect the buildings. Table 1 also shows that building detection quality measures for Block 3 were better than the values for the first two blocks, which suggests a slightly better performance of the methodology used for relatively flat terrain (the case of Block 3).
Table 1. Building accuracy statistics for different urban densities.
Block (site)TPFPFNTotal BuildingsMiss FactorBranching FactorBuilding Detection %
Block 142612540.1414.377.8
Block 217312362090.206.982.8
Block 31587231810.154.487.3
Average0.168.5482.6

4.2. Assessing the Positional Accuracy of Detected Buildings

The planimetric positional accuracy was assessed using standard 1:5,000 topographic maps. Building heights were examined by calculating the difference between building heights observed using ground surveying techniques and those computed from the IKONOS image model. Table 3 lists the building height testing results.
Our results show that the differences in the easting and northing coordinates of building corners have a RMSE of 2.42 and 2.39 m, respectively, using the RFM model built on the RPC solution only, which suits 1:5,000 scale map production.
Table 2 shows that the differences in building heights between surveyed values and the ones extracted using the IKONOS model have a minimum and maximum value of 0.31 and 2.7 m, respectively, with a RMSE of 1.33 m. It should be mentioned here that these building heights represent a relative measure for the extracted elevations as they were computed by subtracting two elevations at the building roof and base. The obtained accuracy suggests the potential use of the IKONOS image model in several applications such as checking building height violations to aviation surfaces, which was one of the main motivations for this research.
Table 2. Building heights extracted from IKONOS image model and ground surveying.
Building No.Heights from Ground SurveyHeights Extracted from Image ModelBuilding Height Error
129.8829.02−0.86
227.3830.08−2.70
332.2732.84−0.57
420.1421.29−1.15
520.1521.3−1.15
615.2115.68−0.47
715.4715.150.31
816.7717.66−0.90
916.9317.67−0.74
1015.7916.86−1.07
1115.5016.21−0.71
1215.6116.4−0.79
1315.2416.92−1.68
1429.8931.03−1.14
1530.5432−1.46
1630.7732.36−1.59
1731.0233.57−2.55
Max2.7
RMSE1.33

5. Summary and Conclusions

We examined the use of IKONOS stereo imagery to extract 3D building information in regards to height and planimetric position. The images were oriented using image geometry models and ground control points. Digital surface and terrain models were used to extract building heights. Buildings were identified using the images’ spectral characteristics through supervised image classification in addition to height information extracted from the IKONOS IMAGE stereo model. The results were compared to building heights surveyed using ground surveying techniques and to building positions extracted from topographic maps. Our accuracy assessment results showed a RMSE of 1.33 m in the computed building height and about one meter RMSE in the easting the northing coordinates of building corners when using ground control points in building the image model. The results suggest the feasibility of using the IKONOS images stereo models for applications that range from building height estimation for aviation purposes to medium scale topographic mapping.

References

  1. Baillard, C.; Dissard, O.; Jamet, O.; Maitre, H. Extraction and textural characterization of above-ground areas from aerial stereo pairs: A quality assessment. ISPRS J. Photogramm. 1998, 53, 130–141. [Google Scholar] [CrossRef]
  2. Lari, Z.; Ebadi, H. Automatic Extraction of Building Features from High Resolution Satellite Images Using Artificial Neural Networks. In Proceedings of ISPRS Conference on Information Extraction from SAR and Optical Data, with Emphasis on Developing Countries, Istanbul, Turkey, 16–18 May 2007.
  3. Liu, Z.; Gong, P.; Shi, P.; Chen, H.; Zhu, L.; Sasagawa, T. Automated building change detection using UltraCamD images and existing CAD data. Int. J. Remote. Sens. 2010, 31, 1505–1517. [Google Scholar] [CrossRef]
  4. Chehata, N.; Jung, F.; Deseilligny, M.P.; Stamon, G. A Region-based Matching Approach for 3D-Roof Reconstruction from HR Satellite Stereo Pairs. In Proceedings of the VIIth Digital Image Computing: Techniques and Applications, Sydney, Australia, 10–12 December 2003; pp. 889–898.
  5. Rottensteiner, F.; Trinder, J.; Clode, S.; Kubik, K.; Lovell, B. Building Detection by Dempster-Shafer Fusion of LIDAR Data and Multispectral Aerial Imagery. In Proceedings of the Seventeenth International Conference on Pattern Recognition, Cambridge, UK, 23–26 August 2004; pp. 339–342.
  6. Brenner, C. Building reconstruction from images and laser scanning. Int. J. Appl. Earth Obs. Geoinf. 2005, 6, 187–198. [Google Scholar] [CrossRef]
  7. Priestnall, G.; Jaafar, J.; Duncan, A. Extracting urban features from LiDAR digital surface models. Comput. Environ. Urban Syst. 2000, 24, 65–78. [Google Scholar] [CrossRef]
  8. Kim, Z.W.; Nevatia, R. Uncertain reasoning and learning for feature grouping. Comput. Vis. Image. Understand. 1999, 76, 278–288. [Google Scholar] [CrossRef]
  9. Lin, C.; Nevatia, R. Building detection and description from a single intensity image. Comput. Vis. Image. Understand. 1998, 72, 101–121. [Google Scholar] [CrossRef]
  10. Fraser, C.; Baltsavias, E.; Gruen, A. Processing of IKONOS imagery for sub-meter 3D positioning and building extraction. ISPRS J. Photogramm. 2002, 56, 177–194. [Google Scholar] [CrossRef]
  11. Thomas, N.; Hendrix, C.; Congalton, R.G. A comparison of urban mapping methods using high-resolution digital imagery. Photogramm. Eng. Remote Sensing 2003, 69, 963–972. [Google Scholar] [CrossRef]
  12. Sohn, G.; Dowman, I. Building Extraction Using LiDAR DEMs and IKONOS Images. In Proceedings of the ISPRS Working Group III/3 Workshop, Dresden, Germany, 8–10 October 2003; Volume 34, Part 3/W13. pp. 8–10.
  13. Wei, Y.; Zhao, Z.; Song, J. Urban Building Extraction from High-resolution Satellite Panchromatic Image Using Clustering and Edge Detection. In Proceedings of 2004 IEEE International Symposium on Geoscience and Remote Sensing, Anchorage, AK, USA, 20–24 September 2004; Volume 7, pp. 2008–2010.
  14. Liu, Z.; Wang, J.; Liu, W. Building Extraction from High Resolution Imagery Based on Multi-Scale Object Oriented Classification and Probabilistic Hough Transform. In Proceedings of 2005 IEEE International Symposium on Geoscience and Remote Sensing, Seoul, Korea, 25–29 July 2005; pp. 2250–2253.
  15. Haverkamp, D. Automatic Building Extraction from IKONOS Imagery. In Proceedings of the ASPRS Annual Conference, Denver, CO, USA, 23–28 May 2004.
  16. Ortner, M.; Descombes, X.; Zerubia, J. Building Extraction from Digital Elevation Model. In Proceedings of 2003 IEEE International Conference on Acoustics, Speech, and Signal Processing, Hong Kong, 6–10 April 2003; Volume 3, pp. 337–340.
  17. Xu, J.; Wan, Y.; Yao, F. A Method of 3D Building Boundary Extraction from Airborne LiDAR Points Cloud, Photonics and Optoelectronic (SOPO). In Proceedings of 2010 IEEE Symposium on Security and Privacy (SP), Berkeley, CA, USA, 16–19 May 2010; pp. 1–4.
  18. Alharthy, A.; Bethel, J. Building Extraction and Reconstruction from LiDAR Data. In Proceedings of ASPRS Annual Conference, Washington, DC, USA, 22–26 April 2002; pp. 18–26.
  19. Ridley, H.M.; Atkonson, P.M.; Aplin, P.; Muller, J.P.; Dowman, I. Evaluating the potential of the forthcoming commercial US high-resolution satellite sensor imagery at the ordnance survey (R). Photogramm. Eng. Remote Sensing 1997, 63, 997–1005. [Google Scholar]
  20. Segl, K.; Kaufmann, H. Detection of small objects from high-resolution panchromatic satellite imagery based on supervised image segmentation. IEEE Trans. Geosci. Remote Sens. 2001, 39, 2080–2083. [Google Scholar] [CrossRef]
  21. Croitoru, A.; Doytsher, Y. Monocular right-angle building hypothesis generation in regularized urban areas by pose clustering. Photogramm. Eng. Remote Sensing 2003, 69, 151–169. [Google Scholar] [CrossRef]
  22. Dial, G.; Bowen, H.; Gerlach, F.; Grodecki, J.; Oleszczuk, R. IKONOS satellite, imagery, and products. Remote. Sens. Environ. 2003, 88, 23–36. [Google Scholar] [CrossRef]
  23. Tao, C.V.; Hu, Y. A comprehensive study of the rational function model for photogrammetric processing. Photogramm. Eng. Remote Sensing 2001, 67, 1347–1357. [Google Scholar]
  24. Jin, X.; Davis, C.H. Automated building extraction from high-resolution satellite imagery in urban areas using structural, contextual, and spectral information. EURASIP J. Appl. Signal. Process. 2005, 2005, 2198–2206. [Google Scholar] [CrossRef]

