Global Patterns of Cropland Use Intensity

1
Institute of Crop Science and Resource Conservation, University of Bonn, Katzenburgweg 5, 53115 Bonn, Germany
2
Institute of Physical Geography, University of Frankfurt, P.O. Box 11 19 32, 60054 Frankfurt, Germany
*
Author to whom correspondence should be addressed.
Remote Sens. 2010, 2(7), 1625-1643; https://doi.org/10.3390/rs2071625
Submission received: 20 April 2010
/
Revised: 14 June 2010
/
Accepted: 18 June 2010
/
Published: 24 June 2010
(This article belongs to the Special Issue Global Croplands)
Abstract
:This study presents a global scale analysis of cropping intensity, crop duration and fallow land extent computed by using the global dataset on monthly irrigated and rainfed crop areas MIRCA2000. MIRCA2000 was mainly derived from census data and crop calendars from literature. Global cropland extent was 16 million km2 around the year 2000 of which 4.4 million km2 (28%) was fallow, resulting in an average cropping intensity of 0.82 for total cropland extent and of 1.13 when excluding fallow land. The lowest cropping intensities related to total cropland extent were found for Southern Africa (0.45), Central America (0.49) and Middle Africa (0.54), while highest cropping intensities were computed for Eastern Asia (1.04) and Southern Asia (1.0). In remote or arid regions where shifting cultivation is practiced, fallow periods last 3–10 years or even longer. In contrast, crops are harvested two or more times per year in highly populated, often irrigated tropical or subtropical lowlands where multi-cropping systems are common. This indicates that intensification of agricultural land use is a strategy that may be able to significantly improve global food security. There exist large uncertainties regarding extent of cropland, harvested crop area and therefore cropping intensity at larger scales. Satellite imagery and remote sensing techniques provide opportunities for decreasing these uncertainties and to improve the MIRCA2000 inventory.
1. Introduction
Due to population increase, changes in the composition of the human diet and increasing demand for bio-fuels, it is necessary to increase global crop production in order to avoid a new era of malnutrition and hunger [1,2,3,4,5]. So far, the discussion on how to achieve the required increase of crop production has been mainly restricted to the question of how many resources (e.g., water, nutrients, energy, germplasm) are needed, and whether an extension of the global cropland will be necessary or whether an increase of crop yields will be sufficient [6,7,8,9,10,11]. In this manuscript, we focus on analyzing cropland use intensity, another major determinant of total crop production. Cropping intensity is defined as the number of crops harvested per year and large differences are reported in both space and time. Shifting cultivation is still practiced by millions of farmers mainly in the tropics and subtropics and crop cultivation is interrupted in these systems by fallow periods that may last decades [12,13,14]. In contrast, up to four crops are harvested per year in very intensive land use systems under similar climate conditions [15,16]. Crop duration ratio is another indicator of land use intensity, which takes also the length of cropping periods into account, and which was used by other authors to describe the effects of mechanization on cropping systems in India [17]. Crop duration ratio is defined as the fraction of the year in which the cropland is covered with crops.
According to the agricultural statistics database of the Food and Agriculture Organization of the United Nations (FAO) FAOSTAT, total cropland extent at the global scale, computed as the sum of arable land and permanent crop area, is about 15.3 million km2 [18]. These statistics account for all cropland used at least once in a five-year period, but neglect areas with longer fallow periods. The total harvested crop area reported in the same database is 11.8 million km2 yr−1, indicating a global average cropping intensity of 0.77 crop harvests per year. However, the extent of fallow land is larger than the difference between global cropland extent and global harvested crop areas because many areas are harvested more than once per year. Reduction of the large fallow areas worldwide by an intensification of agricultural land use may be an option among others to increase crop production. As a first step towards a comprehensive assessment of this option, a global analysis of current cropping intensity patterns and fallow land extent is required.
Here we present a global analysis of fallow land extent, cropping intensities and related crop duration ratios around the year 2000 at the resolution of 5 arc min by 5 arc min. This analysis is based on our global agricultural land use dataset MIRCA2000 [19]. MIRCA2000 was predominantly based on agricultural census data, while remote sensing was used to develop some of the input datasets required to compile MIRCA2000 (e.g., cropland extent and area equipped for irrigation, see Figure 1). First we explain the methodology used to compute cropping intensity and extent of fallow land, introduce the crop duration ratio indicator and describe the data used to compute these indicators (Section 2). Then we show the computed patterns of fallow land extent, cropping intensity and crop duration (Section 3). We discuss the results, compare them to independent datasets and explore opportunities to improve estimates of cropping intensity by using remote sensing techniques (Section 4). Finally, we draw conclusions (Section 5).
2. Data and Methods
2.1. Data Used in this Analysis
To compute cropping intensity, crop duration ratio and the extent of fallow land we used the MIRCA2000 dataset which provides monthly growing areas of 26 irrigated and rainfed crop classes (21 major crops and the crop groups of pulses, citrus crops, fodder grasses, other perennial crops, and other annual crops) at a resolution of 5 arc min by 5 arc min [19]. MIRCA2000 represents the situation around the year 2000 (1998–2002). MIRCA2000 aims to maximize consistency with subnational statistics collected by national institutions and by the FAO.
Figure 1.
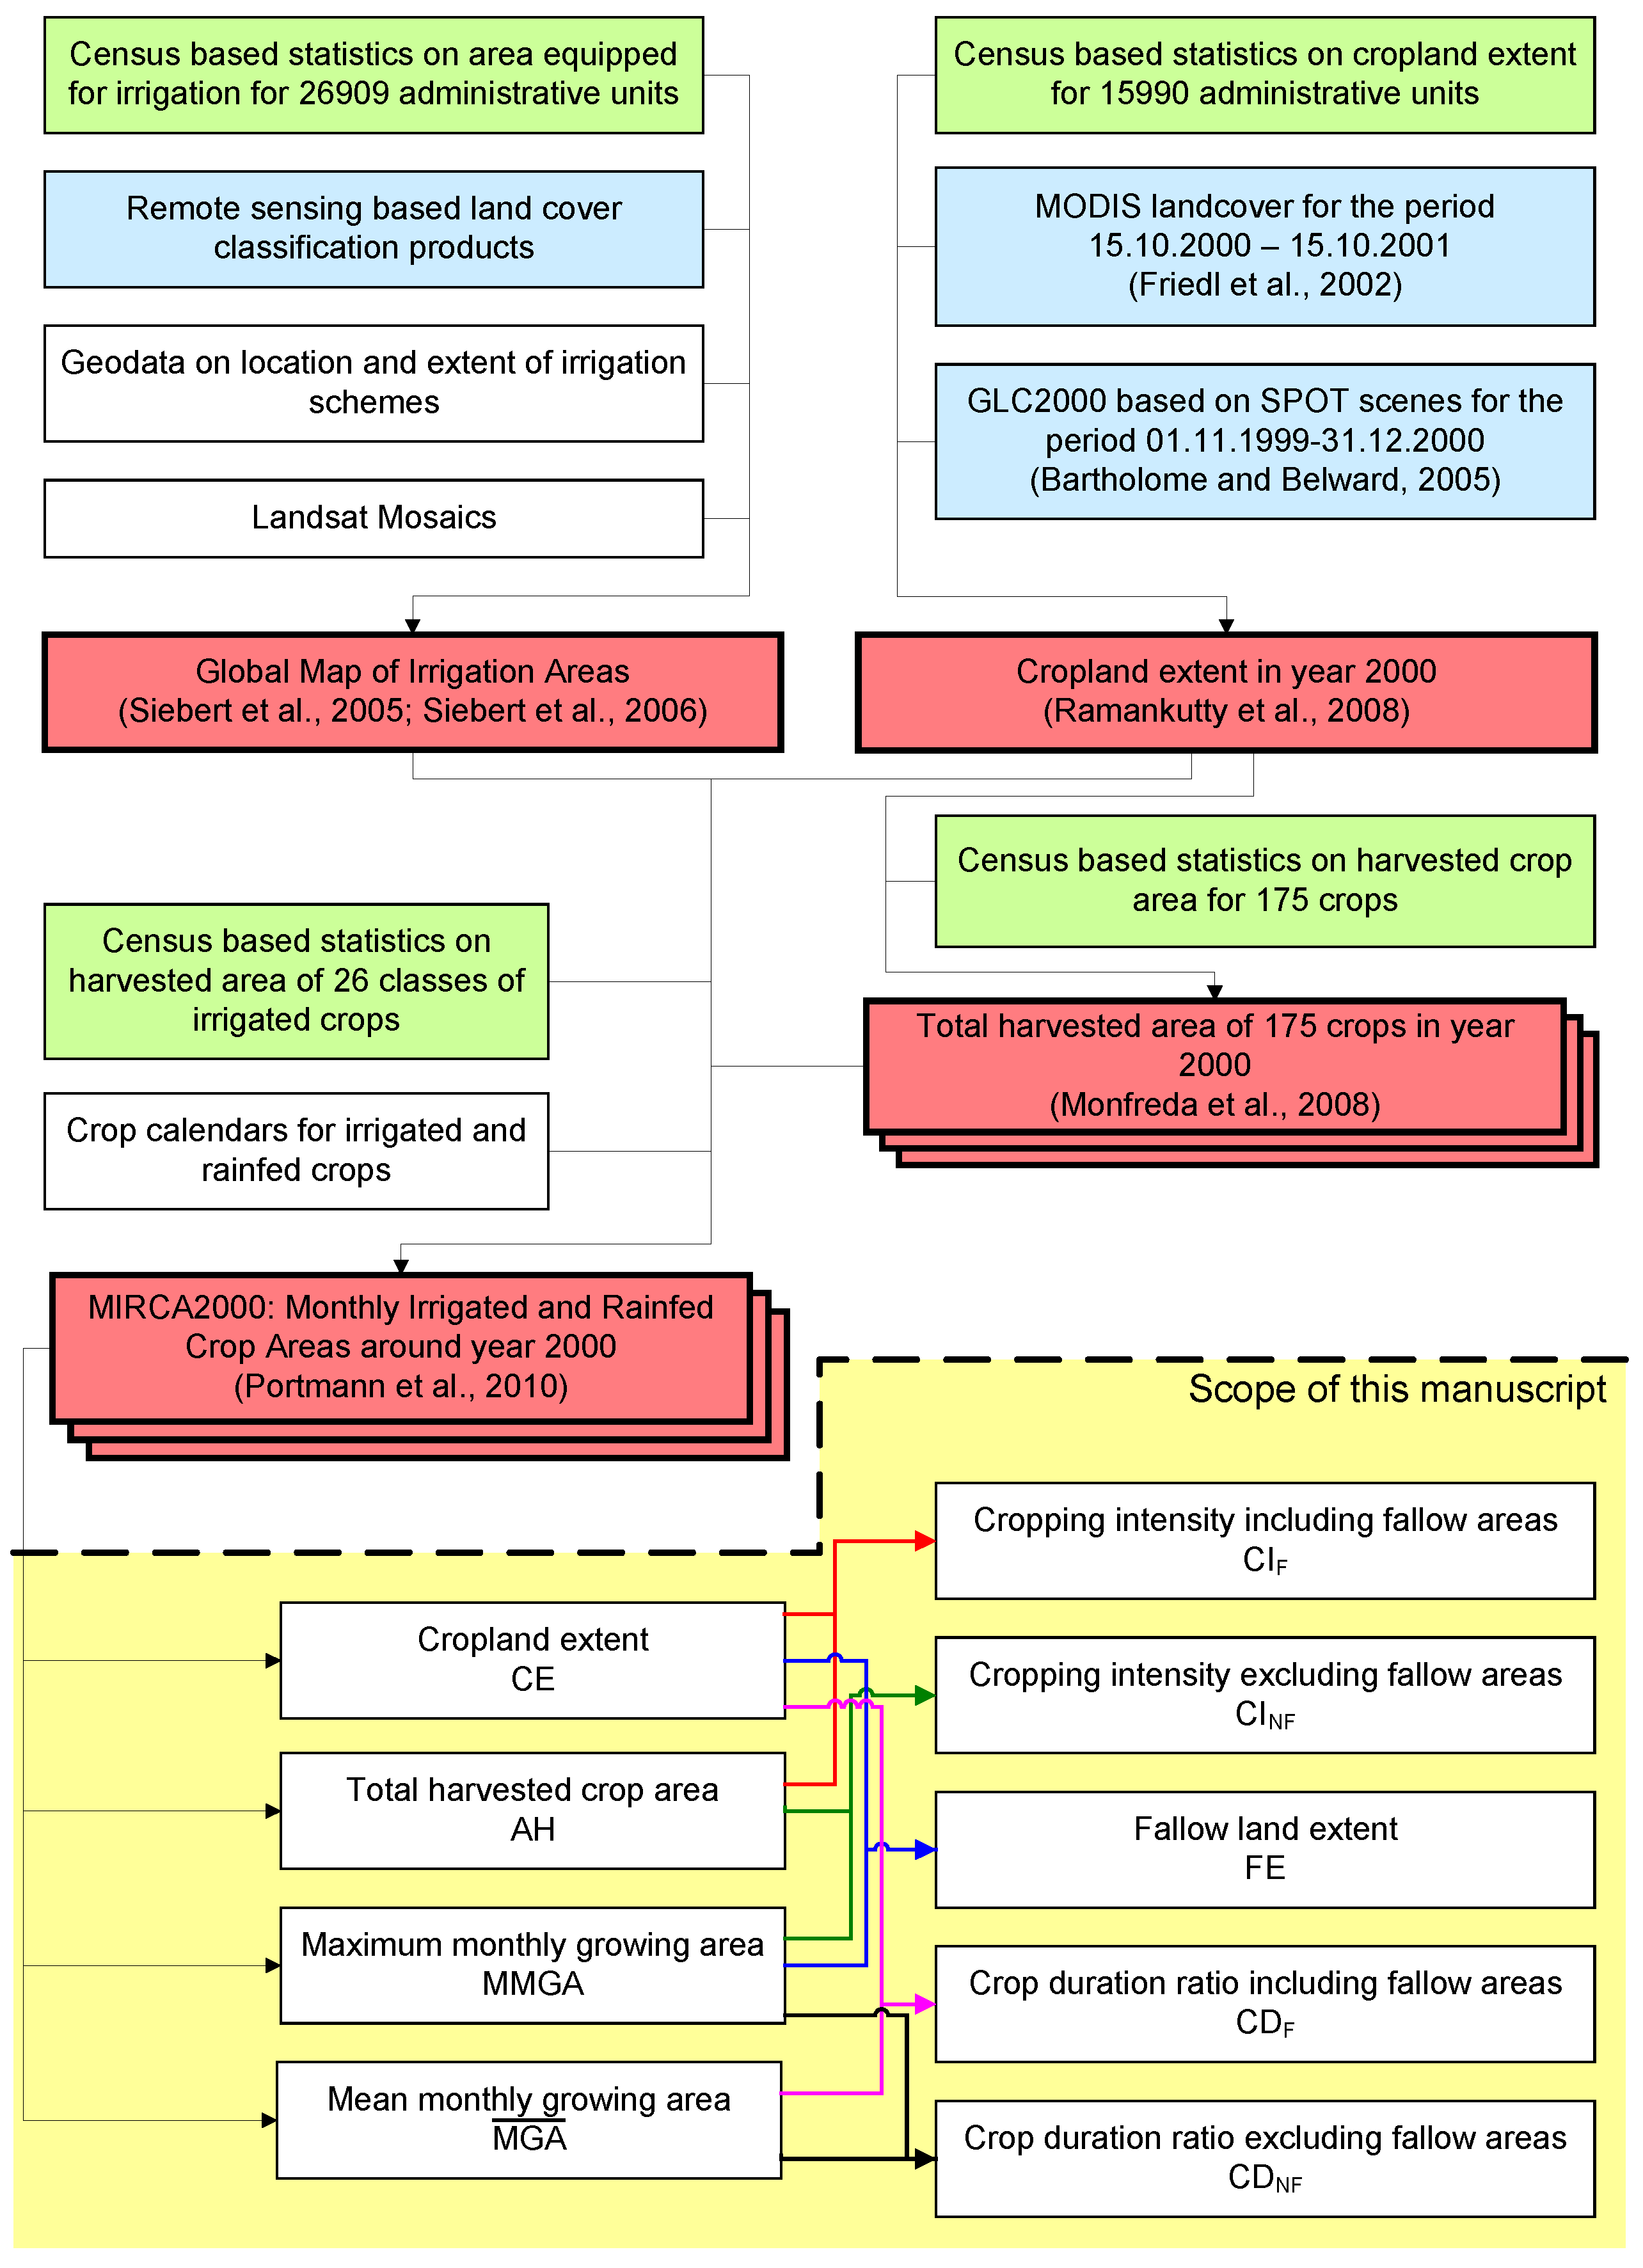
Information flow diagram showing (1) major input datasets used to generate the MIRCA2000 dataset (above the dotted line), and (2) processing of the MIRCA2000 data to compute cropping intensities, fallow extent and crop duration ratios (below the dotted line on yellow background). Red boxes indicate global grid data at 5 arc-minute resolution, blue boxes represent land cover classification products based on remote sensing and green boxes indicate statistical information derived from census based inventories.
Figure 1.
Information flow diagram showing (1) major input datasets used to generate the MIRCA2000 dataset (above the dotted line), and (2) processing of the MIRCA2000 data to compute cropping intensities, fallow extent and crop duration ratios (below the dotted line on yellow background). Red boxes indicate global grid data at 5 arc-minute resolution, blue boxes represent land cover classification products based on remote sensing and green boxes indicate statistical information derived from census based inventories.

MIRCA2000 was developed by combining geospatial data at 5 arc minute resolution for the harvested area of 175 different crops [20], cropland extent [21] and area equipped for irrigation [22,23] to subnational statistics of irrigated and rainfed harvested crop areas and to crop calendars developed for 402 spatial units (Figure 1). The procedure of distributing monthly crop growing areas to specific grid cells tried to maximize consistency between the geospatial data at 5 arc minute resolution and the reported statistics and crop calendars, according to the following criteria:
- -
- In each month and grid cell the sum of crop-specific irrigated areas is lower than or equal to the area equipped for irrigation.
- -
- In each grid cell and month the sum of crop-specific irrigated and rainfed areas is lower than or equal to the cropland extent.
- -
- In each grid cell and for each crop class the annual sum of the irrigated and rainfed harvested crop area is equal to the total (rainfed and irrigated) harvested area of the specific crop [19].
Data derived by remote sensing were not used to compile the MIRCA2000 inventory, but to develop the datasets on global cropland extent [21] and area equipped for irrigation [22,23], which were used as input (Figure 1). MIRCA2000 explicitly considers multi-cropping practices and is, including the data presented in this paper, available for download at http://www.geo.uni-frankfurt.de/ipg/ag/dl/forschung/MIRCA/index.html.
2.2. Methods Used to Compute Cropping Intensities, Crop Duration Ratios and Extent of Fallow Land
Total harvested crop area AH (km2 yr−1) was computed for each grid cell as annual sum of the harvested areas of all 26 irrigated and rainfed crops, while cropland extent CE (km2) was directly provided by the MIRCA2000 dataset. It is important to note that AH and CE computed here differ in particular at the grid cell level from the quantities used as input data to develop the MIRCA2000 dataset [20,21], because of inconsistencies between the different input data used to generate MIRCA2000 [19]. The total global sum of CE is 16.0 million km2 while total AH is 13.1 million km2 yr−1. Cropping intensity CIF (yr−1), which indicates the average annual number of crop harvests on the total cropland, was computed for each grid cell as
CE includes areas that are temporarily fallow [21]. Cropping intensity excluding fallow areas CINF (yr−1) was computed as
where MMGA is the maximum monthly growing area (km2), computed by adding together the growing areas of all irrigated and rainfed crops for each of the 12 months and by afterward selecting the maximum of the 12 total monthly growing areas. Thus, MMGA does not include fallow land and the calculation procedure assumed that crops with non-overlapping cropping periods, such as wheat from October to March and rice from April to September, would be grown on the same piece of land. Cropping intensities were already computed this way and presented in Portmann et al. [19] (but referred to as CI_min and CI_max there). The extent of fallow cropland FE (km2) was computed as
Thus, FE represents the difference between total cropland extent, including fallow land, and the maximum monthly extent of cropped agricultural land. If, for example, in a grid cell, half of the cropland was harvested twice a year and the other half of the cropland was fallow, AH and CE would be equal to cropland area, MMGA would be half of the cropland, CIF would be 1.0, CINF would be 2.0 and FE would be half of the cropland when applying Equations (1–3). The crop duration ratio CD (-) can be computed at the field scale as the ratio of the number of days a field is cropped and the total number of days within the observation period. Here, at the macro scale, we computed CDF (-) for each grid cell as
where is the mean growing area, i.e., the average of the 12 monthly growing areas within the grid cell (km2). Since CE also accounts for fallow land, CDF is reduced in the presence of fallow land. CDNF (-) was therefore additionally computed explicitly for areas cropped at least once in a year and neglecting therefore fallow land areas as
CDF can be in the range between 0 (all cropland is fallow) and 1 (all cropland is permanently cropped, e.g., for permanent crops or in intensive multi-cropping systems) while CDNF needs to be always larger than 0. If, for example, in a grid cell on half of the cropland a crop was grown for six months and half of the cropland was fallow, CDF would be 0.25 and CDNF would be 0.50.
The calculation of cropping intensities CIF and CINF, of crop duration ratios CDF and CDNF and of fallow cropland extent FE is additionally illustrated in Figure 1. Regional averages, as presented later in this paper, were computed in a similar way using Equations (1–5). For example, to compute the regional average of crop duration ratio CDF, we computed the sum of cropland extent CE in all grid cells belonging to the specific region and the sum of mean growing areas of all grid cells belonging to the region and divided then the regional sum of by the regional sum of CE.
3. Results
Around the year 2000, total fallow extent (FE) was 4.4 million km2 or 28% of the total cropland extent (Table 1). Global average cropping intensity was 0.82 including fallow land (CIF) and 1.13 excluding fallow land (CINF). Crop duration ratio was 0.49 including fallow land (CDF) and 0.68 excluding fallow land (CDNF). This means that, on average, the global cropland was cropped about half of the time during the reference period 1998–2002 (Table 1).
The largest amounts of fallow cropland were computed for the United Nations (UN) regions of Northern America and Eastern Europe (including Russian Federation), while the extent of fallow cropland was particularly low in Western Europe and the Caribbean (Table 1). Only in Eastern and Southern Asia total harvested area was larger than cropland extent, resulting in a CIF larger than one, while CIF was lowest for Southern Africa (0.45) and Central America (0.49). When excluding fallow land, cropping intensity was largest in Eastern Asia (1.35), Southern Asia (1.29), Oceania (1.29) and Northern Africa (1.22), while CINF was lowest for Middle Africa (0.99) and the regions with temperate climate where only one crop harvest per year is possible [19]. CDF was largest for Western Europe (0.63), where only small portions of the cropland were fallow and additionally large areas were cultivated with winter cereals that have a long cropping period. In contrast, CDF was lowest for Southern Africa and Central America (0.27), indicating that on average about a quarter of the total cropland extent was actually cropped at any month in these regions. When excluding fallow lands, the crop duration ratio was largest in the Caribbean (0.81) and in Central Asia (0.80) and lowest in Western Africa (0.59).

Table 1.
Total cropland extent CE (1000 km2), fallow land extent FE (1000 km2), cropping intensity including fallow land CIF (yr-1) [19], cropping intensity excluding fallow land CINF (yr-1) [19], crop duration ratio on croplands including fallow land CDF (-) and crop duration ratio on croplands excluding fallow land CDNF (-) per UN region, continent and at the global scale.
| Region | CE (1,000 km2) | FE (1,000 km2) | CIF (yr−1) | CINF (yr−1) | CDF (-) | CDNF (-) |
| AFRICA | 2,318 | 777 | 0.72 | 1.09 | 0.41 | 0.62 |
| Eastern | 550 | 198 | 0.71 | 1.11 | 0.39 | 0.61 |
| Middle | 280 | 129 | 0.54 | 0.99 | 0.35 | 0.65 |
| Northern | 420 | 161 | 0.76 | 1.22 | 0.42 | 0.69 |
| Southern | 180 | 106 | 0.45 | 1.10 | 0.27 | 0.64 |
| Western | 889 | 184 | 0.83 | 1.05 | 0.47 | 0.59 |
| AMERICA | 4,051 | 1,159 | 0.73 | 1.02 | 0.47 | 0.65 |
| Caribbean | 79 | 34 | 0.61 | 1.08 | 0.46 | 0.81 |
| Central | 460 | 249 | 0.49 | 1.06 | 0.27 | 0.60 |
| Northern | 2,278 | 615 | 0.73 | 1.00 | 0.49 | 0.67 |
| South | 1,234 | 260 | 0.82 | 1.04 | 0.50 | 0.64 |
| ASIAa | 6,201 | 1,612 | 0.94 | 1.26 | 0.50 | 0.68 |
| Central | 352 | 119 | 0.72 | 1.08 | 0.53 | 0.80 |
| Eastern | 1,726 | 405 | 1.04 | 1.35 | 0.52 | 0.68 |
| South-Eastern | 1,218 | 392 | 0.80 | 1.17 | 0.48 | 0.71 |
| Southern | 2,445 | 550 | 1.00 | 1.29 | 0.50 | 0.64 |
| Westerna | 461 | 146 | 0.74 | 1.08 | 0.50 | 0.73 |
| EUROPEb | 3,088 | 729 | 0.77 | 1.00 | 0.56 | 0.74 |
| Easternb | 2,083 | 594 | 0.72 | 1.00 | 0.55 | 0.76 |
| Northern | 216 | 36 | 0.84 | 1.00 | 0.59 | 0.71 |
| Southern | 430 | 73 | 0.84 | 1.02 | 0.59 | 0.71 |
| Western | 359 | 26 | 0.93 | 1.01 | 0.63 | 0.67 |
| OCEANIA | 342 | 143 | 0.75 | 1.29 | 0.42 | 0.72 |
| WORLD | 16,000 | 4,419 | 0.82 | 1.13 | 0.49 | 0.68 |
- a
- excluding Russian Federation
- b
- including Russian Federation
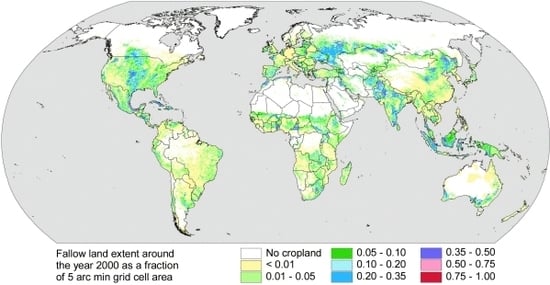
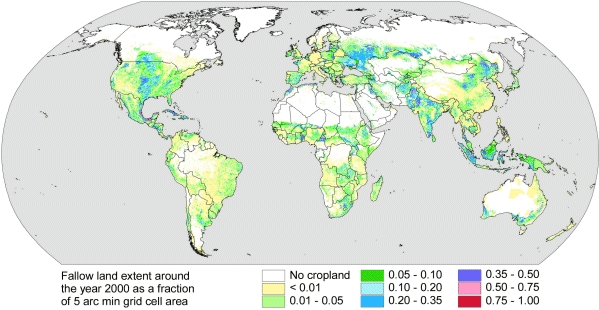
Areas with the largest density of fallow croplands expressed as a percentage of grid cell area are found in the central part of the United States of America and Canada, along the Mexican coast of the Gulf of Mexico, in southwest Russian Federation and the Ukraine, in southern Australia, in northeast China, northern Pakistan, parts of India and in many regions of Southeast Asia (Figure 2b). More than 75% of the cropland is fallow in particular in arid, rainfed crop areas, e.g., in the western United States of America, along the west coast of South America, Southern Africa, Central Asia, and also in regions where shifting cultivation is practiced like in South-Eastern Asia, Madagascar or parts of tropical Africa. In contrast, less than 1% of the total cropland is fallow in many parts of western Europe, eastern China, southern Brazil, northeastern Argentina and the northeastern part of the United States of America, especially south of the Great Lakes (Figure 2c).
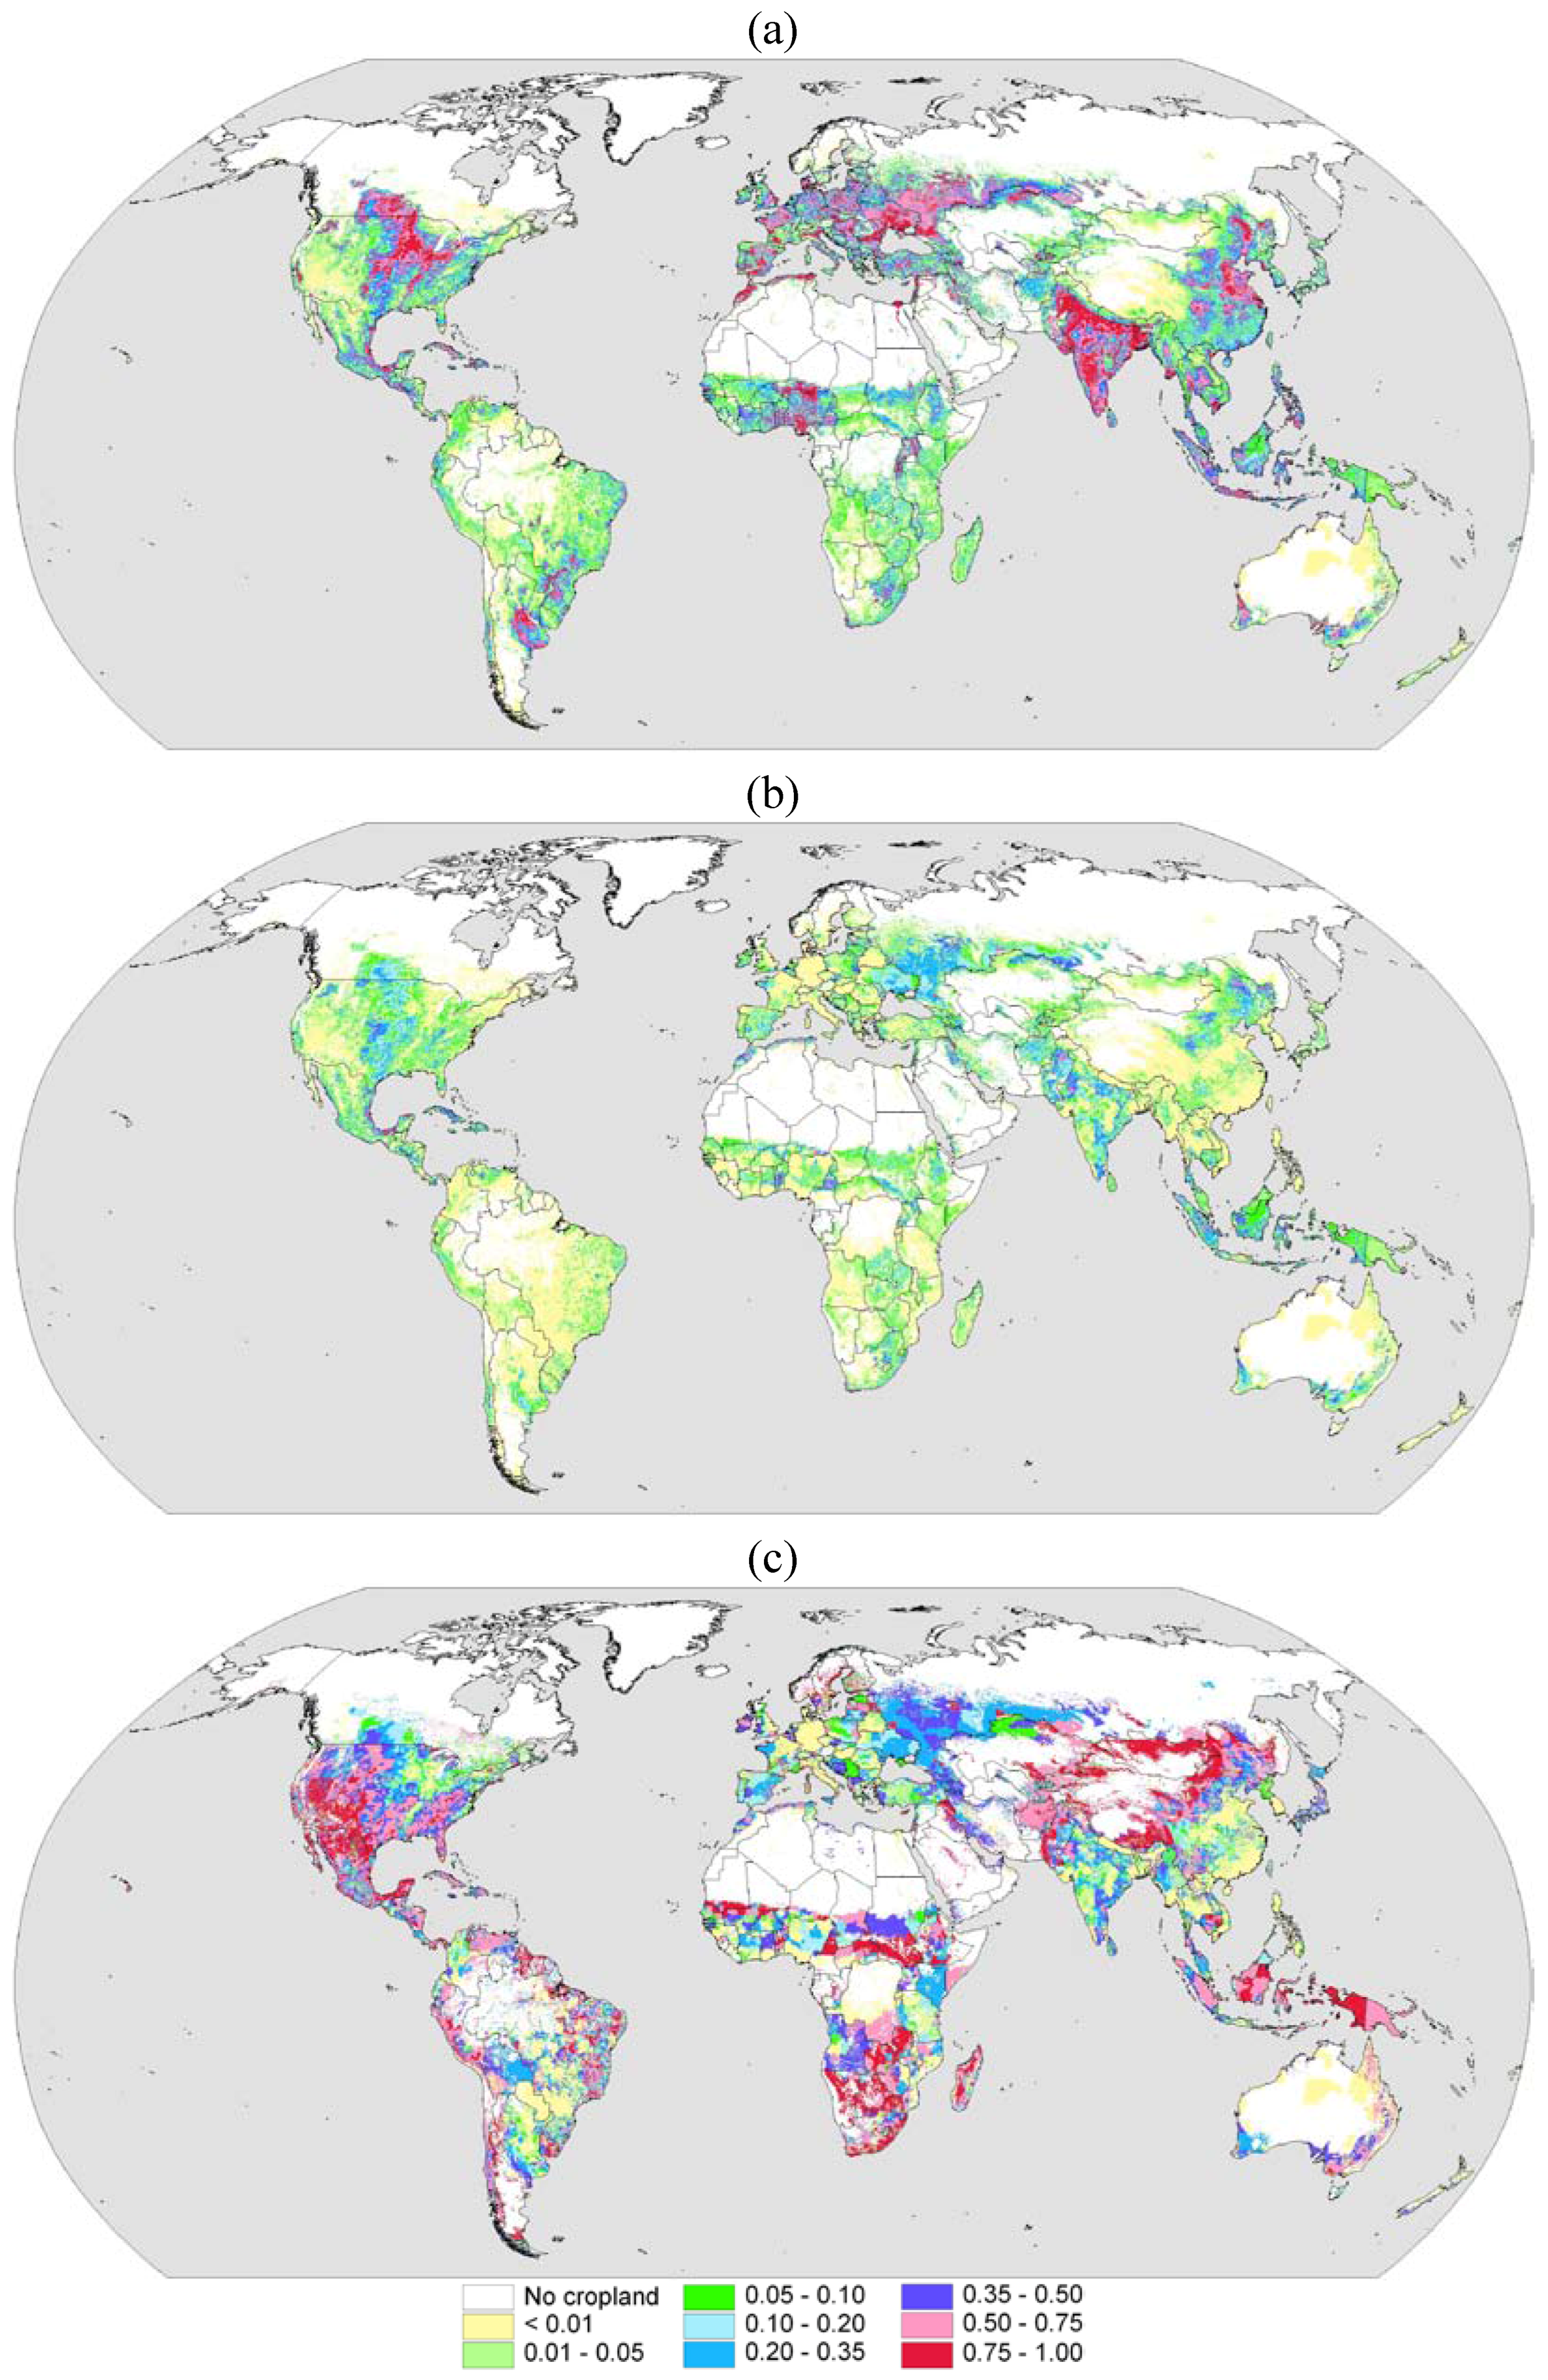
The spatial pattern of CIF shows the lowest values in arid regions without irrigation infrastructure because of restricted water availability (e.g., western United States of America, parts of sub-Saharan Africa, especially in Southern Africa, Western Asia, and Mongolia) or in regions where shifting cultivation is practiced and long fallow periods are required to sustain soil fertility (in Asia in Indonesia on the islands of Borneo, Sumatra and Celebes, in western New Guinea, or in Africa in Madagascar). CIF is largest in irrigated regions where a long natural growing period, availability of irrigation water and short cropping cycles result in intensive multi-cropping systems like in Bangladesh, northern India, southeast China or the deltas of large rivers like the Nile or the Mekong (Figure 3a). CINF is close to one for all regions with temperate climate where due to temperature limitations more than one crop harvest per year is exceptional (Northern America, Europe, and northern Asia) or in semi-arid regions without irrigation infrastructure like northeast Brazil or southwest Africa where only one crop can be harvested in the rainy season. In contrast, CINF is largest in all regions where the climate allows crop cultivation the whole year, e.g., in tropical or subtropical regions (Figure 3b). When cropland density is high, a small difference between CIF and CINF indicates a large pressure on land resources where not much of the land can be left fallow e.g., in Bangladesh, northern India, eastern China, in Indonesia on the island of Java, on the Philippines, in Tanzania, Nigeria, southern Brazil, Europe, and the river Nile delta [19], (Figure 2a and Figure 3a,b).
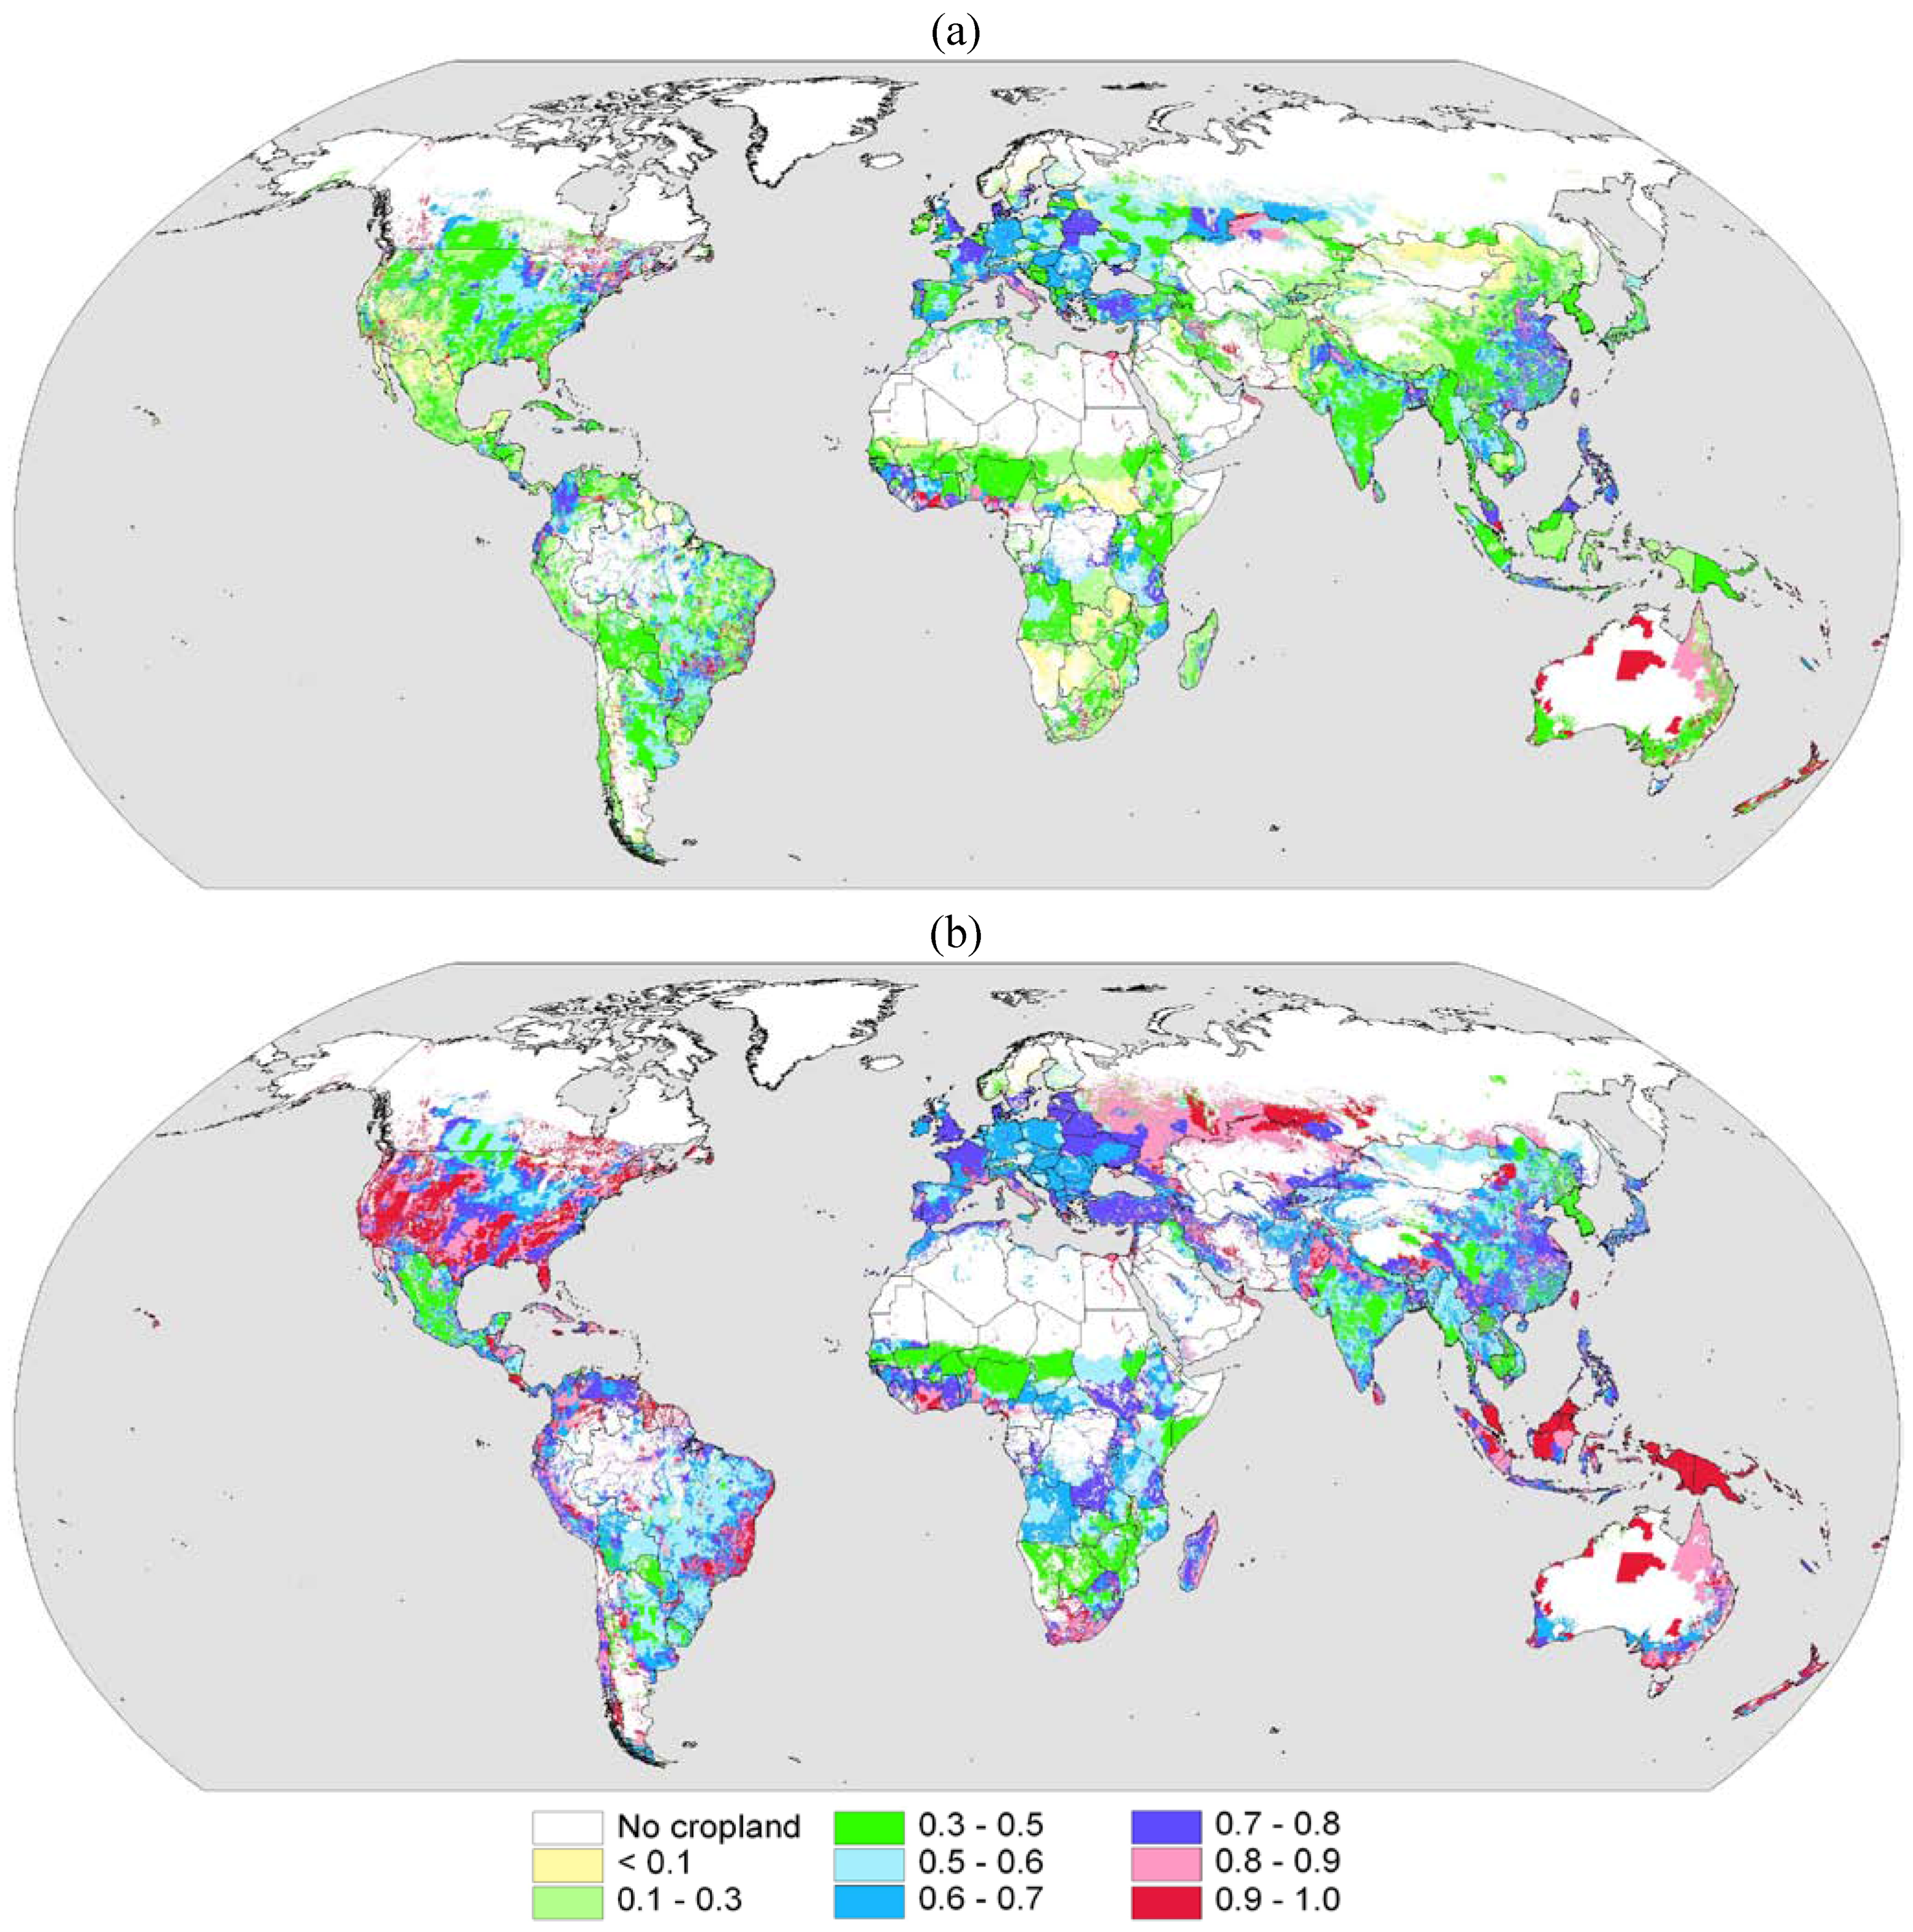
In many regions, the patterns of the crop duration ratio (Figure 4) are very similar to the patterns of cropping intensity (Figure 3). This is expected because of the definition of the terms. However, the crop duration ratio pattern differed significantly from the cropping intensity pattern in regions where permanent crops, fodder grasses or winter varieties of cereals are important. In these regions cropping intensities were relatively low but crop duration ratios were high (e.g., Russian Federation, Australia, parts of the western United States of America). The area where total cropland is on average cropped more than half of the year (CDF > 0.5) is limited to the northeastern part of the United States of America, large parts of Europe, eastern China, northern India, western Venezuela, eastern Argentina, Uruguay, southern Brazil, and small areas in western and eastern Africa and in many irrigated regions (Figure 4a). In contrast, even when excluding fallow areas, cropland is on average cropped less than half of the year in many areas of sub-Saharan Africa, the central part of South America, Mexico, the central part of North America, large regions of northern China and in central and western India (CDNF < 0.5, Figure 4b). This indicates short cropping seasons and only one crop harvest per year.
Figure 2.
(a) Cropland extent derived from the MIRCA2000 dataset [19] as a fraction of total grid cell area, (b) fallow cropland as a fraction of total grid cell area, (c) fallow cropland as a fraction of cropland extent.
Figure 2.
(a) Cropland extent derived from the MIRCA2000 dataset [19] as a fraction of total grid cell area, (b) fallow cropland as a fraction of total grid cell area, (c) fallow cropland as a fraction of cropland extent.

Figure 3.
Global cropping intensity (yr−1) (a) Cropping intensity when including fallow land in cropland extent. (b) Cropping intensity when excluding fallow lands from the calculation of cropping intensity.
Figure 3.
Global cropping intensity (yr−1) (a) Cropping intensity when including fallow land in cropland extent. (b) Cropping intensity when excluding fallow lands from the calculation of cropping intensity.
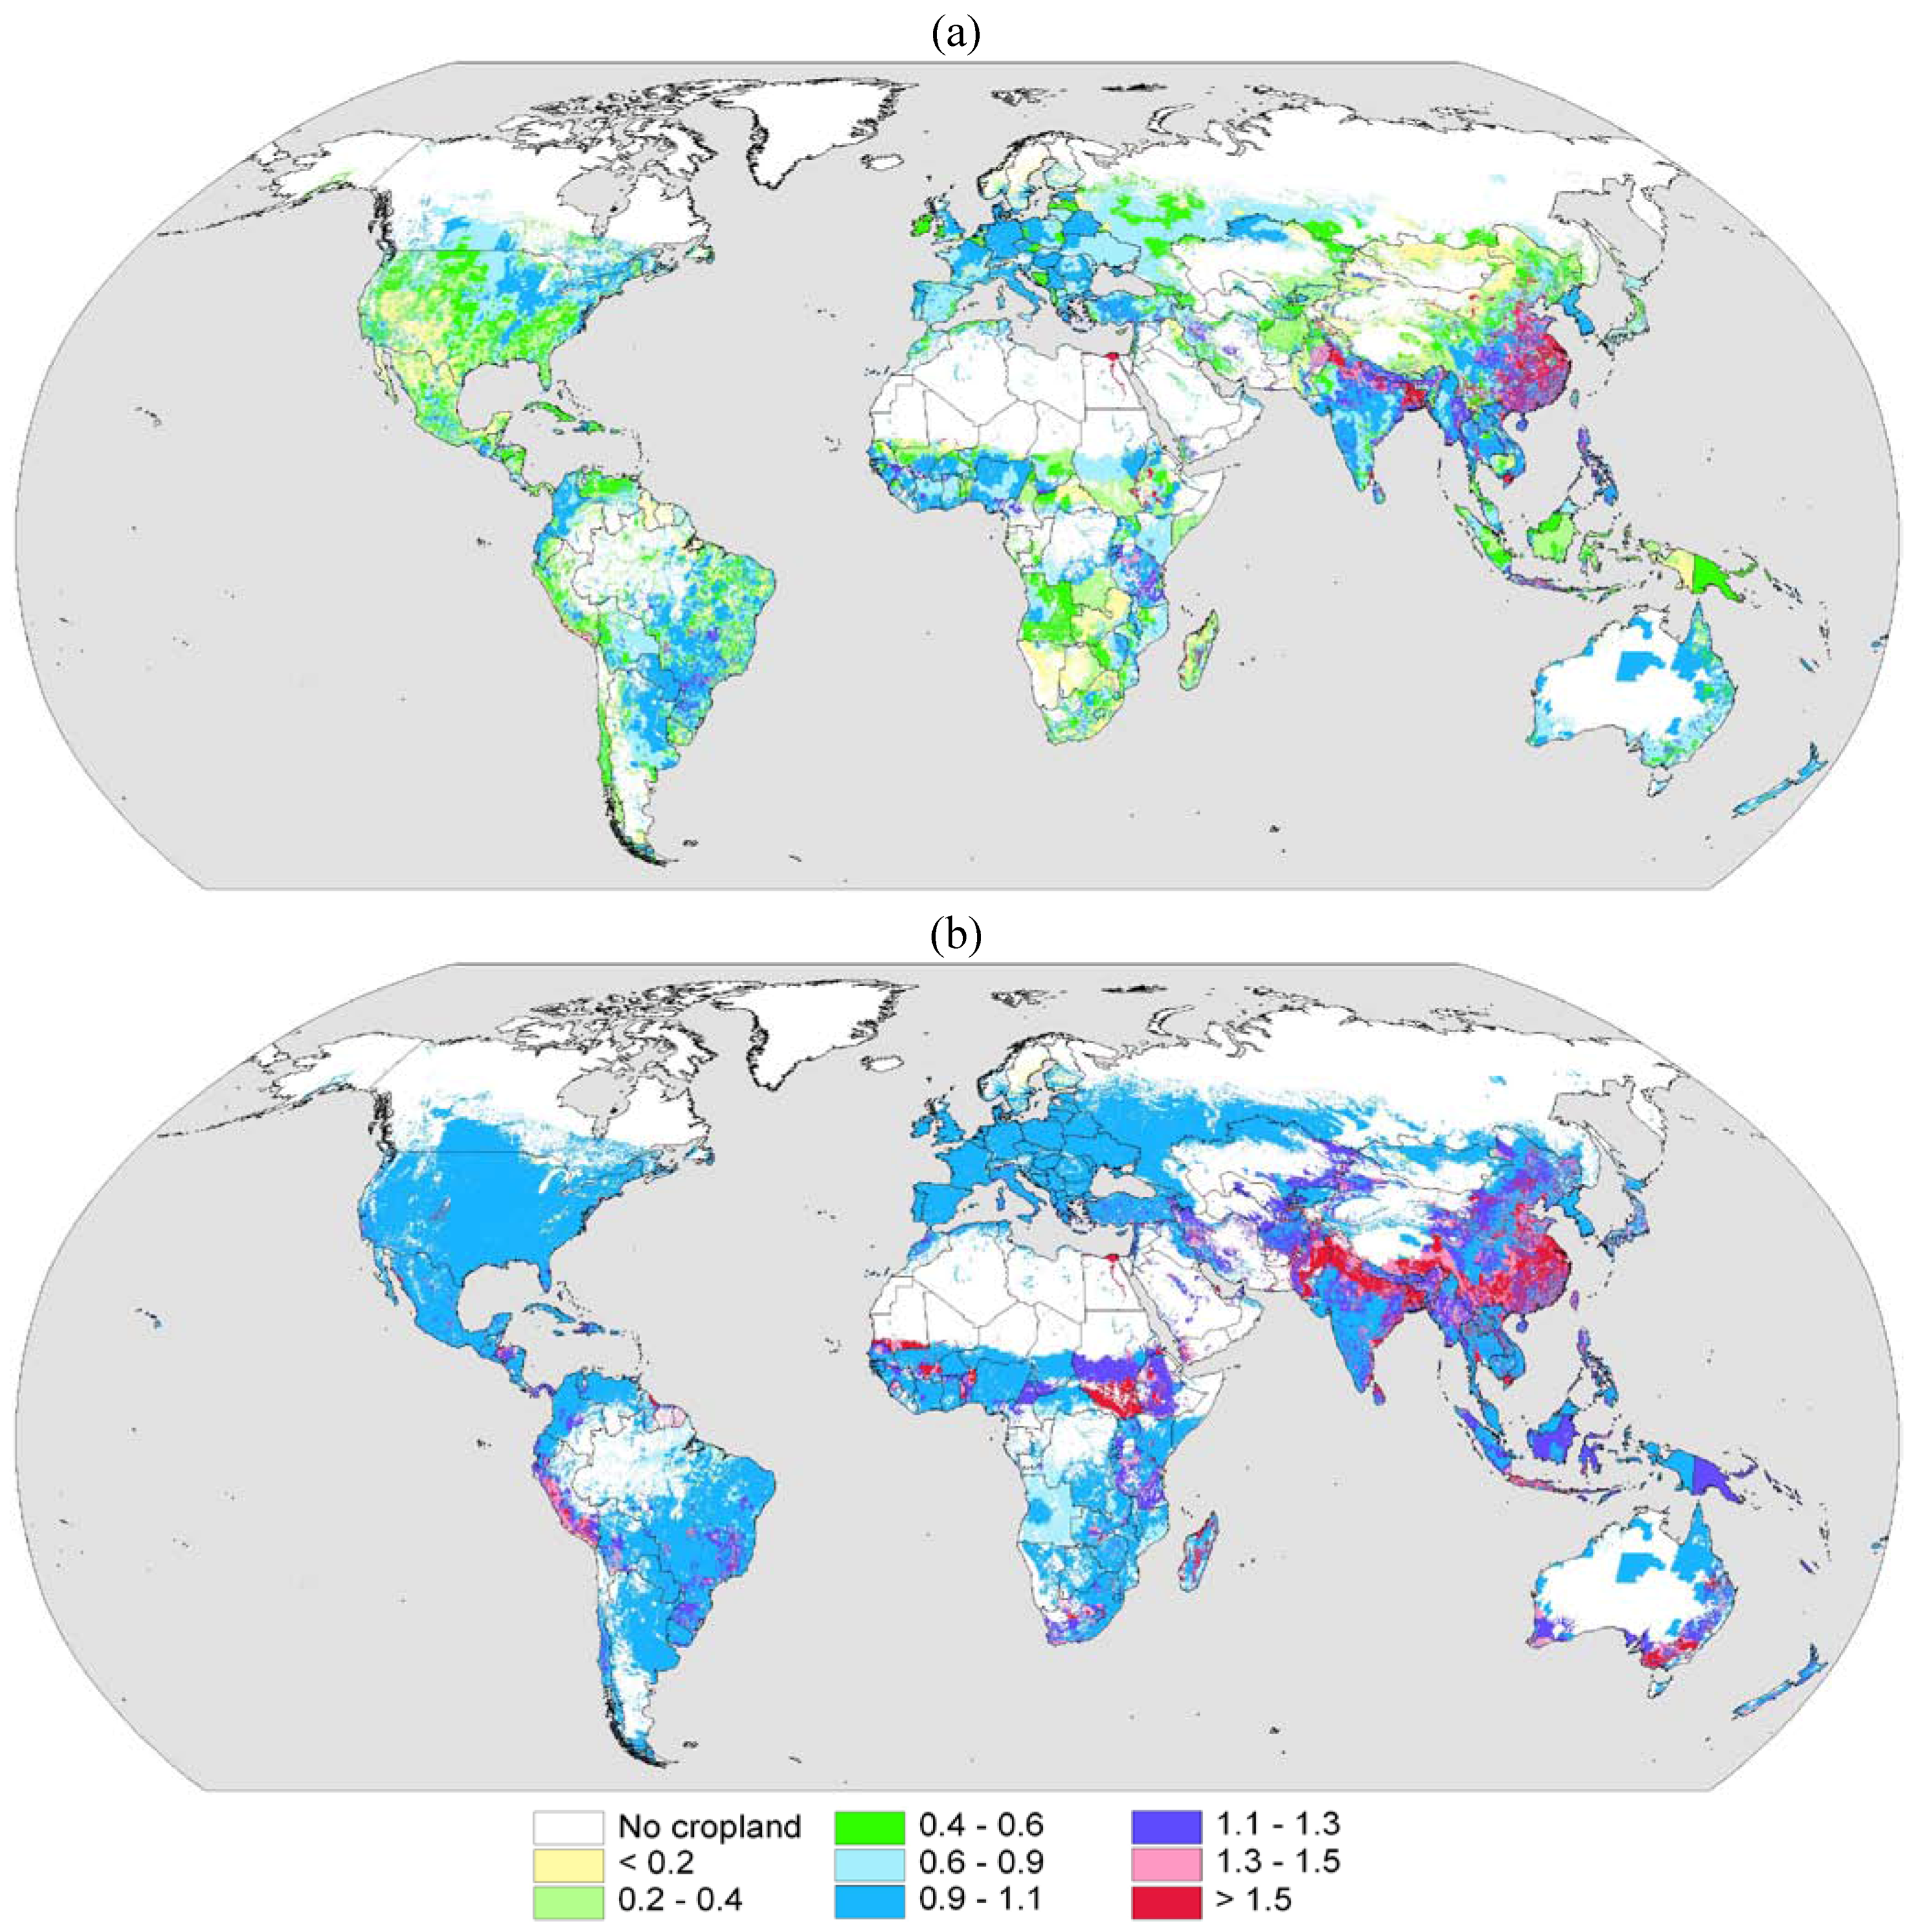
Figure 4.
Crop duration ratio on the global cropland (a) Crop duration ratio when including fallow land in cropland extent. (b) Crop duration ratio when excluding fallow land from the calculation.
Figure 4.
Crop duration ratio on the global cropland (a) Crop duration ratio when including fallow land in cropland extent. (b) Crop duration ratio when excluding fallow land from the calculation.
4. Discussion
4.1. Comparison to Independent Data
The patterns of global fallow land extent and of the related cropping intensity fit well to statistics on land use contained in agricultural census reports or international databases [18,24,25,26]. For example, the United States of America agricultural census, undertaken in the year 2002, reported the largest differences between total cropland extent and harvested crop area for the states of Texas (8.5 million ha), Kansas (4.3 million ha) and Montana (3.9 million ha) [24]. The difference between cropland extent and harvested crop area is similar to FE there, as multi-cropping is limited to only a few regions and crops in the United States of America. The fallow extent computed by using MIRCA2000 differed by less than 1% from these statistics. However, as these census data were used to develop global inventories of harvested crop area [20] and cropland extent [21] applied as major input for MIRCA2000, these statistics cannot be used for validation purposes in a strict sense, but show nevertheless the consistency between input data used to develop MIRCA2000 and results derived from the dataset. Furthermore there is also evidence from the literature that shifting cultivation or slash-and-burn farming is practiced in many subtropical or tropical regions that have low cropping intensity and large fallow extent in MIRCA2000 [12,13,14,27,28,29,30,31]. Therefore the general pattern of cropping intensity presented in this study is reasonable, but there is a need to verify it by using independent information, e.g. obtained by remote sensing (see below).
4.2. Limitations of the Analysis
There are several limitations of the MIRCA2000 dataset and the findings presented here are subject to many uncertainties. Uncertainties contained in the input data used to develop the dataset (for a more detailed discussion see [19,20,21,22,23]) propagated into MIRCA2000. Some farming practices that have a high importance at the regional scale, like agro-forestry or intercropping, cannot be represented in MIRCA2000, and the cropping pattern presented by this global inventory represents a large simplification of the complex patterns observed in reality. The algorithms used to assign crop harvested areas to specific grid cells did not take into account soil or climate constraints (besides air temperature for temperate cereals), so that, at the grid cell level, most crops can grow in areas that are unsuitable [19,20]. The start and end of the cropping seasons is similar in MIRCA2000 for grid cells belonging to the same calendar unit which is a problem when calendar units are large and when climate conditions within the calendar unit are different. It is not clear how relevant these uncertainties may be with respect to aggregated variables like cropping intensity.
There are also limitations caused by the methods used to compute cropping intensities, crop duration ratios and fallow land extent (Equations 1–5). Uses of cropland not resulting in any crop harvest were accounted for as fallow land. This includes cropland areas used temporarily as pasture, areas sown but not harvested (crop failures) or cropland temporarily cultivated with catch or cover crops. This leads to an underestimation of the crop duration ratios. For example, the total extent of fallow land computed here for the United States of America was 54 million hectares. According to the agricultural census 2002 [24], 24 million hectares of it were used temporarily for pasture or grazing, on seven million hectares all crops failed, 15 million hectares were idle or used for cover crops or soil-improvement, but not harvested and not pastured or grazed and seven million hectares were cultivated summer fallow (cropland in sub-humid regions of the western United States cultivated for a season or more to control weeds and accumulate moisture before small grains are planted.). While a distinction of these different land uses would be very useful in general, the required data were however not available at the global scale.
Shifting cultivation systems with fallow cycles lasting longer than five years are very likely underrepresented because the statistics in most of the countries do not account for these areas in the cropland statistics [18,32], and the time series of remote sensing data used to estimate the global cropland extent may be too short to detect these areas as cropland [21]. There are many examples showing for the underestimation of the extent of shifting cultivation systems in official land use statistics in Southeast Asia [31]. The total sum of arable land and permanent crop area for Lao PDR was reported to be 1 million ha in year 2002 [18], but at the same time an inventory that is based on SPOT satellite images estimated the extent of shifting cultivation in Lao PDR at 6.5 million ha or 28% of the total country area [33]. Other studies cited in [31] indicated a similar density of shifting cultivation in Viet Nam (20% of total country area) and Myanmar (15% of total country area), which is also not reflected in the statistics used to develop the MIRCA2000 and other global cropland inventories. Therefore, the extent of cultivated land and the extent of fallow land are underestimated for these countries while average cropping intensity and crop duration ratio are very likely to be overestimated.
4.3. Satellite Remote Sensing
There is a large potential for improving estimates of cropping intensity and fallow land extent by using satellite remote sensing, e.g., by a better detection of the start and end of cropping seasons or of seasons without crop cultivation. For example, NOAA AVHRR time series were used to estimate the extent of double cropping agriculture in Asia [34], MODIS satellite imagery was used to detect vegetation phenology at the global scale [35] or in winter wheat–maize double cropping systems in northern China [36] and to map the intensity and extent of rice cropping in south and southeast Asia [37], Landsat data were combined with census data to develop maps of rice based cropping systems in China [38] while different sensors were used to map single, double and continuous cropping of irrigated crops at the global scale [39].
The main objective of the distribution of irrigated and rainfed crops and begin and end of growing seasons in MIRCA2000 is so far mainly to achieve a maximum of consistency to data used as input (geospatial and statistical information, crop calendars). Remote sensing could be used additionally as another independent data source to validate monthly growing areas on the grid cell level but also for whole administrative units. This may include vegetation index based land cover classification based on optical sensor data [40] and estimates of flooded paddy land extent based on radar data [41,42]. The potential to map areas with shifting cultivation was already indicated before. One major challenge for applications of remote sensing imagery to estimate cropping intensity at the global scale is the required spatial and temporal resolution of the satellite data. The required spatial resolution depends much on the field size, which is very different from country to country and within different regions of the same country. For an accurate estimate of total cropland extent in large scale agriculture in the United States it was sufficient to use MODIS imagery with a 500 m resolution while even Landsat imagery at 30 m resolution was to coarse to provide reliable estimates in small scale agriculture in southern China [43]. For the detection of crop phenology (start and end of cropping season) several images are required for each cropping period which is a limitation in humid regions (cloud cover) when using optical sensors with a high spatial resolution like Landsat, in particular when double or triple cropping is practiced. A combination of census data and remote sensing data can therefore offer a good alternative to replace missing or unreliable information and to improve the spatial patterns of cropping intensity and fallow land extent in datasets like MIRCA2000.
We compared results of our study to cropping intensities and fallow land extent in China as determined by Frolking et al. [38] who combined remote sensing with statistical census data. A comparison to results of the other remote sensing based studies mentioned above was not meaningful because these studies were either not specific to agricultural land [35] or limited in scope, i.e., only considering double cropping systems in Asia [34], winter wheat–maize cropping systems [36], paddy rice systems [37] or irrigated crops [39].
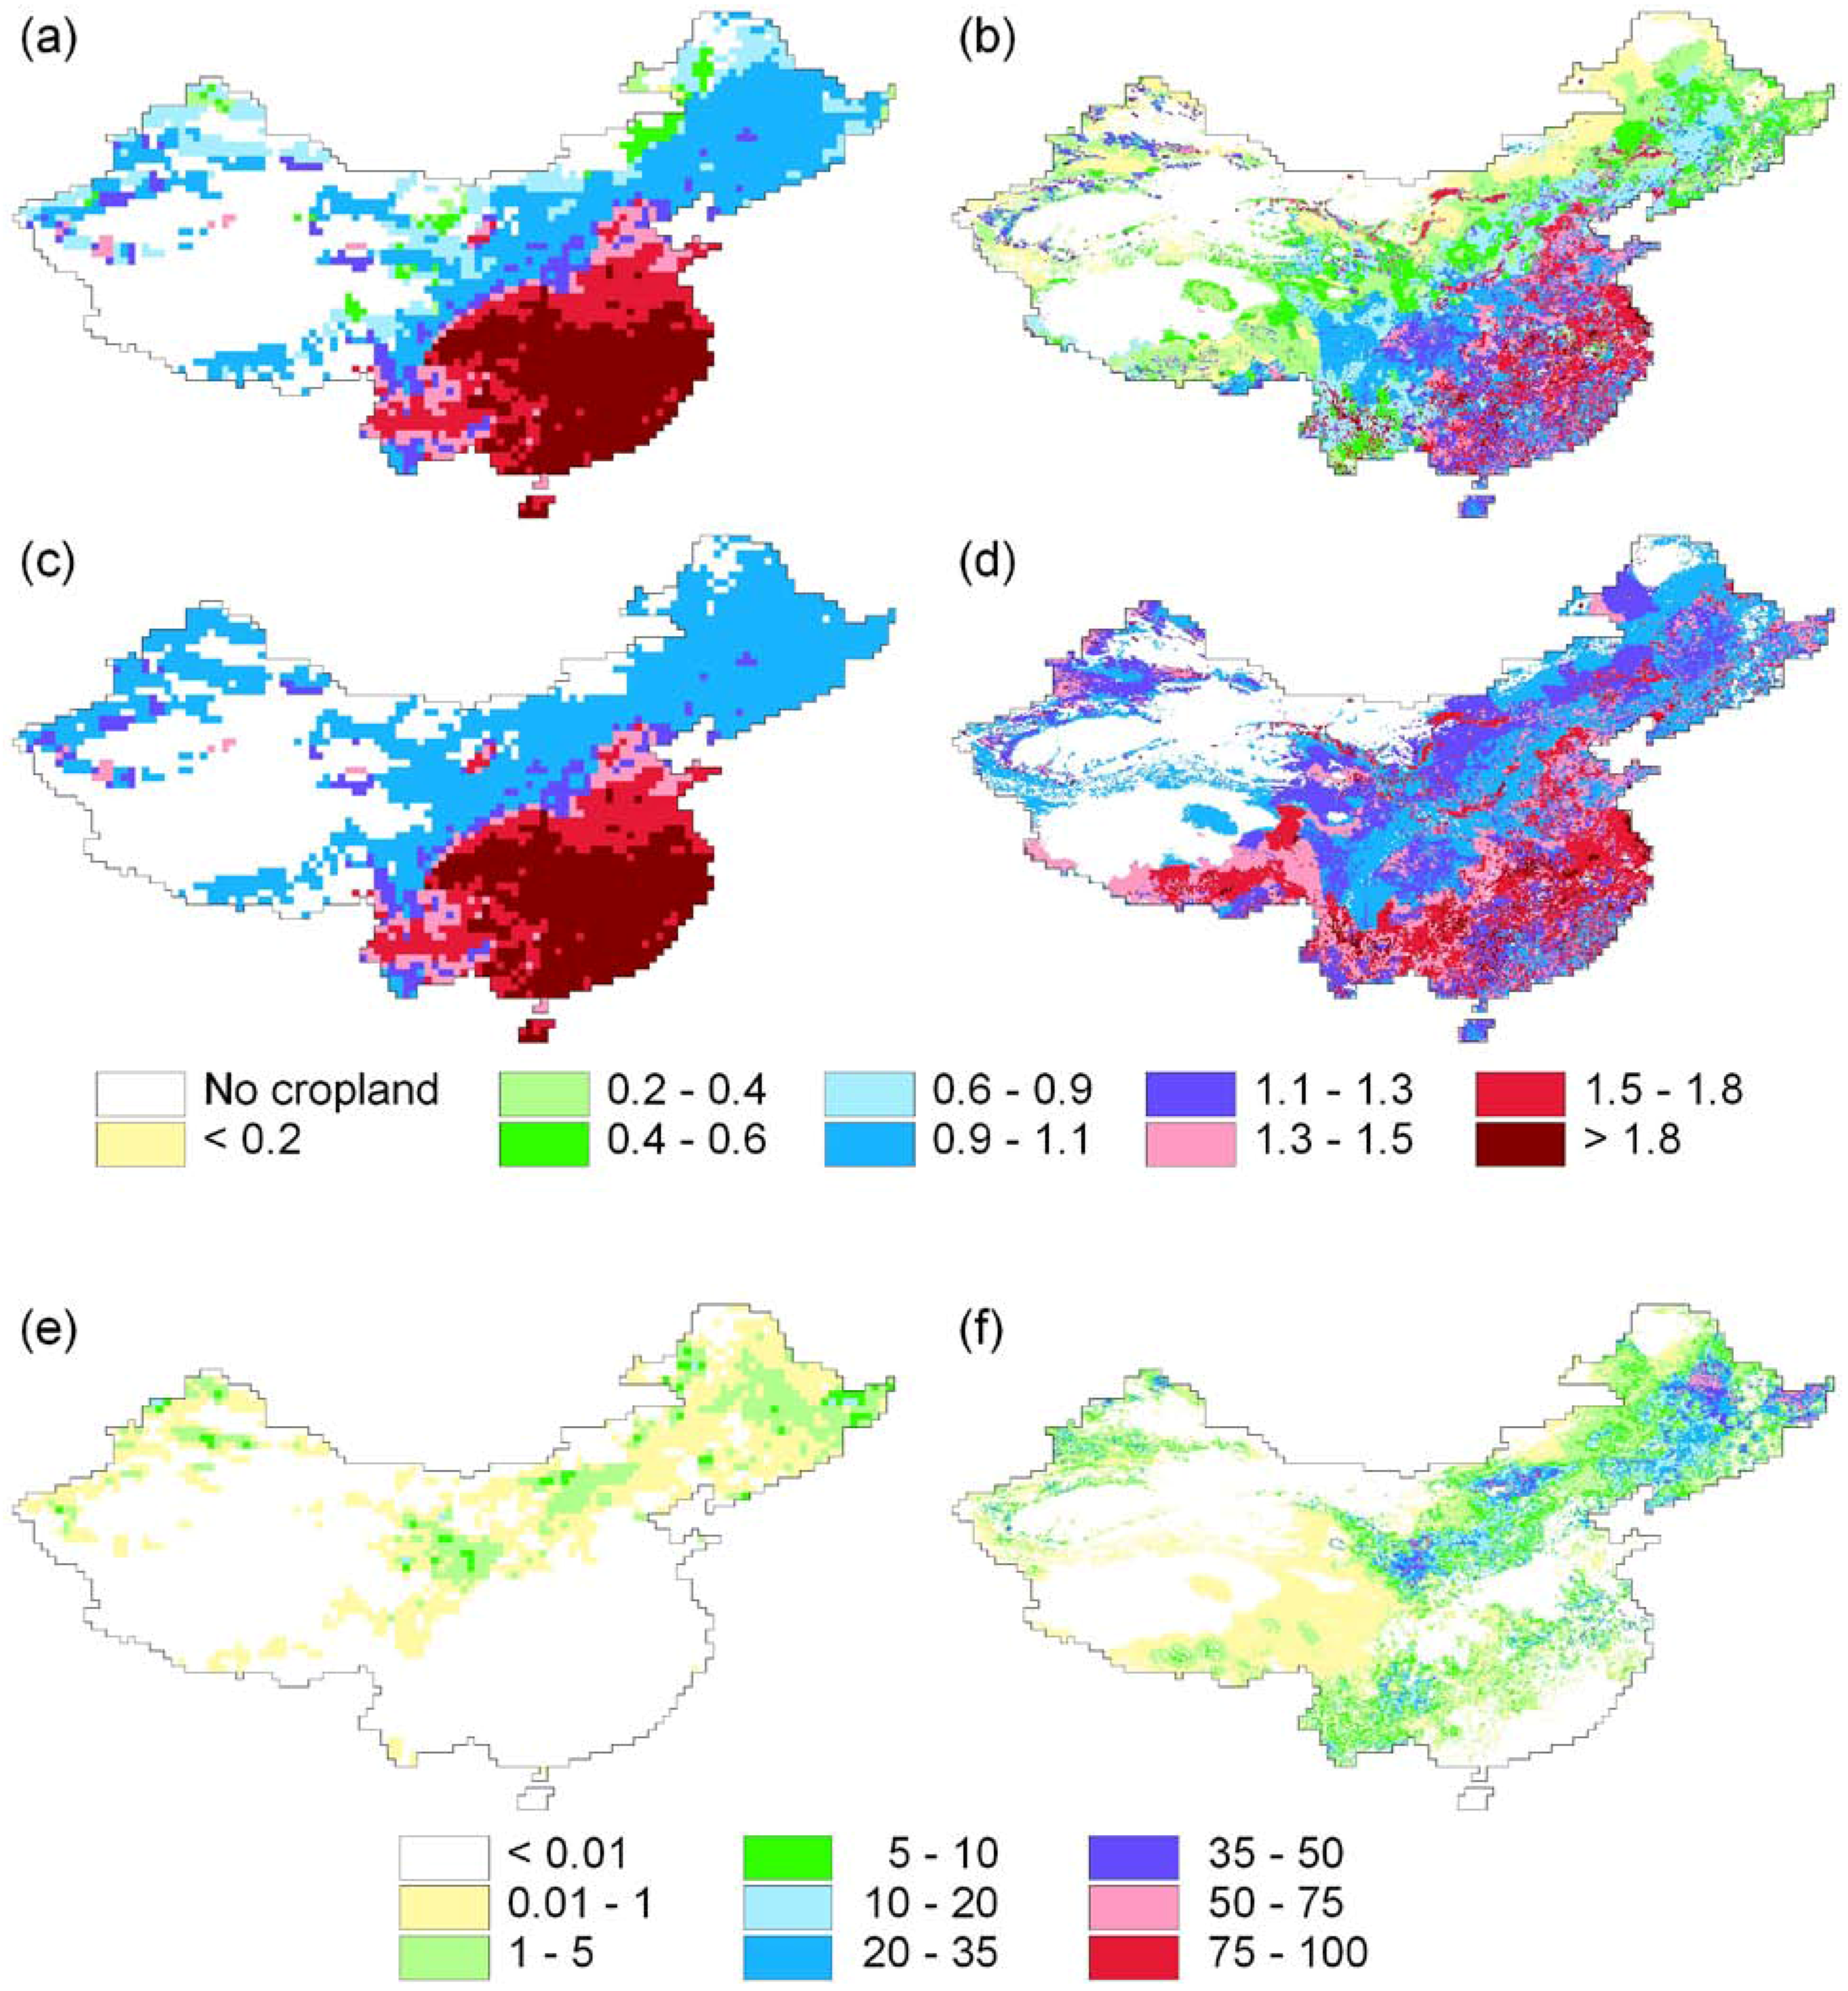
Spatial patterns of CIF, CINF and FE for mainland China are similar to those detected by Frolking et al. [38] although the magnitude is different (Figure 5). In general, cropping intensities of Frolking et al. are larger, while the extent of fallow land is smaller. These differences are mainly due to the uncertain statistical data on sown area, as the remotely-sensed estimates of cropland extent by Frolking et al. are close to statistical information for the year with remote sensing information. Frolking et al. combined cropland extent derived from a 1:100,000 scale map of land cover of China based on Landsat TM imagery for the season 1995/96 with census data on the sown area of crops. Sown area was used as a substitute for harvested area that is not reported in China. Total cropland extent computed as the sum of the paddy fields and nonflooded cropland was 1.74 million km2 in the original land cover map and 1.32 million km2 after accounting for the fraction of noncultivated land within the cropland polygons (e.g., narrow roads and footpaths, small rice paddy levees, irrigation channels and residential areas). To compute the sown crop area, Frolking et al. used data from the agricultural census at the county level for 17 major crops in the year 1990, for which total sown area (1.48 million km2) is 57% larger than cropland extent (0.95 million km2). Since census based inventories compiled before 1997 underestimated total cropland extent in China, Frolking et al. increased sown crop area derived from the census proportionally according to the ratio of remote sensing based cropland extent to cropland extent reported by the census, resulting in an adjusted total sown crop area of 1.98 million km2 and a cropping intensity of 1.50. In contrast, MIRCA2000 is mainly based on official agricultural statistics released after the revision in 1997. In that year cultivated land reported in the statistical yearbooks increased from 0.95 million km2 in 1995 to 1.30 million km2 in 1996 (very close to the 1.32 million km2 of Frolking et al.). However, total area sown was not revised in the agricultural statistics and, different from the approach taken by Frolking et al., did not increase along with cropland extent (1.50 million km2 in 1995 versus 1.52 million km2 in 1996) [44]. In MIRCA2000, cropland is estimated to be 1.59 million km2 for mainland China [19], around the year 2000, while harvested crop area (derived from sown area) is 1.68 million km2, resulting in a cropping intensity of 1.06. Consequently, total fallow land extent for mainland China computed using MIRCA2000 was 0.36 million km2 but only 0.03 million km2 in Frolking et al. and located mainly in the northern and eastern parts of China (Figure 5). The differences between the estimates of Frolking et al. and MIRCA2000 are therefore mainly due to the different treatment of the agricultural census statistics and highlight again the large uncertainty related to agricultural land use in China.
Figure 5.
Cropping intensity in China mainland (-) when including fallow land in cropland extent (a) Computed by Frolking et al [38]. (b) Computed in this inventory. Cropping intensity in China mainland (-) when excluding fallow land from cropland extent (c) Computed by Frolking et al [38]. (d) Computed in this inventory. Extent of fallow cropland as percentage of total grid cell area (e) Computed by Frolking et al [38]. (f) Computed in this inventory.
4.4. Relevance of Study Results for Agricultural Land Management
The inventory presented here should be considered as a first attempt to map cropping intensities at the global scale and the large potential for further improvements and refinements is clearly acknowledged. Nevertheless we could show that there are large differences in cropping intensity between different regions. It is required to account for this variability, for example when addressing future food security issues. Increasing cropping intensity may be one important option among others to further boost global food production, which is neglected in recent analyses of future food security [46,47]. There is a growing consensus for a close linkage between cropping intensity and population density (and thus food demand) in historical periods [6,48] while other studies show that the length of the fallow period is declining in many areas used nowadays for shifting cultivation [31]. Furthermore, global CIF increased between from 0.71 crop harvests per year in 1961 to 0.83 crop harvests per year in 2007 [18]. Additionally, studies have shown that there is a linkage between cropping intensity and crop yield. For example, length of fallow period and crop yields were positively correlated in low input, shifting cultivation systems [12]. In intensive multi-cropping systems minor crops are often cultivated in seasons that are not optimal for this crop [38]. In contrast, other studies showed that crop yields and cropping intensity are often positively correlated in intensive production systems [49]. Therefore analyses of yield gaps (difference between possible yields and actual yields) should consider these relations and better analyze the crop production potential of the whole crop rotation rather than focusing on single crops. Because crop yields and nutritional value can be very different between the specific crops in a crop rotation (e.g., between cereals or roots and tubers) this may require that the productivity of a whole crop rotation system is measured in a different way, e.g., as digestible energy contained in total crop harvest per unit of cropland extent and time.
5. Conclusions
The results of the research presented here reveal that the extent of fallow land is large, except in developed countries in temperate climate zones. There is a large variability of land use intensity on cropland even under similar climate conditions, from extensive shifting cultivation with decade-long periods of fallow to extremely intensive multi-cropping systems (in the tropics), and from extensive fallow areas in many of the eastern European countries to intensive land use without significant fallow areas in western Europe (under temperate climate conditions). The reasons for these differences should be investigated more in detail in order to better assess the potential of land use intensification for ensuring food security in the future. The analysis presented here provides only a first estimate of the global patterns of cropland use intensity. Main sources of uncertainty are that: (1) cropland statistics tend to underestimate shifting cultivation areas, (2) cropping intensity was computed based on crop areas harvested rather than on crop area sown so that areas of crop failure or growing areas of catch and cover crops were neglected or assigned to fallow land, and (3) complex cultivation practices like agro-forestry, intercropping or mixed cultivation are not represented in this global scale assessment. Other uncertainties are imposed through the input data used to develop the MIRCA2000 dataset. For example, the precision of national land use statistics is limited and differs from country to country. Remote sensing techniques offer an important complement or alternative to ground-based data and may therefore improve the resolution and accuracy of global cropping intensity maps. We believe that remote sensing data could in particular help to detect better the start and end of cropping seasons of annual crops resulting in more realistic spatial patterns of cropping intensity and crop duration.
Acknowledgements
We thank Navin Ramankutty and Chad Monfreda who created the foundation for the research presented here by compiling global inventories of cropland extent and crop-specific harvested area. The development of the MIRCA2000 dataset was funded by the German Research Foundation (DFG).
References
- FAO. World Agriculture: Towards 2030/2050; Interim Report; Food and Agriculture Organization of the United Nations: Rome, Italy, 2006. [Google Scholar]
- Keyzer, M.A.; Merbis, M.D.; Pavel, I.F.P.W.; van Wesenbeeck, C.F.A. Diet shifts towards meat and the effects on cereal use: Can we feed the animals in 2030? Ecol. Econ. 2005, 55, 187–202. [Google Scholar] [CrossRef]
- FAO. The State of Food and Agriculture 2008; Food and Agriculture Organization of the United Nations: Rome, Italy, 2008. [Google Scholar]
- Ragauskas, A.J.; Williams, C.K.; Davison, B.H.; Britovsek, G.; Cairney, J.; Eckert, C.A.; Frederick, W.J., Jr.; Hallett, J.P.; Leak, D.J.; Liotta, C.L.; Mielenz, J.R.; Murphy, R.; Templer, R.; Tschaplinski, T. The path forward for biofuels and biomaterials. Science 2007, 311, 484–489. [Google Scholar] [CrossRef] [PubMed]
- Liu, J.; Savenije, H.H.G. Food consumption patterns and their effect on water requirement in China. Hydrol. Earth Syst. Sci. 2008, 12, 887–898. [Google Scholar] [CrossRef]
- Koning, N.B.J.; Van Ittersum, M.K.; Becx, G.A.; van Boekel, M.A.J.S.; Brandenburg, W.A.; van den Broek, J.A.; Goudriaan, J.; van Hofwegen, G.; Jongeneel, R.A.; Schiere, J.B.; Smies, M. Long-term global availability of food: Continued abundance or new scarcity? NJAS-Wageningen. Life Sci. 2008, 55, 229–292. [Google Scholar] [CrossRef]
- Khan, S.; Hanjra, M.A. Footprints of water and energy inputs in food production—Global perspectives. Food Policy 2009, 34, 130–140. [Google Scholar] [CrossRef]
- Rockström, J.; Falkenmark, M. Semiarid crop production from a hydrological perspective: Gap between potential and actual yields. Crit. Rev. Plant Sci. 2000, 19, 319–346. [Google Scholar] [CrossRef]
- Rost, S.; Gerten, D.; Hoff, H.; Lucht, W.; Falkenmark, M.; Rockström, J. Global potential to increase crop production through water management in rainfed agriculture. Environ. Res. Lett. 2009, 4, 1–9. [Google Scholar] [CrossRef]
- Bouwman, A.F.; Beusen, A.H.W.; Billen, G. Human alteration of the global nitrogen and phosphorus soil balances for the period 1970–2050. Global Biogeochem. Cy. 2009, 23. [Google Scholar] [CrossRef]
- Neumann, K.; Verburg, P.H.; Stehfest, E.; Müller, C. The yield gap of global grain production: A spatial analysis. Agr. Syst. 2010, 103, 316–326. [Google Scholar] [CrossRef]
- Bruun, T.B.; Mertz, O.; Elberling, B. Linking yields of upland rice in shifting cultivation to fallow length and soil properties. Agr. Ecosyst. Environ. 2006, 113, 139–149. [Google Scholar] [CrossRef]
- Styger, E.; Rakotondramasy, H.M.; Pfeffer, M.J.; Fernandes, E.C.M.; Bates, D.M. Influence of slash-and-burn farming practices on fallow succession and land degradation in the rainforest region of Madagascar. Agr. Ecosyst. Environ. 2007, 119, 257–269. [Google Scholar] [CrossRef]
- Hiernaux, P.; Ayantunde, A.; Kalilou, A.; Mougin, E.; Gerard, B.; Baup, F.; Grippa, M.; Djaby, B. Trends in productivity of crops, fallow and rangelands in Southwest Niger: Impact of land use, management and variable rainfall. J. Hydrol. 2009, 375, 65–77. [Google Scholar] [CrossRef] [Green Version]
- Tanaka, K. Transformation of rice-based cropping patterns in the Mekong Delta: From intensification to diversification. Southeast Asian Stud. 1995, 33, 363–378. [Google Scholar]
- Siebert, S.; Nagieb, M.; Buerkert, A. Climate and irrigation water use of a mountain oasis in northern Oman. Agr. Water Manage. 2007, 89, 1–14. [Google Scholar] [CrossRef]
- Agarwal, B. Tractors, tubewells and cropping intensity in the Indian Punjab. J. Dev. Stud. 1984, 20, 290–302. [Google Scholar] [CrossRef]
- FAO. FAOSTAT Database. Food and Agriculture Organization of the United Nations. Available online: http://faostat.fao.org (accessed on 4 February 2010).
- Portmann, F.T.; Siebert, S.; Döll, P. MIRCA2000—Global monthly irrigated and rainfed crop areas around the year 2000: a new high-resolution dataset for agricultural and hydrological modelling. Global Biogeochem. Cy. 2010, 24. [Google Scholar] [CrossRef]
- Monfreda, C.; Ramankutty, N.; Foley, J.A. Farming the planet: 2. Geographic distribution of crop areas, yields, physiological types, and net primary production in the year 2000. Global Biogeochem. Cy. 2008, 22. [Google Scholar] [CrossRef]
- Ramankutty, N.; Evan, A.T.; Monfreda, C.; Foley, J.A. Farming the planet: 1. Geographic distribution of global agricultural lands in the year 2000. Global Biogeochem. Cy. 2008, 22. [Google Scholar] [CrossRef]
- Siebert, S.; Döll, P.; Hoogeveen, J.; Faures, J.M.; Frenken, K.; Feick, S. Development and validation of the global map of irrigation areas. Hydrol. Earth Syst. Sci. 2005, 9, 535–547. [Google Scholar] [CrossRef]
- Siebert, S.; Hoogeveen, J.; Frenken, K. Irrigation in Africa, Europe and Latin America. Update of the Digital Global Map of Irrigation Areas to Version 4; Institute of Physical Geography, University of Frankfurt (Main): Frankfurt, Germany, 2006. [Google Scholar]
- USDA. Agricultural Census 2002 Database. United States Department of Agriculture. Available online: http://www.agcensus.usda.gov/Publications/2002/index.asp (accessed on 4 February 2010).
- EUROSTAT Agriculture Database. Statistical Office of the European Communities. Available online: http://epp.eurostat.ec.europa.eu/portal/page/portal/agriculture/data/database (accessed on 4 February 2010).
- NIC. Agricultural Census Database. National Informatics Centre, Department of Agriculture & Cooperation: New Delhi, India. Available online: http://agcensus.nic.in/database.html (accessed on 4 February 2010).
- Lawrence, D.; Radel, C.; Tully, K.; Schmook, B.; Schneider, L. Untangling a decline in tropical forest resilience: Constraints on the sustainability of shifting cultivation across the globe. Biotropica 2010, 42, 21–30. [Google Scholar] [CrossRef]
- Filer, C.; Keenan, R.J.; Allen, B.J.; Mc Alpine, J.R. Deforestation and forest degradation in Papua New Guinea. Ann. For. Sci. 2009, 66. [Google Scholar] [CrossRef]
- Sovu, X.; Tigabu, M.; Savadogo, P.; Oden, P.C.; Xayvongsa, L. Recovery of secondary forests on swidden cultivation fallows in Laos. Forest Ecol. Manag. 2009, 258, 2666–2675. [Google Scholar] [CrossRef]
- Tchabi, A.; Burger, S.; Coyne, D.; Hountondji, F.; Lawouin, L.; Wiemken, A.; Oehl, F. Promiscuous arbuscular mycorrhizal symbiosis of yam (Dioscorea spp.), a key staple crop in West Africa. Mycorrhiza 2009, 19, 375–392. [Google Scholar] [CrossRef] [PubMed]
- Schmidt-Vogt, D.; Leisz, S.J.; Mertz, O.; Heinimann, A.; Thiha, T.; Messerli, P.; Epprecht, M.; Cu, P.V.; Chi, V.K.; Hardiono, M.; Dao, T.M. An assessment of trends in the extent of swidden in Southeast Asia. Hum. Ecol. 2009, 37, 269–280. [Google Scholar] [CrossRef]
- Young, A. Is there really spare land? A critique of estimates of available cultivable land in developing countries. Environ. Dev. Sustain. 1999, 1, 3–18. [Google Scholar] [CrossRef]
- Messerli, P.; Heinimann, A.; Epprecht, M. Finding homogeneity in heterogeneity—A new approach to quantifying landscape mosaics developed for the Lao PDR. Hum. Ecol. 2009, 37, 291–304. [Google Scholar] [CrossRef] [PubMed] [Green Version]
- Canisius, F.; Turral, H.; Molden, D. Fourier analysis of historical NOAA time series data to estimate bimodal agriculture. Int. J. Remote Sens. 2007, 28, 5503–5522. [Google Scholar] [CrossRef]
- Zhang, X.; Friedl, M.A.; Schaaf, C.B. Global vegetation phenology from Moderate Resolution Imaging Spectroradiometer (MODIS): Evaluation of global patterns and comparison with in situ measurements. J. Geophys. Res. 2006, 111, G04017. [Google Scholar] [CrossRef]
- Yan, H.M.; Fu, Y.L.; Xiao, X.M.; Huang, H.Q.; He, H.L.; Ediger, L. Modeling gross primary productivity for winter wheat-maize double cropping system using MODIS time series and CO2 eddy flux tower data. Agr. Ecosyst. Environ. 2009, 129, 391–400. [Google Scholar] [CrossRef]
- Xiao, X.M.; Boles, S.; Frolking, S.; Li, C.S.; Babu, J.Y.; Salas, W.; Moore, B. Mapping paddy rice agriculture in South and Southeast Asia using multi-temporal MODIS images. Remote Sens. Environ. 2006, 100, 95–113. [Google Scholar] [CrossRef]
- Frolking, S.; Qiu, J.J.; Boles, S.; Xiao, X.M.; Liu, J.Y.; Zhuang, Y.H.; Li, C.S.; Qin, X.G. Combining remote sensing and ground census data to develop new maps of the distribution of rice agriculture in China. Global Biogeochem. Cy. 2002, 16. [Google Scholar] [CrossRef]
- Thenkabail, P.S.; Biradar, C.M.; Noojipady, P.; Dheeravath, V.; Li, Y.J.; Velpuri, M.; Gumma, M.; Gangalakunta, O.R.P.; Turral, H.; Cai, X.L.; Vithanage, J.; Schull, M.A.; Dutta, R. Global irrigated area map (GIAM), derived from remote sensing, for the end of the last millennium. Int. J. Remote Sens. 2009, 30, 3679–3733. [Google Scholar] [CrossRef]
- Friedl, M.A.; McIver, D.K.; Hodges, J.C.F.; Zhang, X.Y.; Muchoney, D.; Strahler, A.H.; Woodcock, C.E.; Gopal, S.; Schneider, A.; Cooper, A.; Baccini, A.; Gao, F.; Schaaf, C. Global land cover mapping from MODIS: algorithms and early results. Remote Sens. Environ. 2002, 83, 287–302. [Google Scholar] [CrossRef]
- Salas, W.; Boles, S.; Li, C.S.; Yeluripati, J.B.; Xiao, X.M.; Frolking, S.; Green, P. Mapping and modelling of greenhouse gas emissions from rice paddies with satellite radar observations and the DNDC biogeochemical model. Aquatic Conserv: Mar. Freshw. Ecosyst. 2007, 17, 319–329. [Google Scholar] [CrossRef]
- Zhang, Y.; Wang, C.; Wu, J.; Qi, J.; Salas, W.A. Mapping paddy rice with multitemporal ALOS/PALSAR imagery in southeast China. Int. J. Remote Sens. 2009, 30, 6301–6315. [Google Scholar] [CrossRef]
- Ozdogan, M.; Woodcock, C.E. Resolution dependent errors in remote sensing of cultivated areas. Remote Sens. Environ. 2006, 103, 203–217. [Google Scholar] [CrossRef]
- USDA. China Agricultural and Economic Data. Economic Research Service of the United States Department of Agriculture. Available online: http://www.ers.usda.gov/Data/China/ (accessed on 28 April 2010).
- China Statistical Yearbook–2008; National Bureau of Statistics of China, Bejing, China. Available online: http://www.stats.gov.cn/tjsj/ndsj/2008/indexeh.htm (accessed on 28 April 2010).
- Fedoroff, N.V.; Battisti, D.S.; Beachy, R.N.; Cooper, P.J.M.; Fischhoff, D.A.; Hodges, C.N.; Knauf, V.C.; Lobell, D.; Mazur, B.J.; Molden, D.; Reynolds, M.P.; Ronald, P.C.; Rosegrant, M.W.; Sanchez, P.A.; Vonshak, A.; Zhu, J.K. Radically rethinking agriculture for the 21st century. Science 2010, 327, 833–834. [Google Scholar] [CrossRef] [PubMed]
- Godfray, H.C.J.; Beddington, J.R.; Crute, I.R.; Haddad, L.; Lawrence, D.; Muir, J.F.; Pretty, J.; Robinson, S.; Thomas, S.M.; Toulmin, C. Food security: the challenge of feeding 9 billion people. Science 2010, 327, 812–818. [Google Scholar] [CrossRef] [PubMed]
- Ruddiman, W.F.; Ellis, E.C. Effect of per-capita land use changes on Holocene forest clearance and CO2 emissions. Quaternary Sci. Rev. 2009, 28, 3011–3015. [Google Scholar] [CrossRef]
- Cassman, K.G. Ecological intensification of cereal production systems: Yield potential, soil quality, and precision agriculture. Proc. Nat. Acad. Sci. USA 1999, 96, 5952–5959. [Google Scholar] [CrossRef] [PubMed]
© 2010 by the authors; licensee MDPI, Basel, Switzerland. This article is an open access article distributed under the terms and conditions of the Creative Commons Attribution license (http://creativecommons.org/licenses/by/3.0/).
Share and Cite
MDPI and ACS Style
Siebert, S.; Portmann, F.T.; Döll, P. Global Patterns of Cropland Use Intensity. Remote Sens. 2010, 2, 1625-1643. https://doi.org/10.3390/rs2071625
AMA Style
Siebert S, Portmann FT, Döll P. Global Patterns of Cropland Use Intensity. Remote Sensing. 2010; 2(7):1625-1643. https://doi.org/10.3390/rs2071625
Chicago/Turabian StyleSiebert, Stefan, Felix T. Portmann, and Petra Döll. 2010. "Global Patterns of Cropland Use Intensity" Remote Sensing 2, no. 7: 1625-1643. https://doi.org/10.3390/rs2071625