Non-Lambertian Corrected Albedo and Vegetation Index for Estimating Land Evapotranspiration in a Heterogeneous Semi-Arid Landscape

Abstract
:1. Introduction
2. Methods
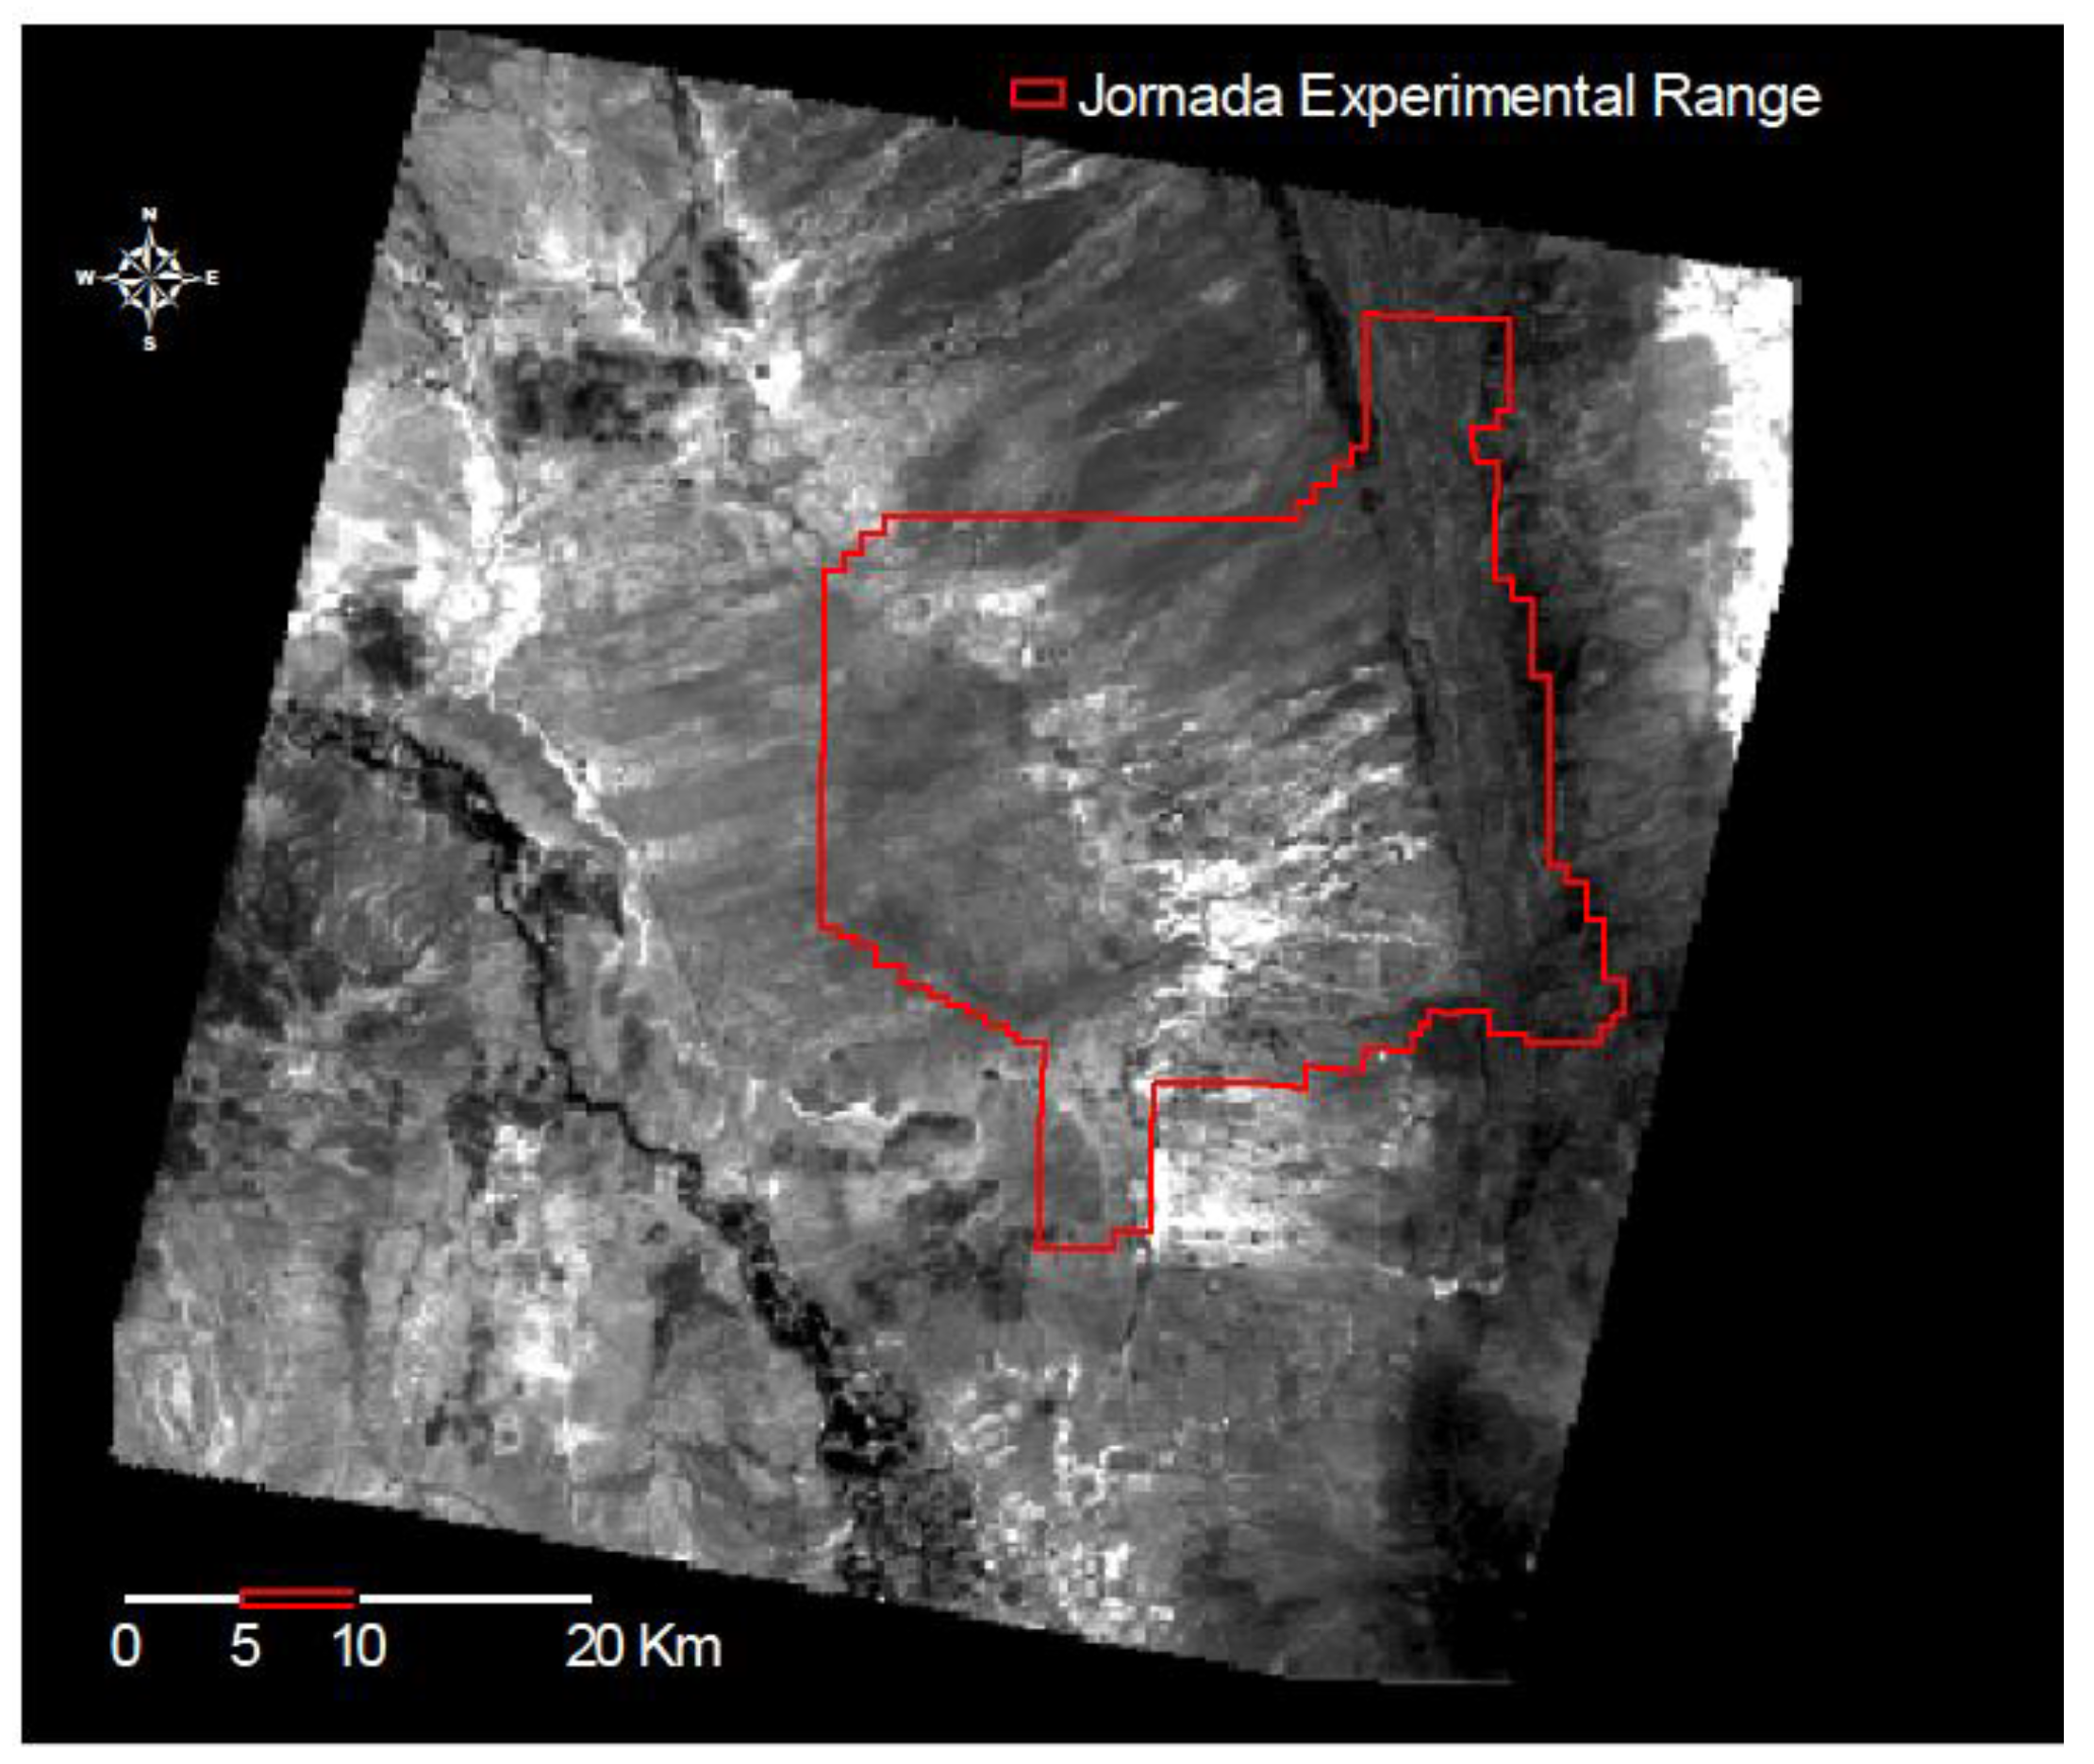
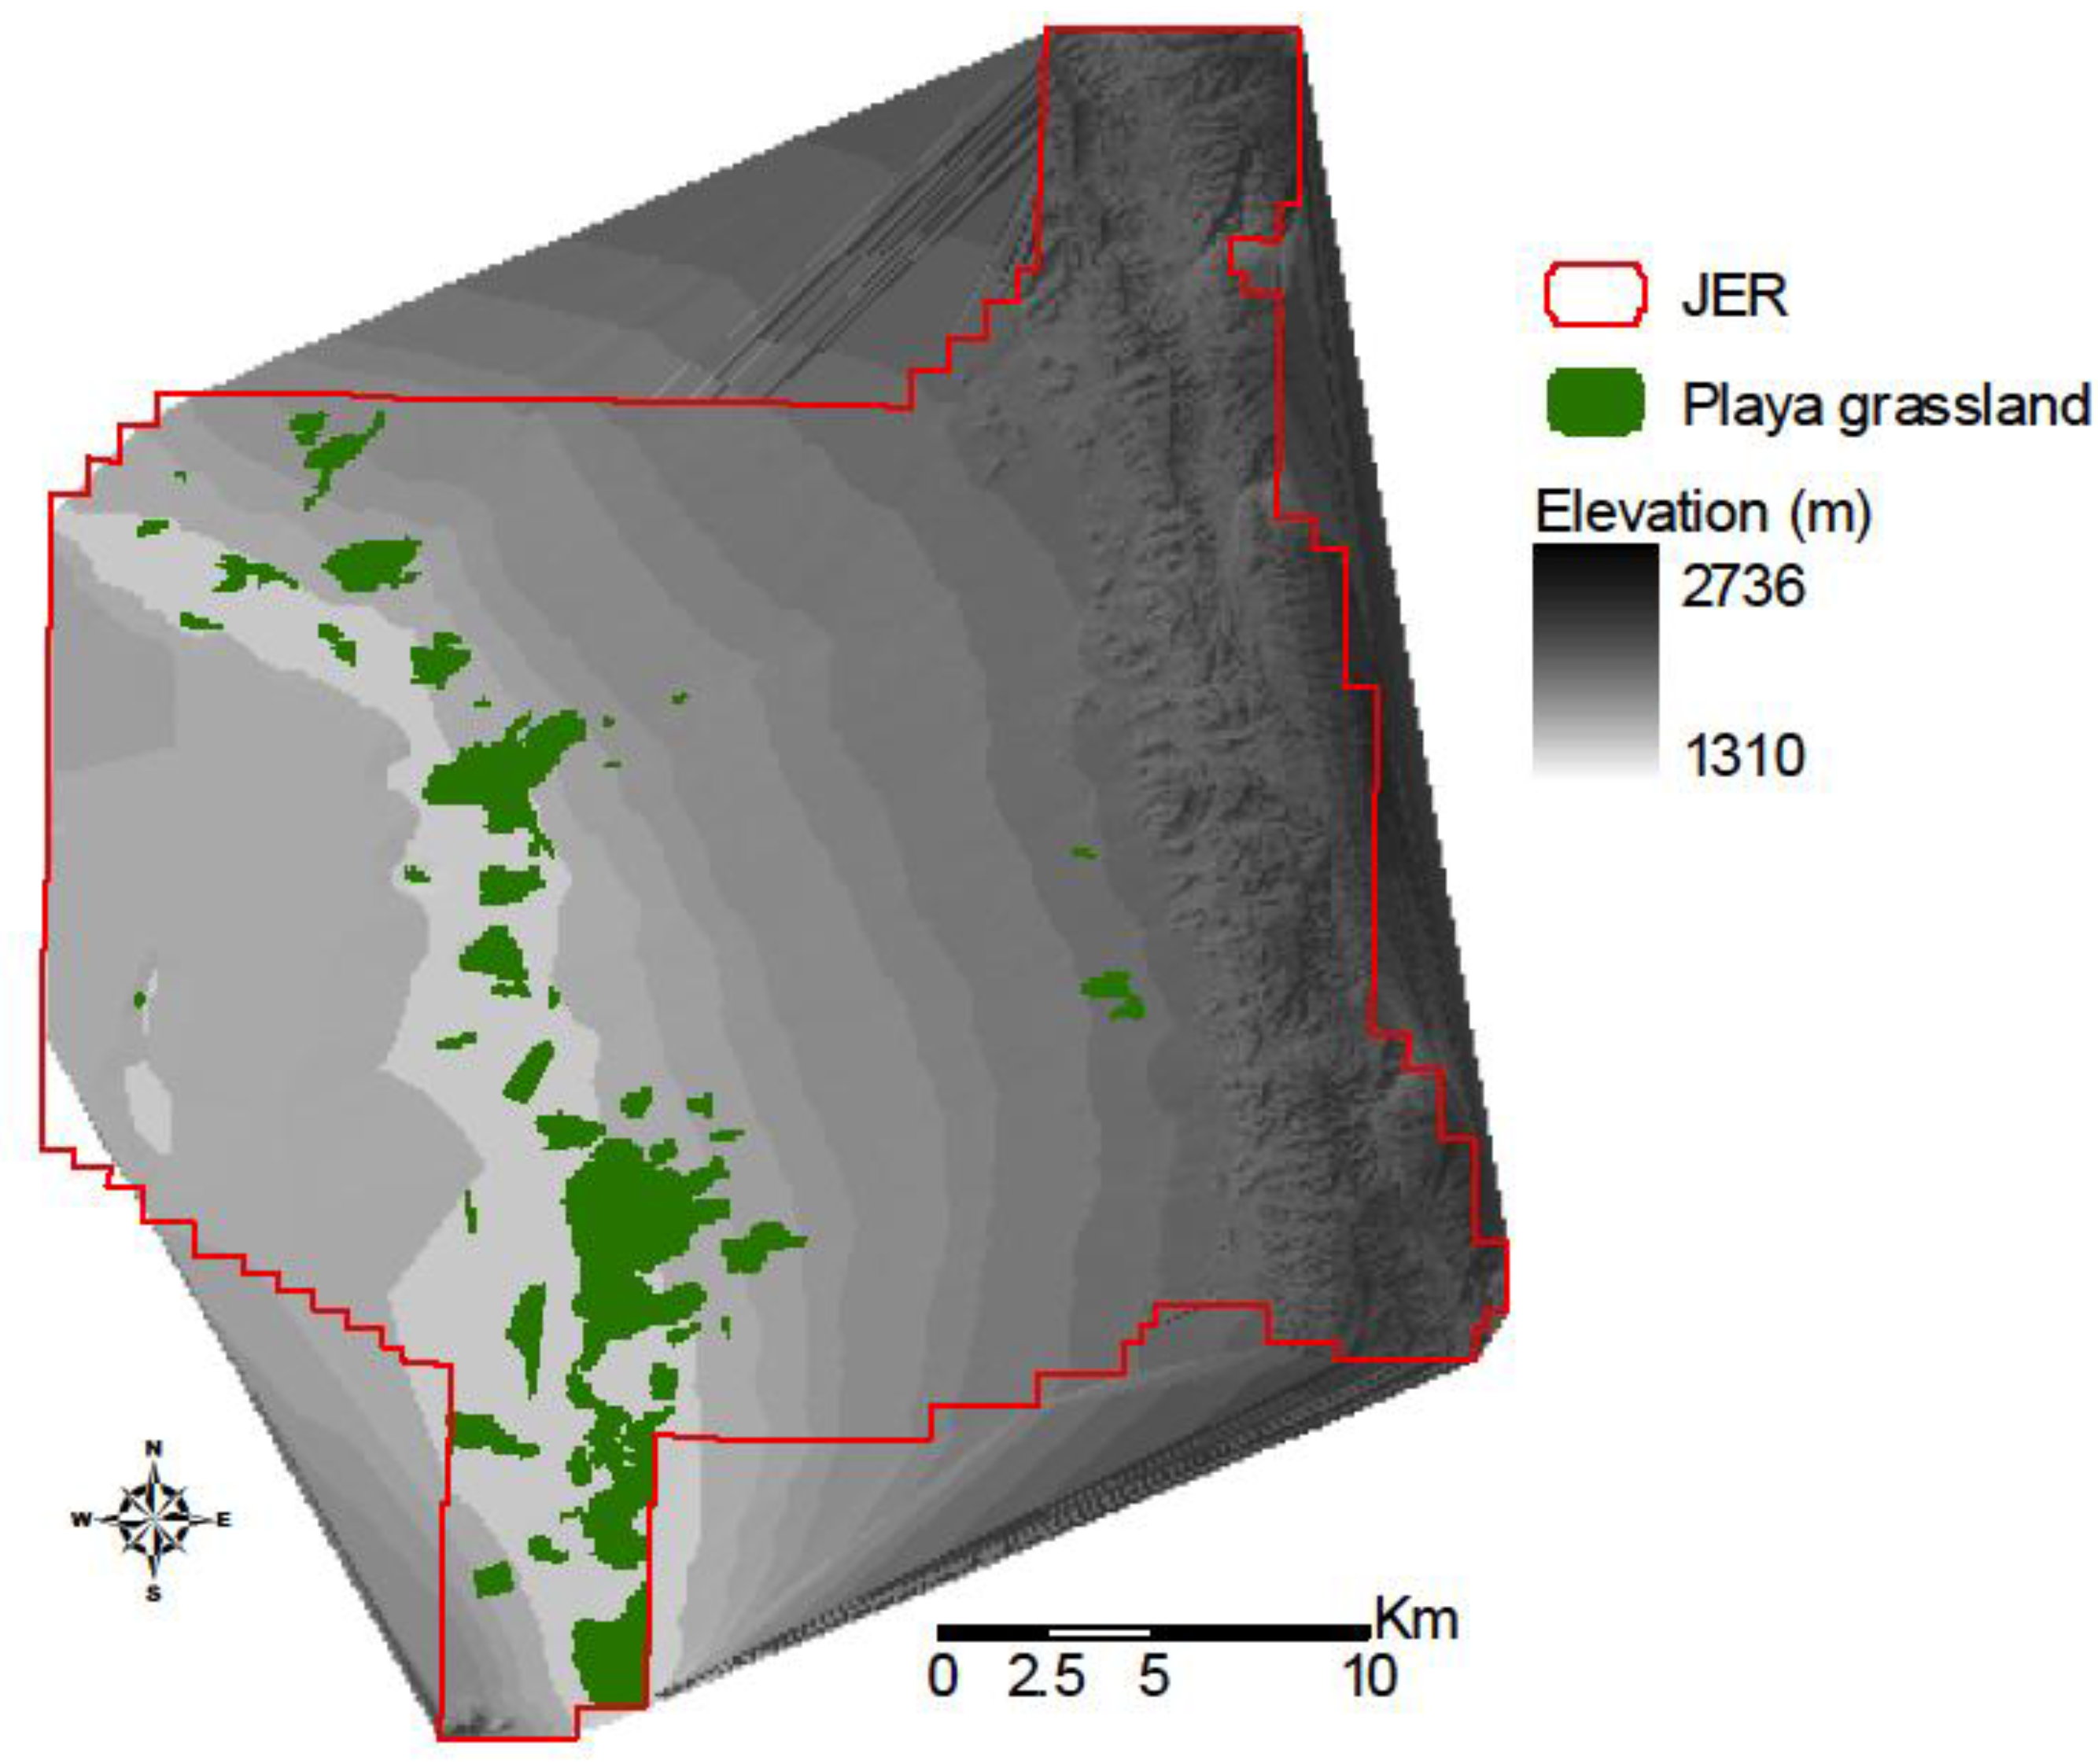
2.1. Study Area
2.2. Satellite, Terrain, and Meteorological Data
2.3. Technique and Data Layers Pre-Processing
2.4. Spatial Computation of Minnaert Coefficients and Application of Reflectance Datasets to SEBAL Algorithms
3. Results and Discussion
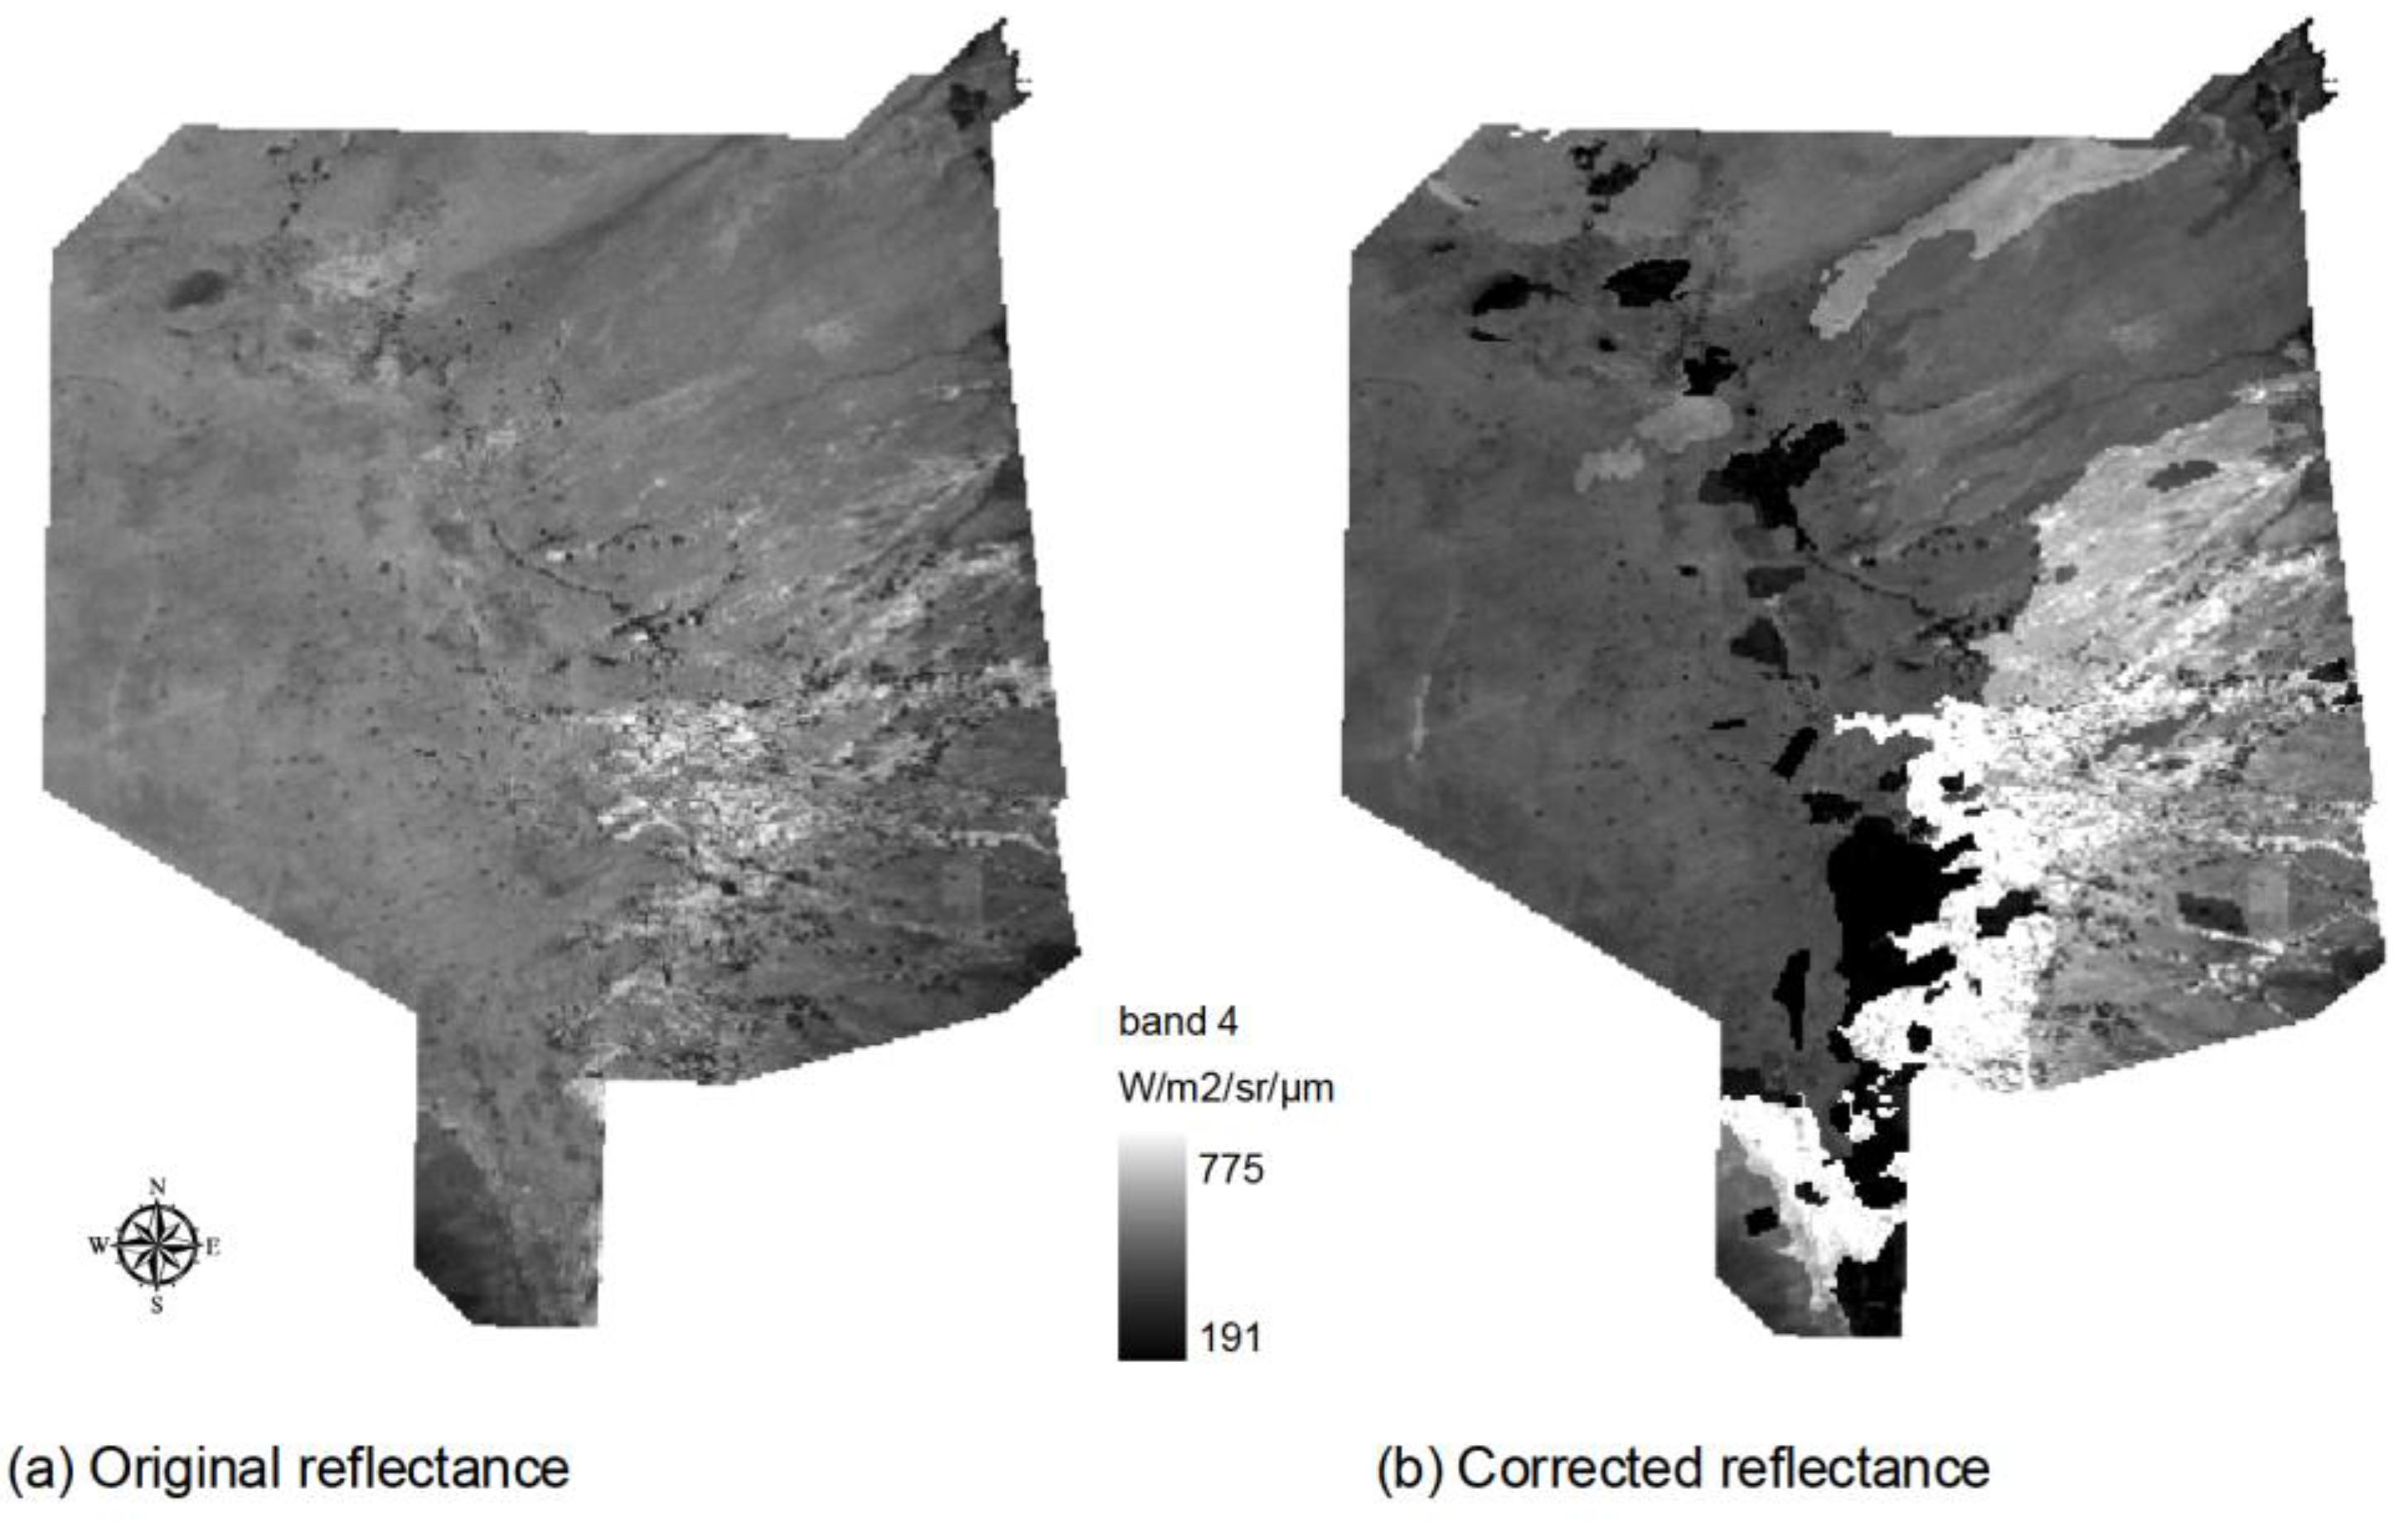
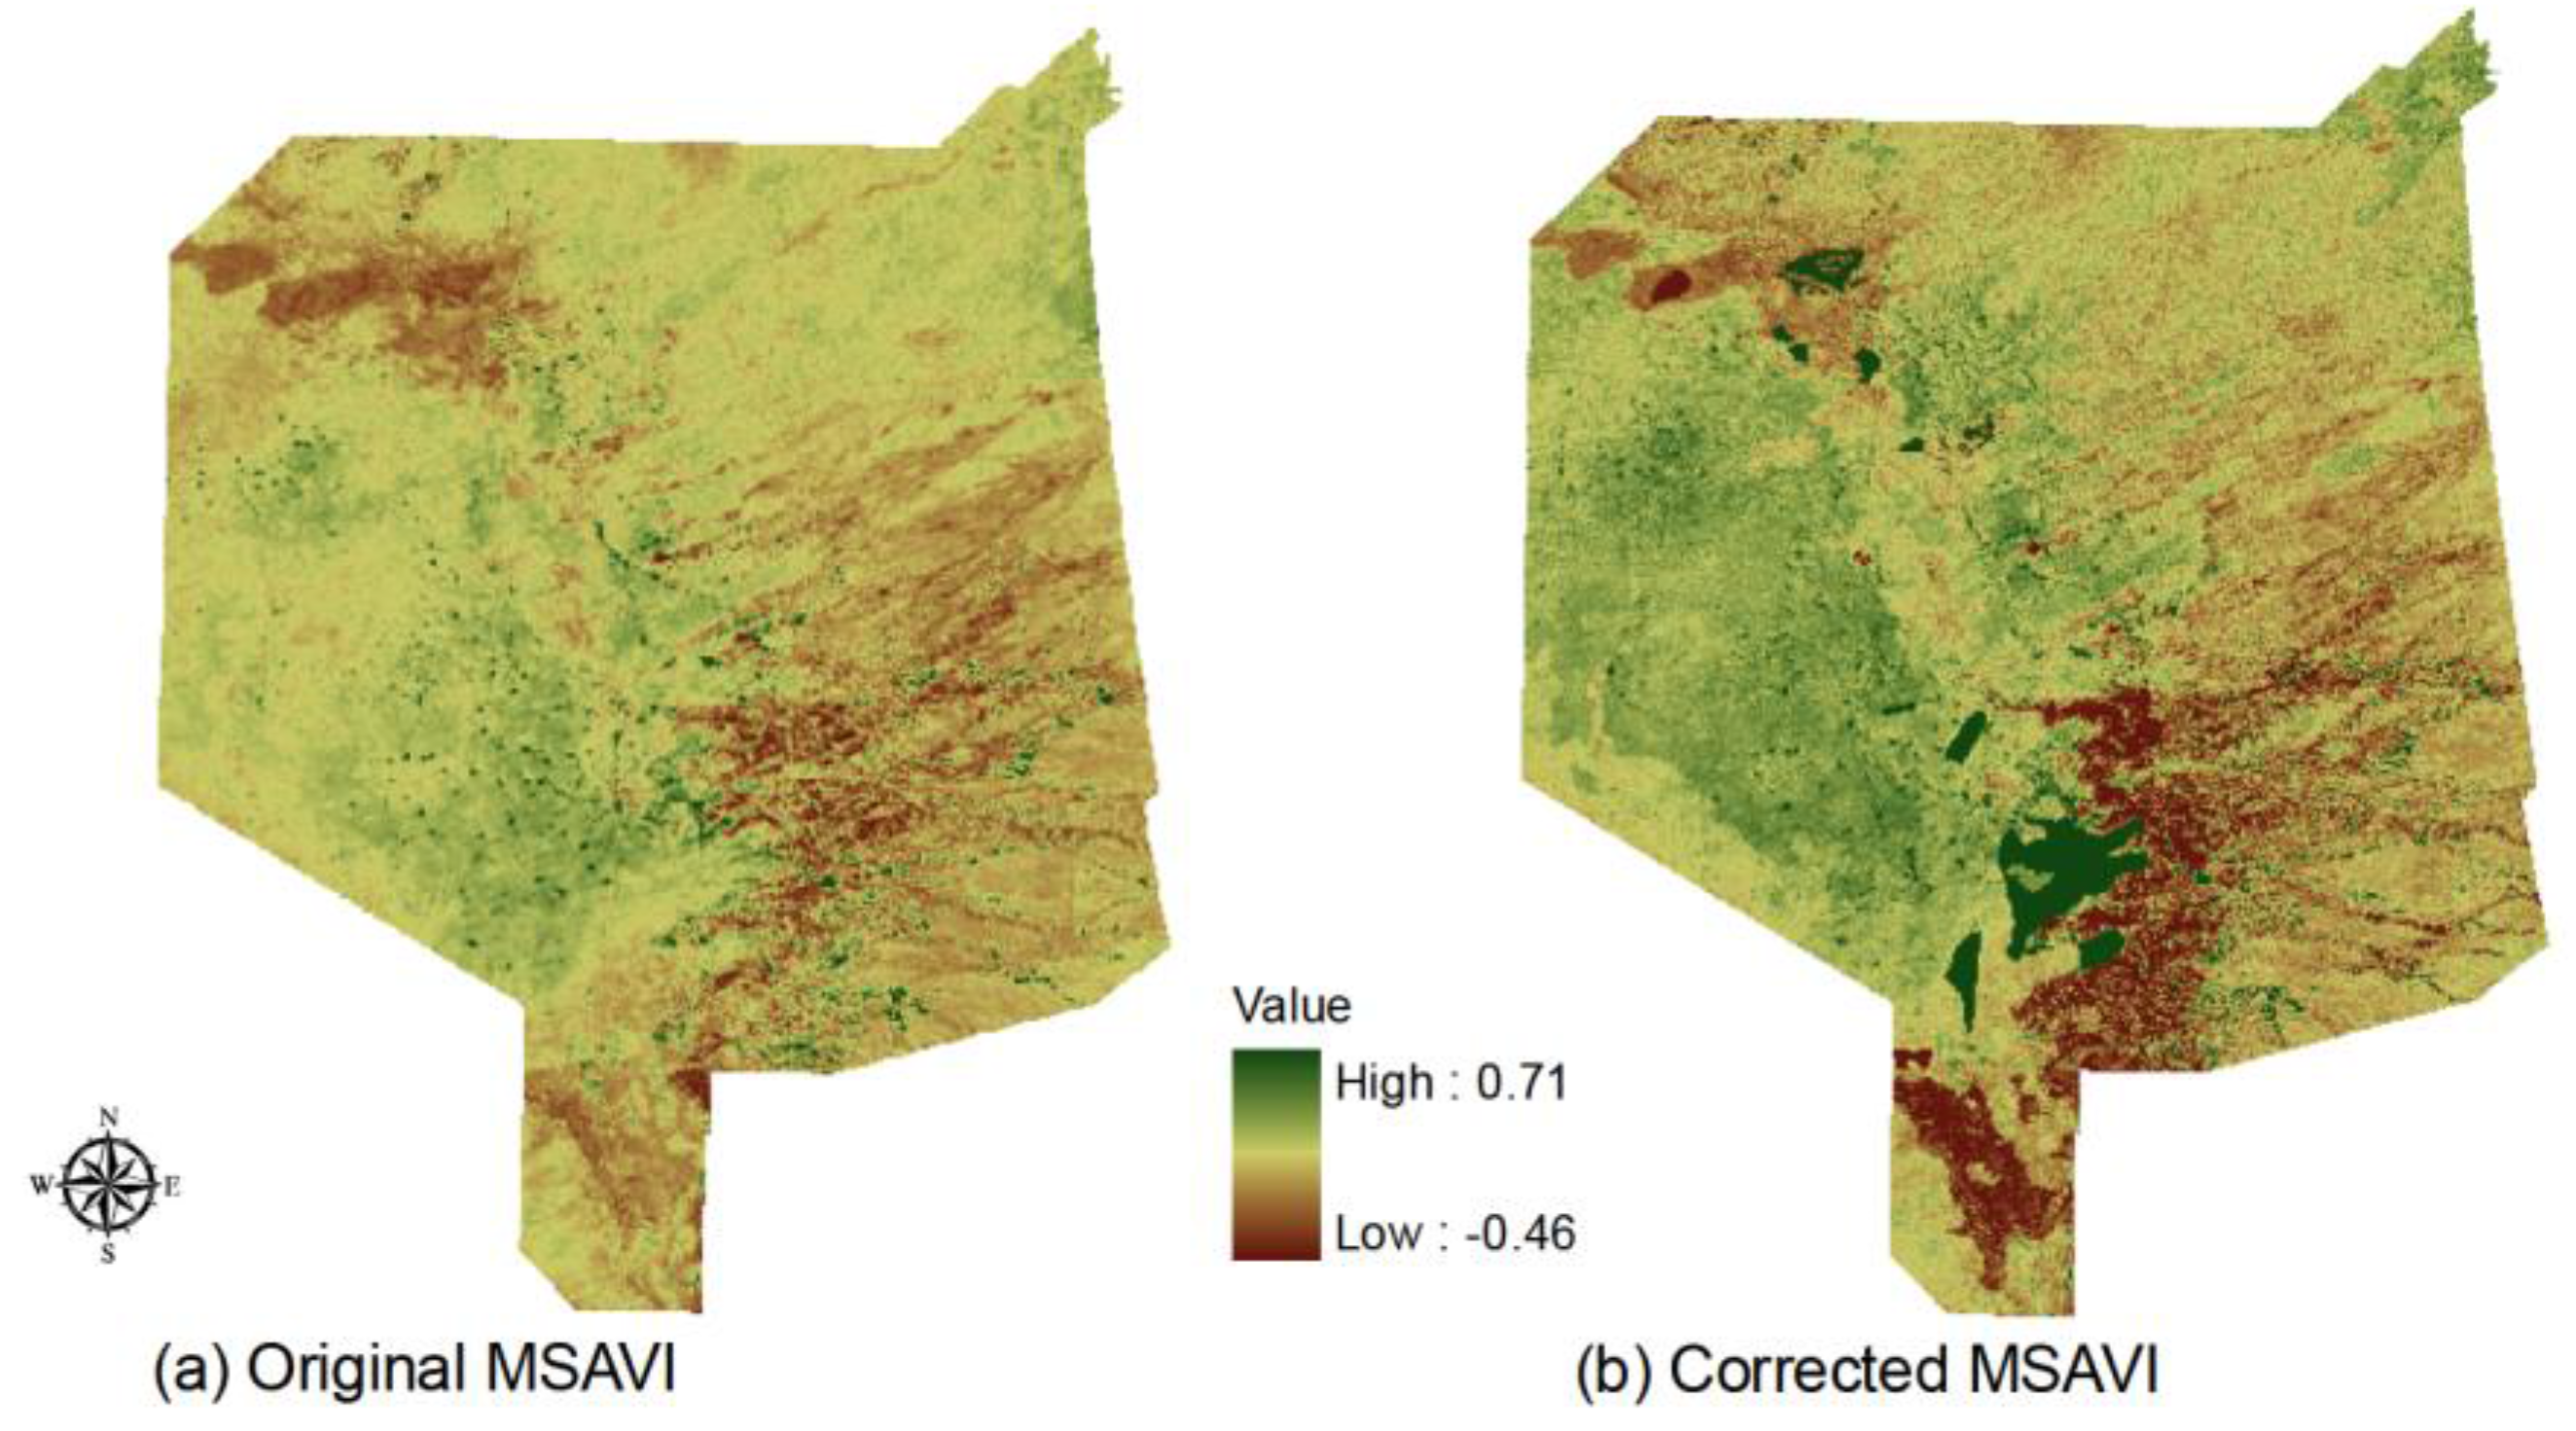
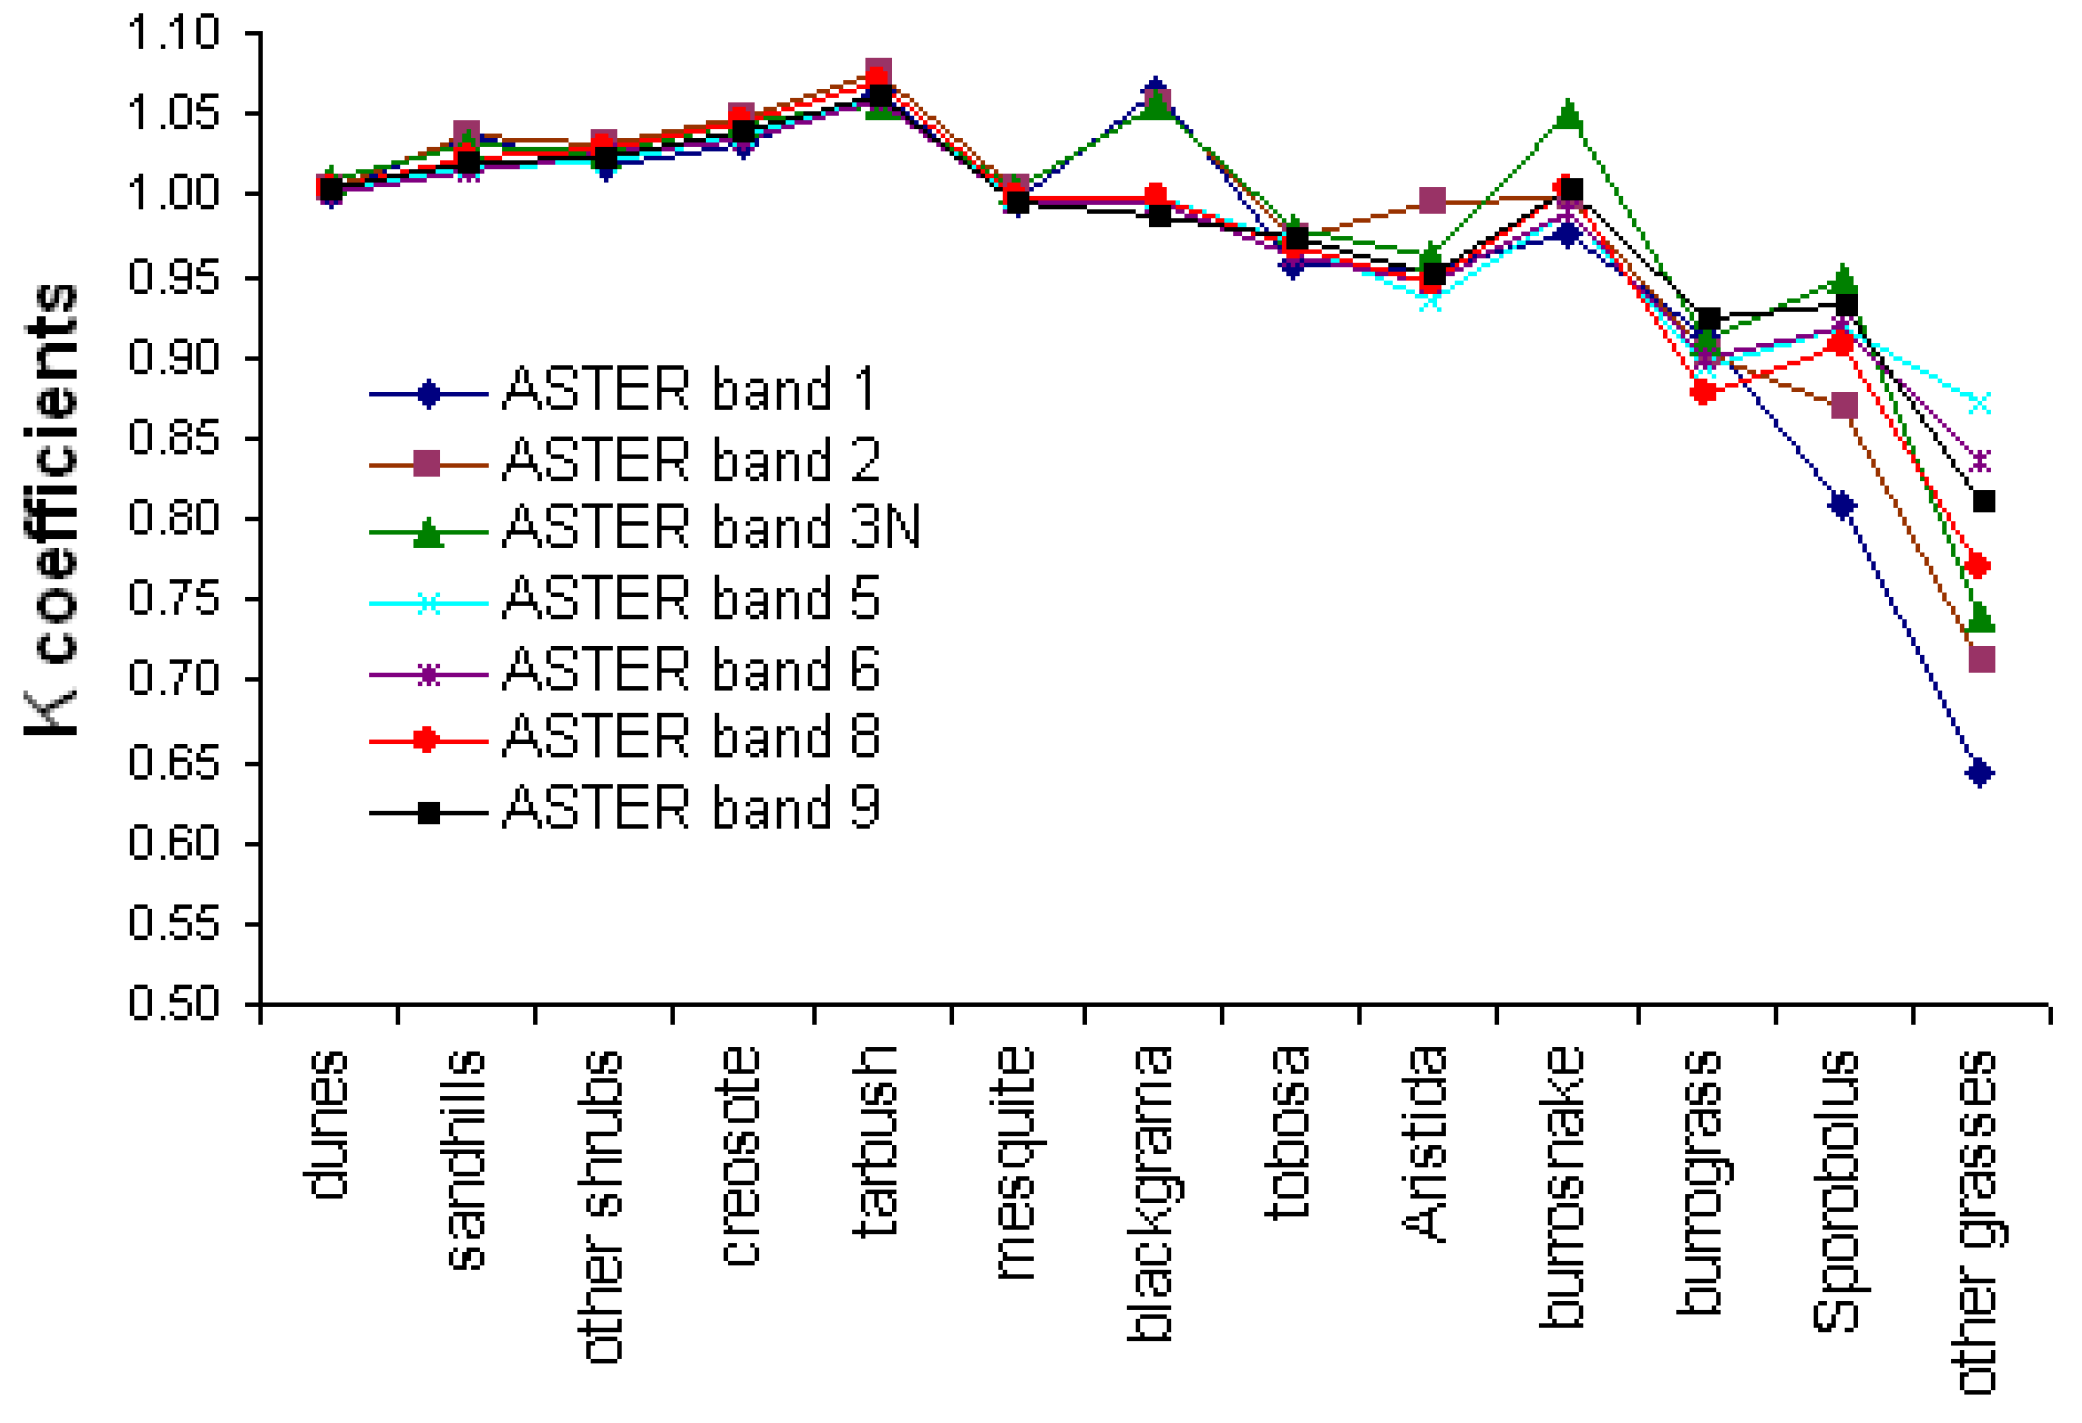
3.1. Minnaert-Corrected Reflectance


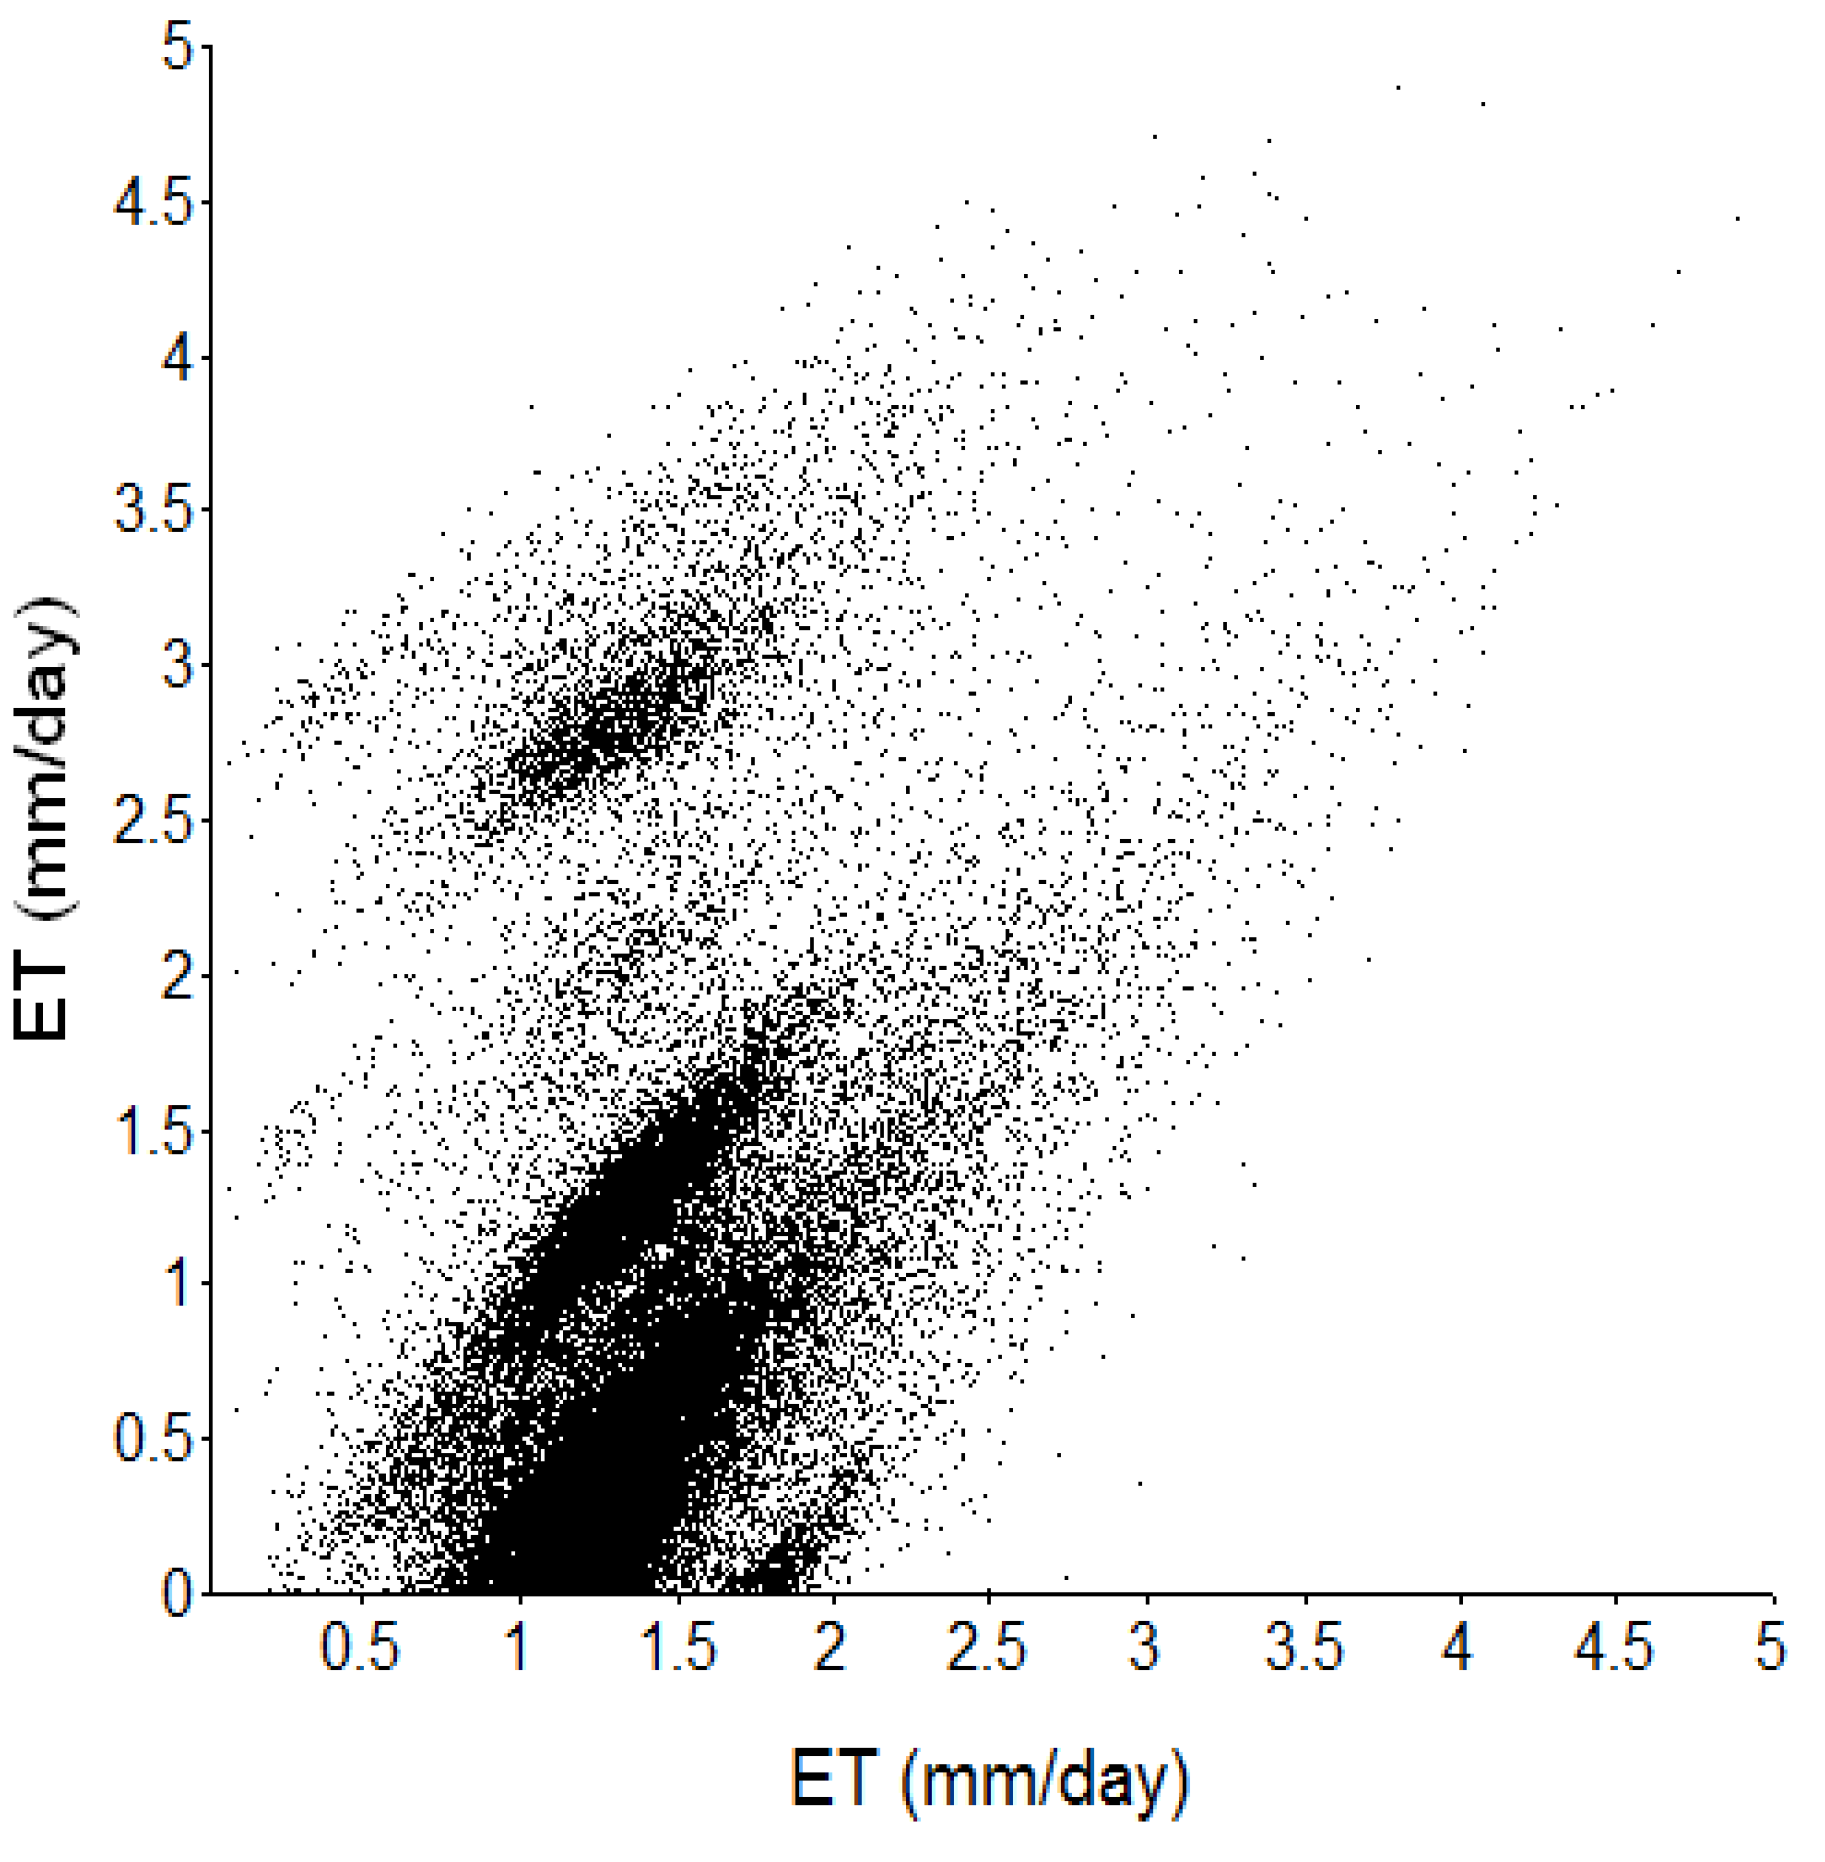
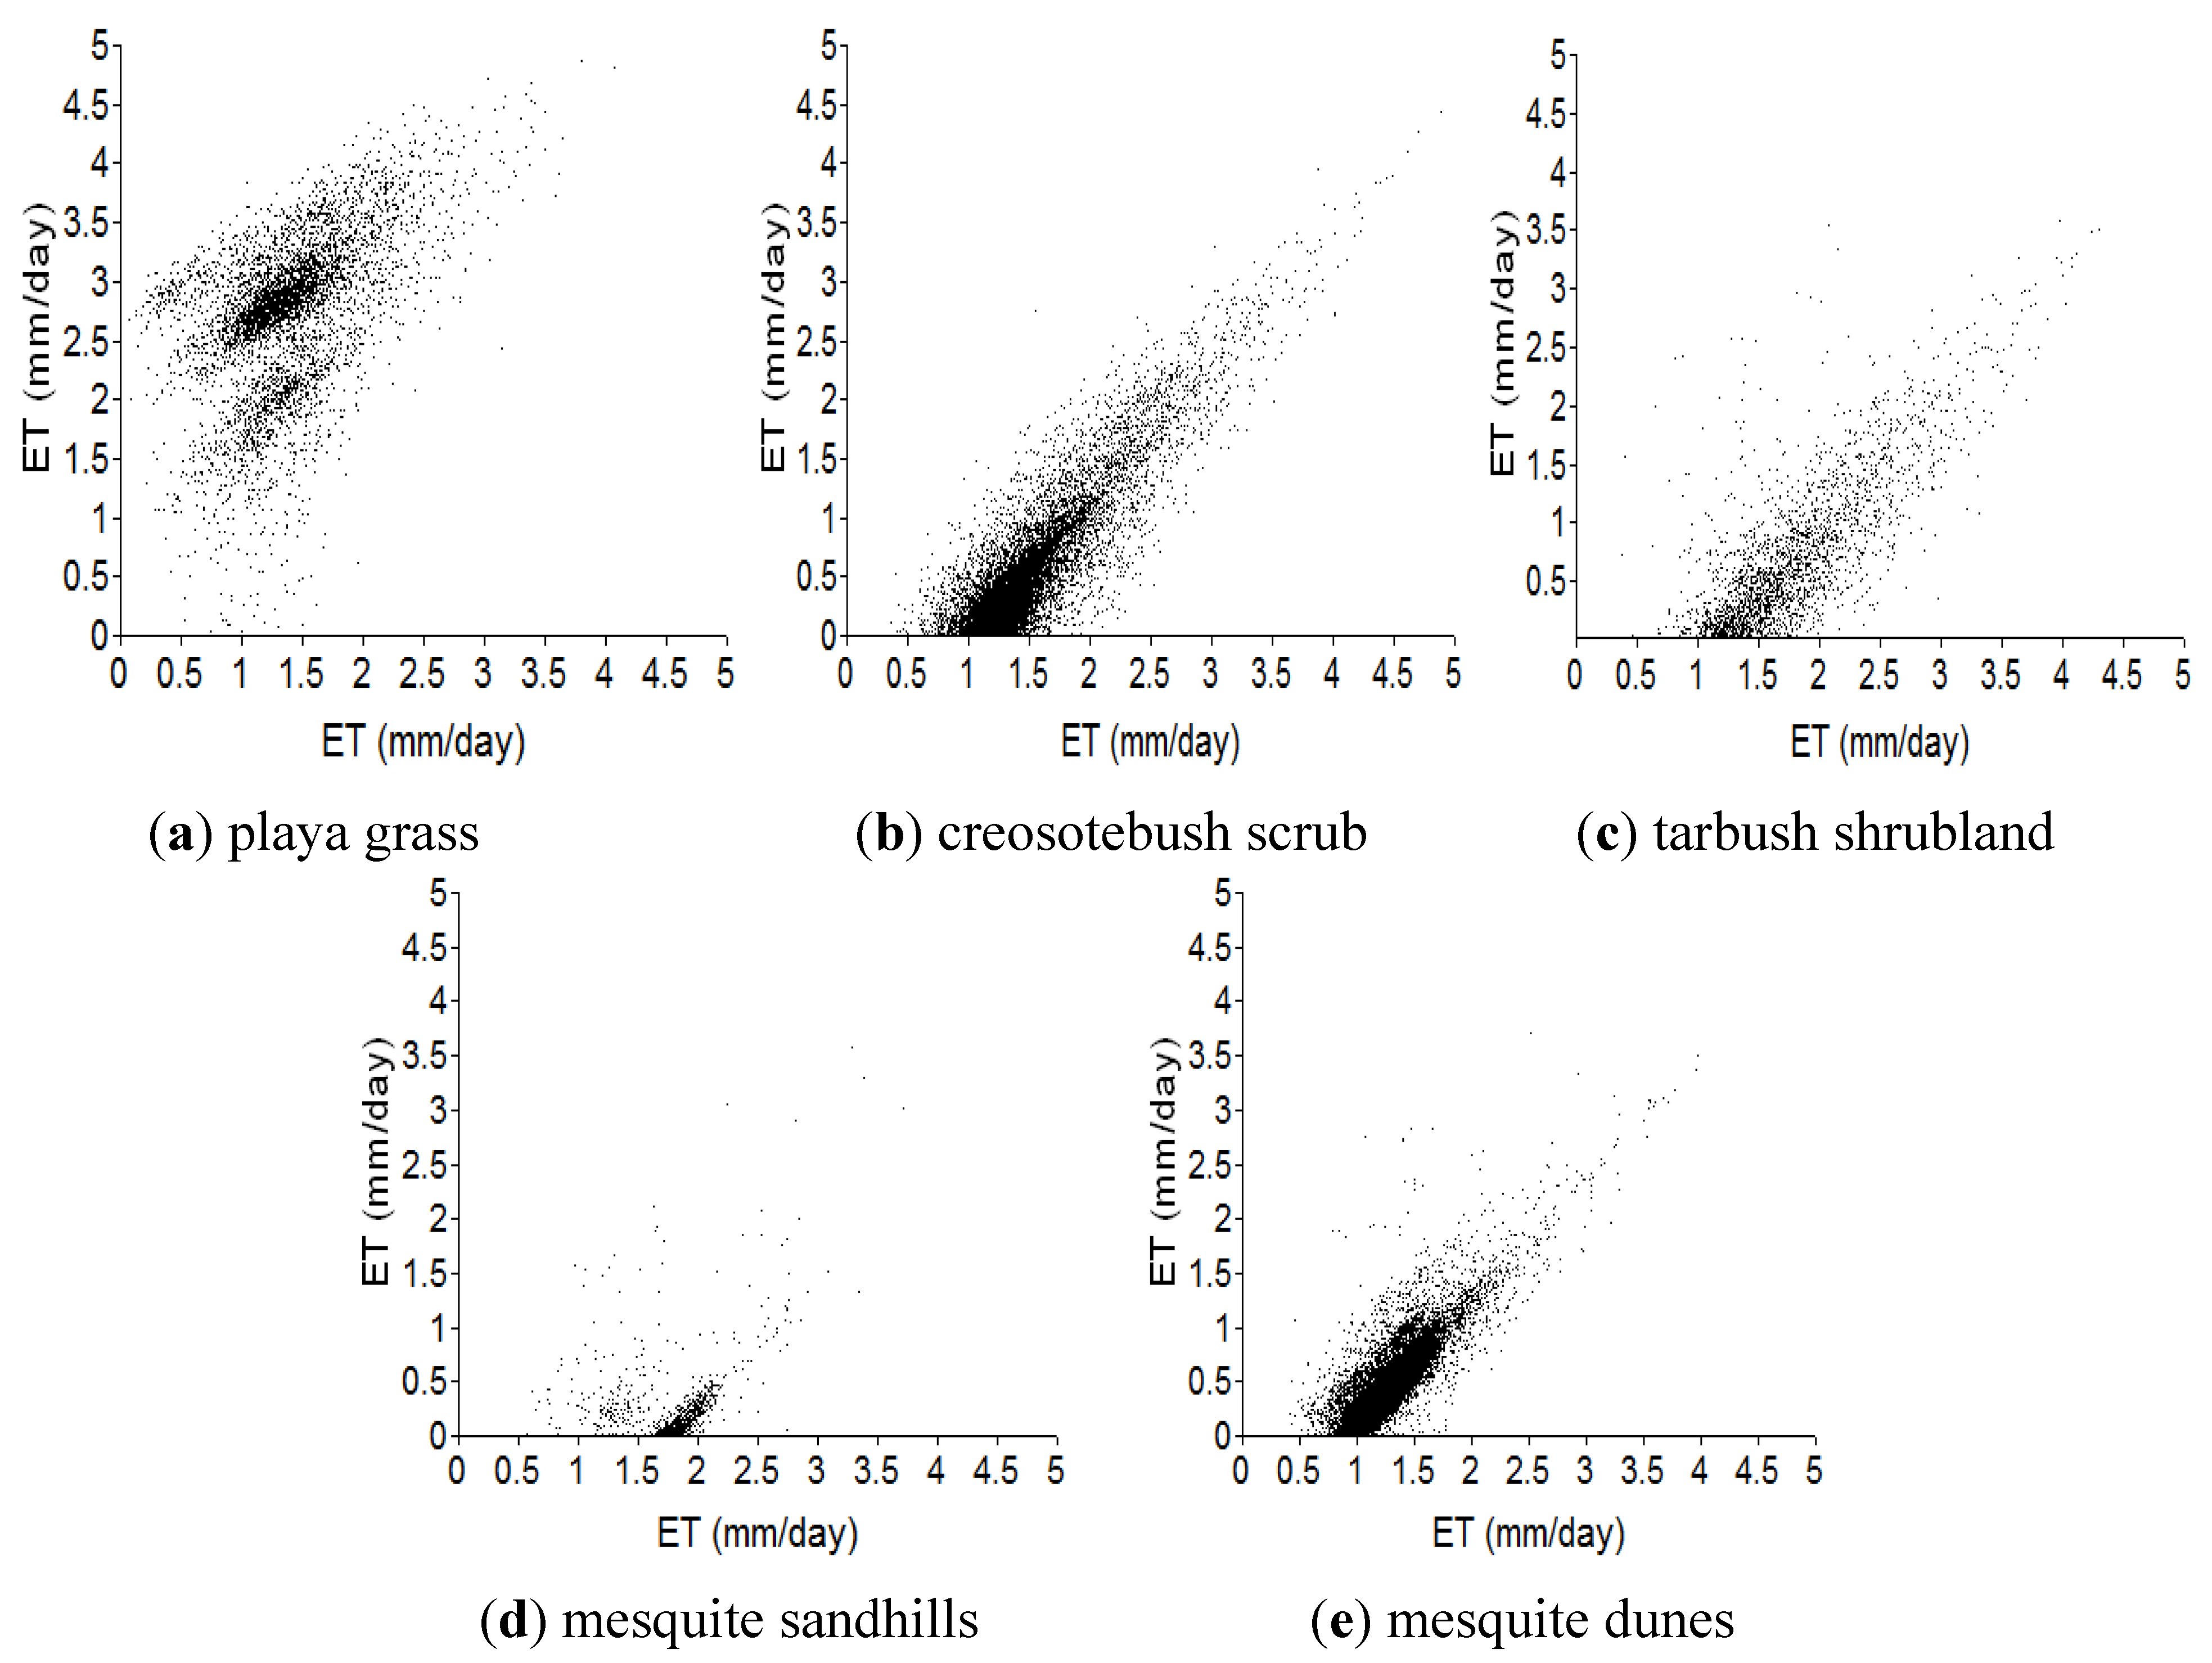
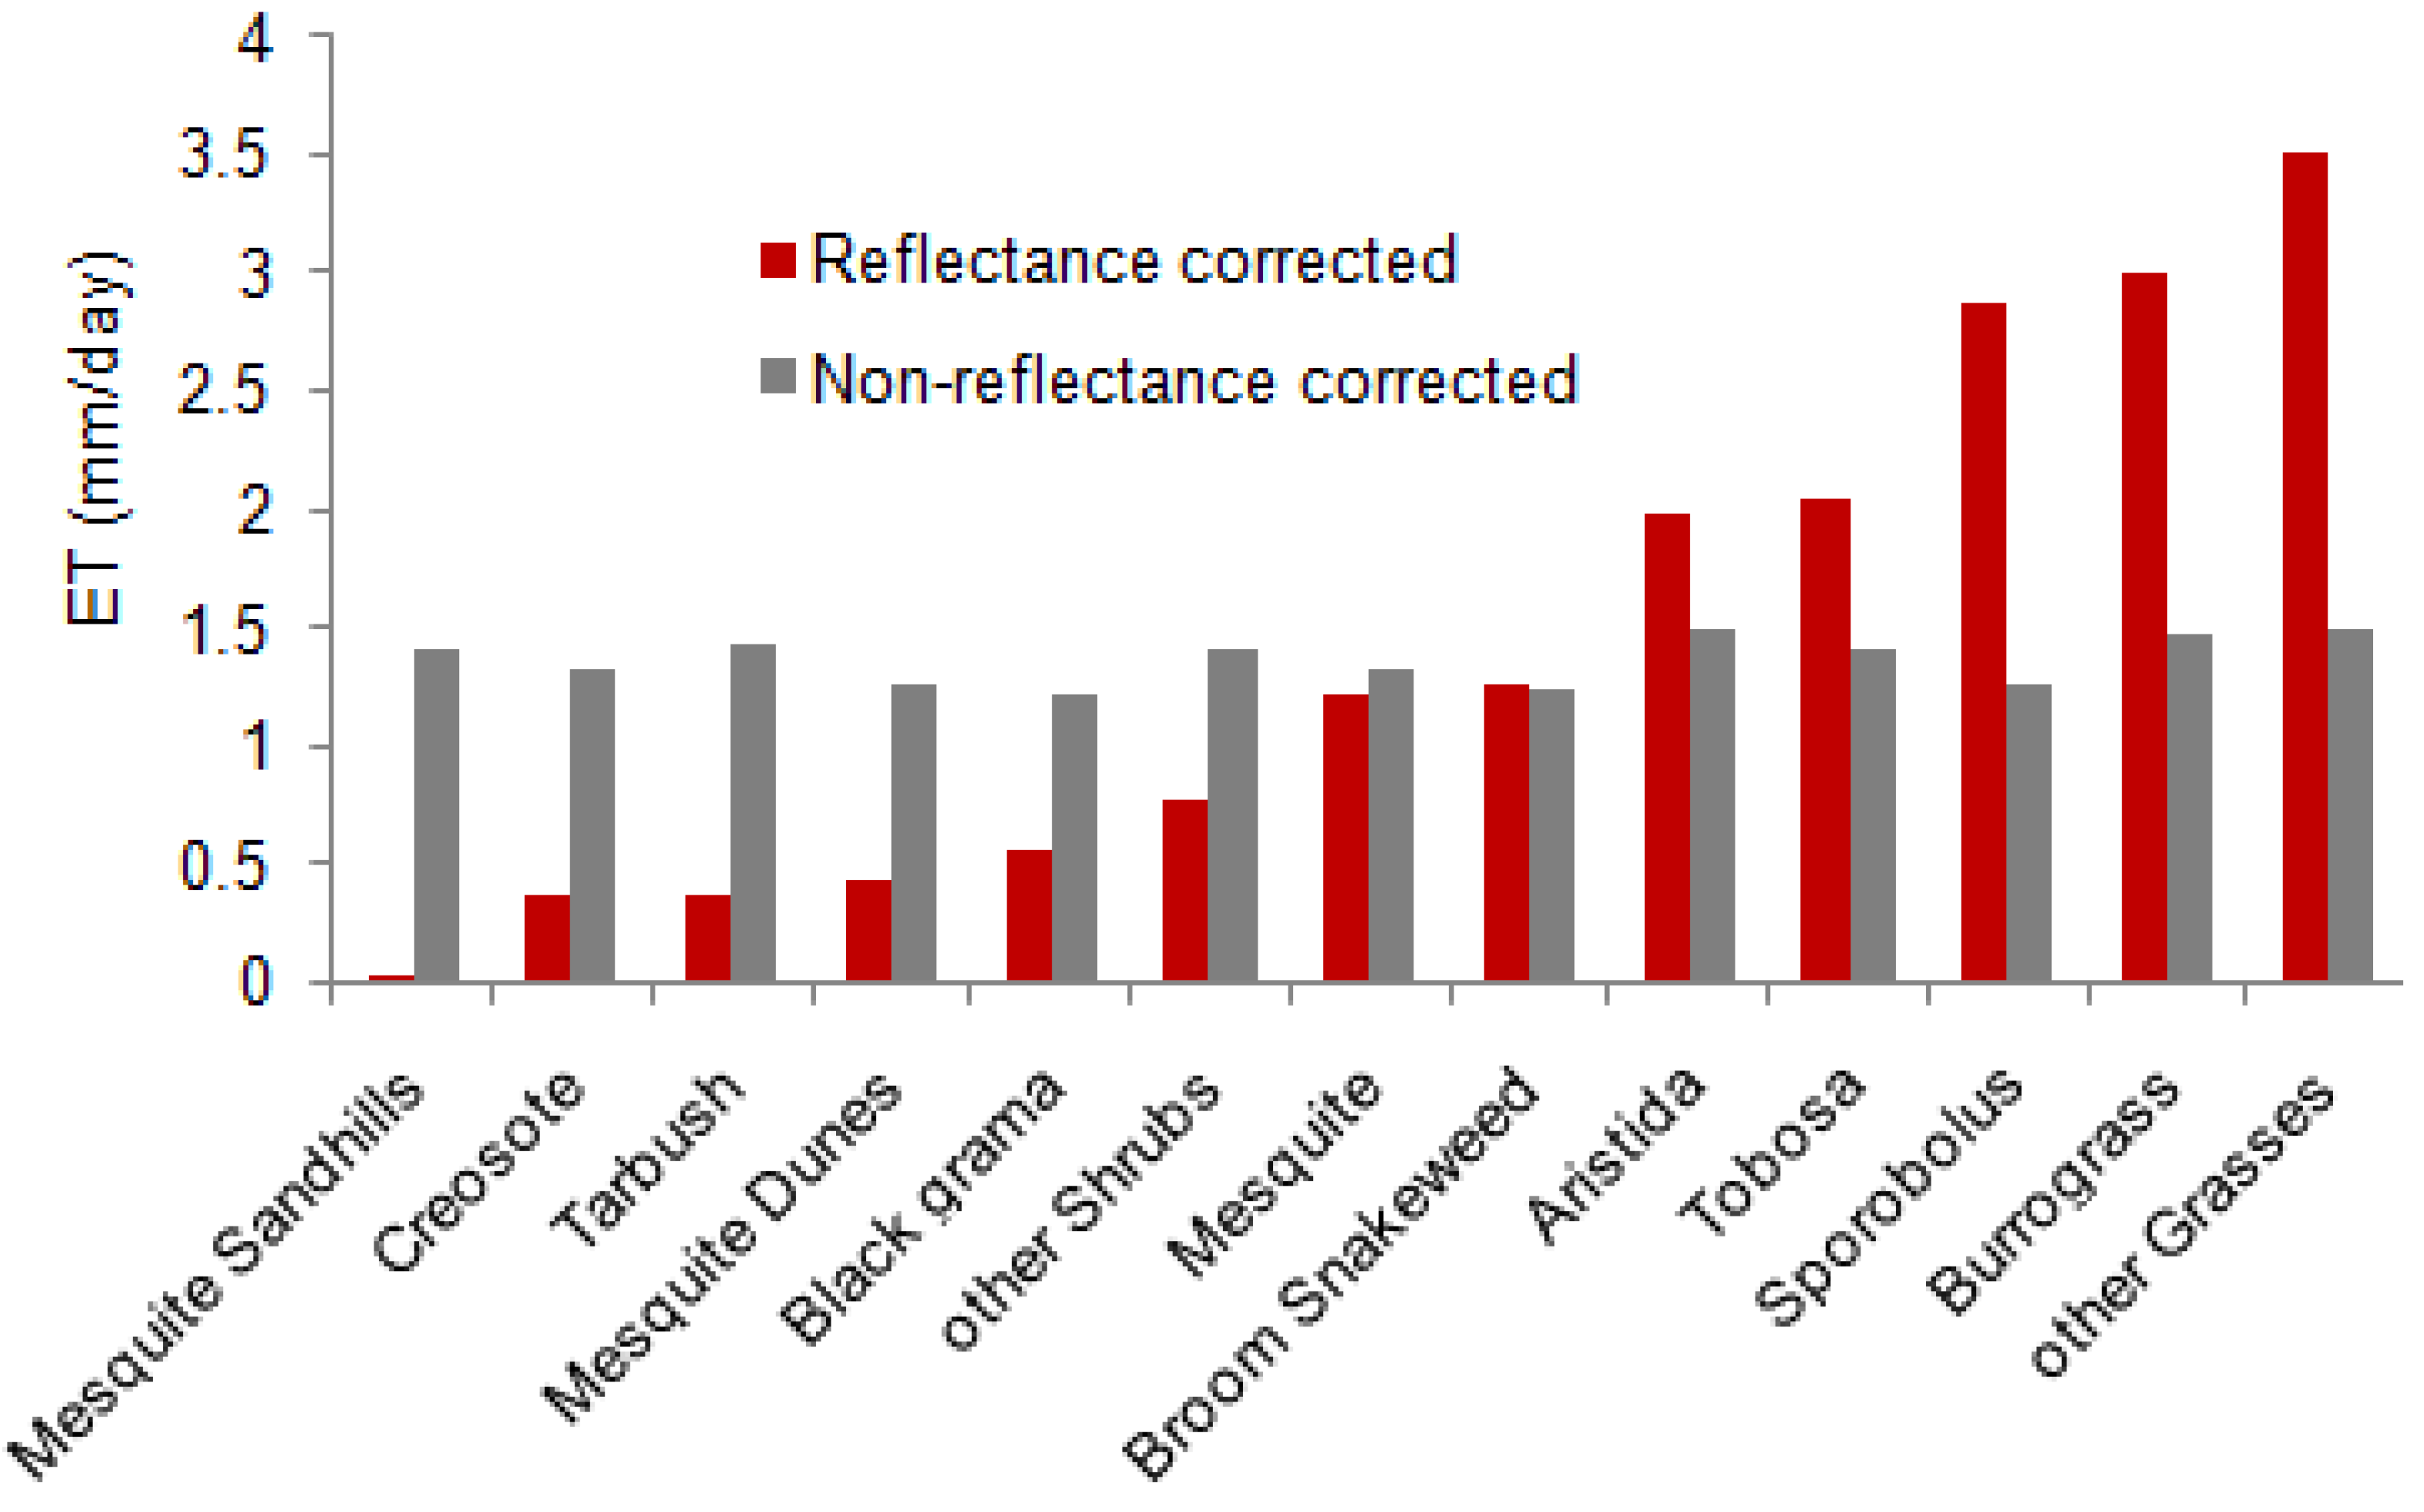
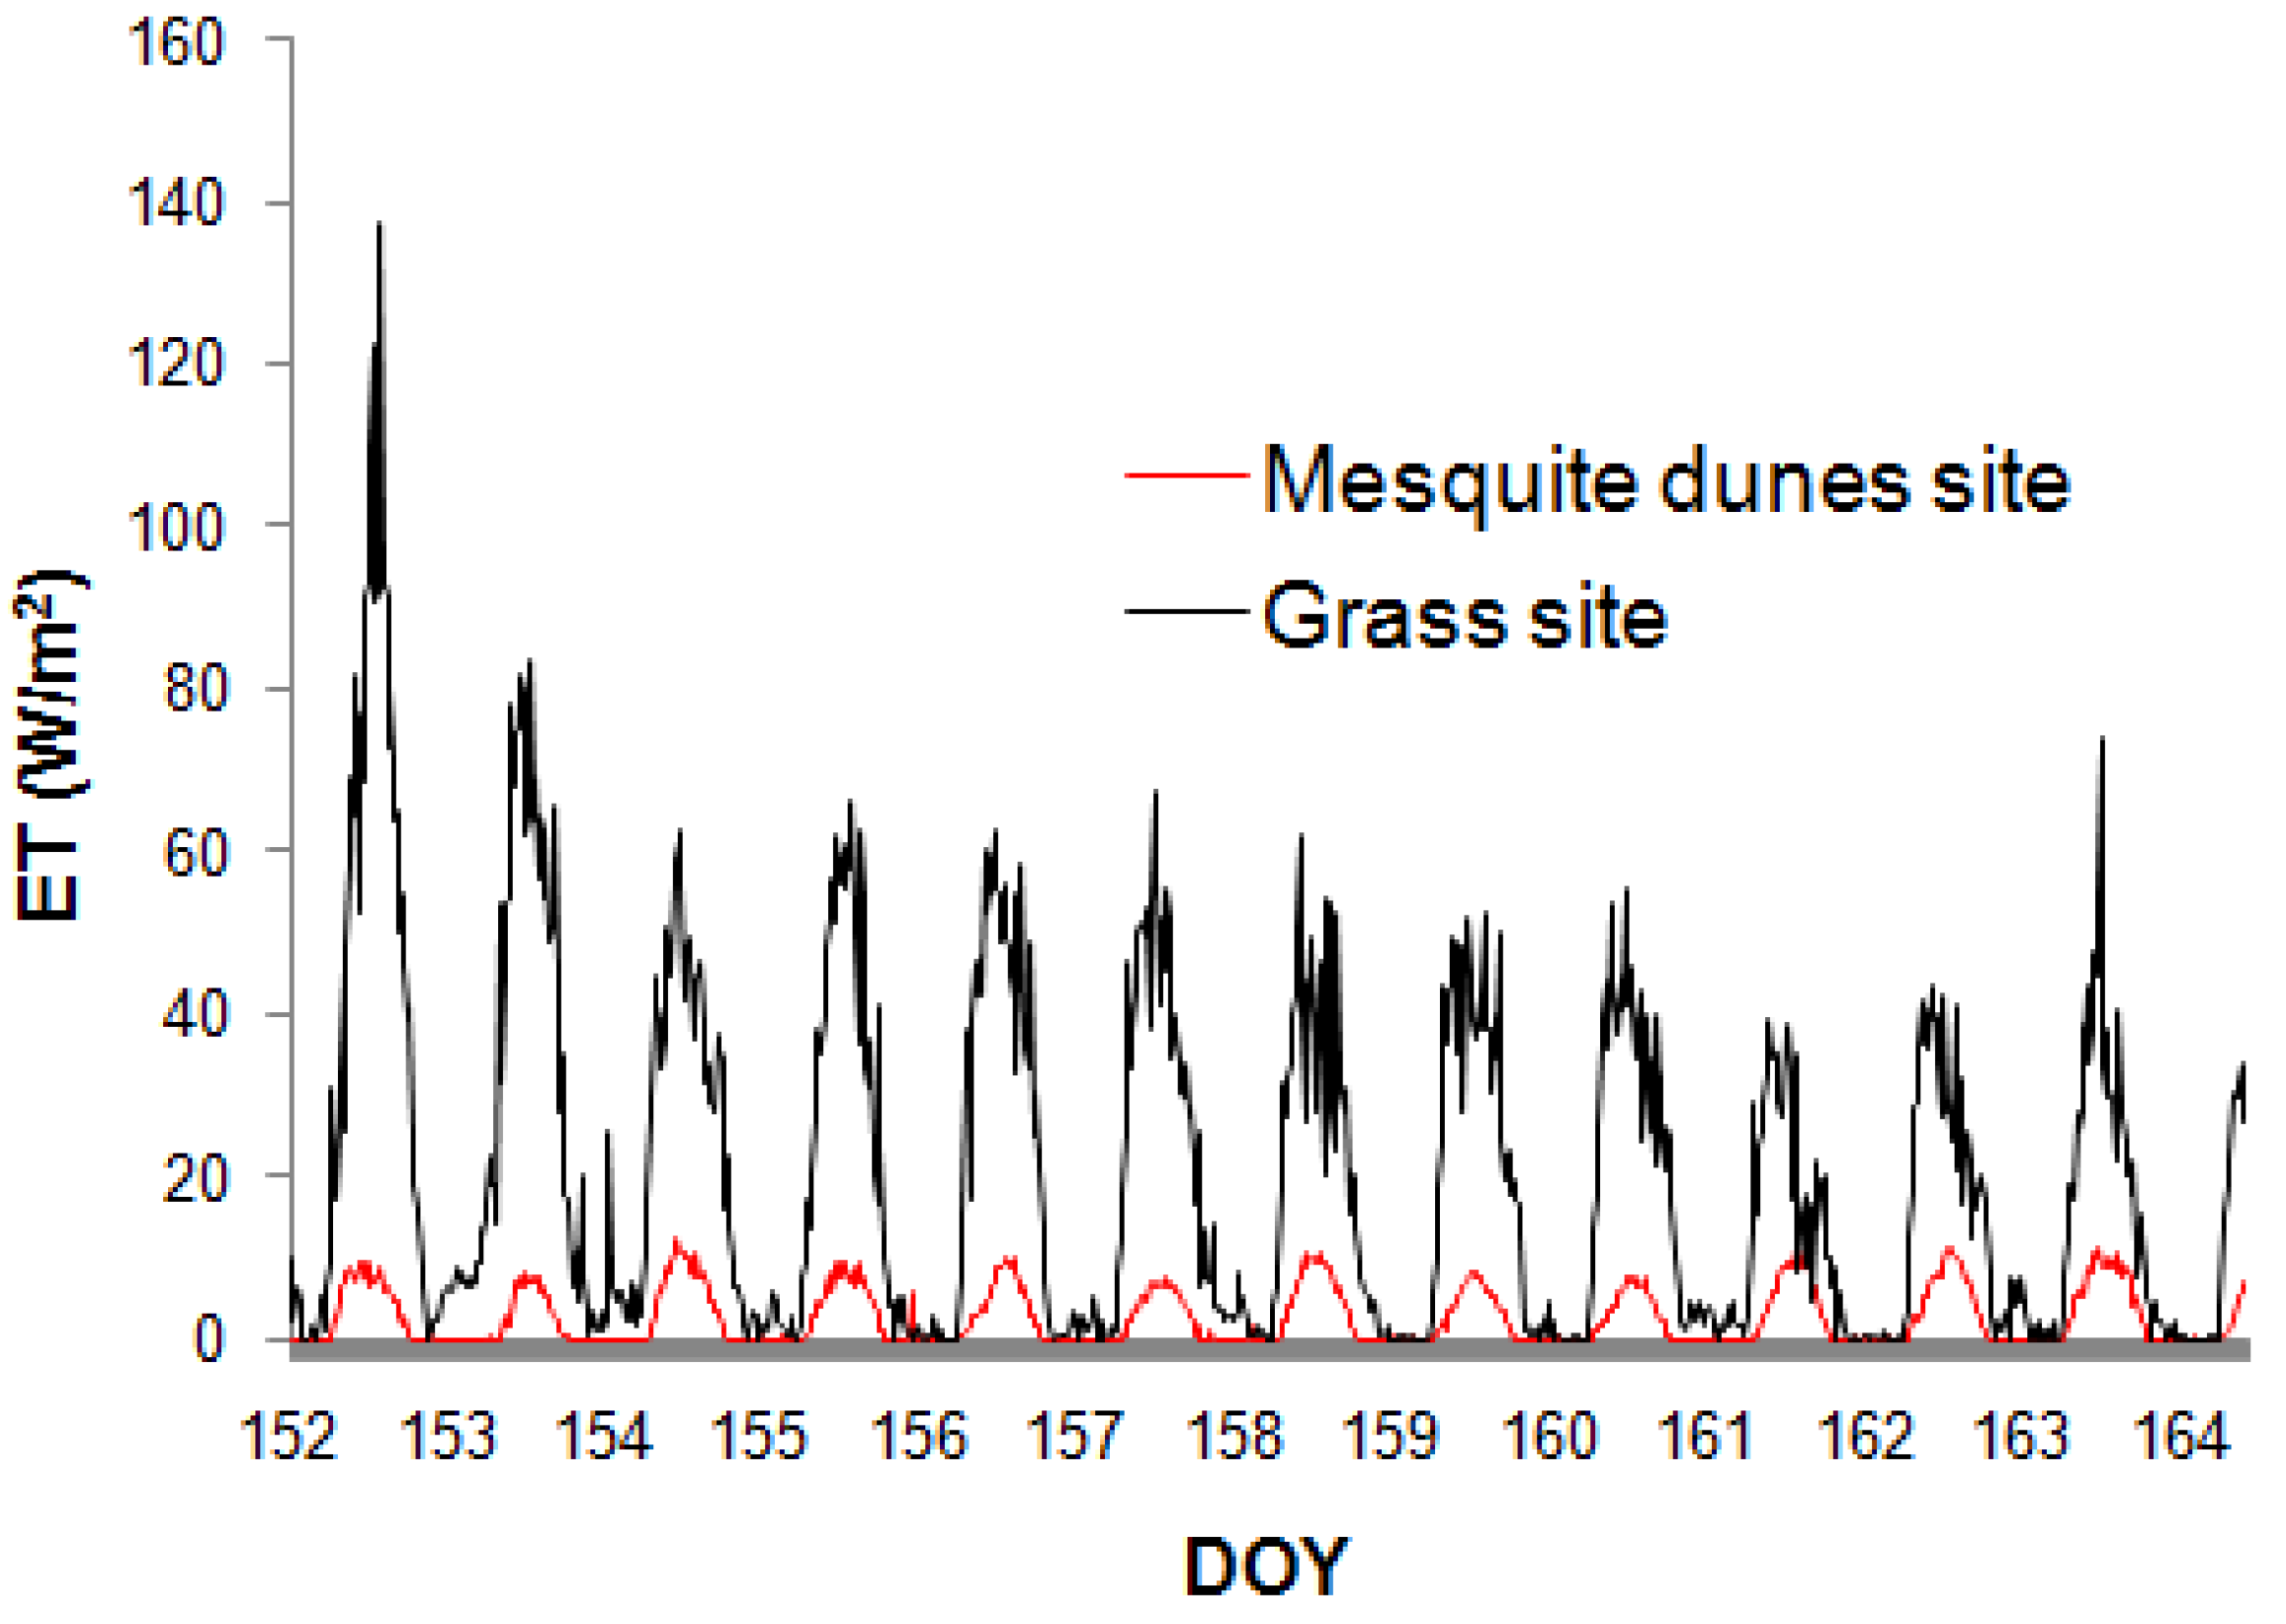
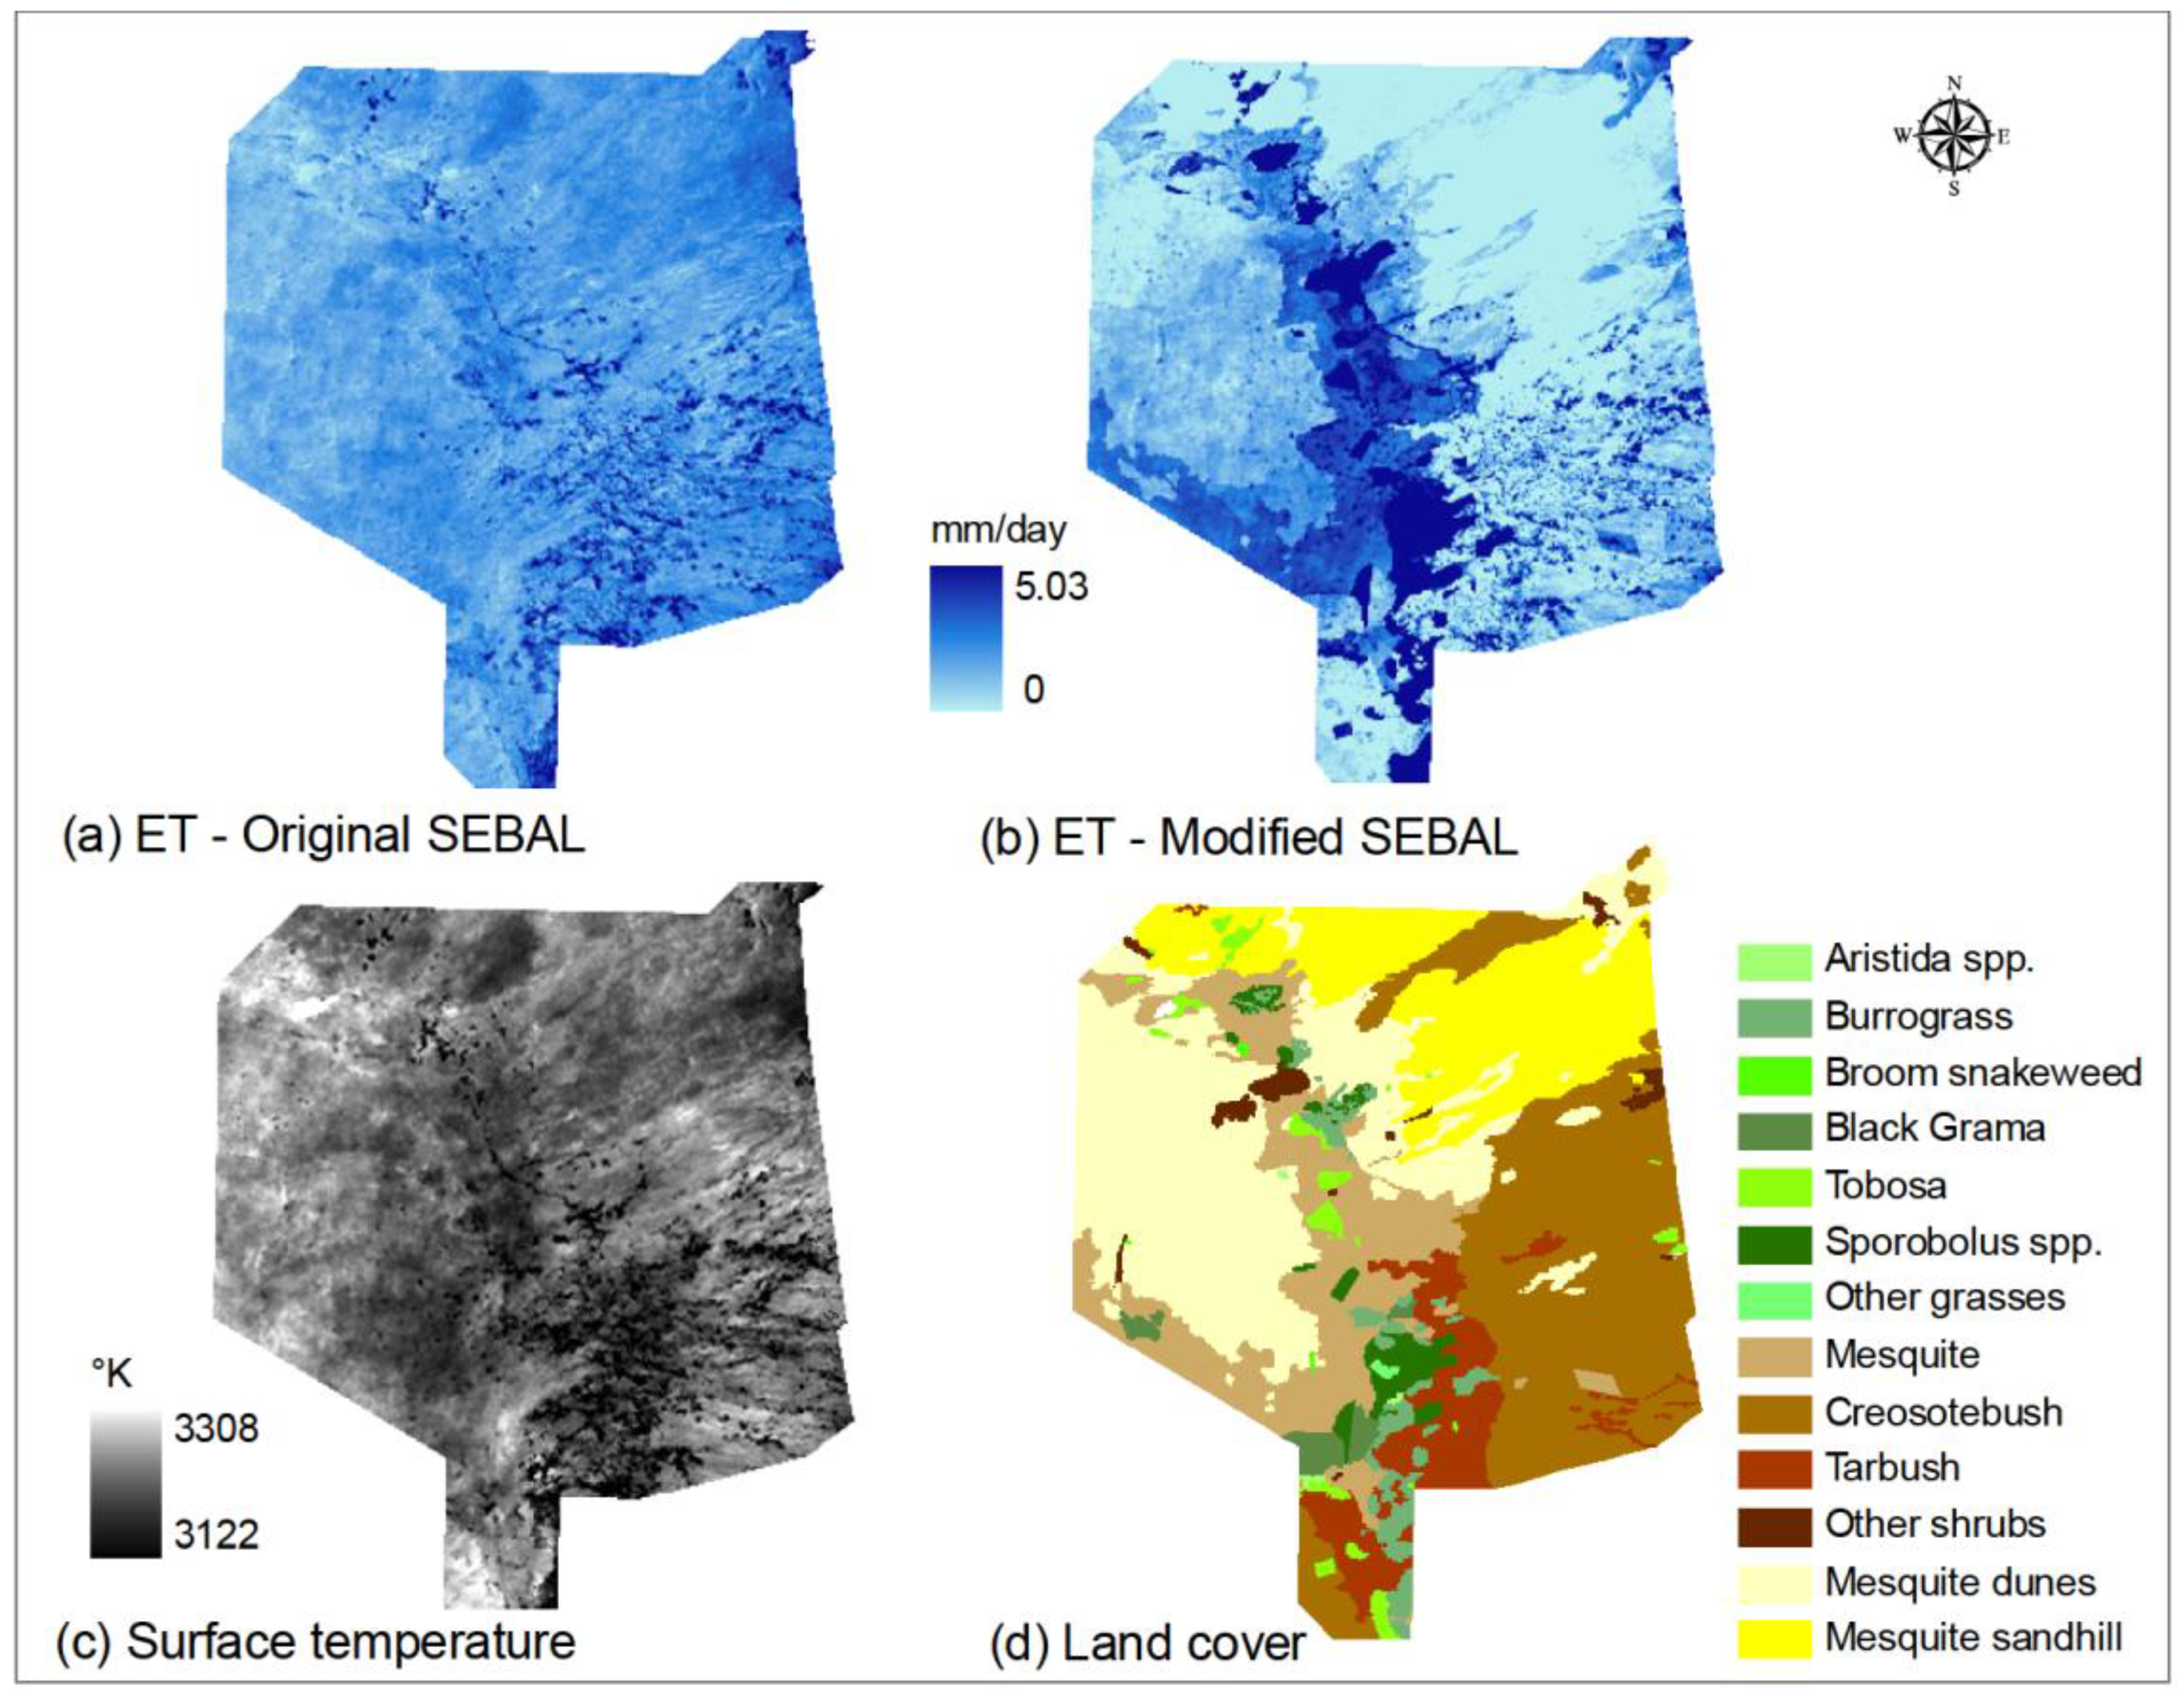
3.2. Assessment of Spatial Distribution of ET


4. Conclusions
Acknowledgements
References and Notes
- French, A.N.; Schmugge, T.J.; Kustas, W.P.; Brubaker, K.L.; Prueger, J. Surface energy fluxes over El Reno, Oklahoma, using high-resolution remotely sensed data. Water Resour. Res. 2003, 39, 1164. [Google Scholar] [CrossRef]
- Bastiaanssen, W.G.M.; Menenti, M.; Feddes, R.A.; Holtslag, A.A.M. A remote sensing surface energy balance algorithm for land (SEBAL): 1. Formulation. J. Hydrol. 1998, 212, 198–212. [Google Scholar] [CrossRef]
- Choudhury, B.J. Estimating evaporation and carbon assimilation using infrared temperature data: Vistas in modelling. In Theory and Application of Remote Sensing; Asrar, G., Ed.; John Wiley & Sons, Inc.: New York, NY, USA, 1989; pp. 28–690. [Google Scholar]
- Kustas, W.P.; Norman, J.M. Use of remote sensing for evapotranspiration monitoring over land surfaces. Hydrol. Sci. J. 1996, 41, 495–516. [Google Scholar] [CrossRef]
- Campbell, G.S.; Norman, J.M. An Introduction to Environmental Biophysics, 2nd ed.; Springer-Verlag: New York, NY, USA, 1998. [Google Scholar]
- Teillet, P.M.; Guindon, B.; Goodenough, D.G. On the slope-aspect correction of multispectral scanner data. Can. J. Remote Sens. 1982, 8, 84–106. [Google Scholar] [CrossRef]
- Thome, K. Algorithm Theoretical Basis Document for ASTER level 2B1—Surface Radiance and ASTER Level 2B5—Surface Reflectance 1999; Optical Sciences Center, University of Arizona: Tucson, AZ, USA.
- Jones, A.R.; Settle, J.J.; Wyatt, B.K. Use of digital terrain data in the interpretation of SPOT-1 HRV multispectral imagery. Int. J. Remote Sens. 1988, 9, 669–682. [Google Scholar] [CrossRef]
- Lu, D.; Ge, H.; He, S.; Xu, A.; Zhou, G.; Du, H. Pixel-based Minnaert correction method for reducing topographic effects on a Landsat 7 ETM+ image. Photogramm. Eng. Remote Sens. 2008, 74, 1343–1350. [Google Scholar]
- Liang, S. Narrow to broadband conversion of land surface albedo I: algorithms. Remote Sens. Environ. 2000, 76, 213–238. [Google Scholar] [CrossRef]
- Qi, J.; Chehbouni, A.; Huete, A.R.; Kerr, Y.H.; Sorooshian, S. A modified soil adjusted vegetation index. Remote Sens. Environ. 1994, 48, 119–126. [Google Scholar] [CrossRef]
- Matsushita, B.; Yang, W.; Chen, J.; Onda, Y.; Qiu, G. Sensitivity of the Enhanced Vegetation Index (EVI) and Normalized Difference Vegetation Index (NDVI) to topographic effects: a case study in high-density cypress forest. Sensors 2007, 7, 2636–2651. [Google Scholar] [CrossRef]
- Minnaert, M. The reciprocity principle in lunar photometry. Astrophys. J. 1941, 93, 403–410. [Google Scholar] [CrossRef]
- Hodgson, M.E.; Shelley, B.M. Removing the topographic effect in remotely sensed imagery. In Erdas Monitor; Kirn, J., Ed.; Erdas Inc.: Atlanta, GA, USA, 1994; Volume 6, pp. 4–6. [Google Scholar]
- Malm, N.R.; Houghton, F.E. Climatic Guide, Las Cruces, 1892–2000; New Mexico Agricultural Experiment Station Research: Las Cruces, NM, USA, 2003; Report 350. [Google Scholar]
- Reynolds, J.F.; Ross, A. Untitled Regionalization at the JRN: Scientific basis for regionalization at the JRN LTER site Jornada Basin LTER. Available online: http://atlantic.evsc.virginia.edu/regionalization/jrn.html (accessed on 26 August 2009).
- Jet Propulsion Laboratory. ASTER Higher-Level Product User Guide; JPL D-20062; NASA: Pasadena, CA, USA, 2001. [Google Scholar]
- Webb, E.K.; Pearman, G.I.; Leuning, R. Correction of flux measurements for density effects due to heat and water vapor transfer. Quart. J. Roy. Meteorol. Soc. 1980, 106, 85–100. [Google Scholar] [CrossRef]
- Jenness, J. Grid and Theme Regression 3.1e (grid_regression.avx) extension for ArcView 3.x. Jenness Enterprises: Flagstaff, AZ, USA, 2006. Available online: http://www.jennessent.com/arcview/regression.htm (accessed on 18 November 2008).
- Shuepp, P.H.; Leclerc, M.Y.; MacPherson, J.I.; Desjardins, R.L. Footprint prediction of scalar fluxes from analytical solutions of the diffusion equation. Bound.-Lay. Meteorol. 1990, 50, 355–373. [Google Scholar] [CrossRef]
- Scheffe, H. Statistical methods for evaluation of several sets of constants and several sources of variability. Chem. Eng. Progr. 1954, 50, 200–205. [Google Scholar]
- Mather, P.M. Computer Processing of Remotely-Sensed Images: An Introduction, 3rd ed.; John Wiley & Sons, Inc.: Chichester, UK, 2004. [Google Scholar]
© 2010 by the authors; licensee Molecular Diversity Preservation International, Basel, Switzerland. This article is an open-access article distributed under the terms and conditions of the Creative Commons Attribution license (http://creativecommons.org/licenses/by/3.0/).
Share and Cite
Mariotto, I.; Gutschick, V.P. Non-Lambertian Corrected Albedo and Vegetation Index for Estimating Land Evapotranspiration in a Heterogeneous Semi-Arid Landscape. Remote Sens. 2010, 2, 926-938. https://doi.org/10.3390/rs2040926
Mariotto I, Gutschick VP. Non-Lambertian Corrected Albedo and Vegetation Index for Estimating Land Evapotranspiration in a Heterogeneous Semi-Arid Landscape. Remote Sensing. 2010; 2(4):926-938. https://doi.org/10.3390/rs2040926
Chicago/Turabian StyleMariotto, Isabella, and Vincent P. Gutschick. 2010. "Non-Lambertian Corrected Albedo and Vegetation Index for Estimating Land Evapotranspiration in a Heterogeneous Semi-Arid Landscape" Remote Sensing 2, no. 4: 926-938. https://doi.org/10.3390/rs2040926