Article

Snow Cover Monitoring Using MODIS Data in Liaoning Province, Northeastern China

Institute of Space and Earth Information Science, Yuen Yuen Research Centre for Satellite Remote Sensing, The Chinese University of Hong Kong, Shatin, Hong Kong, China
*
Author to whom correspondence should be addressed.
Remote Sens. 2010, 2(3), 777-793; https://doi.org/10.3390/rs2030777
Submission received: 25 January 2010 / Revised: 2 March 2010 / Accepted: 2 March 2010 / Published: 17 March 2010

Abstract

:
This paper presents the results of snow cover monitoring studies in Liaoning Province, northeastern China, using MODIS data. Snow cover plays an important role in both the regional water balance and soil moisture properties during the early spring in northeastern China. In addition, heavy snowfalls commonly trigger hazards such as flooding, caused by rapid snow melt, or crop failure, resulting from fluctuations in soil temperature associated with changes in the snow cover. The latter is a function of both regional, or global, climatic changes, as well as fluctuations in the albedo resulting from variations in the Snow Covered Area (SCA). These impacts are crucial to human activities, especially to those living in middle-latitude areas such as Liaoning Province. Thus, SCA monitoring is currently an important tool in studies of global climate change, particularly because satellite remote sensing data provide timely and efficient snow cover information for large areas. In this study, MODIS L1B data, MODIS Daily Snow Products (MOD10A1) and MODIS 8-day Snow Products (MOD10A2) were used to monitor the SCA of Liaoning Province over the winter months of November–April, 2006–2008. The effects of cloud masking and forest masking on the snow monitoring results were also assessed. The results show that the SCA percentage derived from MODIS L1B data is relatively consistent, but slightly higher than that obtained from MODIS Snow Products. In situ data from 25 snow stations were used to assess the accuracy of snow cover monitoring from the SCA compared to the results from MODIS Snow Products. The studies found that the SCA results were more reliable than MODIS Snow Products in the study area.

1. Introduction

Estimation of snowpack parameters, such as Snow Covered Areas (SCA), is a key element of hydrological and climatological studies in high or middle-latitude regions. In addition to the importance of snow cover for early spring water supply and soil moisture content, snow may also generate adverse impacts or damage, such as the death of livestock in deep snow, flooding caused by rapid snow melt, and crop failure due to soil temperature fluctuations. The latter results from changes in the snow cover caused by a large-scale climate change, as well as from fluctuations in the albedo in response to variations in the SCA. These impacts are crucial to human activities, especially in the middle-latitude regions. Consequently, snow cover monitoring is becoming one of the most important current earth observation topics, as well as a significant component of digital earth studies. However, very few reliable large-scale snow monitoring results were obtained before the application of satellite remote sensing, especially in sparsely inhabited areas. Since the 1970s, snow cover monitoring from space has become a routine operation using satellite optical imagery [1].
Snow is a mixture of ice crystals, liquid water, and air [2]. The reflectivity of snow can reach 90% in the visible spectrum. Reflected radiance and irradiance from the snow cover are sensitive to both the grain size of the snow and its vertical profile. When the inhomogeneity of the vertical particle size distribution is also taken into account, the measured spectral albedo can be matched, regardless of the particle shapes. However, this is not true for the modeled radiance distribution, which is highly dependent upon the particle shape [3]. In fact, snow reflectance with different grain sizes in the visible wavelengths is comparatively high, much greater than for most other land cover types, with the exception of cloud, although it decreases dramatically in the near-infrared wavelengths at 1.0–1.6 μm [2]. Thus, the ratio of the visible to the near-infrared can be used to distinguish snow from the other land cover types in optical remote sensing images.
Although satellite remote sensing is able to provide information about fluctuations in snow cover, several difficulties prevail. The most pervasive is the effect of land cover and cloud cover. Differentiation of land cover types is essential in the interpretation of snow information [4]. In particular, the effect of forested areas on SCA estimations [5] is a problem common to all approaches to snow remote sensing in seasonal snow covers [6] and complex landscapes [7,8,9].
Remote sensing applications for snow monitoring started around the early 1990s in Xinjiang, western-inner Mongolia, and the Qinghai-Tibet Plateau of western China. Recently, optical remote sensing data (e.g., AVHRR and Terra/MODIS) have been used to monitor snow properties in Xinjiang [10,11]. Compared with in situ observations over four winters in northern Xinjiang, results showed that MODIS data are preferable to AVHRR data for snow monitoring in Xinjiang [12,13]. However, there are very few studies of seasonal snow cover monitoring in northeastern China [14,15].
In this study, MODIS L1B data, MODIS Daily Snow Products (MOD10A1) and MODIS 8-day Snow Products (MOD10A2) were applied for the first time to SCA monitoring in Liaoning Province, during the winter months of November–April, 2006–2008. In addition, cloud masking and forest masking were examined to determine their effects on snow monitoring. The results obtained show that the SCA percentage from MODIS L1B data is relatively consistent, although slightly higher than that of MODIS Snow Products. In situ data from 25 snow stations were used to investigate the relative accuracy of the SCA results compared to MODIS Snow Products. Comparisons showed that the SCA results obtained were better than MODIS Snow Products in the Liaoning Province study area. However, future long-term monitoring of snow cover in the study area is necessary to confirm the findings over several years.

2. Study Area and Data
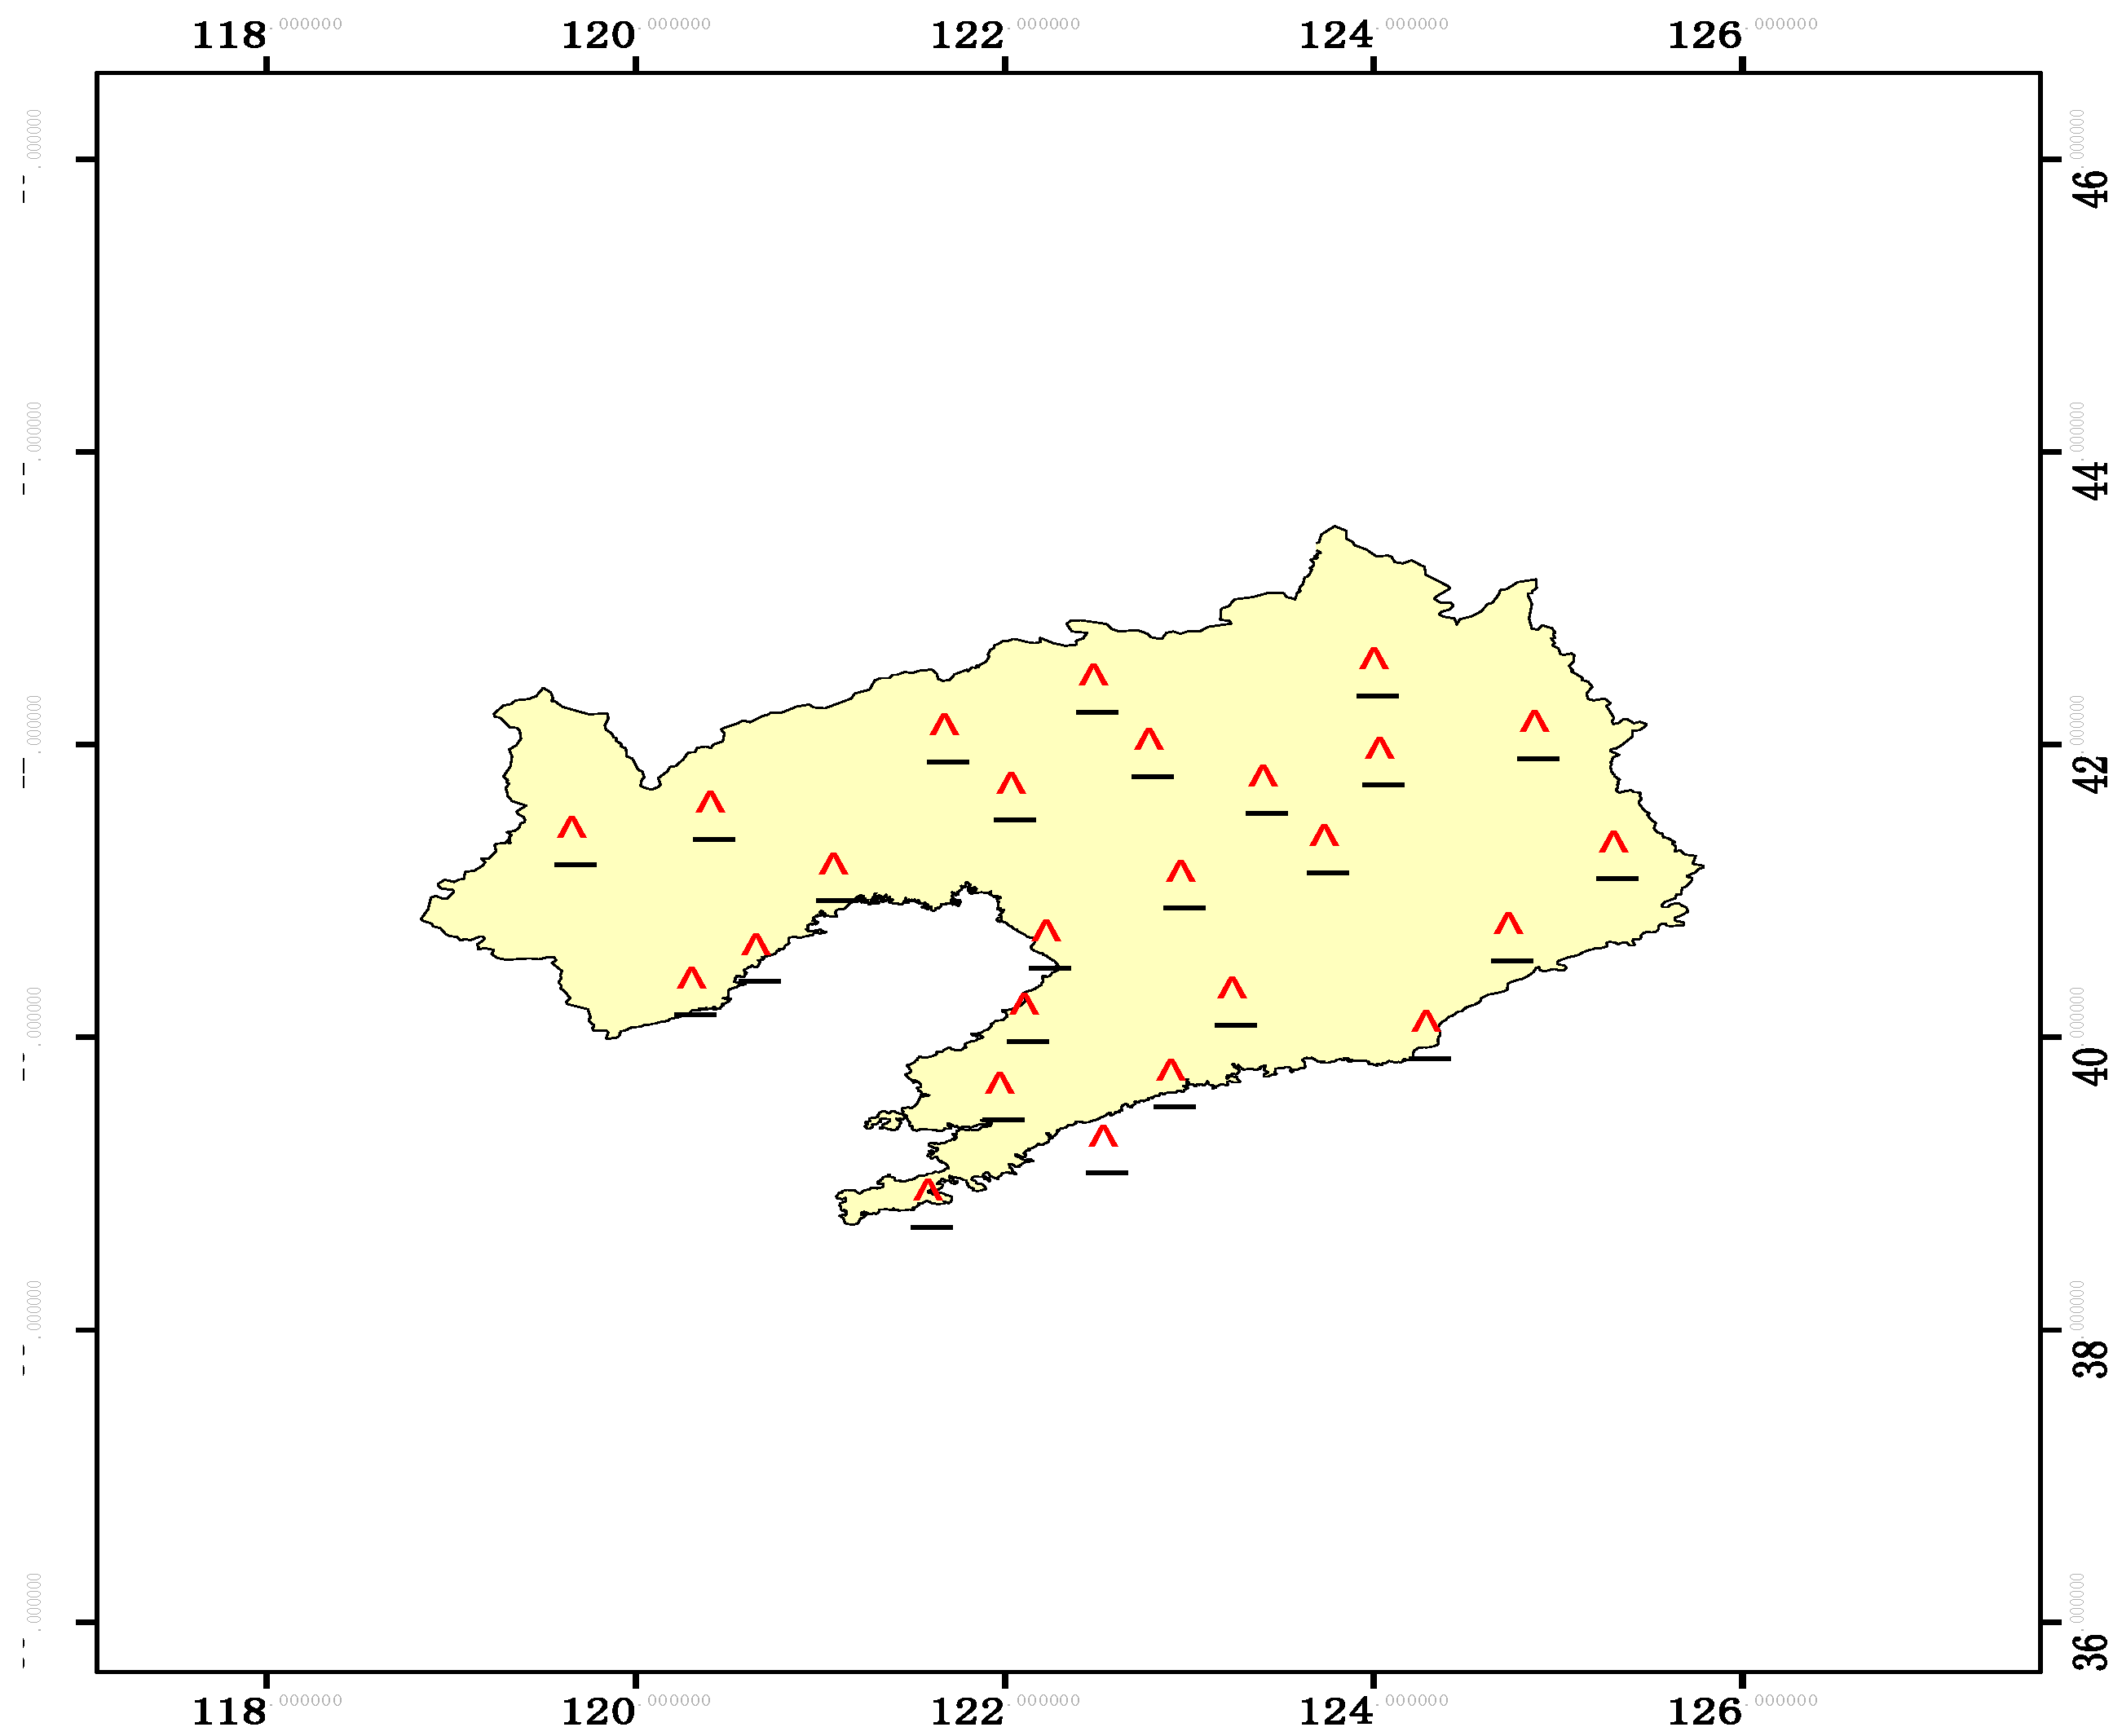
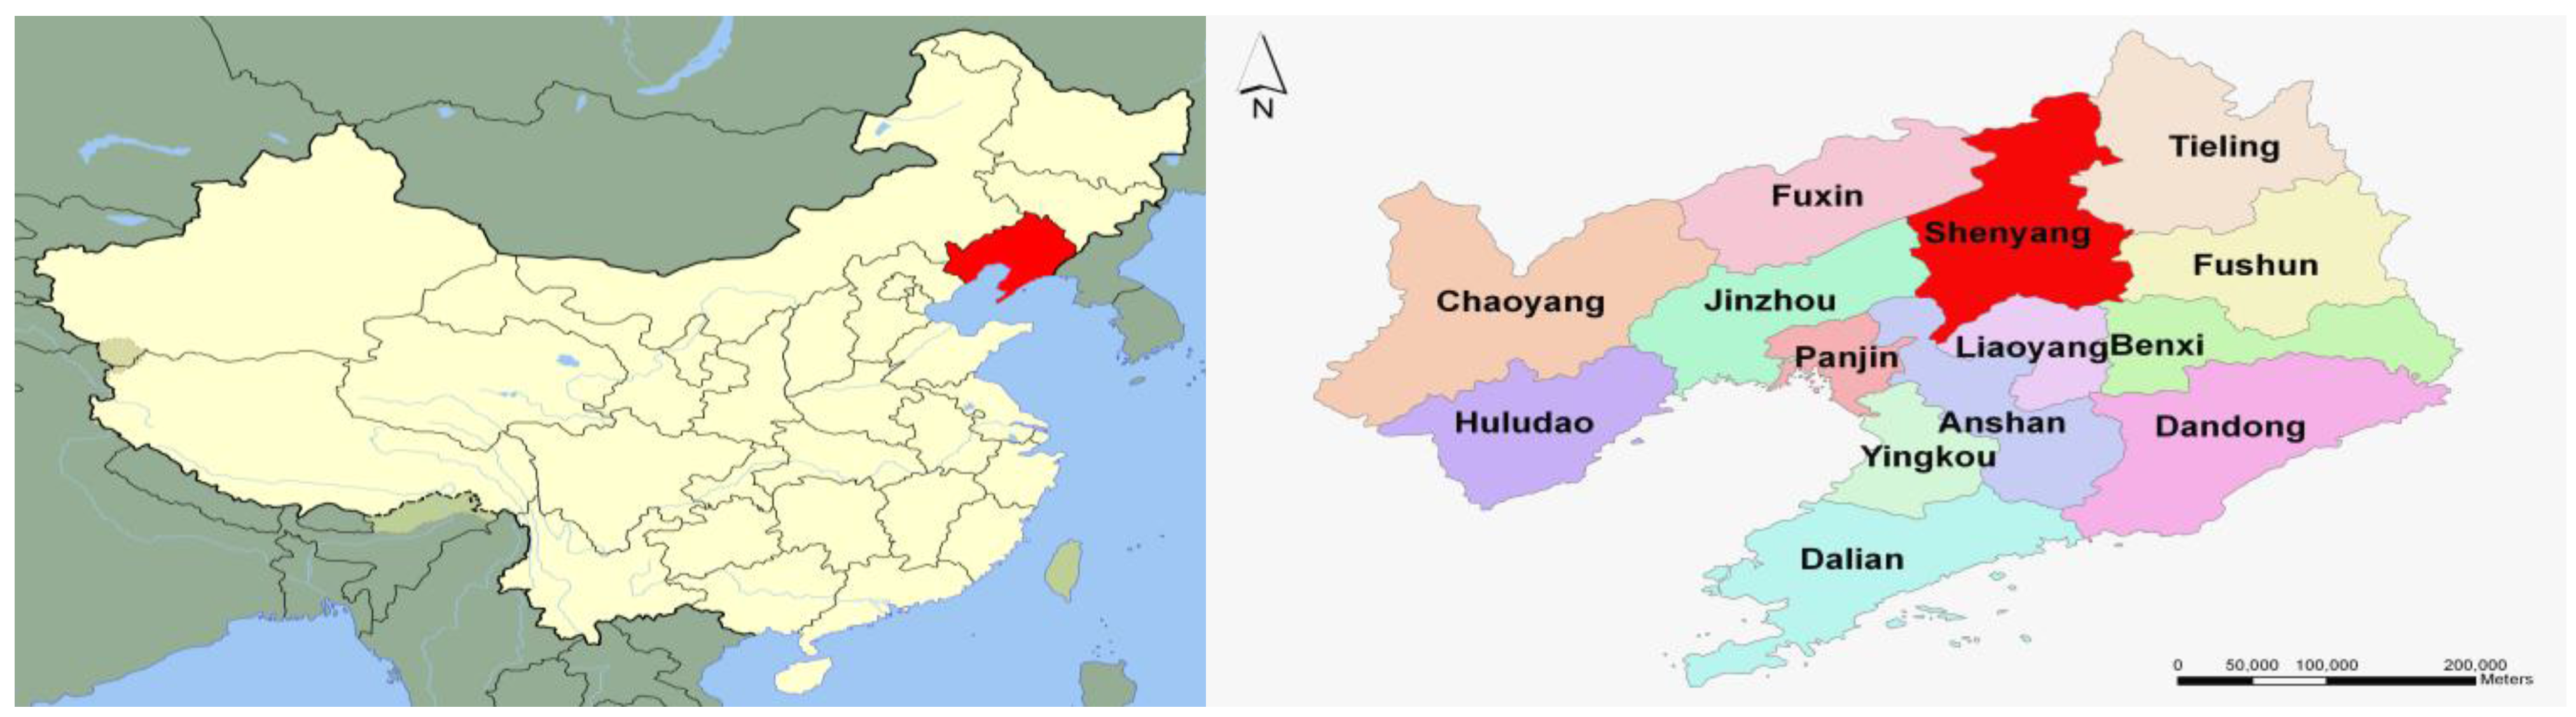
2.1. Study Area

The study area is located in Liaoning Province, northeastern China (between 38°43'N to 43°2'N and 119°37'E to 125°33'E) (Figure 1), covering an area of 145,900 square kilometers. This area is popularly known as “the Golden Triangle” because of its superior geographical location, bounded by the Yellow Sea, Bohai Gulf, and Yalu River. Liaoning consists of central lowland, flanked by mountains and highlands in the east and west. The southward extension of the eastern highlands forms the Liaoning Peninsula. There are abundant, complex and varied land resources that provide a broad base for economic development. The area of cultivable land constitutes 29.5% of the total area, with forest comprising 31.84%, grazing land 2.7%, and water bodies 6.9%. The annual mean temperature ranges between 6.3–13.1 °C, with an annual precipitation of 460–1,120 mm. According to local snow records, the snow cover in Liaoning Province generally persists from early November to the following April [16,17].
Figure 1. The Liaoning Province study area.
Remotesensing 02 00777 g001
Snow monitoring is of great economic importance in Liaoning Province. Early spring snow melt is the main water source for agriculture. Liaoning is a major producer of cotton, peanuts, corn, rice, soybeans, and apples, therefore understanding water resources and soil moisture have important economic implications. Consequently, information about winter snowfall and snow cover is crucial for agricultural management and decision making. In addition, heavy snowfalls commonly present hazards to human activities in high or middle-latitude areas such as Liaoning Province. For example, heavy snowfalls on the 3rd March 2007 caused immense damage. Transportation was disrupted, houses collapsed, power and water supplies were cut off in many cities during the period. Therefore, snow monitoring from satellite data is a valuable tool in this kind of situation. However, because of the complex land cover types in the Province, and its proximity to the ocean, the accurate mapping of snow cover is still difficult in the Province.

2.2. Data

2.2.1. In situ Data

Daily Snow Water Equivalent (SWE) and temperature data from 25 weather stations across Liaoning Province (Figure 2), gathered during the winters of 2006–2008, were used for validation of the remote sensing estimation derived in this study, and for the MODIS snow products.
Figure 2. Distribution of the 25 weather stations used for the study.
Remotesensing 02 00777 g002

2.2.2. MODIS Data

The Moderate-resolution Imaging Spectro-radiometer (MODIS) has 36 channels, 20 in the visible and near-infrared bands, and 16 in the thermal infrared region. The spectral range is from 0.4 μm to 14.3 μm. Freely available MODIS L1B data for the periods from November–April of 2006–2008 were applied to SCA monitoring because of their appropriate temporal, spatial, and spectral resolution [18].
In addition, MODIS Snow Products MOD10A1 and MOD10A2 data [19] were compared with the SCA mapping. They provided fractional snow cover information and snow albedo in the 500-m resolution products, which comprise snow products with temporal resolutions between ¼-day to 8-day, respectively.
Cloud masks of MODIS 8-day Snow Products were also used to minimize the cloud effect and to improve the accuracy of SCA information in the area.

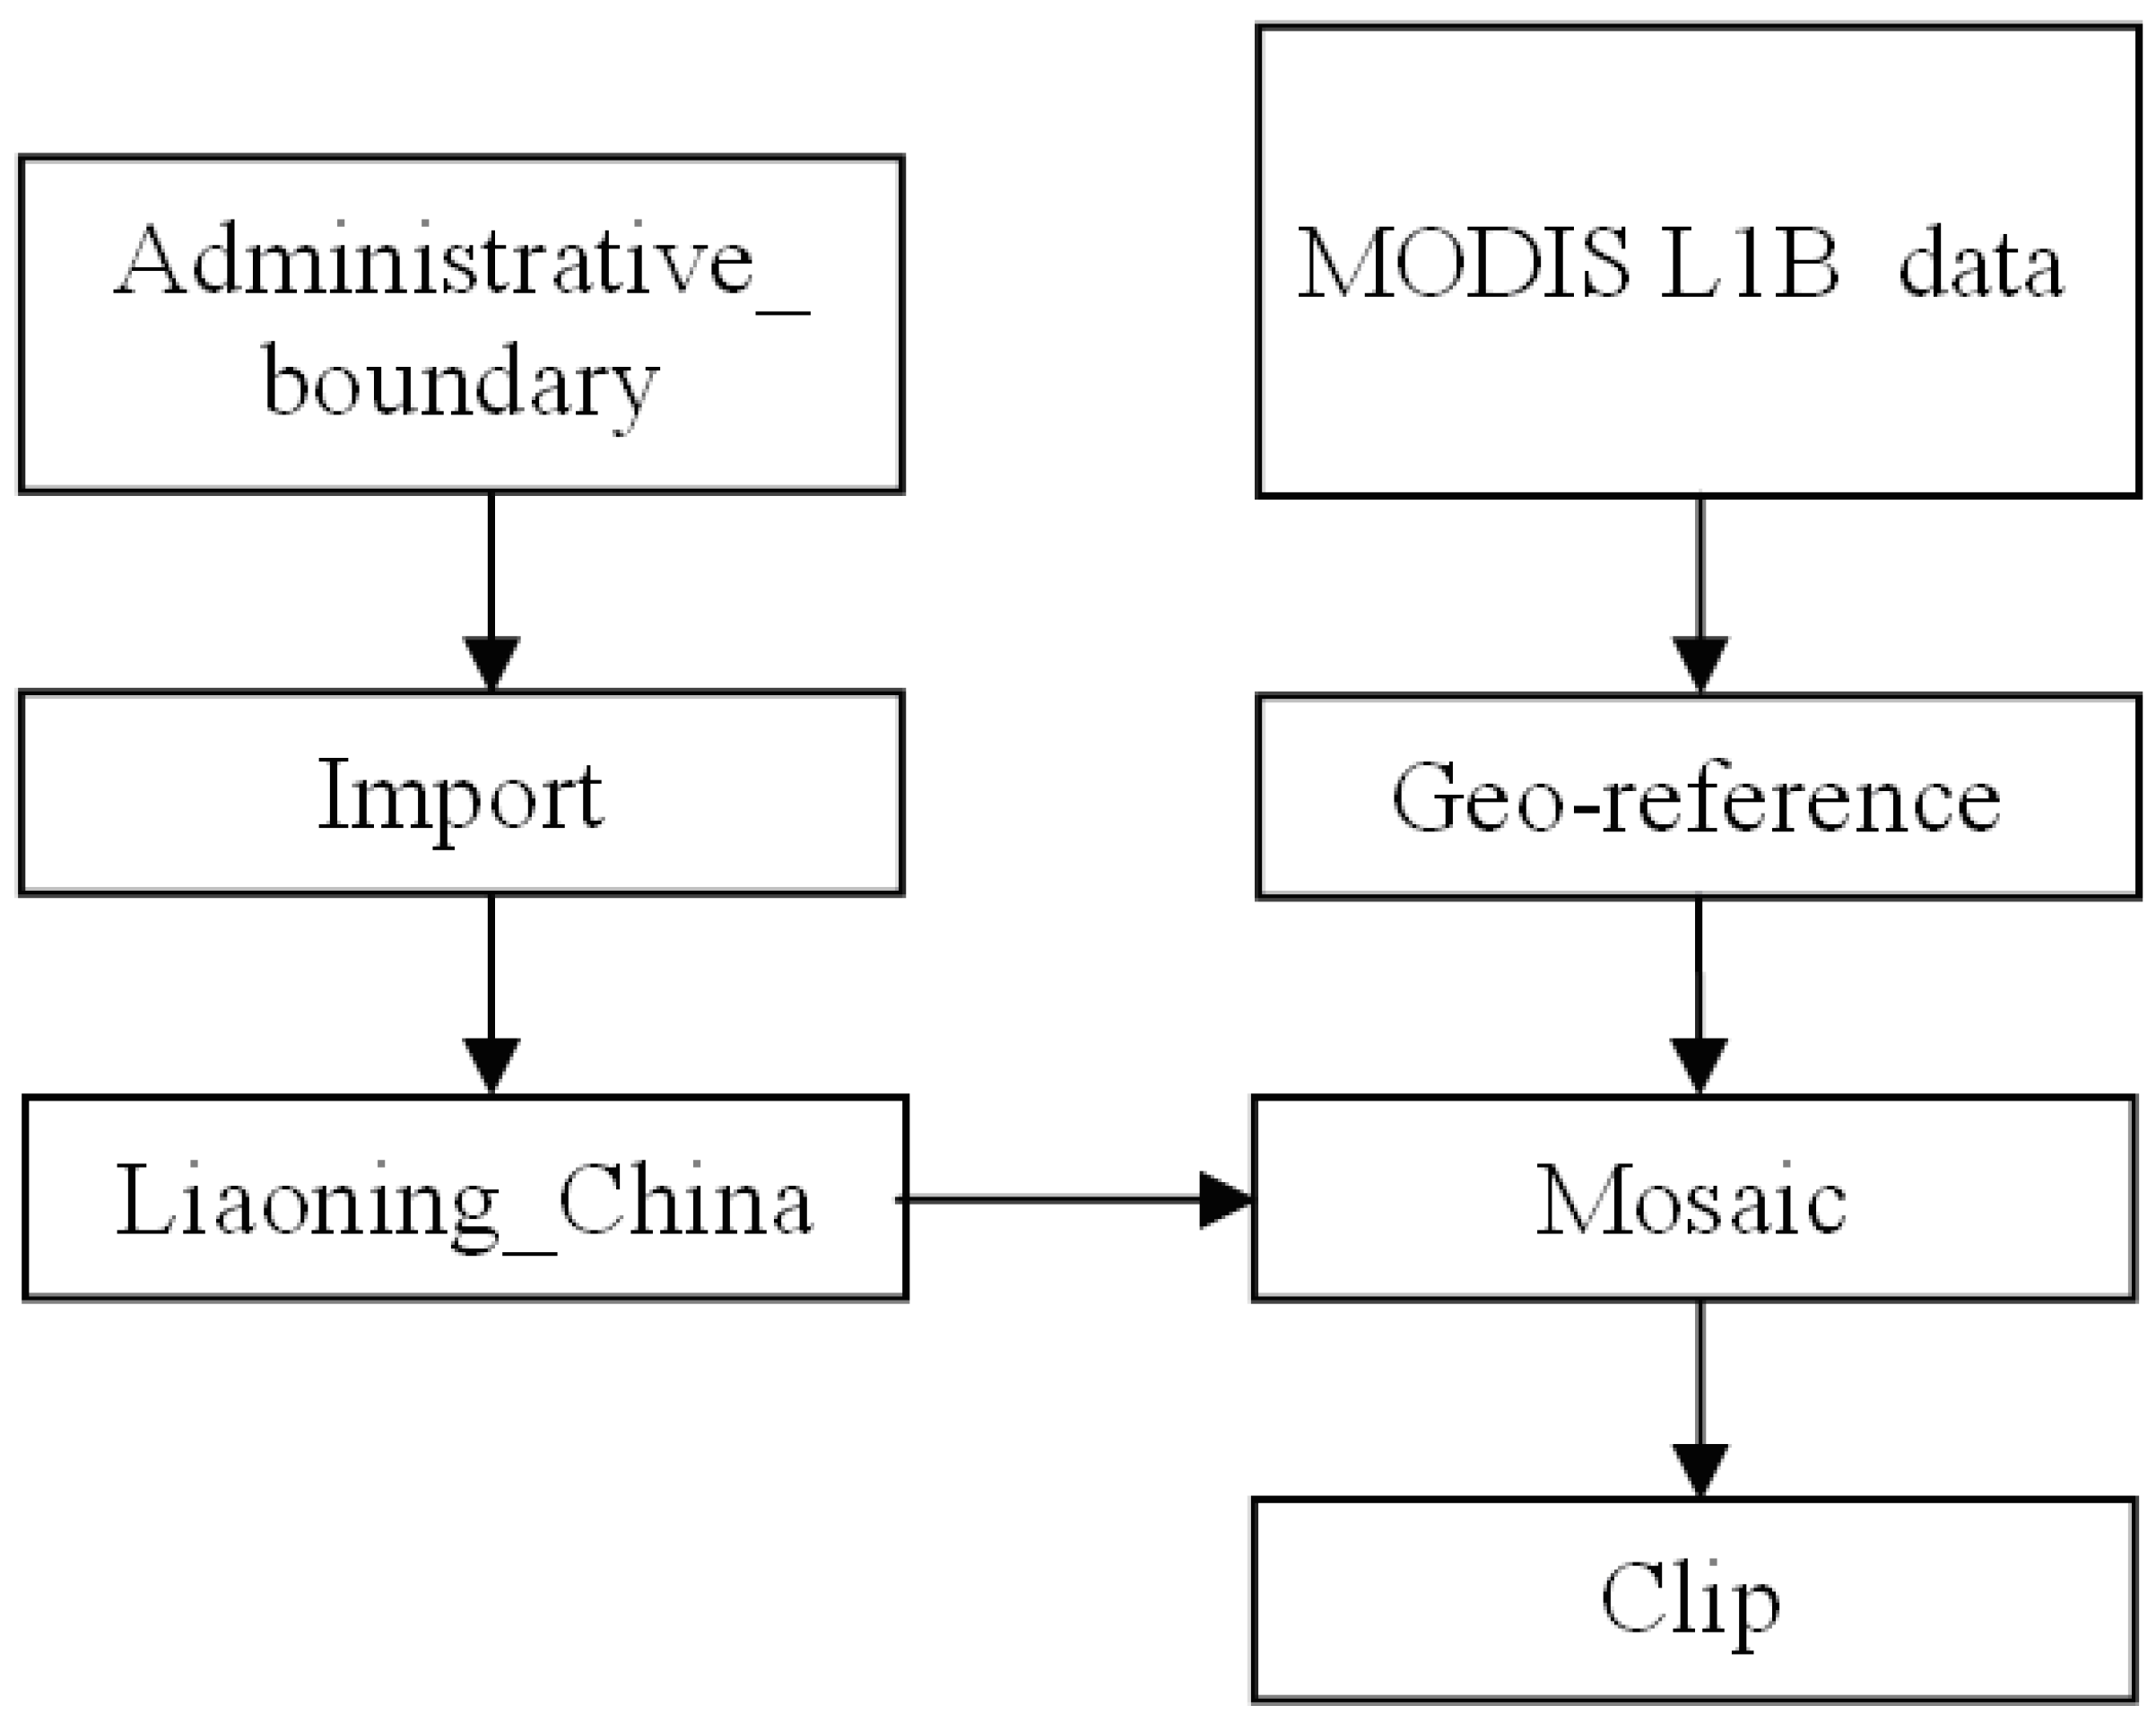
2.3. Pre-Processing of MODIS Data

MODIS L1B data are widely applied in Earth observations. However, useful information can be only extracted after data pre-processing. Normally, data pre-processing is performed manually. Satellite images are usually selected based on the researcher’s experience. Images depicting cloud cover will normally be ignored, because the pixel values recorded in optical remote sensing data mainly describe information gathered from the clouds rather than from the surface of Earth. Geo-coding is assigned to each pixel for the appropriate location, by which each point on the image will have a unique geographical coordinate (i.e., latitude and longitude). This is the process of geo-referencing, which is the most important step in pre-processing MODIS L1B data, and is usually carried out using software like ENVI. Because the Earth is spherical, the remote sensors have a certain incident angle. After geo-referencing, a rectangular image may be transformed into a fan-shaped image, or into another shape. It was always the case that geo-referenced images were not available for the area of interest. The second selection of images for processing could only be conducted after geo-referencing. Moreover, during the period of manual processing, operators have to constantly be present at the computer to interact with the processing software. Overall, manual pre-processing is time-consuming and manpower intensive. For this study, MODIS data were selected according to their location and cloud conditions before geo-referencing. Subsequently, all the selected images were geo-referenced, mosaiced, and clipped automatically, without the need for manual monitoring of the computer. Figure 3 shows the basic procedures for MODIS data pre-processing.
Figure 3. The procedure of MODIS data pre-processing.
Remotesensing 02 00777 g003

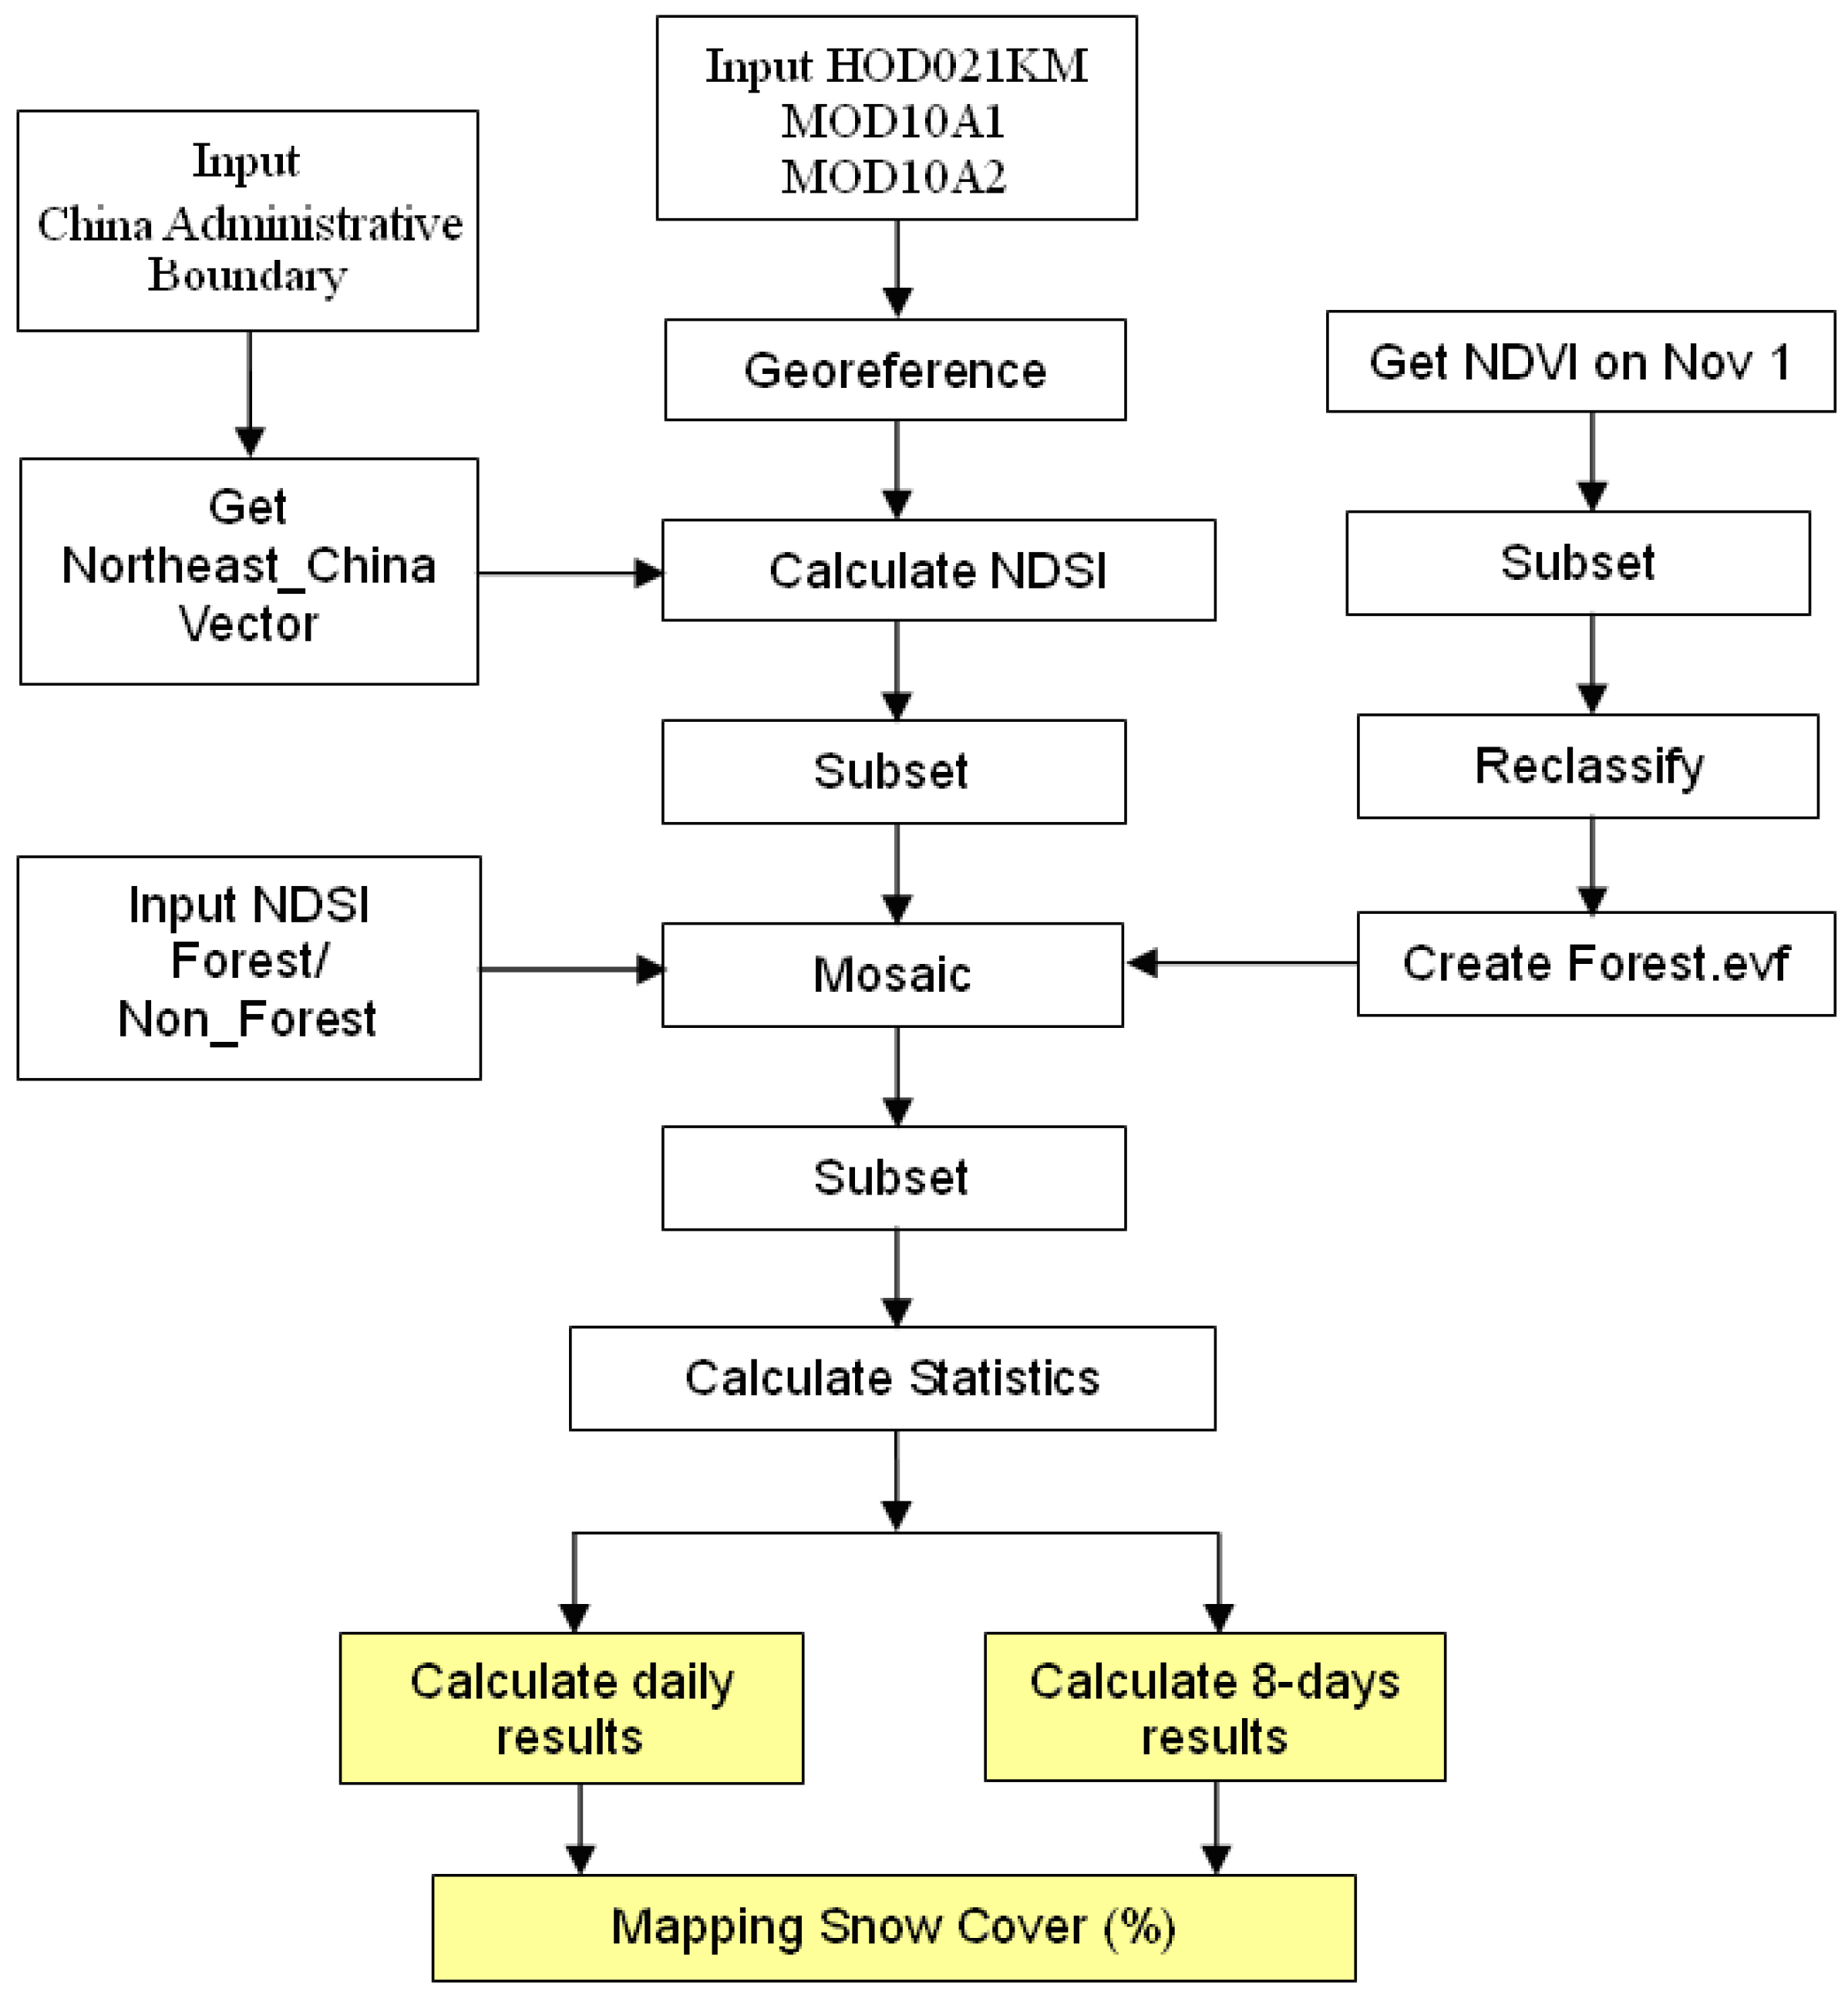
3. Methodology for Snow Mapping

3.1. Snow Mapping from Optical Remote Data

The Normalized Difference Snow Index (NDSI) is used to discriminate snow from other land cover types [2,20,21]. This is defined as:
N D S I = R v R n i R v + R n i
where R v and R n i are reflectance values in the visible and near-infrared optical bands, respectively.
Snow is usually assumed to be present if the NDSI value exceeds 0.4 [22,23,24]. The SCA calculation can be described as:
NDSI ≥ 0.4
Although the SCA threshold is normally selected as 0.4, this value is not applied to all land cover types. Recent investigations suggest that the optimum threshold value varies seasonally for different land cover types [2], especially in forested areas.
Various algorithms have been developed for SCA retrieval, but their accuracy is not yet satisfactory, especially at the local scale. The remote sensing signals response to the SCA results derived from optical remote sensing data were found to depend substantially on the land cover types. For instance, the responses are clearly higher for open areas (farmland, bogs and lakes) than for forested areas [25].
In situ measurements show that NDSI values in snow covered forests are lower than 0.4. Consequently, for accurate mapping in these areas, a comparatively lower value of NDSI has to be selected for the forested areas than for the open areas. Therefore, the SCA mapping adopted an NDSI value of greater than or equal to 0.2 [7].

3.2. Snow Mapping in the Forested Areas

A time series of the Normalized Difference of Vegetation Index (NDVI) datasets was also applied to define the possible bound of forest in the study area. NDVI is used to assess whether the target being observed contains living green vegetation or not. The NDVI of an area containing a dense vegetation canopy will tend towards positive values (0.3–0.8), but it will be negative if a cloud cover and/or snow cover is present. During the winter, grassland and farmland tends towards low NDVI values in the study area, while the pixels returning high NDVI values are most likely to be forested areas. Thus, if the value of NDVI is greater than or equal to 0.4, it is considered to be a snow covered forest.

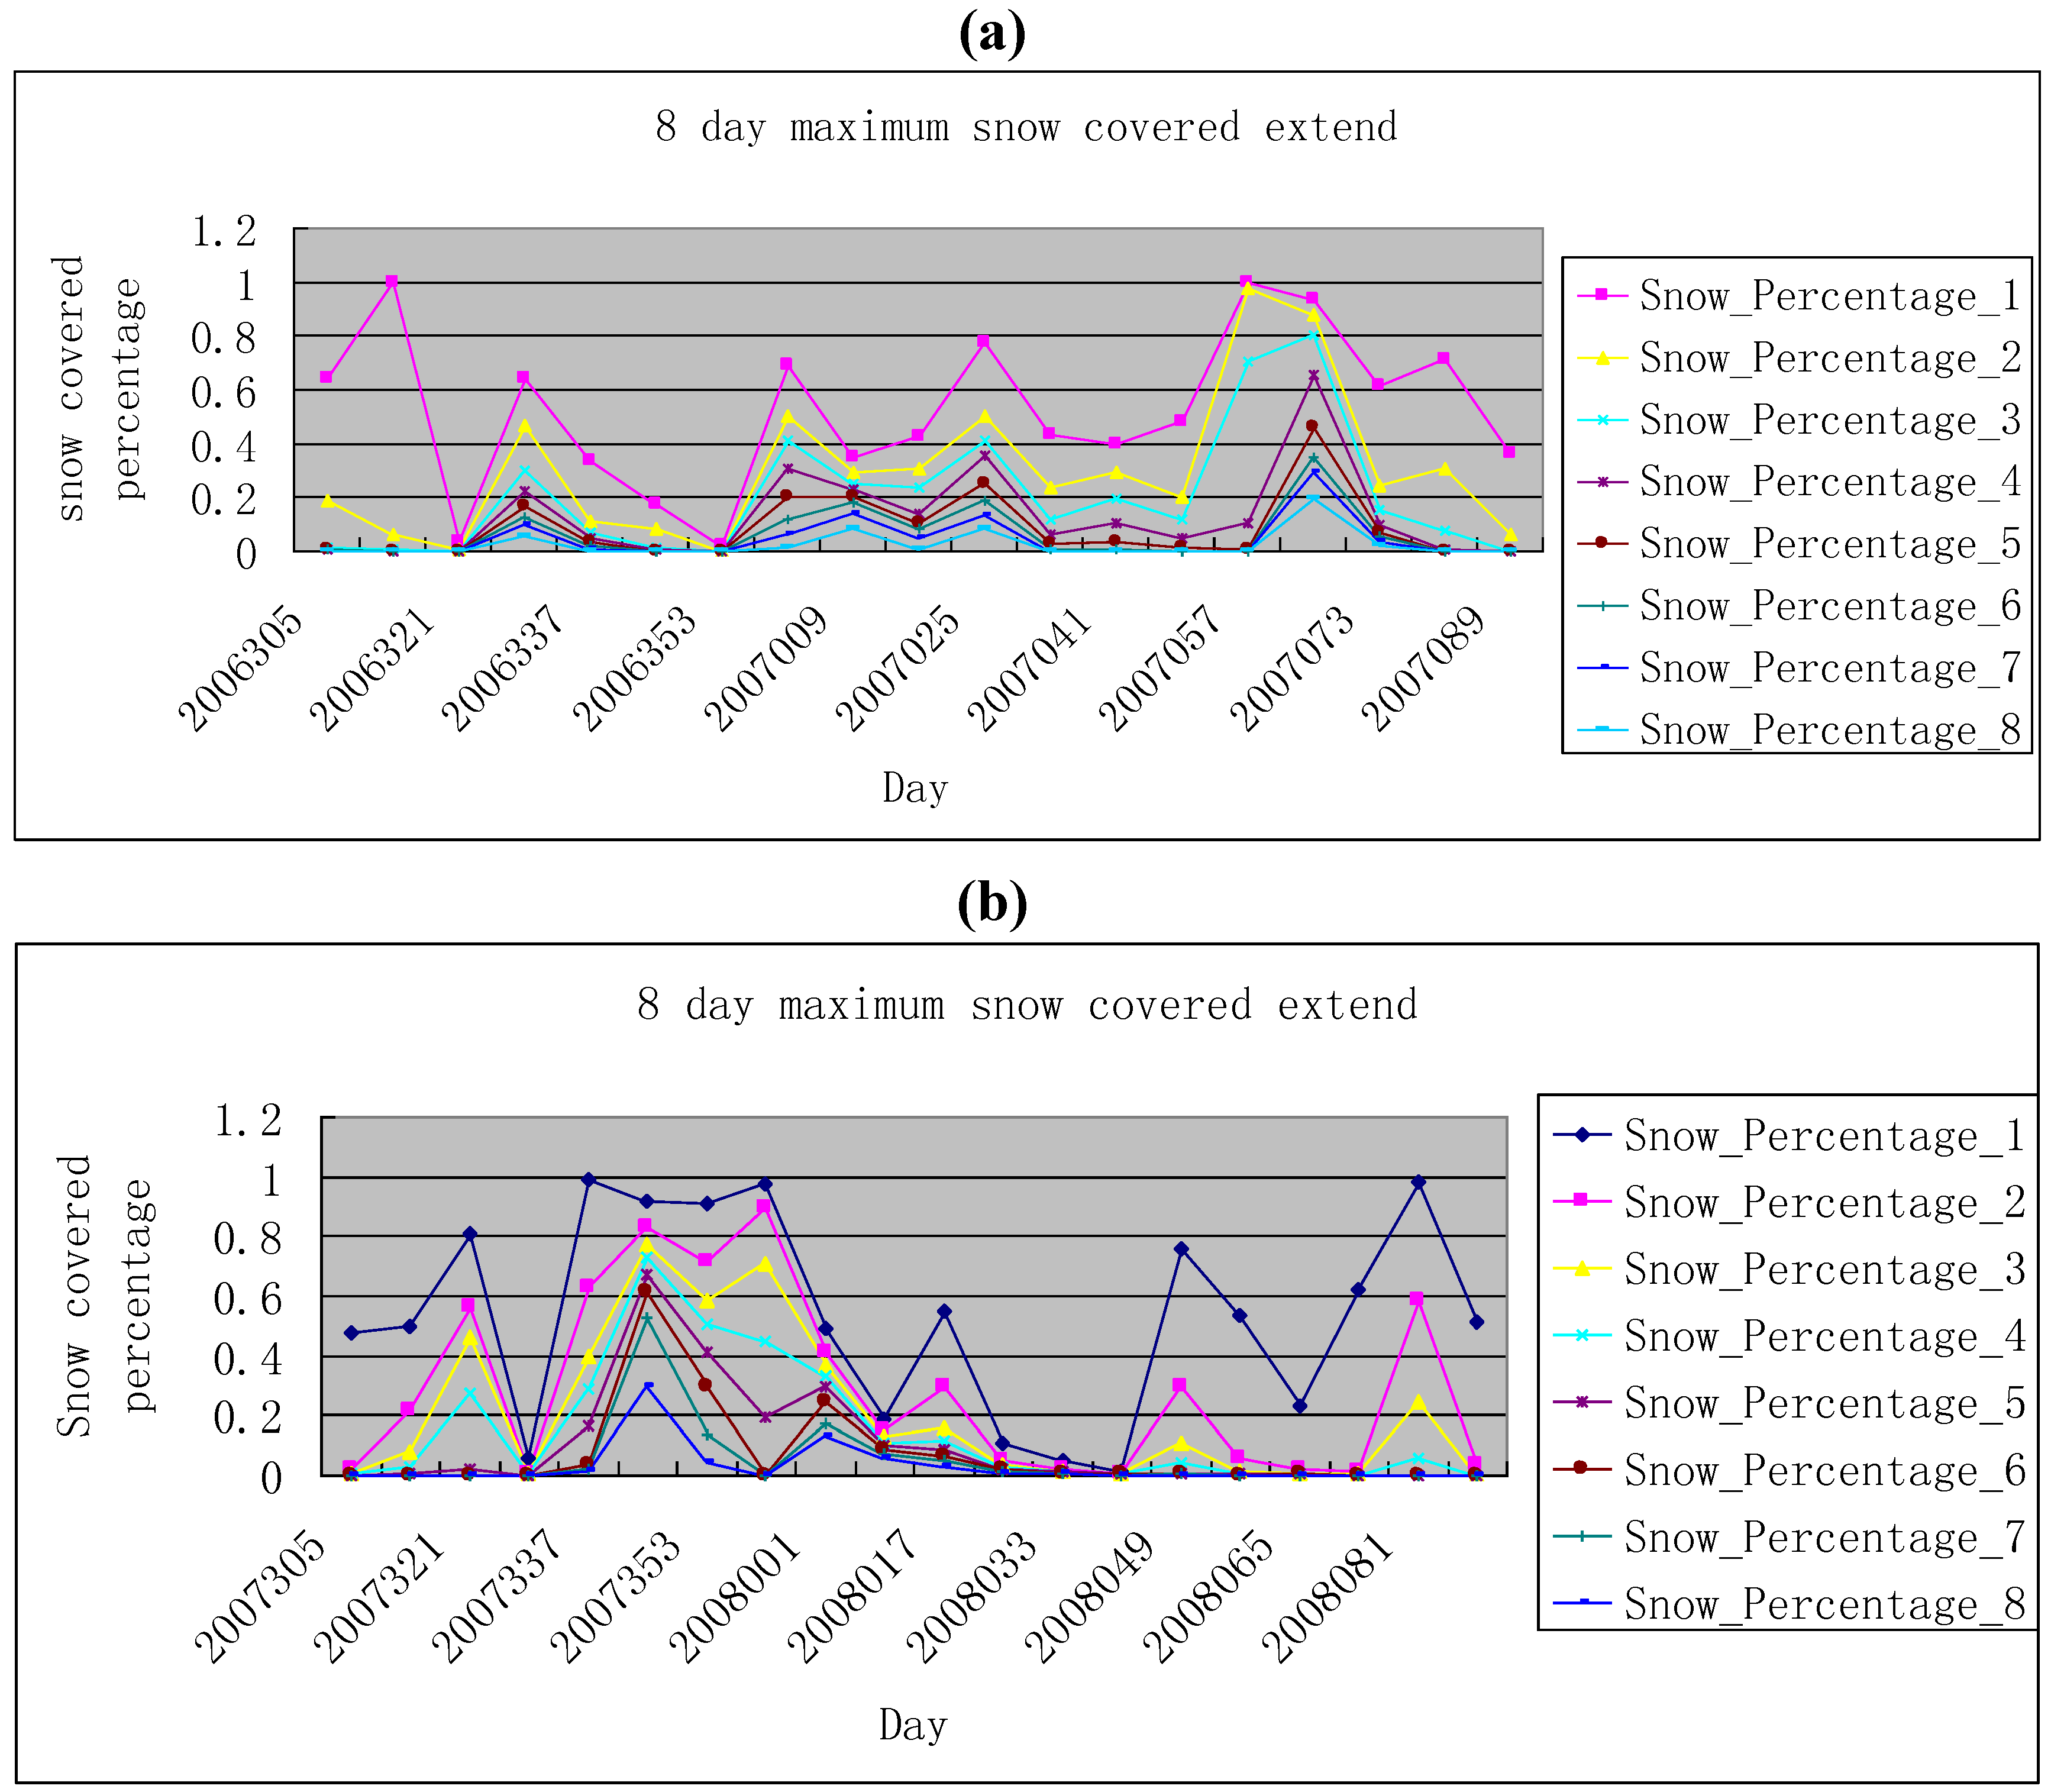
3.3. 8-Day Maximum Snow Extent Derived from MODIS L1B Data

SCA mapping results are significantly affected by the weather and by environmental conditions such as daily temperature and cloud cover. To improve the estimation accuracy, an 8-day maximum snow extent map was generated by superimposing snow maps from eight successive days. Figure 4 outlines the procedure for MODIS data processing.
Because in situ SWE data cannot be translated into snow cover map information without an analysis of temperature conditions, it was necessary to pre-process in situ SWE data to obtain daily in situ snow cover information for the 25 stations (see Figure 5).
Based on the daily in situ snow map, 8-day maximum snow extents from in situ measurements were then derived for the study area. Pixels with precipitation values greater than 0 during a period of eight successive days were recorded as snow covered areas.
Figure 4. Flowchart for snow cover mapping.
Remotesensing 02 00777 g004
Figure 5. Flow chart of in situ snow cover map generation.
Remotesensing 02 00777 g005

4. Results and Discussion

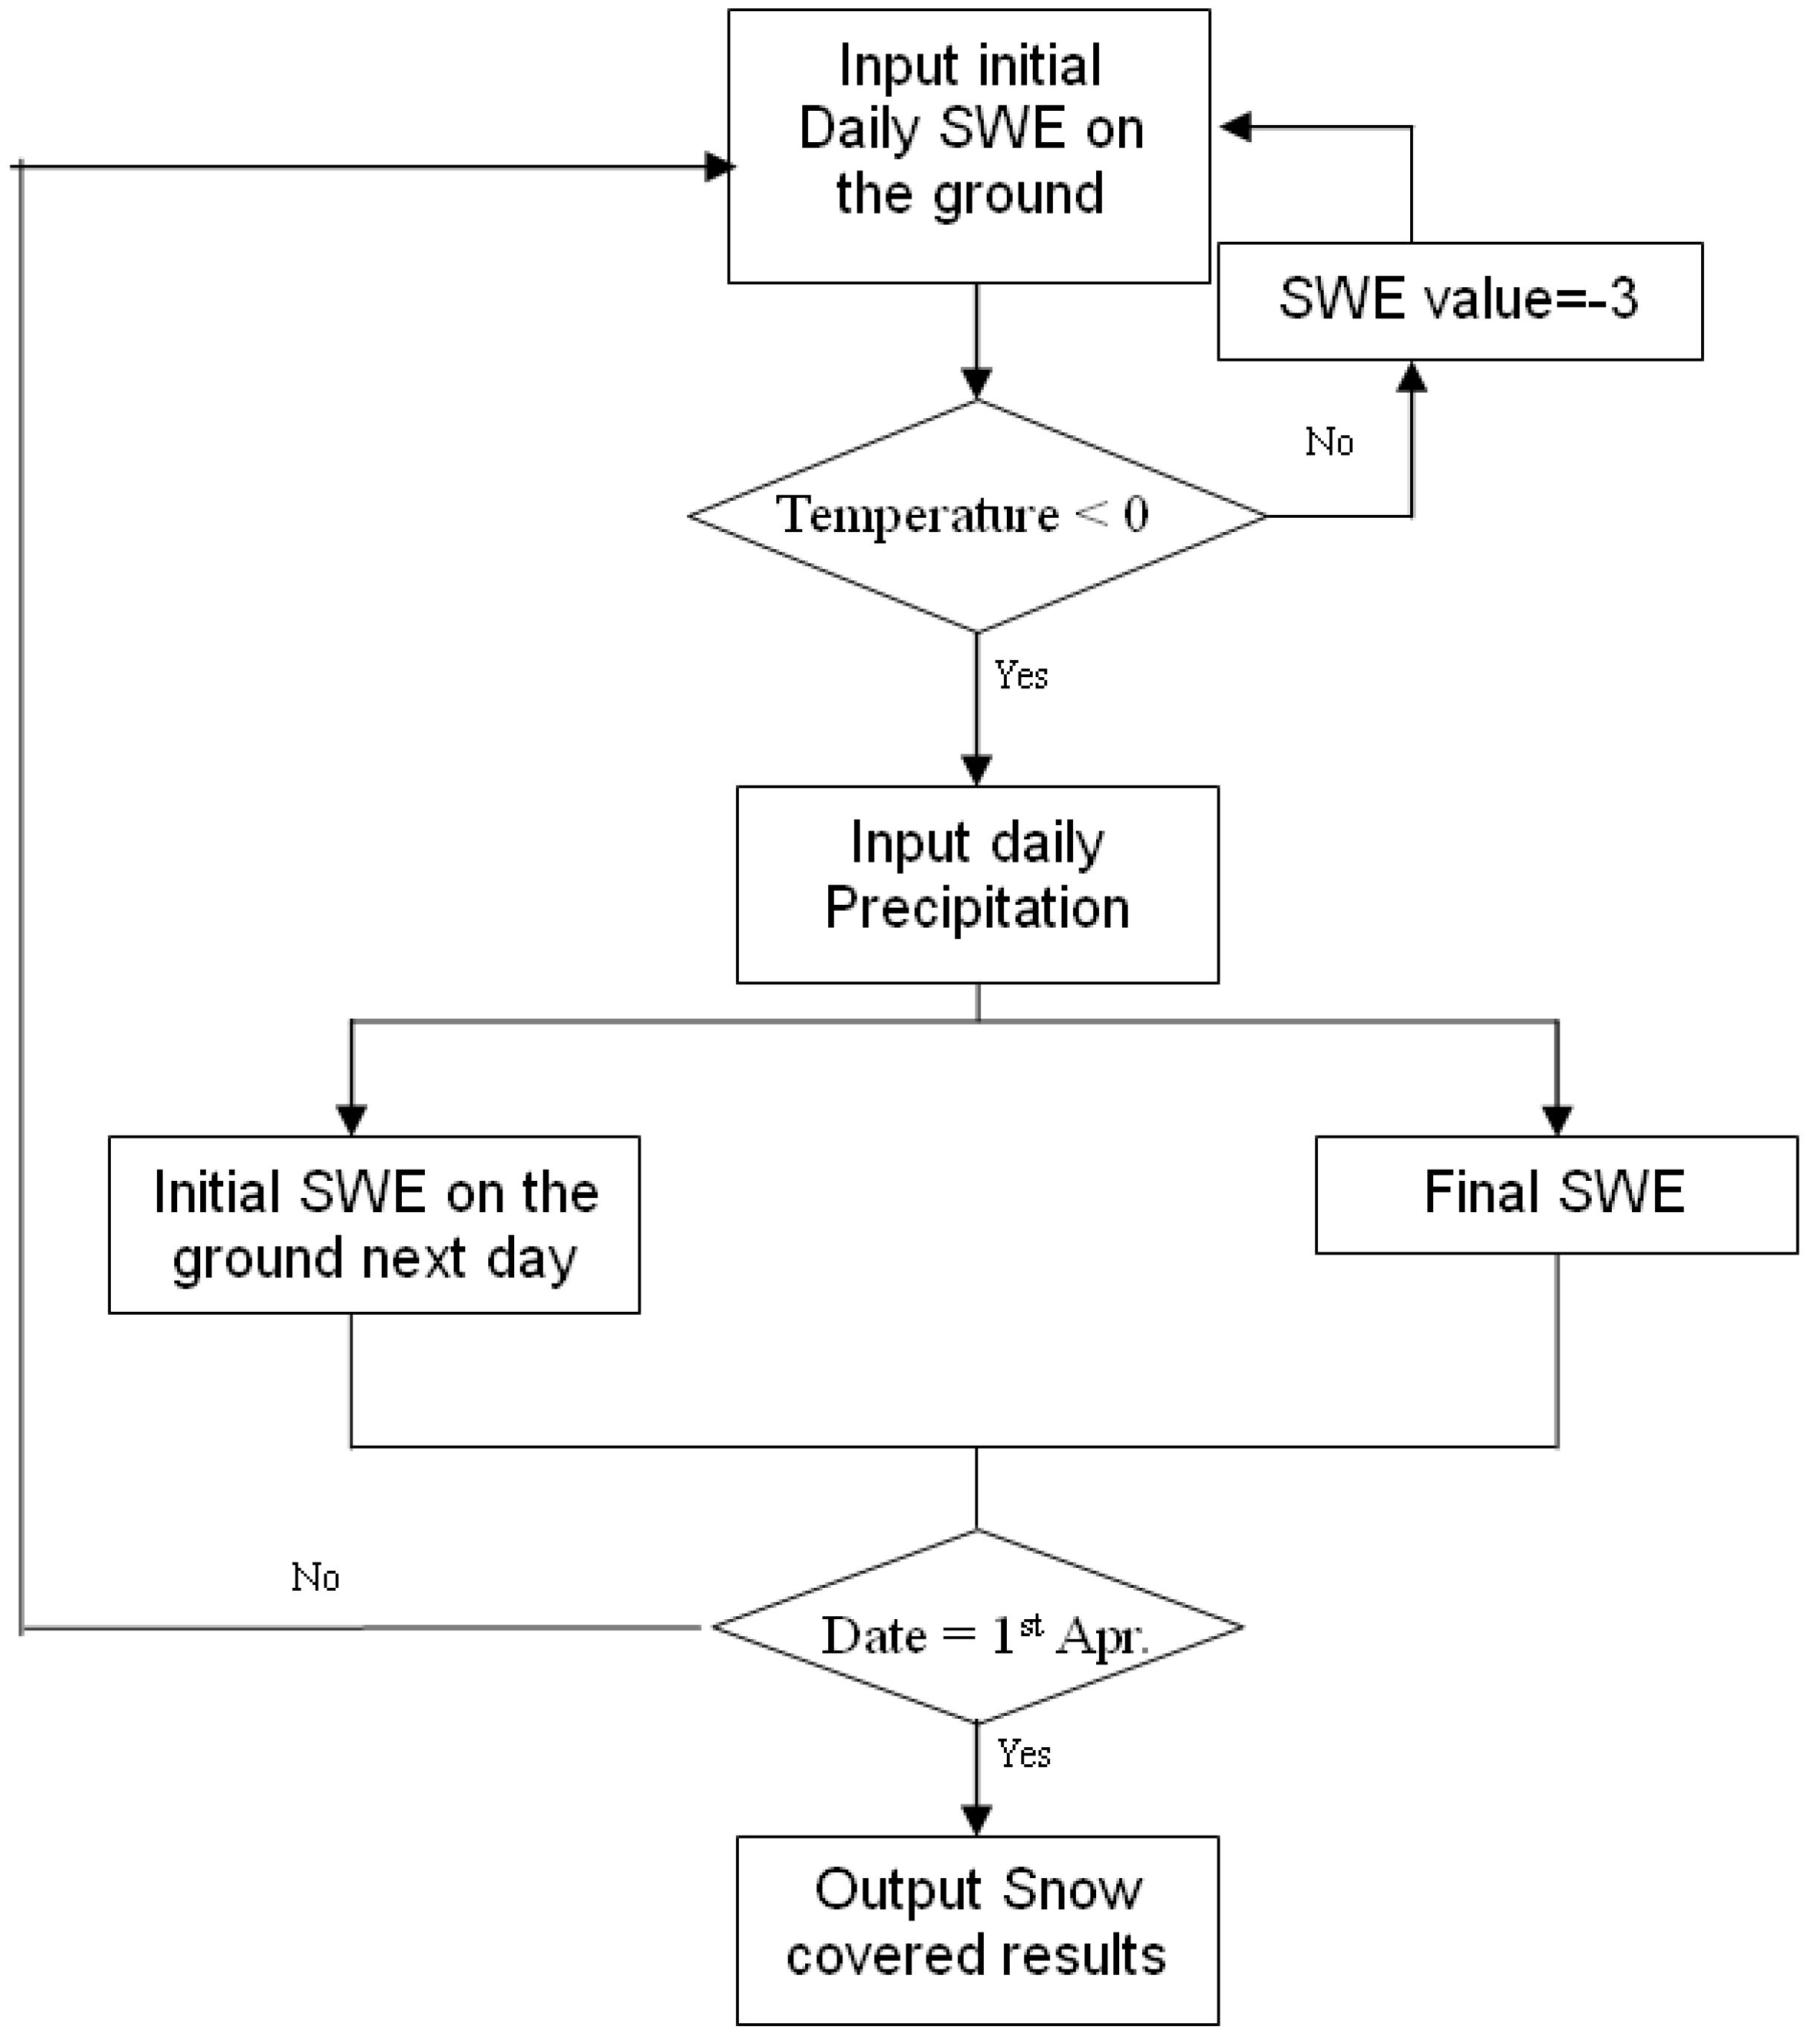
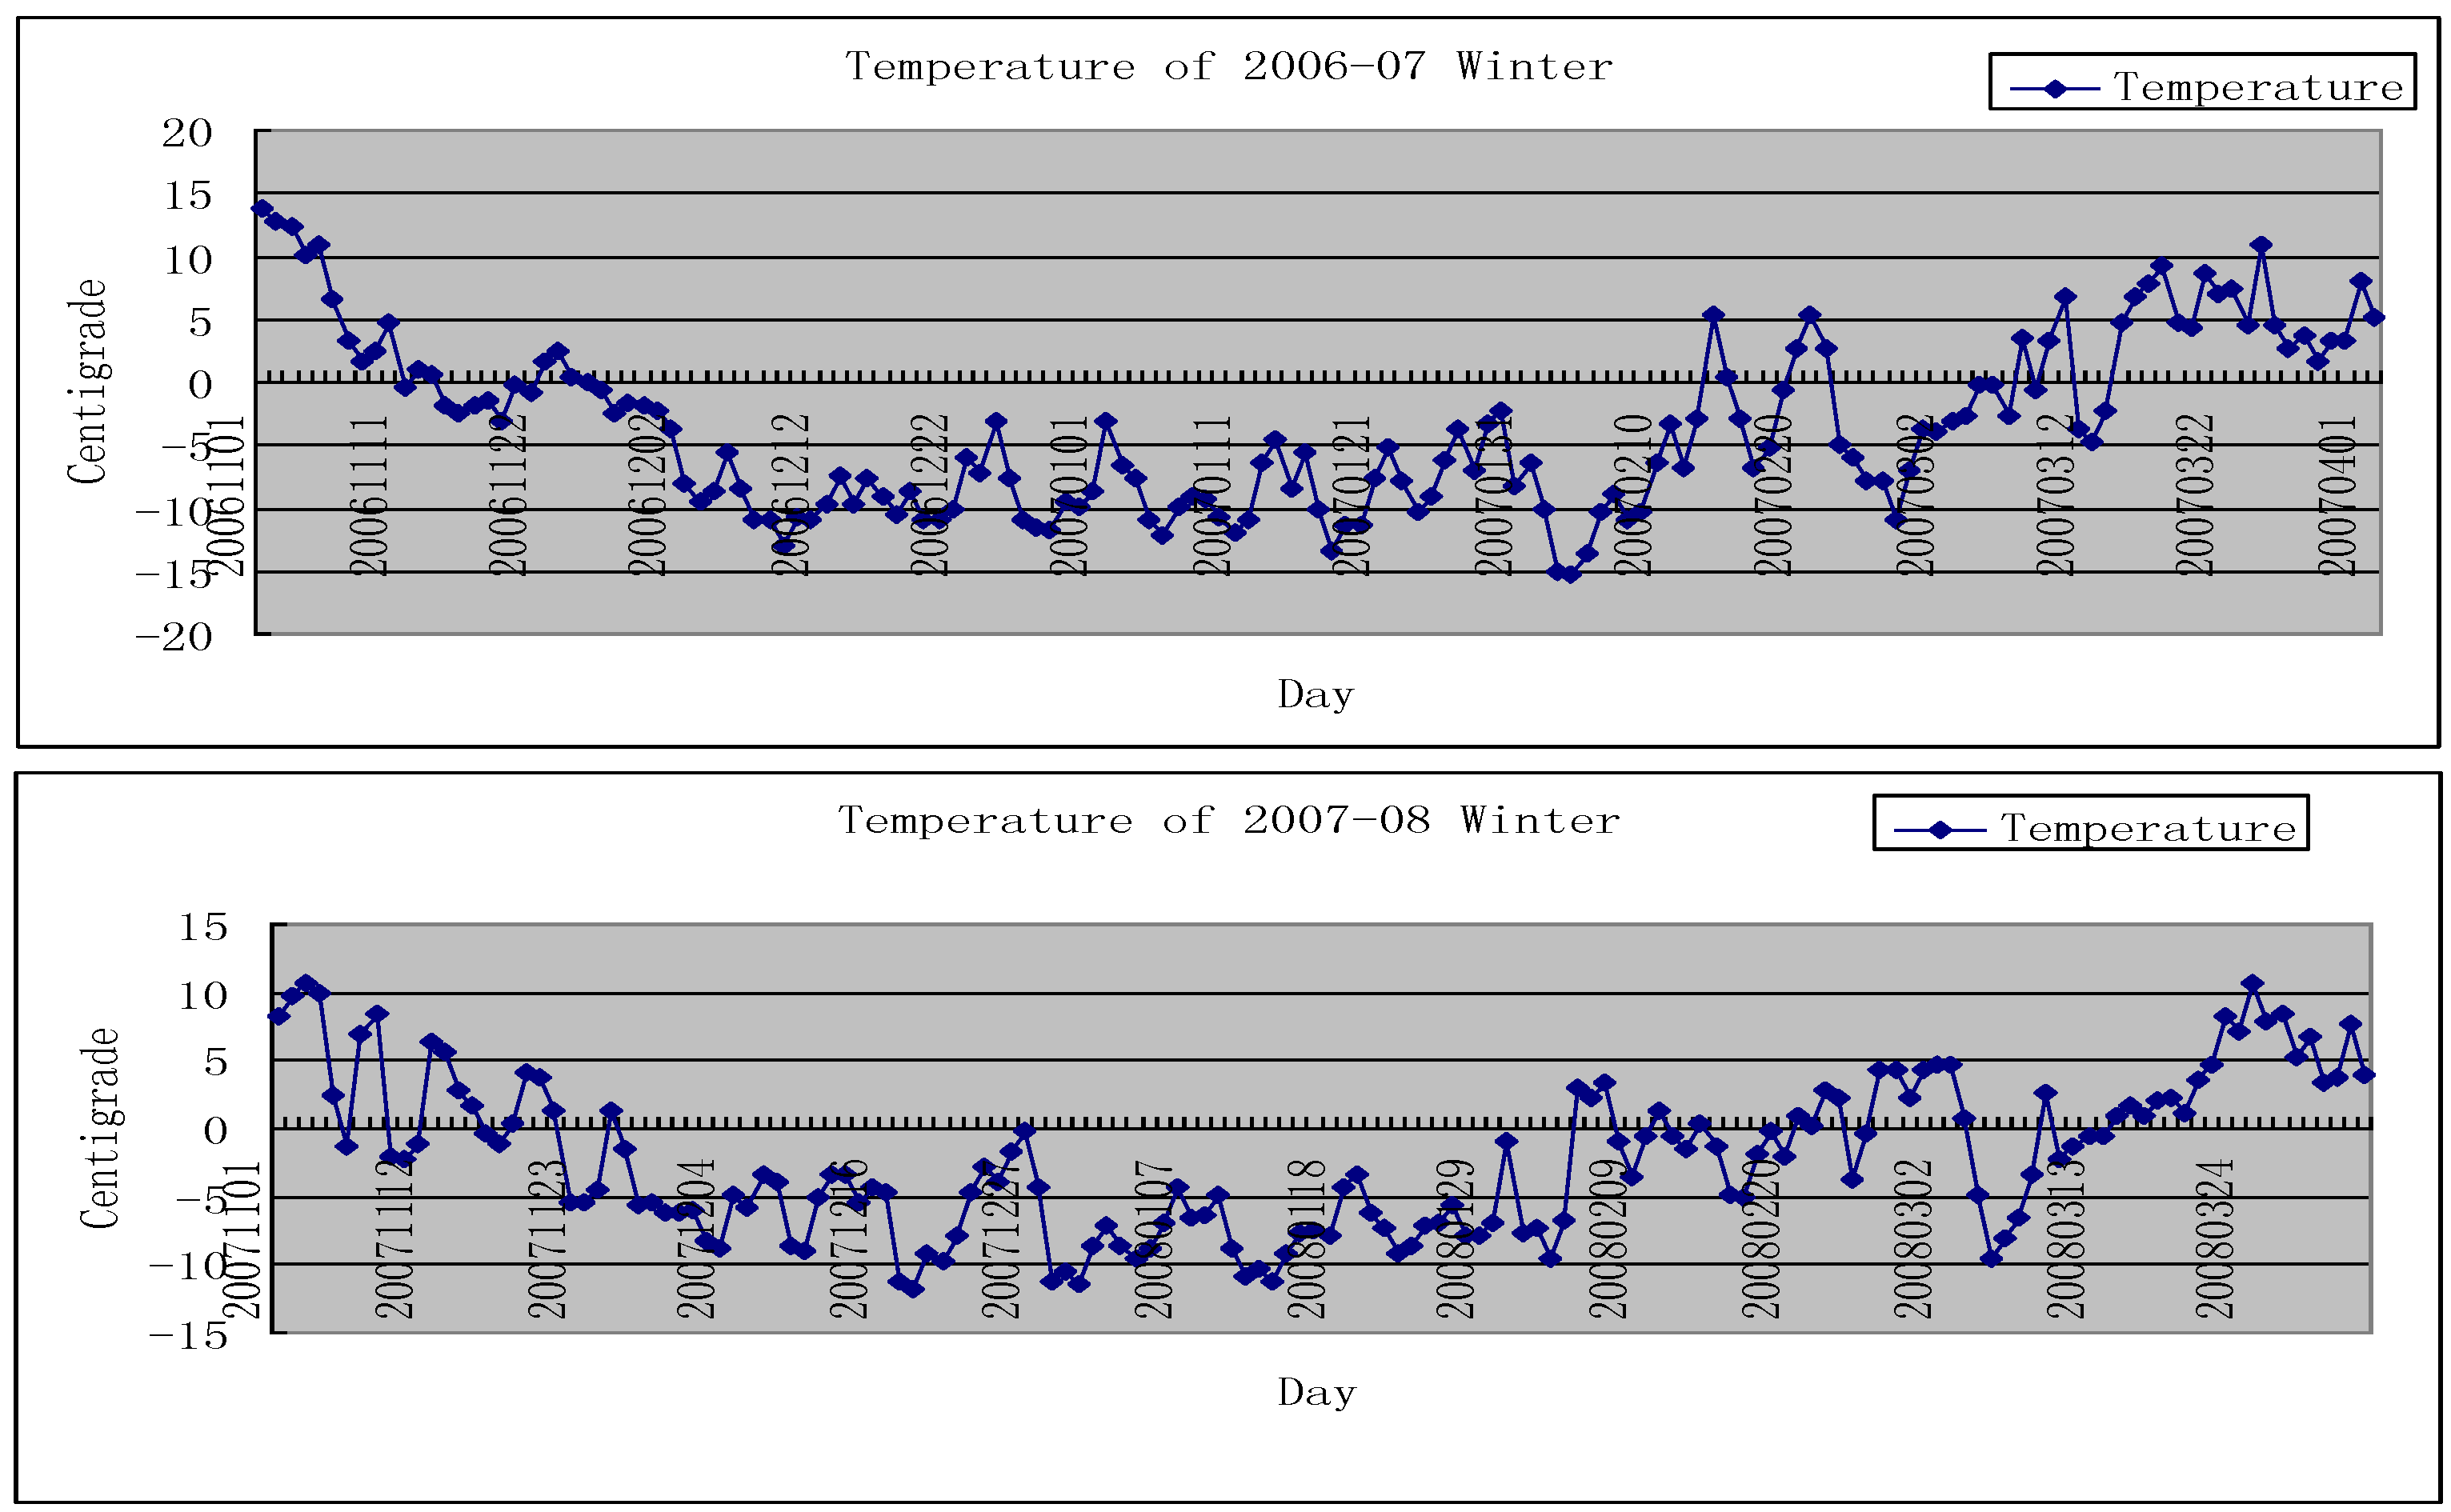
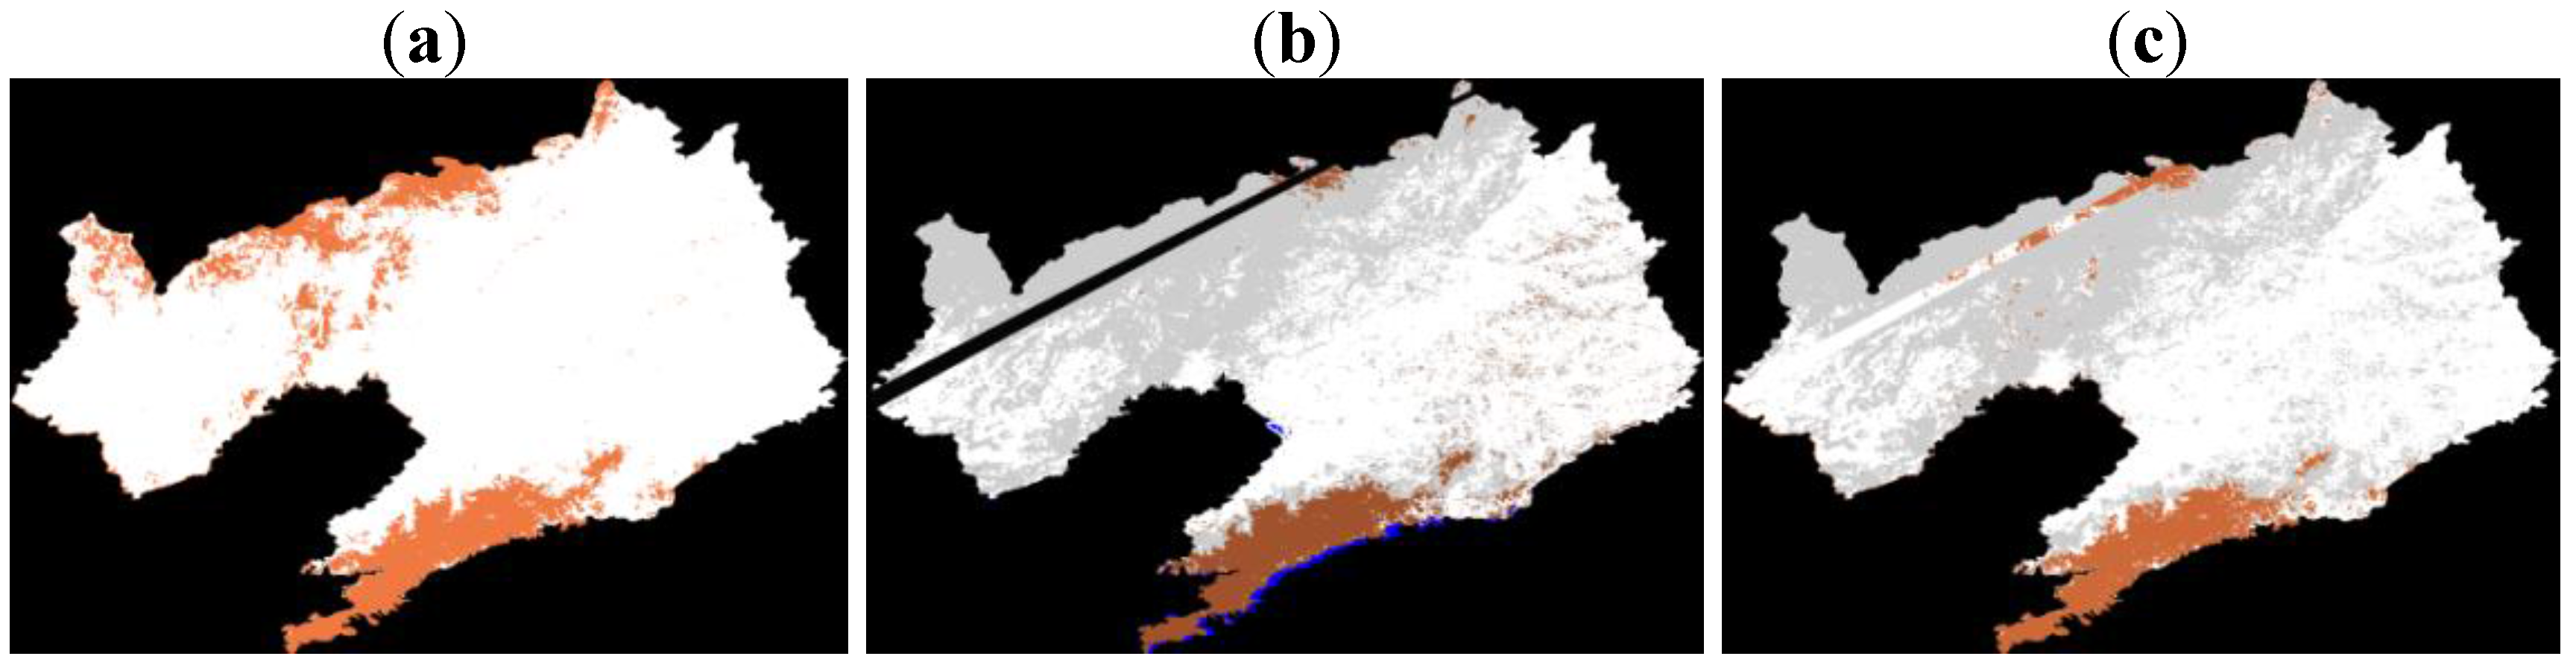
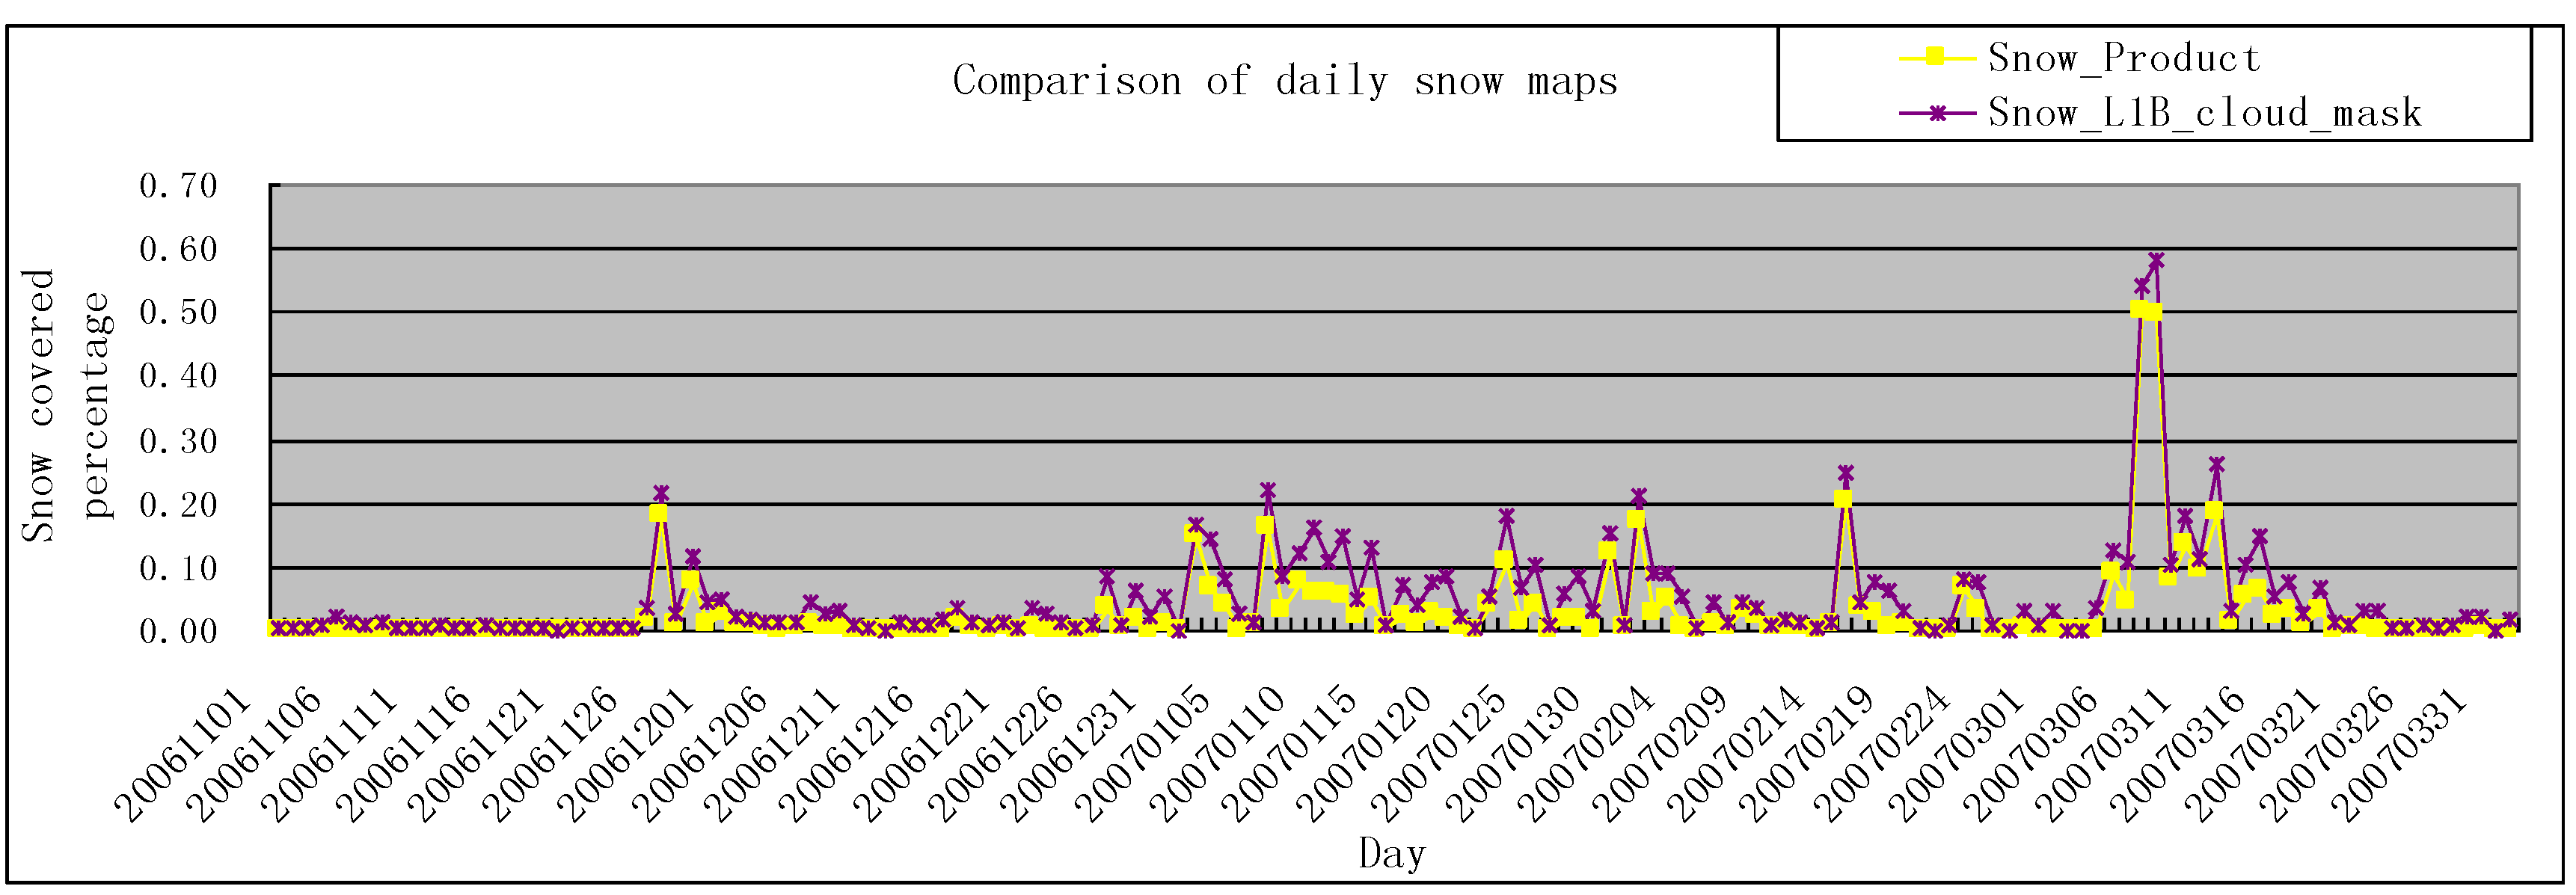
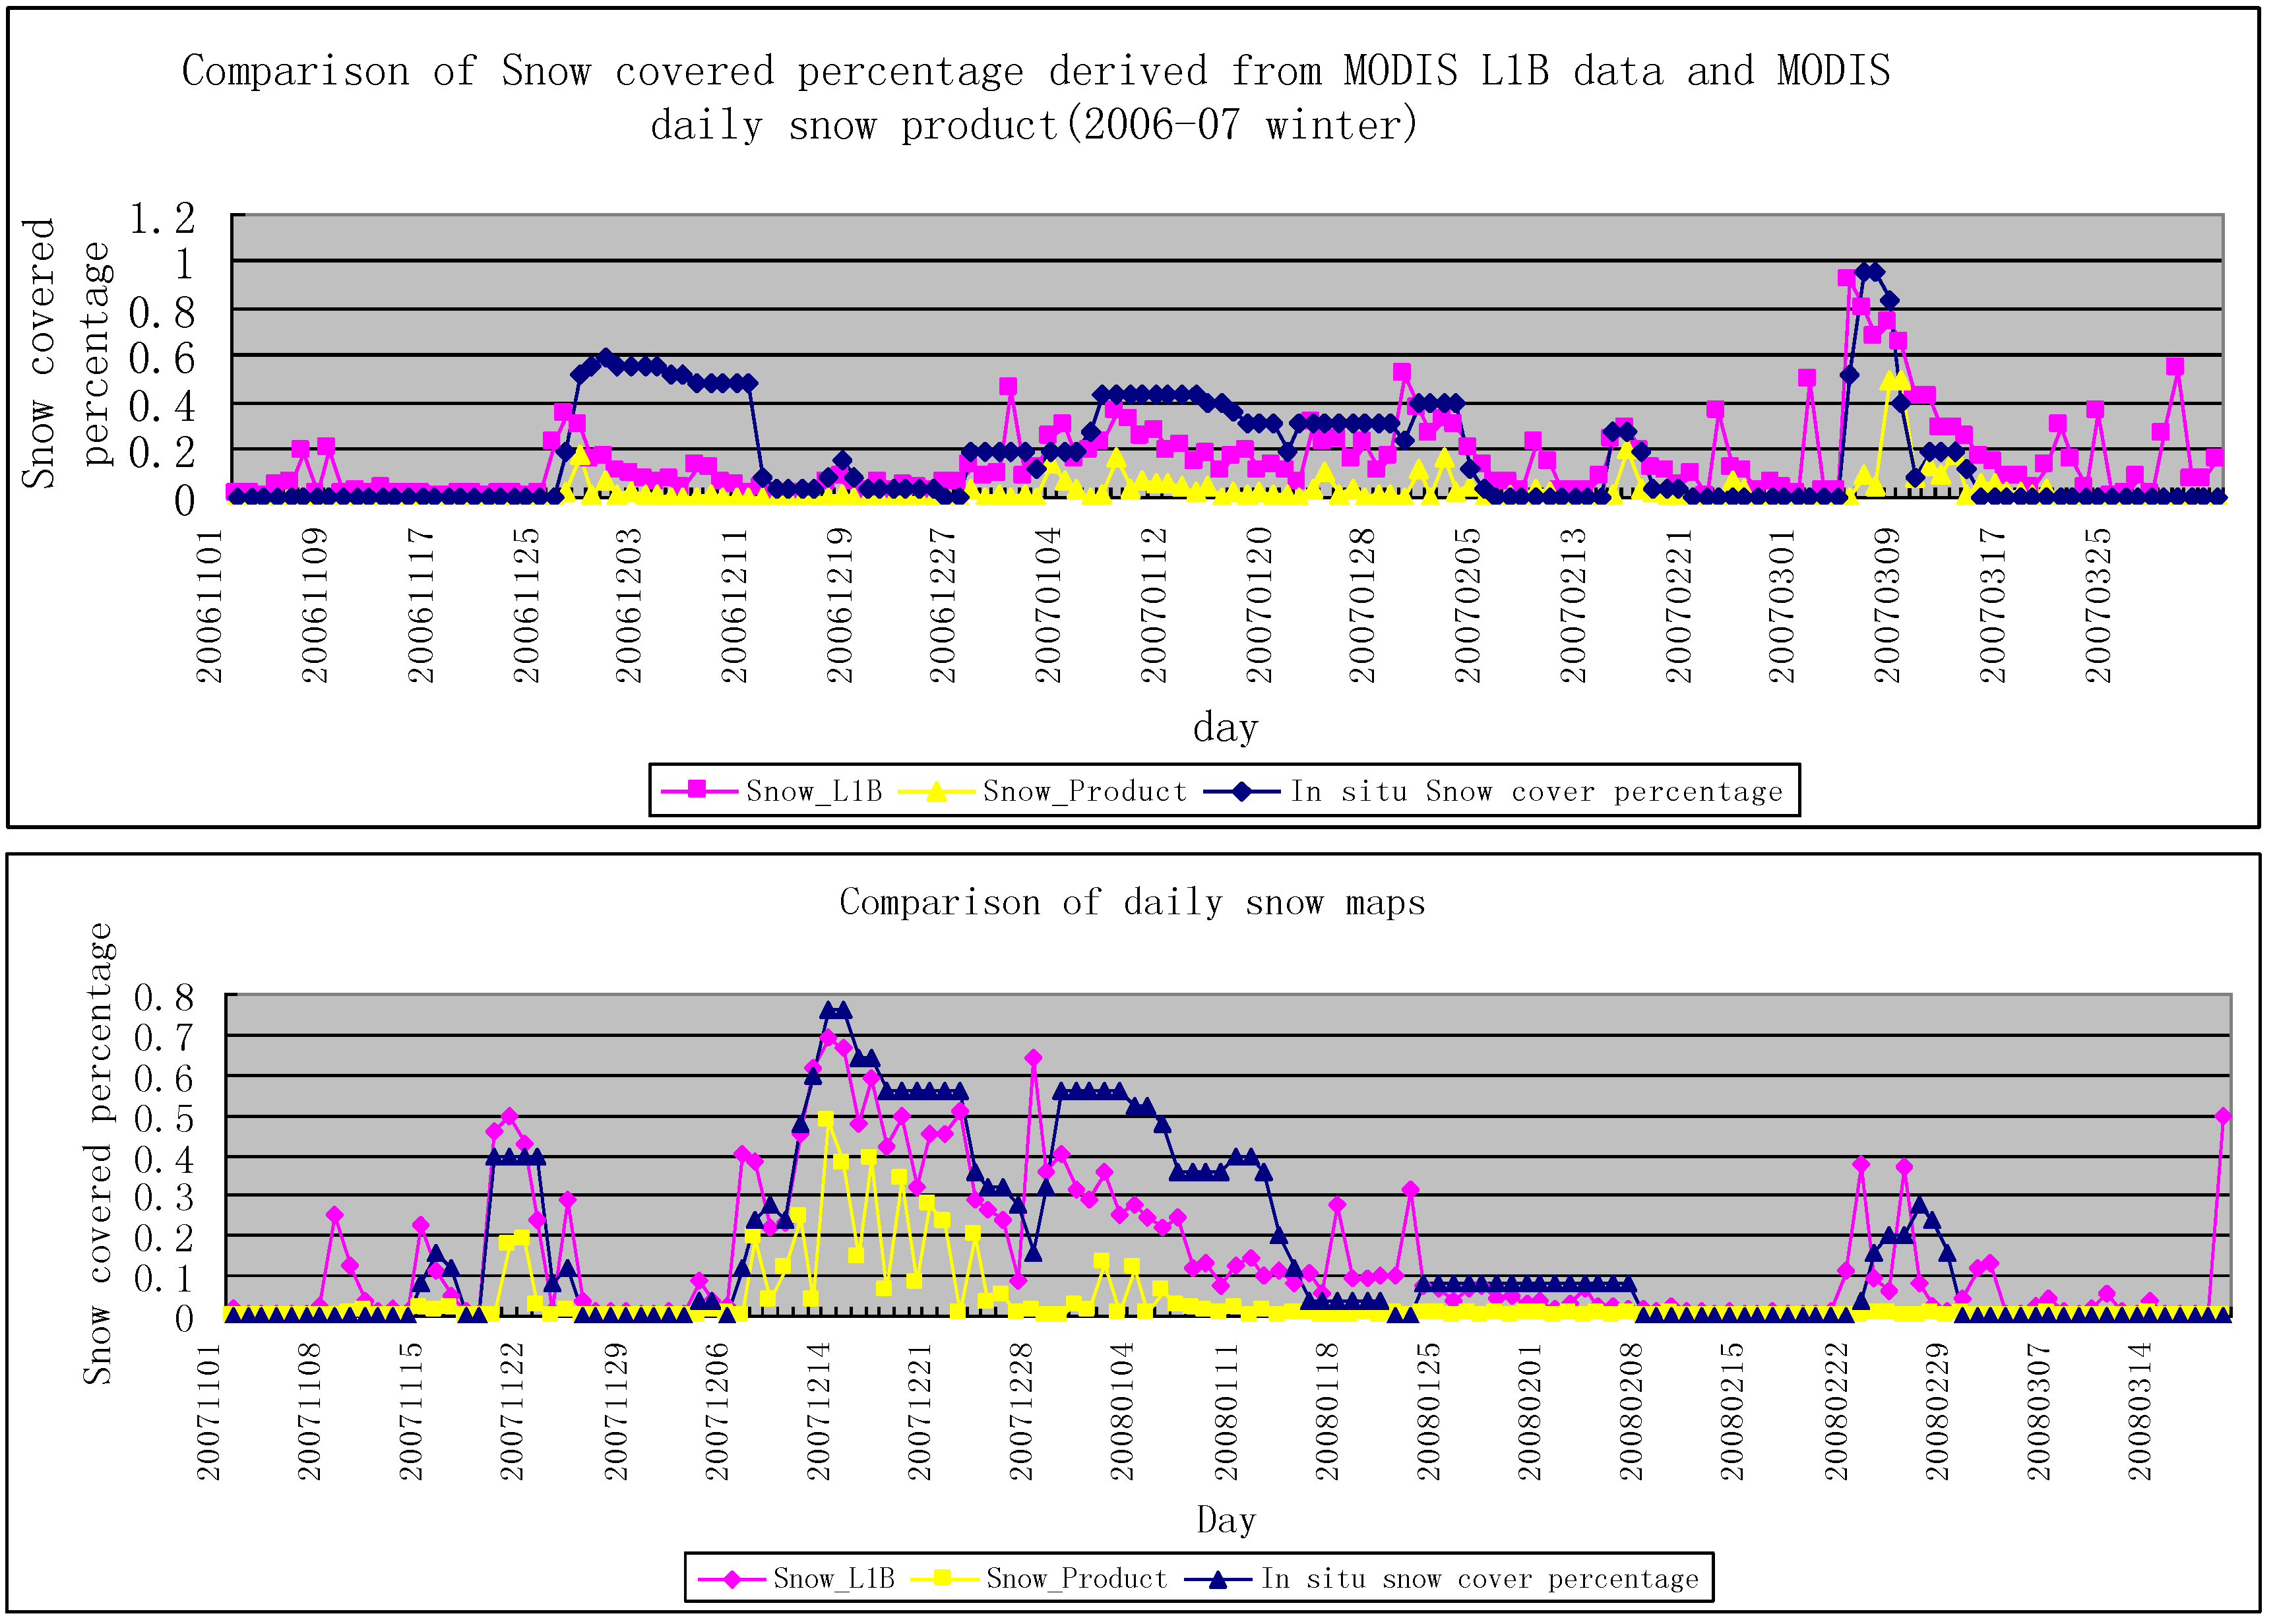
4.1. Daily Snow Mapping

In Liaoning Province, the first snowfall normally occurs in early November each year, and has melted away by early April of the following year. However, snow accumulation commences only when the ground temperature is lower than 0 °C for more than three days. According to the temperature records from Liaoning Province for the winters of 2006–2008 (Figure 6), the period of snow mapping extends from the 1st November to the 1st April of the next year.
Figure 6. Temperature records for 2006–2007 (upper) and 2007–2008 (lower) winters.
Remotesensing 02 00777 g006
Figure 6 shows the daily snow cover percentage derived from 25 in situ measurement stations for the winters of 2006–2007 and 2007–2008. Since the stations are scattered throughout Liaoning Province (Figure 2), the snow covered states of the 25 stations can be regarded as being representative of the whole of the Province.
From Figure 6, the statistical results of snow cover percentages can be derived from MODIS L1B data and MODIS Daily Snow Products (see Table 1). It is clear that the results from the MODIS L1B data are larger than those of the MODIS Snow Products during the winter of 2006–2007. Table 1 shows that the maximum snow covered percentage derived from MODIS L1B is 0.92, while the value is only 0.50 from MODIS Daily Snow Products.
Table 1. Statistical results of snow covered percentages during two winters.
Max. Percentage (2006–2007)Max. Percentage (2007–2008)
MODIS L1B0.920.70
MODIS Snow Products0.500.50
Similarly, in the winter of 2007–2008, the maximum snow covered percentage derived from MODIS L1B was about 0.70, while it was about 0.50 from MODIS Daily Snow Products.
The correlations between snow covered percentages from MODIS L1B data and MODIS Daily Snow Products in the two winters are 0.54 and 0.68, respectively. The main reason for these low correlations may be a result of the cloud cover. In fact, it is difficult to distinguish snow from cloud in many cases because they have very similar optical properties. Liaoning is located in Northeastern China, and half of the boundary runs along the coastline. In winter, a large amount of suspended matter is released from burning coal [26]. The suspended matter creates cloud condensation nuclei that produce an increase in cloud cover over the Province. This suggests that the effects of cloud cover on snow information have to be minimized or removed. Therefore, cloud masking of MODIS data was applied in this study to analyze the effects of cloud cover.
Figure 7 presents a comparison between the results before cloud masking (a), MODIS Daily Snow Product (b), and after cloud masking (c) on the 20th November 2006. In these images, a white color indicates the snow covered areas, grey indicates cloud covered areas, and brown indicates snow-free areas. It is clear that MODIS Daily Snow Product from MODIS L1B data and the snow cover map derived from MODIS Cloud Mask are very similar. This result probably indicates that cloud masking can remove the misleading effects of cloud on snow information, to greatly decrease the percentage of snow covered area derived from MODIS L1B data presented without cloud masking.
Figure 7. Comparison of daily snow maps before cloud masking (a), MODIS Daily Snow Product (b), and after cloud masking (c).
Remotesensing 02 00777 g007
Figure 8 shows the statistical results after cloud masking. The correlation after cloud masking improves to 0.97. This improved correlation clearly demonstrates that cloud cover adversely affects the mapping of daily snow covered areas.
In situ measurements were compared with snow mapping from MODIS data, which demonstrated that the estimated values of the results are closer to those of in situ measurements than to MODIS Snow Products (Figure 9). However, the estimated value of the study results is larger than those of the in situ data for a few days in the early winter or late winter (i.e., early spring), when the temperature is usually above 0 °C.
Figure 8. Comparison of daily snow maps of MODIS Snow Product and snow cover derived from cloud masked MODIS L1B.
Remotesensing 02 00777 g008
Figure 9. Comparison of snow covered percentage derived from in situ measurement, the study model, and MODIS Daily Snow Product.
Remotesensing 02 00777 g009

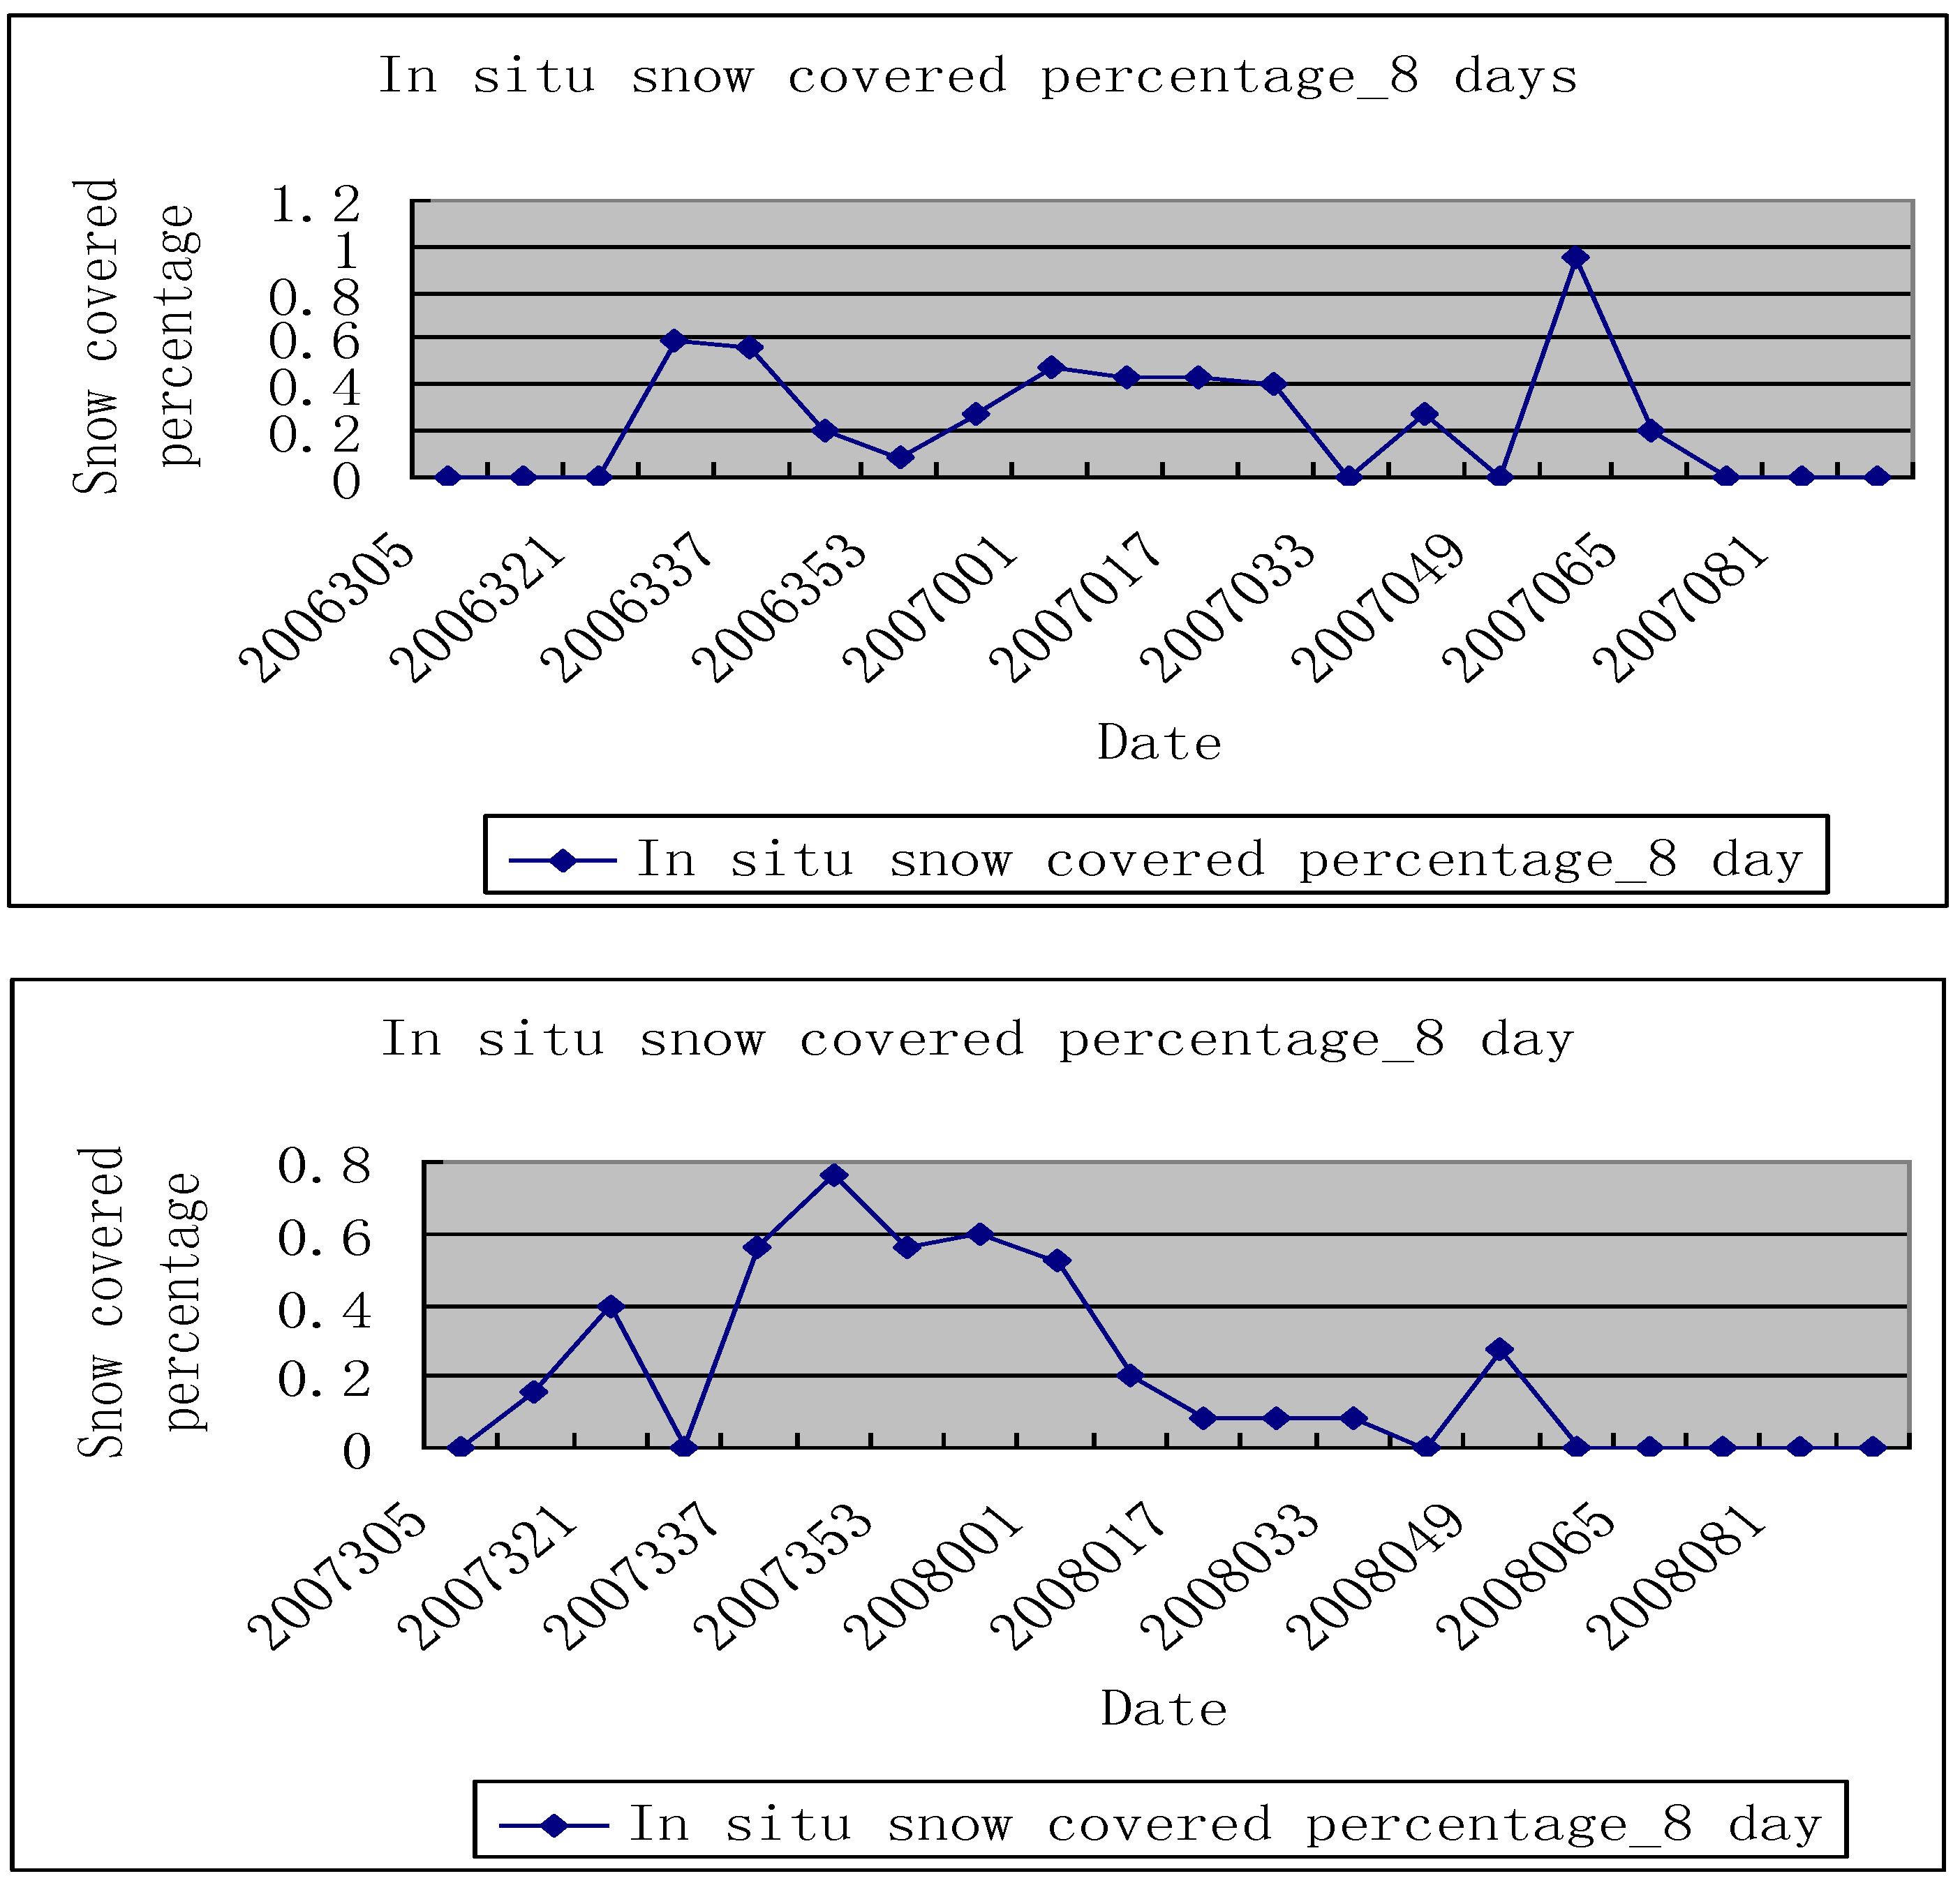
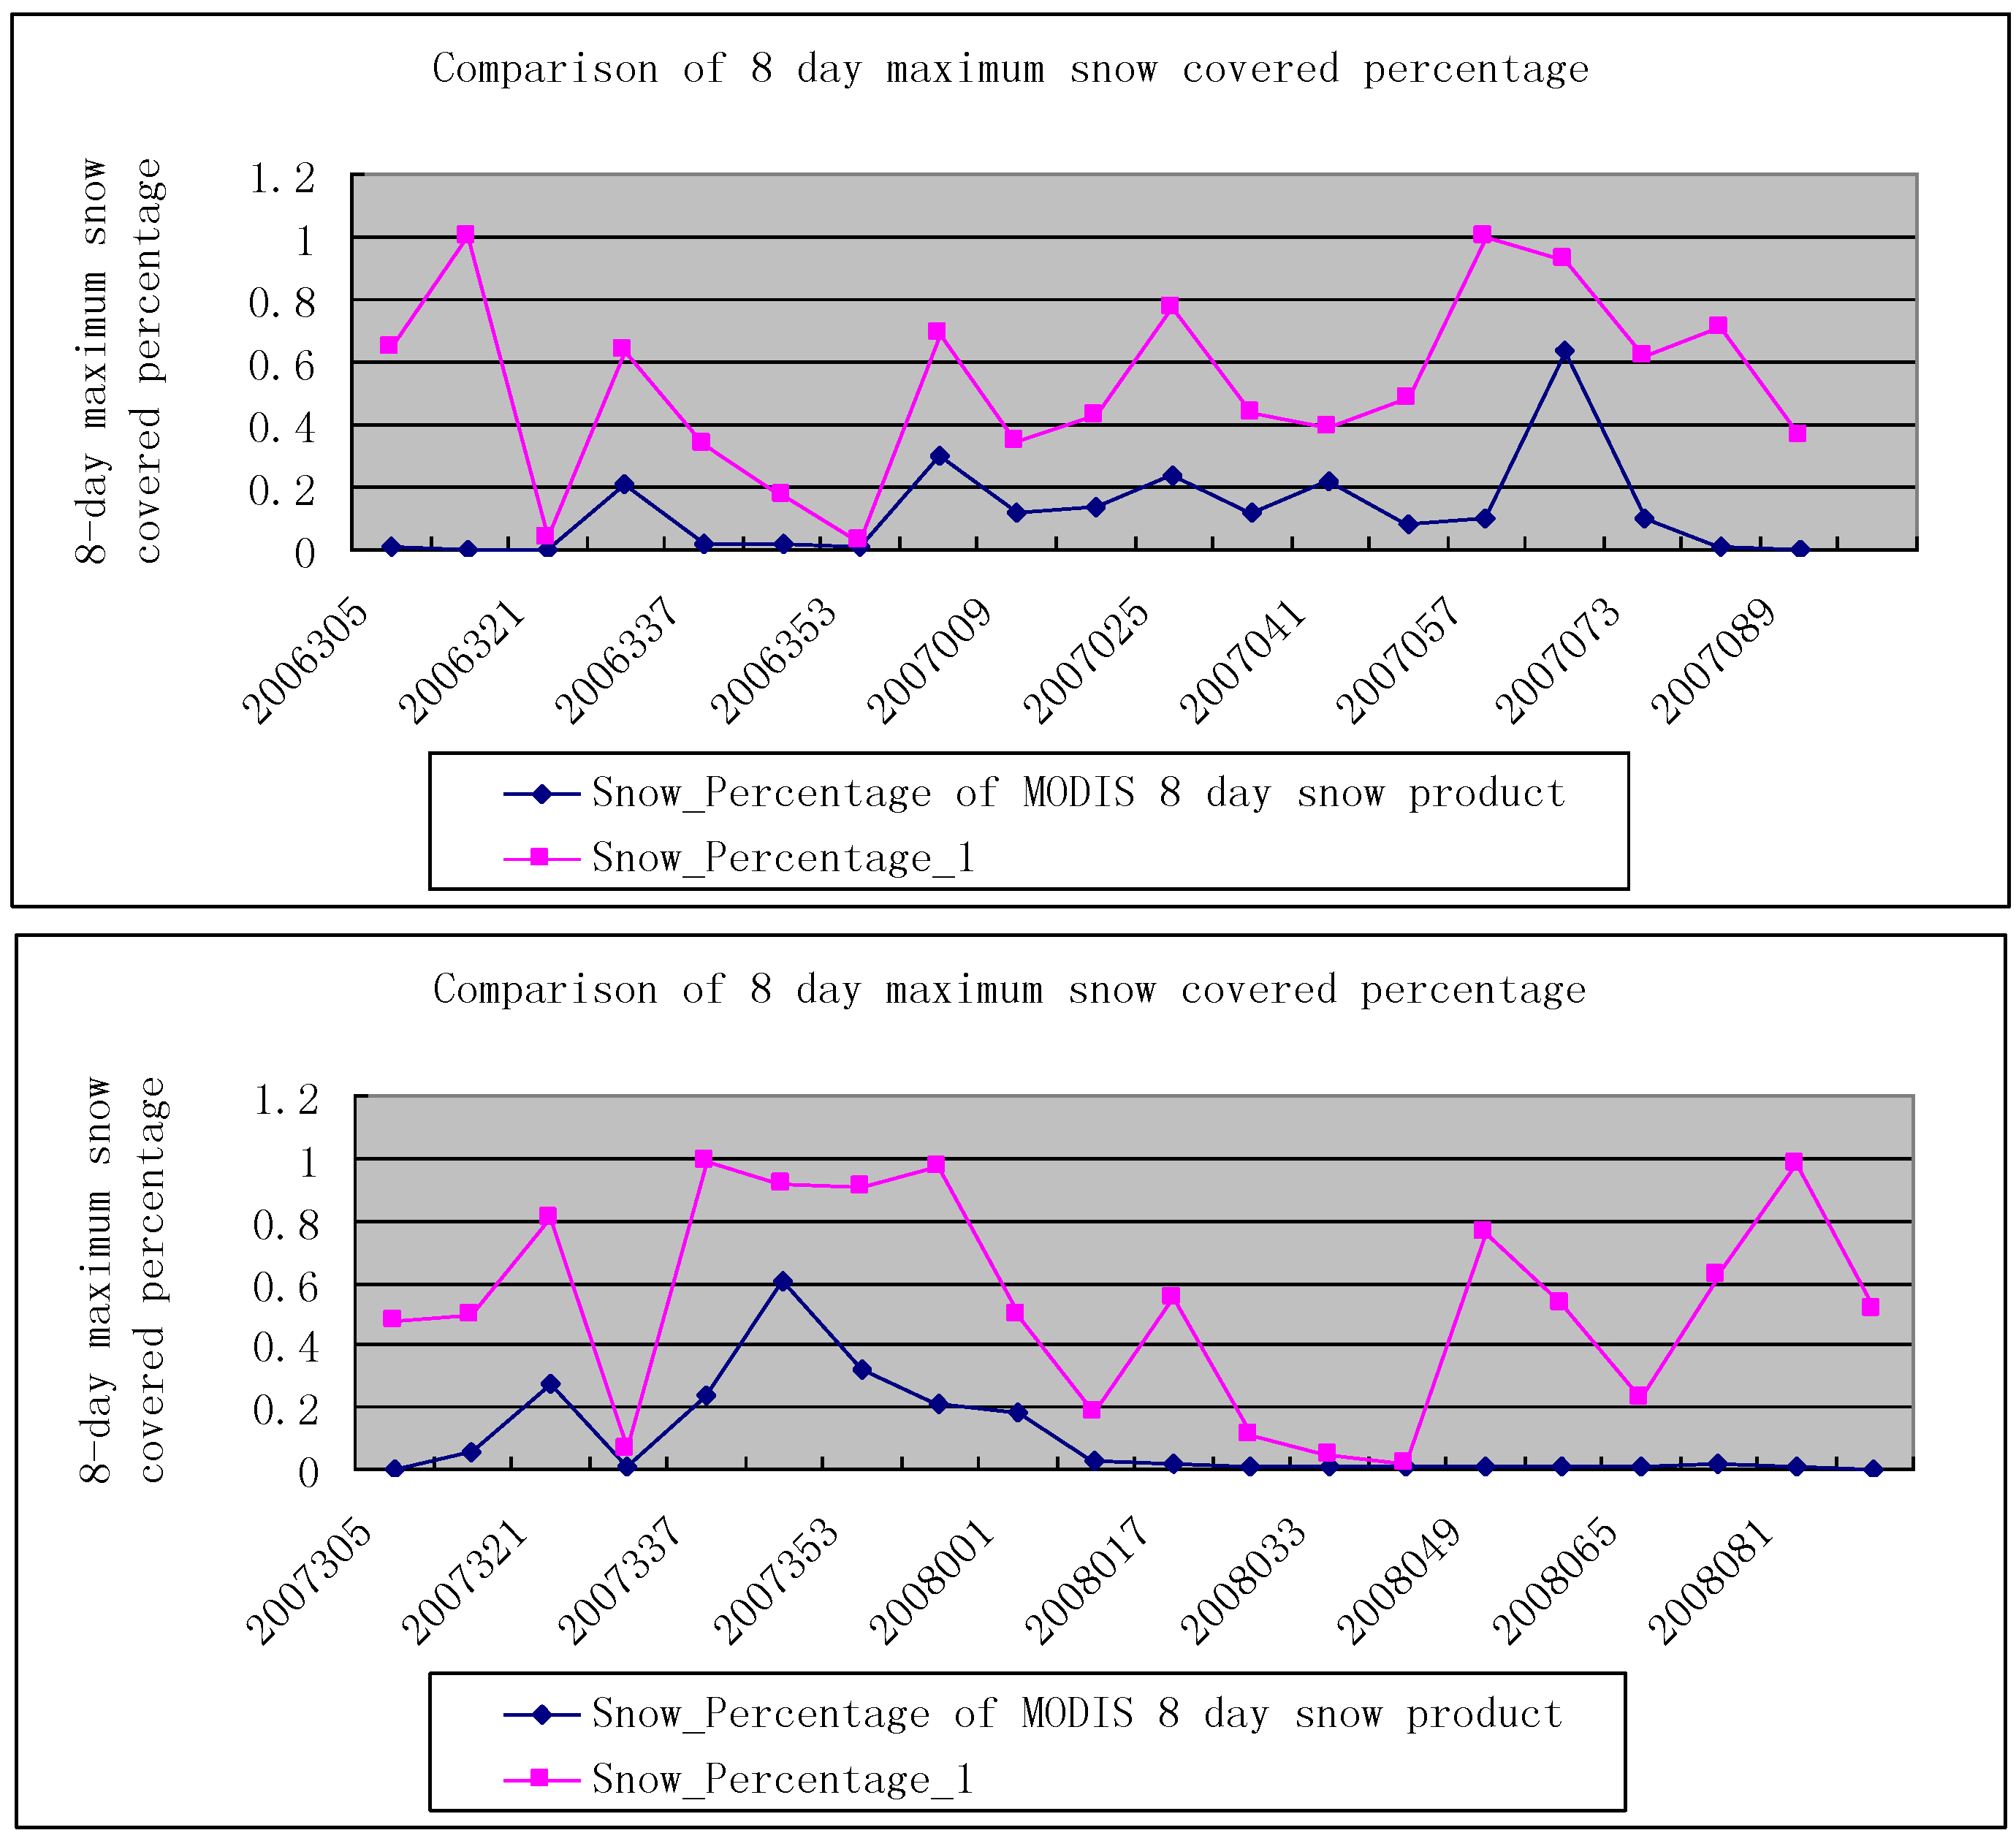
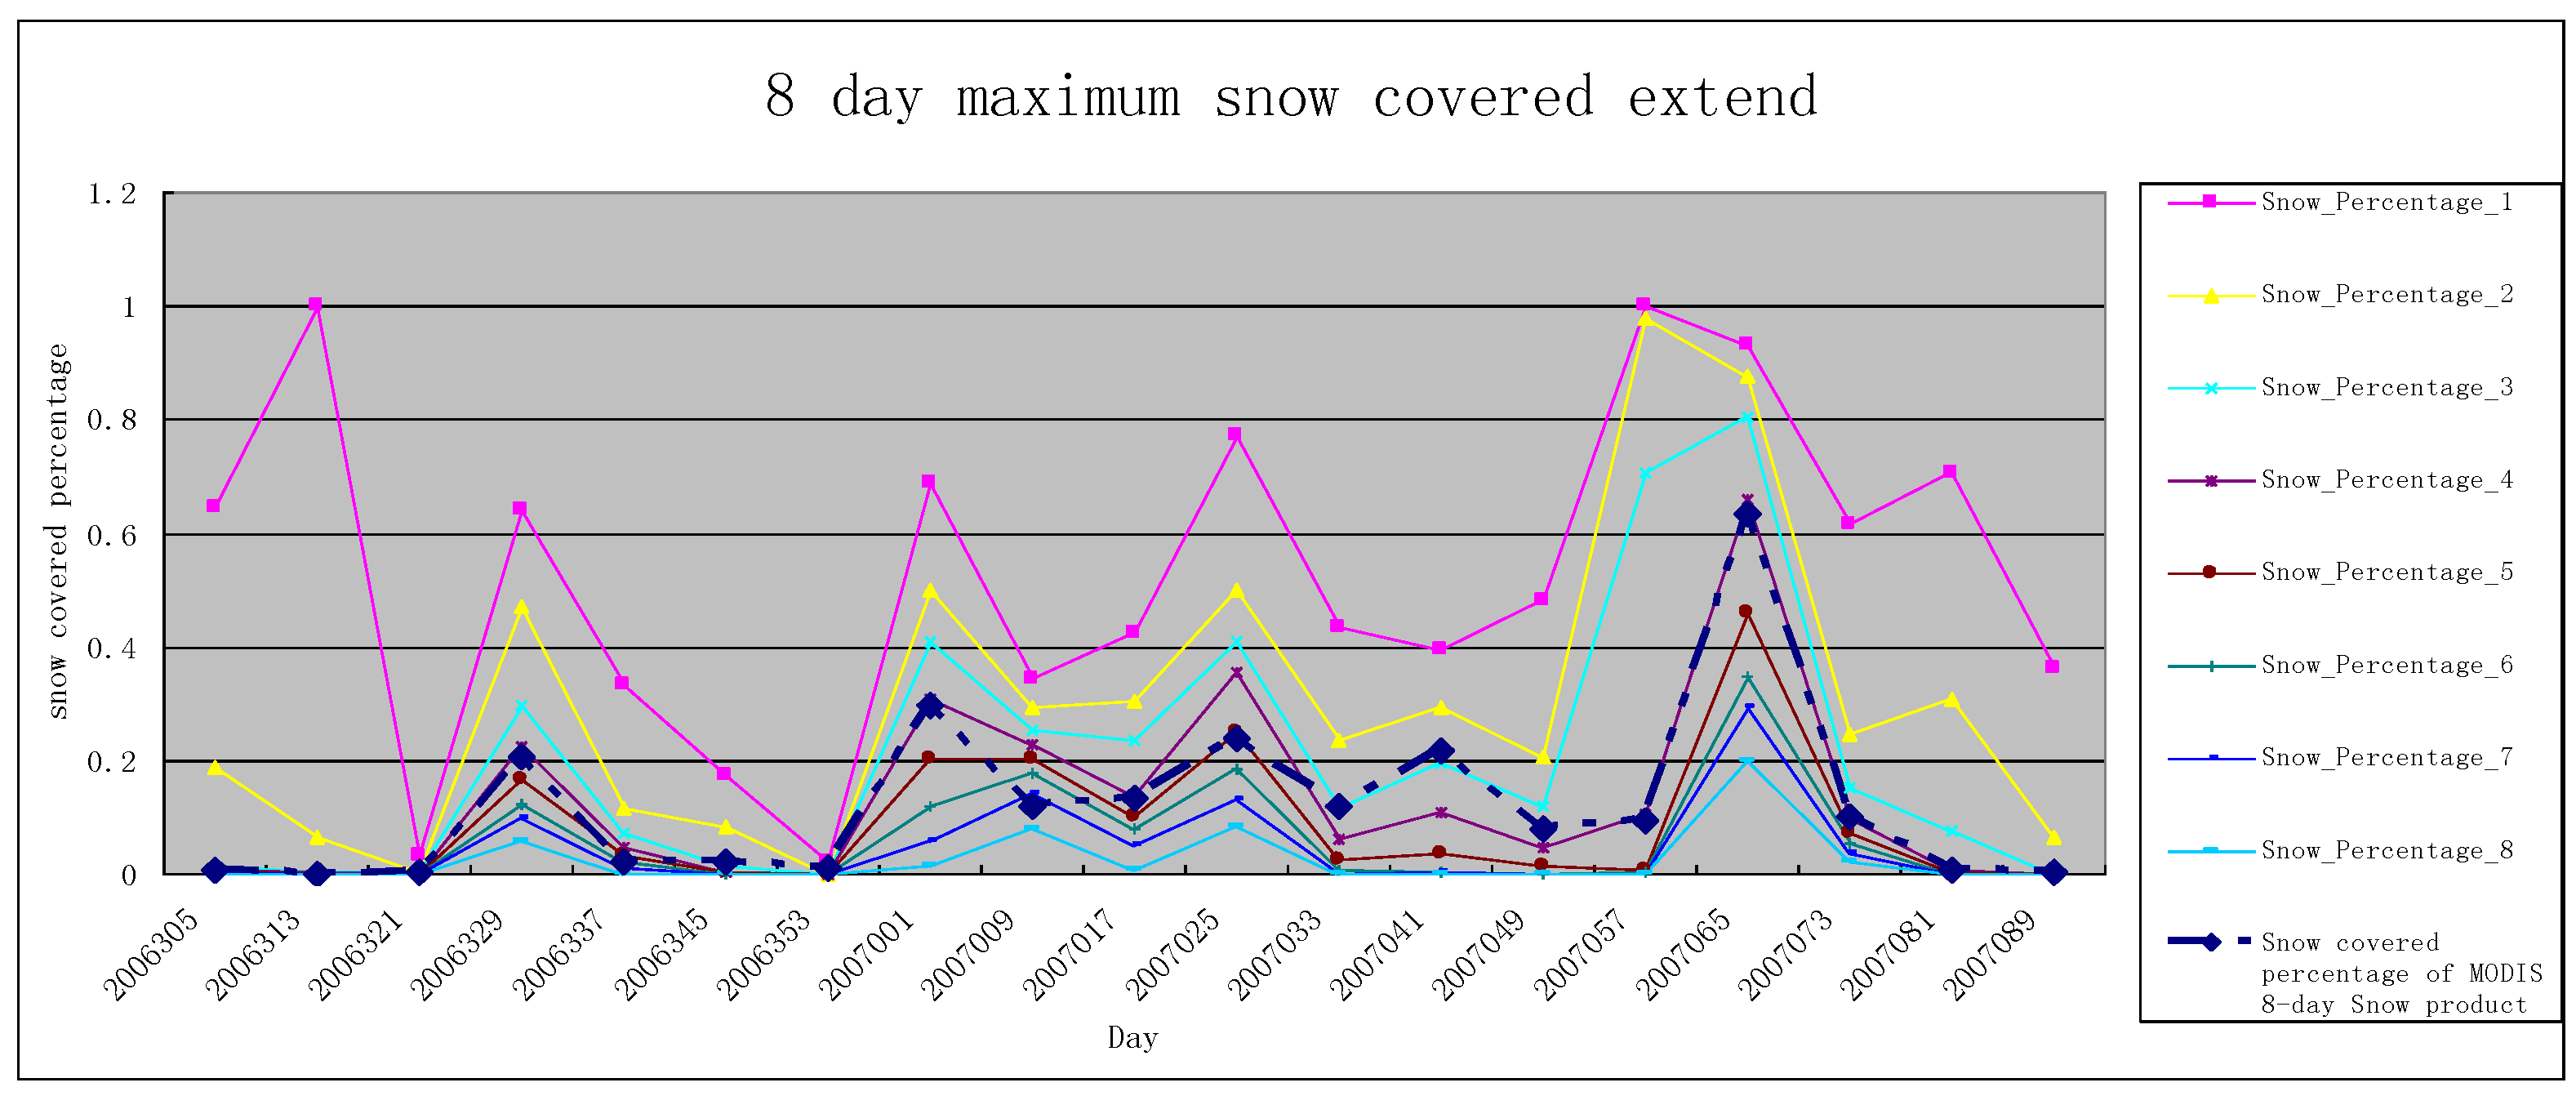
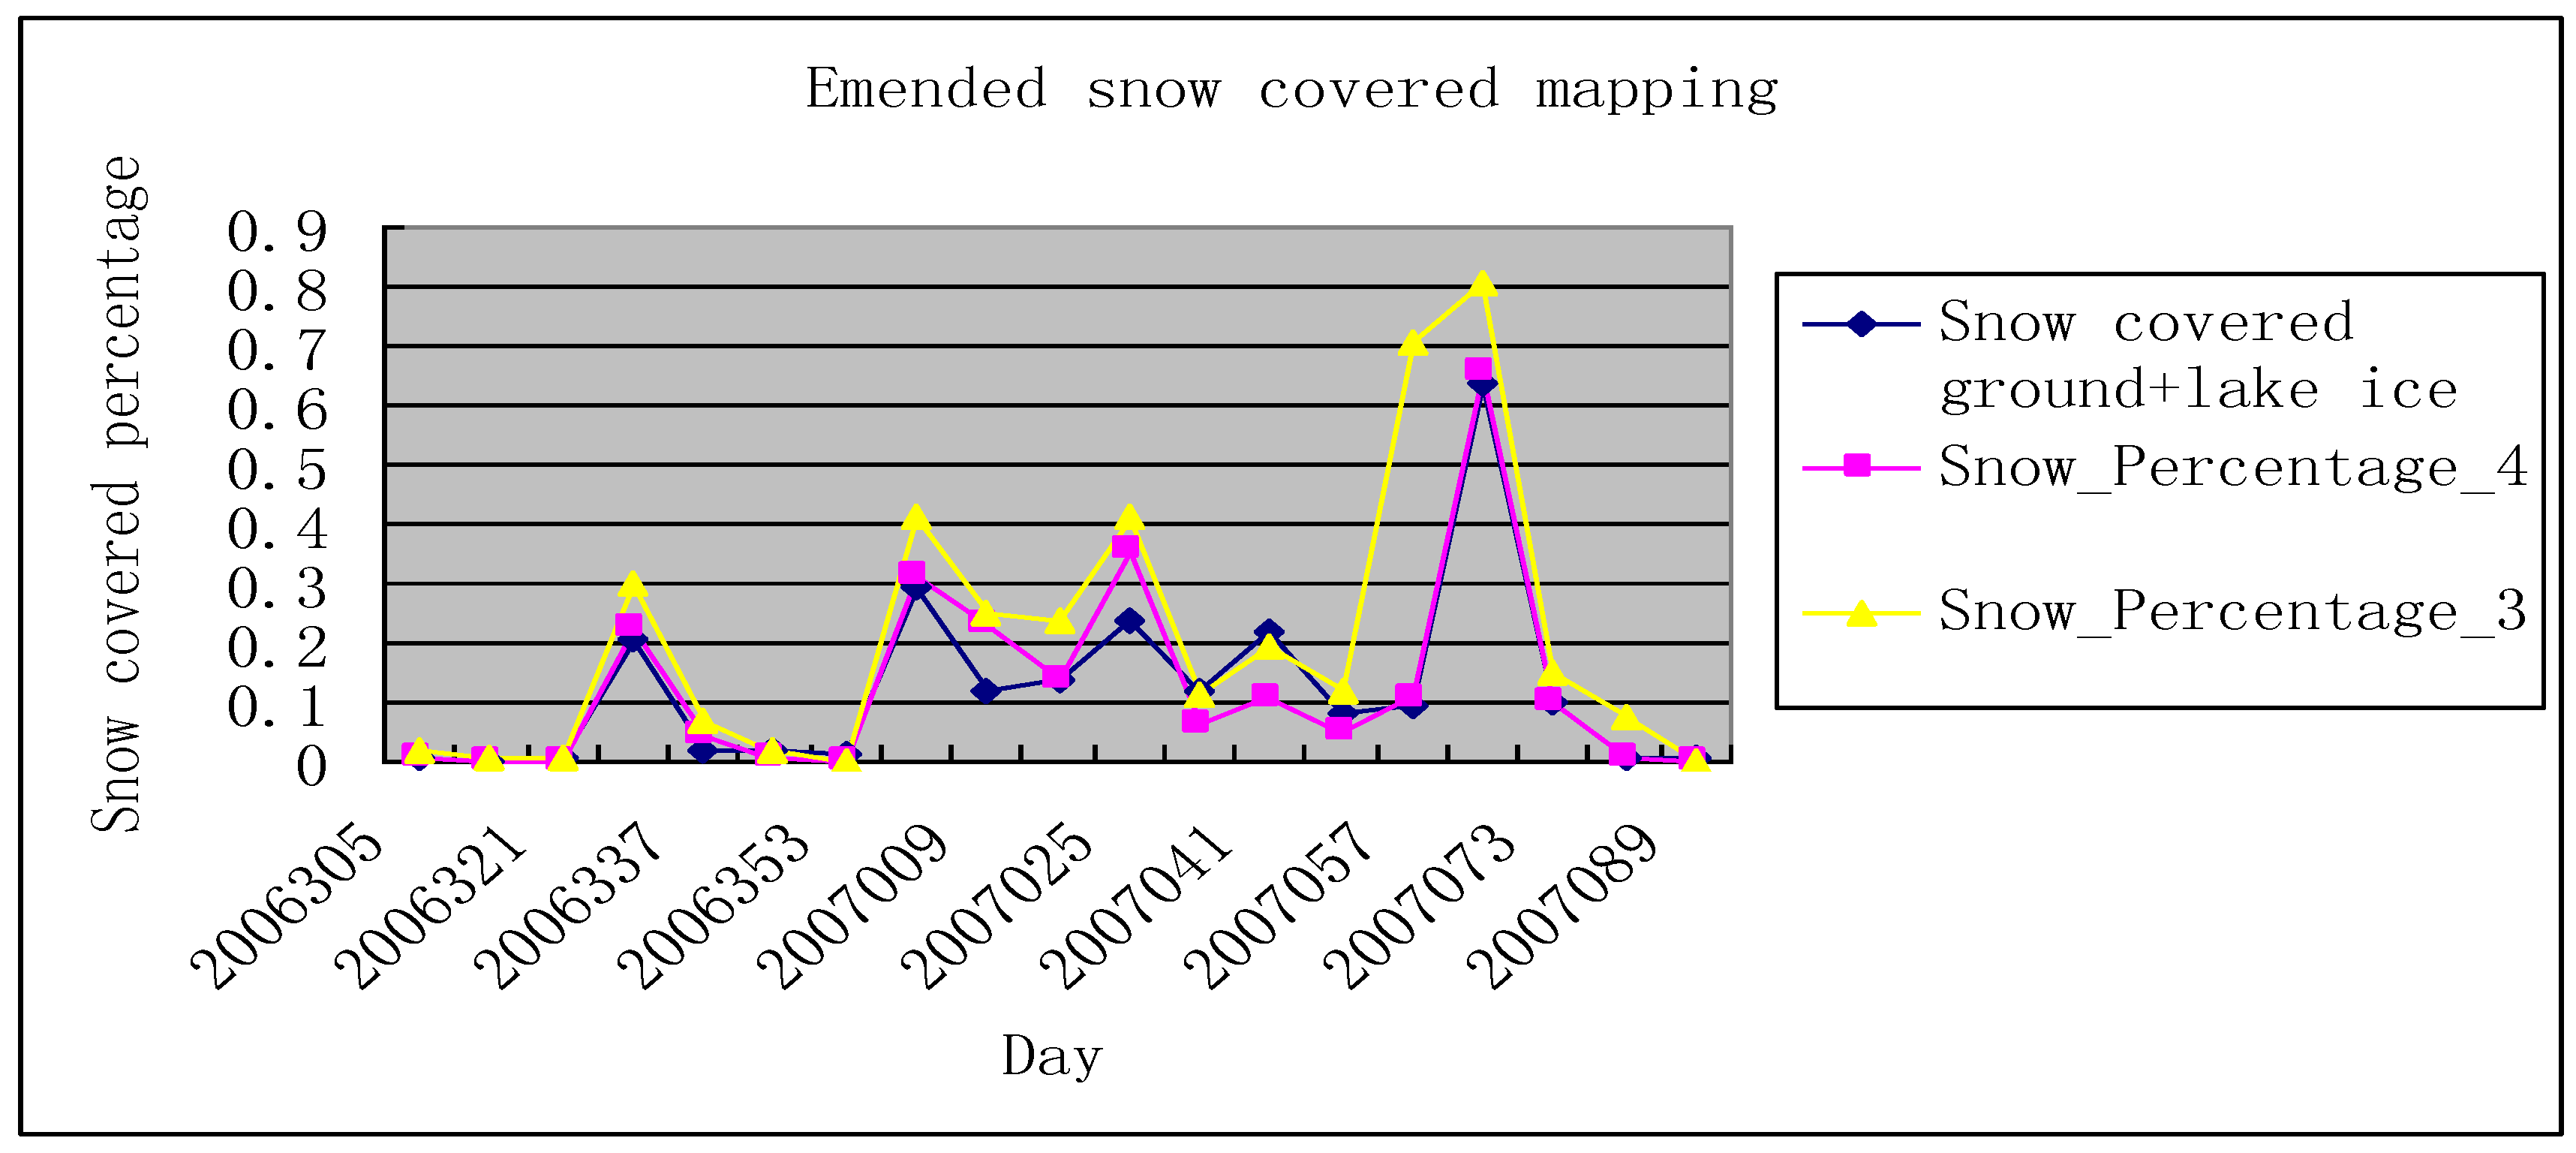
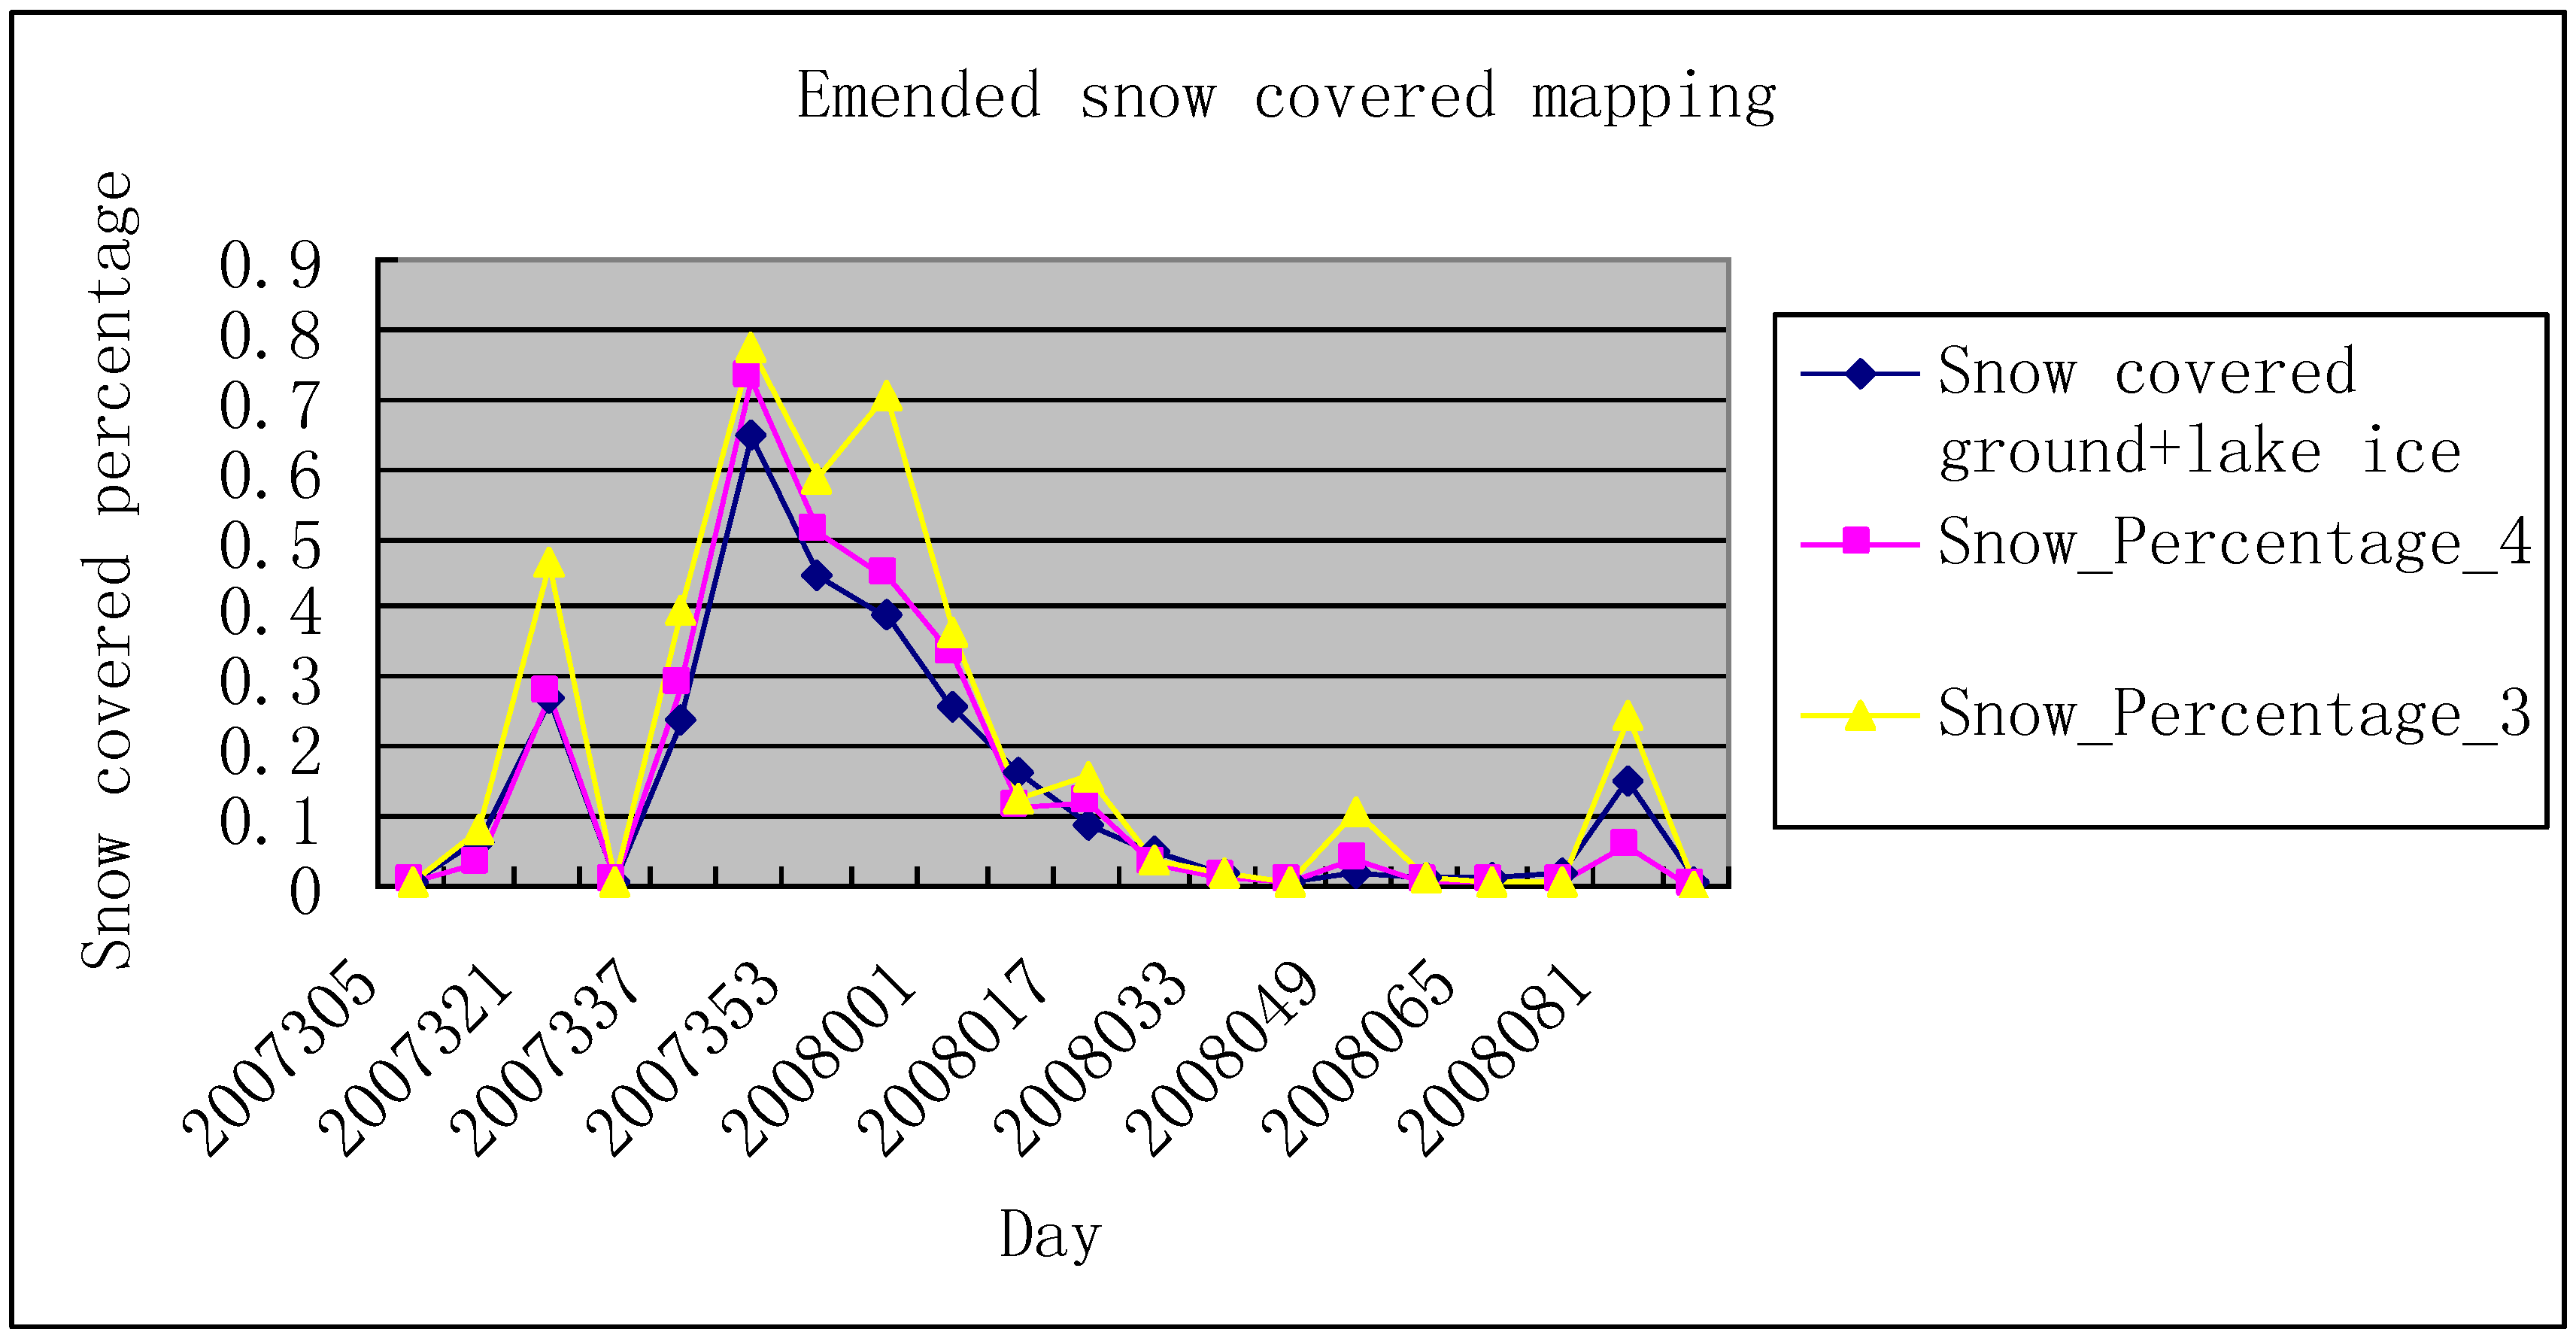
4.2. 8-Day Snow Cover Mapping

As shown in Figure 9, in situ snow covered maps were generated using a combination of in situ SWE measurements and temperature data. The value of each pixel in the mosaic image was assigned using the rules outlined in Table 2. Figure 10 shows the snow cover percentage for the maximum snow cover extent over eight successive days in the study area.
Table 2. Interpretation key for 8-day snow cover mapping derived from in situ measurements.
ValueMeaning
≥ 1Snow-covered area
0Non snow-covered area
−1Frozen ground or ice ground
−2Melting
≤−3Missing data
Figure 10. 8-day maximum snow cover extent for the 2006–2007 (upper) and 2007–2008 (lower) winters.
Remotesensing 02 00777 g010
The adverse effects of cloud cover and temperature on optical remote sensing images are inevitable. To reduce these effects, 8-day maximum snow extent maps were generated during the study. Eight images over eight successive days were mosaiced together. The value of each pixel of the mosaic image was assigned one of nine numbers (Table 3).
Pixel values from 1 to 8 indicate the SCA information. The assigned value corresponds to the superposition of the snow cover days. If one pixel is marked as SCA during the whole 8-day period, the value of the pixel is 8. Otherwise, if only four days in the 8-day period have a snow cover, the pixel is marked as SCA, and the pixel value is 4. Figure 11 shows the estimated results of the snow covered percentage during the 2006-2007 winter. The snow covered percentage is up to 0.9997 and 1, respectively, at the points 2006313 (e.g., the period of 8-days from the 313th day to the 321st day in 2006) and 2007057 (e.g., the period of 8-days from the 57th day to the 65th day of 2007).
Table 3. Interpretation key for 8-day snow cover mapping derived from MODIS L1B.
ValueMeaning
1–8Snow-covered area
0No Snow-cover
−2Cloud-obscured
1Outside Liaoning Province
Figure 11. 8-day maximum snow cover extent mapping for (a) 2006–2007 and (b) 2007–2008.
Remotesensing 02 00777 g011
Figure 12 indicates that most SCA percentages estimated from MODIS L1B data are much higher than those of the MODIS 8-day Snow Products. This difference is probably the result of cloud cover. Because clouds and snow are very similar in their optical properties, SCA mapping from NDSI is always combined with cloud. That is, a value of 1 would most probably be cloud cover. In addition, a pixel will be considered as a snow covered area only when it is recorded as being snow covered the day before and the day after the assessment day. Thus, during the 8-day period, the threshold of snow cover is defined as 3.
Figure 12. Comparison of the 8-day maximum snow covered percentage, for the 2006–2007 (upper) and 2007–2008 (lower) winters.
Remotesensing 02 00777 g012
On the other hand, in MODIS 8-day Snow Products, snow covered lake ice is not recorded as a snow covered surface. Optical remote sensing signals do not have the ability to penetrate any medium. Consequently, whether the covered ground surface is lake ice or bare soil, the reflectance value will be the same if the snow depth is sufficiently thick.
Figure 13, Figure 14 and Figure 15 show that the amended statistical results based on the above analyses are very close to the MODIS 8-day Snow Products. The correlations between snow cover mapping derived from MODIS L1B data and MODIS 8-day Snow Products over the two winters of 2006–2007 and 2007–2008 are 0.81 and 0.97, respectively, if the threshold value of snow cover is defined as 3. However, if the threshold was raised to 4, the correlations would rise to 0.96 and 0.99, respectively.
Figure 13. Statistical results of 8-day maximum snow covered extent.
Remotesensing 02 00777 g013
Figure 14. Emended snow covered mapping of 2006–2007 winter.
Remotesensing 02 00777 g014
Figure 15. Emended snow covered mapping of 2007–2008 winter.
Remotesensing 02 00777 g015
To obtain an estimate of the accuracy of the study model compared to the MODIS Snow Products, the error numbers of the test stations were calculated. The results show that on only two dates (2007057 and 2008025), the numbers of erroneous stations in the study model were larger than those of MODIS Snow Products. In most other cases (95%), the results of the study models are more accurate than MODIS Snow Products (Figure 16).
Figure 16. Numbers of error-judgment stations of the study model compared to MODIS Snow Products., for the 2006–2007 (upper) and 2007–2008 (lower) winters.
Remotesensing 02 00777 g016

5. Conclusion

This paper presents the results of snow cover monitoring in Liaoning Province, northeastern China using MODIS data. In northeastern China, snow cover plays an important role in both water supply and soil moisture in the early spring. In addition, heavy snow may trigger natural hazards such as flooding or crop failure. These impacts are crucial to human activities in the middle-latitude areas such as Liaoning Province. Thus, SCA monitoring is an important current topic in studies of global climate change Satellite remote sensing is a unique tool that can provide rapid and accurate information about the snow cover over large areas.
In the study, MODIS L1B data, MODIS Daily Snow Products (MOD10A1) and MODIS 8-day Snow Products (MOD10A2) were used in the SCA monitoring of Liaoning Province during the winters of November–April, 2006–2008. Cloud masking and forest masking were used to determine the effects of clouds and forest cover on the snow monitoring techniques. The results demonstrate that the SCA percentage obtained from MODIS L1B data is relatively consistent, although slightly higher than that of MODIS Snow Products. In situ data from 25 snow stations were used to compare the accuracy of the SCA results obtained during the study with MODIS Snow Products. The comparisons confirmed that the SCA results were more representative than MODIS Snow Products in Liaoning Province. However, it is recommended that long-term monitoring of the snow cover in Liaoning Province is continued to further develop, particularly to improve the accuracy of, the technique.

Acknowledgements

This research was supported by a Direct Grant (Project code: 2020970) from the Chinese University of Hong Kong. The authors would like to thank NASA for access to MODIS data. Thanks are also due to the three reviewers who made helpful comments during the preparation of this paper.

References

  1. Matson, M.; Ropelewski, C.F.; Varnardore, M.S. An Atlas of Satellite-Derived Northern Hemisphere Snow Cover Frequency; NOAA Atlas, US Department of Commerce: Washington, DC, USA, 1986. [Google Scholar]
  2. Rees, W.G. Remote Sensing of Snow and Ice; CRC Press, Taylor & Francis Group: Boca Rotan, FL, USA, 2006; pp. 99–117. [Google Scholar]
  3. Jin, Z.H.; Charlock, T.P.; Yang, P.; Xie, Y.; Miller, W. Snow optical properties for different particle shapes with application to snow grain size retrieval and MODIS/CERES radiance comparison over Antarctica. Remote Sens. Environ. 2008, 112, 3563–3581. [Google Scholar] [CrossRef]
  4. Rott, H.; Mätzler, C. Preface to microwave observations of snowpack and soil properties. Adv. Space Res. 1989, 9, 231–232. [Google Scholar] [CrossRef]
  5. Kurvonen, L.; Hallikainen, M. Influence of land-cover category on brightness temperature of snow. IEEE Trans. Geosci. Remote Sens. 1997, GE35, 367–377. [Google Scholar] [CrossRef]
  6. Hall, D.K.; Kelly, R.E.J.; Riggs, G.A.; Chang, A.T.C.; Foster, J.L. Assessment of the relative accuracy of hemispheric-scale snow-cover maps. Ann. G1aciolog. 2002, 34, 24–30. [Google Scholar] [CrossRef]
  7. Klein, A.G.; Hall, D.K.; Riggs, G.A. Global snow cover monitoring using MODIS. In Proceedings of 27th International Symposium on Remote Sensing of Environment, Tromsø, Norway, June, 1998; pp. 363–366.
  8. Vikhamar, D.; Solberg, R. A method for snow-cover mapping in forest by optical remote sensing methods. In Proceedings of EARSeL Specialist Workshop on Remote Sensing of Land and Snow, Dresden, Germany, 2000.
  9. Walker, A.E.; Goodison, B.E. Discrimination of a wet snow-cover using passive microwave satellite data. Ann. Glaciol. 1993, 17, 307–311. [Google Scholar]
  10. Liang, T.G.; Huang, X.D.; Wu, C.X.; Liu, X.Y.; Li, W.L.; Guo, Z.G.; Ren, J.Z. An application of MODIS data to snow cover monitoring in a pastoral area: a case study in Northern Xinjiang. Remote Sens. Environ. 2008, 112, 1514–1526. [Google Scholar] [CrossRef]
  11. Wang, X.; Xie, H.; Liang, T. Evaluation of MODIS snow cover and cloud mask and its application in Northern Xinjiang. Remote Sens. Environ. 2008, 112, 1497–1513. [Google Scholar] [CrossRef]
  12. Wang, J.; Li, H.Y.; Hao, X.H. Responses of snowmelt runoff to climatic change in an inland river basin, Northwestern China, over the past 50a. Hydrol. Earth Syst. Sci. 2010, 7, 493–528. [Google Scholar] [CrossRef]
  13. Lan, Y.C.; Wang, J.; Kang, E.S.; Ma, Q.J.; Zhang, J.S.; Chen, R.S. Snow cover monitoring by remote sensing and snowmelt runoff calculation in the upper Huanghe river basin. Chin. Geogr. Sci. 2002, 12, 120–125. [Google Scholar] [CrossRef]
  14. Song, K.S.; Zhang, Y. Snow-cover environmental monitoring and assessment in Northeastern China using passive microwave emission models. Environ. Monit. Assess. 2008, 140, 229–223. [Google Scholar]
  15. Song, K.S.; Zhang, Y.Z.; Jin, C.; Yan, S.; Chiu, L.S. Seasonal snow monitoring in Northeast China using space-borne sensors: preliminary results. Ann. Geogr. Inf. Sci. 2008, 14, 113–119. [Google Scholar] [CrossRef]
  16. Zhang, Y.S.; Ban, X.; Ji, R.; Yuan, G.; Feng, R.; Zhang, S. Analysis of Climatic Resources in Liaoning Province. Meteorol. Sci. Tech. 2004, 32, 33–43. [Google Scholar]
  17. Ji, R.P.; Zhang, Y.; Feng, R.; Chen, P.; Zhang, S.; Wu, J. Analyzing the changing characteristics of agricultural climate resources in Liaoning Province. Resour. Sci. 2007, 29, 74–82. [Google Scholar]
  18. Zhao, S.Y. Analysis of remote sensing applications. In Principles and Methods; Science Press: Beijing, China, 2003. [Google Scholar]
  19. Parajka, J.; Bloschl, G. The value of MODIS snow-cover data in validating and calibrating conceptual hydrologic models. J. Hydrol. 2008, 358, 240–258. [Google Scholar] [CrossRef]
  20. Armstrong, R.L.; Brodzik, M.J.; Savoie, M.H. Enhanced snow cover mapping using combined optical and passive microwave data. In Proceedings of International Geoscience and Remote Sensing Symposium, Anchorage, AK, USA, September, 2004; pp. 861–864.
  21. Kelly, R.E.J.; Chang, A.T.C.; Tsang, L.; Foster, J.L. A prototype AMSR-E global snow area and snow depth algorithm. IEEE Trans. Geosci. Remote Sens. 2003, GE41, 230–242. [Google Scholar] [CrossRef]
  22. Dozier, J. Snow reflectance from Landsat-4 Thematic Mapper. IEEE Trans. Geosci. Remote Sens. 1984, GE22, 323–328. [Google Scholar] [CrossRef]
  23. Dozier, J. Spectral signature of Alpine snow cover from the Landsat Thematic Mapper. Remote Sens. Environ. 1989, 28, 9–22. [Google Scholar] [CrossRef]
  24. Hall, D.K.; Riggs, G.A.; Salomonson, V.V. Development of methods for mapping global snow cover using moderate resolution imaging spectroradiometer data. Remote Sens. Environ. 1995, 54, 127–140. [Google Scholar] [CrossRef]
  25. Hallikainen, M.T.; Jolma, P.A. Retrieval of the water equivalent of snow cover in Finland by satellite microwave radiometry. IEEE Trans. Geosci. Remote Sens. 1986, GE24, 855–865. [Google Scholar] [CrossRef]
  26. Ma, Y.J.; Zuo, H.C.; Zhang, Y.H.; Hui, X.Y. Analyses on variation trends of atmospheric visibility and its effect factor in multi-cities in Central Liaoning. Plateau Meteorol. 2005, 24, 623–628. [Google Scholar]

