Role of Emissivity in Lava Flow ‘Distance-to-Run’ Estimates from Satellite-Based Volcano Monitoring


1
School of Environment, Earth and Ecosystem Sciences, The Open University, Milton Keynes MK7 6AA, UK
2
Istituto Nazionale di Geofisica e Vulcanologia, Osservatorio Etneo, 95125 Catania, Italy
3
Department of Environmental and Chemical Engineering, University of Calabria, 87036 Rende (CS), Italy
*
Author to whom correspondence should be addressed.
Remote Sens. 2019, 11(6), 662; https://doi.org/10.3390/rs11060662
Submission received: 30 January 2019
/
Revised: 5 March 2019
/
Accepted: 14 March 2019
/
Published: 19 March 2019
(This article belongs to the Special Issue Remote Sensing of Volcanic Processes and Risk)
Abstract
:Remote sensing is an established technological solution for bridging critical gaps in volcanic hazard assessment and risk mitigation. The enormous amount of remote sensing data available today at a range of temporal and spatial resolutions can aid emergency management in volcanic crises by detecting and measuring high-temperature thermal anomalies and providing lava flow propagation forecasts. In such thermal estimates, an important role is played by emissivity—the efficiency with which a surface radiates its thermal energy at various wavelengths. Emissivity has a close relationship with land surface temperatures and radiant fluxes, and it impacts directly on the prediction of lava flow behavior, as mass flux estimates depend on measured radiant fluxes. Since emissivity is seldom measured and mostly assumed, we aimed to fill this gap in knowledge by carrying out a multi-stage experiment, combining laboratory-based Fourier transform infrared (FTIR) analyses, remote sensing data, and numerical modeling. We tested the capacity for reproducing emissivity from spaceborne observations using ASTER Global Emissivity Database (GED) while assessing the spatial heterogeneity of emissivity. Our laboratory-satellite emissivity values were used to establish a realistic land surface temperature from a high-resolution spaceborne payload (ETM+) to obtain an instant temperature–radiant flux and eruption rate results for the 2001 Mount Etna (Italy) eruption. Forward-modeling tests conducted on the 2001 ‘aa’ lava flow by means of the MAGFLOW Cellular Automata code produced differences of up to ~600 m in the simulated lava flow ‘distance-to-run’ for a range of emissivity values. Given the density and proximity of urban settlements on and around Mount Etna, these results may have significant implications for civil protection and urban planning applications.
1. Introduction
As less than 10% of the ~1500 active subaerial volcanoes around the world are monitored regularly on the ground, remote sensing (RS) provides an opportunity to increase coverage. A combination of laboratory-based analyses, RS data, and numerical modeling could bridge critical gaps in volcanic hazard assessment and risk mitigation.
The prediction of lava flow ‘distance-to-run’ (ultimate length) is viewed as the key activity in support of risk mapping and planning the emergency response and crisis management of effusive volcanic events. The impact of volcanic eruptions and distances to which erupted lava will flow depend on several physical and chemical parameters [1,2,3,4].
It is widely recognized that RS data can be integrated with ground-based observations during volcanic crisis to facilitate the estimation of thermal anomalies and—depending on spatial and temporal resolutions—forecast the geographic extent of active lava flows. However, a developing lava flow is a complex surface to observe using remote techniques, due to the moving material exhibiting a range of temperatures, textures, vesicularities [5], and thicknesses. Furthermore, the evolution of thermal anomalies may involve continuous changes in energy emitted as surfaces cool, as well as variations that depend on viewing angles [6].
Several automated processes for the detection and measurement of volcanic ‘hot-spots’—such as VAST [7], MODVOLC [8,9], RAT [10], MyVOLC and MyMOD [11], among others—have been developed, tested, and run to date. In particular, three projects have marked the development and awareness for a complete and global monitoring capacity: (i) the European Space Agency’s (ESA) pilot project GLOBVOLCANO (2008–2011), using high-spatial resolution RS; (ii) the European Commission’s European Volcano Observatory Space Services (EVOSS, 2010–2014), centered on high to very-high temporal resolutions, and (iii) the Disaster Risk Management volcano pilot project of the Committee on Earth Observation Satellite (CEOS), focusing on the continuous monitoring of volcanic activity in the whole of Latin America and the Caribbean. These projects, among others, have demonstrated how access to RS data over volcanic regions can enhance the understanding of volcanic activity, enabling hazard mitigation and the identification of developing trends in volcanic activity [12,13].
A focus of this study is emissivity, which is defined as the efficiency of radiating thermal energy at a specific wavelength. Although it is a critical variable in the interpretation of passive RS for accurate surface temperature estimation, emissivity is seldom measured and mostly assumed or estimated to be a fixed value, which does not change as a function of temperature and wavelength.
The fundamental laws of Planck, Stefan-Boltzmann, and Wien demonstrate that surfaces radiate in different regions of the electromagnetic spectrum, depending on their temperature. Planck’s radiation law defines the radiation released to be that of a perfect radiator, a blackbody: however, very few terrestrial surfaces would act as near-perfect blackbodies. The ability of non-blackbody surfaces to emit radiation is defined by their emissivity. Emissivity may be defined as the ratio of the radiation emittance of a sample relative to that of a blackbody at the same temperature.
Volcanic surfaces, such as the basalts analyzed here, may be characterized as selective radiators, since their emissivity varies with wavelength and would be less than unity (blackbody). A variety of approaches have been used to derive surface temperatures from RS data, where emissivity is either assumed to be unity, or a fixed ‘look up’ value. This value for basaltic surfaces is estimated to be 0.90 to 0.95 [14], or it is estimated directly from reflectance data [15] (e.g., 0.80). The motivation of this study is to establish the significance of emissivity variations in the derivation of lava surface temperatures from RS data, and assess the impact of such variations on the estimation of eruption rates and the prediction of lava flow ‘distance-to-run’ using high spatial resolution spaceborne data.
2. Materials and Methods
2.1. Rock Samples
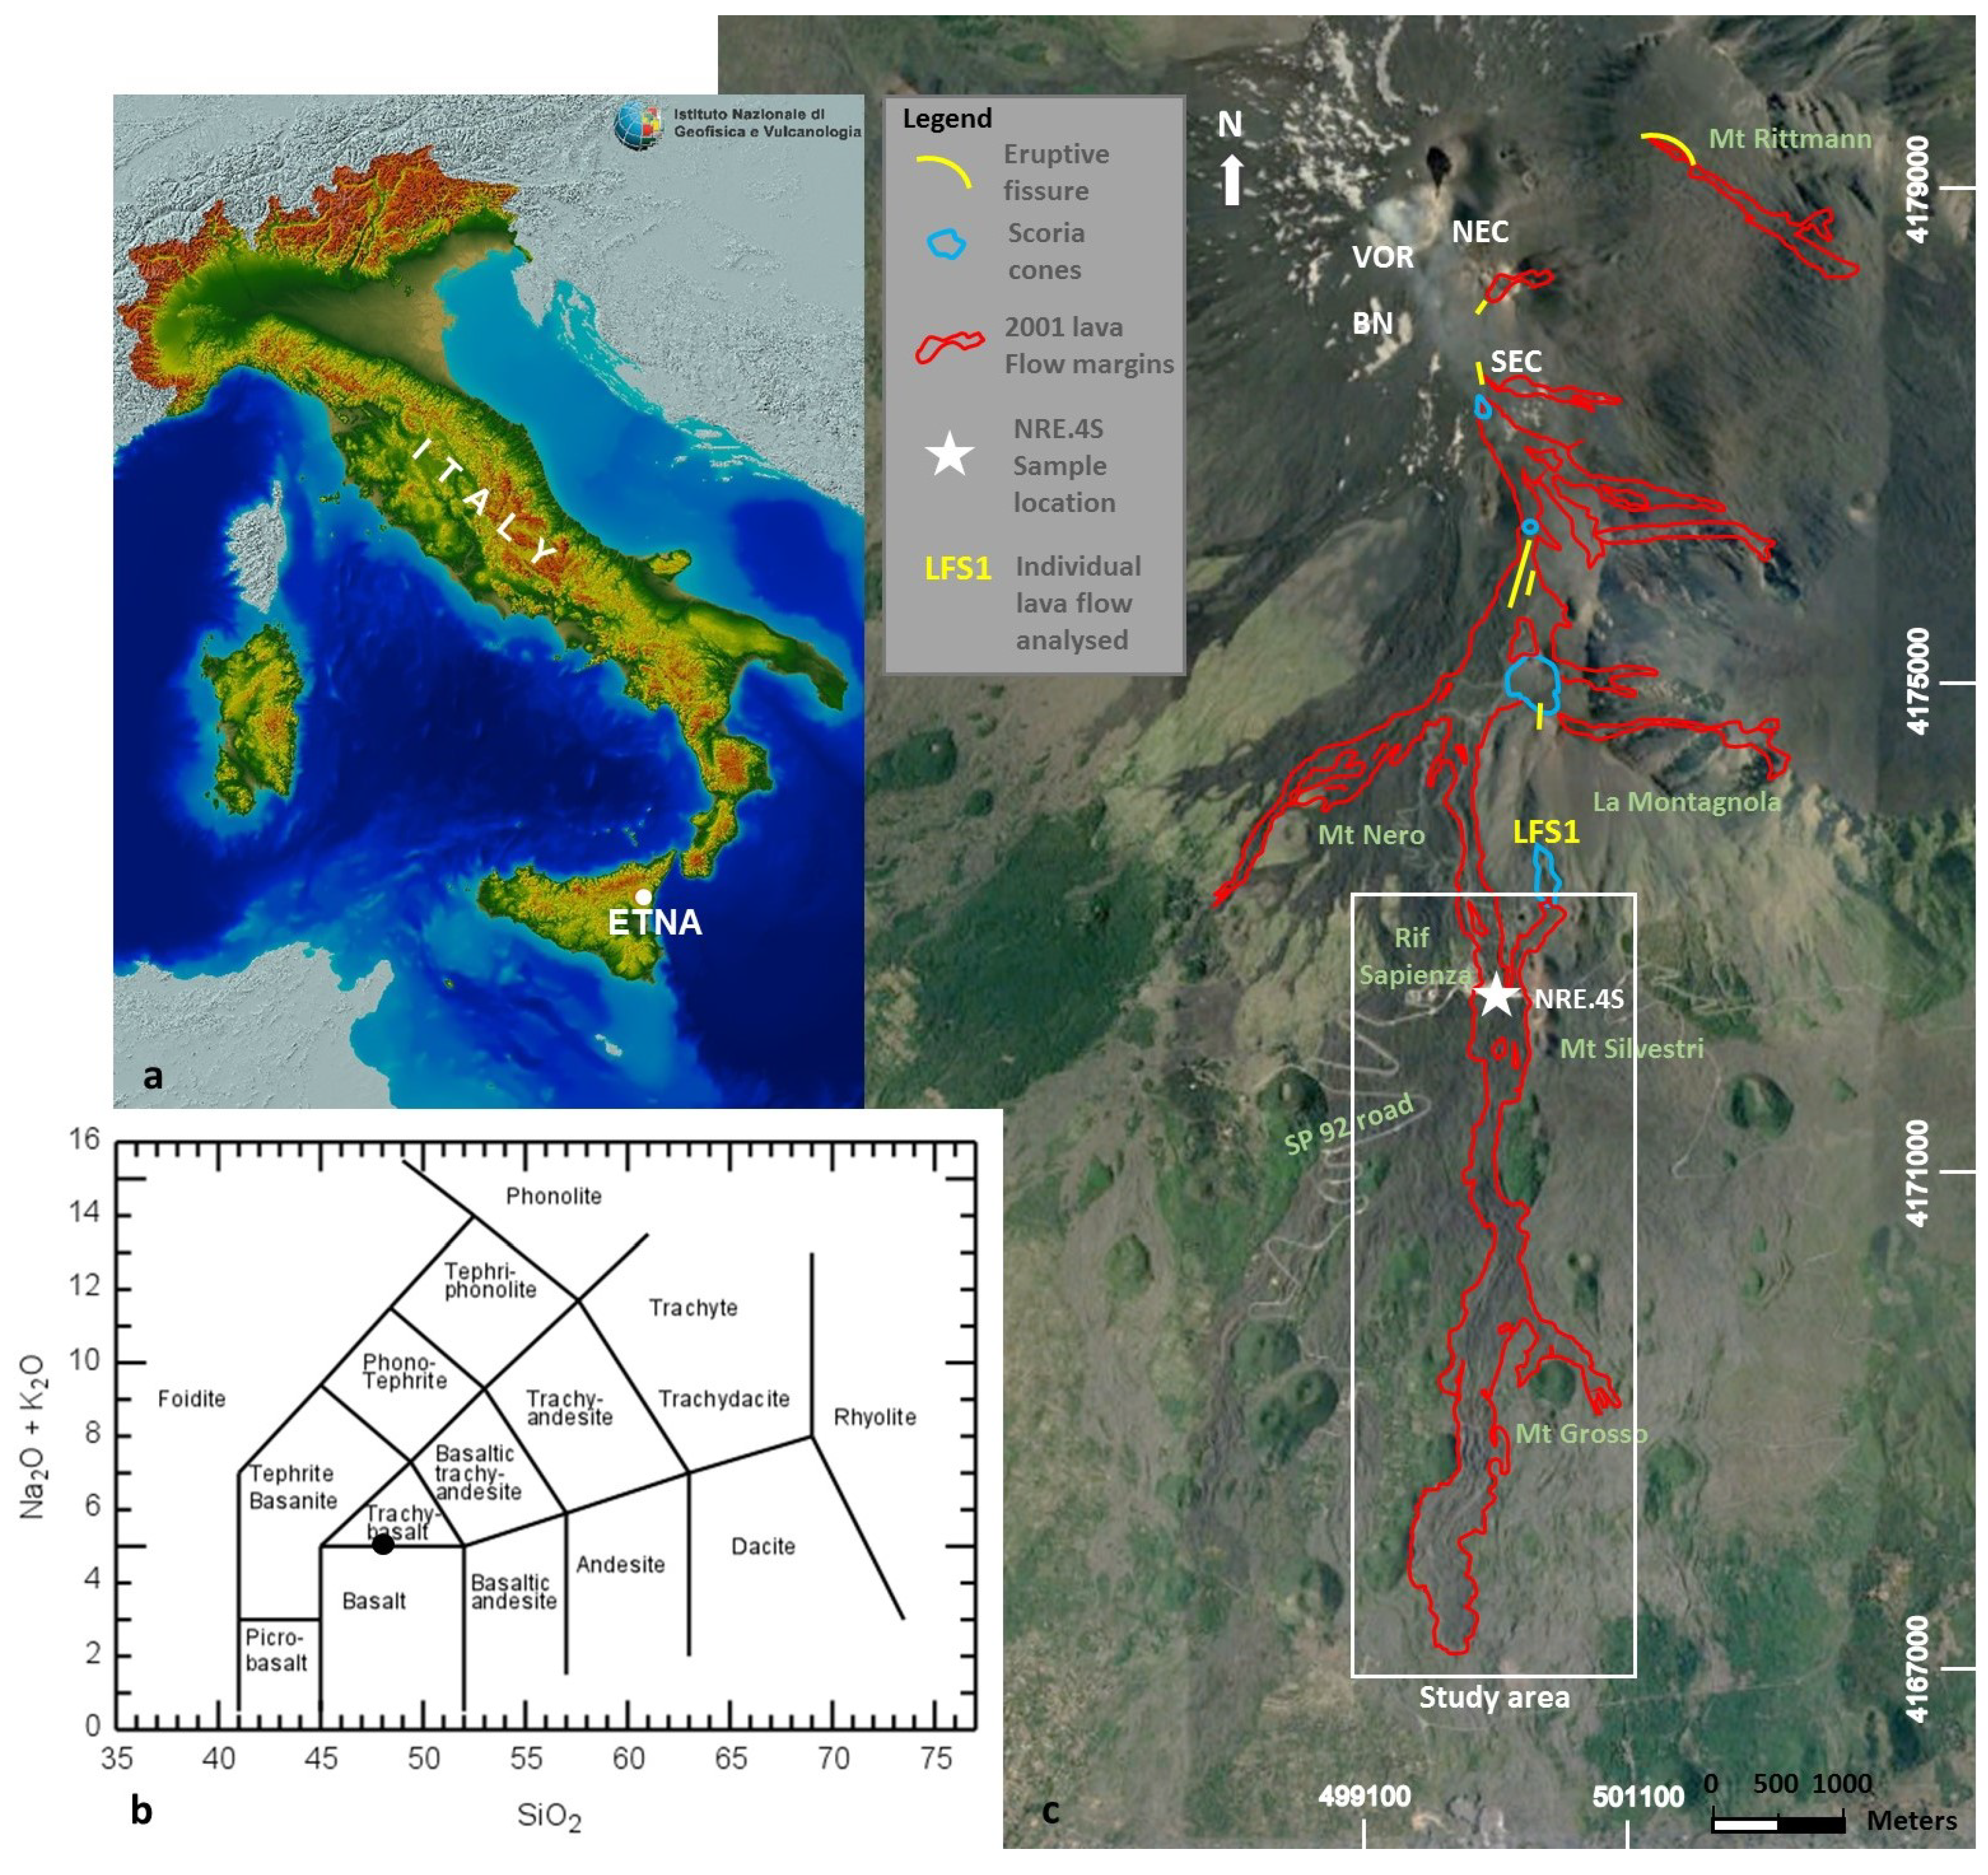
Due to its persistent activity, Mount Etna (Italy) is frequently targeted for studies involving the application of RS data to detect high-temperature thermal features and measure eruptive products [9,16]. The 2001 eruption presents three main features: (i) despite lasting only 23 days (18 July to 09 August 2001), it gave rise to an outstanding pattern of seven different (Figure 1) fast-developing lava flows [17]; (ii) the total lava flow volume is significant in the recent eruptive history of Etna, and (iii) this eruption could be observed by three high spatial resolution multispectral payloads (TM onboard Landsat 5, ETM+ onboard Landsat 7, and ASTER onboard Terra).
To measure the emissivity of exposed lavas, we collected 10 rock samples termed the NRE.4 Series (NRE.4S) across the main flow (LFS1) (Figure 1), in a grid scaled to the spatial resolution of the ASTER TIR bands (~90 m). Samples were initially investigated using Fourier transform infrared (FTIR) spectroscopy to derive emissivity from both reflectance and radiance data at ambient/low and high temperatures. Existing spaceborne data (ASTER Global Emissivity Database) and numerical modeling (MAGFLOW) are used for data validation.
2.2. Laboratory-Based Data Acquisition
We carried out laboratory Fourier transform infrared (FTIR) analyses on solidified volcanic rock samples from the major 2001 eruption of Mount Etna to derive emissivity at a range of wavelengths and temperatures.
2.2.1. Emissivity from Surface Reflectance Spectra
We collected reflectance spectra of samples measured at an ambient temperature (~295 K) at the Planetary Emissivity Laboratory (DLR, Germany) by the Bruker Vertex 80v FTIR spectrometer, using a gold integration sphere hemispherical reflectance accessory.
The experimental setup [19] measures the reflectance of samples in the visible, the near infrared bands, and medium infrared (MIR) ranges. Reflectances are converted into approximate emissivity. For MIR measurements, a wide-range Mercury Cadmium Telluride (MCT) detector is used (1000–400 ) in tandem with a wide-range germanium (Ge) on potassium bromide (KBr) beam splitter (12,500–420 ). For V-NIR measurements, conversely, an InGaAs Diode detector was used (12,500–5800 ) in tandem with a silicon (Si) on calcium fluoride (Ca) beam splitter (15,000–1200 ).
Samples (grain size 500–1000 ) were placed into individual sample cups, which were placed on the hemispherical reflectance accessory, and aligned. Prior to measuring samples, a gold reference target was used to calibrate the instrument. Finally, individual sample spectra were normalized to the gold reference target spectrum results to obtain reflectance values.
The apparent emissivity () values were derived using the measured reflectance (R) data using Kirchhoff’s law (Equation (1)). This approach provides an expected result precision of 0.005 [20].
It is important to note that Kirchhoff’s law (1) is only valid for hemispherical reflectance measurements, and is used to approximate emissivity from reflectance data [21]; thus, the term ‘apparent’ emissivity (ε’) is used in contrast to the ‘true’ emissivity ().
2.2.2. Emissivity from Surface Radiance Spectra
The thermal emission spectra of the samples were measured in a vacuum (0.7 mbar) at temperature and wavelength ranges of 400 to 900 K and 5.0 to 16.0 , respectively. The experimental setup [19] used an external simulation chamber attached to the FTIR spectrometer measuring the emissivity of solid samples (grain size 100–3000 ). The emissivity chamber was equipped with an internal web-cam, and several temperature sensors to measure the sample/cup temperature, monitor the equipment, and record chamber temperatures. Both the cup and the sample are heated uniformly by induction, and the temperature of the emitting surface is measured using a thermophile sensor in contact with the surface. The resulting data are calibrated using the emissivity spectrum of the blackbody material [19] to provide the set of ‘true’ emissivity () data.
2.3. Emissivity from High-Spatial Resolution Satellite Data
The Global Emissivity Database
The Global Emissivity Database (GED v.3) built by NASA’s Jet Propulsion Laboratory (JPL) [22] is the most detailed emissivity product available for Earth’s land surface. Emissivity, rescaled to 100 m from the original 90-m ASTER TIR pixels, is an average of data acquired at five TIR central wavelengths (8.30 μm, 8.65 μm, 9.10 μm, 10.60 μm, and 11.30 μm) every 16 days, from 2000 to 2008. It was obtained by NASA JPL by combining temperature emissivity separation (TES) algorithms and water vapor scaling (WVS) atmospheric corrections coincident with MODIS MOD07 atmospheric profiles and the MODTRAN 5.2 radiative transfer code [23].
In this study, we examined 12 ASTER GEDv3 data ‘tiles’ downloaded from the NASA EOSDIS Land Processes DAAC [24], centered on Sicily (Italy) and Mount Etna.
3. Emissivity Results
3.1. Emissivity from Reflectance
As a preliminary estimate of surface emissivity, we used FTIR reflectance data measured at ambient temperature. The spectral signatures were consistent with those from previous research on basaltic rocks [14,25], confirming that representative emissivity data can be obtained this way (Figure 2). To extend the observable spectral range, two detectors (KBr at 0.66 to 2.50 μm and MCT at 2.50 to 16.00 μm) were used, so that the data could be merged at 2.63 μm to provide the best signal-to-noise (STN) ratio result for the entire range from visible near-infrared (VNIR) to TIR wavelength. The maximum difference in emissivity at any wavelength between the NRE.4 series samples was 0.02.
3.2. Emissivity from Radiance
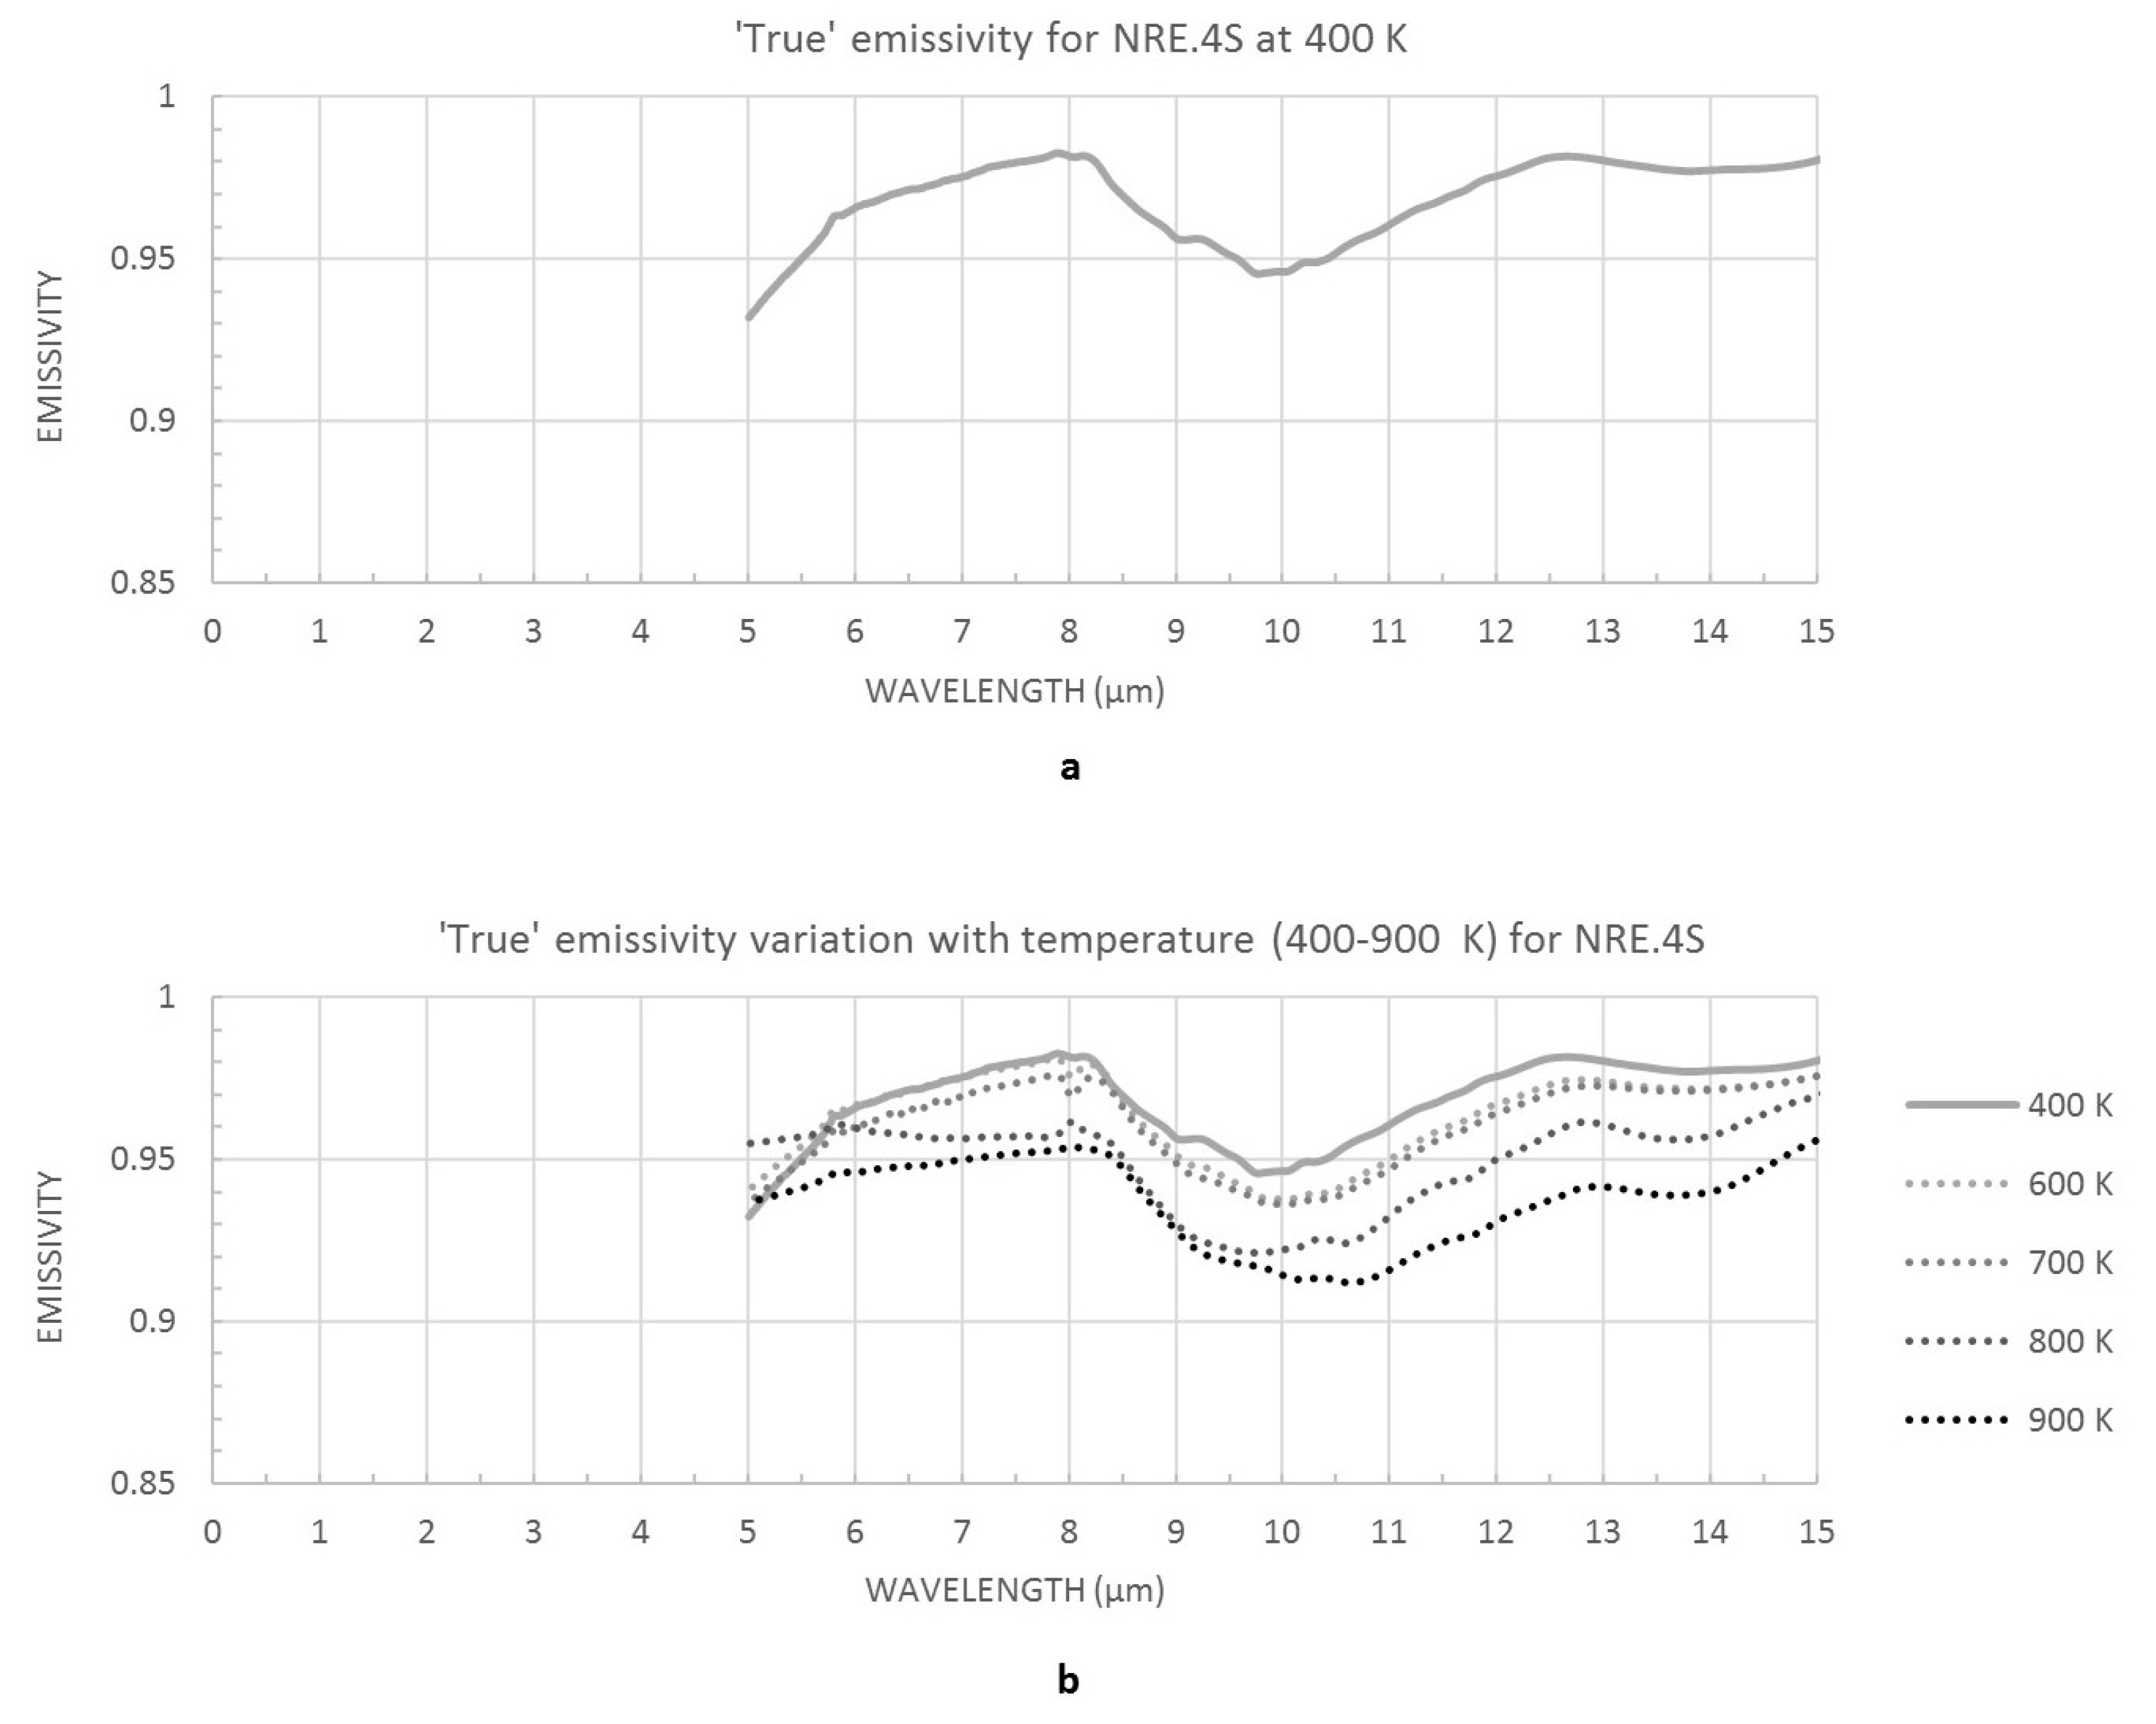
The spectral signatures for samples analyzed using thermal emission analysis at 400 K (Figure 3a) display emissivity values consistent with the preliminary reflectance data (Figure 2) in the TIR region (8.0–15.0 μm), with a significantly improved STN ratio and optimal error range (<0.01) for NRE.4 Series. In contrast to ambient/low-temperature data, high-temperature results (Figure 3b) show a steady decrease in emissivity with every temperature increase step (400–900 K). However, this trend could not be observed between 5.0–6.0 μm. This is because of the instrument sensitivity limitations and for this reason, only the results in TIR wavelengths (8.0–15.0 μm) should be used in further analyses. An additional ‘cooling test’ was performed by measuring the emissivity of the same series in the opposite direction (cooling), by decreasing temperature steps (i.e., 900–400 K), maintaining consistent sample conditions. The deviance in emissivity values during the temperature increase (heating) is shown in Figure 3b and the temperature decrease (cooling) was ≤0.02 with no hysteresis deviation trend in either direction.
3.3. Comparison with Emissivity from Satellite Data
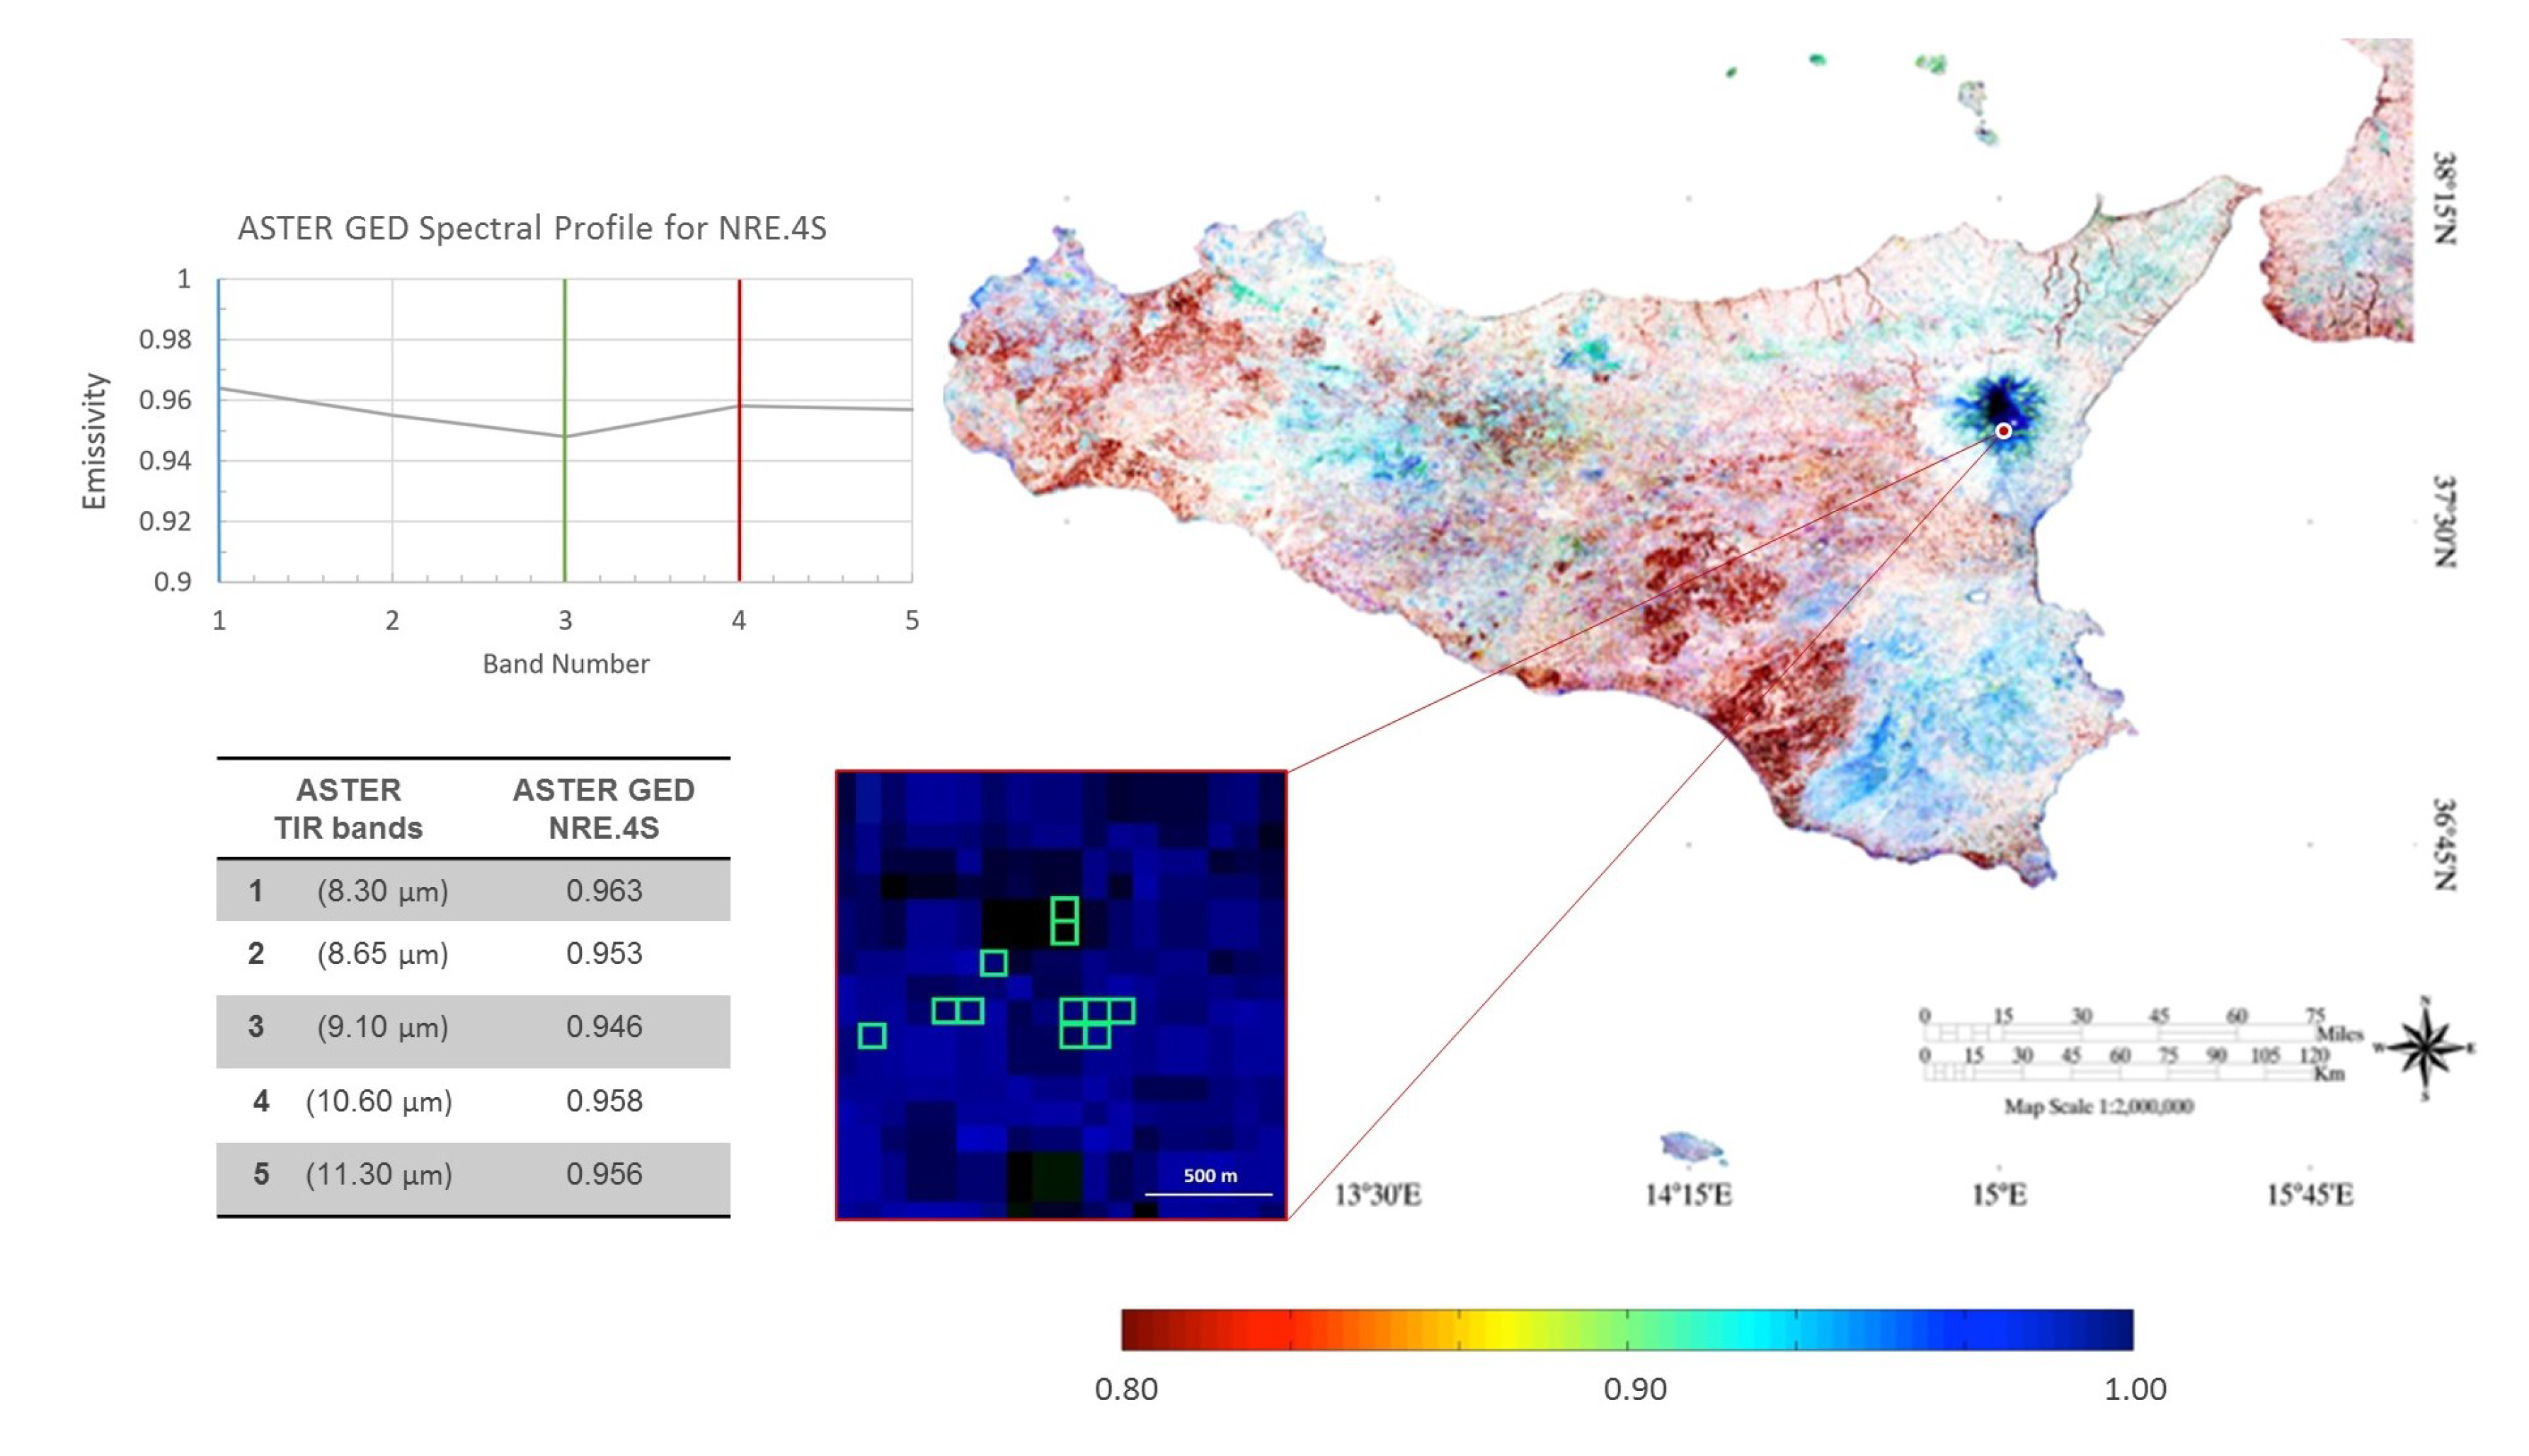
The emissivity map (Figure 4) created using existing spaceborne ASTER GEDv3 data [22] over Sicily (Italy) and Mount Etna, displays a mean emissivity variation of the NRE.4S targets analyzed. The highest emissivities are shown in dark blue; these correspond to the Mt Etna region, which is consistent with the emissivity signatures of basaltic volcanic surfaces. Sicily is geologically complex due to its regional tectonics; thus, green and red areas on the map with lower emissivities would represent compositionally different geological units of non-volcanic origin.
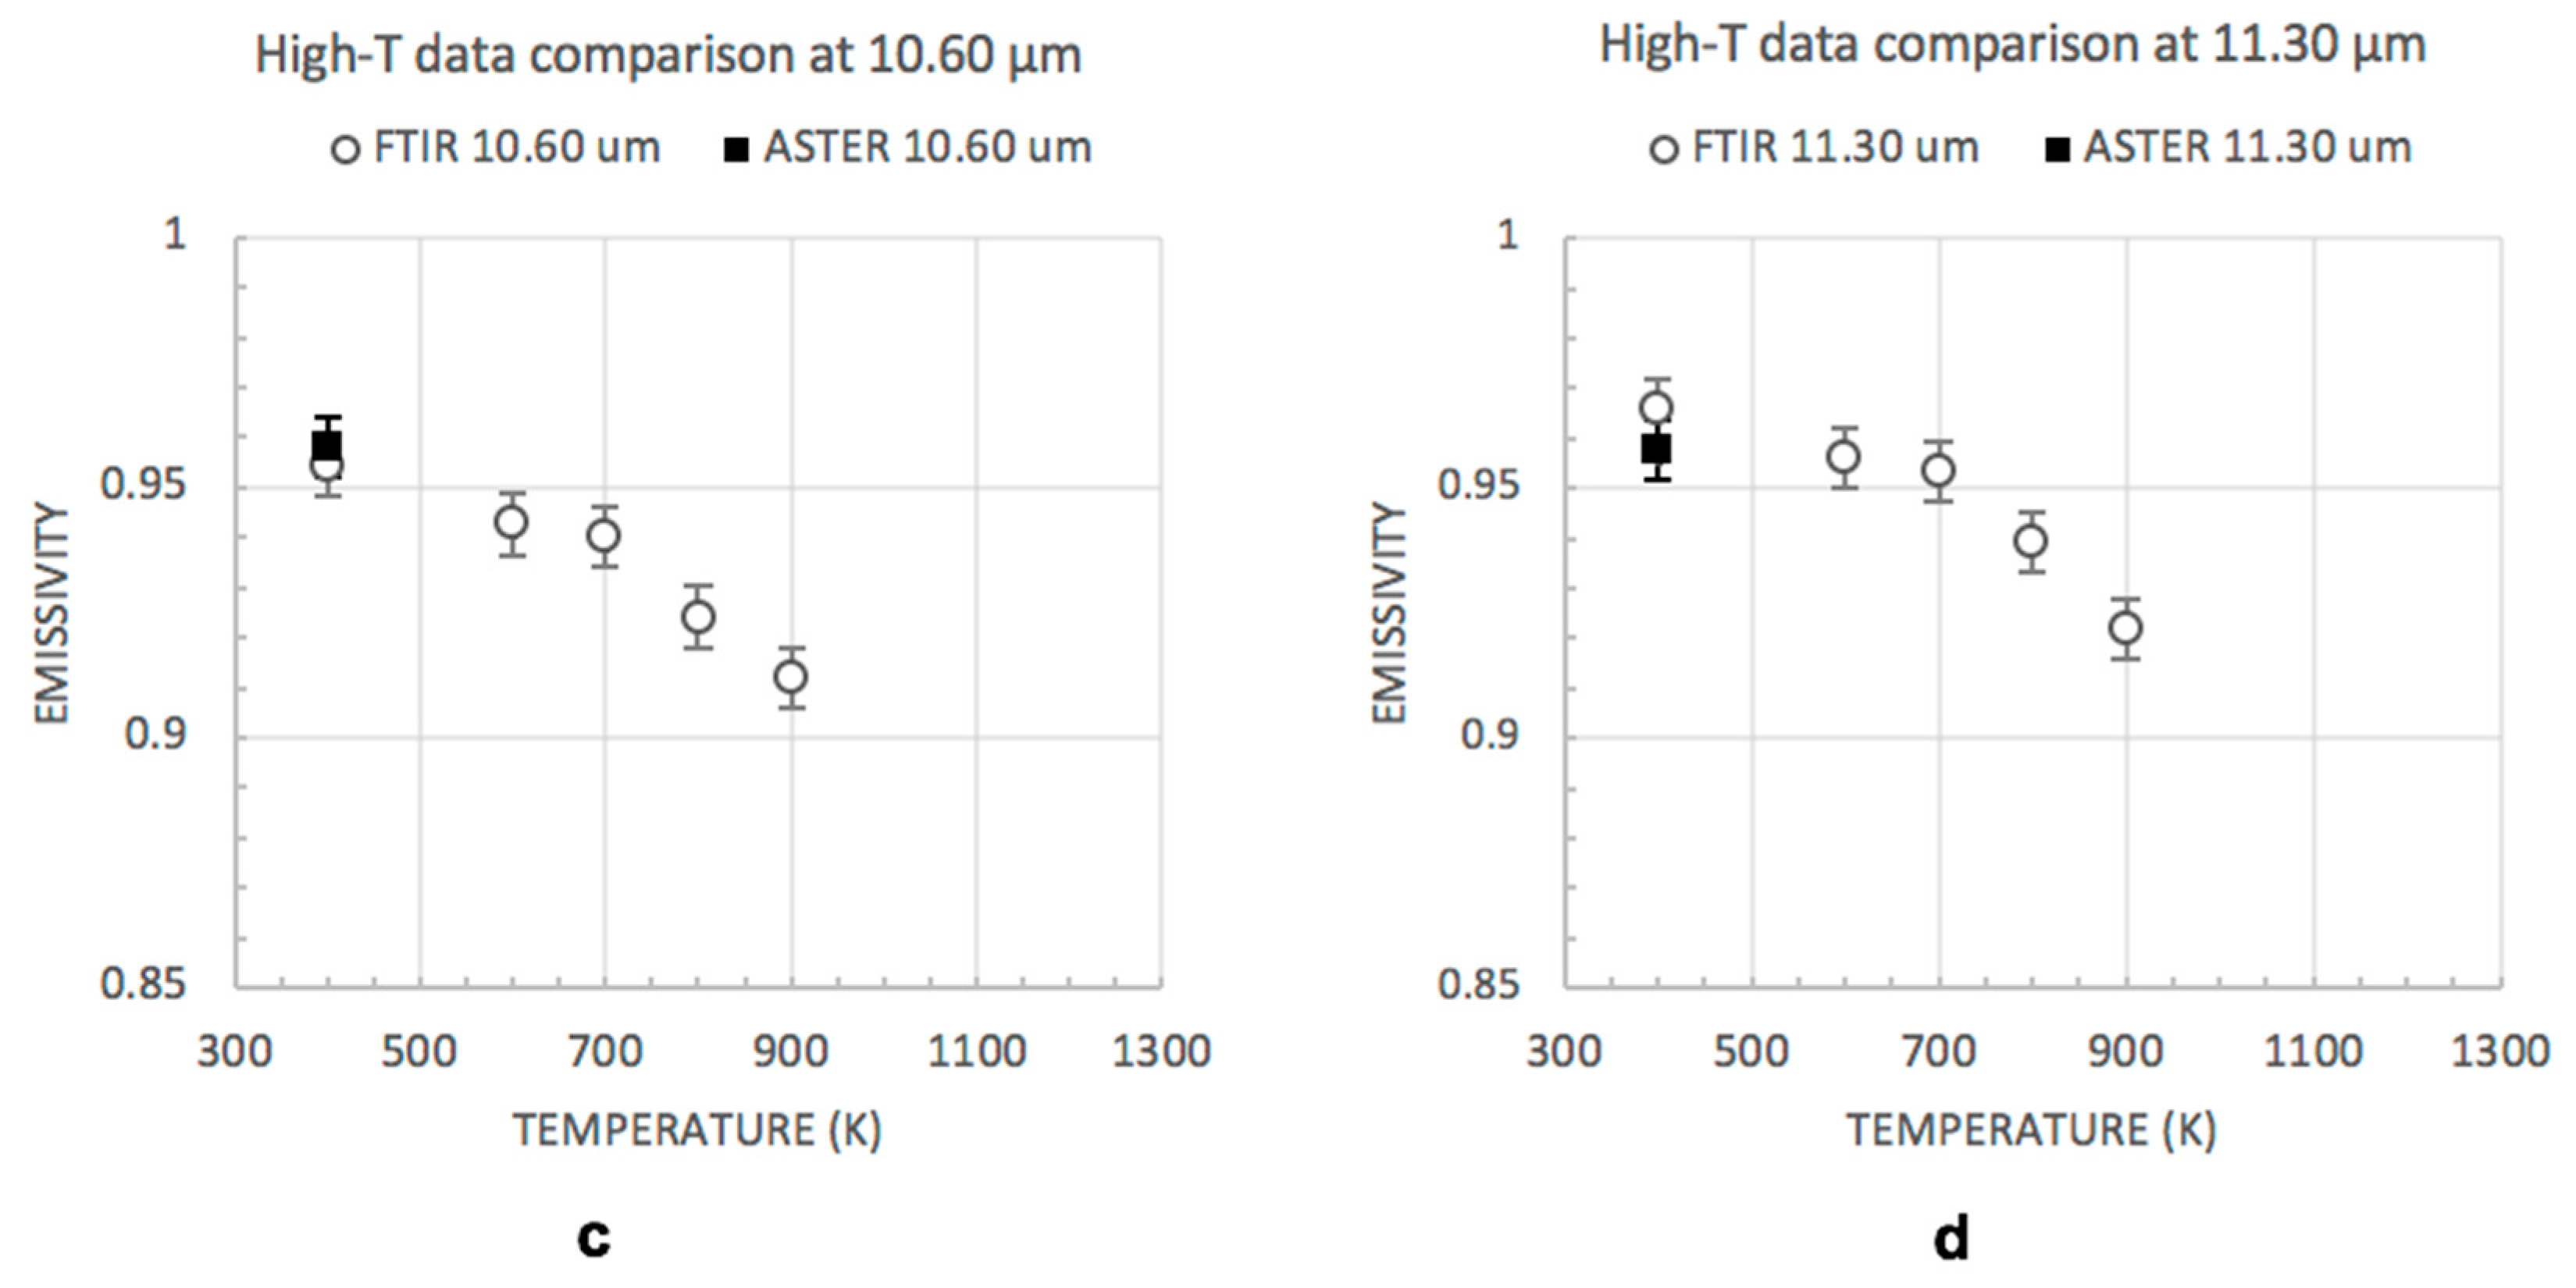
For a direct comparison, spaceborne emissivity data (Figure 4 and Figure 5a) and laboratory FTIR results (Figure 2 and Figure 3a) of the same area targets (NRE.4S) are shown at ASTER TIR operating central-wavelength bands (8.30 , 8.65 , 9.10 , 10.60 , and 11.30 ). A relatively comparable trend can be observed (Figure 5b), exhibiting the best data fit at 9.10 μm (≤0.01) and data range/error of ≤0.03 at other wavelengths. Accounting for different methodologies used in this study and their limitations (discussed in Section 5), the emissivity range/error is expected. This may suggest that, despite being a nine-year average (2000–2008), the ASTER GED mean emissivity data for the 2001 lava flow area can fit reasonably well with our results obtained using ambient/low-temperature FTIR laboratory measurements. However, the high-temperature FTIR results (Figure 3b) indicate a trend (Figure 5c,d) that suggest an emissivity decrease with temperature increase.
4. Emissivity versus Effusion Rate and ‘Distance-to-Run’
4.1. From Spaceborne Data
Varying the emissivity and wavelength will have an impact on the computation of integrated temperatures and radiant fluxes, and hence on the estimation of lava effusion rates and ‘distance-to-run’. To perform a quantitative evaluation, we selected the best-quality night-time image acquired during the 2001 eruption, aimed to avoid both pixel saturation and the reflected radiances of daytime images in SWIR.
This eruption was observed by three high-spatial resolution payloads on Landsat 5 (ETM), Landsat 7 (ETM+), and Terra (ASTER). The selected image data presented here was acquired by ETM+ on 5 August 2001 at 20:34 (Figure 6a). ETM+ is the multispectral scanning radiometer onboard Landsat 7, providing high-spatial resolution data (30 m in V-NIR-SWIR and 60 m in TIR) in repeat cycles of 16 days. Launched in 1999 and still active at the date of writing, ETM+ provided very high-quality images until 2003, when the linear scan compensator developed a permanent fault affecting the whole image (black stripes).
To assess the sensitivity to variations in emissivity, we selected three values. One end-member is a blackbody (1.0), and the second value (0.80) has been used in published research [15]. The third value (0.93) that was selected for our assessment is the minimum emissivity value at 10.60 from our reflectance data (Figure 2), which is also a mean emissivity estimate for basalt [14].
The image was processed for all of the radiant pixels in SWIR and TIR using the three emissivities (1.0, 0.93, and 0.80), following previously established procedures [26]. After radiometric and atmospheric correction [27,28], integrated temperatures are calculated and sub-resolutions were solved in SWIR (1.65 μm and 2.20 μm) to obtain the total radiant flux .
from which the lava effusion rate [16,29,30] is estimated:
In Equation (2), A is the pixel surface area, is the emissivity, is the Stefan–Boltzmann’s constant, is atmospheric transmissivity, and is the shape of the radiating surface. Note that the symbol in Equation (2) is not the same symbol representing the percentage of crystals grown () in Equation (3) or the fitness function () in Table 3. The equation for radiative heat transfer has term , where is the effective temperature to the fourth, power and is the ambient temperature to the fourth power. The difference in temperature from the hot material to the ambient temperature has a control on the rate of transfer. As we are dealing with very small changes in emissivity, this small difference in temperature will play an important role.
In Equation (3), is the lava density (2600 ); the specific heat capacity (1150 ); is the average temperature difference throughout the active flow (100 to 200 K), which is a significant parameter in estimating eruption rate; is the average mass fraction of crystals (0.4 to 0.5) grown in cooling through , and is the latent heat of crystallization ().
Note that while Equation (2) includes only observables and variable emissivity, the values used to solve Equation (3) are average values taken from various literature sources, which are specific for this type of lava and Mount Etna [31,32].
We observe that the TIR (Figure 6b) and two SWIR channels (Figure 6c,d) display significantly different integrated pixel temperatures on the active flow, ranging from as low as 325 K (brightness temperature ε = 1 at 10.45 μm TIR wavelength) to as high as 745 K (ε = 0.8 and 1.6 μm SWIR). Overall, 20% emissivity change may give rise to integrated pixel temperature differences in the order of 15 K in SWIR and 25 K in TIR (shown in 6b-d), which is consistent with previous research [15].
We used the instantaneous effusion rate Er_calc derived from high-spatial resolution RS data to attempt a rapid estimation of the maximum lengths that individual lava flow can reach (Figure 7). By implementing the empirical law [33,34] we observe that a moderate difference in emissivity will influence calculated eruption rates and may impact the ‘distance-to-run’ by as much as 300 m.
Often, the effusion rate can be calculated by exploiting ground-based observations, where the information on how the volume of an individual flow has changed in a given time interval can be quite accurate. This is achieved by using information on the rate of advance, if the cross-sectional area of the flow front is known (i.e., width thickness rate of advance) or if the volume and time interval are known (length width thickness time). The calculated eruption rate is used in the equation to estimate the maximum length that the lava flow can achieve. This approach provides an estimated maximum lava flow length, and is not intended to forecast the exact final length of the flow.
The individual lava flow LFS1 analyzed here reached its maximum length on or around 25 July 2001 with an estimated eruption rate of [17]. According to field estimates, after that date, the effusion rate dropped, so lava did not extend along the whole flow length. Our ETM+ data from 5 August 2001 produced an effusion rate of ~, which is in line with the rate drop observed for that time period, and corresponds well with field estimates of on 6 August 2001 (Table 2).
The total volume [17] up to the end of the eruption (Table 2) would suggest an average effusion rate (i.e., cumulative volume divided by the acquisition time in seconds) of and = 6.7 km, which is slightly greater than and consistent with the observed Nonetheless, the estimation is most needed at the start of the eruption. Our ETM+ calculated effusion rate for 5 August 2001 also highlighted an increase in of 5% between emissivity end-members (i.e., 0.80 and 1.0), which may play a role in hazard mitigation at densely populated areas in close proximity to an active volcano.
4.2. From Straightforward Modelling
To reproduce the lava flow path for the 2001 Mount Etna eruption, we used the MAGFLOW cellular automaton propagator [35,36], which uses a physical model accounting for both thermal and rheological evolution of flowing lavas. It is argued that this model has the potential to significantly improve understanding of the dynamics of lava flow emplacement [37] and assist with related hazard assessment and mitigation [38,39,40,41,42]. MAGFLOW sensitivity analyses show that the main controlling factors are topography, rheology, and vent location, while temporal changes in effusion rates will also strongly influence the accuracy of the predictive lava-flow modeling [43,44].
To model the lava flow path for the 2001 Etna eruption, MAGFLOW was run on a pre-eruptive Digital Elevation Model (DEM) using field-derived effusion rates [17] and the typical properties of basaltic rocks (density = 2600 kg/m3; specific heat capacity = 1150 J kg−1 K−1; solidification temperature = 1173 K; extrusion temperature = 1360 K), and we varied the emissivity.
To evaluate its impact on the simulated ultimate lava flow lengths, we carried out a sensitivity test where three different emissivity values (i.e., 0.80, 0.93, and 1.00) were introduced to the model, maintaining constant emissivity, unaffected by temperature changes throughout the simulation. This method was validated using the actual lava flow extent of the 2001 Mount Etna eruption.
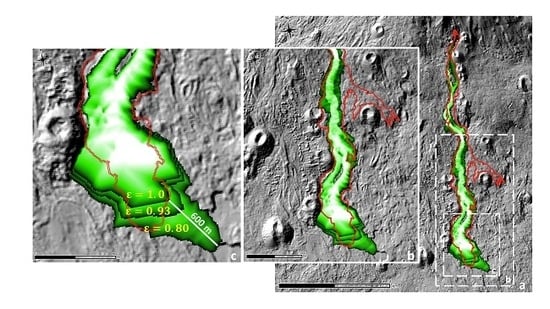
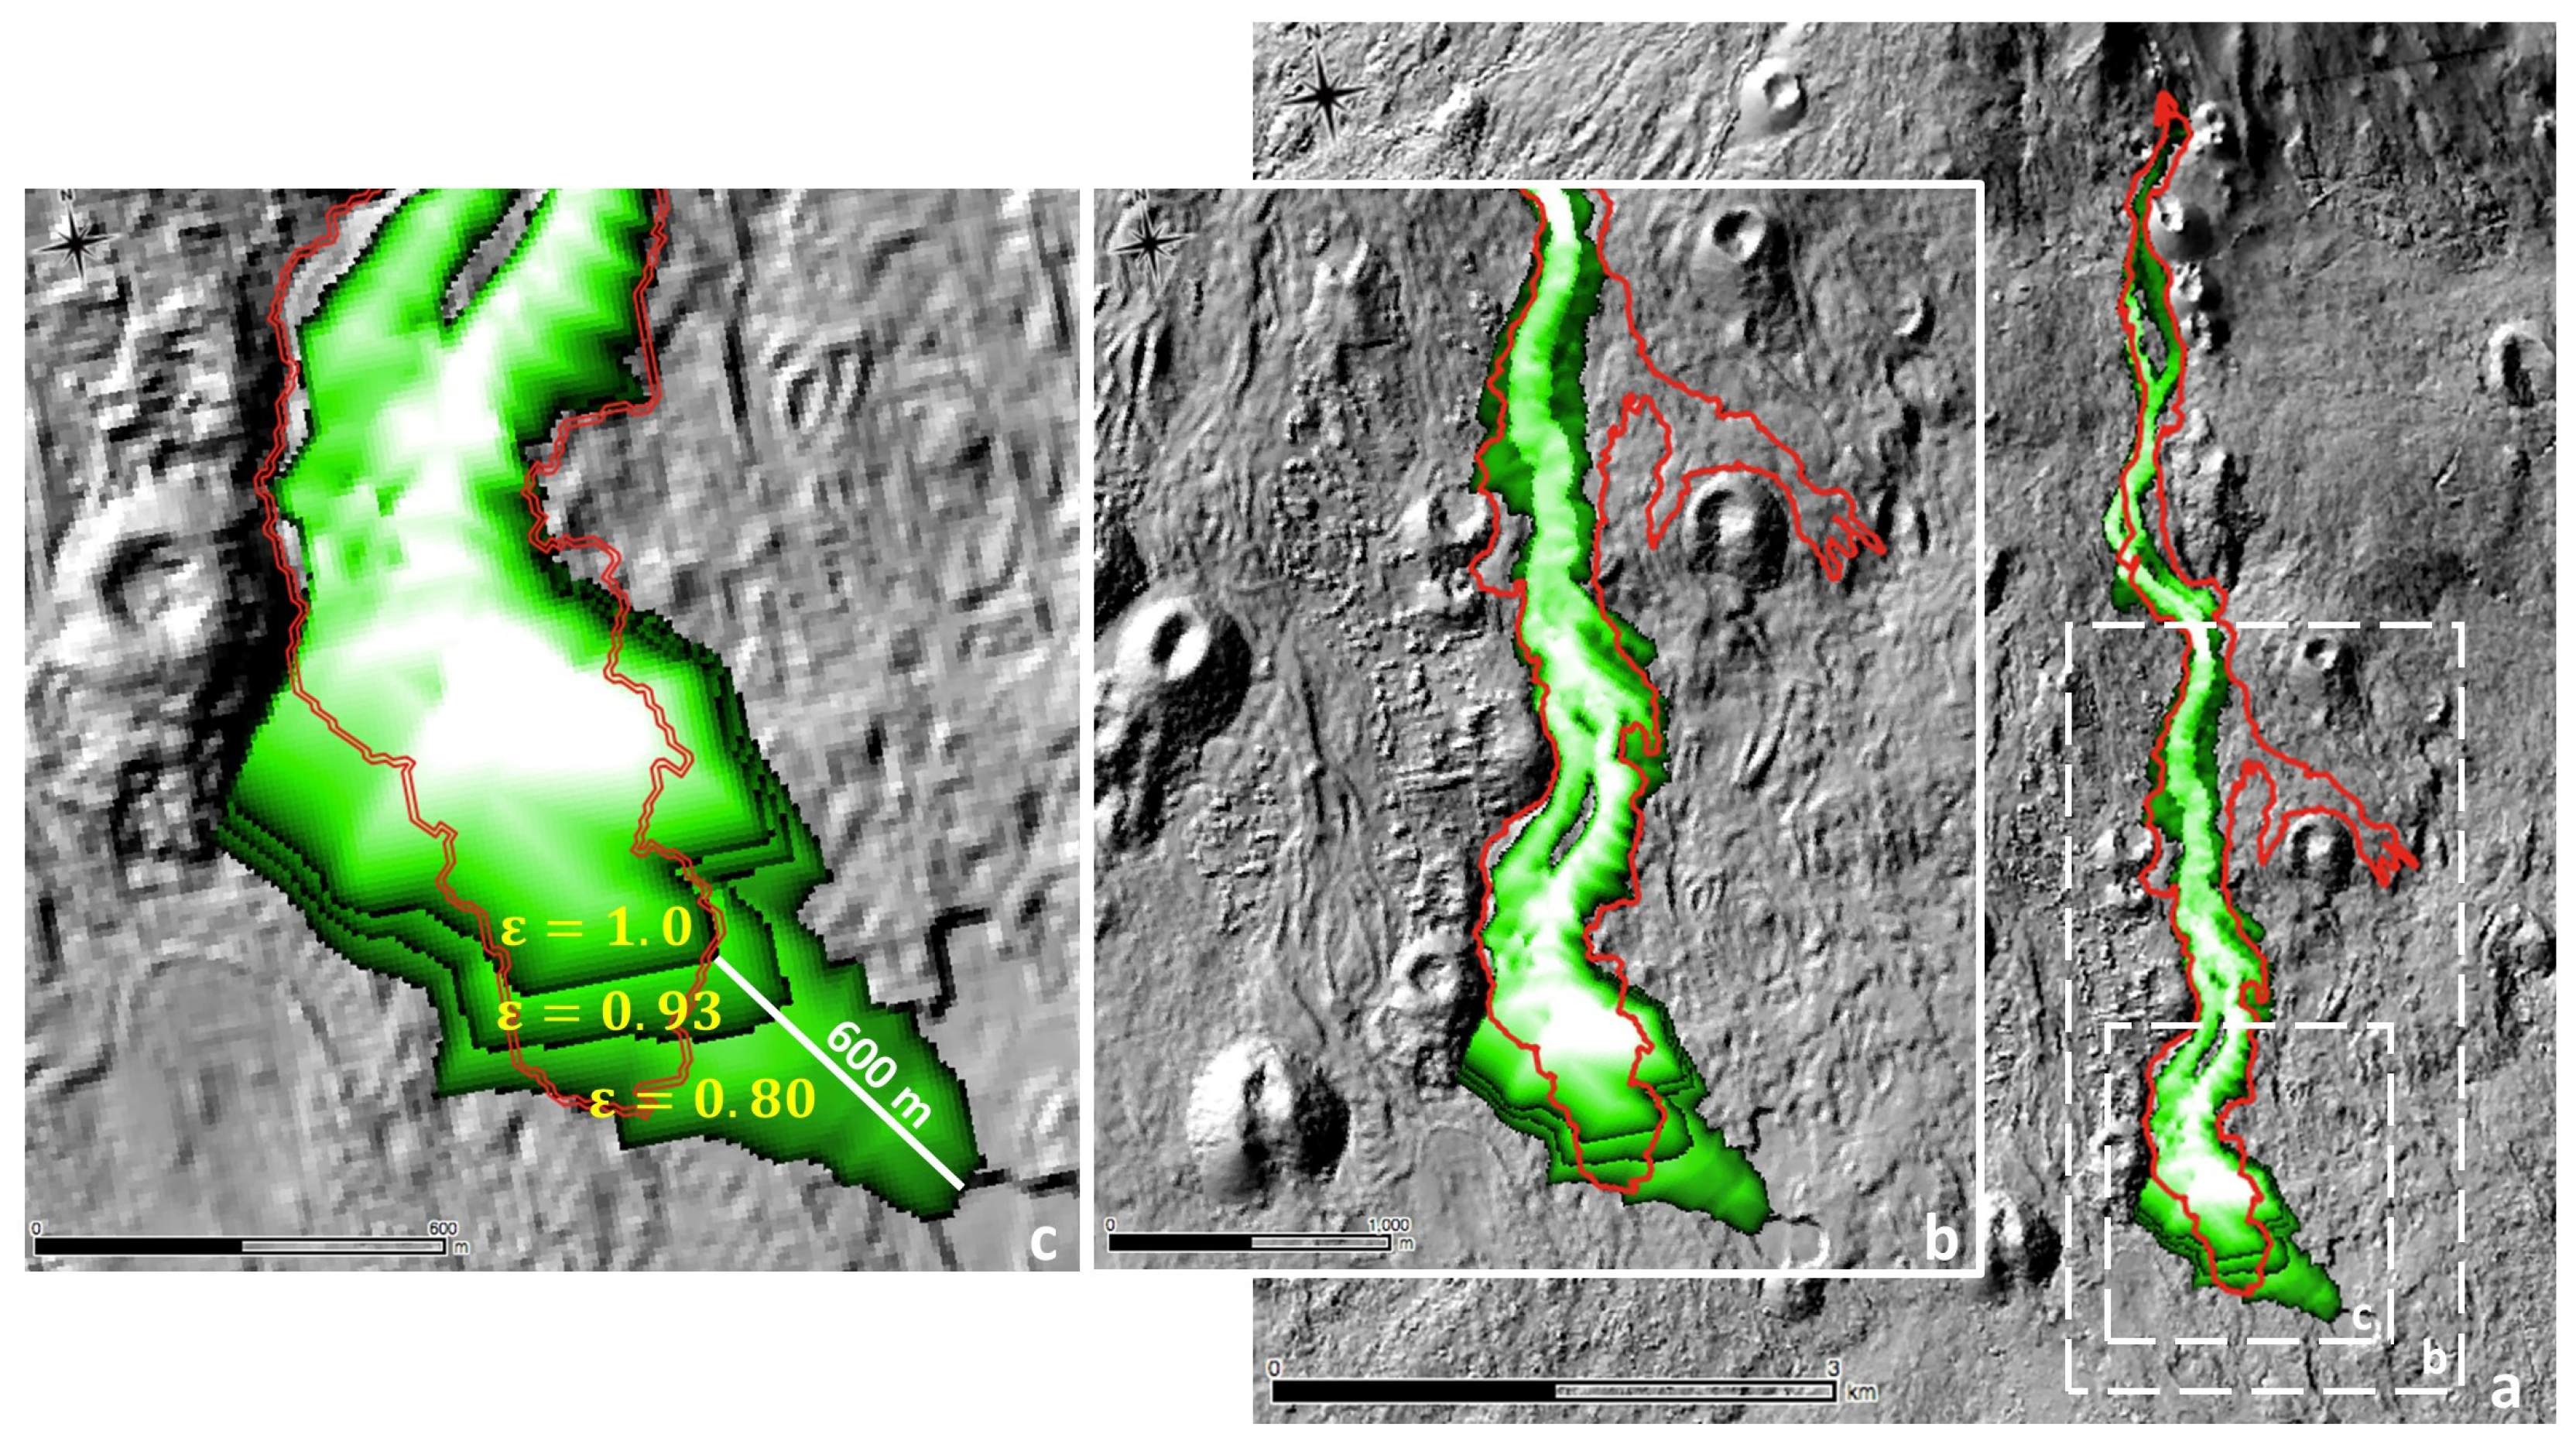
The MAGFLOW simulations obtained using the various emissivity values (i.e., 0.80, 0.93, and 1.00) are shown in Figure 8. There is good overall agreement between the actual and the simulated lava flows, but major discrepancies occurred for all simulations and reality due to the neglecting of the ephemeral vent opening that fed the minor, southeastern branch of the flow [17].
The quality of fit was quantified using a fitness function (ϕ) computed as the square root of A (sim ∩ real)/A (sim ∪ real), where A (sim ∩ real) and A (sim ∪ real) are the areas of the intersection and union between the simulated and actual lava flows, respectively. The lower and upper limits for ϕ are zero and one, with zero indicating the maximum error (i.e., lack of common areas between the simulated and actual lava flows), and one corresponding to a complete overlap (i.e., the simulated area coincides totally with the actual lava flow field).
The main morphological features (area, length, and average thickness) of actual and simulated lava flows, as well as the results of the fitness function (ϕ) are reported in Table 3.
The closest approximate values for the area covered and the average distribution were obtained by the MAGFLOW simulation run with an emissivity of 0.8 (1.94 km2 and 12.4 m, respectively). However, having almost the same extent does not guarantee a best fit (areas may not overlap wholly or in part). This is confirmed by the values of the fitness function ϕ. Whilst the actual lava flow field is quite well reproduced by the MAGFLOW model, with ϕ always higher than 0.75, the maximum value (0.78) is obtained by the simulation run with ε = 0.93, demonstrating that it better reflects the actual field. The MAGFLOW simulation run with ε = 0.93 also reaches the closest flow length (6.5 versus 6.4 km), which is the most critical factor for hazard analysis.
5. Discussion
The land surface temperature derivation and the estimation of eruption rates from spaceborne data rely on assumptions of lava flow emissivity. The majority of research on emissivity to date has been carried out on solid lava at ambient temperatures [14], and it is anticipated that under certain conditions, target radiation emission in the TIR region of the electromagnetic spectrum is inversely proportional to its reflectance [45]. However, there are several drawbacks in using reflectance to derive emissivity values, as the temperature of the sample is not taken into account, and its spatial variation is not recorded. Nonetheless, reflectance data (1-R) can be used to provide a first approximation estimate in the absence of ‘true emissivity’ information.
The ‘apparent’ emissivity data for the 2001 Mount Etna eruption, which was derived from reflectance data at ambient temperature, is comparable to that of the low-temperature (400 K) emission FTIR data (‘true’ emissivity), with a range/error of emissivity ≤0.03, which is consistent with previous research on basaltic rock spectral signatures [25]. A certain amount of spectral contrast is observed and can be attributed to the instrument’s sensitivity and/or the methodology used, which has been acknowledged in previous research [46].
The spaceborne ASTER GED mean emissivity data obtained for the same target area was also relatively consistent with our FTIR results at ambient/low temperatures, producing an emissivity range/error of ≤0.03. However, using this satellite-based approach, incorrect emissivity as an input could result in an error in retrieving lava flow surface temperatures, which will have an inherent impact on the computation of the radiant flux, estimates of the mass eruption rate, and lava flow ‘distance-to-run’ forecasts. Our 5 August 2001 example for the ETM+ satellite scene was used to compute radiant flux show variances in the calculated eruption rate, which has an impact of ~300 m in derived ‘distance-to-run’ between the emissivity end members (0.8 and 1.0). Similarly, a simple emissivity assessment using numerical forward modeler (MAGFLOW) by means of varying its value (i.e., 0.80, 0.93, and 1.0) showed that emissivity has an impact on simulated lava flow ‘distance-to-run’ results of up to ~600 m between the emissivity end-members (0.8 and 1.0).
The computation of term in [3] using spaceborne data also involves convection () and conduction () of the flow. It has been argued that for flows that are not crusted over, is much larger than and . However, in case of flows with crusts, can have as large a heat loss effect as [47]. Etnean ‘aa’ lava flows, which have been discussed here, have crusts and very rough surfaces as they advance away from their vents and channels; thus, their heat transfer through convection can be as large as that of radiation for the medial and distal parts of the flow. Since the crust may act as an insulator, it limits convection and radiation by the amount of heat conducted from the flow through the crust to the outer surface. This effect may be considered as the most likely contributor to the longer flow lengths. Therefore, emissivity variation may indicate flow phase changes by insulation, allowing it to flow father than a simple effusion rate model would predict. Thus, a model that includes all of the thermal components may be able to account for changes in the thermal conditions (and rheology of the flow). Similarly, if emissivity variation is considered when producing the best dual-band solution using the multi-component approach [48] from spaceborne data, it should also involve applying several different emissivities within a single pixel.
The emissivity variation may also be seen as a proxy for crusting the lava flow, which will insulate the flow, allowing it to flow for longer, and thus further. This approach may provide a means of identifying changes in the insulation properties of an active lava flow by using apparent emissivity. Therefore, it can be argued that a change in the apparent emissivity of the surface of the flow does have an indirect effect on the ‘distance-to-run’.
The emissivity data derived from reflectance, low-temperature emission FTIR analyses and/or ASTER GED provide ‘static’ emissivity values, which may be related to the solidified (cooled) product. However, the high-temperature thermal anomaly observed on Mount Etna has an extrusion temperature of ~1360 K, so there is a need to account for emissivity changes with temperature, as evident from our high-temperature FTIR results. This is consistent with several thermal emission studies of silicate glasses and basaltic lavas, which suggest that the emissivity of molten material is significantly lower than that of the same material in a solid state [49]. Therefore, our preliminary results from high-temperature data imply that it is essential to expand this study to assess the role and significance of emissivity, not only as a ‘static’ and uniform value across all wavelengths and temperatures, but also taking its response to thermal gradient into account. This will determine the emissivity variation with temperature change, and will provoke further investigation into the role and impact of emissivity in lava flow dynamic modeling and hazard mitigation.
6. Conclusions
Our reflectance and emission FTIR results at ambient/low temperature indicate that emissivity is wavelength-dependent. Both laboratory (FTIR) and spaceborne (ASTER GED) data correspond well for the same target area, and show good correlation at specific TIR wavelengths by exhibiting an emissivity range/error of 0.03. However, this emissivity information is ‘static’, relating to the solidified (cooled) product, not reflecting the range of temperatures involved at an active lava flow or the emissivity/temperature trend seen in our high-temperature FTIR results. Furthermore, the theoretical empirical approaches and modeling used in this study indicate that a variation of 0.2 in emissivity may result in significant changes to the prediction of lava flow ‘distance-to-run’ estimates.
A reliable and exploitable predictive emissivity trend is needed for both modeling and spaceborne applications for a range of temperatures and wavelengths to improve our understanding of the variation of emissivity with temperature. Further, a better understanding of the impact of emissivity on deduced temperature during active lava flow propagation (and cooling) is needed to improve spaceborne data interpretation, which relies on emissivity as an input in computations of lava surface temperatures, radiant fluxes, and ultimately lava flow length estimations.
Author Contributions
F.F. and N.R. led the conception and design of the work. N.R. and A.C. acquired the data. N.R., A.C., F.F. were responsible for analysis, modelling and interpretation of data. All authors participated in drafting and revising the article and have given final approval of the submitted and revised versions.
Funding
This research (and the APC) was fully funded by the Open University, Milton Keynes, U.K.
Acknowledgments
This project and manuscript were improved through invaluable guidance and support of the Open University, School of Environment, Earth and Ecosystem Sciences, Milton Keynes, U.K. (H. Rymer and S. Blake). The authors are grateful to the Natural Environment Research Council (NERC) Field Spectroscopy Facility, University of Edinburgh, U.K. (C. MacLellan and A. Gray) and Clarendon Laboratory, University of Oxford, U.K. (N. Bowles) for accommodating preliminary FTIR pilot studies. Special thanks to the DLR, Institute of Planetary Research, Planetary Emissivity Laboratory, Berlin, Germany (A. Maturilli) for accommodating FTIR measurements and helpful discussions. MAGFLOW simulations were performed within the framework of Tecnolab, the Laboratory for Technological Advance in Volcano Geophysics of the INGV in Catania, Italy. The editor Arlene Cui and the three anonymous reviewers are acknowledged for their constructive and supportive comments, which helped improve this manuscript.
Conflicts of Interest
The authors declare no conflict of interest. The funders had no role in the design of the study; in the collection, analyses, or interpretation of data; in the writing of the manuscript, or in the decision to publish the results.
References
- Garel, F.; Kaminski, E.; Tait, S.; Limare, A. An experimental study of the surface thermal signature of hot subaerial isoviscous gravity currents: Implications for thermal monitoring of lava flows and domes. J. Geophys. Res. Solid Earth 2012, 117, B02205. [Google Scholar] [CrossRef]
- Vicari, A.; Alexis, H.; Del Negro, C.; Coltelli, M.; Marsella, M.; Proietti, C. Modeling of the 2001 lava flow at Etna volcano by a Cellular Automata approach. Environ. Model. Softw. 2007, 22, 1465–1471. [Google Scholar] [CrossRef] [Green Version]
- McGuire, W.J.; Kilburn, C.R.J.; Murray, J.B. Monitoring Active Volcanoes: Strategies, Procedures, Techniques; University of London Press: London, UK, 1995; p. 421. [Google Scholar]
- Harris, A.J.L. Thermal Remote Sensing of Active Volcanoes: A User’s Manual; Cambridge University Press: Cambridge, UK, 2013; p. 736. [Google Scholar]
- Ramsey, M.S.; Fink, J.H. Estimating silicic lava vesicularity with thermal remote sensing: A new technique for volcanic mapping and monitoring. Bull. Volcanol. 1999, 61, 32–39. [Google Scholar] [CrossRef]
- Ball, M.; Pinkerton, H. Factors affecting the accuracy of thermal imaging cameras in volcanology. J. Geophys. Res. Solid Earth 2006, 111, B11203. [Google Scholar] [CrossRef]
- Higgins, J.; Harris, A. VAST: A program to locate and analyse volcanic thermal anomalies automatically from remotely sensed data. Comput. Geosci. 1997, 23, 627–645. [Google Scholar] [CrossRef]
- Wright, R.; Flynn, L.; Garbeil, H.; Harris, A.; Pilger, E. Automated volcanic eruption detection using MODIS. Remote Sens. Environ. 2002, 82, 135–155. [Google Scholar] [CrossRef] [Green Version]
- Wright, R.; Flynn, L.P.; Garbeil, H.; Harris, A.J.; Pilger, E. MODVOLC: Near-real-time thermal monitoring of global volcanism. J. Volcanol. Geotherm. Res. 2004, 135, 29–49. [Google Scholar] [CrossRef]
- Di Bello, G.; Filizzola, C.; Lacava, T.; Marchese, F.; Pergola, N.; Pietrapertosa, C.; Piscitelli, S.; Scaffidi, I.; Tramutoli, V. Robust satellite techniques for volcanicand seismic hazards monitoring. Ann. Geophys. 2004, 47. [Google Scholar] [CrossRef]
- Hirn, B.R.; Di Bartola, C.; Laneve, G.; Cadau, E.; Ferrucci, F. SEVIRI Onboard Meteosat Second Generation, and the Quantitative Monitoring of Effusive Volcanoes in Europe and Africa. In Proceedings of the IGARSS 2008, 2008 IEEE International Geoscience and Remote Sensing Symposium, Boston, MA, USA, 7–11 July 2008; pp. 374–377. [Google Scholar]
- Wooster, M.J.; Rothery, D.A. Time-series analysis of effusive volcanic activity using the ERS along track scanning radiometer: The 1995 eruption of Fernandina volcano, Galápagos Islands. Remote Sens. Environ. 1997, 62, 109–117. [Google Scholar] [CrossRef]
- Coppola, D.; Macedo, O.; Ramos, D.; Finizola, A.; Delle Donne, D.; Del Carpio, J.; White, R.; McCausland, W.; Centeno, R.; Rivera, M.; et al. Magma extrusion during the Ubinas 2013–2014 eruptive crisis based on satellite thermal imaging (MIROVA) and ground-based monitoring. J. Volcanol. Geotherm. Res. 2015, 302, 199–210. [Google Scholar] [CrossRef] [Green Version]
- Harris, A.J.L. Thermal remote sensing of active volcanism: Principles. In Thermal Remote Sensing of Active Volcanoes: A User’s Manual; Cambridge University Press: Cambridge, UK, 2013; pp. 70–112. [Google Scholar]
- Rothery, D.A.; Francis, P.W.; Wood, C.A. Volcano monitoring using short wavelength infrared data from satellites. J. Geophys. Res. 1988, 93, 7993–8008. [Google Scholar] [CrossRef]
- Harris, A.J.; Butterworth, A.L.; Carlton, R.W.; Downey, I.; Miller, P.; Navarro, P.; Rothery, D.A. Low- cost volcano surveillance from space: Case studies from Etna, Krafla, Cerro Negro, Fogo, Lascar and Erebus. Bull. Volcanol. 1997, 59, 49–64. [Google Scholar] [CrossRef]
- Coltelli, M.; Proietti, C.; Branca, S.; Marsella, M.; Andronico, D.; Lodato, L. Analysis of the 2001 lava flow eruption of Mt. Etna from three-dimensional mapping. J. Geophys. Res. Earth Surf. 2007, 112, F02029. [Google Scholar] [CrossRef]
- Tarquini, S.; Isola, I.; Favalli, M.; Mazzarini, F.; Bisson, M.; Pareschi, M.T.; Boschi, E. TINITALY/01: A new triangular irregular network of Italy. Ann. Geophys. 2007, 50, 407–425. [Google Scholar]
- Maturilli, A.; Helbert, J.; D’Amore, M.; Varatharajan, I.; Ortiz, Y.R. The Planetary Spectroscopy Laboratory (PSL): Wide spectral range, wider sample temperature range. In Proceedings of the SPIE 10765: Infrared Remote Sensing and Instrumentation, San Diego, CA, USA, 18 September 2018. [Google Scholar]
- Korb, A.R.; Salisbury, J.W.; Aria, D.M. Thermal-infrared remote sensing and Kirchhoff’s law 2. Field measurements. J. Geophys. Res. Solid Earth 1999, 104, 15339–15350. [Google Scholar] [CrossRef]
- Maturilli, A.; Helbert, J.; Witzke, A.; Moroz, L. Emissivity measurements of analogue materials for the interpretation of data from PFS on Mars Express and MERTIS on Bepi-Colombo. Planet. Space Sci. 2006, 54, 1057–1064. [Google Scholar] [CrossRef]
- NASA; JPL. ASTER Global Emissivity Dataset 100-meter HDF5[37/38/39.012-0-15.0001]; NASA EOSDIS Land Processes DAAC: Sioux Falls, SD, USA, 2014.
- Hulley, G.C.; Hook, S.J.; Abbott, E.; Malakar, N.; Islam, T.; Abrams, M. The ASTER Global Emissivity Dataset (ASTER GED): Mapping Earth’s emissivity at 100 meter spatial scale. Geophys. Res. Lett. 2015, 42, 7966–7976. [Google Scholar] [CrossRef]
- NASA; JPL. LP DAAC: Land Processes Distributed Active Archive Center. 2014. Available online: https://lpdaac.usgs.gov/dataset_discovery/community/community_products_table/ag100_v003 (accessed on 1 June 2018).
- Wyatt, M.B.; Hamilton, V.E.; McSween, H.Y.; Christensen, P.R.; Taylor, L.A. Analysis of terrestrial and Martian volcanic compositions using thermal emission spectroscopy: 1. Determination of mineralogy, chemistry, and classification strategies. J. Geophys. Res. 2001, 106, 14711–14732. [Google Scholar] [CrossRef] [Green Version]
- Hirn, B.; Di Bartola, C.; Ferrucci, F. Spaceborne monitoring 2000-2005 of the Pu’u ‘O’o-Kupaianaha (Hawaii) eruption by synergetic merge of multispectral payloads ASTER and MODIS. IEEE Trans. Geosci. Remote Sens. 2008, 46, 2848–2856. [Google Scholar] [CrossRef]
- Barsi, J.A.; Barker, J.L.; Schott, J.R. An Atmospheric Correction Parameter Calculator for a single thermal band earth-sensing instrument. In Proceedings of the IGARSS 2003, 2003 IEEE International Geoscience and Remote Sensing Symposium, Toulouse, France, 21–25 July 2003; pp. 3014–3016. [Google Scholar]
- Barsi, J.A.; Barker, J.L.; Schott, J.R. Atmospheric Correction Parameter Calculator. 2003 IGARSS03. Available online: https://atmcorr.gsfc.nasa.gov/ (accessed on 1 June 2018).
- Pieri, D.C.; Baloga, S.M. Eruption rate area, and length relationships for some Hawaiian lava flows. J. Volcanol. Geotherm. Res. 1986, 30, 29–45. [Google Scholar] [CrossRef]
- Wright, R.; Blake, S.; Harris, A.J.; Rothery, D.A. A simple explanation for the space-based calculation of lava eruption rates. Earth Planet. Sci. Lett. 2001, 192, 223–233. [Google Scholar] [CrossRef]
- Harris, A.J.L.; Murray, J.B.; Aries, S.E.; Davies, M.A.; Flynn, L.P.; Wooster, M.J.; Wright, R.; Rothery, D.A. Effusion rate trends at Etna and Krafla and their implications for eruptive mechanisms. J. Volcanol. Geotherm. Res. 2000, 102, 237–269. [Google Scholar] [CrossRef]
- Harris, A.; Dehn, J.; Calvari, S. Lava effusion rate definition and measurement: A review. Bull. Volcanol. 2007, 70, 1–22. [Google Scholar] [CrossRef]
- Kilburn, C.R.J.; Pinkerton, H.; Wilson, L. Forecasting the behaviour of lava flows. In Monitoring Active Volcanoes; McGuire, W.J., Kilburn, C.R.J., Murray, J., Eds.; UCL Press: Londin, UK, 1995; pp. 346–368. [Google Scholar]
- Kilburn, C.R.J.; Ballard, R.D. Lava Flows and Flow Fields; Sigurdsson, H., Ed.; Academic Press: San Diego, CA, USA, 2000; pp. 291–305. [Google Scholar]
- Herault, A.; Vicari, A.; Ciraudo, A.; Del Negro, C. Forecasting lava flow hazards during the 2006 Etna eruption: Using the MAGFLOW cellular automata model. Comput. Geosci. 2009, 35, 1050–1060. [Google Scholar] [CrossRef]
- Cappello, A.; Hérault, A.; Bilotta, G.; Ganci, G.; Del Negro, C. MAGFLOW: A physics-based model for the dynamics of lava-flow emplacement. Geol. Soc. Spec. Publ. 2016, 426, 357–373. [Google Scholar] [CrossRef]
- Kereszturi, G.; Cappello, A.; Ganci, G.; Procter, J.; Németh, K.; Del Negro, C.; Cronin, S.J. Numerical simulation of basaltic lava flows in the Auckland Volcanic Field, New Zealand—Implication for volcanic hazard assessment. Bull. Volcanol. 2014, 76, 1–17. [Google Scholar] [CrossRef]
- Del Negro, C.; Cappello, A.; Neri, M.; Bilotta, G.; Hérault, A.; Ganci, G. Lava flow hazards at Mount Etna: Constraints imposed by eruptive history and numerical simulations. Sci. Rep. 2013, 3, 3493. [Google Scholar] [CrossRef]
- Cappello, A.; Geshi, N.; Neri, M.; Del Negro, C. Lava flow hazards—An impending threat at Miyakejima volcano, Japan. J. Volcanol. Geotherm. Res. 2015, 308, 1–9. [Google Scholar] [CrossRef]
- Cappello, A.; Zanon, V.; Del Negro, C.; Ferreira, T.J.; Queiroz, M.G. Exploring lava-flow hazards at Pico Island, Azores Archipelago (Portugal). Terra Nova 2015, 27, 156. [Google Scholar] [CrossRef]
- Pedrazzi, D.; Cappello, A.; Zanon, V.; Del Negro, C. Impact of effusive eruptions from the Eguas–Carvão fissure system, São Miguel Island, Azores Archipelago (Portugal). J. Volcanol. Geotherm. Res. 2015, 291, 1–13. [Google Scholar] [CrossRef] [Green Version]
- Cappello, A.; Ganci, G.; Calvari, S.; Pérez, N.M.; Hernández, P.A.; Silva, S.V.; Cabral, J.; Del Negro, C. Lava flow hazard modeling during the 2014–2015 Fogo eruption, Cape Verde. J. Geophys. Res. Solid Earth 2016, 121, 2290–2303. [Google Scholar] [CrossRef]
- Bilotta, G.; Cappello, A.; Hérault, A.; Vicari, A.; Russo, G.; Del Negro, C. Sensitivity analysis of the MAGFLOW Cellular Automaton model for lava flow simulation. Environ. Model. Softw. 2012, 35, 122–131. [Google Scholar] [CrossRef]
- Bilotta, G.; Cappello, A.; Hérault, A.; Del Negro, C. Influence of topographic data uncertainties and model resolution on the numerical simulation of lava flows. Environ. Model. Softw. 2019, 112, 1–15. [Google Scholar] [CrossRef]
- Rolim, S.B.A.; Grondona, A.; HACKMANN, C.; Rocha, C. A Review of Temperature and Emissivity Retrieval Methods: Applications and Restrictions. Am. J. Environ. Eng. 2016, 6, 119–128. [Google Scholar]
- Sabol, D.E., Jr.; Gillespie, A.R.; Abbott, E.; Yamada, G. Field validation of the ASTER Temperature– Emissivity Separation algorithm. Remote Sens. Environ. 2009, 113, 2328–2344. [Google Scholar] [CrossRef]
- Patrick, M.R.; Dehn, J.; Dean, K. Numerical modeling of lava flow cooling applied to the 1997 Okmok eruption: Approach and analysis. J. Geophys. Res. Solid Earth 2004, 109, B03202. [Google Scholar] [CrossRef]
- Wright, R.; Flynn, L.P. On the retrieval of lava-flow surface temperatures from infrared satellite data. Geology 2003, 31, 893–896. [Google Scholar] [CrossRef]
- Lee, R.J.; Ramsey, M.S.; King, P.L. Development of a new laboratory technique for high-temperature thermal emission spectroscopy of silicate melts. J. Geophys. Res. Solid Earth 2013, 118, 1968–1983. [Google Scholar] [CrossRef] [Green Version]
Figure 1.
(a) A geological map of Italy and the location of Mount Etna [18]; (b) Derived silica versus alkalis, superimposed on the chemical classification scheme for NRE.4S; (c) The 2001 eruption lava flow margins are highlighted in red and superimposed on the target area in Google Earth. Eruptive fissures are marked in yellow, scoria cones in light blue (after [17]) and within the individual flow study area (LFS1), the approximate sample locations are indicated by the star symbol.

Figure 2.
‘Apparent’ emissivity () spectral signatures measured and derived from reflectance Fourier transform infrared (FTIR) data (1-R) at ambient temperature for NRE.4S.
Figure 2.
‘Apparent’ emissivity () spectral signatures measured and derived from reflectance Fourier transform infrared (FTIR) data (1-R) at ambient temperature for NRE.4S.
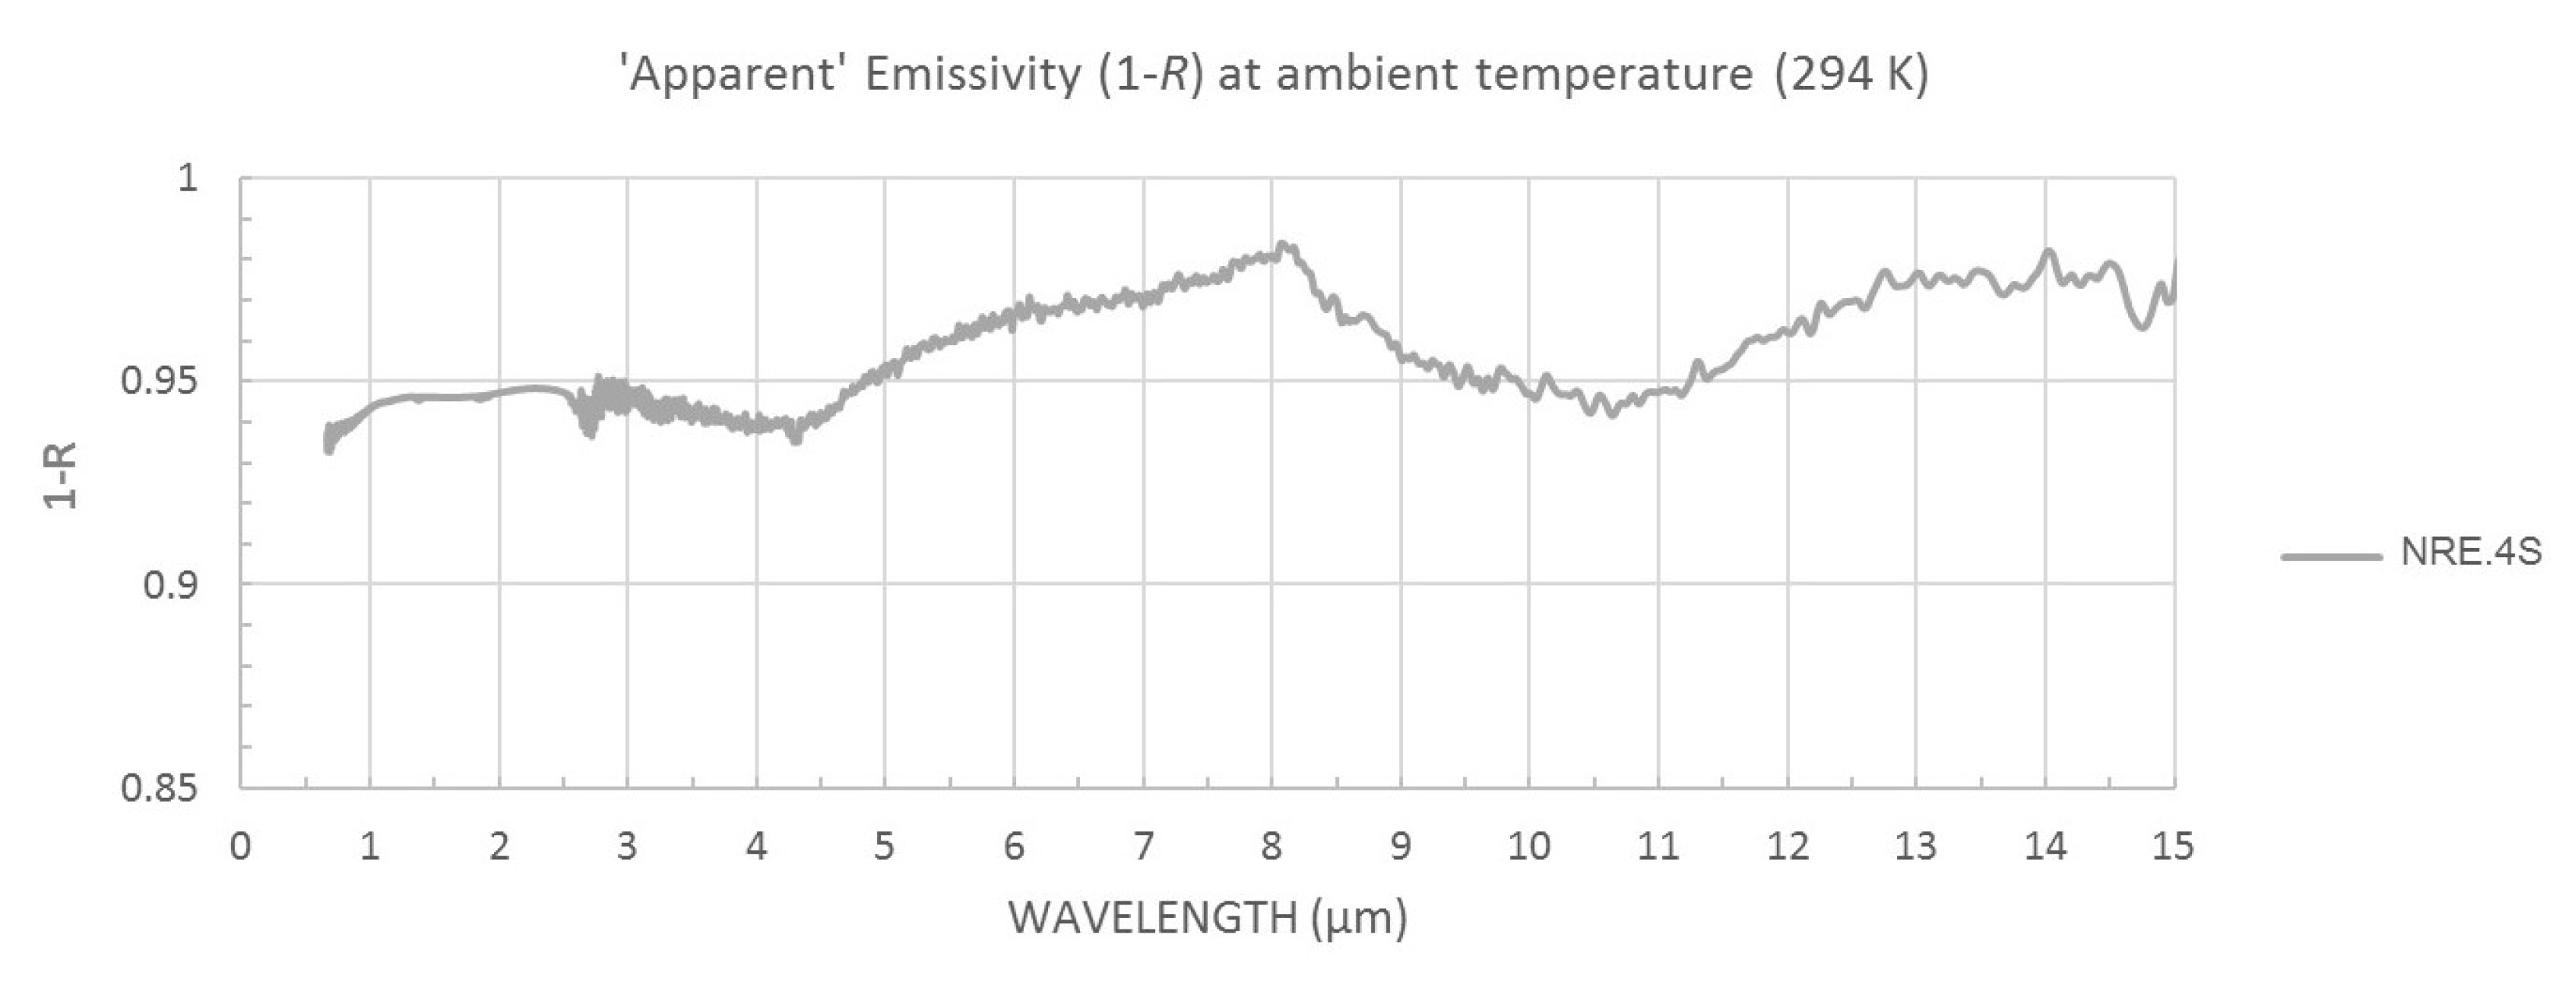
Figure 3.
(a) ‘True’ emissivity () spectral signatures at 400 K using thermal emission FTIR for NRE.4S; and (b) ‘true’ emissivity () spectral signature variation with temperature change between 400–900 K.
Figure 3.
(a) ‘True’ emissivity () spectral signatures at 400 K using thermal emission FTIR for NRE.4S; and (b) ‘true’ emissivity () spectral signature variation with temperature change between 400–900 K.

Figure 4.
(Map) ASTER Global Emissivity Database (ASTER GED) over Sicily, Italy at 100-m pixel resolution at 10.60 μm and 4-3-1 band red–green–blue (RGB) view. The color ramp indicates the mean emissivity values (0.8–1.0). Inset shows samples’ pixel locations for NRE.4S. Emissivity spectral profile plot and the table show emissivity variation with wavelength, extracted from ASTER GED for NRE.4S.

Figure 5.
(a) ASTER GED mean emissivity values (black squares) plotted at ASTER TIR bands for NRE.4S; (b) ASTER GED mean emissivity values (black squares) compared to the ‘apparent’ (1-R) emissivity (grey triangles) and ‘true’ low-temperature (400 K) emissivity data (empty circles) for NRE.4S; (c,d) ASTER GED mean emissivity (static) for NRE.4S (black square) at 10.60 μm and 11.30 μm (ASTER TIR bands 4 and 5 respectively), superimposed on the emissivity/temperature trend 400–900 K (empty circles). Error bars represent maximum emissivity difference between NRE.4S samples measured.
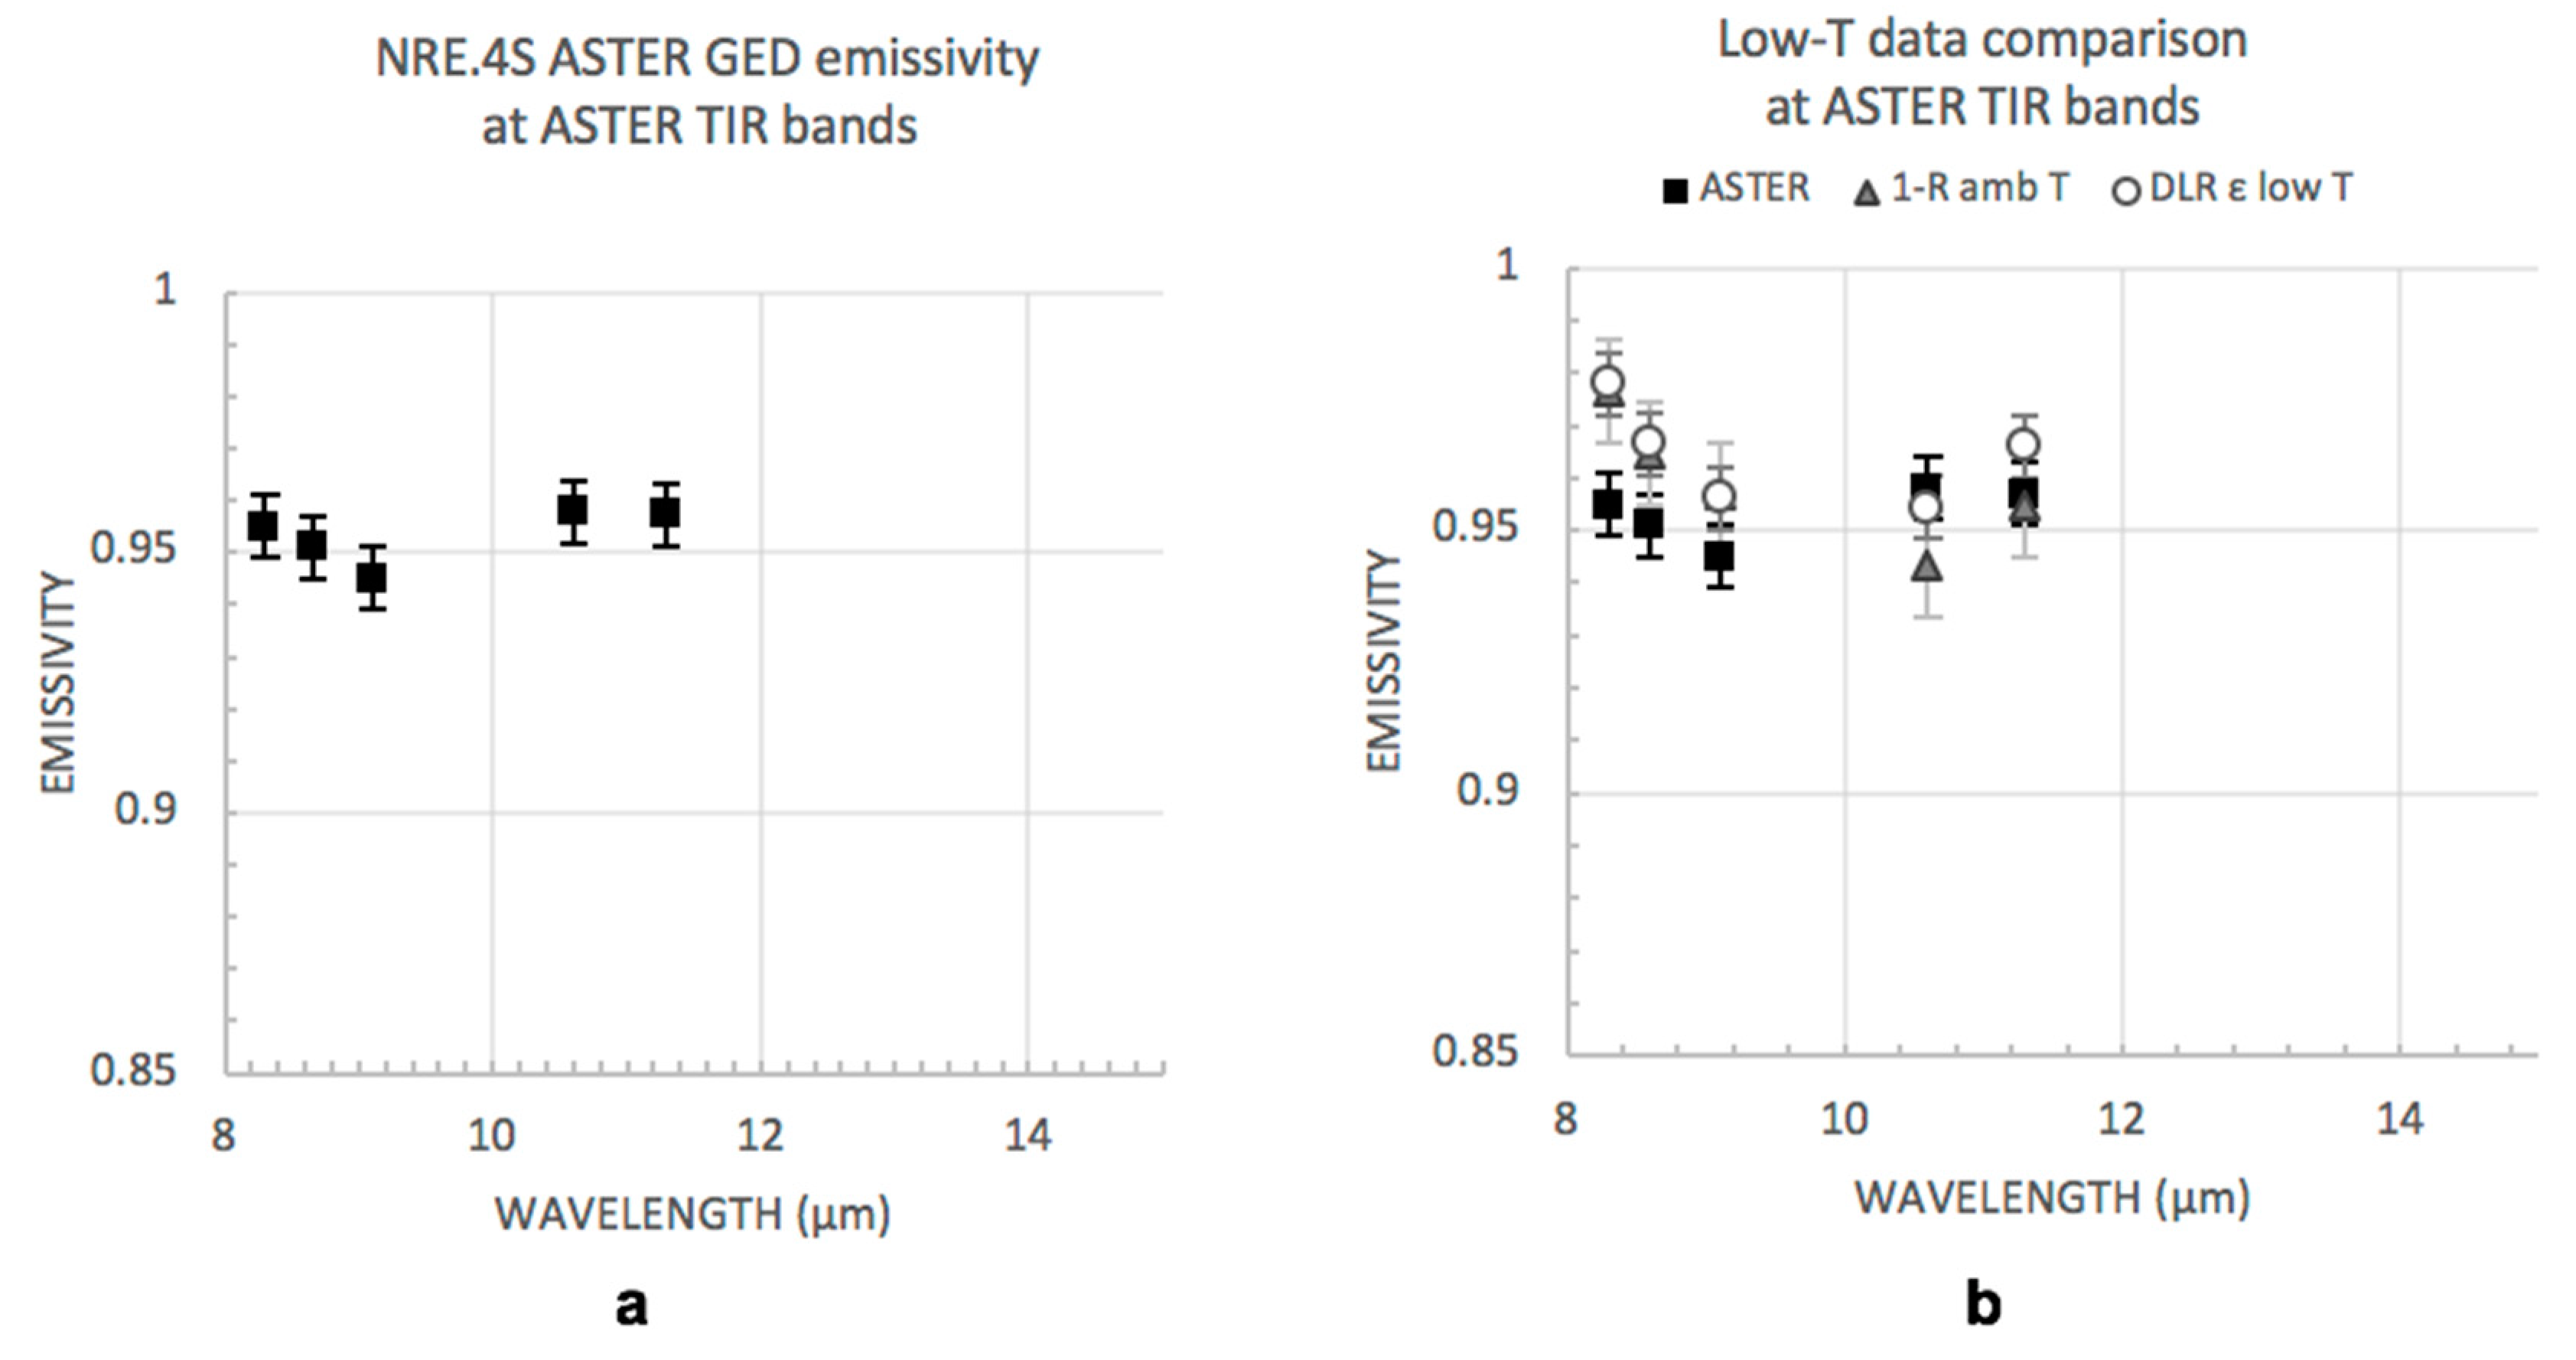

Figure 6.
(a) Mount Etna high-temperature thermal anomaly scene acquired on 5 August 2001 by Landsat 7 (ETM+); (b–d) are all radiant pixel integrated temperatures of the same target area as in (a) TIR Band 6 and SWIR bands 7 and 5 for emissivity of 1.0; The green square in (b–d) marks the location of the pixel (3739′28″N 1459′48″E) used to derive temperature with emissivity variation given below (b–d).

Figure 7.
ETM+ scene obtained on 5 August 2001 highlighting the high-temperature thermal anomaly, focusing on an individual LFS1 flow analyzed in this study and detailing a flow chart of procedures followed to obtain the maximum lengths that LFS1 lava flow can reach using the empirical approach [33,34]. The table shows the difference in results using various emissivity values (0.80, 0.93, and 1.0).
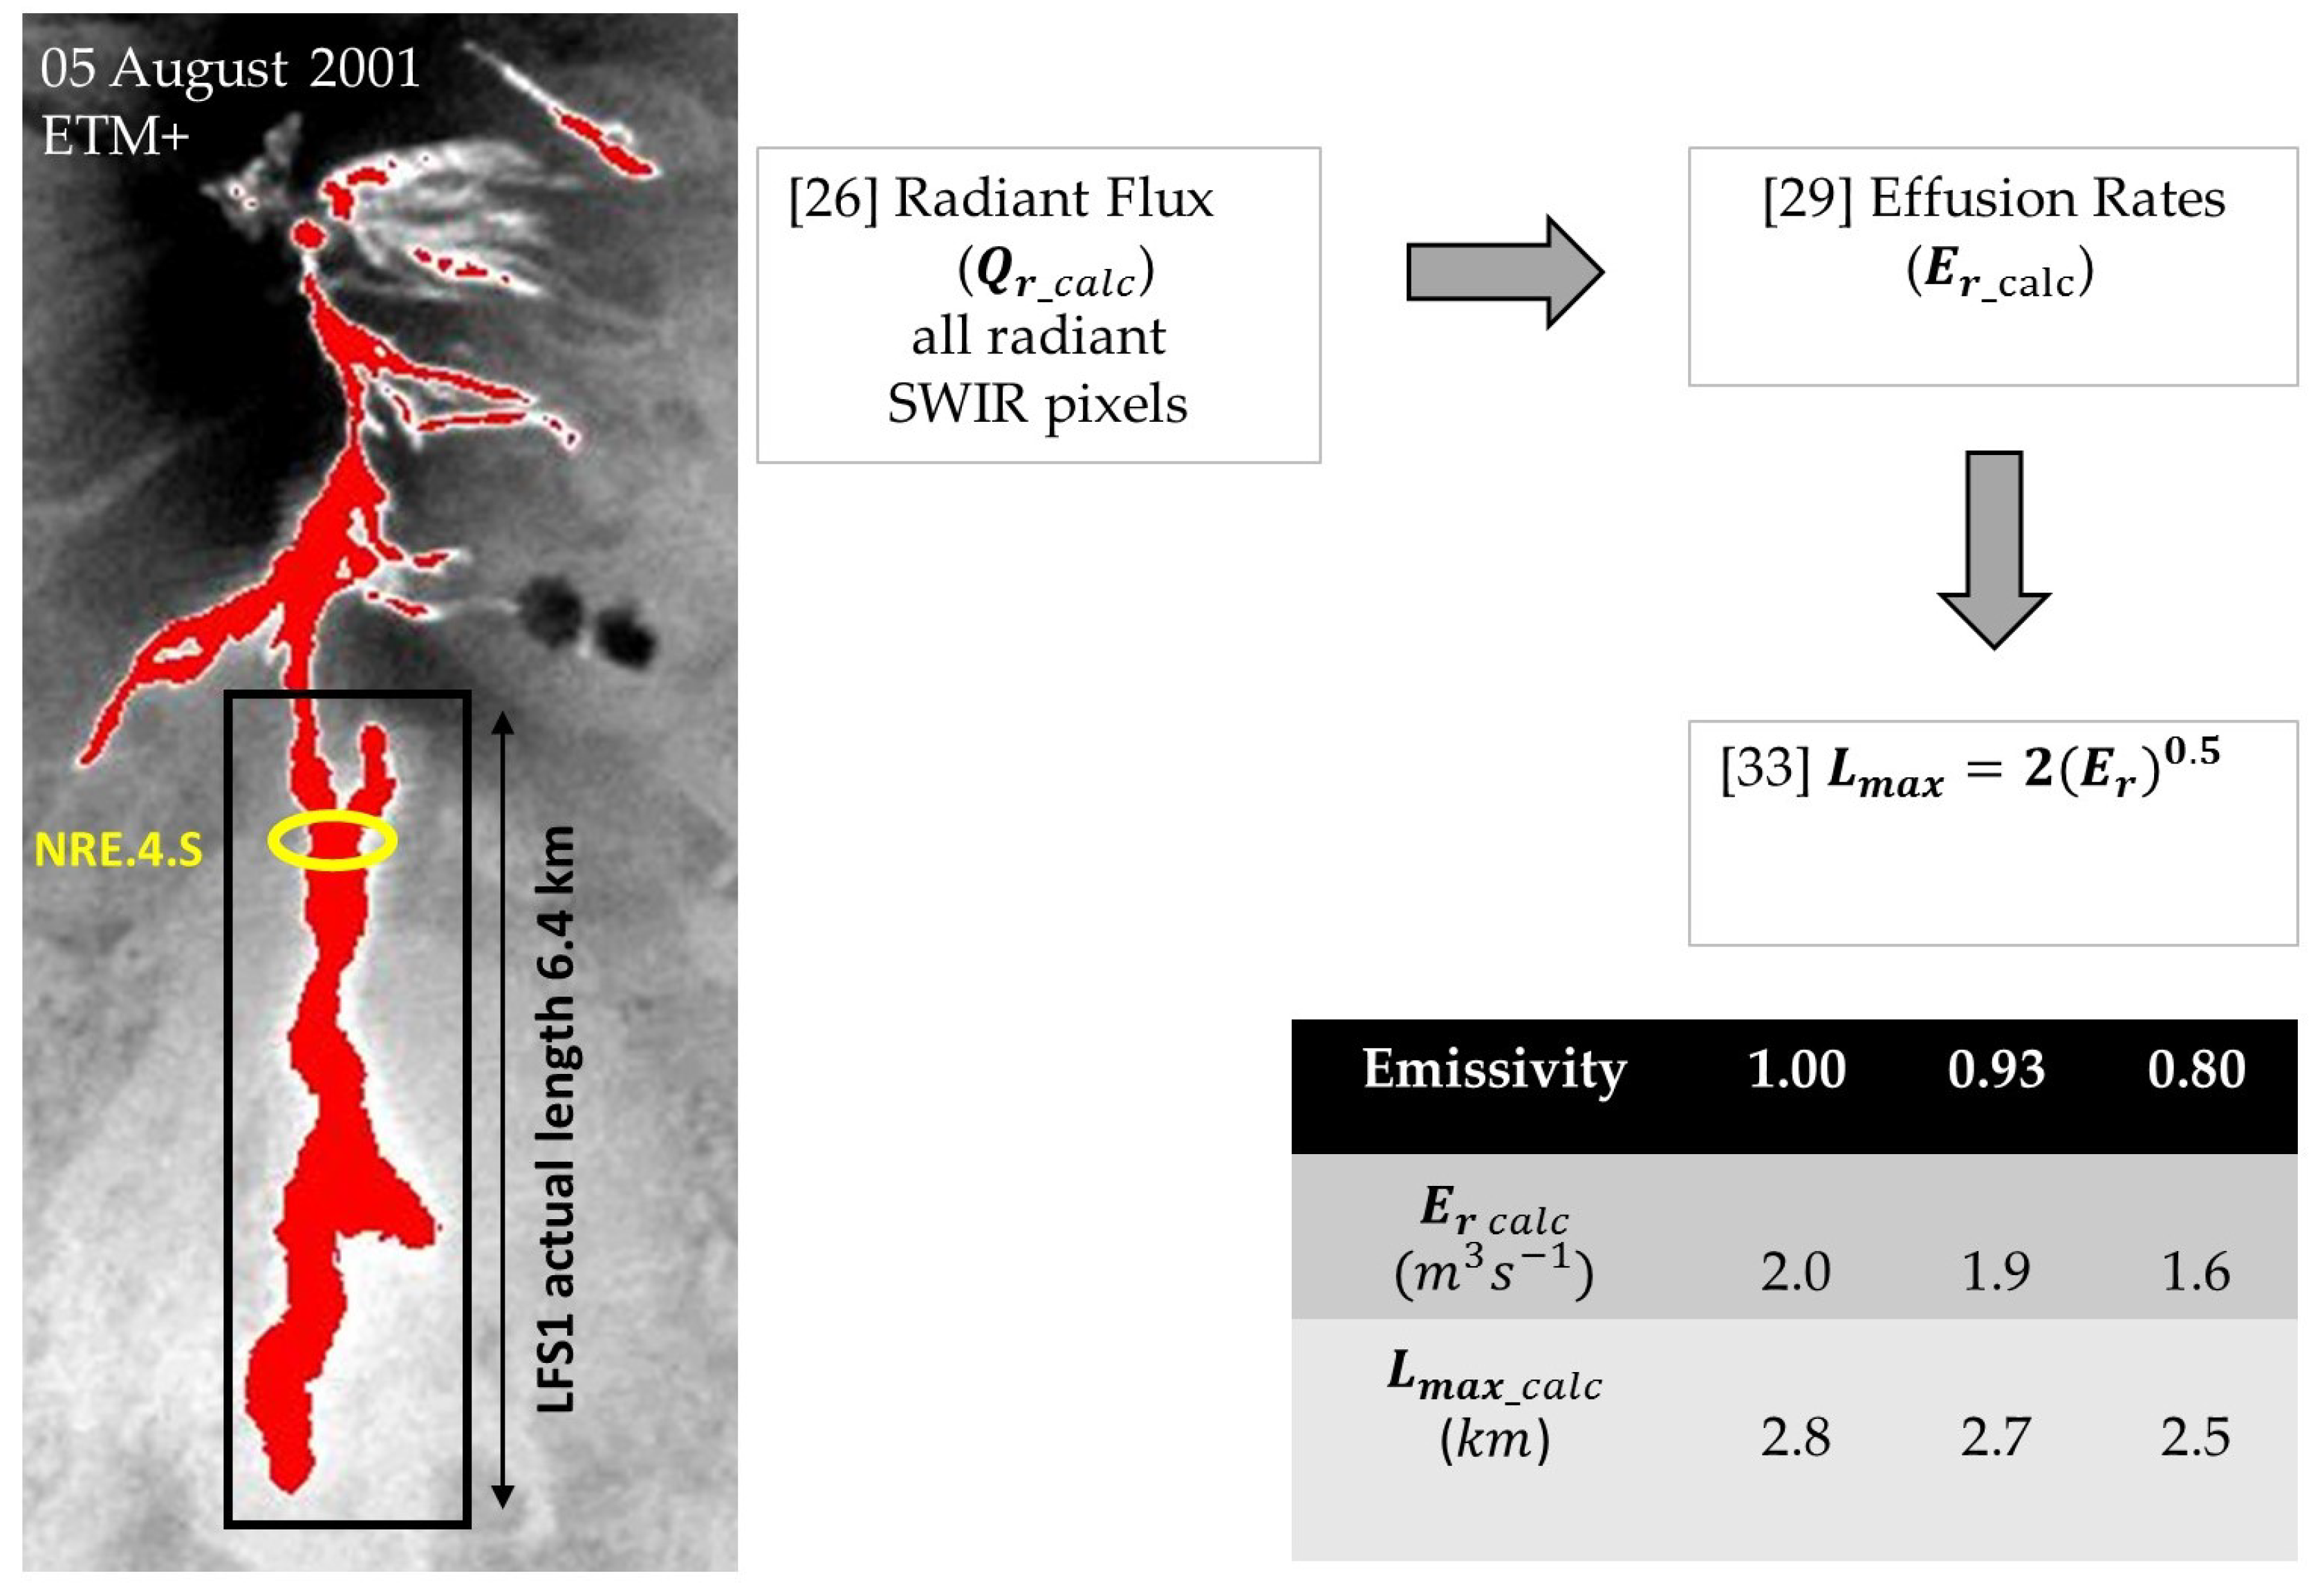
Figure 8.
MAGFLOW simulation results with changing emissivity (i.e., 0.80, 0.93, and 1.00), showing a difference of up to 600 m in lava flow length.
Figure 8.
MAGFLOW simulation results with changing emissivity (i.e., 0.80, 0.93, and 1.00), showing a difference of up to 600 m in lava flow length.


Table 1.
X-Ray Fluorescence major elements content, as a component oxide weight percent (wt%).
| MnO | MgO | CaO | LOl | Total | ||||||||
|---|---|---|---|---|---|---|---|---|---|---|---|---|
| 48.15 | 1.53 | 16.49 | 11.19 | 0.17 | 5.71 | 10.49 | 3.52 | 1.70 | 0.53 | 0.005 | −0.30 | 99.18 |
Table 2.
Volumes and effusion rates for the LFS1 2001 Mount Etna eruption (from [17]).
Table 2.
Volumes and effusion rates for the LFS1 2001 Mount Etna eruption (from [17]).
| Acquisition Date | Local Time | Eruption Day | Acquisition Time (s) | Cumulative Volume | Time Span (s) | Partial Volume | Daily Effusion Rate |
|---|---|---|---|---|---|---|---|
| 18/07/2001 | 03:00 | 0 | 0 | 0.00 | 0 | 0.00 | 0.00 |
| 18/07/2001 | 13:00 | 1 | 36,000 | 0.37 | 36,000 | 0.37 | 10.28 |
| 19/07/2001 | 16:00 | 2 | 133,200 | 1.70 | 97,200 | 1.33 | 13.68 |
| 20/07/2001 | 13:00 | 3 | 208,800 | 3.50 | 75,600 | 1.80 | 22.81 |
| 22/07/2001 | 11:00 | 5 | 374,400 | 8.58 | 165,600 | 5.08 | 30.68 |
| 26/07/2001 | 12:00 | 9 | 723,600 | 14.98 | 349,200 | 6.40 | 18.33 |
| 28/07/2001 | 16:00 | 11 | 910,800 | 16.99 | 187,200 | 2.01 | 10.74 |
| 30/07/2001 | 11:00 | 13 | 1,065,600 | 18.35 | 154,800 | 1.37 | 8.85 |
| 02/08/2001 | 10:00 | 16 | 1,321,200 | 19.82 | 255,600 | 1.47 | 5.75 |
| 04/08/2001 | 07:00 | 18 | 1,483,200 | 20.62 | 162,000 | 0.80 | 4.94 |
| 06/08/2001 | 11:00 | 20 | 1,670,400 | 21.21 | 187,200 | 0.59 | 3.15 |
| 07/08/2001 | 07:00 | 21 | 1,742,400 | 21.32 | 72,000 | 0.11 | 1.53 |
| 09/08/2001 | 10:00 | 23 | 1,926,000 | 21.40 | 183,600 | 0.08 | 0.44 |
Table 3.
Comparison between the morphological properties (length, area, and average thickness) of the 2001 Etna lava flow derived by field measurements [17] and numerical simulations.
Table 3.
Comparison between the morphological properties (length, area, and average thickness) of the 2001 Etna lava flow derived by field measurements [17] and numerical simulations.
| Length [km] | Area [km2] | Average Thickness [m] | Fitness [ϕ] | |
|---|---|---|---|---|
| Actual lava flow | 6.4 | 1.95 | 11 | - |
| Simulation with ε = 0.8 | 6.9 | 1.94 | 12.4 | 0.76 |
| Simulation with ε = 0.93 | 6.5 | 1.83 | 13.1 | 0.78 |
| Simulation with ε = 1.0 | 6.3 | 1.78 | 13.5 | 0.77 |
© 2019 by the authors. Licensee MDPI, Basel, Switzerland. This article is an open access article distributed under the terms and conditions of the Creative Commons Attribution (CC BY) license (http://creativecommons.org/licenses/by/4.0/).
Share and Cite
MDPI and ACS Style
Rogic, N.; Cappello, A.; Ferrucci, F. Role of Emissivity in Lava Flow ‘Distance-to-Run’ Estimates from Satellite-Based Volcano Monitoring. Remote Sens. 2019, 11, 662. https://doi.org/10.3390/rs11060662
AMA Style
Rogic N, Cappello A, Ferrucci F. Role of Emissivity in Lava Flow ‘Distance-to-Run’ Estimates from Satellite-Based Volcano Monitoring. Remote Sensing. 2019; 11(6):662. https://doi.org/10.3390/rs11060662
Chicago/Turabian StyleRogic, Nikola, Annalisa Cappello, and Fabrizio Ferrucci. 2019. "Role of Emissivity in Lava Flow ‘Distance-to-Run’ Estimates from Satellite-Based Volcano Monitoring" Remote Sensing 11, no. 6: 662. https://doi.org/10.3390/rs11060662
Note that from the first issue of 2016, this journal uses article numbers instead of page numbers. See further details here.