Article

Diurnal and Seasonal Variations in Chlorophyll Fluorescence Associated with Photosynthesis at Leaf and Canopy Scales

by
Petya K. E. Campbell
1,2,*,
Karl F. Huemmrich
1,2,
Elizabeth M. Middleton
2,
Lauren A. Ward
3,
Tommaso Julitta
4,
Craig S. T. Daughtry
5,
Andreas Burkart
4,
Andrew L. Russ
5 and
William P. Kustas
5
1
Joint Center for Earth Systems Technology (JCET), University of Maryland Baltimore County, Baltimore, MD 21228, USA
2
Biospheric Sciences Laboratory, NASA Goddard Space and Flight Center, Greenbelt, MD 20771, USA
3
Department of Earth Sciences, University of Hawai’i at Mānoa, Honolulu, HI 96822, USA
4
JB Hyperspectral Devices UG, 40225 Düsseldorf, Germany
5
USDA Agricultural Research Service, Beltsville Agricultural Research Center, Beltsville, MD 20705, USA
*
Author to whom correspondence should be addressed.
Remote Sens. 2019, 11(5), 488; https://doi.org/10.3390/rs11050488
Submission received: 29 January 2019 / Revised: 21 February 2019 / Accepted: 21 February 2019 / Published: 27 February 2019

Abstract

:
There is a critical need for sensitive remote sensing approaches to monitor the parameters governing photosynthesis, at the temporal scales relevant to their natural dynamics. The photochemical reflectance index (PRI) and chlorophyll fluorescence (F) offer a strong potential for monitoring photosynthesis at local, regional, and global scales, however the relationships between photosynthesis and solar induced F (SIF) on diurnal and seasonal scales are not fully understood. This study examines how the fine spatial and temporal scale SIF observations relate to leaf level chlorophyll fluorescence metrics (i.e., PSII yield, YII and electron transport rate, ETR), canopy gross primary productivity (GPP), and PRI. The results contribute to enhancing the understanding of how SIF can be used to monitor canopy photosynthesis. This effort captured the seasonal and diurnal variation in GPP, reflectance, F, and SIF in the O2A (SIFA) and O2B (SIFB) atmospheric bands for corn (Zea mays L.) at a study site in Greenbelt, MD. Positive linear relationships of SIF to canopy GPP and to leaf ETR were documented, corroborating published reports. Our findings demonstrate that canopy SIF metrics are able to capture the dynamics in photosynthesis at both leaf and canopy levels, and show that the relationship between GPP and SIF metrics differs depending on the light conditions (i.e., above or below saturation level for photosynthesis). The sum of SIFA and SIFB (SIFA+B), as well as the SIFA+B yield, captured the dynamics in GPP and light use efficiency, suggesting the importance of including SIFB in monitoring photosynthetic function. Further efforts are required to determine if these findings will scale successfully to airborne and satellite levels, and to document the effects of data uncertainties on the scaling.

1. Introduction

Climate change and anthropogenic activities have significantly affected agricultural and forest production by imposing novel combinations of multiple stresses, which act to alter plant function and productivity. Under favorable conditions, solar light absorbed by leaf chlorophyll (Chl) is used to drive photosynthesis through photochemistry [1]. Plant photosynthesis is a fundamental biochemical process for carbon fixation that occurs within chloroplasts, primarily in the cells of the leaf mesophyll tissue [2]. Chl is arguably the key component enabling vegetation photosynthesis, and is therefore an important indicator of plant function and productivity [3,4,5]. Chl levels vary with foliage maturity, nutrient levels, environmental conditions, light availability, and also seasonally. Thus, plants continuously regulate their photosynthetic processes in response to the changing environmental conditions on diurnal and seasonal timescales. To capture the diurnal responses and seasonal changes in plant photosynthesis, there is a critical need for temporally dense remote sensing time series to accurately monitor the key parameters governing vegetation function. Moreover, observations at relevant time scales would enable the detection of diurnal and seasonal changes in plant condition that may otherwise be overlooked.
Remote sensing approaches used to assess vegetation function over larger scales (e.g., regional to global) are commonly based on reflectance vegetation indices (VIs), and only recently on solar induced fluorescence (SIF). The normalized difference vegetation index [6] (NDVI, Table 1) is often used in agriculture and forestry to track changes in vegetation “greenness,” capturing the seasonal phenology of green biomass, from leaf unfolding to senescence. NDVI uses reflectance bands from the red and near-infrared spectral regions to detect structural changes, such as the variations in canopy closure and leaf area index (LAI) that occur with leaf growth and senescence, providing an indicator of the absorbed photosynthetically active radiation (APAR) [7]. However, NDVI is more sensitive to changes in canopy biomass or LAI and less sensitive to the changes in Chl content, and therefore less sensitive to the variations in photosynthetic function. The photochemical reflectance index (PRI), in contrast to NDVI, is able to detect subtle changes in the photosynthetic activity, primarily documented in evergreen species [7,8,9,10,11]. PRI is typically calculated as a normalized difference VI, utilizing reflectance at the 531 nm wavelength, as compared to a reference band at 570 nm. Diurnal dynamics in PRI are driven by changes in the xanthophyll cycle, associated with changing light levels and the pH of the thylakoid lumen [9,10], while responses over seasonal timescales reflect the changes in photosynthetic pigment contents (e.g., chlorophyll and carotenoids). PRI is also affected by the changes in canopy structure, leaf pigments, and the background signal [12,13], which vary significantly with season. Frequently, the VIs saturate and provide an inconsistent sensitivity to GPP across the phenology.
An approach for the remote estimation of Chl content, broadly used in precision agriculture and forestry, estimates leaf Chl content using VIs that are less sensitive to LAI, so as not to saturate under high LAI [3,4,8]. Gitelson et al. [3,4] and Peng et al. [5] investigated the use VIs as Chl surrogates for gross primary productivity (GPP, the carbon uptake by the process of photosynthesis) estimation, suggested the use of CIred (Table 1) for optimal Chl assessment, and validated canopy Chl in crops and deciduous canopies as the main seasonal driver of productivity.
Chlorophyll fluorescence offers a strong potential to assess vegetation photosynthesis at local and regional levels using Earth observation technology [13]. Chlorophyll fluorescence signals are comprised of red and far-red emissions released from the chloroplasts as a by-product of photosynthesis, which are emitted from both sides of a leaf [14,15,16]. Chlorophyll fluorescence theory and its applications for evaluation of photosynthetic function are well understood [1,3,17,18,19,20,21]. Fluorescence is driven by the available photosynthetic pigments (i.e., chlorophyll) and APAR. The fluorescence signal originates in the antennae complexes of both photosystems I and II, however, most of its contribution originates in photosystem II (PSII) [22,23]. Leaf-level chlorophyll fluorescence, measured by the pulse amplitude modulated (PAM) approach, is commonly used for evaluation of photosynthetic performance of vegetation [1,21,24], measuring leaf-level photosynthetic efficiency and the associated chlorophyll fluorescence (F) parameters. Metrics collected in the presence of sunlight include steady state F (Fs, i.e., F’) and F maximum (i.e., Fm’), which were used to derive photochemical quantum yield of PS II or the operating efficiency of PSII (YII) and electron transport rate (i.e., ETR, photochemical transport of electrons through PSII) [1,18,19,23,24], providing non-invasive means to evaluate photosynthetic activity. Since most of the regulation of photosynthesis takes place in PS II, the F signal provides a good indicator of the functional status of photosynthesis, as it is related to its light use [20,21]. While current PAM systems are capable of continuously measuring photosynthetic performance [24] on a number of plants for extended time periods (e.g., complete growing seasons), these measurements remain restricted to the leaf level.
The eddy covariance approach measures the net exchange of carbon, water, and energy between an ecosystem and the atmosphere nearly continuously, providing time series of canopy level measurements over multiple seasons and years at flux tower sites [25]. Using flux tower measurements, photosynthetic function is reliably estimated at the canopy level, and GPP can be estimated across the growing season at 30 min intervals.
Both PAM fluorimetry and the eddy covariance approach are capable of accurately tracing the diurnal and seasonal dynamics in photosynthetic function, at leaf and canopy levels, respectively. However, both approaches lack the ability for spatial extrapolation beyond the sampled leaves or sites to the larger local and regional levels. Canopy SIF has been demonstrated to be useful for studying the temporal variability of photosynthesis in relationship to environmental constraints [24,26,27,28]. Remote sensing of SIF is a research field of growing interest, with potential to provide an improved tool for monitoring plant status and photosynthetic function. Developments in airborne and space-borne remote sensing have provided opportunities to observe local, regional, and global terrestrial SIF patterns, and have attracted a considerable amount of attention within the scientific community [28,29,30,31,32,33,34,35,36,37].
Recent technology developments have enabled the continuous diurnal and seasonal measurements of SIF at the leaf and canopy level [26,28,37,38,39,40,41,42,43,44,45,46] for extended periods, using automated very high resolution (~0.2 nm) spectral systems [47,48,49,50]. Systems that are able to dynamically adjust the optimization settings with the changing light levels provide a consistent stream of comparable data capturing the SIF diurnal cycles throughout the growing season. At canopy level, the SIF signal has the potential to provide analogous information to the metrics obtained by light-adapted leaf F active PAM measurements, but cannot inform with regard to the dark-adapted metrics such as the non-photochemical quenching (NPQ) [47,51]. The relationship of fluorescence with CO2 assimilation is highly dependent on the ambient PAR levels. In general, the operating efficiency of PSII is inversely associated with CO2 assimilation, and their correlation is stronger at higher PAR levels when photosynthesis is fully activated [17,18,19,21]. There are essential differences between the leaf PAM F light-adapted and the canopy SIF methodologies, and, therefore, leaf and canopy level studies are needed that relate SIF measurements to photosynthetic performance, to characterize relationships between SIF and PAM F metrics [24,47].
Further research is needed to characterize the effects of the diurnal and seasonal dynamics in environmental conditions on vegetation photosynthesis and the associated F and SIF properties, and to evaluate the ability of SIF metrics to characterize the diurnal and seasonal dynamics in photosynthesis. Further understanding of the mechanisms underlying the relationships of vegetation function and F, SIF, and reflectance VIs in different vegetation canopies and environments is essential for advancing their use in remote sensing, and will also contribute important understanding for ESA’s forthcoming Fluorescence EXplorer (FLEX), Earth Explorer 8, which will measure reflectance and SIF together to assess seasonal photosynthetic patterns globally [29,45,52].
To advance the understanding of the utility of SIF metrics to monitor photosynthesis, our goal is to understand how the fine spatial and temporal scale red and far-red SIF (SIFB and SIFA) measurements relate to leaf-level F signals as well as to canopy VIs and GPP, or the carbon used by photosynthesis as measured by a flux tower, and therefore can be used for monitoring vegetation photosynthetic function. The objectives of this study are: to characterize the dynamic diurnal and seasonal relationships between canopy photosynthetic function and vegetation chlorophyll fluorescence and reflectance properties, at both leaf and canopy scales, and to evaluate the potential of SIF to scale leaf level F parameters to the canopy level for estimating GPP. Some of the driving questions motivating this research are: (1) Does canopy SIF capture the variation in leaf-level light-adapted fluorescence metrics indicative of photosynthetic function (i.e., YII and ETR obtained by the PAM approach)? (2) Can SIF contribute to evaluating canopy photosynthetic function (i.e., GPP and LUE) by providing more accurate or additional information as compared to the current approaches? (3) Do the relationships between leaf F and canopy SIF and between canopy GPP and SIF differ significantly during the day and with growth stage?

2. Materials and Methods

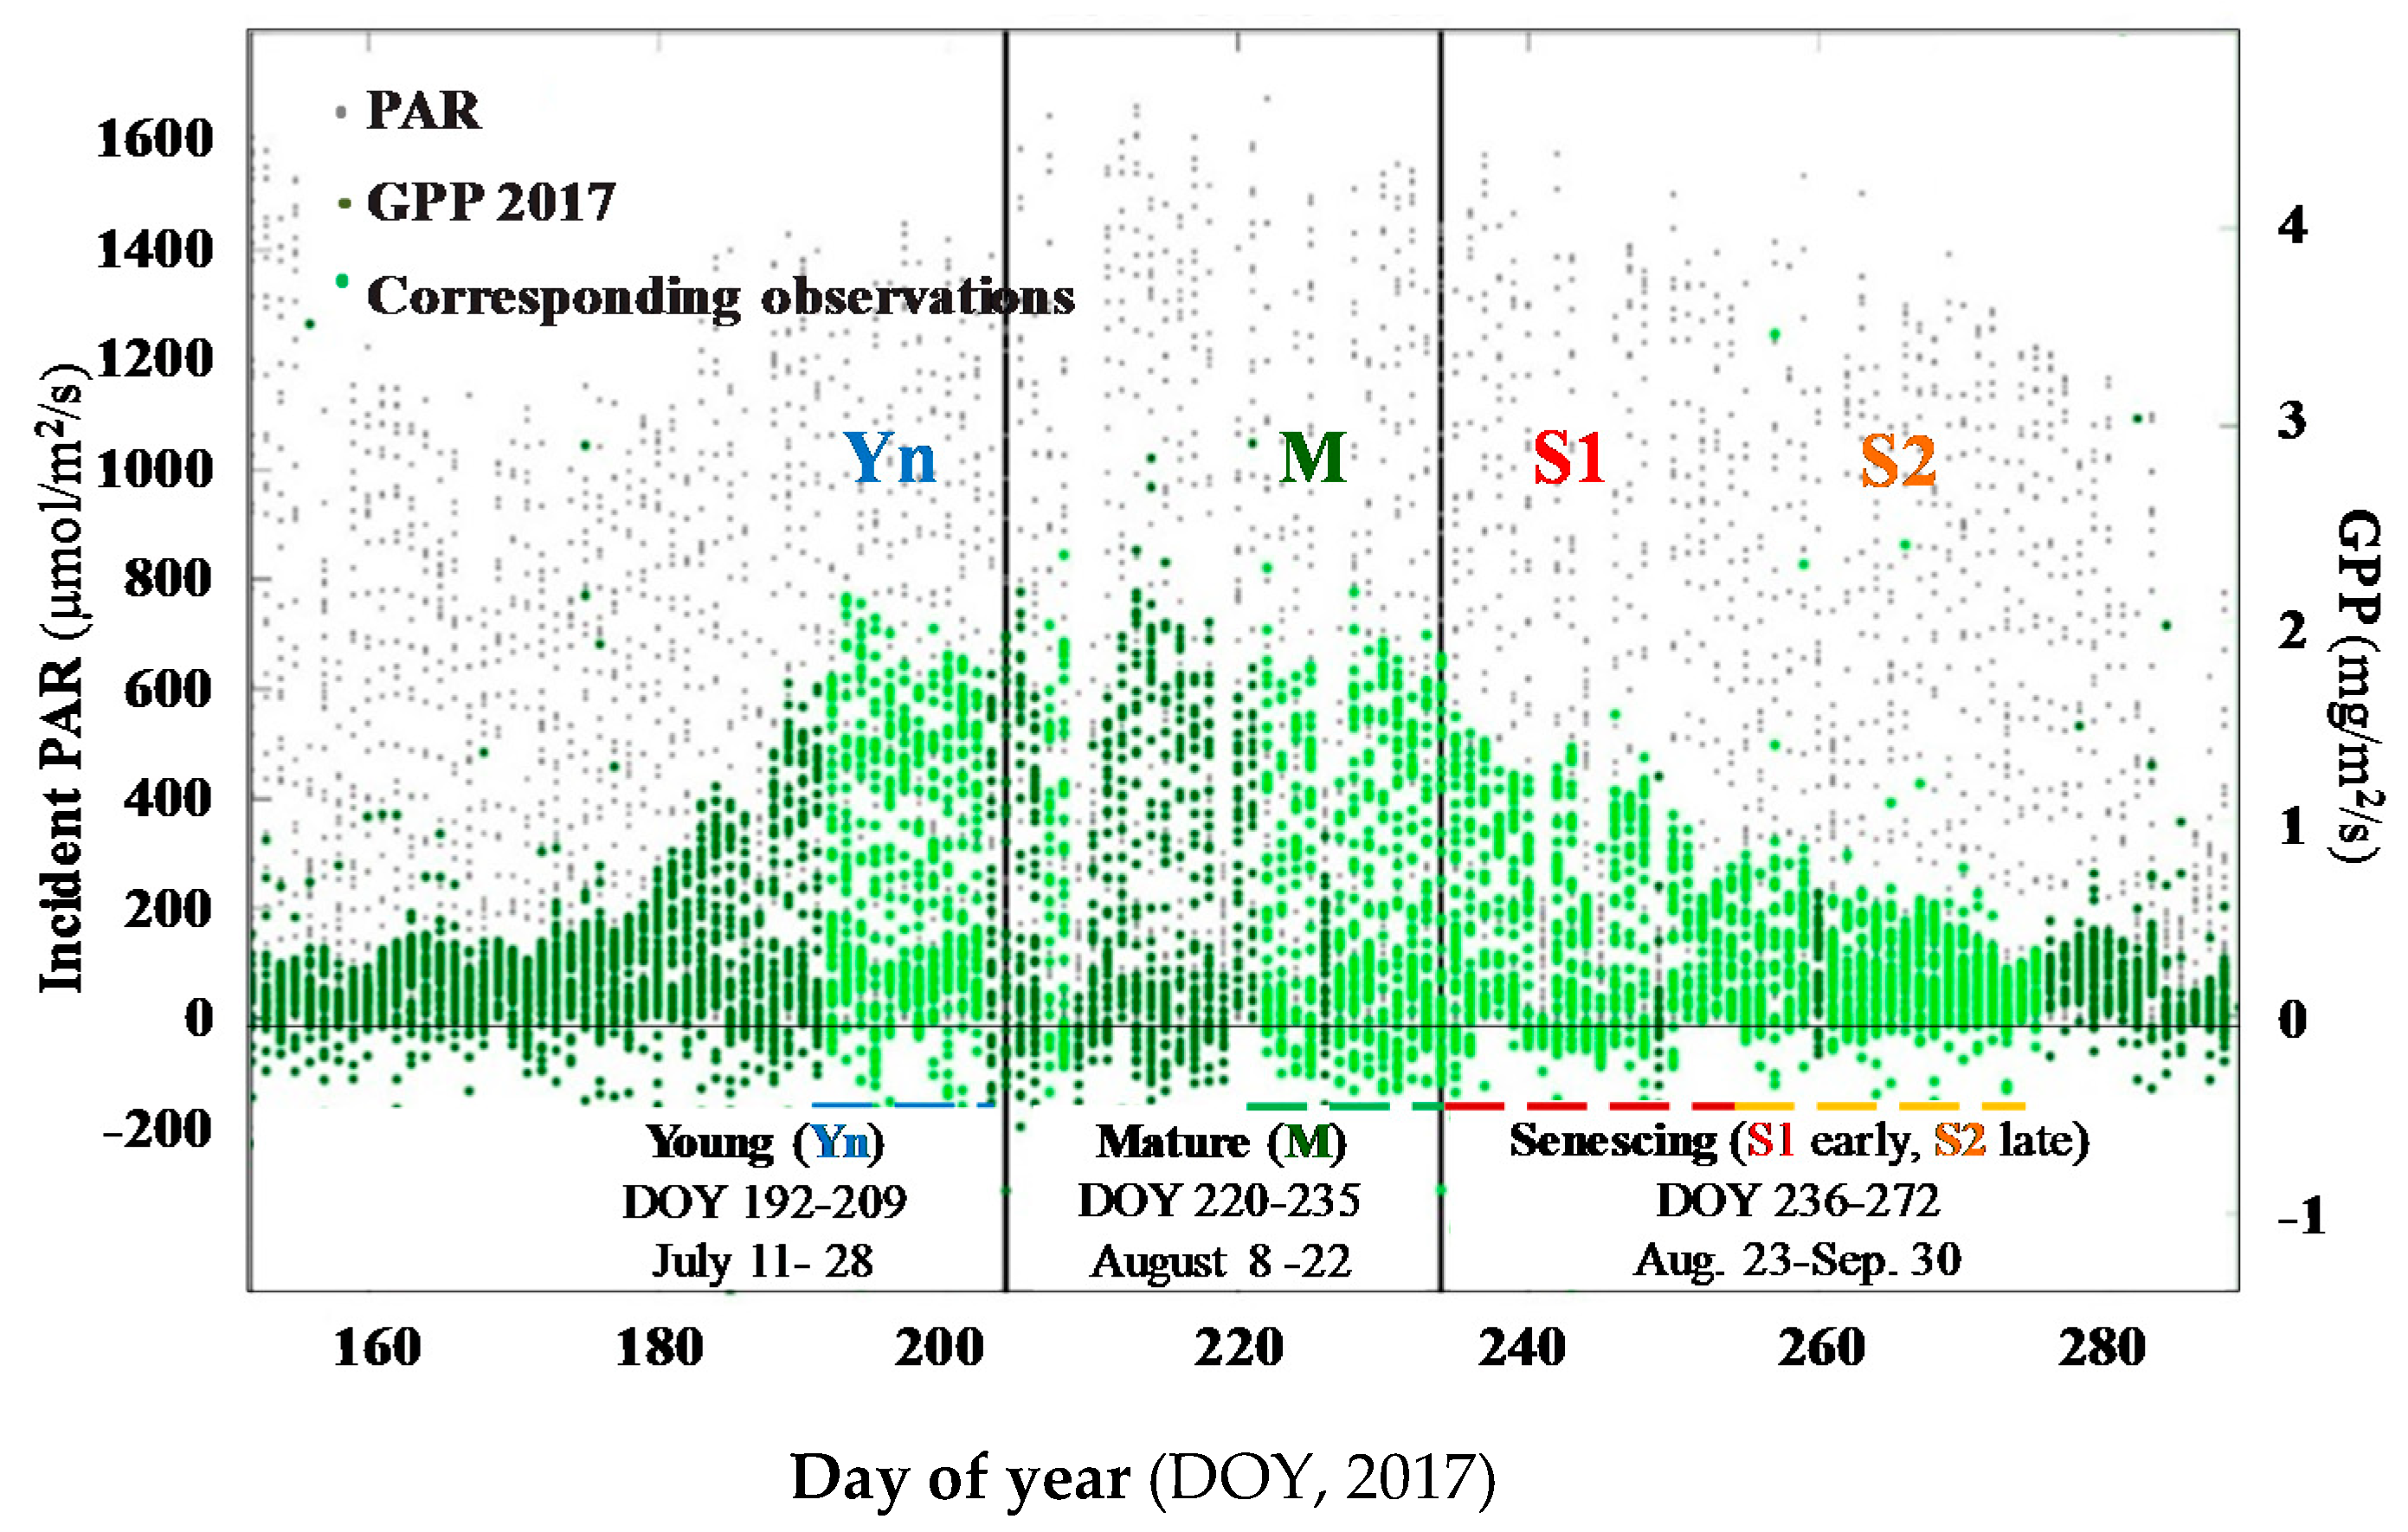
2.1. Study Site and Crop Condition

The data for this study were collected in 2017 at the Optimizing Production Inputs for Economic and Environmental Enhancement (OPE3) site at the Beltsville Agricultural Research Center in Beltsville (BARC), MD, USA (lat/lon 39.030686/−76.84546, 50 m asl), operated by the US Department of Agriculture (USDA) Agricultural Research Service (ARS). At the OPE3 site, corn (Zea mays L.) is planted annually in predominately loamy sand soils, which are rain fed and augmented with optimal nitrogen fertilizer rates. The site is instrumented with a 10 m eddy covariance tower. The local climate is warm and temperate, with hot, humid summers, and typically mild winters with occasional freezes.
Corn has distinct growth stages, divided into vegetative and reproductive. The first and last vegetative stages are designated as emergence and tussling, while the reproductive stages start with the development of the corn silk and are based on the development of the kernels, which accumulate plant resources, leading to a decline in leaf photosynthesis and the onset of canopy senescence. In 2017 the crop emerged around June 20–22 (DOY 171–173) based on a site visit, Pheno-cam records [53], and the operational flux tower measurements (Figure 1) [54]. A 3 m tall portable tower supporting the optical fibers of the fluorescence box (FLoX) instrument [55] and a set of monitoring-PAM (MoniPAM) probes were installed on July 6/7, when the corn was sufficiently developed. The collection of measurements started the following week on July 11 (DOY 192, Figure 1 bright green). The FLoX and MoniPAM collections occurred within the footprint of the flux tower, separated by approximately 120 m.

2.2. Measurements

At the OPE3 site, a 10 m tall eddy covariance tower measured canopy level CO2 assimilation at 30 min intervals continuously throughout the growing season [56] (Figure 1). The measured net CO2 flux (i.e., net ecosystem productivity) is partitioned into GPP (the carbon used by photosynthesis) and ecosystem respiration [28,56,57].
During the summer of 2017 we collected complementary leaf and canopy measurements (Table 1) for C4 corn canopy (Zea mays L.) to capture the dynamics in photosynthesis, reflectance, and chlorophyll fluorescence (F and SIF) through the growing season.
Leaf-level fluorescence and photosynthetic efficiency were characterized using an automated MoniPAM Data Acquisition system (MONI-DA, Heinz Walz GmbH, Effeltrich, Germany) outfitted with emitter-detector probes. The system continuously measured chlorophyll fluorescence in the presence of ambient sunlight (i.e., light-adapted), from several leaf samples simultaneously [24,38,47]. By DOY 190, when the corn canopy was established, canopy closure was approximately 85%, and no additional agricultural treatments were planned, the MoniPAM emitter-detector probes were mounted on fully developed leaves (i.e., on the 4th leaf from the top of the plant). Measurements were collected during the growing season, continuously re-locating the probes as new leaves emerged. Five emitter-detector probes were operated, measuring in parallel light-adapted steady state F (Fs), a broadband measurement of chlorophyll fluorescence in the 710–800 nm range, and the associated PAR. Three probes were positioned to measure fully sunlit leaves from the upper canopy, while the remaining two probes collected measurements on shaded leaves at varying illumination levels and positions in the canopy. Since the leaf signal available for remote sensing of the canopy is primarily associated with the illuminated leaf surfaces, we further analyzed the measurements collected on sunlit leaves. With each measurement, the following parameters were collected: steady state and maximum F (Fs, relative units), operating photosynthetic efficiency of PSII electron transport under sunlight or yield of photosystem II (YII, right axis), relative electron transport rate (ETR, left axis), and incident PAR (Table 1, Figure 2).
Canopy diurnal measurements including reflectance and SIF (mW/m2/nm/sr)—both SIFB in the O2B and SIFA in the O2A bands, were collected using a field spectroscopy system FLoX (Dual FLuorescence boX; JB Hyperspectral Devices UG, Dusseldorf, Germany) [55]. The FLoX optical cables for measurements of down-welling radiance were mounted on at the top of a tower at approximately 3 m height. The optical cables measuring upwelling radiance were pointed at nadir, and were positioned at 1.5 m above the canopy throughout the measurement period, viewing a 25° field of view (2.6 m diameter at ground level). The FLoX is designed for high temporal frequency (at approximately 1 min time interval) acquisition of continuous top of canopy (TOC) optical properties with a focus on measurements of SIF, using an Ocean Optics FLAME S, which covers the full range of visible and near-infrared wavelengths (VNIR, 400–900 nm) and an Ocean Optics QEPro, with high spectral resolution (full width at half maximum, FWHM of 0.3 nm) in the range of the fluorescence emissions (i.e., 650–800 nm). Each spectrometer’s optical input was split between two fiber optics, one leading to a cosine receptor measuring the incoming solar irradiance, and a bare fiber measuring the vegetation reflected and emitted radiances. Both spectrometers were housed in a Peltier thermally regulated box, keeping the internal temperature lower than 25 °C in order to reduce dark current drift. The thermoelectric cooler of the QEPro was set to 20 °C in order to provide stable measurements. The signal was automatically optimized for each channel at the beginning of each measurement cycle, and two dark current spectra were collected. The key settings, such as the interval between measurement cycle and the maximum integration time, were saved in configuration files. The data and metadata (e.g., spectrometer temperature, detector temperature and humidity, GPS position and time) were also stored. The system was designed for long-term fully automatic field measurements, requiring only minimal user input.

2.3. Data Processing and Analysis

The eddy covariance flux measurements were processed to 30 min time steps during the full 2017 growing season (Figure 1). The flux measurements obtained on days with corresponding MoniPAM and FLoX collections were selected for further use. Ecosystem respiration (Re) was calculated as an exponential function of air temperature using a relationship developed from nighttime net ecosystem production, measured by the flux tower and corresponding temperature observations [56,57]. The difference between the CO2 flux and Re provided the GPP (Figure 1, mg/m2/s, shown in green on the right axis). This calculation was supported by the tower’s micro-meteorology measurements, including PAR (µmol/m2/s, Figure 1 in gray on the left axis). Incident PAR was used to estimate the photosynthetic light use efficiency (LUE) [58,59] of the canopy in the tower footprint, which was calculated as:
LUE = GPP/PAR.
Leaf-level light-adapted PAM fluorescence metrics representative of the canopy were derived by calculating the mean of the values from three MoniPAM emitter-detector probes maintained on fully sunlit leaves, using the simultaneously acquired measurements at 10 min intervals. Large outlier values from a single probe (mean ± three standard deviations) were removed, resulting in averaged light-adapted observations of incoming PAR; steady state F (Fs), measured shortly before a saturating pulse is applied; and maximum F level (Fm’), induced by applying a saturating light pulse which temporarily closes all PS II reactions centers. Fs and Fm (relative units) [18,21,24], were used to calculate the electron transport rate (ETR, μmol/m2/s1, Figure 2 in red on the left axis scaled by 10), and the effective photochemical quantum yield of PSII (YII, Figure 2 in blue on the right axis), as:
YII = (Fm − Fs)/Fm.
The FLoX system [55] collects upwelling and down-welling measurements, which were processed to reflectance and solar induced fluorescence (SIF) using two open-source R packages [60,61]. The outputs of the processing are: incoming radiance to the surface, top of canopy reflected radiance, apparent reflectance, and SIF estimates at spectral wavelengths associated with both atmospheric oxygen absorption features centered at 683 (SIFB) and 760 nm (SIFA). Canopy reflectance from the FLoX was used to calculate indices indicative of vegetation green biomass, chlorophyll content, and photosynthetic function (i.e., NDVI, Clred and PRI; Figure 3 and Table 2). SIFA and SIFB were retrieved by applying the spectral fitting method (SFM) [62] at the original acquisition time-steps (i.e., 1 min). Total SIFA+B was calculated as the sum of SIFA and SIFB. Each fluorescence estimate was assigned a quality flag, reporting information related to the illumination stability during the measurement cycle and the internal noise of the instrument at the moment of the data acquisition, which were used for filtering the dataset for saturated data points and anomalous readings [48,62]. Additional screening was done to remove sensor artefacts due to low light levels (i.e., in the early morning and late afternoon, SZA > 75°), so that only data collected between 8:00 and 17:00 local time were used in the analyses.
The set of complementary leaf and canopy measurements at OPE3 occurred at different time intervals: 30 min (flux tower); 10 min (MoniPam); and approximately 1 min (FLoX). Incident PAR was measured by the OPE3 flux tower and at leaf level by the MoniPAM. The FLoX-measured incoming radiance at 750 nm and the MoniPAM PAR measurements were collected at closer time intervals, and over the study period they display a strong linear relationship, which was used to derive PAR estimates for the FLoX footprint. Outliers (i.e., values greater than three median absolute deviations) from this daily linear trend were removed from both data sets. The absorbed in the footprint of the FLoX canopy PAR (APAR, µmol/m2/s), required for computation of the FLoX fluorescence yields, was calculated as:
APAR = PAR × fAPAR,
where PAR is the estimate for the FLoX footprint. The fraction of APAR (fAPAR) was calculated as a linear function of NDVI [63], experimentally established for corn:
fAPAR = (NDVI × 1.251) − 0.2528,
where NDVI was derived using the FLoX reflectance measurements. The empirical function was derived based on light bar (Accu-PAR ceptometer, METER (formerly Decagon), Pullman, WA) measurements of incident and transmitted PAR collected near solar noon on five different clear days covering the growing season, measuring every meter along a 100 m transect through the OPE3 corn field, in conjunction with above canopy spectral reflectance measurements collected using an ASD FieldSpec spectrometer (Malvern Panalytical, Longmont, CO). Using the field observations, fAPARfield was calculated using the equation:
fAPARfield = (PARin − PARtrans)/PARin,
where PARin is the incident PAR and PARtrans is the PAR transmitted through the canopy measured at ground level [64]. NDVI was calculated from the ASD spectral reflectance using the 670 and 800 nm bands. The NDVI and fAPAR were averaged to five meter intervals, and data from all dates were combined into the regression along with measurements of bare ground (where fAPAR = 0) for each day (R2 = 0.93, standard error of regression 0.056).
Canopy SIF yield was calculated as:
SIFy = SIF/APAR,
for both SIFA (SIFAy) and SIFB (SIFBy) bands, with the assumption that APAR was equally available to both PSII and PSI.
To compare all three data sets effectively, the most frequently acquired FLoX data set, screened for outliers as described above and including APAR, was smoothed using a moving Savitzky–Golay filter function to reduce the random noise and enhance the measured steady state signal [65] (MATLAB 2018b), which was linearly interpolated to 10 min intervals and resampled at congruent time steps with the Moni-PAM data. The combined MoniPAM and FLoX data sets were then linearly interpolated to extract values at the same 30 min intervals used by the flux data. The PAR values for numerous days across the season were evaluated statistically for significant differences associated with the three sensors, and plotted to confirm that the patterns, variations, and magnitudes of PAR from the MoniPAM, Flux, and FLoX closely matched. As result of the processing, the three data sets (Figure 2) were merged into one, containing measurements covering the period from 8:15–17:45 (≤20 per day), at consistent 30 min time intervals and with matching PAR levels. To avoid artifacts in the data due to lower solar illumination angels at the site, the measurements collected at 8:15, 17:15, and 17:45 were excluded from the analysis, living the time period of 8:45–16:45 (i.e., 17 observations per day).
The time period for which we have data from all three instruments in 2017 covers from day of year (DOY) 192 to DOY 273 (i.e., July 11 to September 29, 2017, Figure 2). During DOYs 210–220, the FLoX system was deployed for tower measurements of diurnal SIF, in support of the 2017 NASA airborne SIF acquisitions at the Smithsonian Research Center (SERC) in Edgewater, MD. Nevertheless, the 2017 dataset includes measurements representative of the major corn growth stages (58 days total). We identified the distinct growth stages based on Phenocam records [53], the variation in canopy GPP, leaf quantum yield of photosystem two (i.e., YII), and the reflectance VIs (FLoX), as indicated in Figure 1, Figure 2 and Figure 3. The young (Yn) growth stage was identified by the pattern of increase in the reflectance indices NDVI and Clred, as seen in early July (Figure 2 and Figure 3), and covers the corn vegetative period. Upon reaching maximal YII, NDVI, and Clred values (DOY 192–209, July 11–28), we defined the mature corn stage (M, DOY 220–235, August 8–22), which includes the corn initial reproductive phases. Finally, the early and late senescence stages (S1 and S2) displayed a sharp decrease in GPP, YII, and Clred from August 23 through September 30 (DOY 236–273).
To compare the diurnal and seasonal variation in the observations and statistically evaluate the strength of the relationships of the optical metrics to photosynthetic activity, and their dependence upon the time of collection and growth stage, we selected three representative days free of clouds within each growth stage (12 days, 17 observations/day), as follows: young (Yn , DOY 192–194), mature (M, DOY 222–224), early senescence (S1, DOY 245–247), and advanced senescence (S2, DOY 255–257). Frequently, remote sensing parameters saturate and underperform, and are not transferable across a phenology. To allow for scaling using remote sensing metrics (i.e., SIF), a linear relationship with the parameter of interest (i.e., GPP and LUE) is desired. The relationships between GPP, LUE, and the fluorescence and reflectance metrics were investigated using linear regression analysis, and the established correlations are shown in Figures 6 and 7. The strength of the relationships is indicated by listing the coefficients of determination (i.e., R2, percentage of explained variation in the dependent variable) in corresponding colors according to growth stage. The overall coefficient of determination is listed in black when the relationship was statistically significant (p < 0.01).
The diurnal measurements were sub-selected further to form categorical variables representative of the three distinct periods during the day: morning (am, 8:45–10:15), noon (11:45–1:15), and afternoon (pm, 15:15–16:45) local time (EDT or UTC-4, 12 observations per day, 144 observations). The seasonal changes in the diurnal profiles of the observations are shown in Figure 4 and Figure 5, where each value represents a mean of the measurements collected at this time on three consecutive clear days, representative of each growth stage, as indicated by different colors (blue—young, green—mature, red—early senescence, yellow—late senescence). The trends in the data are depicted using best fit lines (i.e., linear or polynomial). The statistical significance of the differences in the data (p < 0.01), associated with the time of observation (i.e., am/noon/pm) and growth stage (i.e., Yn/M/S1/S2), were determined based on an ANOVA general linear model (GLM) analysis (SYSTAT 12.3, SYSTAT Software Inc., 2017), suggested as optimal for use with data with unbalanced design and uneven number of samples, which occurred due to outliers and missing values. The coefficients of determination (R2) are used to describe the level of variation in the measurements attributed to the ANOVA independent variables: (1) observation time (i.e., morning, midday, afternoon); (2) growth stage (i.e., young, mature, senescent); and (3) the interactions of the first two (Table 3). The ANOVA GLM least square means of the dependent variables (e.g., GPP, VIs, F, and SIF metrics, etc.) are reported, indicating the significance of the differences among the means with a different letter (Table 3).
We anticipated that SIF observations at high PAR (i.e., saturating light level for photosynthesis) were likely to have stronger correlations with the leaf level F metrics and canopy GPP. To depict the relationship of fluorescence metrics (i.e., F and SIF) with CO2 assimilation (GPP) not limited/controlled by PAR, we separately analyzed the measurements collected in periods of the day where PAR is known to be below saturation (am and pm) from the period where PAR commonly is at levels saturating for photosynthesis and electron transport (i.e., 12:30 noon ± 1 h, Table 4), therefore providing a more consistent comparison of the relationships between photosynthetic performance and F metrics across the growth stages. To provide context for interpretation and relevance of the results to the satellite observations of SIF, the measurements collected under varying lower light levels were included in the analysis (Table 3 and Table 4), and are identified in Figure 4 and Figure 5 (i.e., am, noon and pm). The overpass time of the satellites measuring SIF over Greenbelt, MD is for MetOp GOME-2 9:30 equatorial local time (ELT), Envisat SCIAMACHY and FLEX 10:00 ELT (http://www.ceos-cove.org/en/), ranging during the growing season by more than an hour, and is approximated by the morning (am) observations.

3. Results

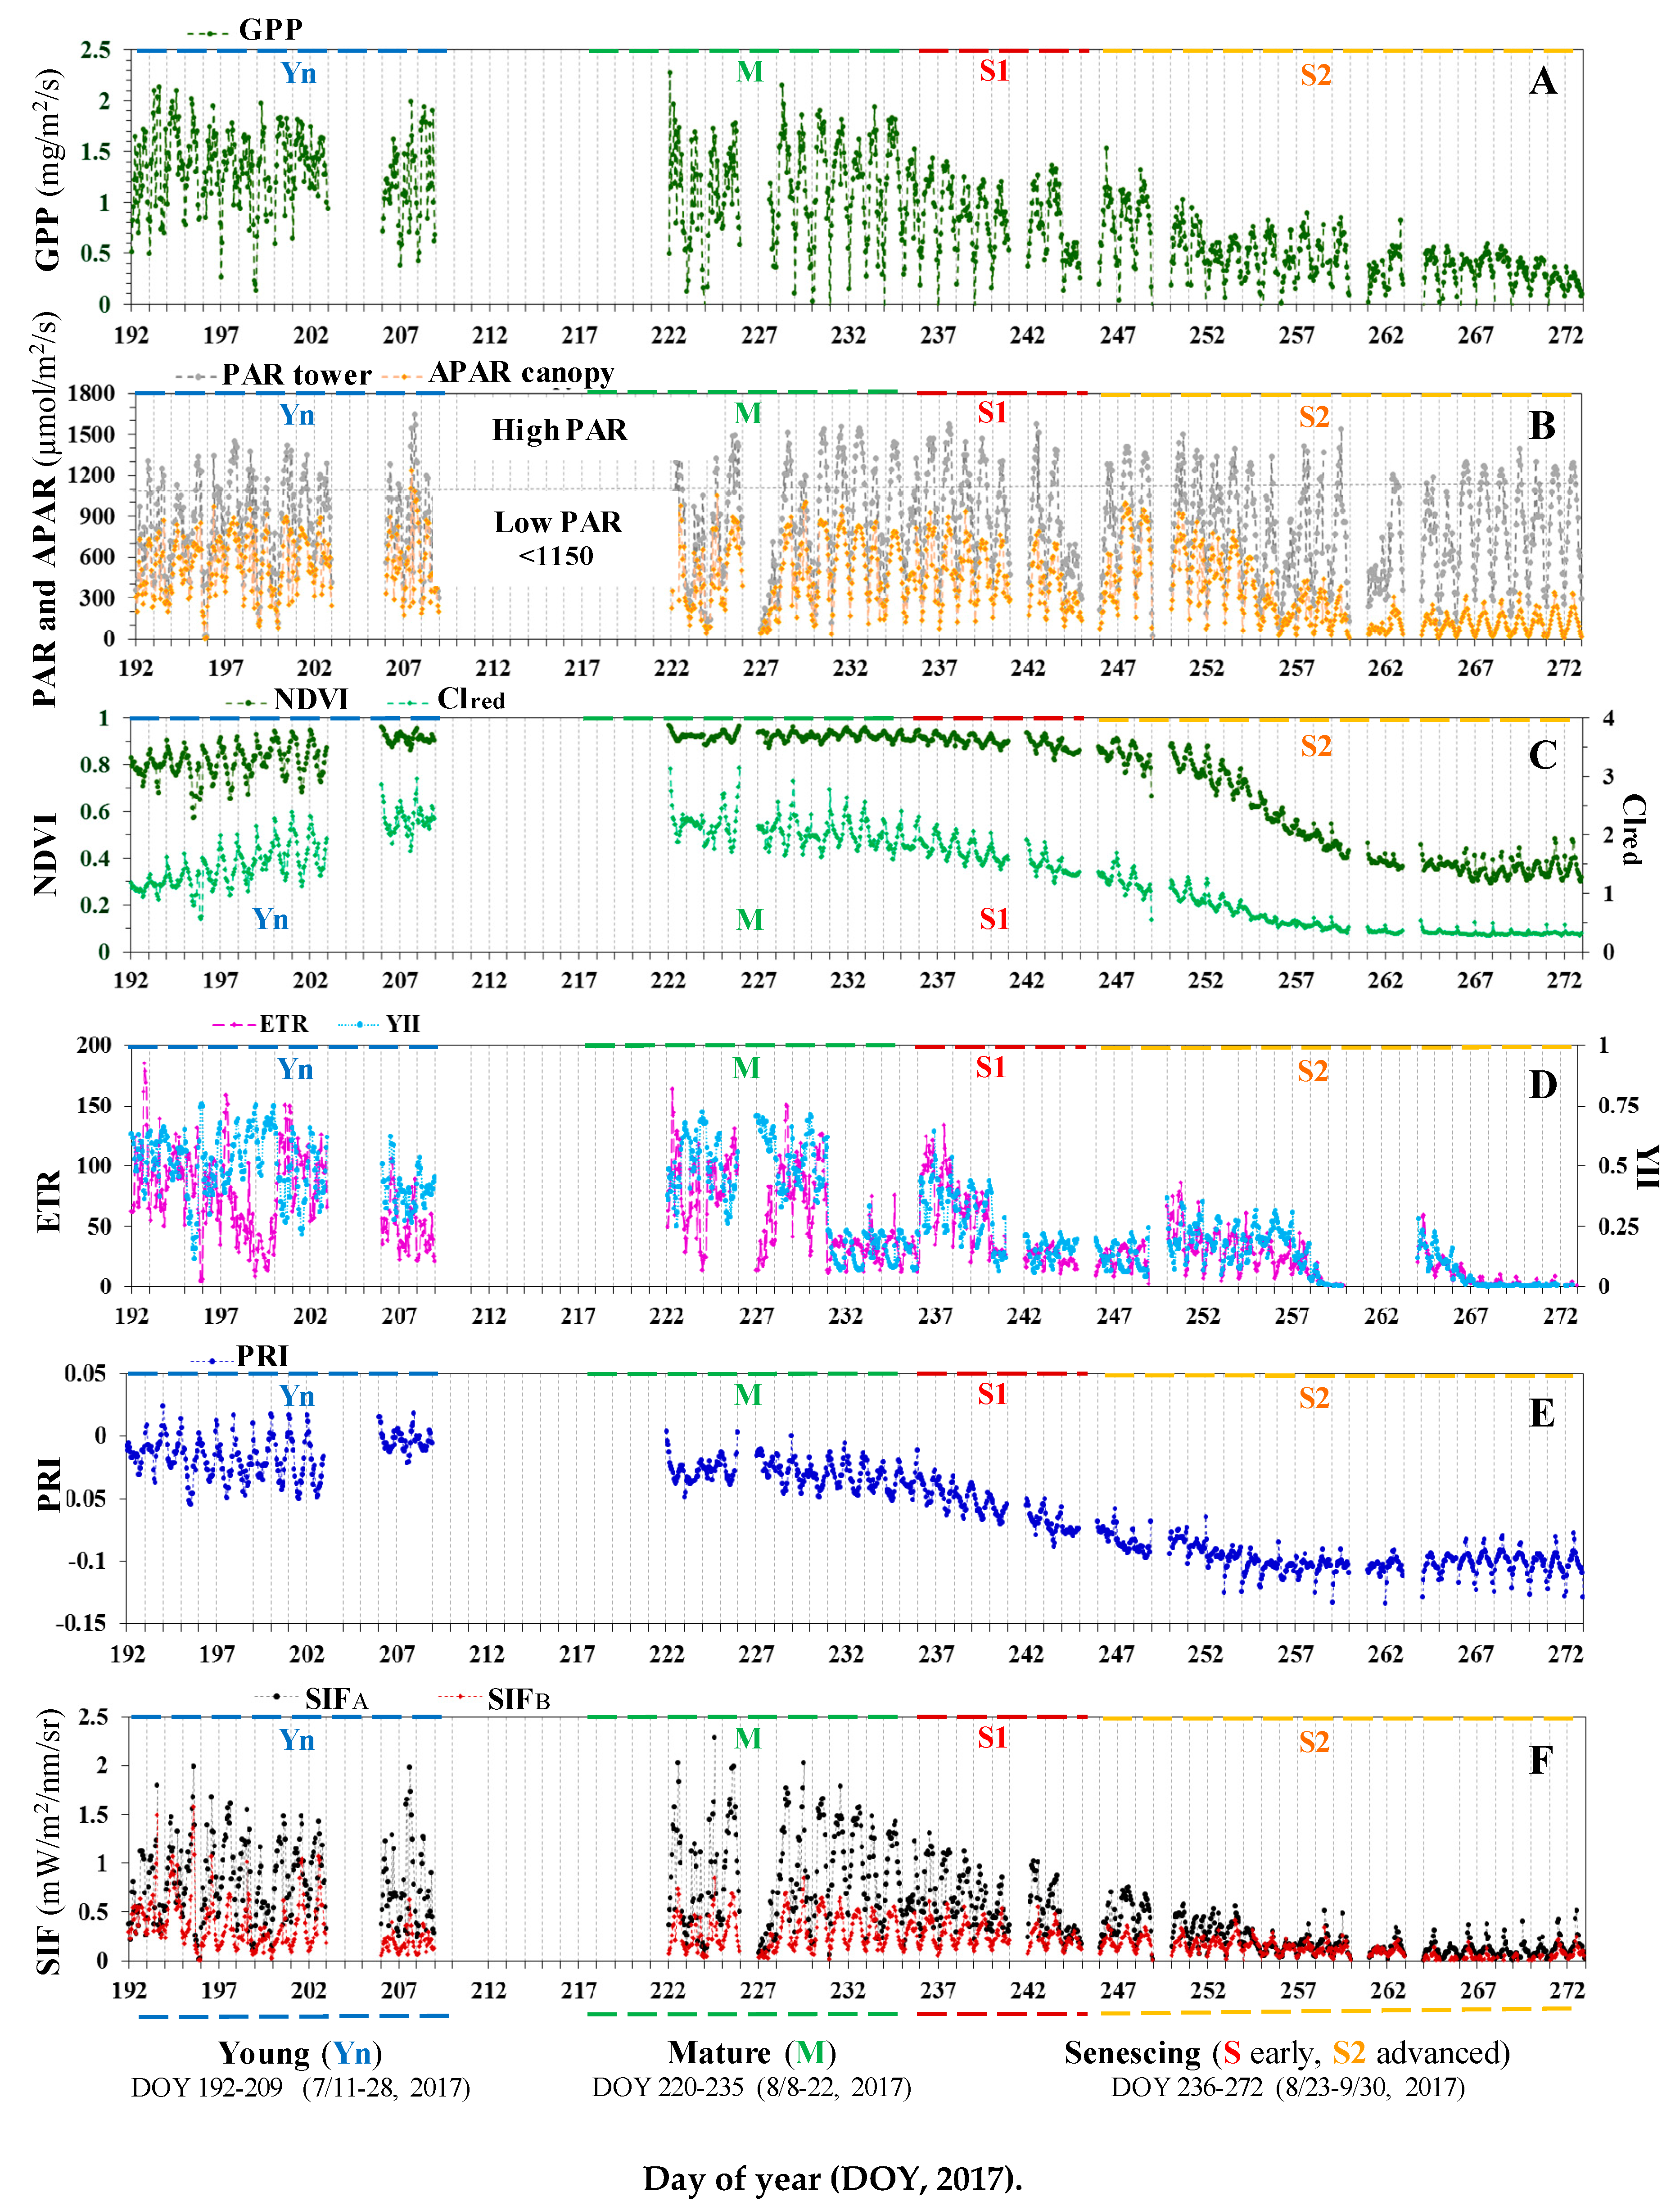
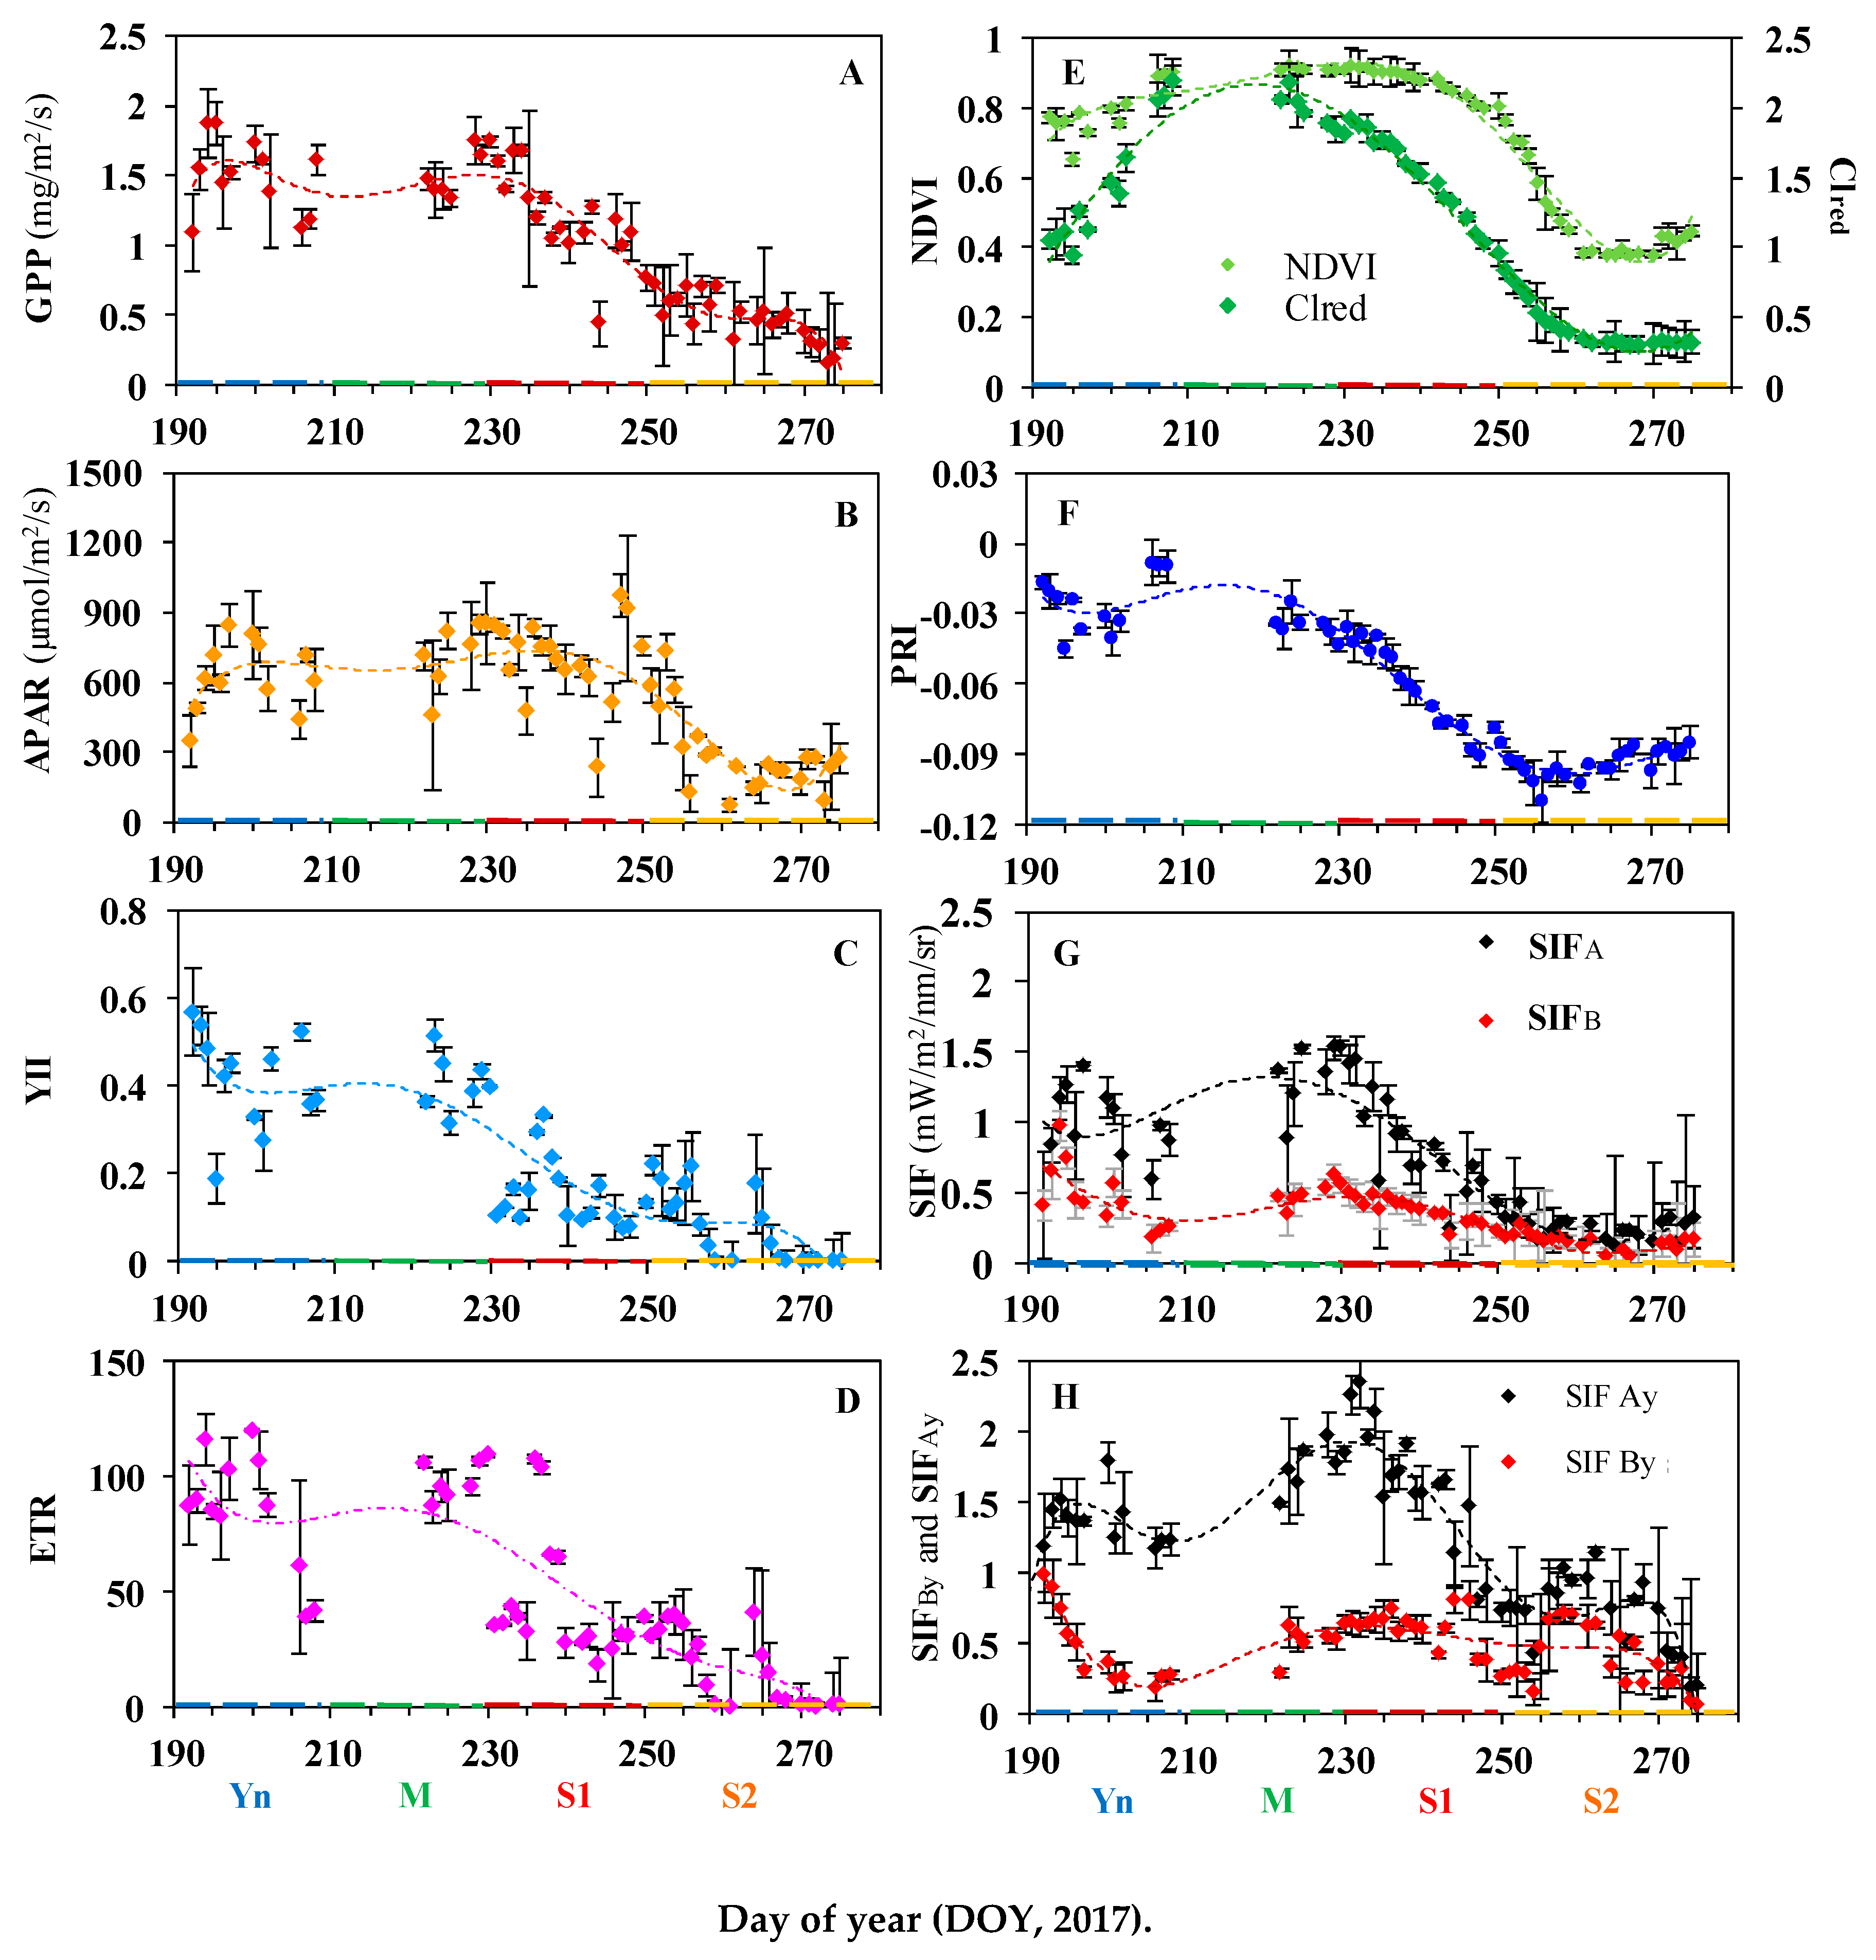
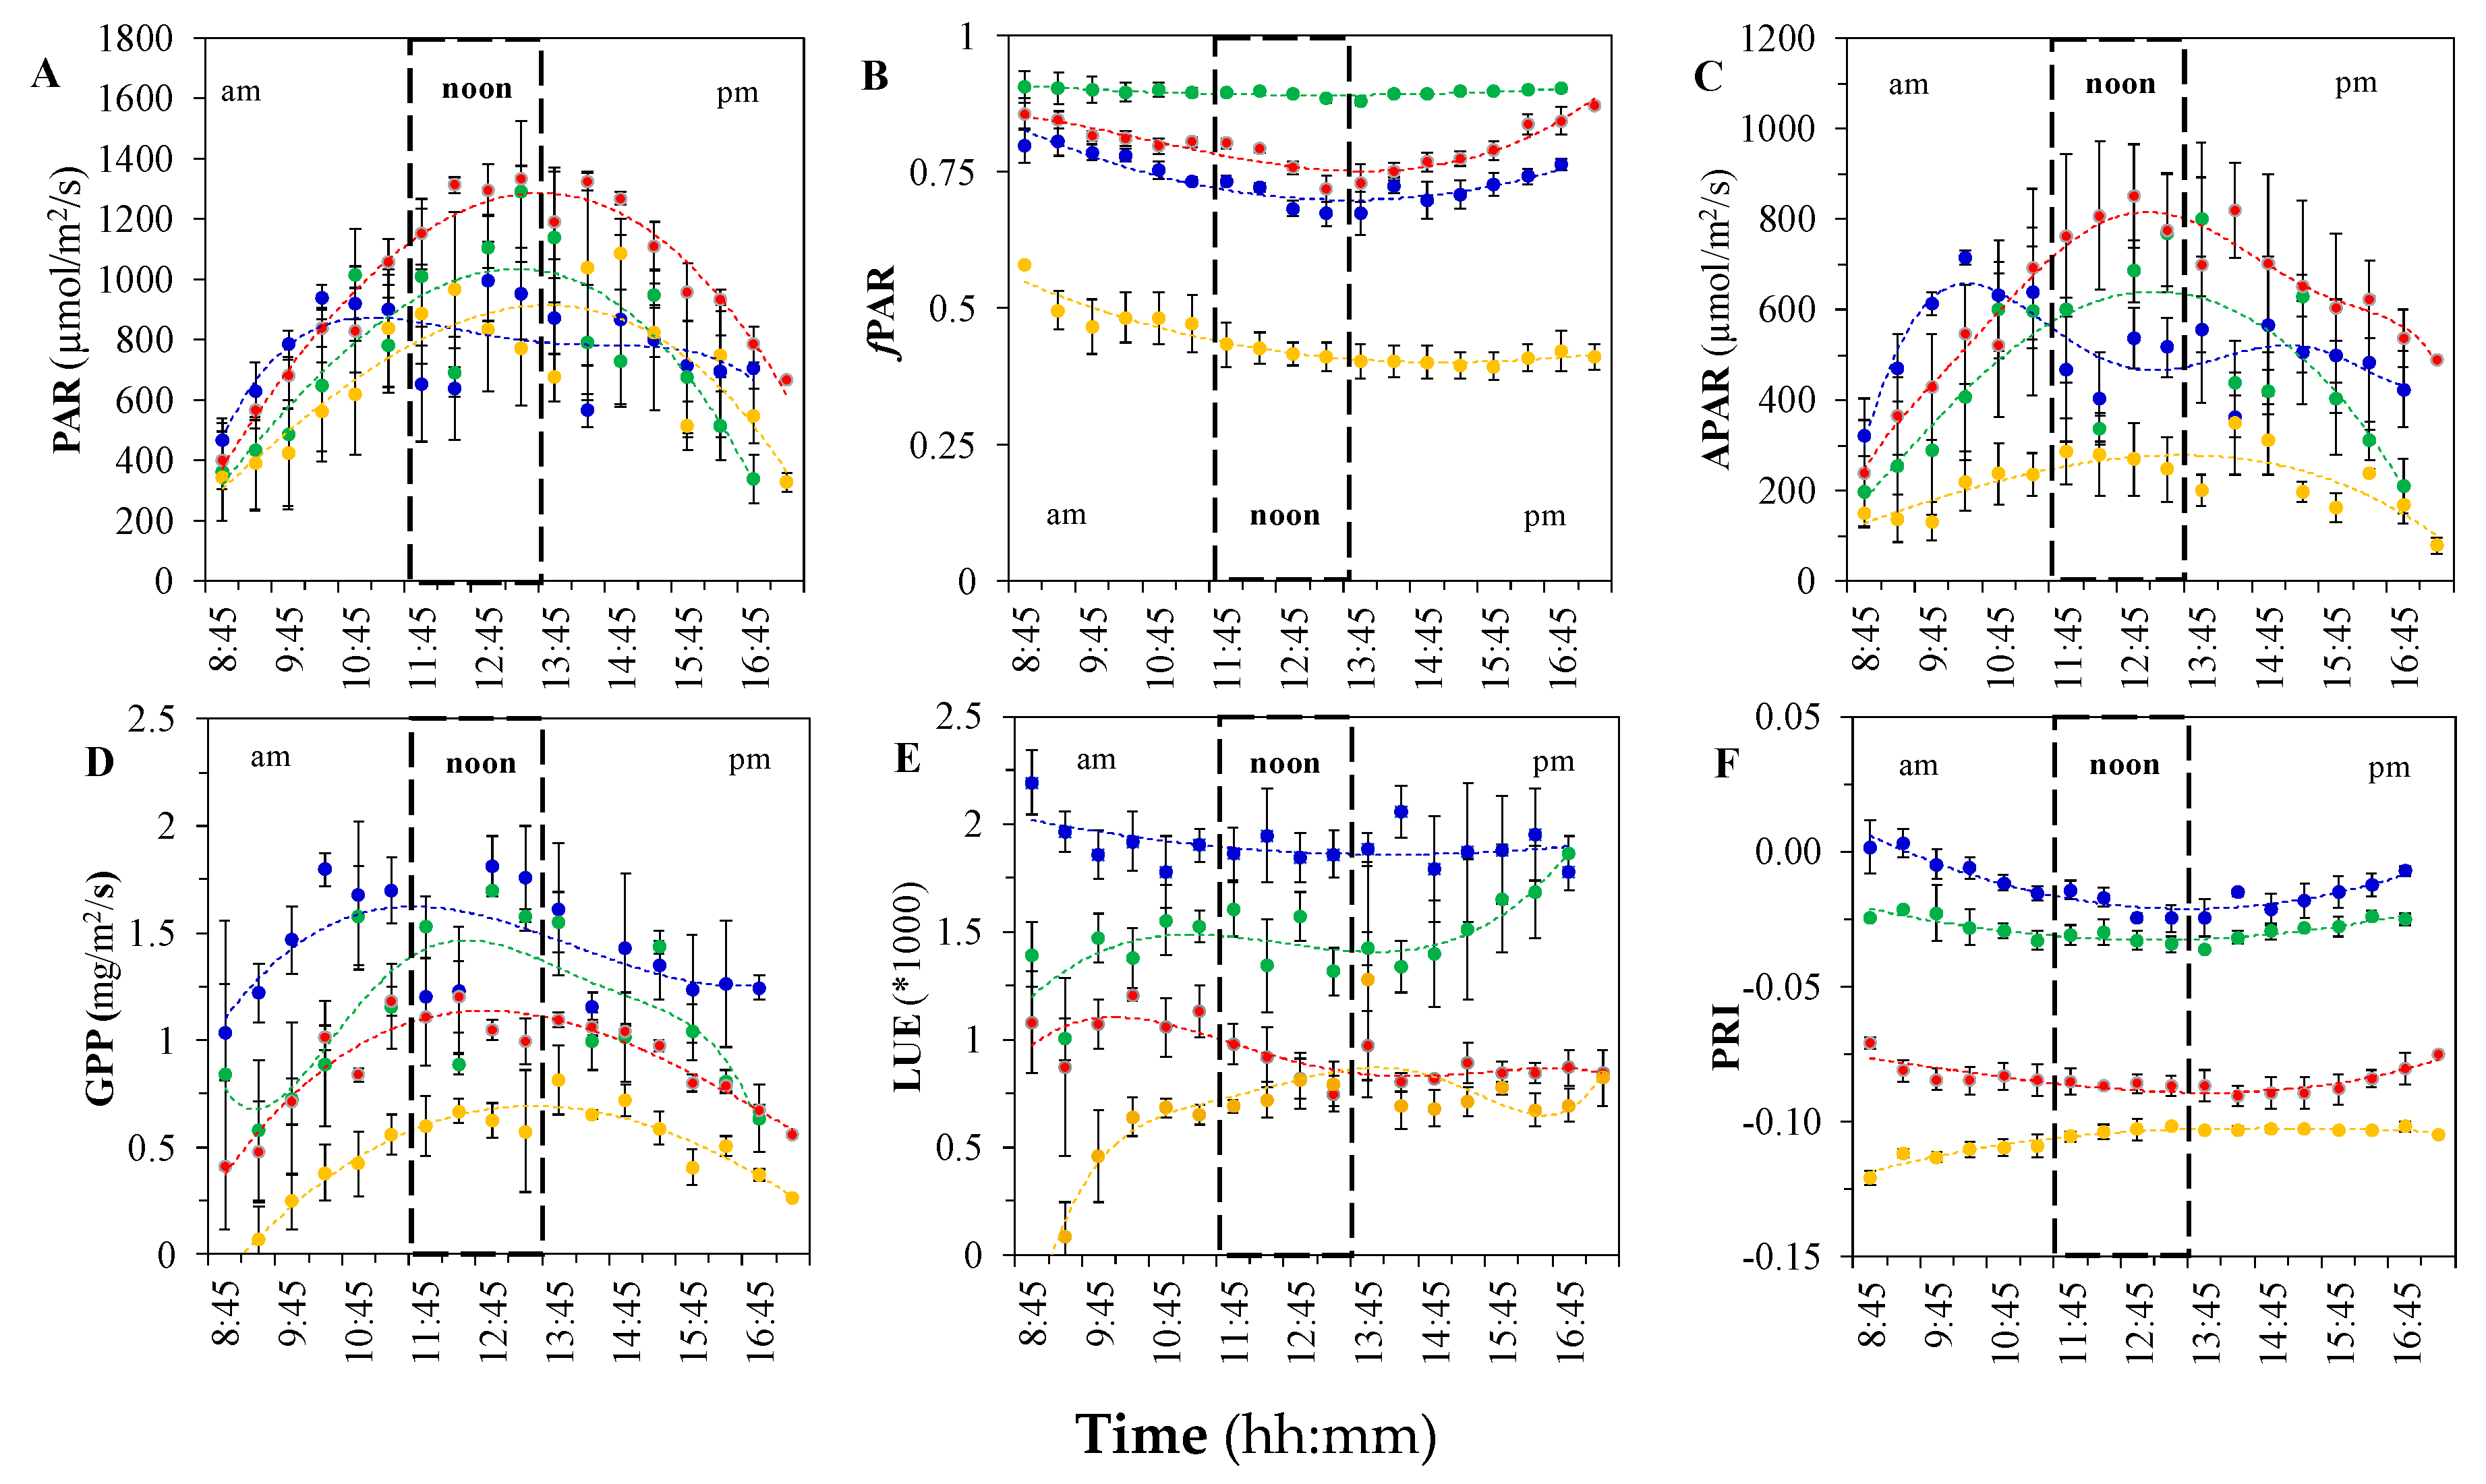
3.1. Diurnal and Seasonal Variations in Photosynthesis and the Associated Reflectance and Fluorescence Metrics

The diurnal profiles in vegetation canopy and leaf functional and spectral properties changed gradually throughout the growing season (Figure 2), and significant differences associated with the different growth stages were established. In general, the diurnal variations in photosynthetic activity, reflectance and SIF metrics exhibited a similar pattern of increase in magnitude in the morning to reach maximum close to midday, declining in the afternoon. However, the phenology-related changes in diurnal variation in the observed parameters were more complex, demonstrating diurnal dynamics which gradually changed in a different manner with phenology. The highest diurnal variability in all metrics was observed in the early morning during the young growth stage (Yn, Figure 2 and Figure 3).

3.1.1. Variation in GPP, PAR, and LUE

GPP, APAR, and LUE maintained significantly higher values during the young and mature stages and declined with senescence (Figure 2 and Figure 4). During the summer of 2017, the corn emerged at approximately DOY 170, at which time midday GPP was 0.50 mg/m2/s (Figure 1). GPP increased after DOY 180, in response to applied nitrogen (N) treatment (140 kg N/ha), to an absolute maximum of approximately 2.35 mg/m2/s (Figure 1 and Figure 2A). GPP varied significantly during the young period DOY 193–194 (Figure 2A and Figure 4D). During the mature stage GPP reached highest value on DOY 222, when the canopy was still developing and new leaves were being produced (Figure 2A). The diurnal patterns of GPP through the entire growing season were consistent, with the highest GPP values always measured near midday (Figure 2A). Midday average GPP was highest during the young stage (Figure 3A, Figure 4C, Table 3), declining thereafter.
The diurnal variations in PAR, fAPAR, and APAR are compared across the growth stages (Figure 2B, Figure 3B, Figure 4A–C). PAR (Figure 4A) consistently increased in the morning to a maximum around midday, and declined in the afternoon at different rates. Mean midday PAR reached a highest value of 1275 µmol/m2/s (Table 3) during early senescence (S1, Figure 1, Figure 2B and Figure 3A). The largest diurnal change in PAR was observed during the early senescent stage (i.e., increase until midday of ~600 µmol/m2/s, Figure 4A).
During the young and early senescent stages (Figure 3B, 4B), fAPAR declined in the morning to reach minimum in the early afternoon at approximately 14:15, increasing in the afternoon close to the levels measured in the morning. During the mature stage, the behavior of fAPAR did not change significantly throughout the day (Figure 3B, green), indicating that, only during this stage, the use of either PAR or APAR could yield similar results and derivative parameters.
The magnitude of midday average APAR was highest during the early senescence stage (Figure 3B, Table 3, S1), which coincided with the maximal PAR levels observed during this stage and the high canopy chlorophyll content of the established canopy, as captured by the Clred and NDVI values (Figure 3E). Comparing the diurnal profiles of APAR across the growth stages, APAR was significantly lower during the S2 stage (Figure 4C). During the young stage, ANOVA did not identify statistically significant changes in APAR associated with the diurnal time periods (Table 3, am/noon/pm). However, during the young stage, the diurnal profile of APAR exhibited a complex dynamic behavior (Figure 4C) similarly to PAR, increasing quickly in the morning to reach highest magnitude in the late morning, and afterward declining by midday approximately in half to a level maintained until the end of the day. During the S1 stage, APAR remained relatively high in the late afternoon (Figure 4C), which was attributed to the high PAR observed at this time (Figure 4A). During late senescence (i.e., S2) when chlorophyll levels were significantly lower, APAR remained low during most of the day (Figure 4C, points in yellow), while PAR exhibited a distinct midday maximum (Figure 4A).
LUE declined in the morning to reach minimum in the early afternoon during all stages (Figure 4E). Similarly to GPP, the highest LUE throughout the day was observed in the morning during the young stage. While the late morning LUE values separated the four growth stages, the midday and afternoon values grouped together the S1 and S2 stages, separating them from the young and mature stages (Figure 4E). The diurnal variation in LUE significantly differed with growth stage (Table 3, significant interaction between ‘time of day’ and ‘growth stage’). During the young stage, LUE did not change significantly throughout the day (Table 3), while significant diurnal changes were observed during the remaining growth stages.

3.1.2. Variation in Reflectance VIs

The reflectance indices NDVI and Clred (Figure 2C) were calculated to evaluate the changes in canopy biomass and chlorophyll content, respectively. The diurnal variation in NDVI and Clred exhibited similar patterns, with lowest values measured at midday.
The diurnal variation in NDVI significantly differed with growth stage (Table 3, ANOVA significant interaction between ‘time of day’ and ‘growth stage’). The largest diurnal range in NDVI was measured on young corn (i.e., diurnal range from 0.6–0.9, Figure 2). The low midday values and larger diurnal variation during the young stage contributed to influence of the soil background at higher sun elevations, which was most apparent when the canopy LAI was lower. With an increase in foliage and canopy closure, the NDVI diurnal variation decreased and remained steady until the S2 stage. There were no statistically significant diurnal changes in NDVI during the mature stage, however, during this growth stage, significant differences were observed in GPP, Clred, PRI, and SIF (Figure 4 and Figure 5, Table 3). Midday NDVI decreased from 0.9 to 0.4 by DOY 262 (Figure 3C, S2).
As compared to NDVI, Clred exhibited very different seasonal dynamics, gradually increasing during the young stage to reach maximum during the mature stage, declining gradually during the S1 and S2 stages (Figure 2C). The diurnal variation in Clred was also largest during the early stage (Figure 2C, Yn), with a minimum observed at noon in all growth stages. The absolute daily maximum of Clred was measured during the mature stage (Figure 2), after which Clred declined during senescence, and during S2, the diurnal variations were not statistically significant (Table 3).
The diurnal variation in PRI significantly differed with growth stage (Table 3, ANOVA significant interaction between ‘time of day’ and ‘growth stage’). During the young and mature stages, daily minimum PRI was measured at noon (i.e., a ‘v’ pattern), while during senescence the pattern gradually changed, and during advanced senescence, the daily maximum PRI values occurred at noon (i.e., ‘ᴧ’ pattern). Similarly to NDVI and Clred, the highest magnitude of diurnal variation was also observed for the young canopy, when lower PRI values were measured at midday. In contrast, during S2 stage, PRI increased during the middle of the day (Figure 2E and Figure 4F). Only in the early morning during the young stage did PRI have positive mean values (Table 3, Figure 4F). Highest midday values were measured during the young (Figure 4F, Table 3), followed by the mature and senescent stages. PRI reached lowest values during the senescent stage, which occurred in the early morning (−0.106, Table 3).

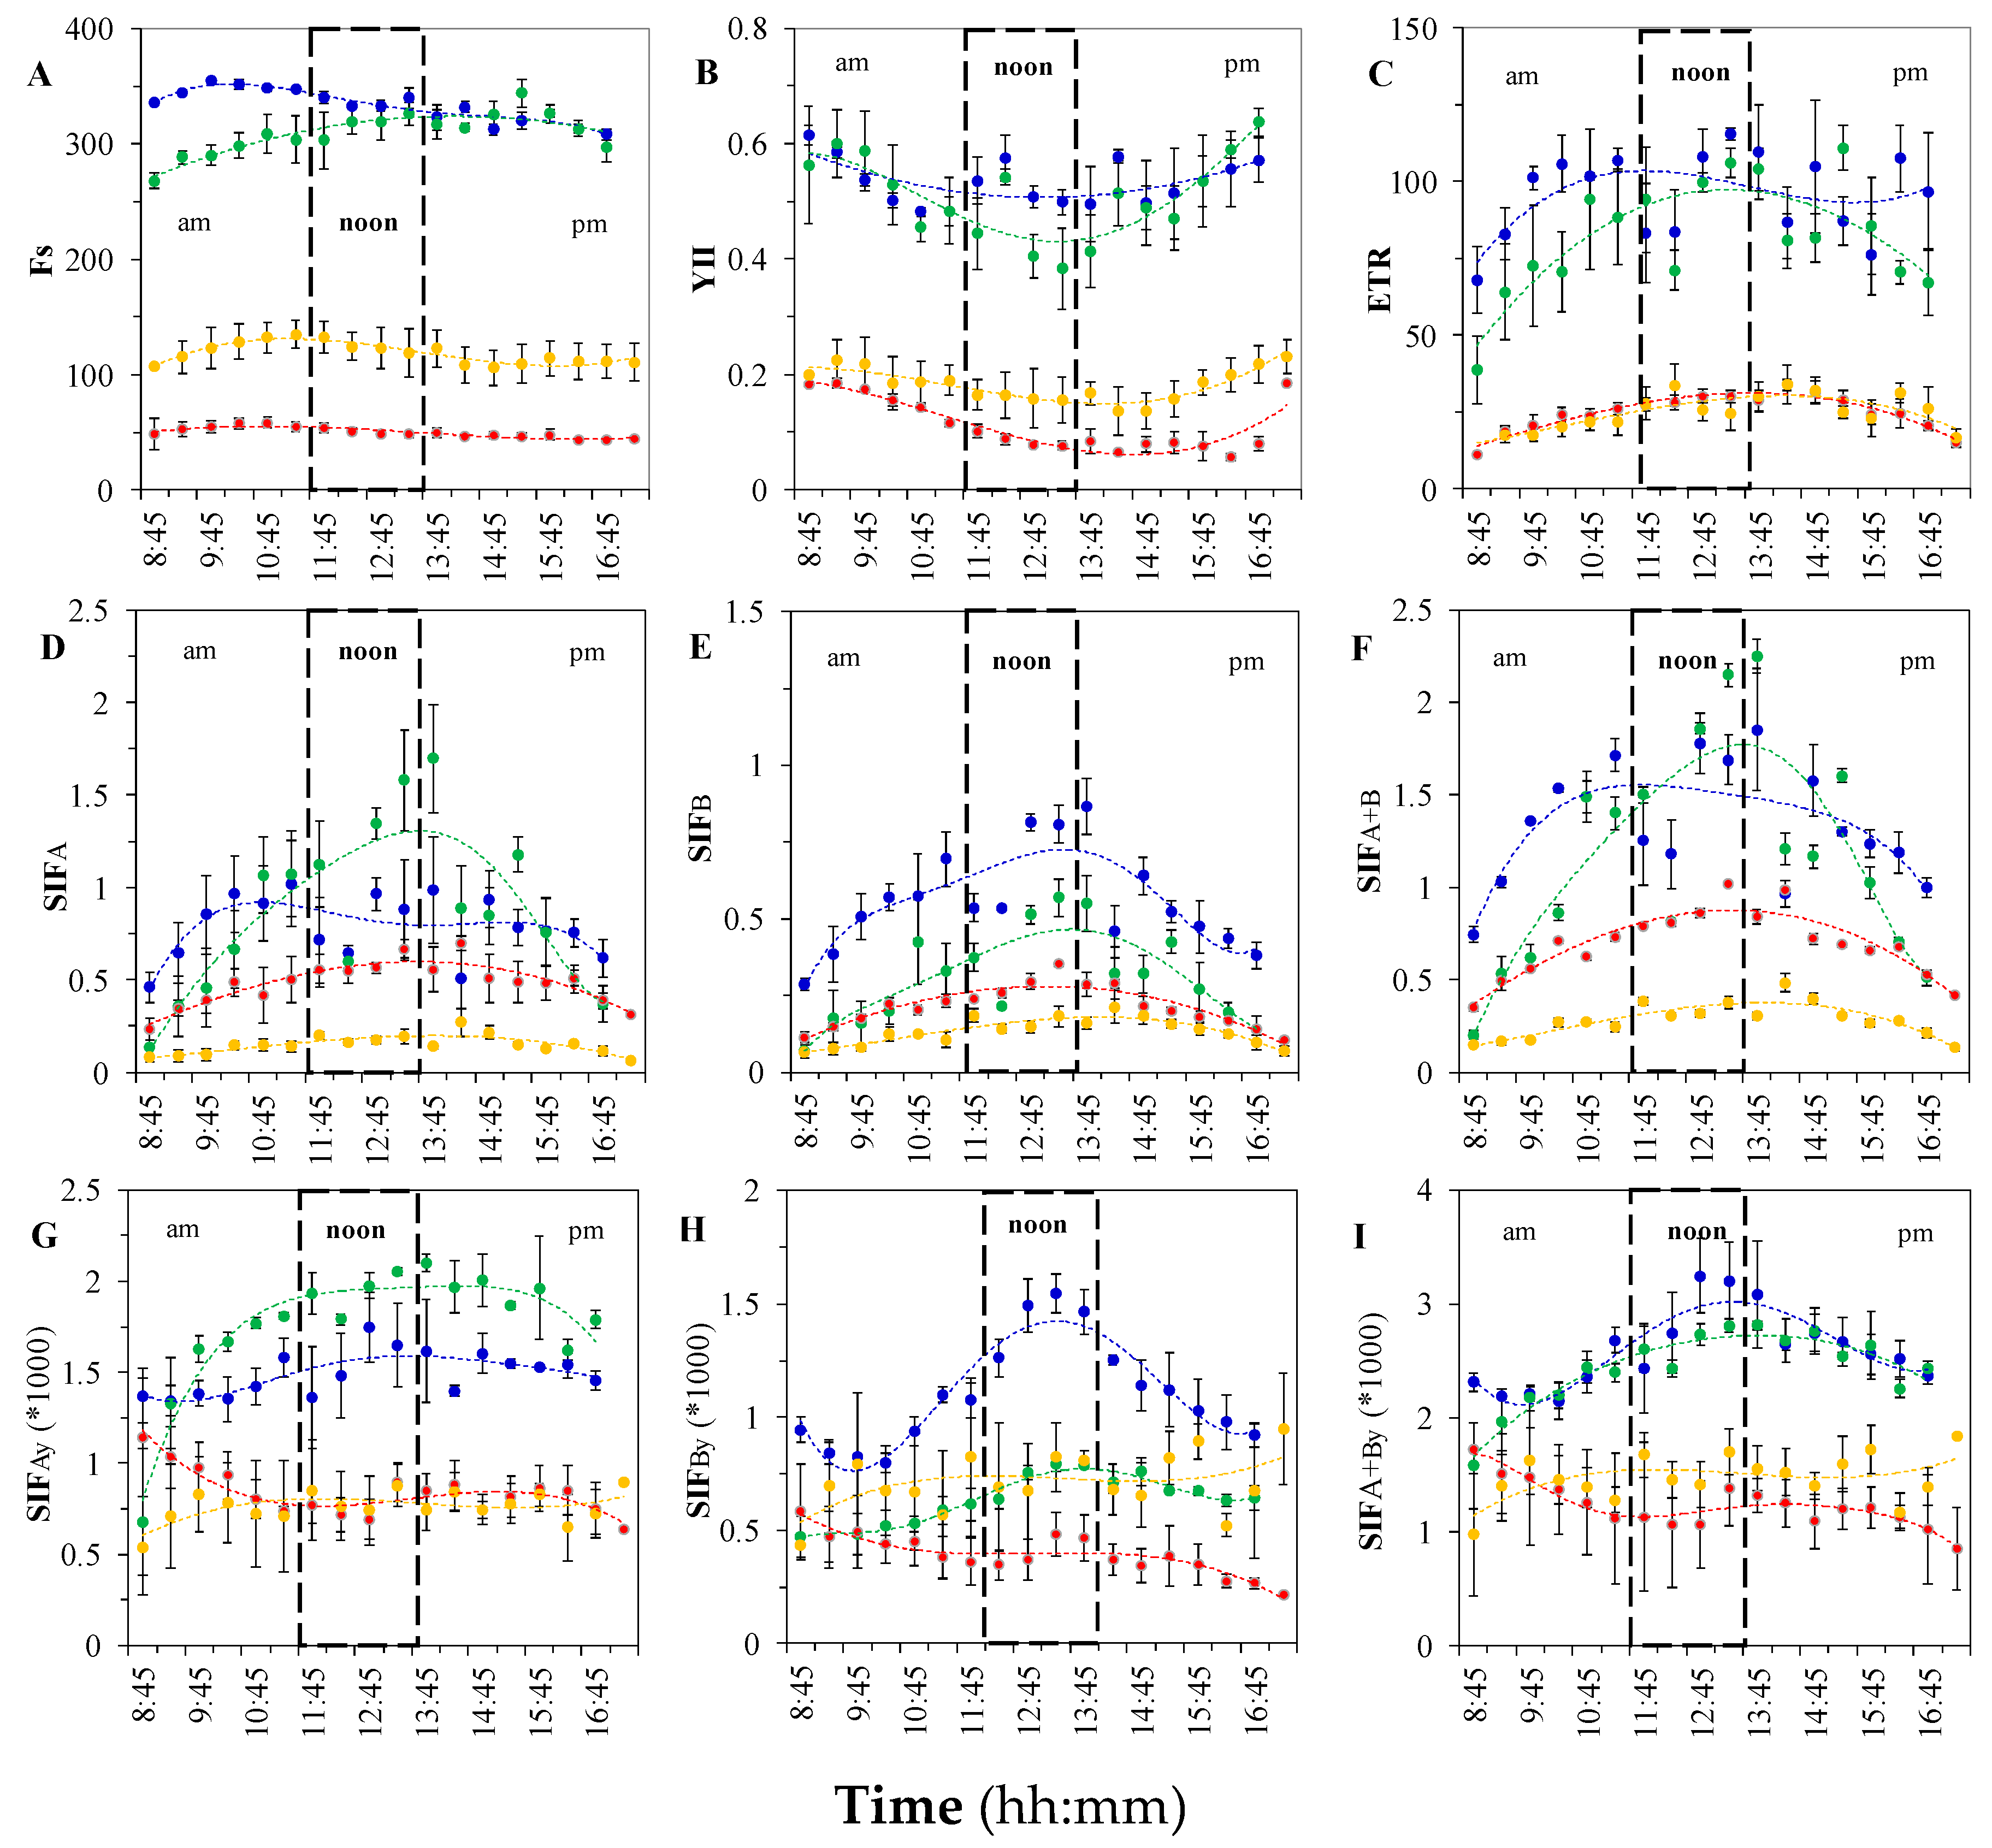
3.1.3. Variation in Leaf-level Chlorophyll Fluorescence

The steady state fluorescence (Fs) magnitude was distinctly higher during the young and mature stages, as compared to the S1 and S2 (Figure 5A). During the young stage, Fs reached a daily maximum in the morning (Table 3), while during the mature, S1, and S2 stages, highest daily Fs was observed at midday. During the young and mature stages, similar Fs amounts were emitted at noon and in the afternoon. The magnitude of afternoon Fs was lower than the in the morning only during the young stage (Figure 5A). Fs has been suggested as a leaf proxy for SIFA [51], however it is especially difficult to compare directly the variation in Fs to the variation in SIF, since Fs does not translate to radiance units and the incident and absorbed PAR varied diurnally and during the season.
During the young stage YII did not significantly change during the day (Table 3). During the mature stage, midday YII was lower, but the morning and afternoon levels were not significantly different (Table 3, Figure 5B). The mean midday YII values declined in the mature as compared to the young stage (Figure 3C), and YII was significantly lower during the S1 and S2 stages (Figure 3C, 5B, Table 3). During the S1 and S2 stages, YII was highest in the morning, declined gradually until the early afternoon, and recovered later to magnitudes similar to those observed in the morning (Figure 5B). The patterns of the diurnal variation in YII resembled these observed in LUE and PRI (Figure 4E–F).
The highest ETR was observed during the young stage, which was reached in the late morning and maintained during the day (Figure 5C). During the young and mature stages midday ETR had distinctly higher magnitude as compared to S1 and S2 (Figure 3D). During the mature stage, ETR had a pronounced midday maximum. The diurnal variation in ETR resembled the trends observed in GPP during the young and mature stages. Only during the mature growth stage did ETR vary significantly when comparing the three observation periods (am/noon/pm, Table 3). ETR magnitudes and dynamics were almost identical during both S1 and S2 stages (Figure 5C).

3.1.4. Variation in Canopy SIF Metrics

SIFA, SIFB, and SIFA+B exhibited a pronounced diurnal pattern, with highest average values measured close to midday (Figure 5D–F, Table 3). During the young stage, in the morning, SIFA and SIFA+B increased relatively quickly, reaching a highest value at approximately 10:45 (Figure 5D). In comparison, SIFB also increased fast until approximately 10:45, but afterwards it continued to rise more gradually until the early afternoon, declining afterward. During the young stage, the diurnal patterns of SIFA and SIFA+B (Figure 5D, F) closely followed the patterns of the PAR and GPP diurnals (Figure 4A, D). The highest SIFB was measured during the young stage, while higher levels of SIFA and SIFA+B were measured during the mature stage (Figure 5, Table 3).
During senescence, SIF yields (SIFBy, SIFAy and SIFA+By) were significantly higher in the morning, declining until midday, and remained relatively unchanged during the remainder of the day (Table 3). The highest SIFAy average was observed during the mature stage, when Clred also reached significantly higher levels (Table 3). During the mature stage, the magnitude of SIFAy increased in the morning, reaching a daily maximum at noon, and declined in the afternoon (Figure 5G). SIFAy separated the young and mature from the senescent growth stages during most of the day (Figure 5G, Table 3).
The diurnal profiles of SIFBy significantly differed with growth stage (Figure 5H, Table 3 AVOVA GLM). During the young stage, the magnitude of SIFBy was distinctly higher, as compared to the remaining growth stages, and the dynamics of the diurnal variations were more complex (Figure 5H). During the young stage, SIFBy decreased until mid-morning (Figure 5H, 9:45), which corresponds inversely with the increase in APAR (Figure 4C) at the same time. SIFBy increased to a mean maximum at midday (Figure 5H), and gradually declined afterwards. The diurnal profile of SIFBy depicted a clear separation between the observations of the young and the observations of the mature and senescent stages at midday (Figure 5H, Table 3), which resembled the pattern established for LUE (Figure 4E). The diurnal variations in SIFA+By during the young and mature stages did not significantly differ (Figure 5I), with highest mean SIFA+By values observed at midday for both (Table 3). During the senescent stages, the SIF yield metrics were higher in the morning, steadily declined throughout the day, and reached lowest mean values in the late afternoon, which distinctly differed from the patterns observed during the young and mature stages.
Analysis of variance (ANOVA GLM) established that the diurnal variations in LUE, NDVI, PRI, SIFBy, and SIFA+B significantly differed on a seasonal timescale (Table 3, ‡ significant interaction term between time of day and growth stage). Normalizing the SIF metrics, using parameters that change in a similar manner with time of day and growth stage, could be beneficial for comparison and deriving models for estimating GPP and LUE (e.g., normalizing by PAR, APAR, Clred).

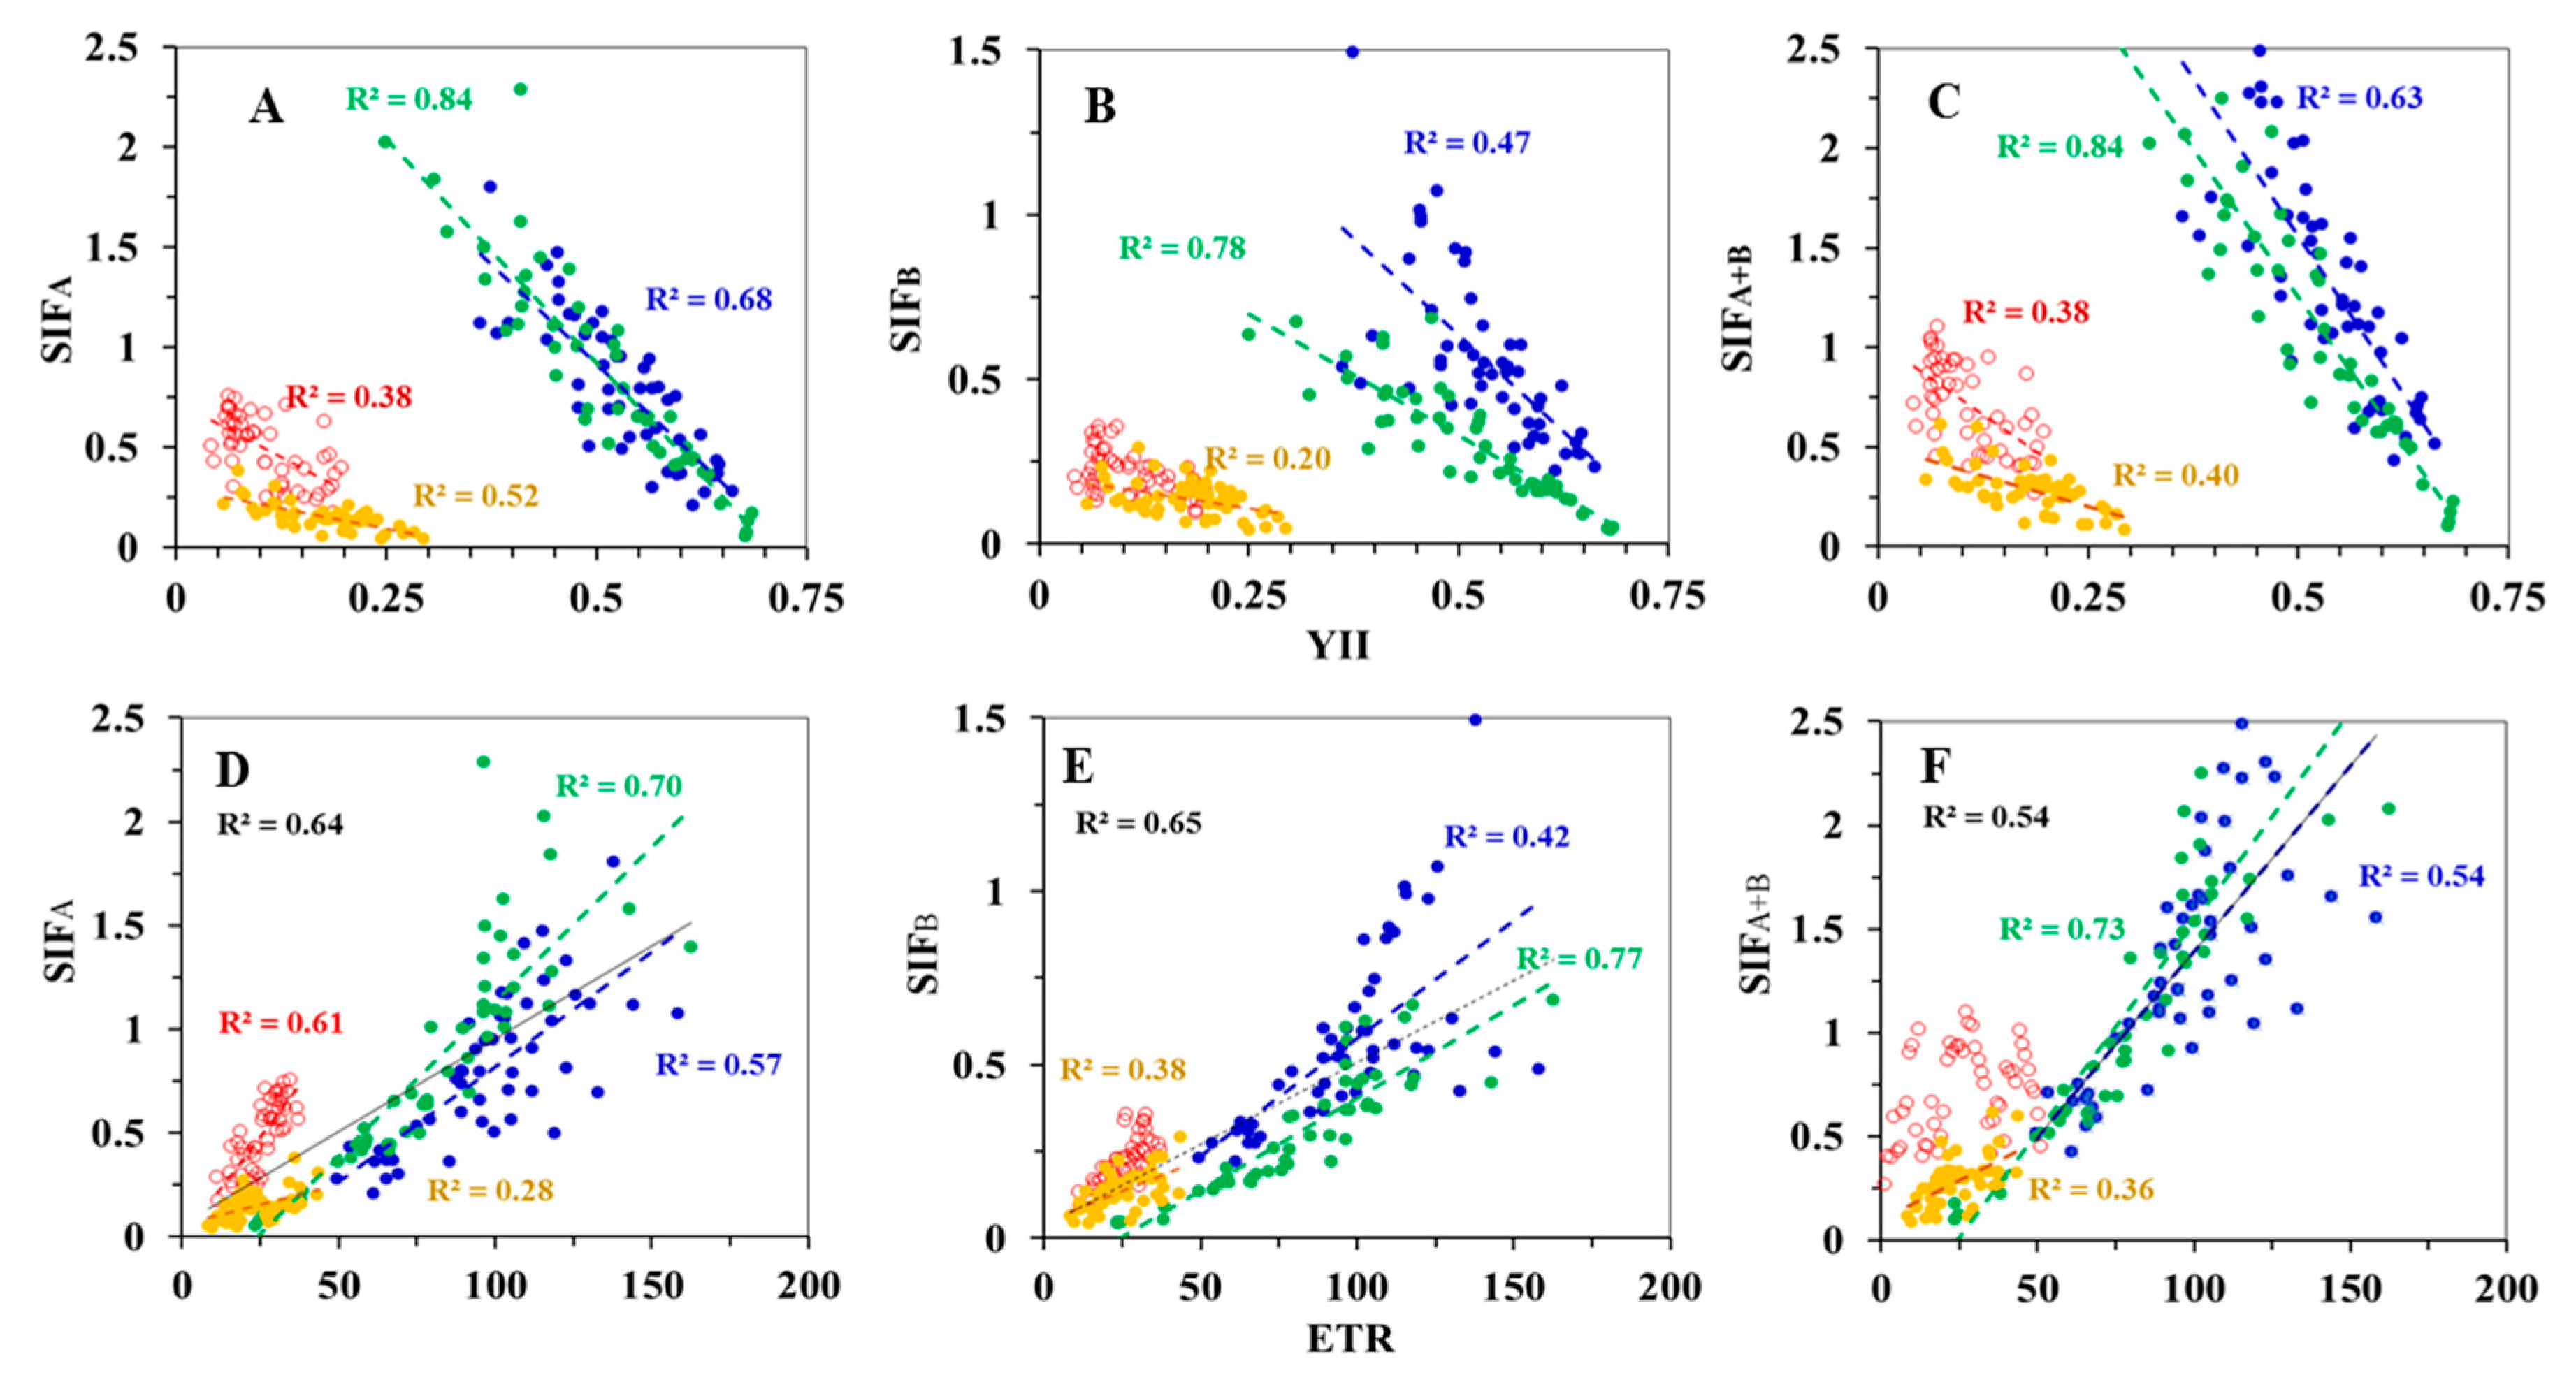
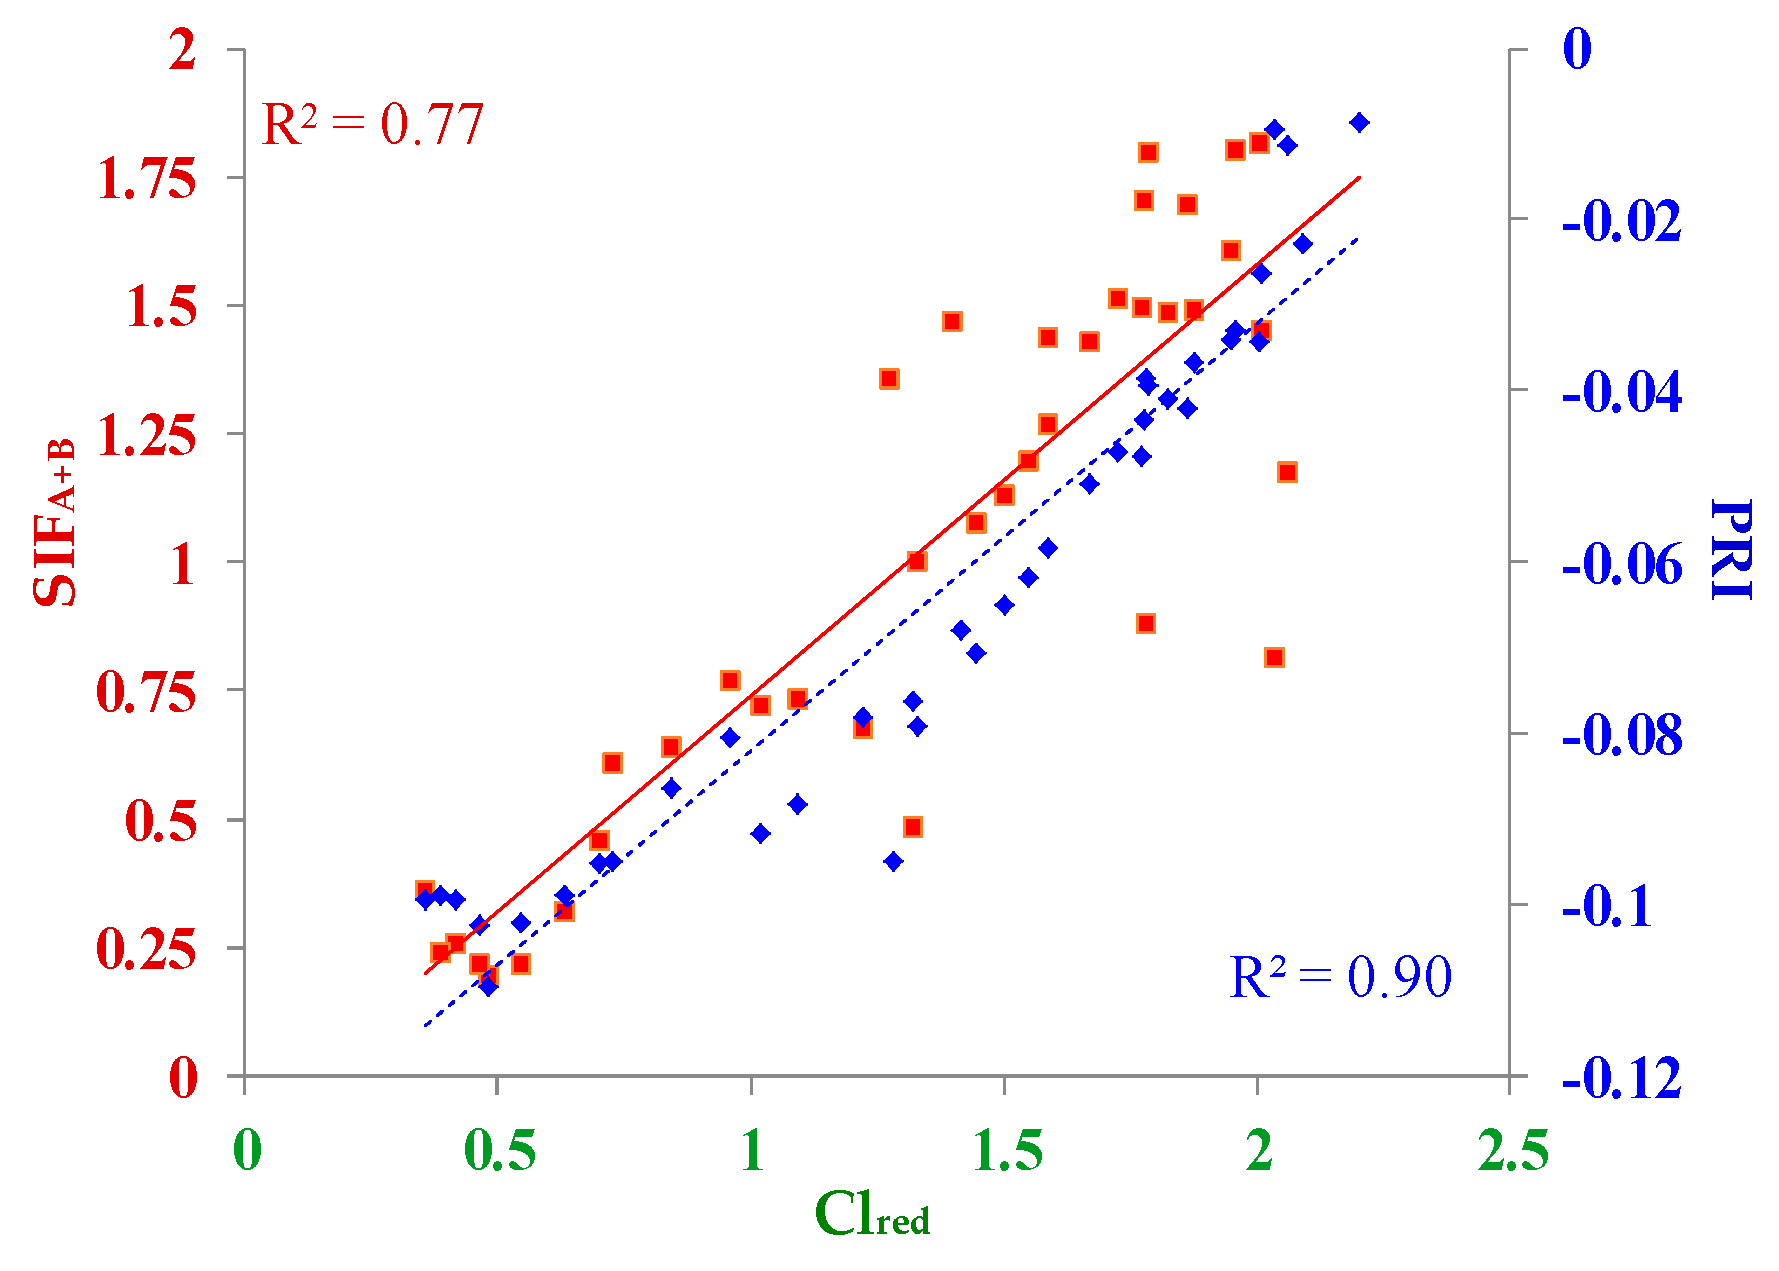
3.2. Correlations between Diurnal Sets of Observations across Corn Growth Stages

The linear relationships between canopy photosynthetic activity (i.e., GPP) and the optical metrics are shown in Figure 6 and Figure 7, where the strength of relationships is indicated by the coefficients of determination (R2, percentage of explained variation in the dependent variable) in colors corresponding to the growth stage. The overall coefficient of determination is listed in black only when the relationship was statistically significant (p < 0.01). The correlation between GPP and YII was negative (Figure 6A), while positive linear relationships with GPP were established for ETR (Figure 6B), APAR (Figure 6C), and the SIF metrics (Figure 6D–F). Stronger correlations emerged between GPP and the observations collected during the young and mature stages. The relationships between observations from the S1 and S2 stages maintained linearity, however, the relationships were not statistically significant (p > 0.01). The correlation between GPP and YII (Figure 6A) grouped the observations from the young and mature stages, separating them from those from both S1 and S2 stages.
Strong overall correlations with GPP were established for SIFA, SIFB, and SIFA+B (Figure 6D–F), grouping the observations from all growth stages together, thus providing the potential for estimating GPP using a generalized (i.e., common) relationship across all growth stages. Overall, the highest correlation emerged between GPP and SIFA+B (R2 = 0.78, Figure 6F), with the strongest association identified between observations from the mature growth stage (R2 = 0.80, Figure 6F), followed by the correlation between the observations from the young stage (R2 = 0.78). Using observations from the young stages, the strongest correlations were established between GPP and SIFA (R2 = 0.79, Figure 6E). Comparing the correlations between observations from the mature stage, GPP was strongly correlated with SIFB, followed by SIFA+B, SIFA, YII, and ETR (i.e., R2 = 0.82, Figure 6D; R2 = 0.80, Figure 6F; R2 = 0.78, Figure 6E; R2 = 0.77, Figure 6A; R2 = 0.71, Figure 6B; respectively). During the young stage, the correlation between GPP and SIFB explained a slightly larger proportion of the variation in GPP as compared to APAR (R2 = 0.79 vs. R2 = 0.77, respectively). During the young and mature stages, SIFA and SIFA+B explained a larger percent of the variation as compared to APAR, with SIFA+B providing the stronger correlations (Figure 6F).
Negative linear relationships were established between YII and the SIF metrics (Figure 7A–C), explaining an equally large amount of the variation in SIFA and SIFA+B during the young and mature stages (Figure 7C, R2 = 0.63 and R2 = 0.84, respectively). The strength of these correlations was most pronounced for the observations from the mature stage (green points in Figure 7A–C). The linear regressions between YII and SIFA and SIFA+B clearly separated the observations collected during the senescent stages from those collected during the young and mature stages. The strength of the correlations between YII and SIFB and the slopes of the relationships differed with growth stage (Figure 7B).
Positive linear relationships were established between ETR and SIF (Figure 7D–E), with the highest amount of the variation in the data explained for the SIFB observations from the mature stage (Figure 7E, green, R2 = 0.77). The relationships between ETR and the SIF metrics grouped the observations from all growth stages closer to a linear relationships, however, the overall coefficients of determination identified a moderate overall association strength (i.e., overall R2 = 0.54–0.65).
Using the complete diurnal sets (i.e., 8:45–16:15 data), the correlations between the SIF yield metrics (i.e., SIFAy, SIFBy, SIFA+By) and leaf YII and ETR produced weaker relationships of low statistical significance (p > 0.01), and, similarly, no statistically significant correlations were established between GPP diurnal observations and SIF yields.

3.3. Correlations between Observations Collected under Different Conditions for Photosynthesis

The relationships between GPP, LUE, and the remote sensing metrics (i.e., APAR, VIs, SIF, and SIFy) were investigated using linear regression analysis. It was anticipated that the midday SIF observations collected under high PAR levels, when the process of photosynthesis is fully activated, would provide stronger correlations and a more unbiased comparison of photosynthetic function across the corn growth stages. The strength of the relationships are compared in Table 4, independently evaluating the relationships for measurements collected at low PAR levels in the morning, afternoon, and at midday from the midday observations when PAR is at saturating levels for photosynthesis, YII, and ETR (i.e., PAR ≥ 1150 µmol/m2/s). PAR < 1150 was observed at middays on the days with partial cloud cover, when the FLoX was able to maintain consistent measurements.

3.3.1. Low PAR Conditions Including the Morning, Midday, and Afternoon Time Periods
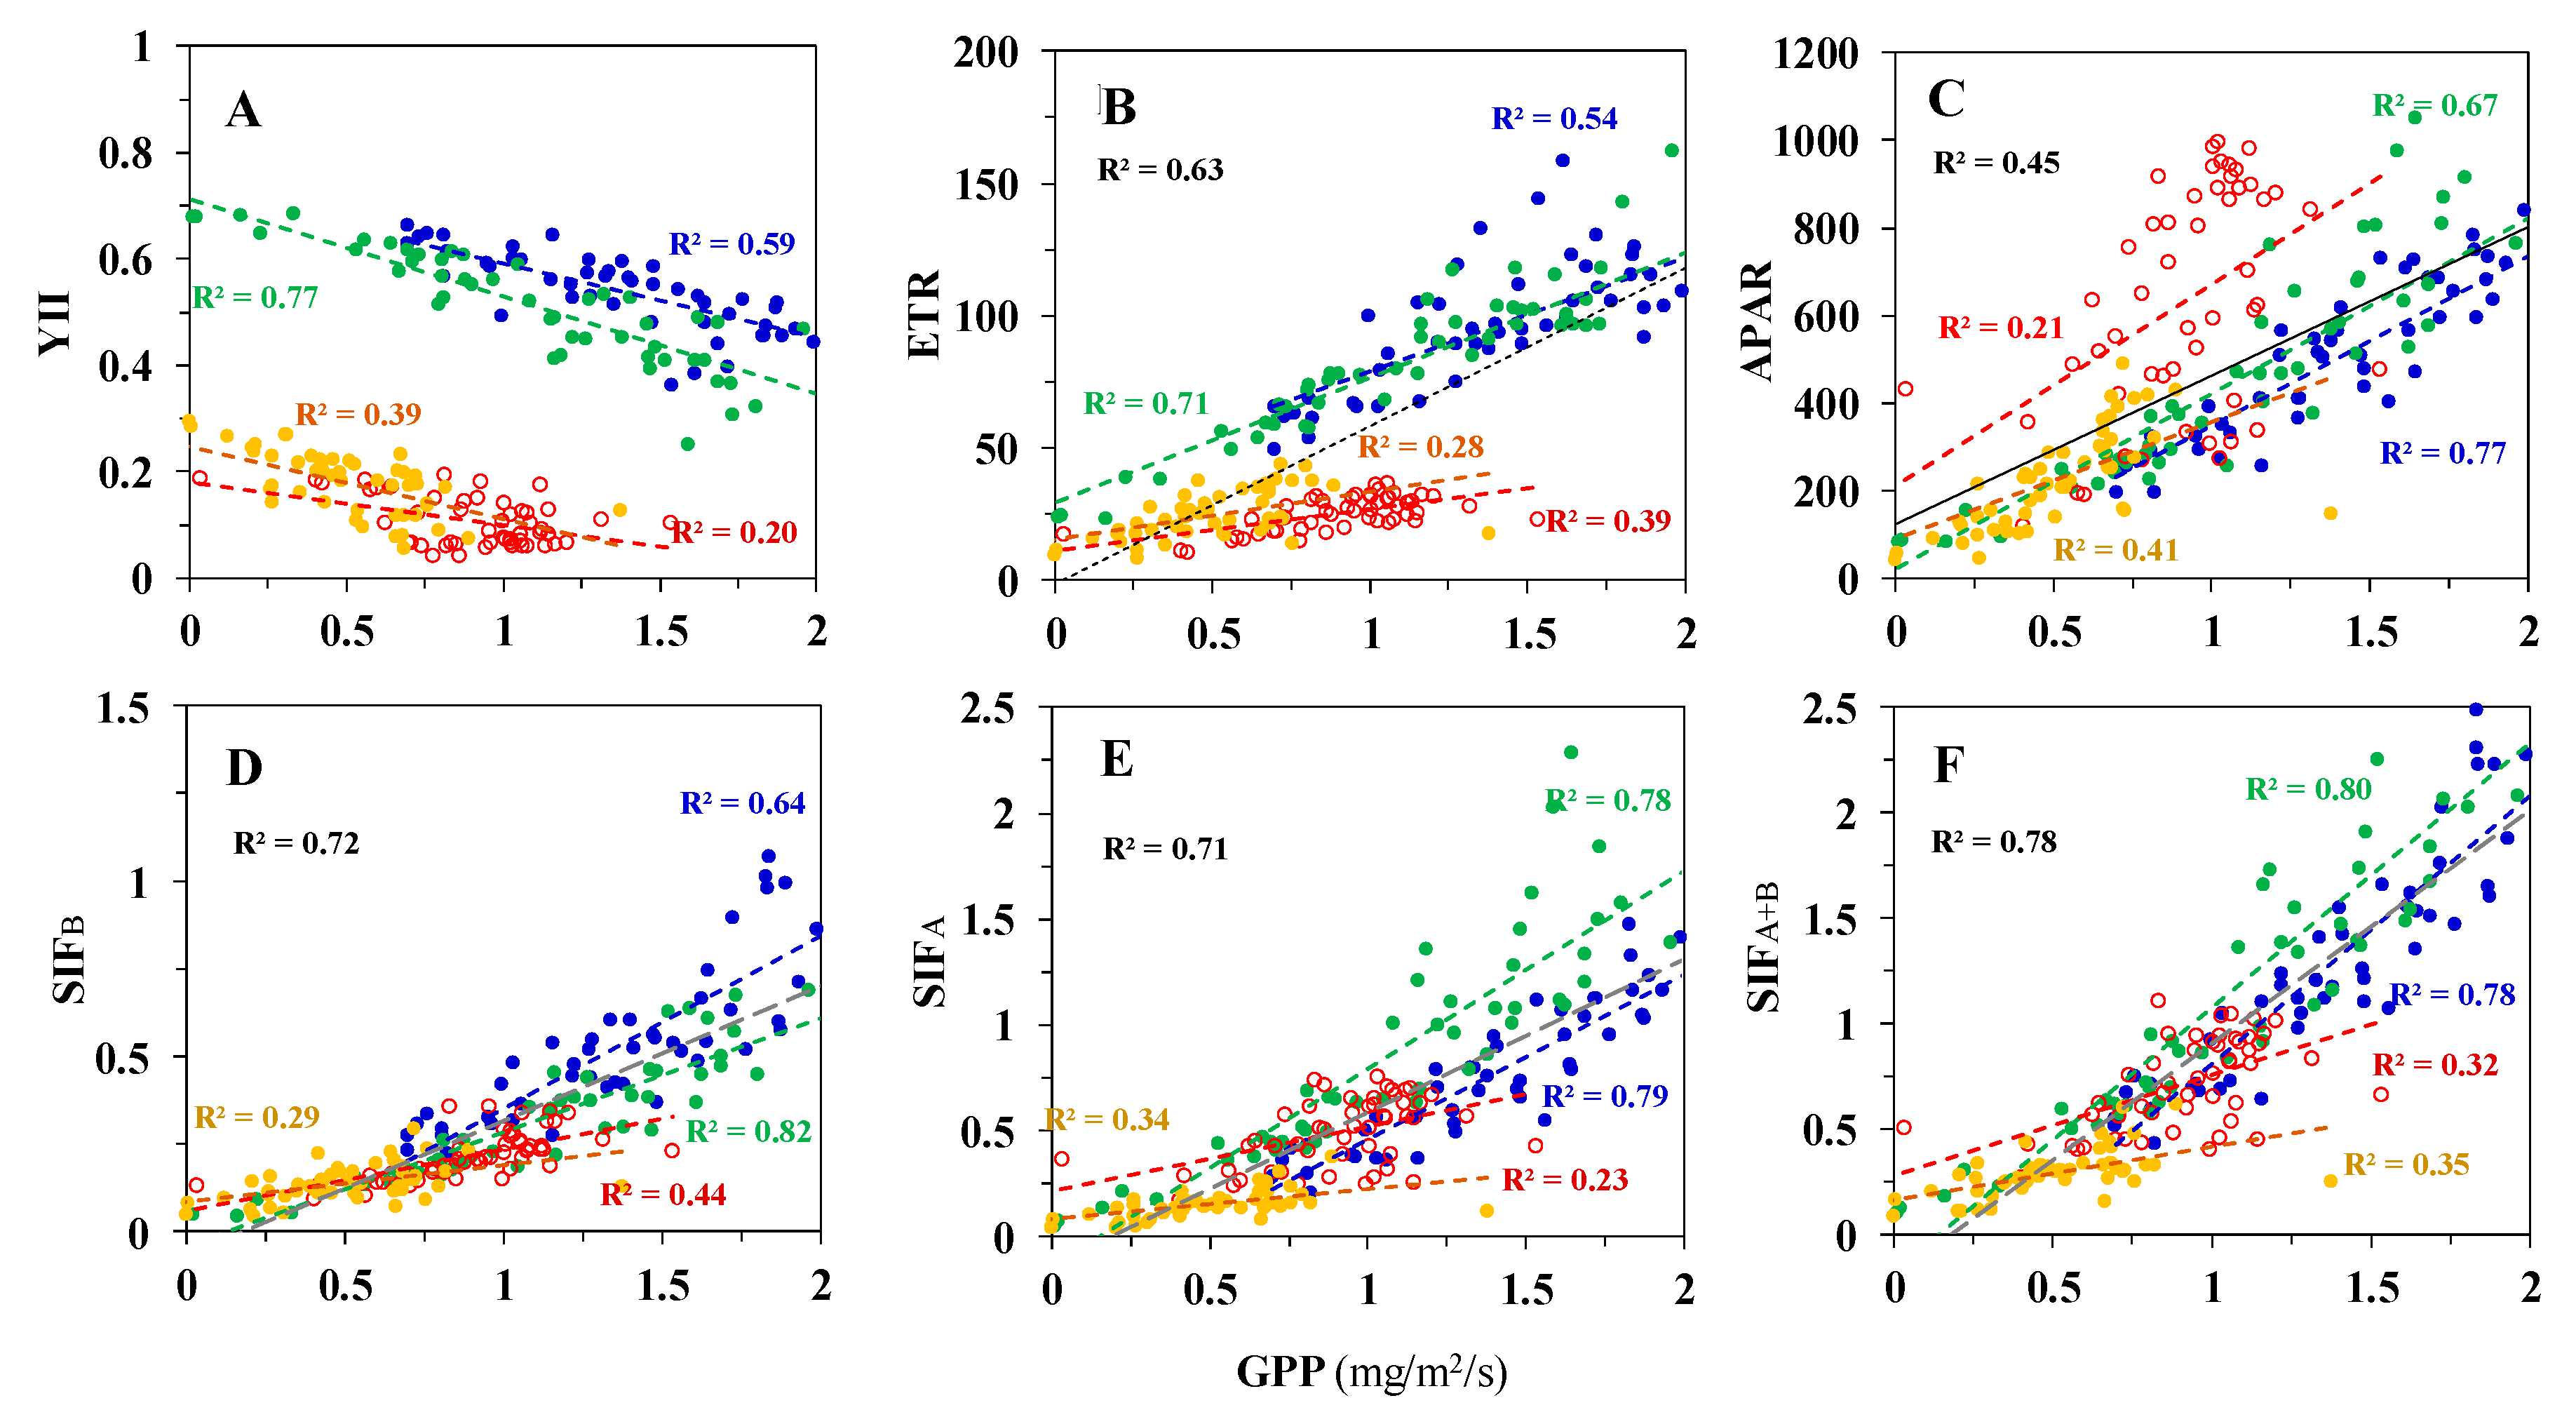
Correlations to GPP

Strong correlations were established during the morning period between GPP and both PAR and APAR (Table 4, R2 = 0.60, R2 = 0.79, respectively), at midday with APAR (R2 = 0.75, Table 4), and in the afternoon only weakly with PAR. This finding indicates that, during the morning period, the variations in GPP at the corn site are mostly driven by the variations in PAR and APAR.
At the leaf level, strong correlations were established between GPP and ETR (Table 4, morning R2 = 0.75, midday R2 = 0.70, afternoon R2= 0.66). At the canopy level, the strongest correlation was established with the morning observations of GPP for SIFA+B (R2 = 0.88), followed by the correlation for SIFA (R2 = 0.86). Considering only the midday timeframe, at low PAR, strong correlations were observed between GPP and SIFA+B (R2 = 0.83), followed by SIFA (R2 = 0.80), PRI (R2 = 0.73), and SIFAy (R2 = 0.74).

Correlations to LUE

Under low PAR, there was no significant association between LUE and APAR. Leaf-level ETR and YII were correlated with LUE only weakly during the morning, and YII moderately during midday and the afternoon (Table 4). PRI was strongly correlated to LUE (R2 = 0.71), using only the afternoon observations. At midday, under low PAR, both SIFAy and NDVI were similarly correlated with LUE (R2 = 0.71 for both).

3.3.2. High Light Conditions (i.e., High PAR) at Midday

Correlations to GPP

Under saturating PAR levels, no significant relationship was established between APAR and GPP, which was anticipated. At the leaf level, YII exhibited the strongest correlation to GPP (Table 4, R2 = 0.81). At the canopy level, strong correlations were established between GPP and SIFA+By (R2 = 0.79), followed by PRI, SIFAy, and SIFA+B (R2 = 0.78, R2 = 0.75, and R2 = 0.75, respectively).

Correlations to LUE

Under saturating PAR levels, no significant relationship existed between APAR and LUE. As anticipated, at the leaf level under high PAR YII provided the strongest relationship to LUE (Table 4, R2 = 0.79). At the canopy scale, SIFA+By provided the strongest relationship to LUE (R2 = 0.71), followed by SIFBy (R2 = 0.70) and PRI (R2 = 0.67).
Tables summarizing the parameters of the linear correlations between GPP and the F metrics (i.e., listing slope, intercept, and coefficient of determination) for observations collected in the morning, midday, and afternoon, and under high and low PAR, are made available for completeness as Supplementary Materials.

4. Discussion

This study assembled a set of complementary observations for corn across the crop growth stages, including canopy GPP and leaf and canopy fluorescence metrics, to investigate their complex dynamic behavior at both diurnal and seasonal scales. During the analysis, we noted minimal effect of clouds and light variability on the FLoX VIs and SIF metrics, which is attributed to the innovative design of the FLoX system, the strategy for automated optimization of the acquisitions, and the data processing routines in which the set of quality flags identified the values acquired during unstable light conditions, generating a set of measurements obtained under a consistent sensor optimization, tailored for the incident light levels.
To our knowledge, very few studies have evaluated the correlation between the diurnal (i.e., 8:45–16:15 timeframe) dynamics in photosynthetic function in SIFA and SIFB across seasonality or multiple crop growth stages [42,49,50,51,52,66]. Most investigations have focused on the relationship of SIFA to GPP, since SIFA can be obtained globally from satellites, and evaluated either the SIF diurnal patterns or phenological changes. Comparing diurnals, prior research have demonstrated that LUE and SIFAy co-vary, and that their ratio tends to be constant under high light [27,50,51,66]. This study established stronger correlations of LUE to SIFA+By and to SIFBy under high PAR, and less so to SIFAy (Table 4). Recent studies [45,51] similarly report significant linear correlations between midday leaf-level chlorophyll fluorescence parameters (i.e., Fs), canopy PRI, and chlorophyll VIs for C3 coniferous and deciduous forests. These studies have reported a strong association of SIFA with NDVI and chlorophyll content, which our findings corroborate for a C4 crop, and, in addition, demonstrate that SIFB and SIFA+B were also strongly correlated with NDVI and Clred.
Recently, similar diurnal patterns and positive linear relationships between GPP and SIFA were reported using field and satellite observations for C3 and C4 canopies [36,37,42,43,44,45,50]. Based on the established correlations between diurnal observations (i.e., 8:45–16:45), we also report strong positive correlations to GPP for SIFA and SIFB. Our results for SIFA concur with the results from these investigations, and show that the relationships between diurnal GPP and SIFA varied with PAR condition (i.e., high vs. low) and growth stage for C4 canopy.
Our results report linear relationships between the SIF metrics (i.e., SIFA, SIFB, and SIFA+B) and YII, and between SIF and ETR, primarily during the mature stage (Figure 6), when canopy chlorophyll levels and Clred were highest. Prior investigations [42,44] have reported that YII correlates well with SIFAy for C3 canopies, which our findings did not support for corn, a C4 crop.
Using the complete diurnal sets of observations (i.e., 8:45–16:15), no strong linear relationships were established between the SIF yield metrics (i.e., SIFAy, SIFBy, SIFA+By) and either GPP or LUE, which could be indicative of the complex and nonlinear behavior of their association across the diurnal profile. Deriving consistent diurnal and seasonal estimates of canopy SIF yield remains challenging, due to the difficulties in estimation of the absorbed energy [31,59]. Some of the variations observed in the morning and afternoon estimates of APAR and the associated SIFAy, SIFBy, and SIFA+By could be attributed to the field data used for deriving the linear function between fAPAR and NDVI, which were collected near solar noon. While the implemented equation for deriving fAPAR describes the seasonal change in NDVI/fAPAR, it may underperform under low PAR early in the morning and in the late afternoon.
Prior studies characterizing the diurnal cycle in chlorophyll fluorescence during several consecutive days [38] reported that SIF (i.e., SIFA and SIFB) was mainly driven by PAR variation, but that fluorescence yield was severely reduced during the central hours of the day in association with stress factors (e.g., high light and temperature). Our results corroborate the importance of PAR as a driving factor for both GPP and SIF, as their yields (LUE and SIFy) co-varied closely (Table 4).
Under low PAR, SIFA+B and SIFA were correlated strongly with GPP, demonstrating higher sensitivity to GPP as compared to the sensitivity of APAR to GPP (Table 3). Under high PAR levels, SIFA+By and SIFAy captured the variation in GPP optimally. Under a saturating PAR leaf level YII was also strongly correlated with GPP and indicative of canopy photosynthetic function. SIFA+By and SIFBy offered sensitive capabilities for assessment of LUE under saturating PAR, which outperformed PRI, but were inferior as compared to the utility of YII, which explained the highest percentage of the variation in LUE. Under low PAR, the sensitivity of YII to LUE was significantly lower, and the correlations using SIF metrics varied strongly according to time of observation during the day. The use of multiple SIF metrics, depending on PAR condition, offers the potential to improve the sensitivity of statistical models for estimating GPP and LUE, and therefore needs to be considered. Our findings demonstrate that, at midday, under higher PAR levels (e.g., saturating for photosynthesis) YII was correlated more accurately with GPP and LUE (Table 3). Under lower PAR levels, ETR exhibited strong correlations to GPP (Table 3), and also to the canopy SIF metrics, which are strongly influenced by the changing PAR levels, and therefore may suffer inaccuracies.
Further research, investigating the capability of SIF metrics for scaling and spatially extrapolating leaf YII and ETR under varying PAR conditions, is warranted for both C3 and C4 canopies. Recent studies [42,44,47] measuring C3 vegetation used supplemental dark-adapted measurements to augment PAM light-adapted observations and successfully estimate non-photochemical quenching during the day (NPQ) in a modeling framework, and thus enabled the partitioning of leaf PAR into YII, NPQ, and heat dissipation. Future efforts enhancing the current dataset with estimates of NPQ would yield a long term dataset for partitioning of APAR for C4 vegetation, which is not currently available.
Currently SIF observations are available from field, airborne, and space-borne platforms, which are collected at different light levels and times during the day. Their sensitivity for evaluation of photosynthetic function and scaling between leaf and canopy levels would likely benefit from a separate consideration depending on PAR condition (i.e., PAR below or above saturation level for photosynthesis), which would likely improve their applicability for monitoring of GPP and LUE.
GPP, APAR, NDVI, CLred and SIF maintained similar diurnal patterns across the growing season, while the diurnal pattern of PRI changed during the early senescence stage (Figure 2E and Figure 4F). To our knowledge, the change (i.e., inversion) in the PRI diurnal profiles has not been reported previously for corn canopies, and further research is warranted to investigate if it also applies to other species.
In addition to the metabolic changes advancing with phenology, major drivers of the seasonal dynamics in photosynthesis and the associated fluorescence and reflectance properties include variation in light and the seasonal dynamics in canopy chlorophyll. The seasonal changes in midday values for PRI appeared driven mostly by the changes in canopy chlorophyll, as indicated by their strong correlations with CIred (Figure 8). Similar relationships were also observed for both SIFA and SIFB in relation to CIred. These findings are corroborated by previous research evaluating the relationship of canopy PRI and a chlorophyll index (e.g., MTCI) for loblolly stands of various ages [30]. Our findings confirm the capability of SIFA, SIFB, SIFA+B, and their yields to enable more consistent interpretation and estimation of GPP and LUE, and strongly suggest that their diurnal and seasonal dynamics should be considered for scaling of photosynthetic function from leaf to canopy levels.
Although the spectral data used in this study were acquired from a nadir orientation, it is widely documented that the reflectance measured from vegetation canopies varies with solar illumination angle due to variations in shadows, understory background, and canopy parameters such as biomass and leaf area index, which contribute to the variation in the results to a different degree [12,13,58,59]. A full analysis of the sensitivity of the relationships between GPP and the SIF metrics, focusing on these effects, is warranted. An improved understanding of the drivers of variation with phenology, and the implementation of a strategy for normalisation of their effects, would be a logical follow up research effort. Since the present dataset was collected at a close proximity to the canopy, future efforts would be warranted, using modeling scenarios [67,68,69] to determine whether our present findings can scale successfully to airborne and satellite levels.
Incorporating the consistently collected spectral and field datasets into the Automated Radiative Transfer Models Operator (ARTMO) framework will facilitate the data interpretation, comparisons, and scaling from the leaf to the canopy and above [69] of vegetation function and the associated biophysical variables, which is of importance for the forthcoming spectroscopy missions such as NASAs SBG [70], EnMAP [71], and ESA FLEX [52,72].
Ultimately, we would like to trace the changes in photosynthetic function with phenology and not chlorophyll content or canopy biomass, the effects of which can be domineering and can obscure the relationships of PRI and SIF to GPP.

5. Conclusions

Using automated systems, this research effort assembled a set of corresponding leaf and canopy chlorophyll fluorescence and reflectance measurements, representative of the diurnal dynamics in the major growth stages for corn, which is supported by canopy GPP collected by an eddy co-variance tower. Statistical analyses of the observations demonstrated that: (1) Canopy SIF was able capture the dynamics in leaf level light-adapted YII and ETR, and SIFA+B exhibited the strongest correlation. (2) As compared to APAR and PRI, SIF metrics provided stronger relationships to GPP and LUE, which differed depending on PAR levels: strongest correlations to GPP under low PAR were provided by SIFA+B and SIFA, under high PAR by SIFA+By and SIFAy; PRI had the strongest correlation to LUE under low PAR, while under high PAR, SIFA+By and SIFBy provided stronger correlations. (3) The relationships of canopy SIF to leaf F and to canopy GPP differed during the day in association with the diurnal variation in PAR and GPP and with growth stage.
This study demonstrated that canopy SIF metrics co-varied with leaf ETR and YII, both indicative of photosynthetic function at leaf level, and therefore show high potential for scaling photosynthetic processes from leaf to canopy level. Using diurnals from the different growth stages, single linear relationships between LUE and SIFA+By, and LUE and SIFBy described approximately seventy percent of the variation in data associated with both time of observation and growth stage. Diurnal observations of SIF (both SIFA and SIFB) and SIF yield (i.e., SIFAy, SIFBy, and SIFA+By), spanning the growing season can provide an important capability for remote sensing of canopy GPP and LUE, however, additional research and analysis are warranted to corroborate the applicability of these findings for other species. The change in the PRI diurnal pattern established with corn senescence requires further investigation using other species. Future research is needed to evaluate the driving factors for the established relationships between canopy GPP and the associated reflectance and fluorescence properties, in the context of varying climate and environmental conditions, and using independent field bio-physical measurements.
The results contribute to enhancing the ability to relate the commonly measured leaf-level photosynthetic parameters to the canopy level, based on SIFA, SIFB, SIFA+B, and their yields. SIFA is currently measured by satellites (e.g., GOME-2, GOSAT, OCO-2) and the measurement of SIFA, and both SIFA and SIFB are targeted by the future NASA GeoCarb and ESA FLEX missions, respectively.

Supplementary Materials

The following are available online at https://www.mdpi.com/2072-4292/11/5/488/s1, Table S1: Linear correlation coefficients (R2) between Gross Primary Production (GPP) and leaf-level active fluorescence metrics (PSII (YII) and electron transport rate (ETR), canopy-level optical indices (normalized difference vegetation index (NDVI), photochemical reflectance index (PRI), chlorophyll index (CIred), and photosynthetically active radiation (PAR) metrics. Table S2: Linear correlation coefficients (R2) between midday Gross Primary Production (GPP) and leaf-level active fluorescence metrics (PSII (YII) and electron transport rate (ETR), canopy-level optical indices (normalized difference vegetation index (NDVI), photochemical reflectance index (PRI), chlorophyll index (CIred), and absorbed photosynthetically active radiation (APAR).

Author Contributions

Conceptualization, P.K.E.C., K.F.H., T.J., E.M.M.; methodology, P.K.E.C., T.J., A.B., A.L.R., C.S.T.D., W.P.K.; data curation and analysis, P.K.E.C, L.A.W., T.J., K.F.H.; writing—original draft preparation, P.K.E.C.; writing—review and editing, P.K.E.C., K.F.H., E.M.M.

Funding

This research supports the following NASA/ROSES grants: (1) Next Generation UAV Based Spectral Systems for Environmental Monitoring, NNH14ZDA001N-AIST; (2) Prototyping Multi-Source Land Imaging (MuSLI) Canopy Chlorophyll for the assessment of vegetation function and productivity, NNH17ZDA001N-LCLUC; and (3) Spectral Bio-Indicators of Ecosystem Photosynthetic Efficiency, NNH09ZDA001N-TE. The sources of support for co-author L. Ward, include: NASA/GSFC Office of Education, Summer internship 2018; Hawaii Space Grant Consortium at the University of Hawaii and the Michigan Space Grant Consortium, University of Michigan.

Acknowledgments

We acknowledge the support of NASA and the GSFC Biospheric Sciences Laboratory. The research was possible due to the long-term collaboration with the scientists from the United States Department of Agriculture-Agricultural Research Service, Hydrology and Remote Sensing Lab, Beltsville, MD, which enabled the coordinated collections at OPE3.

Conflicts of Interest

The authors declare no conflict of interest. The FLoX spectral systems are developed by the co-authors T. Julitta and A. Burkart.

References

  1. Maxwell, K.; Johnson, G.N. Chlorophyll fluorescence-A practical guide. J. Exp. Bot. 2000, 51, 659–668. [Google Scholar] [CrossRef] [PubMed]
  2. Larcher, W. Physiological Plant Ecology, 3rd ed.; Springer: Berlin, Germany, 2003. [Google Scholar]
  3. Gitelson, A.A.; Buschmann, C.; Lichtenthaler, H.K. Leaf chlorophyll fluorescence corrected for re-absorption by means of absorption and reflectance measurements. J. Plant Physiol. 1998, 152, 283–296. [Google Scholar] [CrossRef]
  4. Gitelson, A.; Solovchenko, A. Non-invasive Quantification of Foliar Pigments: Principles and Implementation. In Hyperspectral Remote Sensing of Vegetation, 2nd ed.; Thenkabail, P.S., Lyon, J.G., Huete, A., Eds.; CRC Press-Taylor and Francis Group: Boca Raton, FL, USA; London, UK; New York, NY, USA, 2018; Chapter 5; Volume II, pp. 135–162. [Google Scholar]
  5. Peng, Y.; Nguy-Robertson, A.; Arkebauer, T.; Gitelson, A.A. Assessment of Canopy Chlorophyll Content Retrieval in Maize and Soybean: Implications of Hysteresis on the Development of Generic Algorithms. Remote Sens. 2017, 9, 226. [Google Scholar] [CrossRef]
  6. Rouse, J.W.; Haas, R.H.; Schell, J.A.; Deering, D.W. Monitoring vegetation systems in the Great Plains with ERTS. In Third Earth Resources Technology Satellite-1 Symposium; Freden, S.C., Mercanti, E.P., Becker, M., Eds.; Technical Presentations, NASA SP-351; NASA: Washington, DC, USA, 1974; Volume 1, pp. 309–317. [Google Scholar]
  7. Gamon, J.A.; Peñuelas, J.; Field, C.B. A Narrow-Waveband Spectral Index That Tracks Diurnal Changes in Photosynthetic Efficiency. Remote Sens. Environ. 1992, 44, 35–44. [Google Scholar] [CrossRef]
  8. Hunt, E.R.; Doraiswamy, P.C., Jr.; McMurtrey, J.E.; Daughtry, C.S.T.; Perry, E.M.; Akhmedov, B. A visible band index for remote sensing leaf chlorophyll content at the canopy scale. Int. J. Appl. Earth Obs. Geoinf. 2013, 21, 103–112. [Google Scholar] [CrossRef] [Green Version]
  9. Peñuelas, J.; Filella, I.; Gamon, J.A. Assessment of photosynthetic radiation-use efficiency with spectral reflectance. New Phytol. 1995, 131, 291–296. [Google Scholar] [CrossRef] [Green Version]
  10. Gamon, J.A.; Serrano, L.; Surfus, J.S. The photochemical reflectance index: An optical indicator of photosynthetic radiation-use efficiency across species, functional types, and nutrient levels. Oecologia 1997, 112, 492–501. [Google Scholar] [CrossRef] [PubMed]
  11. Middleton, E.M.; Huemmrich, K.F.; Landis, D.; Black, T.A.; Barr, A.; McCaughey, J.H. Remote sensing of ecosystem light use efficiency using MODIS. Remote Sens. Environ. 2016, 187, 345–366. [Google Scholar] [CrossRef]
  12. Ranson, K.J.; Daughtry, C.S.T.; Biehl, L.L. Sun angle, view angle, and background effects on spectral response of simulated balsam fir canopies. Photogrammic Eng. Remote Sens. 1986, 52, 649–658. [Google Scholar]
  13. Zarco-Tejada, P.J.; González-Dugo, V.; Williams, L.E.; Suárez, L.; Berni, J.; Goldhamer, D.; Fereres, E. A PRI-based water stress index combining structural and chlorophyll effects: Assessment using diurnal narrow-band airborne imagery and the CWSI thermal index. Remote Sens. Environ. 2013, 138, 38–50. [Google Scholar] [CrossRef] [Green Version]
  14. Lichtenhaler, H.K.; Buschmann, C.; Rinderle, U.; Shmuck, G. Application of chlorophyll fluorescence in ecophysiology. Radiat. Environ. Biophys. 1986, 25, 297–308. [Google Scholar] [CrossRef]
  15. Jones, H.G.; Vaughan, R.A. Remote Sensing of Vegetation: Principles, Techniques and Applications; Oxford University Press Inc.: New York, NY, USA, 2011; ISBN 978-0-19-920779-4. [Google Scholar]
  16. Van Wittenberghe, S.; Alonso, L.; Verrelst, J.J. Bidirectional sun-induced chlorophyll fluorescence emission is influenced by leaf structure and light scattering properties—A bottom-up approach. Remote Sens. Environ. 2015, 158, 169–179. [Google Scholar] [CrossRef]
  17. Krause, G.H.; Weis, E. Chlorophyll fluorescence as a tool in plant physiology. Photosynth. Res. 1984, 5, 139–157. [Google Scholar] [CrossRef] [PubMed]
  18. Genty, B.; Briantais, J.M.; Baker, N.R. The relationship between the quantum yield of photosynthetic electron transport and quenching of chlorophyll fluorescence. Biochim. Biophys. Acta Gen. Subj. 1989, 990, 87–92. [Google Scholar] [CrossRef]
  19. Jee, G. Advances in Photosynthesis and Respiration, Volume 19: Chlorophyll a fluorescence: A signature of photosynthesis. Photosynth. Res. 2005, 83, 101–105. [Google Scholar]
  20. Baker, N.R. Chlorophyll fluorescence: A probe of photosynthesis in vivo. Annu. Rev. Plant Biol. 2008, 59, 89–113. [Google Scholar] [CrossRef] [PubMed]
  21. Murchie, E.H.; Lawson, T. Chlorophyll fluorescence analysis: A guide to good practice and understanding some new applications. J. Exp. Bot. 2013, 64, 3983–3998. [Google Scholar] [CrossRef] [PubMed]
  22. Franck, F.; Juneau, P.; Popovic, R. Resolution of the Photosystem I and Photosystem II contributions to chlorophyll fluorescence of intact leaves at room temperature. Biochim. Biophys. Acta 2002, 1556, 246. [Google Scholar] [CrossRef]
  23. Vilfan, N.; van der Tol, C.; Muller, O.; Rascher, U.; Verhoef, W. Fluspect-B: A model for leaf fluorescence, reflectance and transmittance spectra. Remote Sens. Environ. 2016, 186, 596–615. [Google Scholar] [CrossRef]
  24. Porcar-Castel, A.; Pfundel, E.; Korhonen, J.F.J.; Juurola, E. A new monitoring PAM fluorimeter (MONI-PAM) to study the short- and long-term acclimation of photosystem II in field conditions. Photosynth. Res. 2008, 96, 173–179. [Google Scholar] [CrossRef] [PubMed]
  25. Baldacci, D. Assessing the eddy covariance technique for evaluating carbon dioxide exchange rates of ecosystems: Past, present and future. Glob. Chang. Biol. 2003, 9, 479–492. [Google Scholar] [CrossRef]
  26. Cheng, Y.-B.; Middleton, E.M.; Zhang, Q.; Huemmrich, K.F.; Campbell, P.K.E.; Corp, L.A.; Cook, B.D.; Kustas, W.P.; Daughtry, C.S.T. Integrating Solar Induced Fluorescence and the Photochemical Reflectance Index for Estimating Gross Primary Production in a Cornfield. Remote Sens. 2013, 5, 6857–6879. [Google Scholar] [CrossRef] [Green Version]
  27. Damm, A.; Elbers, J.; Gioli, B.; Hamidi, K.; Hutjes, R.; Kosvancova, M.; Meroni, M.; Migleta, F.; Moersch, A.; Moreno, J.; et al. Remote sensing of sun-induced fluorescence to improve modeling of diurnal courses of gross primary production (GPP). Glob. Chang. Biol. 2010, 16, 171–186. [Google Scholar] [CrossRef] [Green Version]
  28. Rossini, M.; Nedbal, L.; Guanter, L.; A’c, A.; Alonso, L.; Burkart, A.; Cogliati, S.; Colombo, R.; Damm, A.; Drusch, M.; et al. Red and far red Sun-induced chlorophyll fluorescence as a measure of plant photosynthesis. Geophys. Res. Lett. 2015, 42, 1632–1639. [Google Scholar] [CrossRef] [Green Version]
  29. Schickling, A.; Matveeva, M.; Damm, A.; Schween, J.; Wahner, A.; Graf, A.; Crewell, S.; Rascher, U. Combining Sun-induced chlorophyll fluorescence and photochemical reflectance index improves diurnal modeling of gross primary productivity. Remote Sens. 2016, 8, 574. [Google Scholar] [CrossRef]
  30. Middleton, E.M.; Rascher, U.; Corp, L.A.; Huemmrich, K.F.; Cook, B.D.; Noormets, A.; Schickling, A.; Pinto, F.; Alonso, L.; Damm, A.; et al. The 2013 FLEX - US Airborne Campaign at the Parker Tract Loblolly Pine Plantation in North Carolina, USA. Remote Sens. 2017, 9, 612. [Google Scholar] [CrossRef]
  31. Colombo, R.; Celesti, M.; Bianchi, R.; Campbell, P.; Cogliati, S.; Cook, B.; Corp, L.; Damm, A.; Domec, J.; Guanter, L.; et al. Variability of sun-induced chlorophyll fluorescence according to stand age-related processes in a managed loblolly pine forest. Glob. Chang. Biol. 2018, 1–17. [Google Scholar] [CrossRef] [PubMed]
  32. Frankenberg, C.; Fisher, J.B.; Worden, J.; Badgley, G.; Saatchi, S.S.; Lee, J.E.; Toon, G.C.; Butz, A.; Jung, M.; Kuze, A. New global observations of the terrestrial carbon cycle from GOSAT: Patterns of plant fluorescence with gross primary productivity. Geophys. Res. Lett. 2011, 38, 1–6. [Google Scholar] [CrossRef]
  33. Joiner, J.; Yoshida, Y.; Vasilkov, A.P.; Middleton, E.M. First observations of global and seasonal terrestrial chlorophyll fluorescence from space. Biogeosciences 2011, 8, 637–651. [Google Scholar] [CrossRef] [Green Version]
  34. Joiner, J.; Yoshida, Y.; Vasilkov, A.P.; Schaefer, K.; Jung, M.; Guanter, L.; Zhang, Y.; Garrity, S.; Middleton, E.M.; Huemmrich, K.F. The seasonal cycle of satellite chlorophyll fluorescence observations and its relationship to vegetation phenology and ecosystem atmosphere carbon exchange. Remote Sens. Environ. 2014, 152, 375–391. [Google Scholar] [CrossRef] [Green Version]
  35. Joiner, J.; Yoshida, Y.; Guanter, L.; Middleton, E.M. New methods for the retrieval of chlorophyll red fluorescence from hyperspectral satellite instruments: Simulations and application to GOME-2 and SCIAMACHY. Atmos. Meas. Tech. 2016, 9. [Google Scholar] [CrossRef]
  36. Sanders, A.F.; Verstraeten, W.W.; Kooreman, M.L.; van Leth, T.C.; Beringer, J.; Joiner, J. Spaceborne sun-induced vegetation fluorescence time series from 2007 to 2015 evaluated with Australian flux tower measurements. Remote Sens. 2016, 8, 895. [Google Scholar] [CrossRef]
  37. Wood, J.D.; Griffis, T.J.; Baker, J.M.; Frankenberg, C.; Verma, M.; Yuen, K. Multiscale analyses of solar-induced florescence and gross primary production. Geophys. Res. Lett. 2017, 44, 533–541. [Google Scholar] [CrossRef]
  38. Amoros-Lopez, J.; Gomez-Chova, L.; Vila-Frances, J.; Alonso, L.; Calpe, J.; Moreno, J.; del Valle-Tascon, S. Evaluation of remote sensing of vegetation fluorescence by the analysis of diurnal cycles. Int. J. Remote Sens. 2008, 29, 5423–5436. [Google Scholar] [CrossRef]
  39. Campbell, P.K.E.; Middleton, E.M.; Corp, L.A.; Kim, M.S. Contribution of chlorophyll fluorescence to the apparent vegetation reflectance. Sci. Total Environ. 2008, 404, 433–439. [Google Scholar] [CrossRef] [PubMed]
  40. Campbell, P.K.E.; Middleton, E.M.; Corp, L.A.; van der Tol, C.; Huemmrich, K.F.; Cendrero-Mateo, M.P.; Leifeld, J. Diurnal and phenological changes in vegetation fluorescence and reflectance, indicative of vegetation photosynthetic properties and function. In Proceedings of the 5th International Workshop on Remote Sensing of Vegetation Fluorescence, Paris, France, 22–24 April 2014; p. 9. [Google Scholar]
  41. Meroni, M.; Rossini, M.; Guanter, L.; Alonso, L.; Rascher, U.; Colombo, R.; Moreno, J. Remote sensing of solar-induced chlorophyll fluorescence: Review of methods and applications. Remote Sens. Environ. 2009, 113, 2037–2051. [Google Scholar] [CrossRef]
  42. Wyber, R.; Malenovský, Z.; Ashcroft, M.B.; Osmond, B.; Robinson, S.A. Do daily and seasonal trends in leaf solar induced fluorescence reflect changes in photosynthesis, growth or light exposure? Remote Sens. 2017, 9, 604. [Google Scholar] [CrossRef]
  43. Alonso, L.; Van Wittenberghe, S.; Amorós-López, J.; Vila-Francés, J.; Gómez-Chova, L.; Moreno, J. Diurnal cycle relationships between passive fluorescence, PRI and NPQ of vegetation in a controlled stress experiment. Remote Sens. 2017, 9, 770. [Google Scholar] [CrossRef]
  44. Yang, H.; Yang, X.; Zhang, Y.; Heskel, M.A.; Lu, X.; Munger, J.W. Chlorophyll fluorescence tracks seasonal variations of photosynthesis from leaf to canopy in a temperate forest. Glob. Chang. Biol. 2017, 23, 2874–2886. [Google Scholar] [CrossRef] [PubMed]
  45. Goulas, Y.; Fournier, A.; Daumard, F.; Champagne, S.; Ounis, A.; Marloie, O. Gross Primary Production of a Wheat Canopy Relates Stronger to Far Red Than to Red Solar-Induced Chlorophyll Fluorescence. Remote Sens. 2017, 9, 97. [Google Scholar] [CrossRef]
  46. Middleton, E.M.; Corp, L.A.; Cook, B. FUSION Canopy Tower System for Remote Sensing Observations of Terrestrial Ecosystems. 2013. Available online: ftp://fusionftp.gsfc.nasa.gov/FUSION/ (accessed on 25 February 2019).
  47. Porcar-Castell, A.; Tyystjärvi, E.; Atherton, J.; van der Tol, C.; Flexas, J.; Pfündel, E.E.; Moreno, J.; Frankenberg, C.; Berry, J.A. Linking chlorophyll a fluorescence to photosynthesis for remote sensing applications: Mechanisms and challenges. J. Exp. Bot. 2014, 65, 4065–4095. [Google Scholar] [CrossRef] [PubMed]
  48. Cogliati, S.; Rossini, M.; Julitta, T.; Meroni, M.; Schickling, A.; Burkart, A.; Pinto, F.; Rascher, U.; Colombo, R. Continuous and long-term measurements of reflectance and sun-induced chlorophyll fluorescence by using novel automated field spectroscopy systems. Remote Sens. Environ. 2015, 164, 270–281. [Google Scholar] [CrossRef]
  49. Damm, A.; Guanter, L.; Verhoef, W.; Schläpfer, D.; Garbari, S.; Schaepman, M.E. Impact of varying irradiance on vegetation indices and chlorophyll fluorescence derived from spectroscopy data. Remote Sens. Environ. 2015, 156, 202–215. [Google Scholar] [CrossRef]
  50. Liu, L.; Guan, L.; Liu, X. Directly estimating diurnal changes in GPP for C3 and C4 crops using far-red sun-induced chlorophyll fluorescence. Agric. For. Meteorol. 2017, 232, 1–9. [Google Scholar] [CrossRef]
  51. Springer, K.R.; Wang, R.; Gamon, J.A. Parallel Seasonal Patterns of Photosynthesis, Fluorescence, and Reflectance Indices in Boreal Trees. Remote Sens. 2017, 9, 691. [Google Scholar] [CrossRef]
  52. Drusch, M.; Moreno, J.; Del Bello, U.; Franco, R.; Goulas, Y.; Huth, A.; Kraft, S.; Middleton, E.; Miglietta, F.; Mohammed, G.; et al. The FLuorescence EXplorer Mission Concept-ESA’s Earth Explorer 8. IEEE Trans. Geosci. Remote Sens. 2017, 55, 1273–1284. [Google Scholar] [CrossRef]
  53. PhenoCam—An Ecosystem Phenology Web Camera Network. Available online: https://phenocam.sr.unh.edu/webcam/ (accessed on 20 December 2018).
  54. FLUXNET 2015, FLUXNET-ORNL. Hosted at the Oak Ridge National Laboratory, USA. Available online: URL https://fluxnet.ornl.gov/) (accessed on 10 December 2018).
  55. Julitta, T.; Burkart, A.; Rossini, M.; Schickling, A.; Colombo, R.; Rascher, U.; Cogliati, S.M. FLoX: A System for Automatic Long Term Measurements of Top of Canopy Sun Induced Chlorophyll Fluorescence. In FLEX 2017 Workshop, ESA-ESRIN. ESA: FLEX 2017, Frascati, Italy. Available online: https://www.dropbox.com/s/w8umv5j9nvk5p5w/Abstract-book.pdf?dl=0 (accessed on 25 February 2019).
  56. Houborg, R.; Anderson, M.C.; Daughtry, C.S.T.; Kustas, W.P.; Rodell, M. Using leaf chlorophyll to parameterize light-use-efficiency within a thermal-based carbon, water and energy exchange model. Remote Sens. Environ. 2011, 115, 1694–1705. [Google Scholar] [CrossRef]
  57. Cook, B.D.; Davis, K.J.; Wang, W.; Desai, A.; Berger, B.W.; Teclaw, R.M.; Martinm, J.G.; Bolstad, P.; Bawkin, P.S.; Yi, C.; et al. Carbon exchange and venting anomalies in an upland deciduous forest in northern Wisconsin, USA. Agric. For. Meteorol. 2004, 126, 271–295. [Google Scholar] [CrossRef]
  58. Nichol, C.J.; Huemmrich, K.F.; Black, T.A.; Jarvis, P.G.; Walthall, C.L.; Grace, J. Remote sensing of photosynthetic-light-use efficiency of boreal forest. Agric. For. Meteorol. 2000, 101, 131–142. [Google Scholar] [CrossRef] [Green Version]
  59. Gitelson, A.A. Recent Developments in Remote Estimation of Crop Biophysical and Biochemical Properties at Various Scales. In Hyperspectral Remote Sensing of Vegetation, 2nd ed.; Thenkabail, P.S., Lyon, J.G., Huete, A., Eds.; CRC Press—Taylor and Francis Group: Boca Raton, FL, USA; London, UK; New York, NY, USA, 2018; Volume 3, pp. 3–24. [Google Scholar]
  60. Julitta, T.; Wutzler, T.; Rossini, M.; Colombo, R.; Cogliati, S.; Meroni, M.; Burkart, A.; Migliavacca, M. An R Package for Field Spectroscopy: From System Characterization to Sun-Induced Chlorophyll Fluorescence Retrieval; ESA ESRIN: Frascati, Rome, Italy, 2017. [Google Scholar]
  61. Julitta, T. FieldSpectroscopy CC and FieldSpectroscopy DP Packages. Online on GitHub Platform. 2017. Available online: https://github.com/tommasojulitta (accessed on 24 January 2019).
  62. Cogliati, S.; Verhoef, W.; Kraft, S.; Sabater, N.; Alonso, L.; Vicent, J.; Colombo, R. Retrieval of sun-induced fluorescence using advanced spectral fitting methods. Remote Sens. Environ. 2015, 169, 344–357. [Google Scholar] [CrossRef]
  63. Goward, S.N.; Huemmrich, K.F. Vegetation canopy PAR absorptance and the normalized difference vegetation index: An assessment using the SAIL model. Remote Sens. Environ. 1992, 39, 119–140. [Google Scholar] [CrossRef]
  64. Hipps, L.E.; Asrar, G.; Kanemasu, E. Assessing the interception of photosynthetically active radiation in winter wheat. Agric. Meteorol. 1983, 28, 253–259. [Google Scholar] [CrossRef]
  65. Orfanidis, S.J. Introduction to Signal Processing; Prentice Hall: Englewood Cliffs, NJ, USA, 1996. [Google Scholar]
  66. Miao, G.; Guan, K.; Yang, X.; Bernacchi, C.J.; Berry, J.A.; DeLucia, E.H.; Wu, J.; Moore, C.E.; Meacham, K.; Cai, Y.; et al. Sun-Induced Chlorophyll Fluorescence, Photosynthesis, and Light Use Efficiency of a Soybean Field from Seasonally Continuous Measurements. J. Geophys. Res. Biogeosci. 2018, 123, 610–623. [Google Scholar] [CrossRef]
  67. Van der Tol, C.; Verhoef, W.; Immermans, J.; Verhoef, A.; Su, Z. An integrated model of soil-canopy spectral radiance observations, photosynthesis, fluorescence, temperature and energy balance. Biogeosci. Discuss. 2009, 6, 6025–6075. [Google Scholar] [CrossRef]
  68. Van der Tol, C.; Berry, J.A.; Campbell, P.K.E.; Rascher, U. Models of fluorescence and photosynthesis for interpreting measurements of solar-induced chlorophyll fluorescence. J. Geophys. Res. Biogeosci. 2014, 119, 2312–2327. [Google Scholar] [CrossRef] [PubMed] [Green Version]
  69. Verrelst, J.; Rivera, J.P.; Alonso, L.; Moreno, J. An Automated Radiative Transfer Models Operator (ARTMO) Toolbox for Automated Retrieval of Biophysical Parameters through Model Inversion; European Geosciences Union (EGU) General Assembly: Vienna, Austria, 2011. [Google Scholar]
  70. ESAS; National Academies of Sciences, Engineering and Medicine. Thriving on Our Planet: A Decadal Strategy for Earth Observation from Space; The National Academies Press: Washington, DC, USA, 2018. [Google Scholar] [CrossRef]
  71. Guanter, L.; Kaufmann, H.; Segl, K.; Foerster, S.; Rogass, C.; Chabrillat, S.; Kuester, T.; Hollstein, A.; Rossner, G.; Chlebek, C.; et al. The EnMAP spaceborne imaging spectroscopy mission for earth observation. Remote Sens. 2015, 7, 8830–8857. [Google Scholar] [CrossRef]
  72. European Space Agency (ESA). Report for Mission Selection, FLEX. In ESA SP-1330/2 Volume 2; European Space Agency: Noordwijk, The Netherlands, 2015. [Google Scholar]
Figure 1. Eddy covariance measurements collected at OPE3, Greenbelt, MD in 2017, including incident photosynthetically active radiation (PAR, µmol/m2/s) and gross primary production (GPP, mg/m2/s)). The Y axes indicate the measured parameters. The days with corresponding MoniPAM and FLoX measurements are depicted in bright green. Days 192–209 demonstrate the dynamics in GPP during the corn young (Yn) growth stage, days 220–235 during the mature (M), and days 236–272 (S) during the senescing (S1 early and S2 advanced) growth stages.
Remotesensing 11 00488 g001
Figure 2. Diurnal and seasonal variations in canopy gross primary production (GPP, A), incident and absorbed photosynthetically active radiation (PAR and APAR, B), reflectance indices (NDVI and Clred, C; and PRI, E), leaf-level photosynthetic parameters (YII and ETR, D), and canopy solar induced fluorescence (SIF, F). The Y axes of each panel indicate the measured parameters. The data were collected contemporaneously at time intervals ranging from 1–30 minutes, they were filtered, smoothed and interpolated to the GPP observations (i.e., 30 minutes), resulting in a set of corresponding measurements for 58 days, depicting the diurnal dynamics across the growing season.
Remotesensing 11 00488 g002
Figure 3. Seasonal variation in midday canopy gross primary production (GPP, A), absorbed photosynthetically active radiation (APAR, B), leaf photochemical efficiency of photosystem two (YII, C) and electron transport rate (ETR, D), vegetation indices (NDVI, Clred and PRI, E–F), solar induced fluorescence (SIF, G), and SIF yield metrics (SIFy, H). Each value represents an ANOVA GLM mean of four midday observations (e.g., 11:45–13:15 EDT, 30 min. interval). Error bars denote ±SD of the mean. The corn growth stages are depicted with colored lines (blue—young/Yn, green—mature/M, red—early senescence/S1, yellow—late senescence/S2). Refer to Table 1 for measurement units.
Remotesensing 11 00488 g003
Figure 4. Diurnal and seasonal variations in photosynthetically active radiation (PAR, µmol/m2/s), absorbed PAR (APAR), fraction of APAR (fAPAR), gross primary production (GPP), light use efficiency (LUE), and photochemical reflectance index (PRI). Each value represents a mean (±SE of the mean, n = 12) of the measurements collected at this time on three consecutive clear days, representative of key growth sages for corn. The growth stages are indicated in different colors (blue—young, green—mature, red—early senescence, yellow—late senescence).
Remotesensing 11 00488 g004
Figure 5. Diurnal and seasonal variations in leaf-level light-adapted PAM fluorescence metrics (Fs, YII and ETR, AC); canopy solar induced fluorescence (SIF, D,E), and SIF yields (SIFy, GI). The growth stages are indicated in different colors (blue—young, green—mature, red—early senescence, yellow—late senescence). Each value represents a mean (±SE of the mean) of the measurements collected at this time on three consecutive clear days representing each growth sage.
Remotesensing 11 00488 g005
Figure 6. Linear correlation between diurnal observations (8:45–16:45, n = 17/day) of GPP and leaf YII and ETR (A,B), absorbed photosynthetically active radiation (APAR, C), and canopy solar induced fluorescence (SIF, DF) metrics. To compare the relationships across growth stages, measurements collected on three consecutive clear days in each growth stage were used (young in blue (n = 51), mature in green (n = 50), senescence in red/initial (n = 51) and yellow/advanced (n = 51)). The linear coefficients of determination (R2) are listed in colors according to growth stage. The overall coefficient of determination for the data from all stages (n = 203) is provided in black when the relationships were statistically significant (p < 0.01). Refer for units to Table 1.
Remotesensing 11 00488 g006
Figure 7. Correlations between diurnal observations (i.e., observations collected in the 8:45–16:45 timeframe) of canopy solar induced fluorescence (SIF) and leaf-level yield to PSII (YII, A–C), and between SIF and electron transport rate (ETR, D–F). The relationships are evaluated using measurements from three consecutive clear days selected in each growth stage (i.e., young (n = 51, blue), mature (n = 49, green), senescing: initial (n = 51, red), and advanced (n = 52, yellow). The linear coefficients of determination (R2) are listed in colors according to growth stage. The overall coefficient of determination (R2, n = 203) of the relationship using data from all stages is listed in black, only when the trends were statistically significant (p < 0.01). Refer for units to Table 1.
Remotesensing 11 00488 g007
Figure 8. Association of midday SIFA+B (red, left axis, PAR ≥ 1150 µmol/m2/s) and PRI (blue, right axis) to canopy chlorophyll, as captured by Clred. The midday values are calculated from the observations collected within ±1 h of local solar noon, and include 58 days from four growth stages of corn.
Remotesensing 11 00488 g008
Table 1. Complementary measurements of corn (Zea mays L.), collected across the 2017 growing season at OPE3, Greenbelt, MD.
Measurement ApproachLocation FrequencyParameters (units)
Eddy covariance10 m tower 30 minGross primary production (GPP, mg/m2/s), photosynthetically active radiation (PAR, µmol/m2/s) and absorbed PAR (APAR, µmol/m2/s), light use efficiency (LUE, mg CO2/µmol PAR)
MoniPAMleaf-level 10 minPAM light-adapted fluorescence metrics (i.e., F maximum—Fm’, and F steady state—Fs), used to estimate the operating efficiency of PSII (YII, arbitrary units or au) and electron transport rate (ETR, µmol electrons/m2/s)
FLoX1.5 m above Canopy < 2 minSolar induced fluorescence (SIF, mW/m2/nm/sr) in the O2A (SIFA) and O2B (SIFB) bands and their sum (SIFA+B), SIF yields (SIFAy, SIFBy, SIFB+Ay), normalized difference vegetation index (NDVI, au), chlorophyll index (CIred, au), photochemical reflectance index (PRI, au)
Table 2. Reflectance indices indicative of corn growth, chlorophyll content, and level of photosynthesis.
Spectral Index [Band Resolution]Reference
NDVI = (R800 − R670)/(R800 + R670) [10 nm]Rouse et al., 1974 [7]
CIred = (R785/R705) − 1 [10 nm and 5 nm ]Gitelson et al., 2018 [4]
PRI = (R531 − R570)/(R531 + R570) [2 nm]Gamon et al., 1992 [11]
Table 3. Diurnal and seasonal variation in canopy GPP, LUE, and the associated leaf and canopy reflectance and fluorescence properties for corn (ANOVA GLM: least square means (n = 12) and regression coefficients (R2)). To evaluate the seasonal changes in the diurnal observations, the data were organized into four stages: young (Yn, DOY 192–194), mature (M, DOY 222–224), early senescence (S1, DOY 245–247), and advanced senescence (S2, DOY 255–257). The diurnal measurements were sub-selected further to form three categories: morning (am, 8:15–9:45), midday (noon, 11:45–1:15), and afternoon (pm, 15:45–17:15) local time (i.e., EDT).
Growth stageYoung (Yn)Mature (M)Early Senescence (S1)Advanced Senescence (S2)ANOVA GLM
Time periodamnoonpmn3amnoonpmnamnoonpmnamnoonpmnn3R2
Canopy CO2 exchange and radiation metrics(Eddy covariance flux tower)
GPP11.10b21.50a1.28ab360.74c1.40a0.84c360.49d1.09b0.66cd360.12e0.62cd0.39d361440.79 †, +
PAR 4572d812c690cd36476d1,096b607cd36490d1,275a794c36307de865c536d361440.57 †, +
APAR431c481c459c36272d653b370d35296d799a511c36101e270d162de351420.54 †, +
LUE (x1000)1.90a1.88a1.93a361.31b1.35b1.51b351.11c0.87d0.84d360.22e0.75d0.74d361430.77 ‡
Leaf chlorophyll fluorescence metrics(Pulse amplitude modulated F, MoniPAM)
YII0.59a0.53a0.56a360.55a0.41b0.57a350.19c0.09e0.11e350.24c0.16d0.21c351410.89 †, +
ETR80.2b97.7a86.8ab3652.8c95.0a76.7b3515.2e28.9d20.7de3513.2e28.0d23.6de341400.79 †, +
Canopy reflectance and fluorescence metrics(FLuorescence bOX, FLoX)
Reflectance vegetation indices (VIs)
NDVI0.84b0.76d0.80c350.92a0.92a0.92a360.88b0.82c0.86b360.59e0.54f0.53f361430.95 ‡
Clred1.28c1.07d1.19cd352.33a2.06b2.29a361.38c1.11d1.27c360.51d0.48d0.49d361430.94 †, +
PRI0.002a−0.020c−0.009b35−0.022c−0.032d−0.024c35−0.080e−0.085e−0.083e35−0.106f−0.104f−0.103f341390.95 ‡
Solar induced fluorescence metrics (SIF, mW/m2/nm/sr)
SIFA0.60c0.80b0.70bc360.45cd1.24a0.59c360.28e0.58c0.40d360.07f0.18f0.12f361440.65 †, +
SIFAy (x1000)1.38c1.56b1.48bc361.68b1.86a1.64b351.05d0.77e0.81e350.87e0.81e0.77e351410.75 +
SIFB0.36b0.75a0.42b360.12de0.43b0.19d360.12de0.28c0.14de360.06e0.16d0.11de361440.79 †, +
SIFBy (x1000)0.88c1.35a0.98bc360.50c0.68b0.58c360.53d0.39e0.34e360.81d0.75d0.76d361440.64 ‡
SIFA+B0.97c1.48b1.12c360.57e1.67a0.79d350.41ef0.87d0.54c340.13f0.35ef0.22ef351400.66 ‡
SIFA+By (x1000)3.64c4.47a3.95b363.87b4.45a3.87b352.63d1.93e1.96e342.55d2.37de2.31de341390.65+
Significant ANOVA GLM independent variables (p < 0.001): † time of day, + growth stage, ‡ their interaction; 1 Means compare within a row; 2 Significantly different means are depicted with different letters: a, b, c, d, e, f; 3 Sample size n varies due to removed outliers identified by ANOVA; 4 For measurement units see Table 1.
Table 4. Relationships to gross primary production (GPP) and to light use efficiency (LUE) of leaf-level PAM fluorescence metrics (i.e., operating efficiency of PSII or YII and electron transport rate, ETR), canopy-level reflectance indices (i.e., normalized difference vegetation index, NDVI; photochemical reflectance index, PRI; chlorophyll index, CIred), and solar induced fluorescence (SIF) in the O2A (SIFA) and O2B (SIFB) bands and their total (SIFA+B). The strength of the relationships was evaluated considering the time of observation and light level (i.e., below or above saturating for photosynthesis PAR, µmol/m2/s), and the linear coefficients of determination (R2) were reported.
VariablesMorning
Low PAR
MiddayAfternoon
Low PAR
High PAR 1Low PAR 2
IndependentDependentR2n3pR2npR2npR2np
GPPPhotosynthetically active radiation (PAR) and absorbed PAR (APAR)
PAR0.6048**0.1128ns0.1619ns0.4348*
APAR0.7948**0.0828ns0.7518**0.3748*
Leaf chlorophyll fluorescence metrics (Pulse amplitude modulated F, MoniPAM)
YII0.1548ns0.8127**0.6318*0.1748ns
ETR0.7548**0.6727*0.7018**0.6648**
Canopy reflectance VIs
NDVI0.2248ns0.2328ns0.6519*0.2248ns
Clred0.0948ns0.3628ns0.6019**0.0948ns
PRI0.4848ns0.7828**0.7319**0.4548*
Canopy solar induced fluorescence (SIF)
SIFA0.8648**0.6528**0.8019**0.6548**
SIFB0.6847**0.6828**0.6819**0.7348*
SIFA+B0.8848**0.7128**0.8319**0.7548**
Solar induced fluorescence yield (SIFy = SIF/APAR)
SIFAy0.1648ns0.7528**0.7418**0.2648ns
SIFBy0.0148ns0.6228*0.0518ns0.0348ns
SIFA+By0.1248ns0.7928**0.3018ns0.2148ns
LUEPhotosynthetically active radiation (PAR) and absorbed PAR (APAR)
PAR0.1647ns0.1428ns0.1418ns0.2648ns
APAR0.2347ns0.0228ns0.0218ns0.1948ns
Leaf chlorophyll fluorescence metrics (Pulse amplitude modulated F, MoniPAM)
YII0.4048*0.7927**0.6118*0.6948**
ETR0.5548*0.4927*0.4718ns0.2848ns
Canopy reflectance VIs
NDVI0.2948ns0.1928ns0.7118*0.1648ns
Clred0.1148ns0.2228ns0.6618*0.1448ns
PRI0.6648**0.6728*0.6418**0.7148**
Canopy solar induced fluorescence (SIF, mW/m2/nm/sr)
SIFA0.3848ns0.3528ns0.4318ns0.1148ns
SIFB0.4647*0.6328**0.4118ns0.3248ns
SIFA+B0.4547*0.5128*0.4618*0.1848ns
Solar induced fluorescence yield (SIFy = SIF/APAR)
SIFAy0.3046ns0.6228**0.7118**0.3447ns
SIFBy0.1546ns0.7028*0.1718ns0.2947ns
SIFA+By0.2946ns0.7128**0.3518ns0.6247*
* p < 0.01; ** p < 0.001; 1 High PAR(1150-1400); 2 Low PAR (400-1145); 3 Sample size n vary due to identified outliers; Bolded R2 ≥ 0.70.

