A New Remote Sensing Dryness Index Based on the Near-Infrared and Red Spectral Space


1
State Key Laboratory of Desert and Oasis Ecology, Xinjiang Institute of Ecology and Geography, Chinese Academy of Sciences, Urumqi 830011, China
2
University of Chinese Academy of Sciences, Beijing 100039, China
3
School of Aeronautics and Astronautics, Sun Yat-Sen University, Guangzhou 510275, China
4
China-Asean Environment Cooperation Center, Beijing 100875, China
*
Author to whom correspondence should be addressed.
Remote Sens. 2019, 11(4), 456; https://doi.org/10.3390/rs11040456
Submission received: 1 February 2019
/
Revised: 18 February 2019
/
Accepted: 18 February 2019
/
Published: 22 February 2019
(This article belongs to the Special Issue Advances in Remote Sensing-based Disaster Monitoring and Assessment)
Abstract
:Soil moisture, as a crucial indicator of dryness, is an important research topic for dryness monitoring. In this study, we propose a new remote sensing dryness index for measuring soil moisture from spectral space. We first established a spectral space with remote sensing reflectance data at the near-infrared (NIR) and red (R) bands. Considering the distribution regularities of soil moisture in this space, we formulated the Ratio Dryness Monitoring Index (RDMI) as a new dryness monitoring indicator. We compared RDMI values with in situ soil moisture content data measured at 0–10 cm depth. Results showed that there was a strong negative correlation (R = −0.89) between the RDMI values and in situ soil moisture content. We further compared RDMI with existing remote sensing dryness indices, and the results demonstrated the advantages of the RDMI. We applied the RDMI to the Landsat-8 imagery to map dryness distribution around the Fukang area on the Northern slope of the Tianshan Mountains, and to the MODIS imagery to detect the spatial and temporal changes in dryness for the entire Xinjiang in 2013 and 2014. Overall, the RDMI index constructed, based on the NIR–Red spectral space, is simple to calculate, easy to understand, and can be applied to dryness monitoring at different scales.
1. Introduction
Drought is a frequent natural phenomenon that influences social and economic development, poses a series of environmental problems, and causes natural disasters, such as change of surface water circulation, destruction of agricultural productivity, and desertification [1,2]. Since the middle of the last century, there has been an extensive unanticipated land desertification in arid and semi-arid regions, worldwide, which has threatened the population of many countries [3]. Moreover, according to the Intergovernmental Panel on Climate Change (IPCC), the amount of severely dry land is predicted to increase in the near future. This will be more serious in continental regions, during the summer months [4]. In the current climate change scenario, the consequence of such dryness trends could be catastrophic. Therefore, detecting drought areas, monitoring drought grade, and evaluating the impacts of drought on agriculture, environment, and the economy are critical for regional drought risk control and sustainable development policies [5].
Due to the complexity of drought occurrence, during the last few decades, a great quantity of drought monitoring models and methods, based on ground observation sites, have been proposed [6,7], which mainly use years of ground measured precipitation and evaporation data [8]. These indices, such as the Palmer Drought Severity Index (PDSI) [8], the Rainfall Anomaly Index (RAI) [9], the Crop Moisture Index (CMI) [10], the Bhalme-Mooley Index (BMDI) [11], the Surface Water Supply Index (SWI) [12], the Standardized Anomaly Index (SAI) [13], and the Standardized Precipitation Index (SPI) [14], could accurately reflect the duration and intensity of drought. However, they are difficult to be applied on a large-scale, due to the dependence on site data. Additionally, from a global perspective, the number of observation sites and the duration of meteorological records in many areas are insufficient to detect spatiotemporal variations of drought-related variables [15]. With the development of meteorological grid data, these indices mentioned above have made a breakthrough for large-scale applications, but the coarse spatial resolution of the data is still hard to meet the needs of agricultural drought risk management.
The development of remote sensing technology has effectively compensated for the shortcomings of the traditional site-based monitoring methods. Remote sensing data has become the main data source for drought research because of its low acquisition cost, wide monitoring range, and strong data continuity [16,17]. Over the past decades, a large number of remote sensing data on precipitation, soil moisture, surface temperature, evapotranspiration, and water reserves, have played important roles in drought research [18,19].
Precipitation and soil moisture are the important factors affecting the severity and duration of drought. Currently, a variety of satellite precipitation data has been used for drought research [20,21,22]. The primary satellite precipitation products are shown in Table 1. Satellite soil moisture products are also widely used in drought research, especially in arid and semi-arid regions. Soil Moisture Ocean Salinity (SMOS) [23], Soil Moisture Active Passive (SMAP) [24], and Advanced Microwave Scanning Radiometer–Earth Observing System (AMSR-E) [25] are the main sources of soil moisture monitoring data based on satellite remote sensing. These data have been widely used in soil moisture inversion and drought risk assessment [26,27,28,29]. However, due to the coarse spatial resolutions of the above products, they are also hard to be applied on agricultural drought assessment.
More than 99% of the soil spectral change information can be described by the red, near-infrared and shortwave infrared bands [36], which provides an important theoretical support for the use of optical remote sensing data for drought assessment. Researchers have proposed a variety of soil moisture and drought assessment methods, based on hyper-spectral and multi-spectral data.
Studies have analyzed the relationship between hyper-spectral data and soil moisture, based on physical and statistical models [37,38], and have proposed several soil moisture inversion indices [39,40,41]. Avoiding the difference between complex conditions in the field and spectral data obtained under laboratory conditions, is the main problem for a quantitative monitoring of soil moisture in the future.
Multi-spectral data, which is abundant in source and has a high spatiotemporal resolution compared with hyper-spectral data, has been widely used in drought monitoring. Table 2 shows the major multi-spectral data sources for drought monitoring. However, due to limited number of bands, drought or dryness monitoring can be achieved through band combinations or statistics only, based on the sensitive bands of soil moisture or vegetation status. Gao established the Normalized Difference Water Index (NDWI), based on Landsat/TM Channel 4 and 5, showing a good performance on measuring liquid water molecules [42]. There are several indices based on Red(R) and Near Infrared (NIR), which were widely used in drought/dryness monitoring with different satellite data. Ghulam proposed the Perpendicular Drought Index (PDI) [43] (which can reflect the soil moisture status) and had it verified at the Beijing Shunyi Remote Sensing Experimental Base. The results showed that there is a high correlation between PDI and in situ drought values calculated from 0–20 cm of soil moisture, with correlation coefficients of R2 = 0.57 (r = 0.75). However, PDI might fail under conditions of medium and high vegetation cover, because it does not consider the impact of vegetation cover. Ghulam presented the Modified Perpendicular Drought Index (MPDI) through the elimination of the influence of the vegetation fraction, by introducing the fractional vegetation coverage variable (fv) which represents the proportion of ground covered by canopies [44]. After correlation analysis with the drought values obtained from in situ soil moisture data, MPDI performed as well as PDI, in the early stages of vegetation growth, with a correlation coefficient of R2 = 0.8134. MPDI showed a better performance under dense vegetation cover conditions, since it considered the vegetation condition in the modeling process. However, parameters such as the vegetation reflectances of red and near infrared band and the soil line, are generally fixed by experience [45].
Since dryness is often related to temperature and vegetation conditions, researchers established several dryness indices based on one single factor or a combination of multiple factors, and the ability of these indices to reflect dryness spatial distribution have been tested [46,47]. Temperature-Vegetation Drought Index (TVDI) is a soil moisture monitoring index constructed on the basis of the Normalized Difference Vegetation Index—Land Surface Temperature (NDVI-LST) feature space, which considered the response of vegetation growth status and temperature, to the change of soil moisture. NDVI is vulnerable to soil background for sparse vegetation, while being insensitive to dense vegetation. As a result, TVDI might fail in areas with low or high NDVI values [48]. In addition, other researchers have combined existing dryness indices as indicators for assessing soil moisture, with vegetation indices or surface temperatures, to construct new indices. Amani developed a 3-Dimensional (3D) space of LST, Perpendicular Vegetation Index (PVI), and soil moisture (SM) to construct the Temperature–Vegetation–Soil Moisture Dryness Index (TVMDI) for dryness estimation and monitoring, and MPDI is the indicator of SM [49]. TVMDI has been evaluated in Yanco, Australia, and the result shows an acceptable correlation with in situ soil moisture data (r = −0.65). It was compared with other dryness indices based on satellite data, such as PDI, MPDI, and TVDI, and the result showed that TVMDI is the most accurate index. However, there are a few issues with this index. First, as an important factor in TVMDI, LST was estimated using the Single Channel method, which often reduces the accuracy of dryness assessment [50]. Second, PVI used in the TVMDI can be affected by soil background, reducing its ability to accurately characterize vegetation moisture status. Furthermore, TVMDI uses MPDI as the indicator of soil moisture. Similar to MPDI, there is the issue of using empirical values for the soil line parameters.
Through the analysis of the multi-indicator dryness indices and the indices based on the NIR–Red spectral space, we find that these indices mainly have the following disadvantages: (1) Error propagation during the inversion of each indicator in the multi-indicators index might reduce the accuracy of the dryness index. (2) The impact of vegetation cover on soil moisture estimation is not fully considered. (3) The effectiveness of these dryness indices in the arid and semi-arid regions have not been fully investigated. To overcome these shortcomings, the main objective of this paper is to propose a new operable dryness monitoring index—the Ratio Dryness Monitoring Index (RDMI)—and to evaluate its applicability in semi-arid regions. We constructed RDMI based on the NIR–Red spectral space, implemented it with Landsat-8 images, and validated it with field-measured soil moisture sampling data. Furthermore, we applied RDMI with Landsat-8 imagery in the region around Fukang of Xinjiang, China and with Moderate Resolution Imaging Spectroradiometer (MODIS) imagery in the entire Xinjiang province, in order to test its robustness at different scales.
2. Study Areas and Data
2.1. Study Area
The Xinjiang Uygur Autonomous Region, one of the driest regions on the earth, is located in Northwestern China and the hinterland of the Eurasian continent [51]. The surface landscape includes the Tianshan Mountains, Altai Mountains, and the Kunlun mountains, which are seperated by two vast desert basins, the Tarim Basin, and the Junggar Basin [52].
Xinjiang has a temperate continental climate. The annual average precipitation is 158 mm, and the annual mean temperature is 7.6 °C. In general, Xinjiang is divided into the Northern and Southern part, by the Tianshan Mountains. There are climate differences between Northern Xinjiang and Southern Xinjiang. Northern Xinjiang has a temperate, continental, arid, and semi-arid climate, affected by the Western wind belt. The annual precipitation is about 150–200 mm. Southern Xinjiang has a warm, temperate, continental, arid climate, and the warm and humid airflow is difficult to reach due to the limitations of the terrain. The annual precipitation is about 25–100 mm. The annual potential evaporation in Xinjiang is up to 1800 mm. The ecological environment in Xinjiang is fragile, and the climatic characteristics of low precipitation and high evaporation can often easily lead to drought events.
The second study area is a part of the main agricultural area on the Northern slope of the Tianshan Mountains. Cotton, winter wheat, and spring corn are the main crops in this area. Meanwhile, this area is connected to the Gurbantunggut Desert and is a typical oasis desert ecotone, where the main soil type is sandy soil. This area contains a variety of surface landscapes, such as farmland, wetlands, desert ephemerals, and deserts.
In order to verify the effectiveness of the proposed method, it is necessary to test its robustness for monitoring and assessing dryness, over time and at different scales. We chose the region around Fukang, located on the Northern slope of the Tianshan Mountains, to test the proposed method, at a medium scale, and the entire Xinjiang region, to test it at a large scale (Figure 1).
2.2. Field Measurement Data
In the ground soil moisture sampling, taking into account the impact of the cloud cover on the data quality, whenLandsat transits, we carried out multiple ground sampling experiments, according to the satellite transit time, to ensure the matching of the ground sampling time and the high-quality Landsat image. Therefore, from the end of April to mid-July 2014, soil moisture observation experiments were set up at the Fukang Experimental Stations of the Chinese Academy of Sciences, and the surrounding areas. The test sites were located in the surrounding areas of the Fukang City, on the Northern slope of the Tianshan Mountains, as shown in Figure 2. The main soil types in this area are tidal soil and lime desert soil.
In order to ensure the spatial consistency of the location of the sampling area and the Landsat pixel, we used a GPS device to select sampling areas, based on a comprehensive consideration of the sample land cover type and the Landsat pixel position. We selected a total of fifty-one sampling areas, with a minimum interval of one kilometer, between each sampling area. These sampling areas had different land cover types, including cotton (n = 19), winter wheat (n = 8), spring maize (n = 14), bare land (n = 8), and desert (n = 2). The size of each sampling area was 30 m × 30 m, which coincided with the Landsat pixel range, and five points were selected within each sampling area, including the center point. In each sampling area, five points of the GPS position information were first recorded, and then a soil drill was used to separately collect soil samples from 0−10 cm of the soil surface. Finally, soil samples from the five points were mixed and weighed, on site. The weights of the soils in each sampling area, were recorded. The soil samples were taken back into the laboratory, in sealed bags, and dried for 12 hours, in a 105 °C, constant, temperature drying chamber [53]. Each soil sample weight was measured after the drying process. Equation (1) was used to calculate the gravimetric soil moisture content.
where is the gravimetric soil moisture content (%), is the weight of the wet soil, and is the weight of the dry soil.
Finally, through the screening of the Landsat images during the sampling period, the image data of the cloud cover on 12 June 2014 was only 0.06%. Finally, we used the soil sampling experiment data from 12 June 2014 for index verification.
2.3. Satellite Image Data and Its Pre-Processing
In order to evaluate the dryness index proposed in this paper and to verify its applicability at different scales, two types of satellite images were used in this study. The red (R) and near-infrared (NIR) bands used in the study were obtained by the Landsat-8, with a medium resolution (30 m), and the MODIS was obtained with a coarser resolution (250 m). The Landsat-8 image was used for the evaluation of the proposed dryness index and dryness mapping in the surrounding areas of Fukang City. In addition, MODIS data were used to generate a dryness map of Xinjiang, demonstrating the applicability of the proposed index, on a large scale.
2.3.1. Landsat 8 Data
The cloud free Landsat-8/Operational Land Imager (OLI) L1T image, from 12 June 2014, was downloaded from the United States Geological Survey (USGS) website to develop the proposed index. The surface reflectance was calculated using the 6S atmospheric correction model. Due to the calibration uncertainties of band 11 of the Landsat-8, the split window method is not recommended to invert LST, as mentioned in Gerace et al., [54]. Band 10 of the Landsat-8 was used for the inversion of LST, through the single-window algorithm in this research, as explained by USGS [55]. Furthermore, the spatial resolution of Landsat-8’s thermal infrared bands was resampled to 30 meters, by the product provider. Therefore, the spatial resolution of Landsat-8 imagery data used in this study was 30 meters.
2.3.2. MODIS data
MODIS surface spectral reflectance products were used for mapping the dryness distribution in Xinjiang, China. The Xinjiang Uygur Autonomous Region covers a large space and requires a total of six scenes to achieve regional coverage (Path 23–25, Row 04–05). MOD09A1 contains surface reflectance of Terra MODIS Bands 1–7, and its temporal granularity was eight days. All MODIS products were geometrically and radiometrically corrected and were in a sinusoidal projection system, downloaded from https://search.earthdata.nasa.gov/. The sinusoidal projection of the MODIS products was converted to an Albers equal area projection with a WGS-84 datum, and the products on the same date were mosaiced. All these processes were completed using the MODIS Reprojection Tool (MRT). The georeferencing process was performed in ArcGIS 10.2, with a georeferencing error less than 0.5–1 pixels. The products were extracted using the vector boundary of the Xinjiang Uygur Autonomous Region. The spatial resolution of the MODIS09A1 reflectance product was 500 meters.
We selected 18 tiles of the MODIS image (h23v04, h23v05, h24v04, h24v05, h25v04, h25v05) from 2 June 2013, 2 June 2014, and 21 August 2014, to show the intra- and inter-annual differences in the RDMI index, within the study area.
3. Method
Since the NIR–Red spectral space theory is the basis of the proposed dryness index, as well as other indices, a brief explanation of the NIR–Red spectral space is provided in Section 3.1. Then, the dryness indices based on the 2/3D space, which were used to compare the proposed index in the surrounding areas of Fukang City, are discussed in Section 3.2. Finally, the new dryness monitoring index is proposed in Section 3.3.
3.1. The NIR–Red Spectral Space
Due to vegetation canopies’ strong absorption in the red band and strong reflection in the near-infrared band, the red and near-infrared bands in the remote sensing data are used to generate various vegetation indices, such as the Ratio Vegetation Index (RVI), the Difference Vegetation Index (DVI), and the NDVI. The NIR–Red spectral space and the spectral features were originally designed by Richardson and Wiegand to construct the PVI [56]. Based on this theory, Price estimated the vegetation amount from visible and near infrared reflectances [57].
In addition, Ghulam and Zhan found that the near-infrared spectral space contained information on not only vegetation status, but also soil moisture [43]. PDI and MPDI were proposed on the basis of this feature. In the triangular feature space (Figure 3a), because bare soils were not affected by vegetation cover, their reflectivity in red and near-infrared bands are only affected by their moisture content. With the decrease of soil moisture, the reflectivity of the red, and near-infrared bands increase, forming one edge of the triangle in the NIR–Red spectral space, represented by the soil line (Figure 3a). With the increase of vegetation coverage, the rate of increase of reflectance in the near-infrared band is much higher than that in the red band. PVI uses the arbitrary, pixel to soil-line distance, to characterize the degree of vegetation cover. The distribution characteristics of the pixels parallel to the soil line in the triangular feature space are also used by Ghulam and Zhan to describe the connection with soil moisture and to establish their dryness index. Zhan et al. developed the Soil Moisture Monitoring by Remote Sensing (SMMRS) model, based on the distribution characteristics of the near-infrared and red spectral spaces, for dryness monitoring [58]. This model is relatively simple, but the mixed information of soil and vegetation was not considered.
PDI has been verified to be very effective in soil moisture monitoring over bare soils, but similar to SMMRS its performance is greatly reduced in areas with dense vegetation. MPDI has been validated with in-situ soil moisture measurements in the Henan province of China [45]. The characteristics of vegetation and soil moisture in the NIR–Red spectral space were widely used in the studies of Amani and Mobasheri [59,60]. In particular, TVMDI has been verified with Australia’s Yanco and Iran, as research areas. The above-mentioned indices, based on this feature space, are listed in Table 3. From the application of this feature space, it has a good performance in practical applications, such as vegetation conditions and soil moisture monitoring.
3.2. Satellite-Based Dryness Indices
3.2.1. PDI
PDI is a dryness monitoring index considering the NIR–Red spectral space under different soil moisture conditions, as follows:
where and are the reflectance values of the red and near-infrared bands, respectively, and indicates the slope of the soil line equation that is defined according to the conditions in the study area. The definition of soil moisture in PDI development is explained by Figure 4. L is a line passing through the origin of the spectral space and is perpendicular to the soil line. The distance from a random pixel to L can be represented as the degree of dryness in the region that the pixel belongs to. Generally speaking, as the distance of a random pixel is closer to L, the dryness value is closer to 0, indicating that the regions are either water bodies or extremely wet areas.
3.2.2. MPDI
In order to eliminate the influence of vegetation in the PDI, and improve soil moisture monitoring accuracy, Ghulam et al. introduced the vegetation fraction concept and proposed MPDI, on the basis of PDI. This index can effectively reflect soil moisture in areas with different kinds of vegetation coverage. The equation of MPDI is calculated as follows:
where and are the reflectance values of red and near-infrared bands, respectively; indicates the slope of the soil line equation which is defined according to the conditions in the study area; is the vegetation cover fraction, which can be estimated with various methods, such as neural networks [68], linear spectral mixture decomposition [69], and vegetation indices [70]; and and are the red and near-infrared reflectances of vegetation, which are set to 0.05 and 0.5, by field measurements, respectively [44].
3.2.3. TVDI
TVDI is a dryness index based on the empirical parameterization of the relationship between the surface temperature and vegetation index in the NDVI-LST triangle space, as shown in Figure 5. Its definition is as follows:
where is the minimum surface temperature in the triangle space that represents the wet edge; and NDVI are the surface temperature and NDVI values for a given pixel, respectively, which are estimated using remote sensing; a and b are the linear fitting parameters of the dry edge, which can be calculated using the maximum surface temperature values, at a given NDVI, as follows:
3.2.4. TVMDI
TVMDI is constructed in a three-dimensional space integrating normalized land surface temperature (), normalized soil moisture (), and vegetation status (PVI), which are commonly used for dryness assessment (Figure 6), as follows:
SM are calculated as follows:
where and are the reflectances of near-infrared and red bands, after atmospheric correction, and M, b, are the slope and the intercept of the linear-fitting formula of the soil line, respectively.
All of the above-mentioned dryness indices have their own strengths and weaknesses. PDI and MPDI make full use of the spectral characteristics of soil, under different water conditions, but the PDI index does not take the impact of vegetation cover into account. MPDI introduces the vegetation cover factor to overcome PDI’s shortcoming under medium and high vegetation cover conditions. However, in practical applications, the vegetation coverage factor shows uncertainty, due to the use of empirical parameters, in the calculation [62,71]. TVDI introduced land surface temperature and vegetation indices to estimate dryness status, but underutilized the information of red and near infrared bands. In addition, the estimation of TVDI is influenced by the uncertainties of land surface temperature and the NDVI inversion process. TVMDI assesses dryness status by comprehensively considering the land surface temperature, vegetation coverage, and soil moisture. However, the method of TVMDI for soil moisture evaluation uses the theory of PDI, and uncertainties caused by the mixed information of vegetation and soil still exist.
3.3. The Proposed Ratio Dryness Monitoring Index (RDMI)
As shown in Figure 3, the NIR–Red spectral space contains rich information on vegetation coverage and soil moisture. The low reflectance in the red band and high reflectance in the near infrared band is a typical spectral feature of a healthy vegetation. Richardson and Wiegand proposed the PVI, based on the distance of a given pixel to the soil line in the NIR–Red spectral space, to express the vegetation coverage. The distribution of the pixels on the PVI isoline that have the same vegetation coverage condition, is mainly affected by soil moisture and leaf water content of the vegetation [43]. The lower the reflectance in the red and near infrared bands of a given pixel, the closer the pixel is to the lower left in the PVI isoline and the less water stress the vegetation has, and vice versa.
As discussed above, it can be seen from Figure 7 that the line AB is the soil edge and that the line AC represents the smallest water stress areas under various vegetation coverage conditions. AC and BC are defined as the wet edge and the dry edge, respectively.
The position of a random pixel in the approximate triangle, formed by AB, AC, and BC, contains two kinds of information. The first is the vegetation coverage conditions that are expressed as the distance from a given pixel to the soil edge (AB). The second is the water stress status under the same vegetation coverage conditions, which can be expressed as the ratio of the distance from a given pixel to the wet edge (AC) and the distance from the wet edge to the dry edge (BC).
3.3.1. The Edges of the Triangle Extractions
According to the above discussions, in order to express the water stress state under different vegetation coverage conditions, it is necessary to extract the pixels on the three sides in the scatter plot, for the fitting of the soil edge and the wet edge, respectively. The least squares linear regression was used for the determination of the parameters of the three edges, so as to balance the accuracy of the edge fitting and the performance of the algorithm.
(1) Soil edge:
In the case of the same reflectance in the red band, the reflectance of bare soil in the near infrared band is always lower than that of the vegetation, because of the physical properties of the vegetation leaves [43]. In order to determine the parameters used to describe the soil edge, pixels with the minimum near-infrared reflectance values corresponding to each red reflectance value, were extracted as the bare soil pixel set. Then, the parameters were calculated, using the least squares linear regression method, with the extracted bare soil pixel set. The soil edge equation can be formed as the following:
where and are the reflectance values of the near infrared and red bands of the bare soil pixel set, and and are the slope and intercept of the soil edge equation, respectively.
(2) Wet edge:
It can be seen from Figure 7 that, due to the growth of vegetation and the expansion of vegetation coverage in a given pixel, the near infrared band reflectance increases, and the red band reflectance decreases. The reason for this can be analyzed in two aspects. First, the sufficient water content that is required for the growth of vegetation has a strong absorption in the red band, reducing the red band reflectance. Second, the leaf cell structure has a stronger reflection and transmission ability in the near infrared band than the bare soil, increasing the reflectance value in the near infrared band [43]. From the above analysis, we can assume that pixels closer to the near infrared axis are not affected by water stress, and are then defined as the “wet edge”. Pixels with the minimum red reflectance values corresponding to each near infrared reflectance value were extracted as the wet pixel set. After that, the least squares linear regression method was introduced to extract the parameters of the wet edge equation, with the wet pixel set. The wet edge can be described as the following:
where and are the reflectance values of the near infrared and red band of the wet pixel set, and and are the slope and intercept of the wet edge equation, respectively.
(3) Dry edge:
To determine the dry edge, we must first define the positions of the three points of the triangle. According to the application of the triangle characteristics in the spectral space in previous studies [43,56], the following steps are used to determine the positions of the three vertices of the triangle. First, point A, which represents the wettest bare soil, was the cross-point of the wet edge and the soil edge. Second, point C, which represents the densest healthy vegetation canopies, was calculated using the wet edge equation and the highest near-infrared reflectance in the wet boundary point set. Third, point B, which represents the driest bare soil, was calculated using Equation (7) and the highest red reflectance. According to the positions of B and C, the values of and in Equation (10), which define the dry edge, can then be calculated. Finally, the mathematical description of a triangle space including all pixels was created.
3.3.2. Constructing RDMI
Based on the extracted triangular boundary, as shown in Figure 8, we can construct a line passing through a given pixel P (Rnir, Rred), paralleling the soil line. According to the definition of PVI [56], all the pixels on this line have the same PVI values, which means that they have the same vegetation condition. This line intersects with the wet and the dry edges in D and E, respectively. Based on the above discussion, the position of a point on this line depends on its soil moisture condition. Point D represents the absence of water stress, under this vegetation condition, while point E can represent the maximum water stress situation. The distance DP can represent the difference in the soil moisture situation of point P with point D. Therefore, the degree of dryness, under a certain vegetation coverage condition, can be expressed as the ratio of the distances of DP and DE, as shown in the following formula:
Pixels near point D representing the highest soil moisture of this PVI level, will have the minimum dryness values (0), and point E represents the maximum dryness value (1). That is, a larger RDMI value represents, more dryness and less soil moisture, and vice versa.
3.3.3. Implementing RDMI with Landsat-8
Taking the Landsat-8 data of 12 June 2014 as an example, the RDMI value can be calculated using the band 4 and band 5 reflectance values of the Landsat-8, based on the following steps, as shown in Figure 9.
(a) The pixels on the triangle boundary can be extracted according to the method mentioned in Section 3.3.1. As shown in Figure 10, each pixel in the imagery can be represented by a point which is described by its red and near infrared reflectance values. The pixels of the entire imagery can be abstracted into a n*2 array (n is the number of pixels). According to the value of the red band reflectance, the array is sorted and evenly divided into m groups and, m is decided using the quantity of the imagery and computational efficiency. For each group, the point which has the minimum near-infrared value is selected, and these points form the soil-edge point set. Using the same method, according to the near infrared reflectance values of the points, the array is sorted and divided into groups, and the points with the minimum red reflectance value in each group form the wet-edge point set.
(b) , , , were calculated using the least squares method, based on the point sets extracted. Based on the extracted points sets, , can be calculated using Equation (9).
(c) For a random point P (, ) in the spectral space, we can define a line with a slope of passing through this point. The intersection points D and E with the dry edge and the wet edge can be obtained by solving the intersection of Equations (9) and (10), respectively. and can be calculated using Equation (12).
is the distance of point p1 and point p2, and are the red band reflectances of point p1 and point p2, and and are the near infrared band reflectances of p1 and point p2. The RDMI value of point P can be calculated using Equation (11).
In summary, PDI, MPDI, and TVMDI are based on the dryness index established by the distribution characteristics of the soil moisture in the NIR–Red spectral space. Based on the same spectral space, this paper discusses the distribution of soil moisture in the feature space and establishes the RDMI index. TVDI is a simple land surface dryness index based on NDVI and LST, which is realized by calculating the distance between a certain pixel and the cold and hot boundaries. The proposed index is also established from the perspective of the distribution characteristics of soil moisture in a two-dimensional space. Therefore, in this paper, PDI, MPDI, TVDI, and TVMDI, as the indices based on multi-spectral data, are used to compare with RDMI, to evaluate the effectiveness of RDMI. To evaluate the results, the Pearson correlation coefficients (r) were chosen to estimate the strength of the linear relationship between in situ data and the estimated dryness index values, the r results were assessed at 0.001 significance level (P indicates the P-value in this paper) [49]. By comparing the correlation coefficients between the different indices and the measured data, the sensitivity to dryness was compared.
4. Results and Discussions
4.1. RDMI Vs. In Situ Measured Data
In order to evaluate the sensitivity of RDMI, with the soil moisture, we used 26 soil moisture samples from the in situ soil moisture data to analyze the correlation between RDMI and soil moisture. The results showed that there was a significant negative correlation between RDMI and soil moisture (r = –0.89, p < 0.001), as shown in Figure 11a. In other words, as the soil moisture decreases, the RDMI value increases.
To further illustrate the relationship between RDMI and soil moisture, we performed a linear fit between the RDMI and in situ data, to obtain a linear equation. Based on this linear equation, we calculated the simulated soil moisture (SMestimate) for the remaining 25 sample locations. We assessed the performance of this relationship between the SMestimate and the in situ soil moisture (SM), using the root mean square error (RMSE) and coefficient of determination (R2). As shown in Figure 11b, the RMSE was 2.99%, and the R2 was 0.76. SMestimate showed a strong correlation with in situ soil moisture data, which means that a change in the RDMI value well reflected a change in the soil moisture levels.
4.2. RDMI Vs. Other Satellite-Based Dryness Indices
In this section, a comparative study among the RDMI and several existing dryness indices based on remote sensing, including the PDI, MPDI, TVDI, and TVMDI is presented, by calculating each correlation coefficient, slope, intercept, and RMSE of the linear regression, with in situ soil moisture content data (Table 4).
In order to distinguish the dryness monitoring ability of each index, we analyzed the correlation between the values of each index and the in-situ soil moisture data, under different land cover conditions, as shown in Table 4. The results for all samples indicated that the RDMI shows the strongest linear correlation with soil moisture content data measured in situ, with an r value of −0.89, followed by TVMDI, with an r value of −0.87. The results of the samples under different land cover conditions indicated that RDMI showed a strong correlation with in situ data, under both varied vegetation cover and bare soil conditions. PDI and MPDI showed strong correlation with in situ data under different bare soil conditions. The correlation between TVMDI and in situ data under different vegetation coverages, was second only to RDMI, but, in varied bare soil conditions, the correlation was weaker than in that of other indices. RDMI has a stable response to soil moisture under different land cover conditions, which is better than other dryness indices. This result could be attributed to two aspects. First, the RDMI is constructed on the basis of two variables which reflect the status of vegetation and soil moisture intuitively. Second, the distribution of pixels in the NIR–Red spectral space is mathematically determined.
TVMDI uses the three indicators of LST, NDVI, and SM for a regional dryness assessment. The results showed a high correlation with the measured soil moisture, but there were three issues to be considered. First, there was an inherent correlation between the three variables. A change in one indicator would cause another indicator to change. The impact of this intrinsic correlation on TVMDI should be explored further [49]. Second, TVMDI uses NDVI to characterize vegetation status. A disadvantage of the NDVI, i.e., being saturated in areas with high vegetation coverage, will affect the TVMDI result, over these areas. Third, the LST inversion uses a single-channel algorithm. The real-time atmospheric profile data required in this algorithm is often difficult to obtain for most study areas. Due to the spatial resolution differences between the thermal infrared sensors and visible near infrared sensors, all LST products must be resampled to ensure consistency with other spatial data resolutions [72]. Uncertainty in the LST inversion process can further accumulate in the TVMDI.
Other dryness indices, such as the TVDI, the PDI, and the MPDI showed a relatively weaker correlation with the measured soil moisture data (Table 4). TVDI uses the vegetation index and surface temperature as variables for constructing the LST-NDVI space.Thus, it is more sensitive to the uncertainty of remote sensing-based inversion, as compared with TVMDI. Among all the indices examined, PDI showed the least significant correlation with the measured soil moisture data (r = −0.72, p < 0.001), and its application for vegetated surfaces is limited, due to the mixed pixel phenomenon [73]. Compared with PDI, MPDI showed a slightly stronger correlation (r = −0.74, p < 0.001) with measured soil moisture data, which could be attributed to the mixed pixel decomposition elimination of the vegetation component [45]. Soil types and properties are diverse in different areas, as are vegetation types and conditions, but most studies using the MPDI method used fixed parameters, such as the slope of the soil line and the vegetation reflectance of the red and near infrared bands [65]. Such treatment greatly affects the practical applications of MPDI to different regions and at different scales.
Compared with the existing remote sensing-based dryness monitoring index, RDMI is calculated based on the red and near-infrared band reflectance values, directly acquired using satellite sensors, which avoids the accumulation of errors in LST, NDVI, and other inversion processes. Through the mathematical description of the triangular feature space, RDMI explained the variation of soil moisture, under different vegetation conditions.
4.3. RDMI Dryness Maps with Landsat 8 and MODIS Imagery
4.3.1. Dryness Indices Map with Landsat 8 Data
In order to analyze the difference in the dryness monitoring ability between RDMI and other dryness indices, including PDI, MPDI, TVDI, and TVMDI, in the area around Fukang, we used the Landsat-8 data to map the dryness indices in this area (Figure 12). In order to facilitate comparison among these indices, all the mapping results were normalized using Equation (13).
where is the normalized dryness index value, is the dryness index value, and and are the maximum and minimum of the dryness index values.
Figure 12 shows the dryness of each index in the area around Fukang. The larger the index value in these figures, the higher the surface dryness. Among them, RDMI, TVDI, and TVMDI can clearly distinguish between different land cover types. As irrigation is the main supplier of soil moisture under arid conditions [74], compared with bare land, desert, the cropland has been effectively replenished with water. Therefore, its dryness value is low, and the soil is moist. The dryness values of PDI and MPDI are not significantly different, under different land covers. Figure 13 shows the frequency distributions of the dryness map of these indices. From the statistical distribution of the frequency, RDMI pixels were normally distributed in the range of 0.1–0.7, and the number of pixels with a pixel value of 0.4 was the greatest. RDMI could describe the spatial difference of regional dryness distribution. The pixel values of TVMDI were distributed between 0.1–1, but a large number of pixels were concentrated in the high value range. There were two peaks in the frequency distribution of TVDI. In combination with the information in Figure 12e, the TVDI value in the desert area was abnormally high. PDI pixels were distributed in the value range of 0.5–0.9, and the dryness of this region was significantly overestimated. MPDI was mainly concentrated between the range of 0.15 and 0.4, and the dryness of this region was significantly underestimated. The MPDI’s ability to distinguish dryness under different land cover conditions, was limited.
It is worth noting that all dryness values of the TVDI in the Gurbantunggut desert, were high. In fact, the soil moisture on the southern edge of the Gurbantunggut Desert was not as low as expected. On one hand, due to the penetration of the snowmelt water in spring, the soil moisture content of sand dunes might have been relatively high during this season. On the other hand, ephemeral plants are widely distributed in this area, which is an important part of desert vegetation as it has a positive effect on maintaining soil moisture [75]. This was faithfully displayed in the RDMI map. In summary, the RDMI exhibited good dryness monitoring capabilities under different land covers, as compared to other drought indices.
4.3.2. The RDMI Map with MODIS Data
To evaluate the applicability of the proposed RDMI over large-scale areas, two RDMI maps were produced for the entire Xinjiang province, using two MODIS images that were acquired on 2 June 2013 and 2 June 2014.
Figure 14a shows the spatial distribution of RDMI on 2 June 2013. It can be seen that the RDMI values are higher in the central area of the Tarim Basin and in the Northern Xinjiang Junggar Basin, where the land surface is much drier than in other areas. Furthermore, the values are lower in the Tianshan mountainous area and West of the Ili River Valley, which are relatively wetter than other areas.
As shown in Figure 15, the soil edge parameters of the three different dates were very stable, the slopes of the soil edges were maintained between 0.91 and 0.92, and the intercept changes were negligible. The slopes of the wet edges had tiny variations among these dates, but it is intuitively seen from Figure 16 that this change had an insignificant effect on the characteristic of the wet edges in the spectral space.
The RDMI values in North of the Altay region, Tacheng, Yumin, and the Northern area of the Kunlun Mountains were relatively low, which means that the soil in these areas was moist. Through the analysis of the spatial distribution characteristics of RDMI in Xinjiang, it could be seen that the RDMI values in the growing season of Xinjiang’s mountain forests and the main cultivated areas, maintained a low level, indicating that the soil moisture remained relatively high. As the supply of water resource in Xinjiang mainly comes from precipitation, snow, glaciers, and groundwater in mountain areas, the spatial distribution of water resources in Xinjiang is extremely uneven [76]. The vertical zonal distribution of dry and wet conditions in Xinjiang is relatively obvious [77]. The northern slope of the Tianshan Mountains, the Ili River Valley, and the Southern slope of Altay were relatively humid, while the Taklamakan Desert and the Gurbantunggut Desert were dry [78]. The dry and wet conditions reflected by the RDMI mapping, based on the MODIS images were consistent with the actual dry and wet patterns in Xinjiang.
Figure 14c shows the RDMI distribution on the 2 June 2014. In the spring and summer of 2014, most areas of Xinjiang were dry, because the temperatures in Northern Xinjiang, the Tianshan Mountain area, and the Southern Xinjiang, were higher than that in the previous years, and precipitation in the whole region was lower in the spring of 2014. The Ili River Valley suffered the most severe drought in the past 60 years, and the southern Xinjiang had the least precipitation for the same period of six consecutive months [79]. As can be seen clearly, the RDMI values of 2014 in the Ili River Valley, Aksu, Kashgar, and Hotan areas were higher than that on the same date of 2013. Figure 14d shows the RDMI difference results, for the same period, between the two years. The RDMI spatial distribution of the entire Xinjiang province in 2014, compared to 2013, Tacheng, Ili River Valley, the Northeastern Tarim Basin, and the Eastern section of the Northern slope of the Tianshan Mountains, was significantly dry. In contrast, the Northern part of the Tarim Basin obviously became wetter.
As shown in Figure 14e, since the end of August, the RDMI values in the Altay, Tacheng, Tianshan North Slope Economic Zone, Ili River Valley, Hotan, and Aksu regions were low, indicating that the soil moisture was high. The RDMI values were higher in the Gurbantunggut Desert and in the Taklimakan Desert. Compared with June 2 of the same year (Figure 14f), the RDMI values in most areas of the Xinjiang region did not change much. In the major agricultural areas, such as the Tacheng area, the Northern slope of the Tianshan Mountains, the Ili River valley, the Hotan area, and the Aksu area, the RDMI values became lower, which means the soil became wetter. This is related to irrigation in Xinjiang, in mid-August.
To further illustrate the ability of RDMI for dryness monitoring, we performed a comparison of the frequency distribution of RDMI maps, for the three dates. As shown in Figure 16a, the frequency distribution of the RDMI values shifted to the high-value area on 2 June 2014, compared with 2 June 2013, and the number of high-value pixels was significantly higher than that on 2 June 2013. This shows that Xinjiang, on 2 June 2014, was drier than that on 2 June 2013. As shown in Figure 16b, the frequency distribution on 21 August 2014, was more evenly distributed between 0.2 and 0.6, compared to 2 June 2014, and the peak was significantly lower. This shows that Xinjiang’s dryness on 31 August 2014 had, eased as compared to the dryness levels of 2 June 2014.
Land cover, regional climate, and soil properties affected soil moisture, and land cover might be the most crucial factor determining the short-term, and eventually long-term, evolution of the soil moisture fields [80]. Different land cover has different evapotranspiration conditions, which affect soil moisture over time [81]. Figure 17 shows the distribution of RDMI mean values in different land cover conditions in Xinjiang. According to the average RDMI distribution under different land cover conditions, the average RDMI of agricultural land, including dry cropland and irrigated cropland, was between 0.2 and 0.4, indicating that cropland soil was wetter than other land covers. With the decrease of grassland vegetation coverage, RDMI gradually increased, indicating that the lower the grassland coverage, the drier the soil. The RDMI of bare land and desert was high, indicating that the soil moisture content was extremely low in these areas. According to the RDMI changes at different times, under the same land cover conditions, the RDMI average values on 2 June 2014 increased for various land cover regions, as compared to 2 June 2013, which showed that the soil moisture in Xinjiang on 2 June 2014 was higher than it was on 2 June 2013. Similarly, the RDMI value on 21 August 2014 was lower than that on 2 June 2014.
5. Conclusions
Soil dryness poses serious health, social, economic, and political issues with far-reaching consequences. Therefore, it is crucial to understand how soil dryness affects the environment. In this regard, remote sensing methods have gained increasing attention, due to their larger spatial coverage and frequent temporal sampling abilities. The combination of different bands of spectral reflectance values can reflect the vegetation growth and soil moisture for a given region. Based on previous studies on the spectral space, this paper proposed a new dryness monitoring index, named RDMI, and verified it in the arid area. First, based on the NIR–Red spectral space, we analyzed the pixel triangular distribution characteristics, proposed a fitting method for establishing triangle boundaries, and then constructed a new dryness monitoring index. Second, we validated the proposed index using in-situ soil moisture data. The results showed that the RDMI values had a strong correlation with the in situ soil moisture values (r = −0.89, p < 0.001). Third, we used RDMI and other dryness indices, such as PDI, MPDI, TVDI, and TVMDI to map the dryness spatial distribution of the surrounding areas of Fukang City, with the Landsat-8 image. By comparing the correlation between the values of these indices and the in-situ soil moisture data under different land cover conditions, we found that the RDMI had a stable performance under various land covers. Finally, in order to verify the application of this index on a large scale, MODIS data acquired from three dates were used to map and compare the dryness spatial distribution in Xinjiang. The results showed that this index could reflect the changes in dryness spatial distributions in Xinjiang, at different times.
The index proposed in this paper expressed the dryness state at a certain moment in a specific region, and is an estimate of the dryness and wetness pattern at a specific time, taken with “snapshot” characteristics. The comparative analysis of the dryness spatial distribution changes in Xinjiang, for the three periods, showed that this index could reflect the change of regional dryness. In the future, we will conduct a comparative study of the long-term sequence dryness spatial distribution, based on this method, and will try to use this method to monitor the regional drought events. We can compare this method with the widely used drought indices, such as PDSI and SPI, to expand the application scope of this method. In addition, this paper used Landsat and MODIS data sources to verify the feasibility of this method for medium resolution and coarse resolution remote sensing data. The results showed that this method had a good performance in dryness monitoring for different spatial resolutions. However, because the acquisition times of these two data sources were different, and the soil moisture might have changed in a short time, the correlation of the RDMI values on these two scales were not analyzed. We will discuss this issue in a future long-term sequence study of RDMI.
In summary, the RDMI index could provide accurate surface dryness information and was robust, for different scales and different surface cover conditions.
Author Contributions
Data curation, J.Z.; Funding acquisition, Q.Z.; Investigation, J.Z.; Methodology, J.Z.; Project administration, Q.Z.; Resources, A.B.; Writing–original draft, J.Z.; Writing–review & editing, Q.Z., Y.W., and A.B.
Funding
This research was funded by National Key Research and Development Plan of China (Grant No. 2017YFB0504204), the ‘100 Talents Project’ of Chinese Academy of Sciences, China (Grant No. Y674141001), High-level Talent Introduction Project in Xinjiang Uygur Autonomous Region (Grant No. 644151001).
Acknowledgments
We are very grateful to Yuankang Xiong and Jin Zhao for their help during the soil sample collection. We thank very much the editors and the anonymous reviewers for their insightful comments and suggestions, which helped to clarify the text and improve the manuscript significantly.
Conflicts of Interest
The authors declare no conflict of interest.
References
- Wilhite, D.A. Drought as a natural hazard: Concepts and definitions. Drought A Glob. Assess. 2000, 1, 3–18. [Google Scholar]
- Mishra, A.K.; Singh, V.P. A review of drought concepts. J. Hydrol. 2010, 391, 202–216. [Google Scholar] [CrossRef]
- Jiang, L.; Jiapaer, G.; Bao, A.; Guo, H.; Ndayisaba, F. Vegetation dynamics and responses to climate change and human activities in central asia. Sci. Total Environ. 2017, 599, 967–980. [Google Scholar] [CrossRef] [PubMed]
- Makundi, W.R.; Shemdoe, R.; Kibassa, D.; Ravilious, C.; Bertzky, M.; Miles, L.; Angelsen, A.; Wertzkanounnikoff, S.; Hatcher, J. Climate Change and Water; Intergovernmental Panel on Climate Change Secretariat: Geneva, Switzerland, 2008. [Google Scholar]
- Hao, L.; Liu, S. Risk assessment to china’s agricultural drought disaster in county unit. Nat. Hazards 2012, 61, 785–801. [Google Scholar] [CrossRef]
- Li, Y.; Chen, C.Y.; Sun, C.F. Drought severity and change in xinjiang, china, over 1961–2013. Hydrol. Res. 2017, 48, 1343–1362. [Google Scholar] [CrossRef]
- Santos, J.F.; Pulido-Calvo, I.; Portela, M.M. Spatial and temporal variability of droughts in portugal. Water Resour. Res. 2010, 46. [Google Scholar] [CrossRef]
- Palmer, W. Meteorological drought. In U.S. Department of Commerce Weather Bureau Research Paper; U.S. Government Printing Office: Washington, DC, USA, 1965. [Google Scholar]
- Van Rooy, M. A rainfall anomaly index independent of time and space. Notos 1965, 14, 6. [Google Scholar]
- Palmer, W.C. Keeping track of crop moisture conditions, nationwide: The new crop moisture index. Weatherwise 1968, 21, 156–161. [Google Scholar] [CrossRef]
- Bhalme, H.N.; Mooley, D.A. Large-scale droughts/floods and monsoon circulation. Mon. Weather Rev. 1980, 108, 1197. [Google Scholar] [CrossRef]
- Shafer, B.A.; Dezman, L.E. Development of a surface water supply index (swsi) to assess the severity of drought conditions in snowpack runoff areas. In Proceedings of the 50th Annual Western Snow Conference, Reno, NV, USA, 19–23 April 1982. [Google Scholar]
- Katz, R.W.; Glantz, M.H. Anatomy of a rainfall index. Mon. Weather Rev. 1986, 114, 764–771. [Google Scholar] [CrossRef]
- McKee, T.B. Drought monitoring with multiple time scales. In Proceedings of the 9th Conference on Applied Climatology, Dallas, TX, USA, 15–20 January 1995. [Google Scholar]
- Easterling, D.R. Global Data Sets for Analysis of Climate Extremes; Springer: Berlin, Germany, 2013; pp. 347–361. [Google Scholar]
- Lessel, J.; Sweeney, A.; Ceccato, P. An agricultural drought severity index using quasi-climatological anomalies of remotely sensed data. Int. J. Remote Sens. 2016, 37, 913–925. [Google Scholar] [CrossRef]
- Atzberger, C. Advances in remote sensing of agriculture: Context description, existing operational monitoring systems and major information needs. Remote Sens. 2013, 5, 949–981. [Google Scholar] [CrossRef]
- Yin, J.; Zhan, X.; Hain, C.R.; Liu, J.; Anderson, M.C. A method for objectively integrating soil moisture satellite observations and model simulations toward a blended drought index. Water Resour. Res. 2018, 54, 6772–6791. [Google Scholar] [CrossRef]
- Hao, Z.; AghaKouchak, A.; Nakhjiri, N.; Farahmand, A. Global integrated drought monitoring and prediction system. Sci. Data 2014, 1, 140001. [Google Scholar] [CrossRef] [PubMed]
- Paridal, B.R.; Collado, W.B.; Borah, R.; Hazarika, M.K.; Sarnarakoon, L. Detecting drought-prone areas of rice agriculture using a modis-derived soil moisture index. Gisci. Remote Sens. 2008, 45, 109–129. [Google Scholar] [CrossRef]
- Damberg, L.; AghaKouchak, A. Global trends and patterns of drought from space. Theor. Appl. Climatol. 2014, 117, 441–448. [Google Scholar] [CrossRef]
- AghaKouchak, A.; Cheng, L.; Mazdiyasni, O.; Farahmand, A. Global warming and changes in risk of concurrent climate extremes: Insights from the 2014 california drought. Geophys. Res. Lett. 2014, 41, 8847–8852. [Google Scholar] [CrossRef]
- Barré, H.M.; Duesmann, B.; Kerr, Y.H. SMOS: The mission and the system. IEEE Trans. Geosci. Remote Sens. 2008, 46, 587–593. [Google Scholar] [CrossRef]
- Entekhabi, D.; Njoku, E.G.; O’Neill, P.E.; Kellogg, K.H.; Crow, W.T.; Edelstein, W.N.; Entin, J.K.; Goodman, S.D.; Jackson, T.J.; Johnson, J. The soil moisture active passive (smap) mission. Proc. IEEE 2010, 98, 704–716. [Google Scholar] [CrossRef]
- Njoku, E.G.; Jackson, T.J.; Lakshmi, V.; Chan, T.K.; Nghiem, S.V. Soil moisture retrieval from amsr-e. IEEE Trans. Geosci. Remote Sens. 2003, 41, 215–229. [Google Scholar] [CrossRef]
- Chen, N.C.; He, Y.Q.; Zhang, X. Nir-red spectra-based disaggregation of smap soil moisture to 250 m resolution based on oznet in southeastern australia. Remote Sens. 2017, 9, 51. [Google Scholar] [CrossRef]
- Liu, D.; Mishra, A.K.; Yu, Z.B.; Yang, C.G.; Konapala, G.; Vu, T. Performance of smap, amsr-e and lai for weekly agricultural drought forecasting over continental united states. J. Hydrol. 2017, 553, 88–104. [Google Scholar] [CrossRef]
- Martinez-Fernandez, J.; Gonzalez-Zamora, A.; Sanchez, N.; Gumuzzio, A.; Herrero-Jimenez, C.M. Satellite soil moisture for agricultural drought monitoring: Assessment of the smos derived soil water deficit index. Remote Sens. Environ. 2016, 177, 277–286. [Google Scholar] [CrossRef]
- Park, S.; Im, J.; Park, S.; Rhee, J. Drought monitoring using high resolution soil moisture through multi-sensor satellite data fusion over the korean peninsula. Agric. For. Meteorol. 2017, 237, 257–269. [Google Scholar] [CrossRef]
- Du, L.; Tian, Q.; Yu, T.; Meng, Q.; Jancso, T.; Udvardy, P.; Huang, Y. A comprehensive drought monitoring method integrating modis and trmm data. Int. J. Appl. Earth Obs. 2013, 23, 245–253. [Google Scholar] [CrossRef]
- Naumann, G.; Barbosa, P.; Carrao, H.; Singleton, A.; Vogt, J. Monitoring drought conditions and their uncertainties in africa using trmm data. J. Appl. Meteorol. Climatol. 2012, 51, 1867–1874. [Google Scholar] [CrossRef]
- Joyce, R.J.; Janowiak, J.E.; Arkin, P.A.; Xie, P.P. Cmorph: A method that produces global precipitation estimates from passive microwave and infrared data at high spatial and temporal resolution. J. Hydrometeorol. 2004, 5, 487–503. [Google Scholar] [CrossRef]
- Janowiak, J.E.; Joyce, R.J.; Yarosh, Y. A real-time global half-hourly pixel-resolution infrared dataset and its applications. Bull. Am. Meteorol. Soc. 2001, 82, 205–217. [Google Scholar] [CrossRef]
- Guo, H.; Bao, A.; Liu, T.; Chen, S.; Ndayisaba, F. Evaluation of persiann-cdr for meteorological drought monitoring over china. Remote Sens. 2016, 8, 379. [Google Scholar] [CrossRef]
- Adler, R.F.; Huffman, G.J.; Chang, A.; Ferraro, R.; Xie, P.P.; Janowiak, J.; Rudolf, B.; Schneider, U.; Curtis, S.; Bolvin, D.; et al. The version-2 global precipitation climatology project (gpcp) monthly precipitation analysis (1979-present). J. Hydrometeorol. 2003, 4, 1147–1167. [Google Scholar] [CrossRef]
- Price, J.C. On the information content of soil reflectance spectra. Remote Sens. Environ. 1990, 33, 113–121. [Google Scholar] [CrossRef]
- Lobell, D.B.; Asner, G.P. Moisture effects on soil reflectance. Soil Sci. Soc. Am. J. 2002, 66, 722–727. [Google Scholar] [CrossRef]
- Bablet, A.; Vu, P.V.H.; Jacquemoud, S.; Viallefont-Robinet, F.; Fabre, S.; Briottet, X.; Sadeghi, M.; Whiting, M.L.; Baret, F.; Tian, J. Marmit: A multilayer radiative transfer model of soil reflectance to estimate surface soil moisture content in the solar domain (400–2500 nm). Remote Sens. Environ. 2018, 217, 1–7. [Google Scholar] [CrossRef]
- Whalley, W.R.; Leedsharrison, P.B.; Bowman, G.E. Estimation of soil-moisture status using near-infrared reflectance. Hydrol. Process. 1991, 5, 321–327. [Google Scholar] [CrossRef]
- Fabre, S.; Briottet, X.; Lesaignoux, A. Estimation of soil moisture content from the spectral reflectance of bare soils in the 0.4–2.5 mu m domain. Sensors 2015, 15, 3262–3281. [Google Scholar] [CrossRef] [PubMed]
- Oltra-Carrio, R.; Baup, F.; Fabre, S.; Fieuzal, R.; Briottet, X. Improvement of soil moisture retrieval from hyperspectral vnir-swir data using clay content information: From laboratory to field experiments. Remote Sens. 2015, 7, 3184–3205. [Google Scholar] [CrossRef]
- Gao, B.C. Ndwi—A normalized difference water index for remote sensing of vegetation liquid water from space. Remote Sens. Environ. 1996, 58, 257–266. [Google Scholar] [CrossRef]
- Ghulam, A.; Qin, Q.; Zhan, Z. Designing of the perpendicular drought index. Environ. Geol. 2007, 52, 1045–1052. [Google Scholar] [CrossRef]
- Ghulam, A.; Qin, Q.M.; Teyip, T.; Li, Z.L. Modified perpendicular drought index (mpdi): A real-time drought monitoring method. ISPRS J. Photogramm. Remote Sens. 2007, 62, 150–164. [Google Scholar] [CrossRef]
- Zhang, J.; Zhou, Z.; Yao, F.; Yang, L.; Hao, C. Validating the modified perpendicular drought index in the north china region using in situ soil moisture measurement. IEEE Geosci. Remote Sens. Lett. 2015, 12, 542–546. [Google Scholar] [CrossRef]
- Sandholt, I.; Rasmussen, K.; Andersen, J. A simple interpretation of the surface temperature/vegetation index space for assessment of surface moisture status. Remote Sens. Environ. 2002, 79, 213–224. [Google Scholar] [CrossRef]
- Kogan, F.N. Application of vegetation index and brightness temperature for drought detection. Adv. Space Res. 1995, 15, 91–100. [Google Scholar] [CrossRef]
- Ghulam, A. Remote Monitoring of Farmland Drought Based n-Dimensional Spectral Feature Space. Ph.D. Thesis, Peking University, Beijing, China, 2006. (In Chinese). [Google Scholar]
- Amani, M.; Salehi, B.; Mahdavi, S.; Masjedi, A.; Dehnavi, S. Temperature-vegetation-soil moisture dryness index (tvmdi). Remote Sens. Environ. 2017, 197, 1–14. [Google Scholar] [CrossRef]
- Dash, P.; Gottsche, F.M.; Olesen, F.S.; Fischer, H. Land surface temperature and emissivity estimation from passive sensor data: Theory and practice-current trends. Int. J. Remote Sens. 2002, 23, 2563–2594. [Google Scholar] [CrossRef]
- Yao, J.; Chen, Y.; Zhao, Y.; Mao, W.; Xu, X.; Liu, Y.; Yang, Q. Response of vegetation ndvi to climatic extremes in the arid region of central asia: A case study in xinjiang, china. Theor. Appl. Climatol. 2017, 131, 1503–1515. [Google Scholar] [CrossRef]
- Zhang, Q.; Singh, V.P.; Bai, Y. Spi-based evaluation of drought events in xinjiang, china. Nat. Hazards 2012, 64, 481–492. [Google Scholar] [CrossRef]
- Li, H.X.; Yang, J.; Hao, X.M. Retrieval of soil moisture information in xinjiang using modis. Acta Prataculturae Sin. 2017, 26, 16–27. (In Chinese) [Google Scholar]
- Gerace, A.; Montanaro, M. Derivation and validation of the stray light correction algorithm for the thermal infrared sensor onboard landsat 8. Remote Sens. Environ. 2017, 191, 246–257. [Google Scholar] [CrossRef]
- Available online: https://landsat.usgs.gov/2014 (accessed on 24 December 2014).
- Richardson, A.J. Distinguishing vegetation from soil background information. Photogramm. Eng. Remote Sens. 1977, 43, 1541–1552. [Google Scholar]
- Price, J.C. Estimating vegetation amount from visible and near-infrared reflectances. Remote Sens. Environ. 1992, 41, 29–34. [Google Scholar] [CrossRef]
- Zhan, Z.; Qin, Q.; Ghulan, A.; Wang, D. Nir-red spectral space based new method for soil moisture monitoring. Sci. China Ser. D Earth Sci. 2007, 50, 283–289. [Google Scholar] [CrossRef]
- Amani, M.; Parsian, S.; MirMazloumi, S.M.; Aieneh, O. Two new soil moisture indices based on the nir-red triangle space of landsat-8 data. Int. J. Appl. Earth Obs. 2016, 50, 176–186. [Google Scholar] [CrossRef]
- Mobasheri, M.R.; Bidkhan, N.G. Development of new hyperspectral angle index for estimation of soil moisture using in situ spectral measurments. ISPRS Int. Arch. Photogramm. Remote Sens. Spat. Inf. Sci. 2013, 40, 481–486. [Google Scholar] [CrossRef]
- Qin, Q.; Ghulam, A.; Zhu, L.; Wang, L.; Li, J. Application of perpendicular drought index in the drought assessment: A case study in ningxia huizu autonomous region of china using modis data. In Proceedings of the 2006 IEEE International Geoscience and Remote Sensing Symposium, Denver, CO, USA, 31 July–4 August 2006; Volumes 1–8, pp. 3078–3081. [Google Scholar]
- Shahabfar, A.; Eitzinger, J. Agricultural drought monitoring in semi-arid and arid areas using modis data. J. Agric. Sci. 2011, 149, 403–414. [Google Scholar] [CrossRef]
- Liu, Y.; Yue, H.; Wang, H.; Zhang, W.; Iop. Comparison of smmi, pdi and its applications in shendong mining area. In Proceedings of the International Symposium on Earth Observation for One Belt and One Road, Sanya, China, 25–27 November 2017; Volume 57. [Google Scholar]
- Zormand, S.; Jafari, R.; Koupaei, S.S. Assessment of pdi, mpdi and tvdi drought indices derived from modis aqua/terra level 1b data in natural lands. Nat. Hazards 2017, 86, 757–777. [Google Scholar] [CrossRef]
- Sheng, C.; Bingfang, W.; Nana, Y.; Jianjun, Z.; Qi, W.; Feng, X. A refined crop drought monitoring method based on the chinese gf-1 wide field view. Sensors 2018, 18, 1297. [Google Scholar]
- Gao, Z.; Gao, W.; Chang, N.-B. Integrating temperature vegetation dryness index (tvdi) and regional water stress index (rwsi) for drought assessment with the aid of landsat tm/etm plus images. Int. J. Appl. Earth Obs. 2011, 13, 495–503. [Google Scholar] [CrossRef]
- Sun, L.; Wu, Q.; Pei, Z.; Li, B.; Chen, X. Study on drought index in major planting area of winter wheat of china. Sens. Lett. 2012, 10, 453–458. [Google Scholar] [CrossRef]
- Carpenter, G.A.; Gopal, S.; Macomber, S.; Martens, S.; Woodcock, C.E.; Franklin, J. A neural network method for efficient vegetation mapping. Remote Sens. Environ. 1999, 70, 326–338. [Google Scholar] [CrossRef]
- Elmore, A.J.; Mustard, J.F.; Manning, S.J.; Lobell, D.B. Quantifying vegetation change in semiarid environments: Precision and accuracy of spectral mixture analysis and the normalized difference vegetation index. Remote Sens. Environ. 2000, 73, 87–102. [Google Scholar] [CrossRef]
- Baret, F.; Clevers, J.G.; Steven, M.D. The robusteness of canopy gap fraction estimates from red and near-infrared reflectances: A comparison of approaches. Remote Sens. Environ. Remote Sens. Environ. 1995, 54, 141–151. [Google Scholar] [CrossRef]
- Shahabfar, A.; Ghulam, A.; Eitzinger, J. Drought monitoring in iran using the perpendicular drought indices. Int. J. Appl. Earth Obs. 2012, 18, 119–127. [Google Scholar] [CrossRef]
- Qin, Z.; Karnieli, A.; Berliner, P. A mono-window algorithm for retrieving land surface temperature from landsat tm data and its application to the israel-egypt border region. Int. J. Remote Sens. 2001, 22, 3719–3746. [Google Scholar] [CrossRef]
- Shahabfar, A.; Reinwand, M.; Conrad, C.; Schorcht, G. A re-examination of perpendicular drought indices over central and south-west asia. In Remote Sensing for Agriculture, Ecosystems, and Hydrology Xiv; Neale, C.M.U., Maltese, A., Eds.; Spie-International Socity Optical Engineering: Bellingham, WA, USA, 2012; Volume 8531. [Google Scholar]
- Zhao, C.Y.; Sheng, Y.; Yimam, Y. Quantifying the impacts of soil water stress on the winter wheat growth in an arid region, xinjiang. J. Arid Land 2009, 1, 34–42. [Google Scholar]
- Li, J.; Zhao, C.Y.; Song, Y.J.; Sheng, Y.; Zhu, H. Spatial patterns of desert annuals in relation to shrub effects on soil moisture. J. Veg. Sci. 2010, 21, 221–232. [Google Scholar] [CrossRef]
- Li, S.Y.; Tang, Q.L.; Lei, J.Q.; Xu, X.W.; Jiang, J.; Wang, Y.D. An overview of non-conventional water resource utilization technologies for biological sand control in xinjiang, northwest china. Environ. Earth Sci. 2015, 73, 873–885. [Google Scholar] [CrossRef]
- Hu, R.J.; Ma, H.; Fan, Z.L. The climate trend demonstrated by changes of the lakes in xinjiang since recent years. J. Arid Land Resour. Environ. 2002, 16, 20–27. (In Chinese) [Google Scholar]
- Jiang, L. Analysis on the trend of climate and runoff changes of manas river basin upstream. Environ. Prot. Xinjiang 2016, 38, 44–48. (In Chinese) [Google Scholar]
- Xinhua. Drought Affects Half a Million in Xinjiang. Available online: http://www.chinadaily.com.cn/china/2014-08/23/content_18475075.htm (accessed on 23 August 2014).
- Yoo, C.; Kim, S.J.; Lee, J.S. Land cover change and its impact on soil-moisture-field evolution. J. Hydrol. Eng. 2001, 6, 436–441. [Google Scholar] [CrossRef]
- Chen, X.; Su, Y.; Liao, J.; Shang, J.; Dong, T.; Wang, C.; Liu, W.; Zhou, G.; Liu, L. Detecting significant decreasing trends of land surface soil moisture in eastern china during the past three decades (1979–2010). J. Geophys. Res. Atmos. 2016, 121, 5177–5192. [Google Scholar] [CrossRef]
Figure 1.
Study area (Xinjiang Uygur Autonomous Region, China). The inset image is the surrounding area of the Fukang City and locations of fifty-one soil samples were taken.
Figure 1.
Study area (Xinjiang Uygur Autonomous Region, China). The inset image is the surrounding area of the Fukang City and locations of fifty-one soil samples were taken.

Figure 2.
The positions of the fifty-one soil moisture samples with different land cover types in the surrounding areas of the Fukang City. Typical land cover types, such as desert, farmland, bare land, wetlands, are marked with text in the map.
Figure 2.
The positions of the fifty-one soil moisture samples with different land cover types in the surrounding areas of the Fukang City. Typical land cover types, such as desert, farmland, bare land, wetlands, are marked with text in the map.

Figure 3.
(a) The triangle distribution characteristics in the near-infrared (NIR)–Red spectral space. (b) The PVI and soil moisture (SM) iso-lines [49]. NIR and Red represent near-infrared and red band reflectance, respectively.
Figure 3.
(a) The triangle distribution characteristics in the near-infrared (NIR)–Red spectral space. (b) The PVI and soil moisture (SM) iso-lines [49]. NIR and Red represent near-infrared and red band reflectance, respectively.

Figure 4.
The definition of PDI, the PDI value is defined as the distance of E and F in the NIR–Red spectral space [43].
Figure 4.
The definition of PDI, the PDI value is defined as the distance of E and F in the NIR–Red spectral space [43].

Figure 5.
The sketch map of the TVDI. TVDI is established in the two-dimensional space of NDVI and LST, and the TVDI value is defined as the ratio of the distance from the pixel to the wet edge (A) to the distance between the dry and wet edges (B). [46].
Figure 5.
The sketch map of the TVDI. TVDI is established in the two-dimensional space of NDVI and LST, and the TVDI value is defined as the ratio of the distance from the pixel to the wet edge (A) to the distance between the dry and wet edges (B). [46].

Figure 6.
The definition of Temperature–Vegetation–Soil Moisture Dryness Index (TVMDI). TVMDI is based on PVI, LST, and SM as the axis of the three-dimensional space. The TVMDI value is defined as the square root of the square sum of PVI, LST, and SM at the pixel position [49].
Figure 6.
The definition of Temperature–Vegetation–Soil Moisture Dryness Index (TVMDI). TVMDI is based on PVI, LST, and SM as the axis of the three-dimensional space. The TVMDI value is defined as the square root of the square sum of PVI, LST, and SM at the pixel position [49].

Figure 7.
The definition of the triangle edges. AB is the soil edge, AC is the wet edge, and BC is the dry edge. All pixels are distributed in this triangular region in the NIR–Red spectral space.
Figure 7.
The definition of the triangle edges. AB is the soil edge, AC is the wet edge, and BC is the dry edge. All pixels are distributed in this triangular region in the NIR–Red spectral space.

Figure 8.
Development of the Ratio Dryness Monitoring Index (RDMI) based on the NIR–Red spectral space. DP and DE are the lines passing through the pixel P that are parallel to soil edge (AB). The RDMI value is the ratio of DP and DE.
Figure 8.
Development of the Ratio Dryness Monitoring Index (RDMI) based on the NIR–Red spectral space. DP and DE are the lines passing through the pixel P that are parallel to soil edge (AB). The RDMI value is the ratio of DP and DE.

Figure 9.
Flowchart for calculating the RDMI. (a) Establishment of the NIR–Red spectral space, (b) extracting the triangle boundary point set, and (c) the triangle boundary fit according to the point set, and calculation of the RDMI.
Figure 9.
Flowchart for calculating the RDMI. (a) Establishment of the NIR–Red spectral space, (b) extracting the triangle boundary point set, and (c) the triangle boundary fit according to the point set, and calculation of the RDMI.

Figure 10.
The triangle distribution of the NIR and red bands values in the NIR–Red spectral space generated with real Landsat-8 OLI data. The yellow points represent the soil pixels and the blue points represent the wet pixels.
Figure 10.
The triangle distribution of the NIR and red bands values in the NIR–Red spectral space generated with real Landsat-8 OLI data. The yellow points represent the soil pixels and the blue points represent the wet pixels.

Figure 11.
(a) The relationship between the RDMI and in situ soil moisture (n = 26). (b) The correlation between the estimated soil moisture content and the in situ soil moisture content.
Figure 11.
(a) The relationship between the RDMI and in situ soil moisture (n = 26). (b) The correlation between the estimated soil moisture content and the in situ soil moisture content.

Figure 12.
The dryness maps of the surrounding area of Fukang City using Landsat-8 imagery on the 12 June 2014. (a) RDMI, (b) the false color composite image, (c) PDI, (d) MPDI, (e) TVDI, and (f) TVMDI. (All the dryness values in these maps were normalized. The spatial resolution of these maps is 30 m).


Figure 13.
A comparison of the frequency distributions of the RDMI, MPDI, PDI, TVDI, and the TVMDI dryness maps.
Figure 13.
A comparison of the frequency distributions of the RDMI, MPDI, PDI, TVDI, and the TVMDI dryness maps.

Figure 14.
The RDMI maps of the Xinjiang province and the differences in dryness in spatial distributions. (a) RDMI map for June 2, 2013; (b) illustration of the Xinjiang area; (c) RDMI map for June 2, 2014; (d) the RDMI difference on the same date of different years; (e) RDMI map for August 21, 2014; (f) the RDMI difference on the different date of the same year.

Figure 15.
The soil, wet edge pixels, and fitting parameters of the NIR–Red spectral spaces in Xinjiang on three different dates (2 June 2013, 2 June 2014, and 21 August 2014). Ssoil, Isoil are the slopes and intercepts of soil edge, Swet, Iwet are the slopes and intercepts of the wet edge.
Figure 15.
The soil, wet edge pixels, and fitting parameters of the NIR–Red spectral spaces in Xinjiang on three different dates (2 June 2013, 2 June 2014, and 21 August 2014). Ssoil, Isoil are the slopes and intercepts of soil edge, Swet, Iwet are the slopes and intercepts of the wet edge.

Figure 16.
A comparison of the RDMI frequency distribution on different dates. (a) A comparison between 2 June 2013 and 2 June 2014; and (b) a comparison between 2 June 2014 and 21 August 2014.
Figure 16.
A comparison of the RDMI frequency distribution on different dates. (a) A comparison between 2 June 2013 and 2 June 2014; and (b) a comparison between 2 June 2014 and 21 August 2014.

Figure 17.
The RDMI average values on different dates for different land cover conditions in Xinjiang.
Figure 17.
The RDMI average values on different dates for different land cover conditions in Xinjiang.


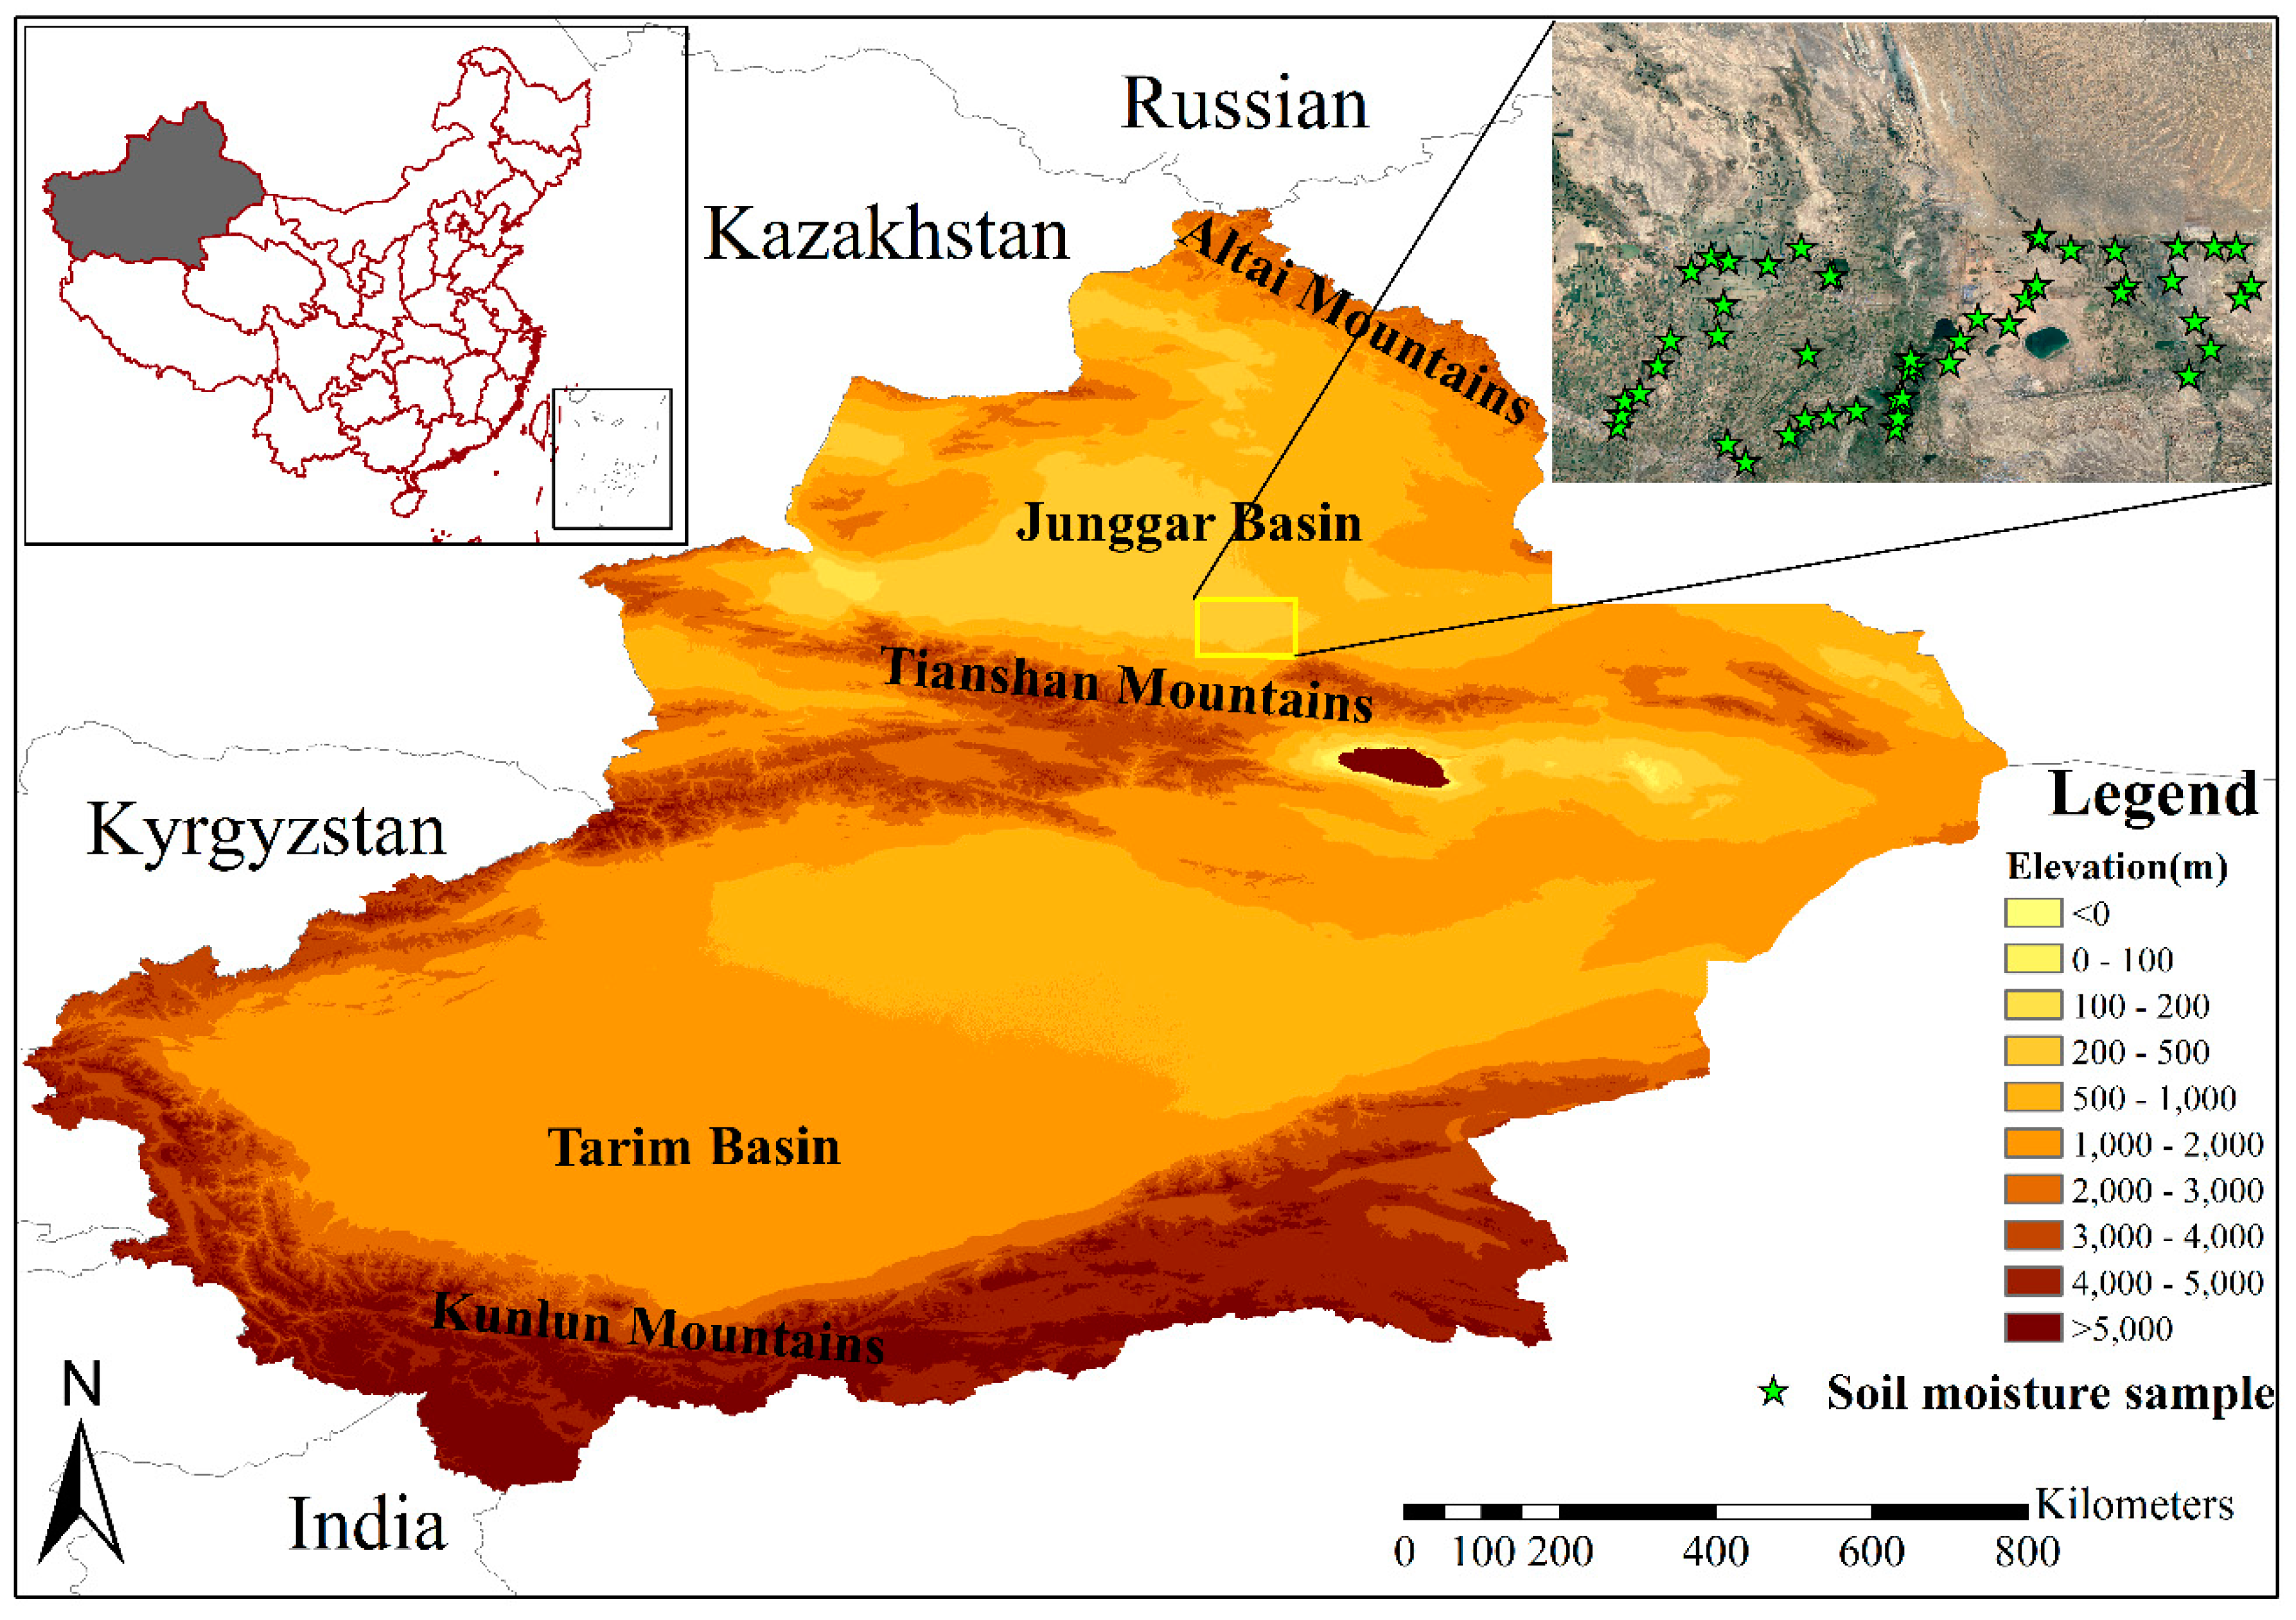
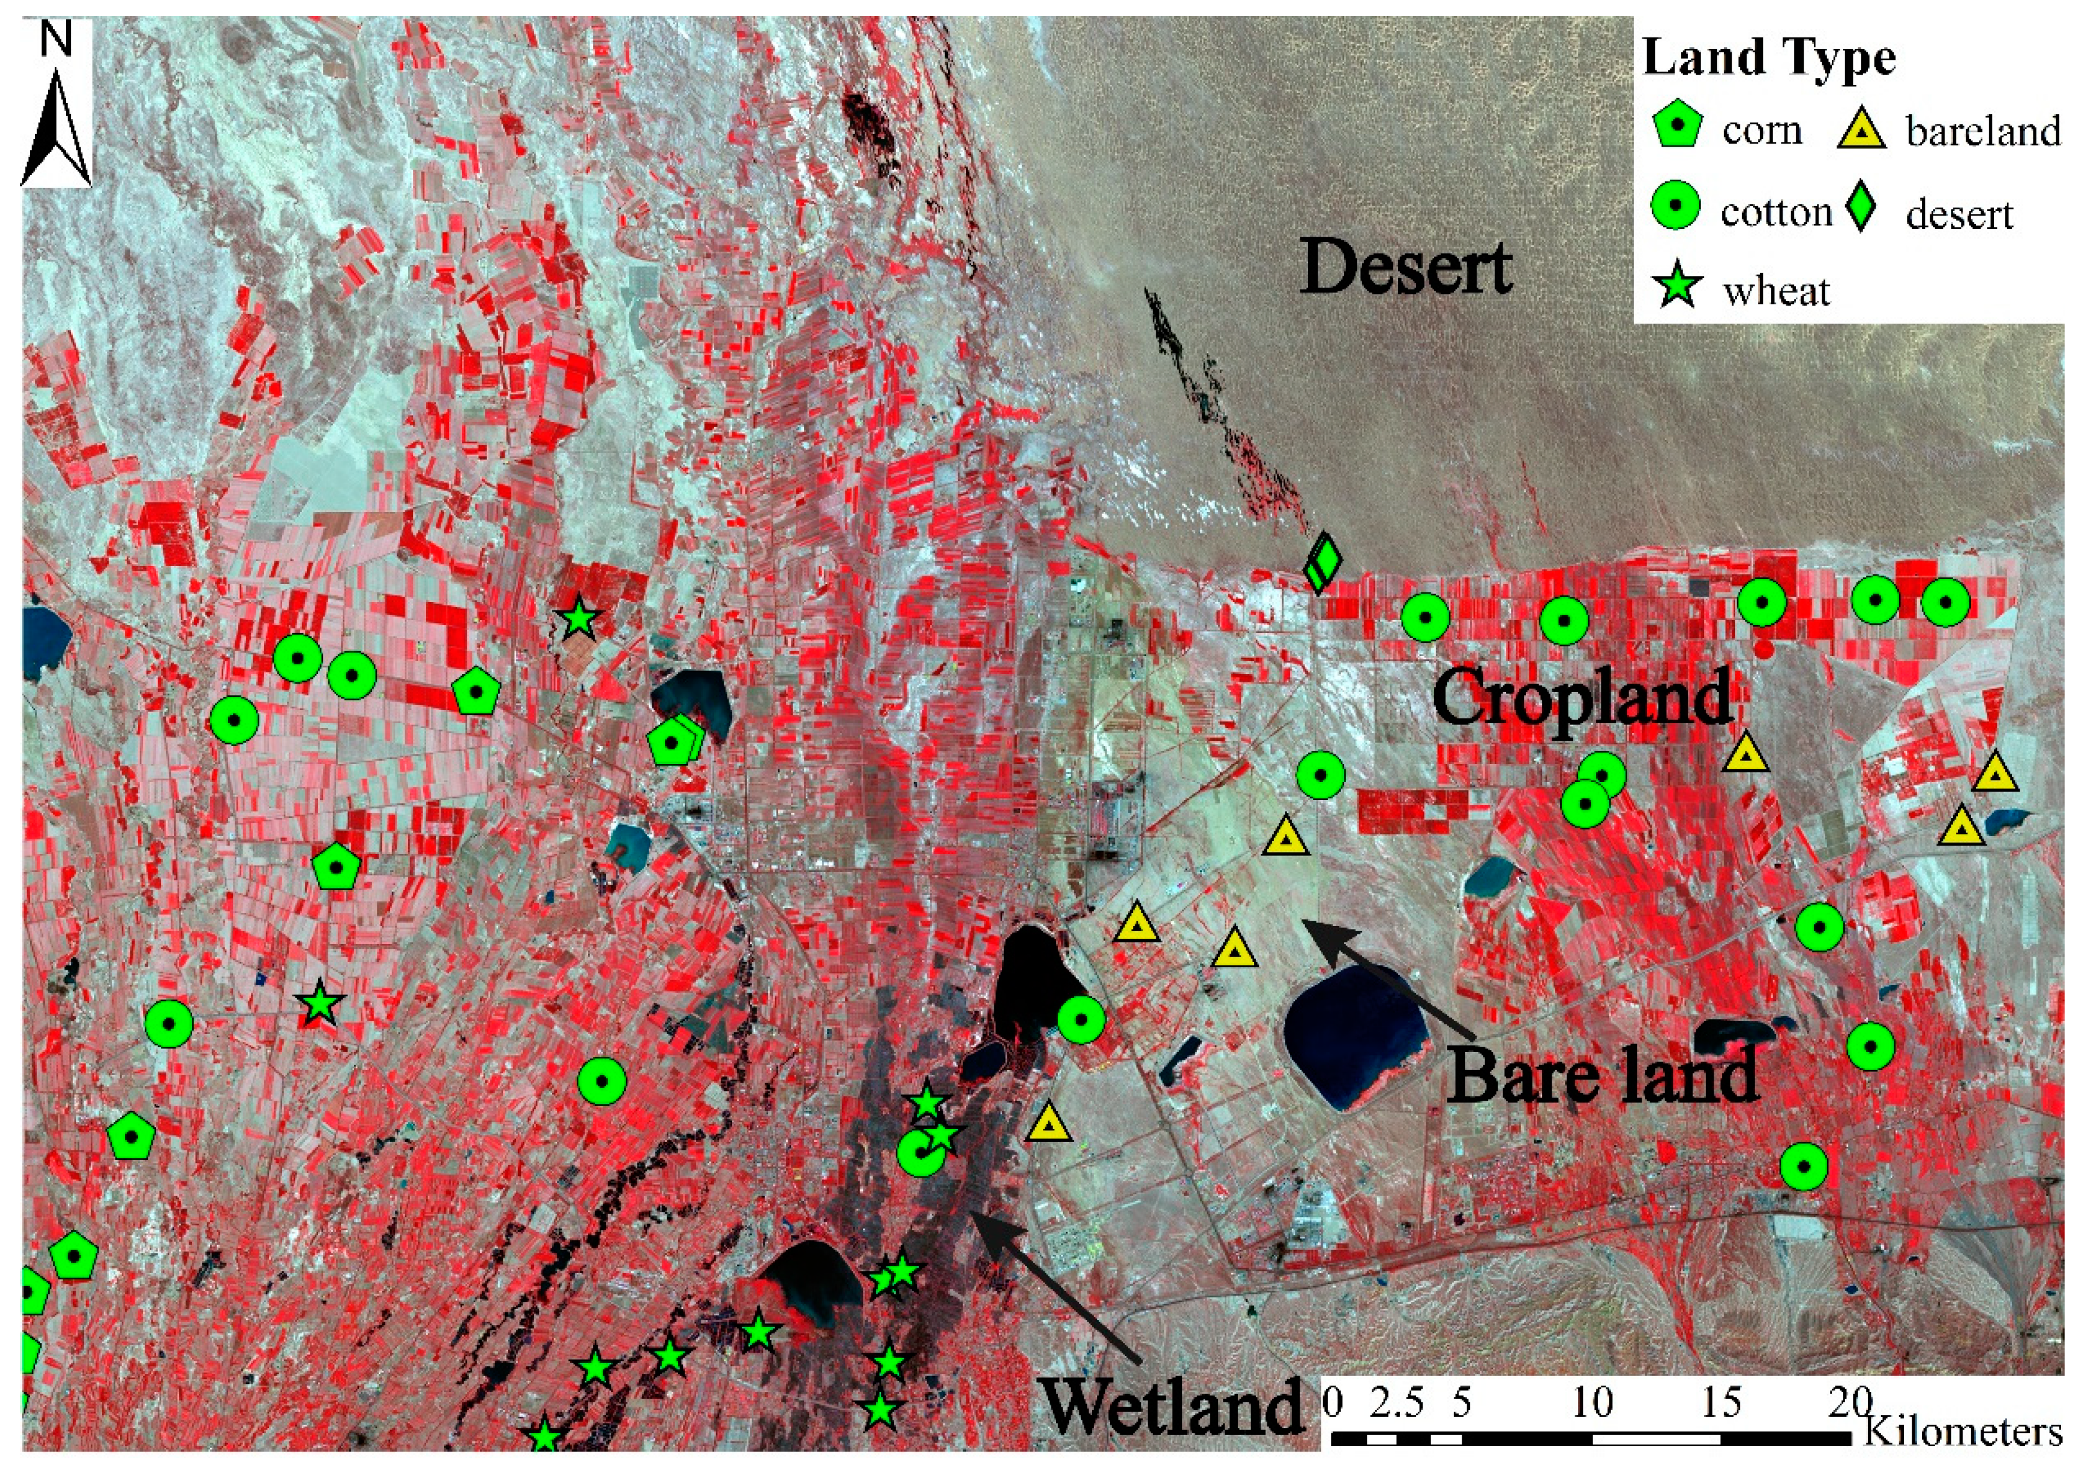
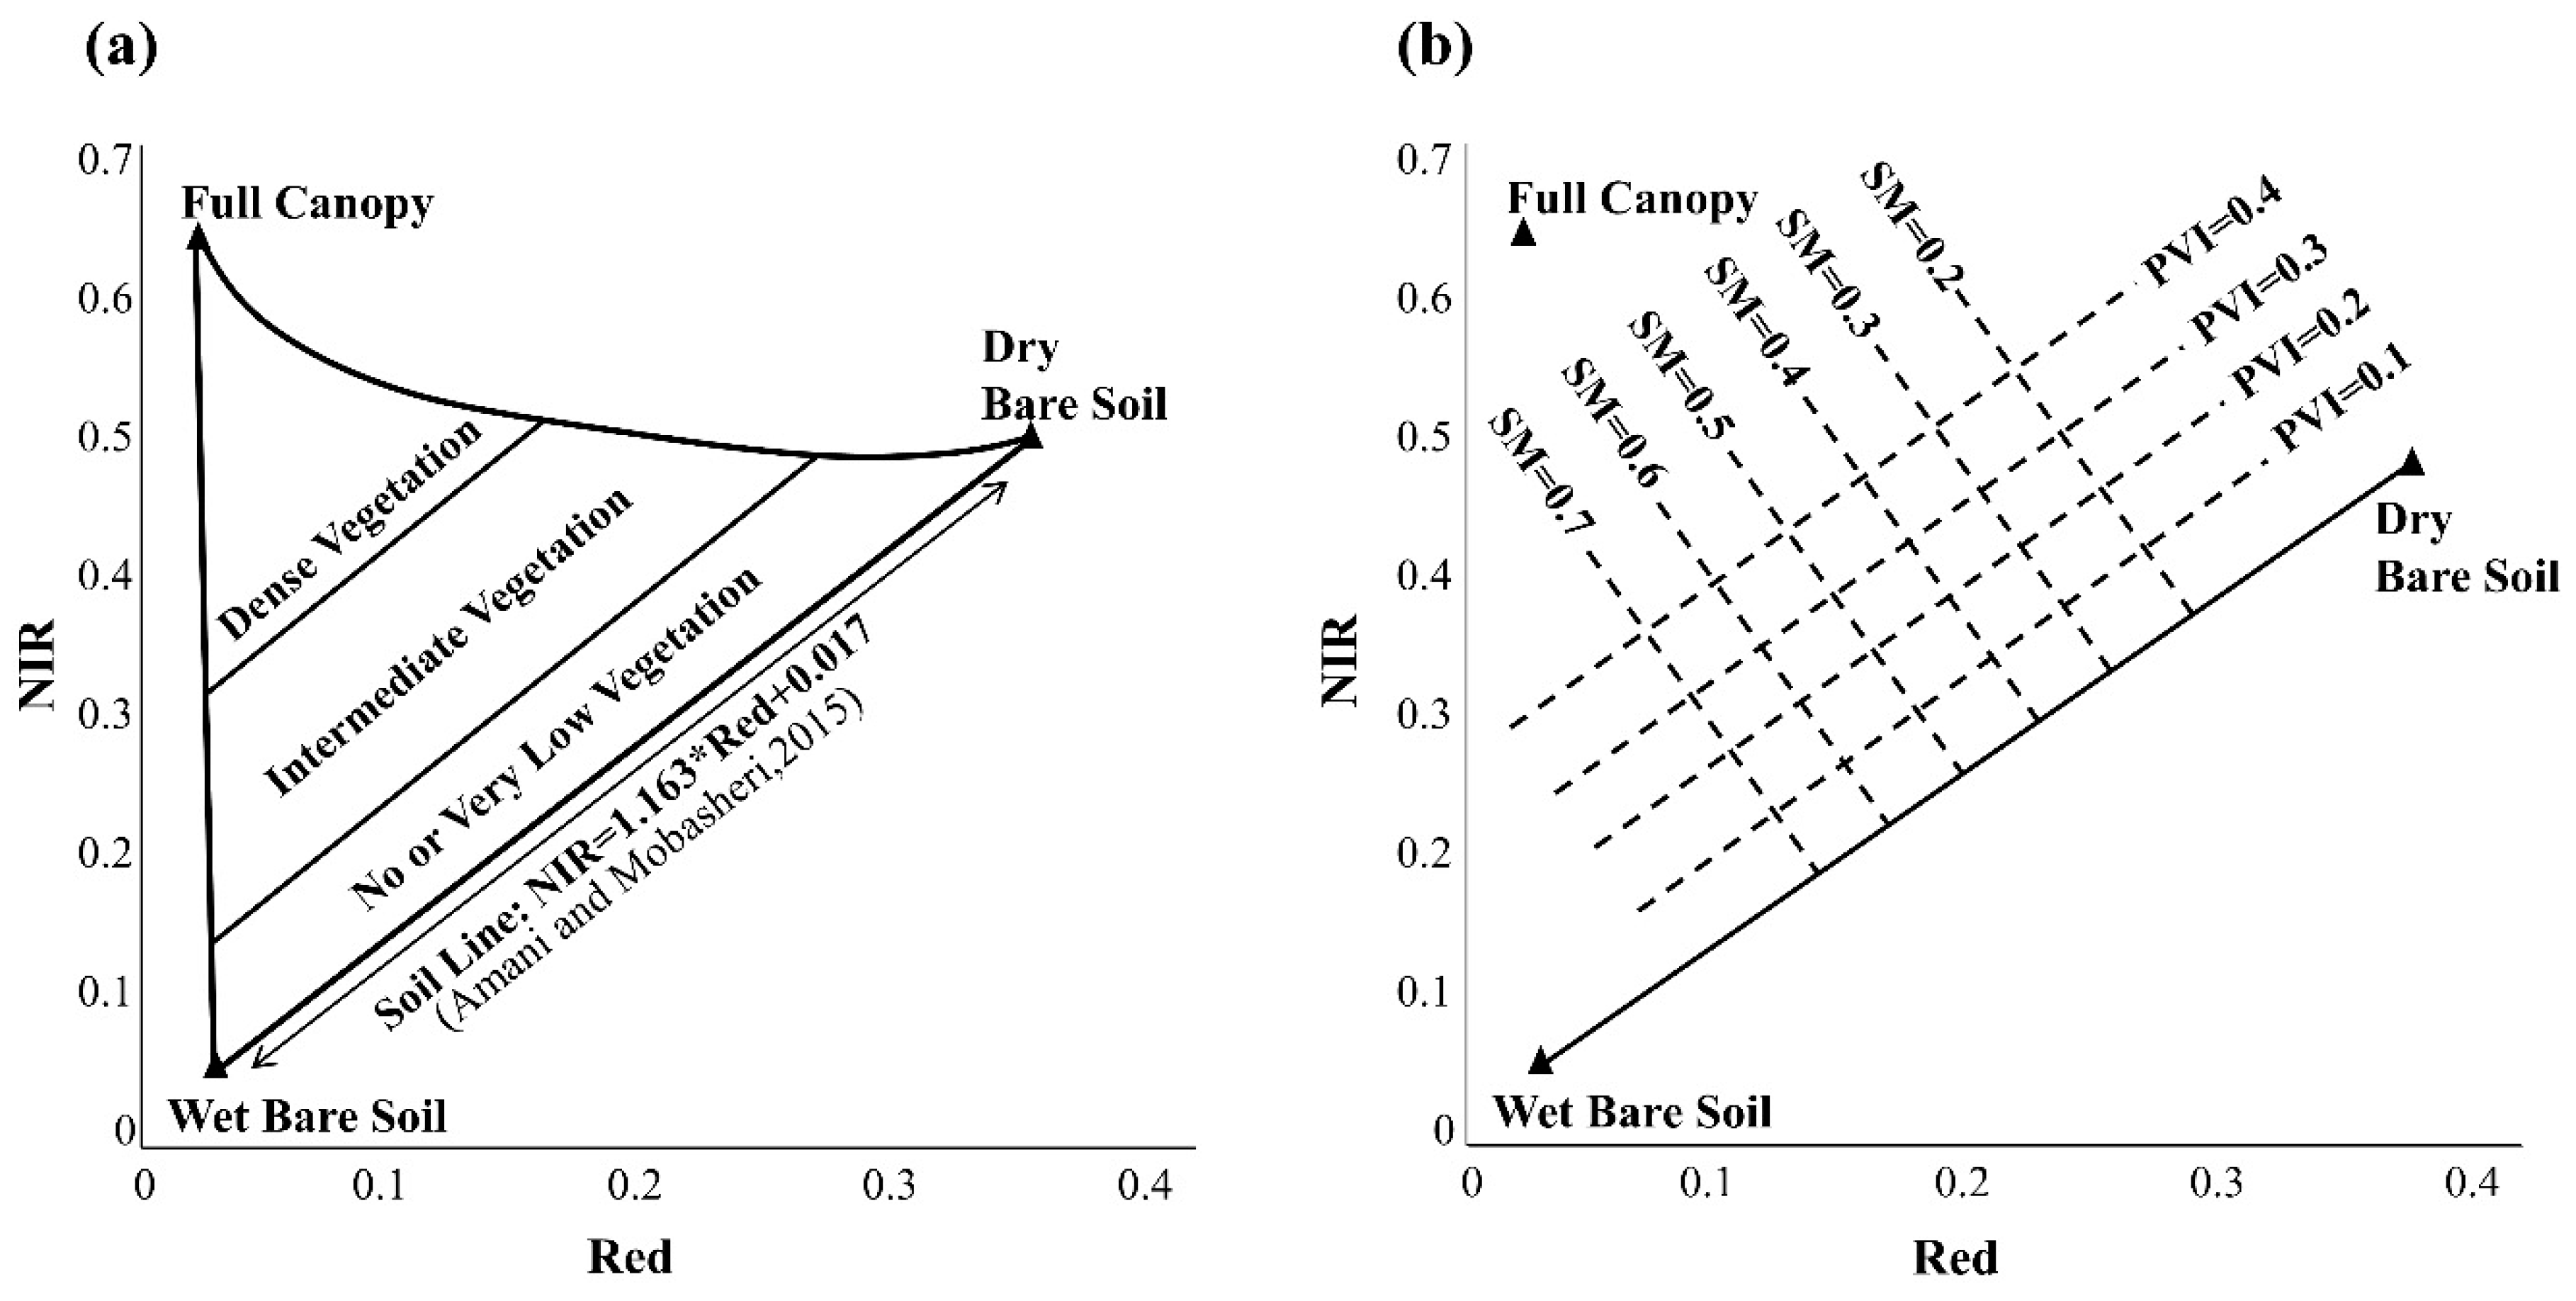
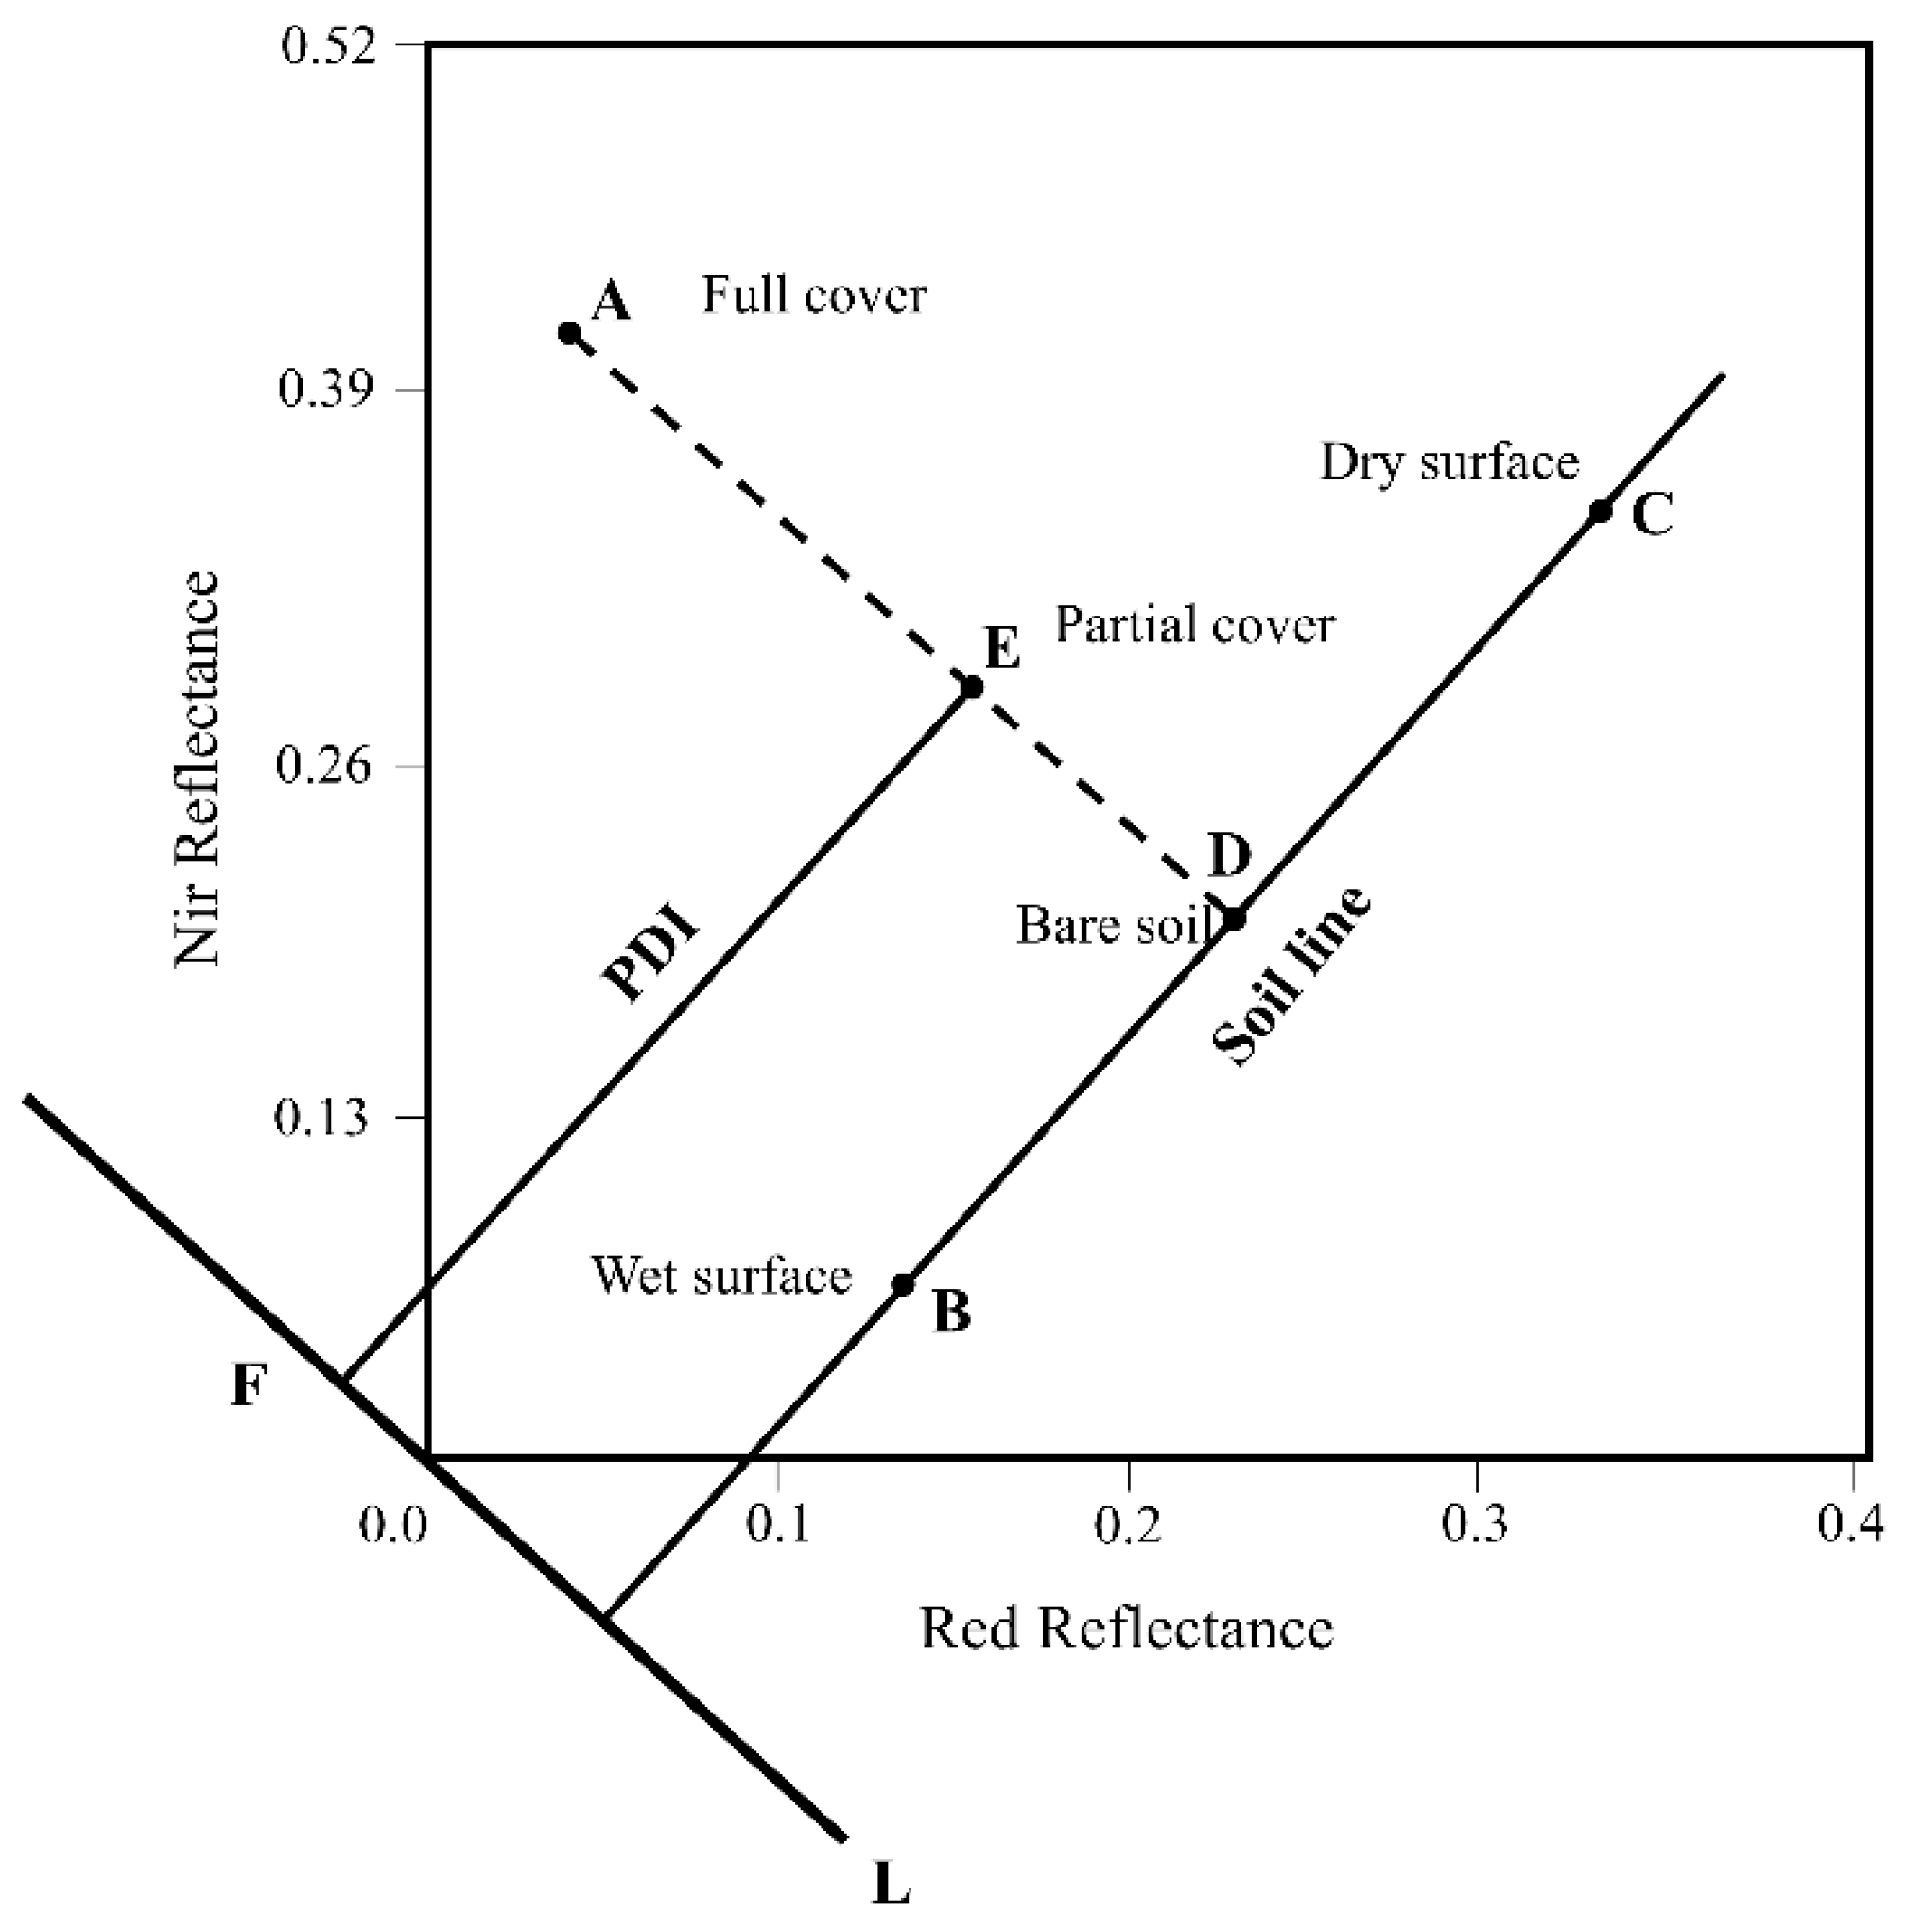
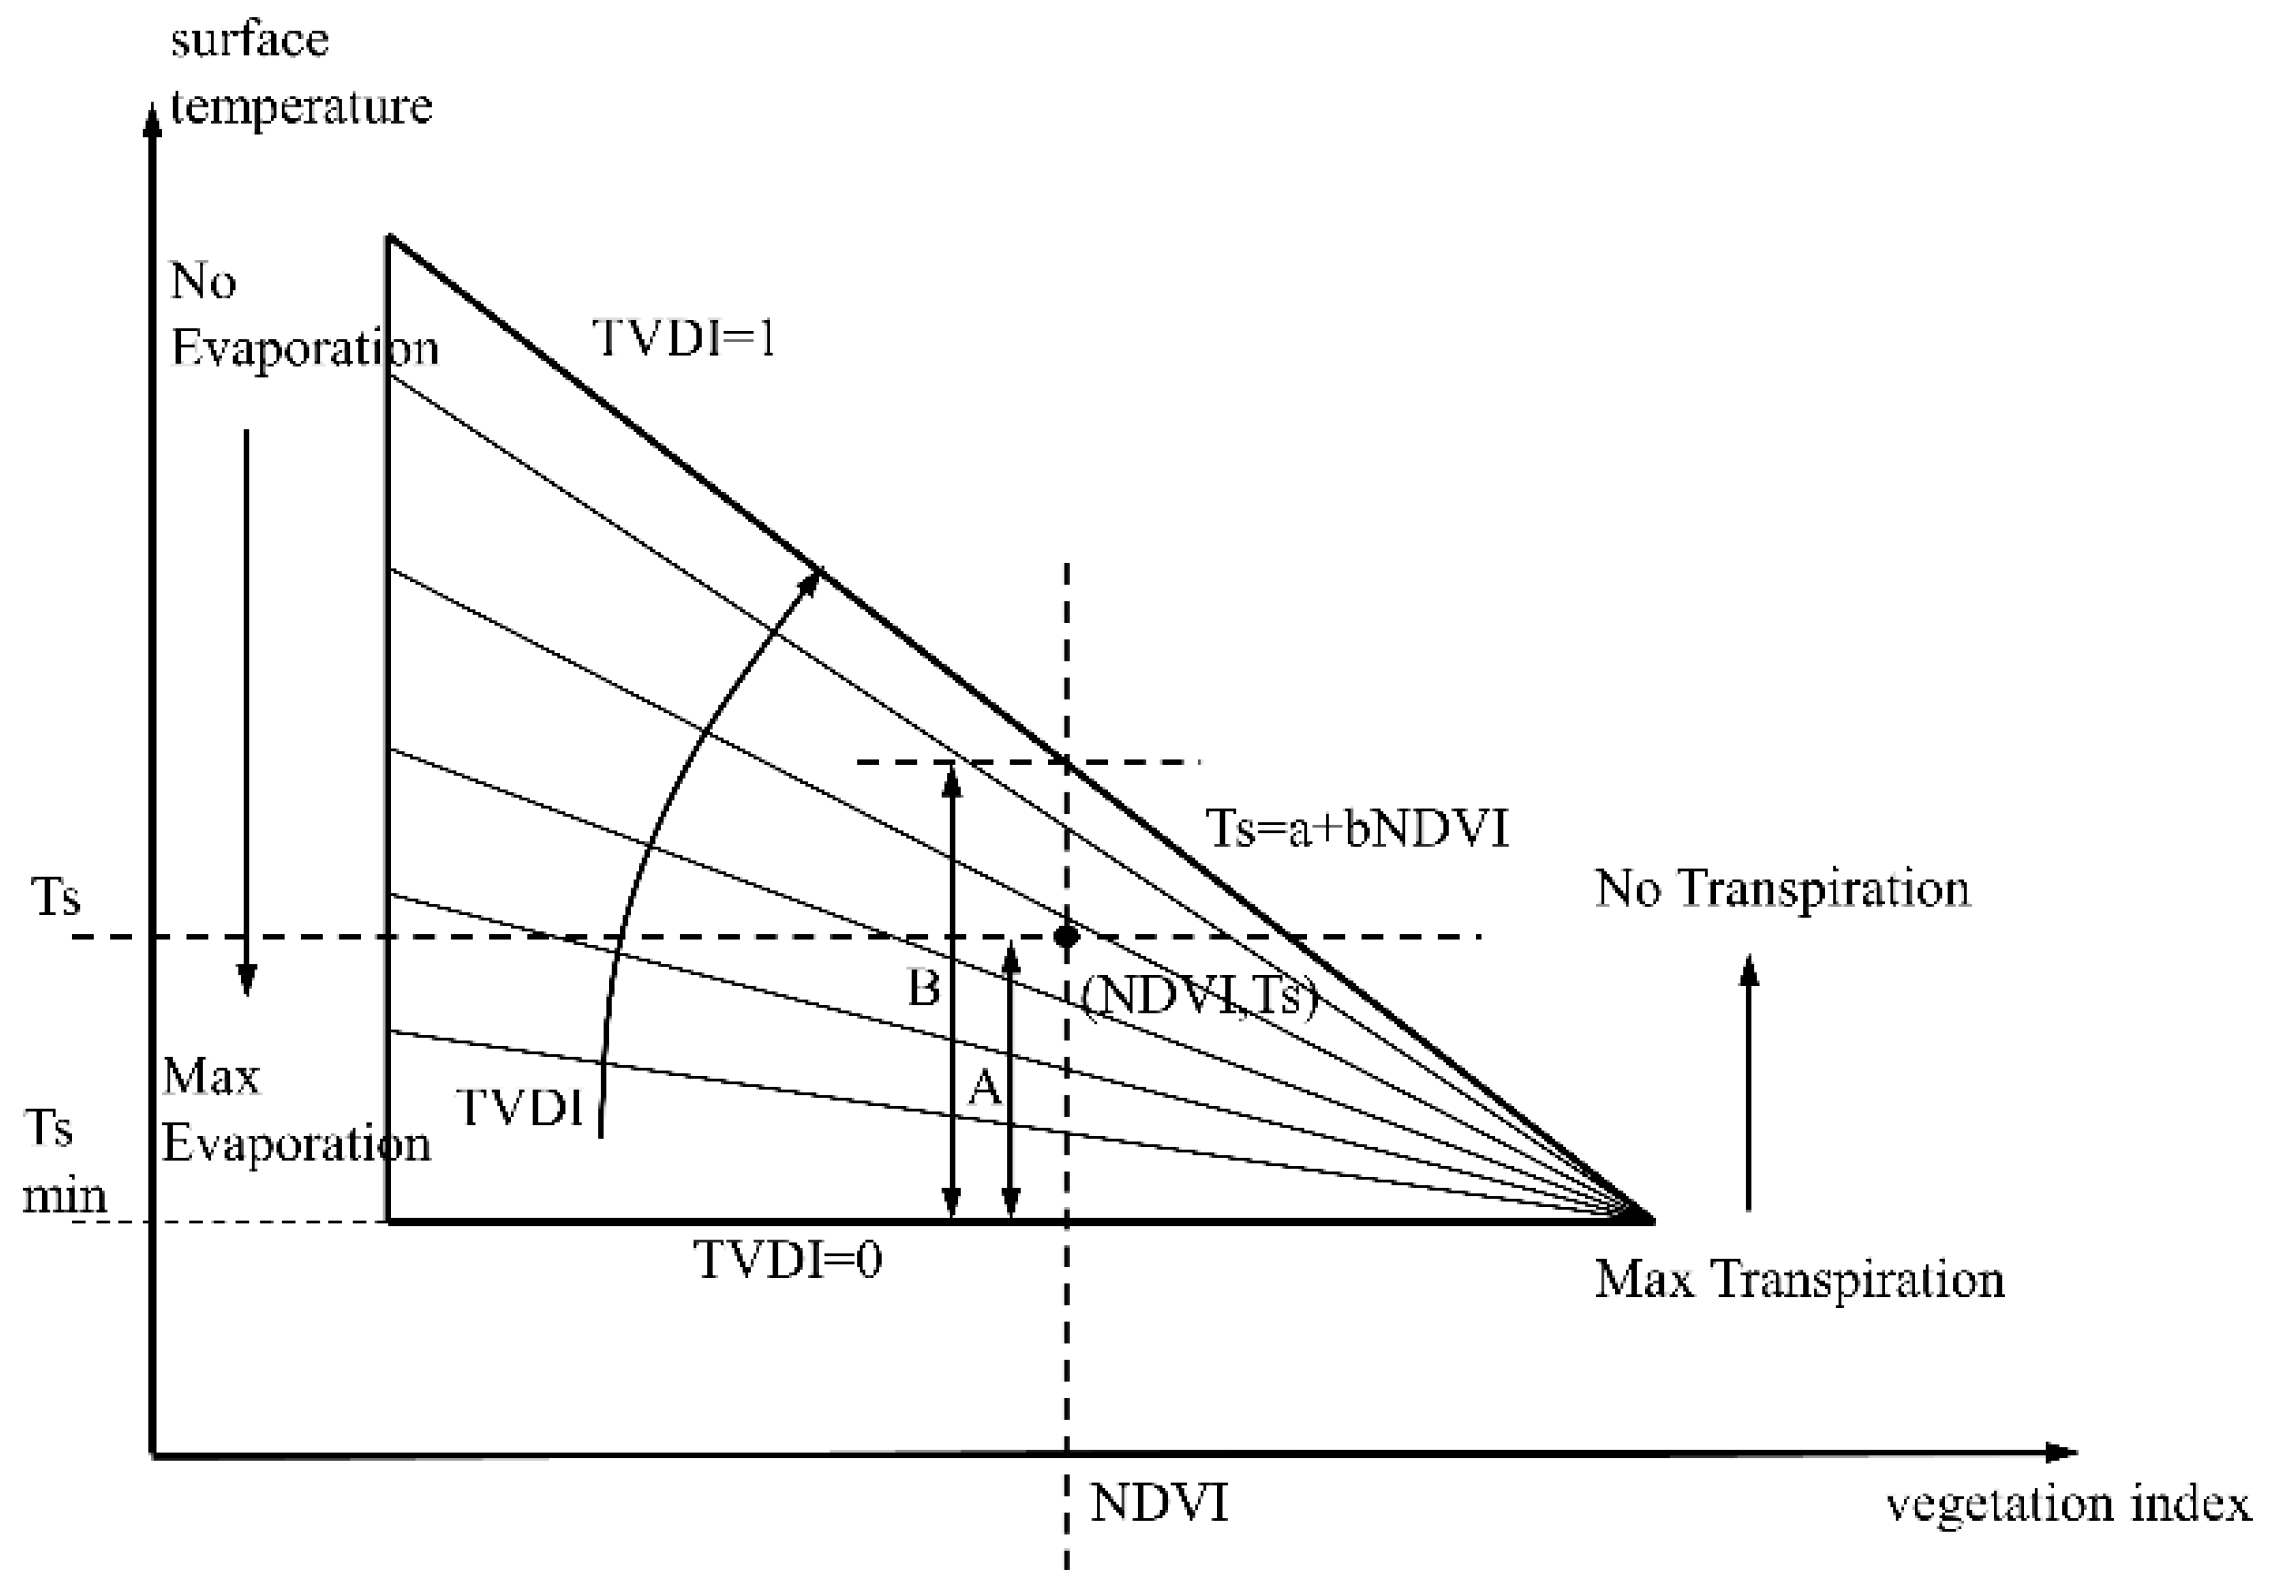
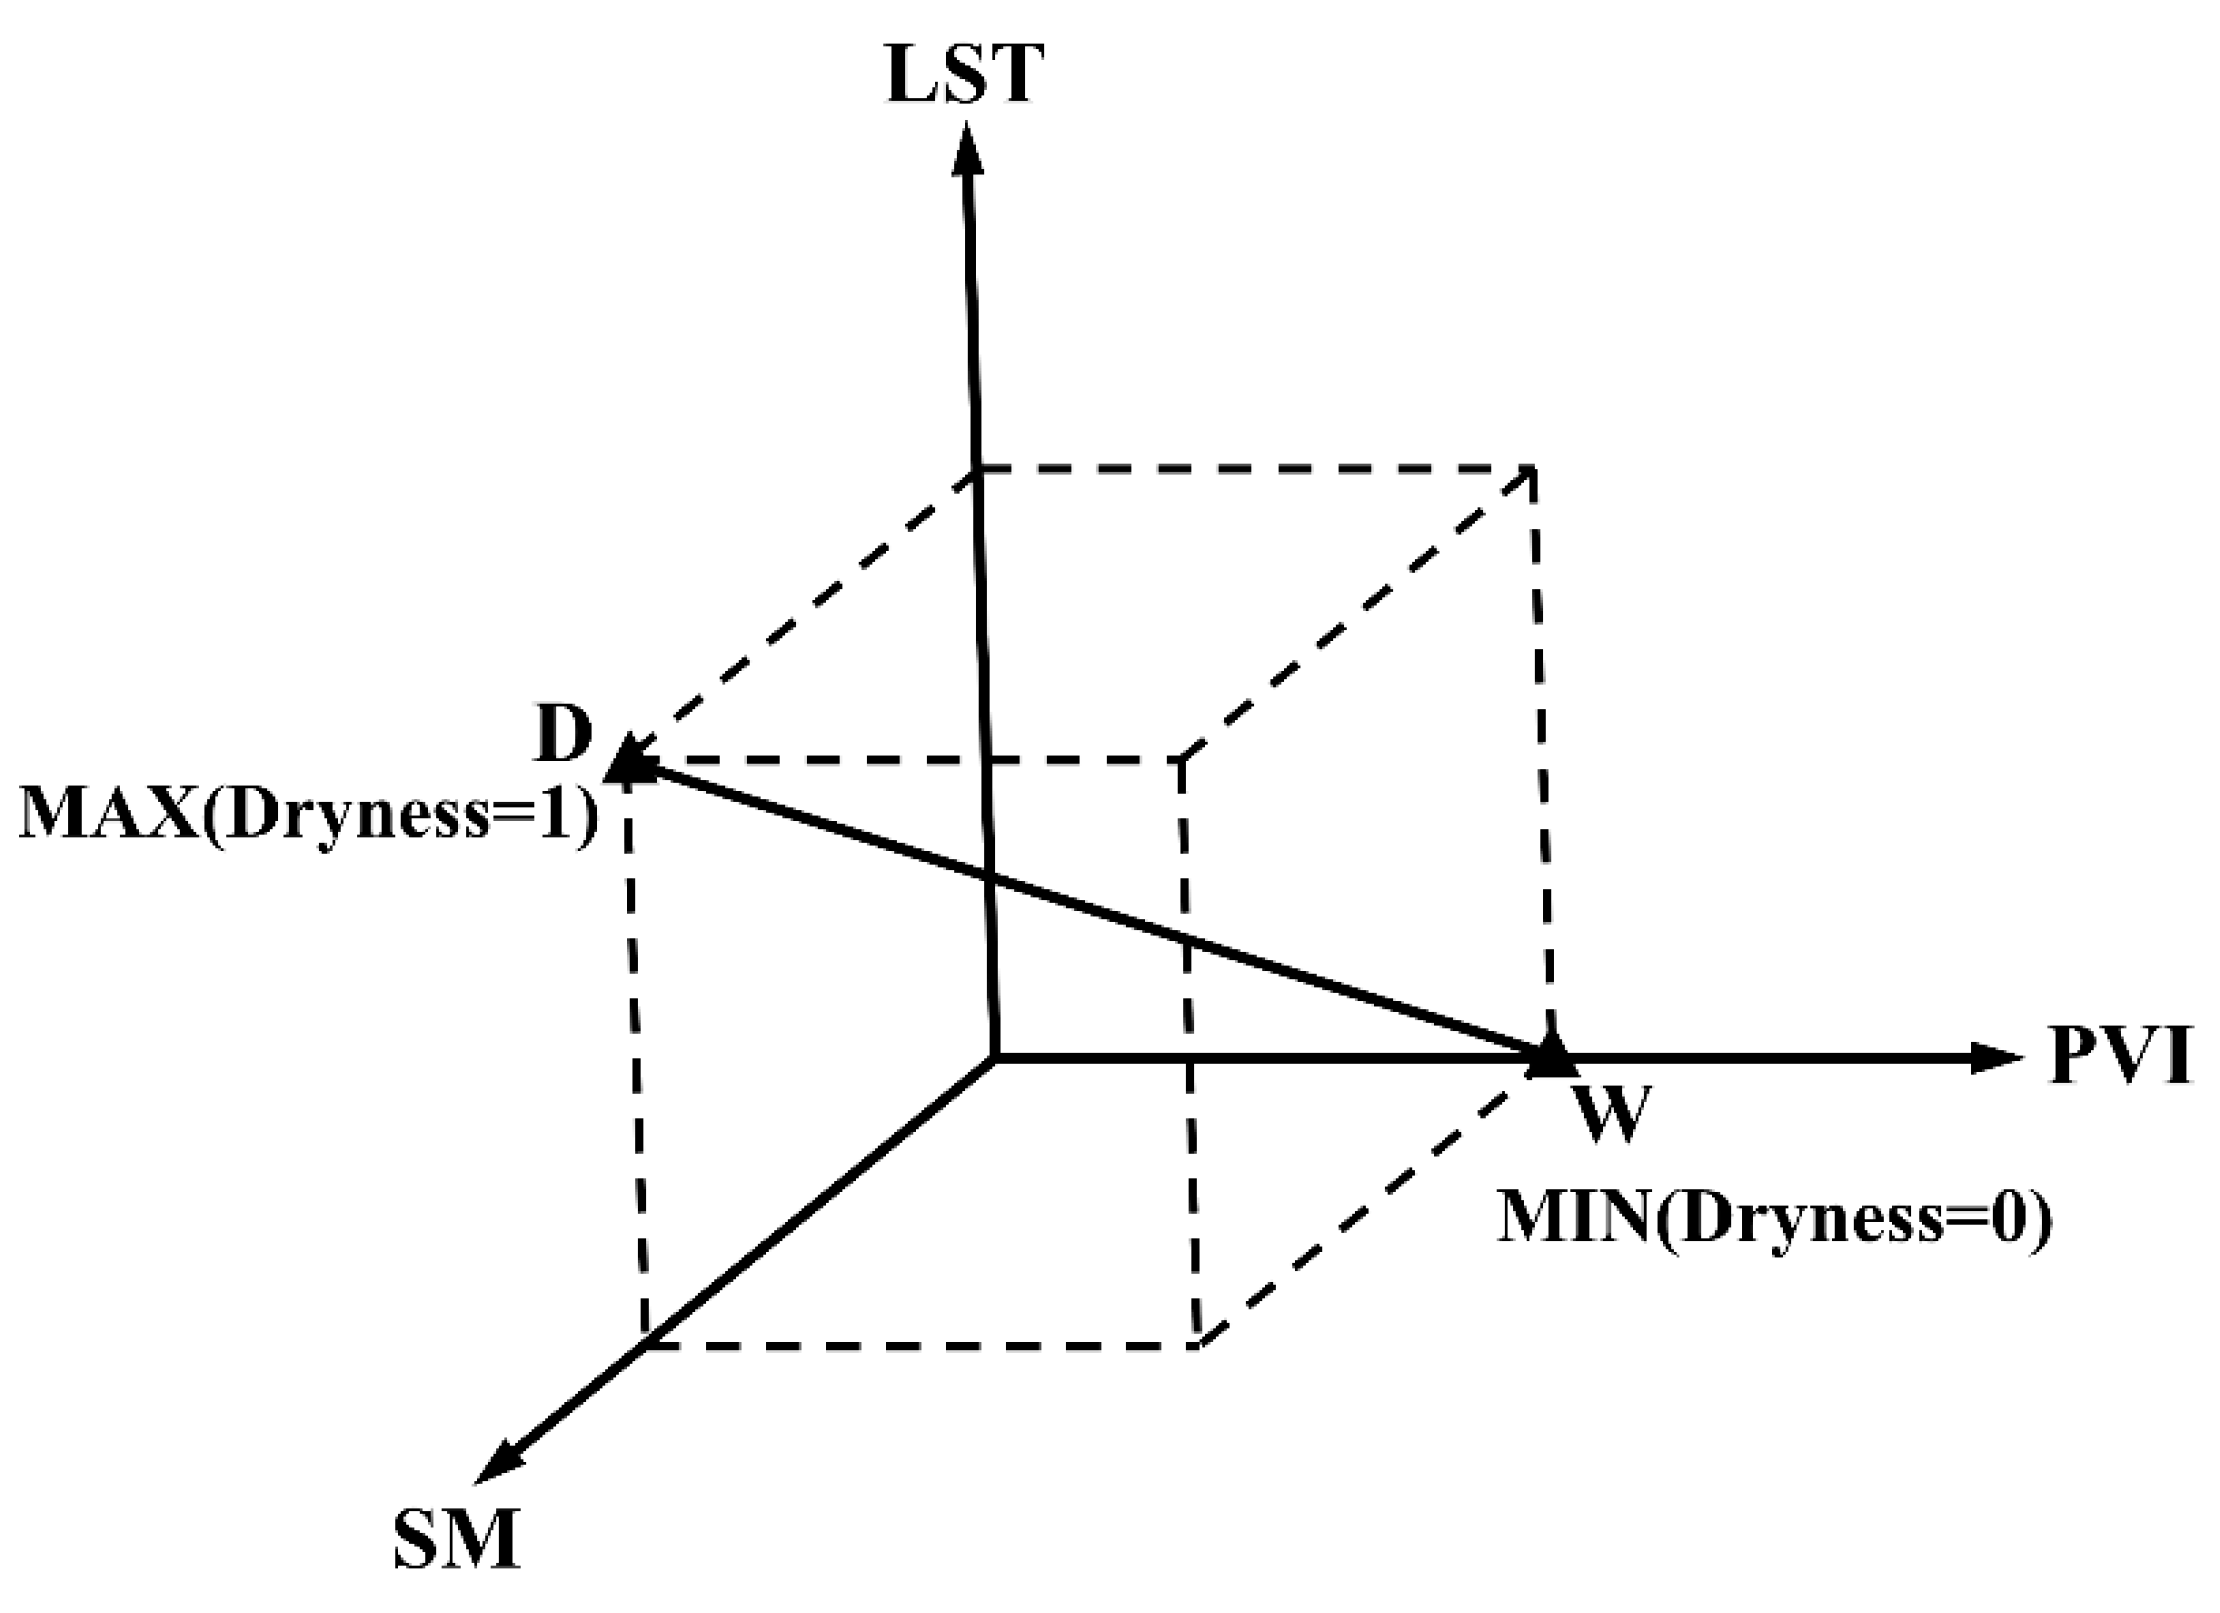
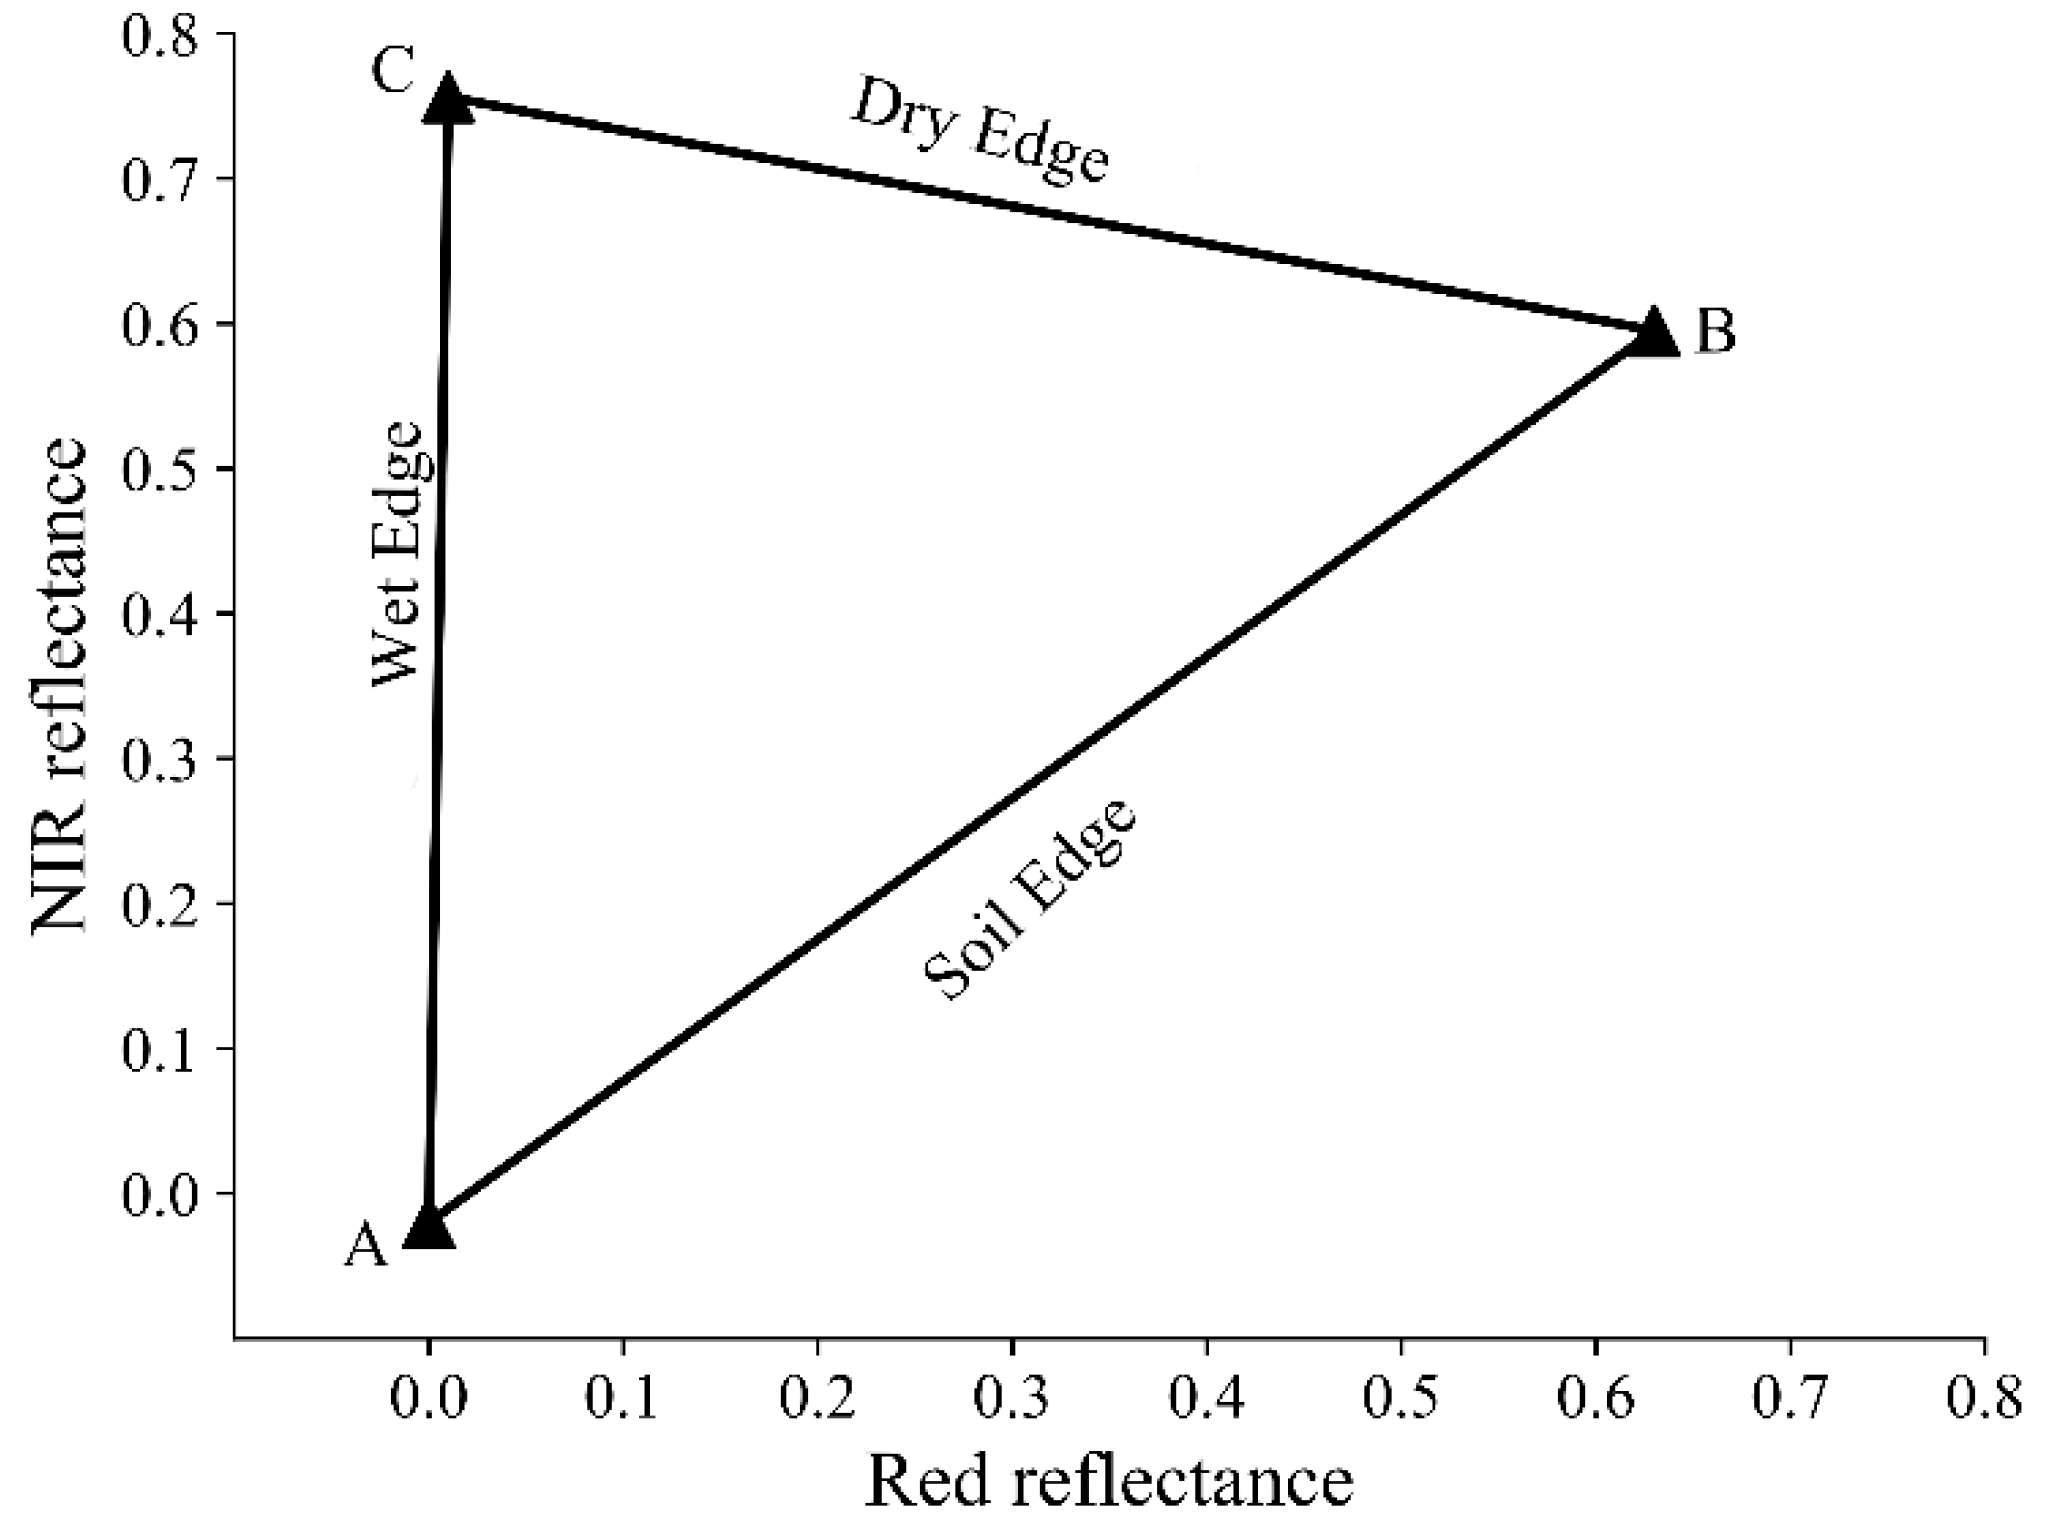
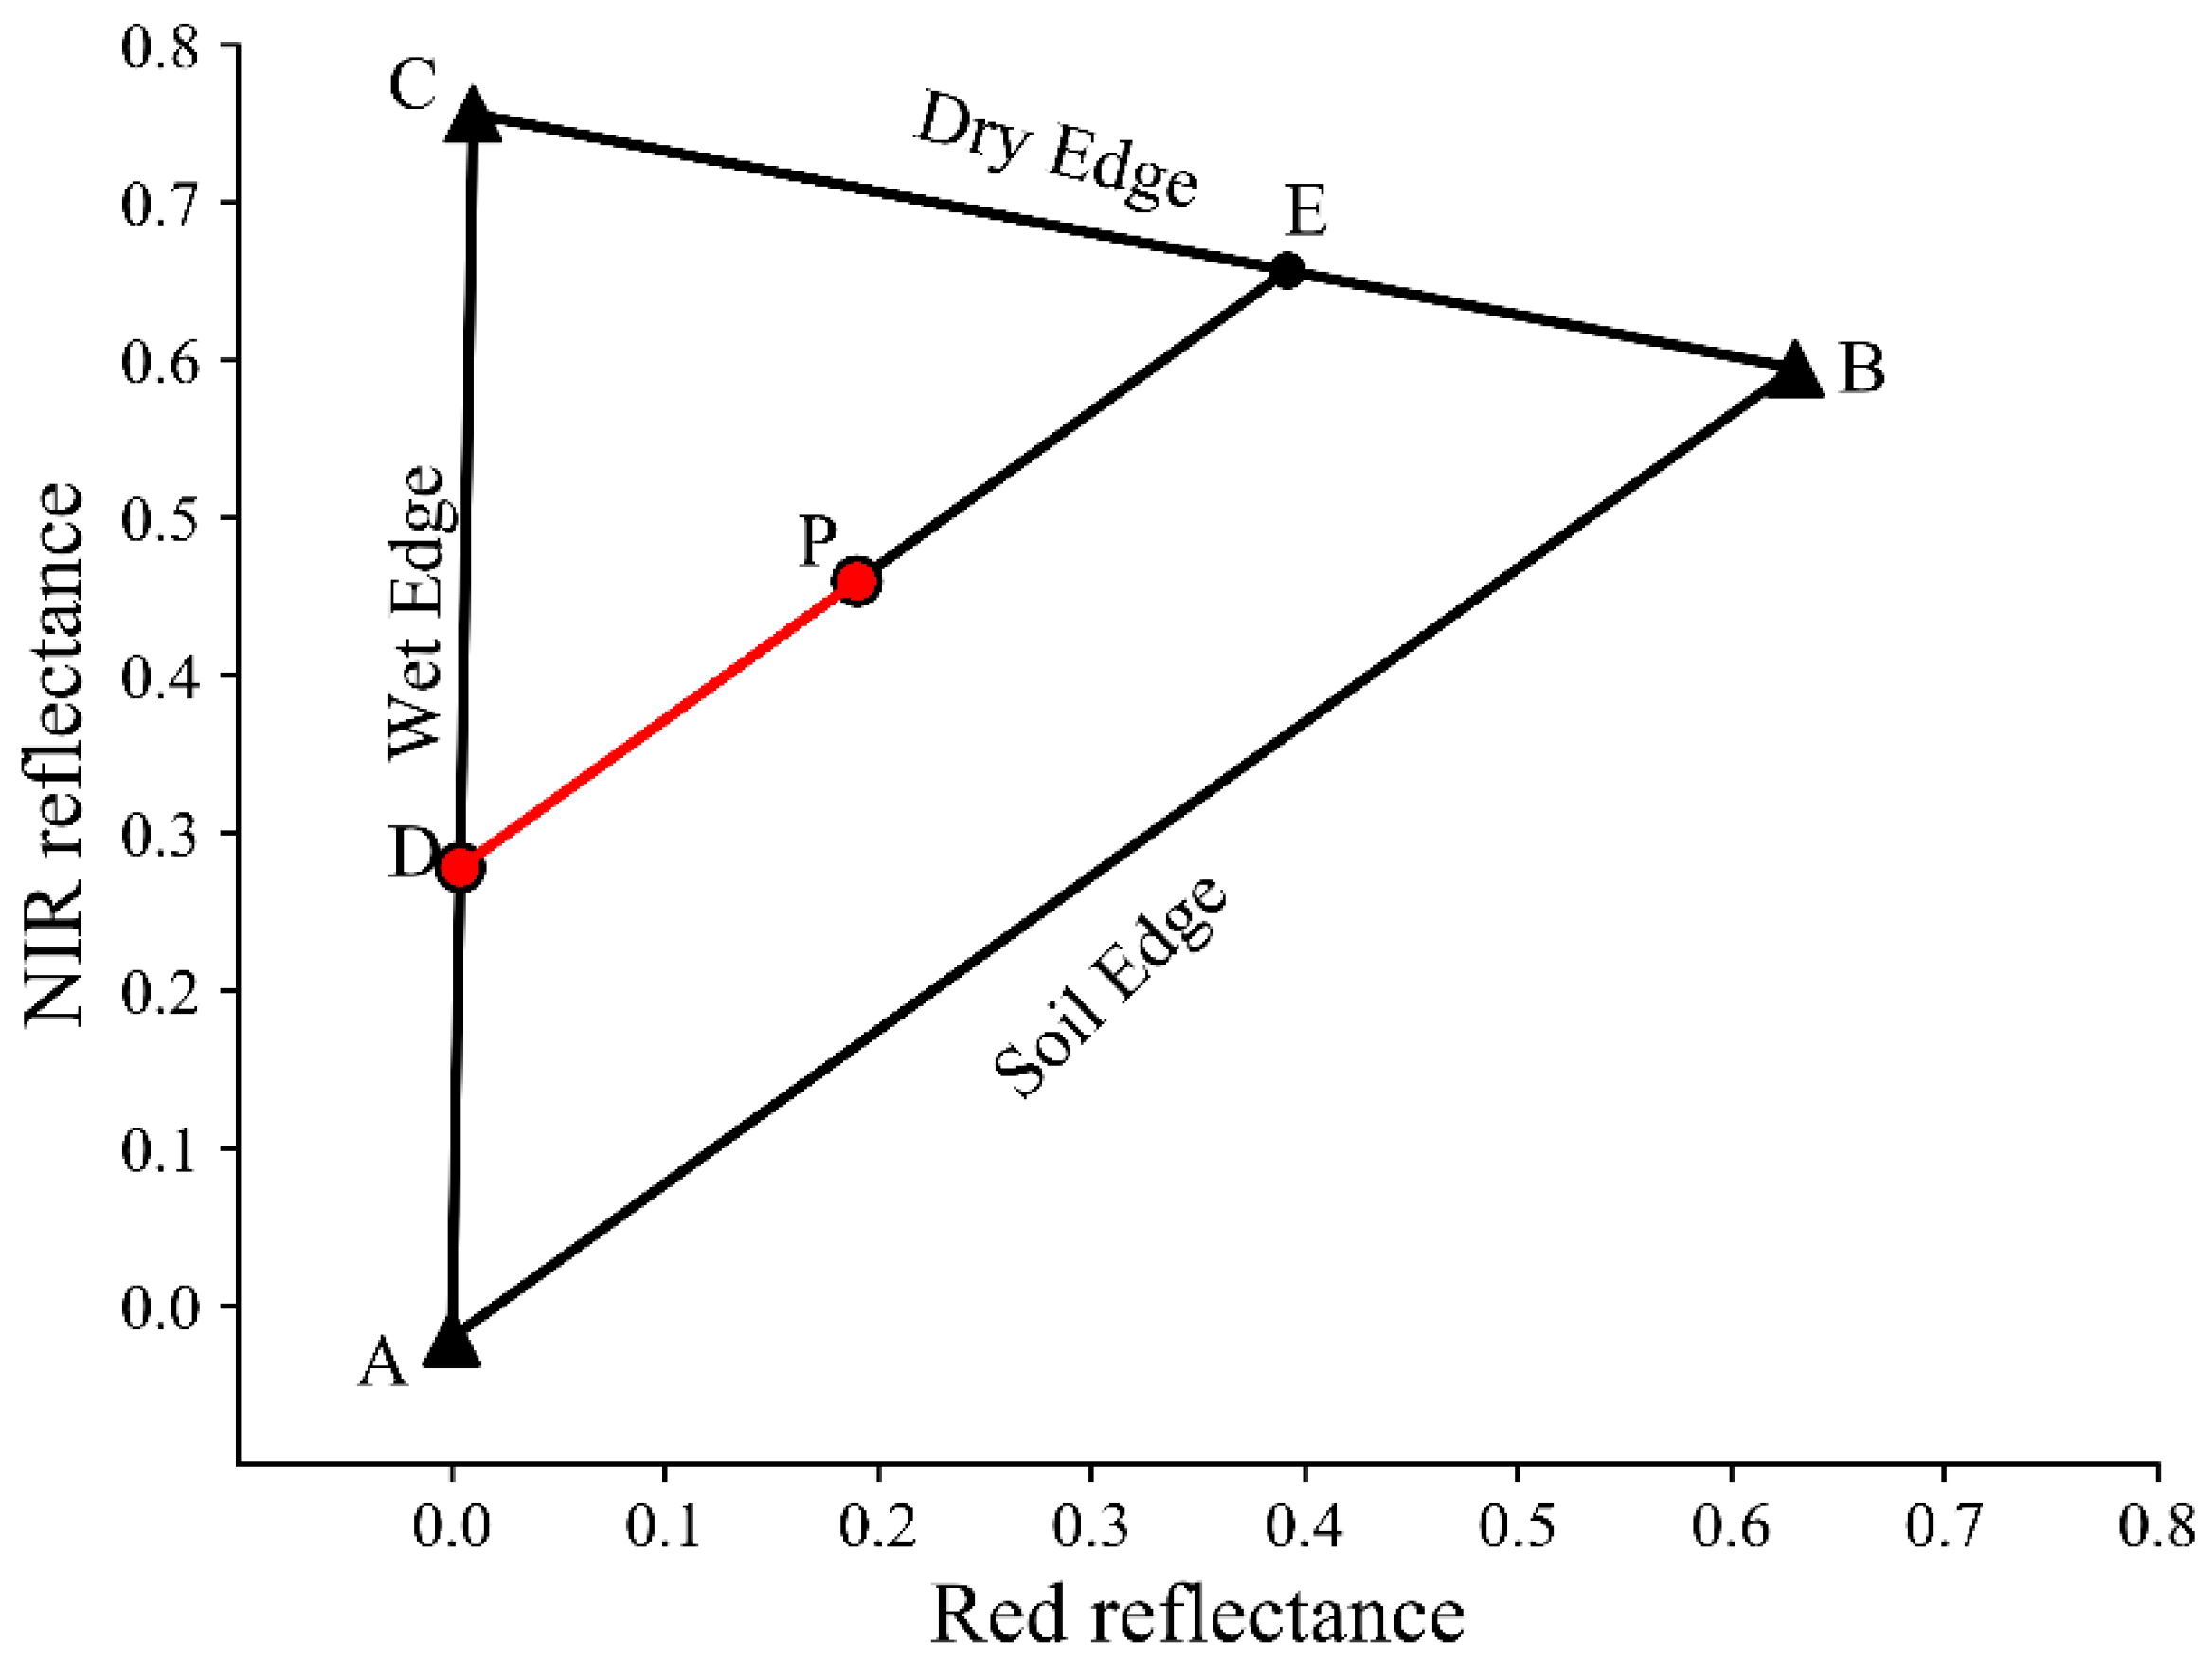
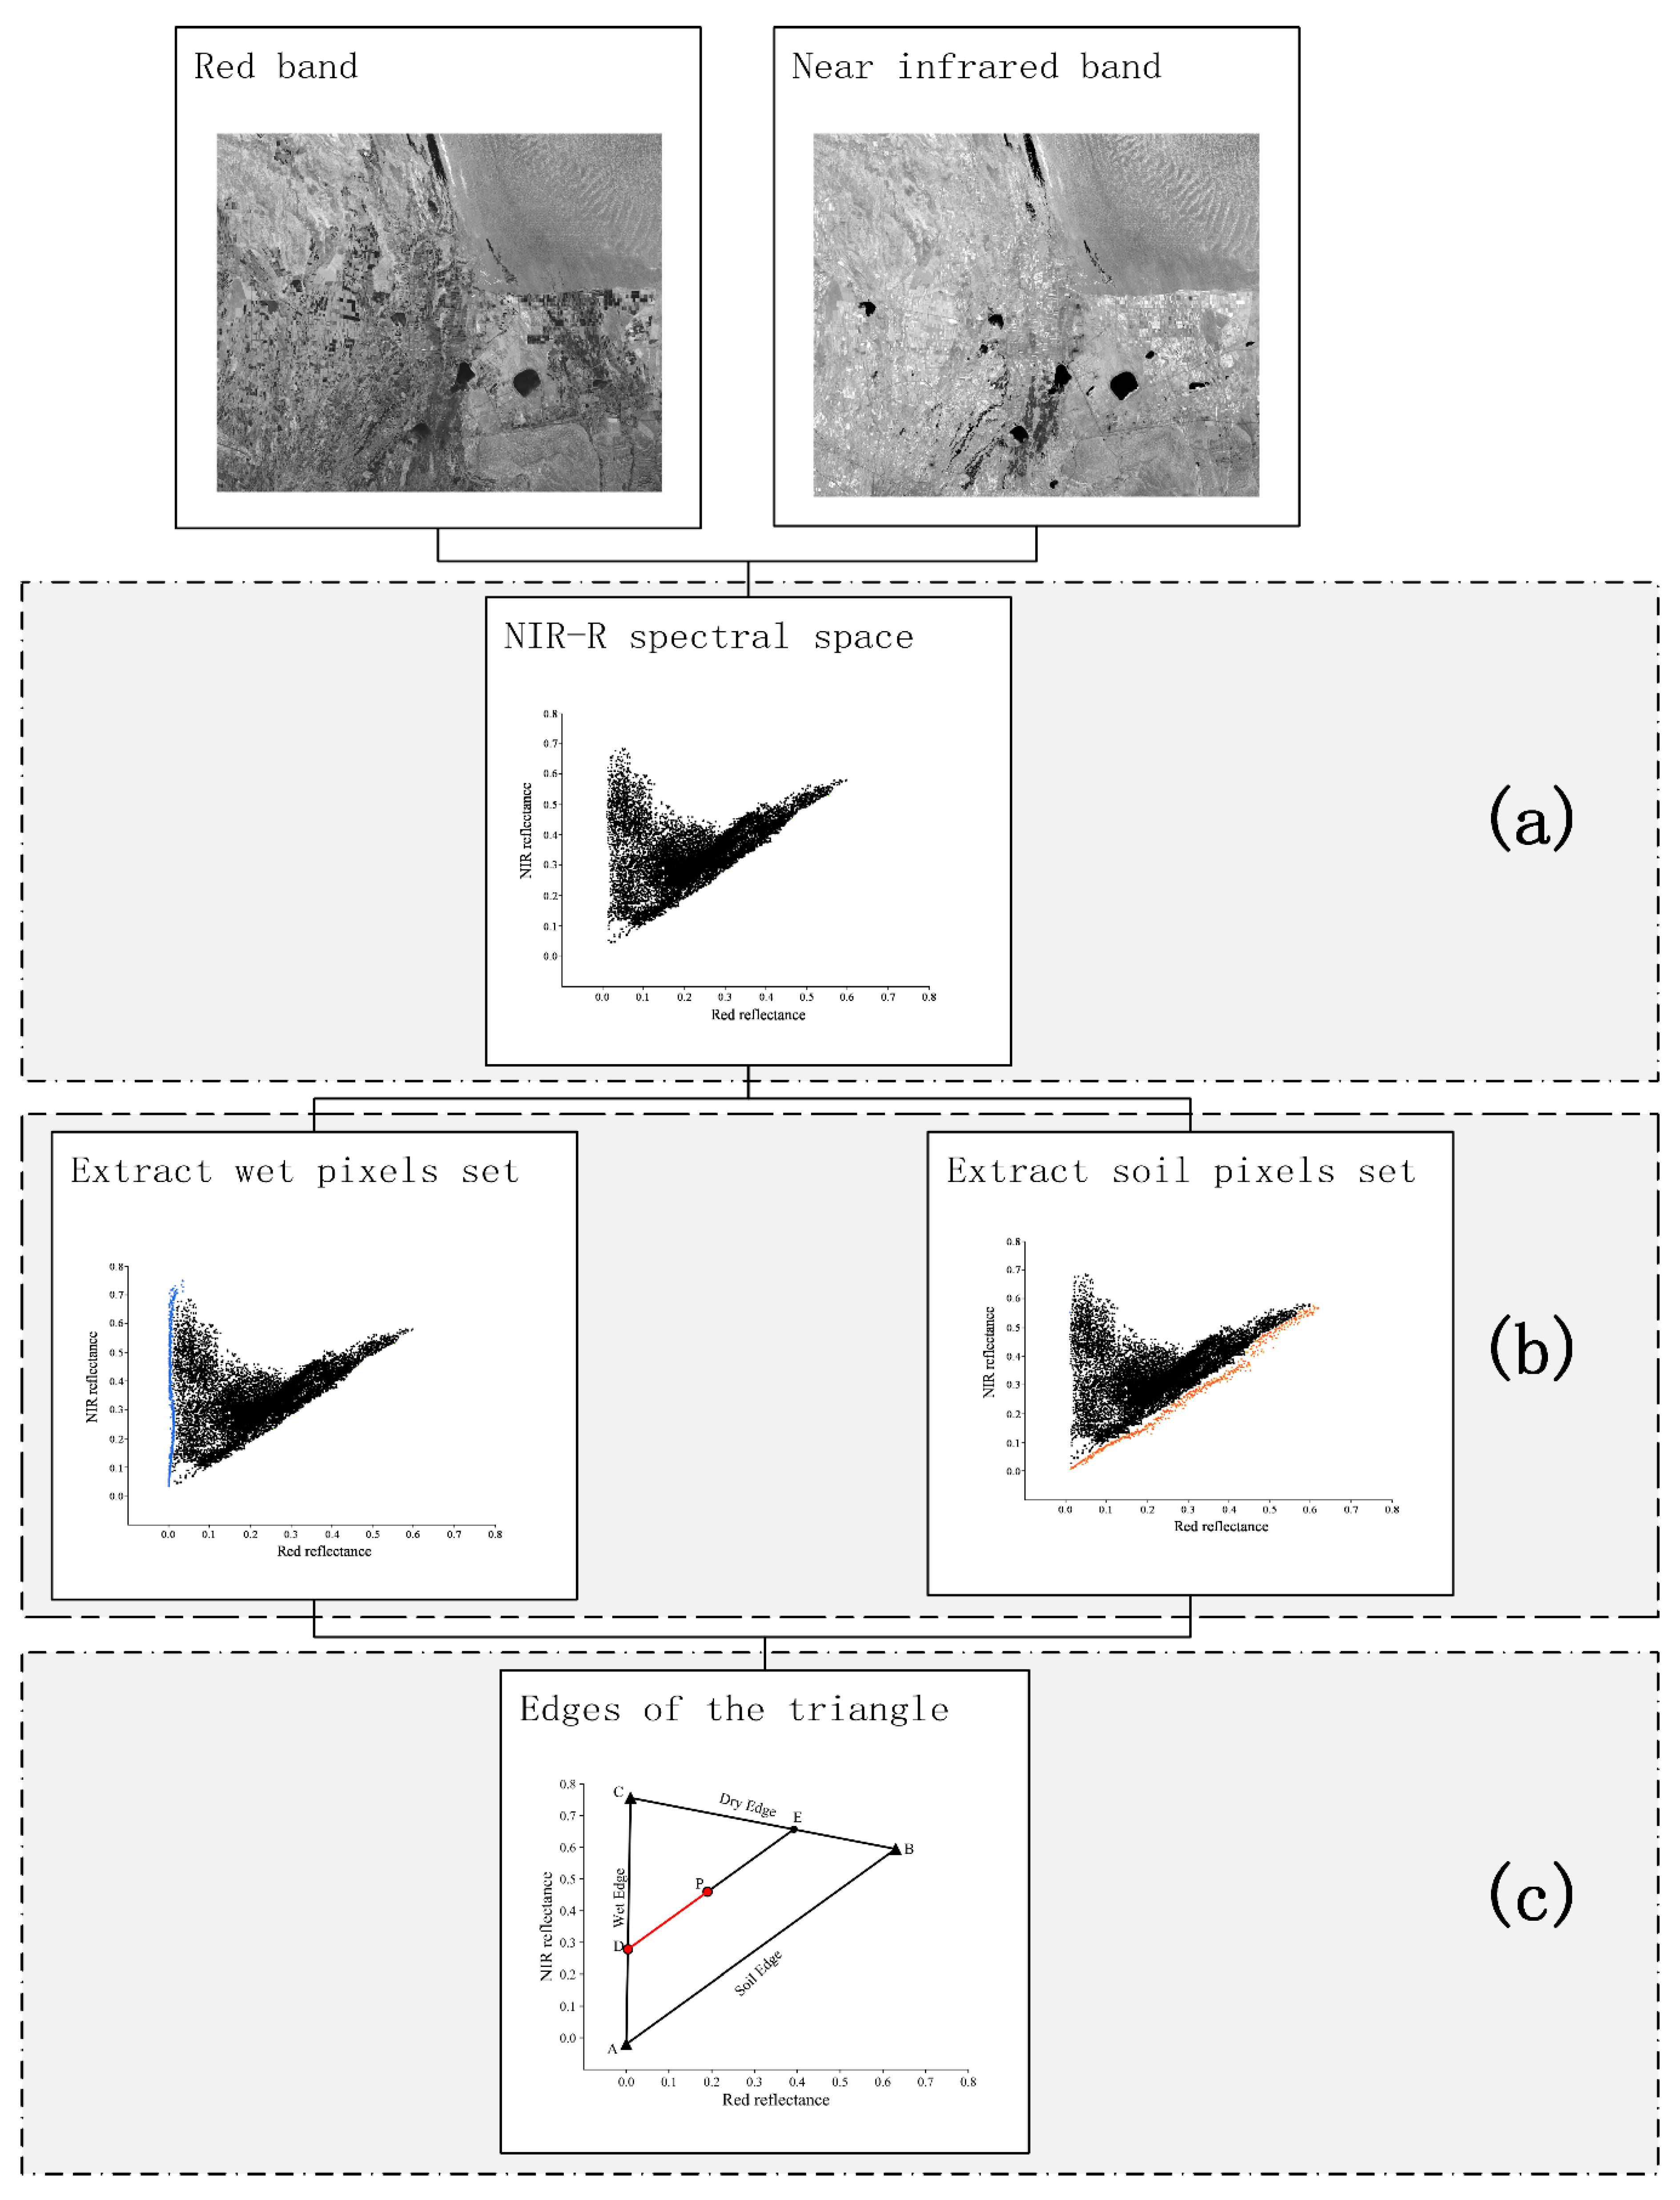
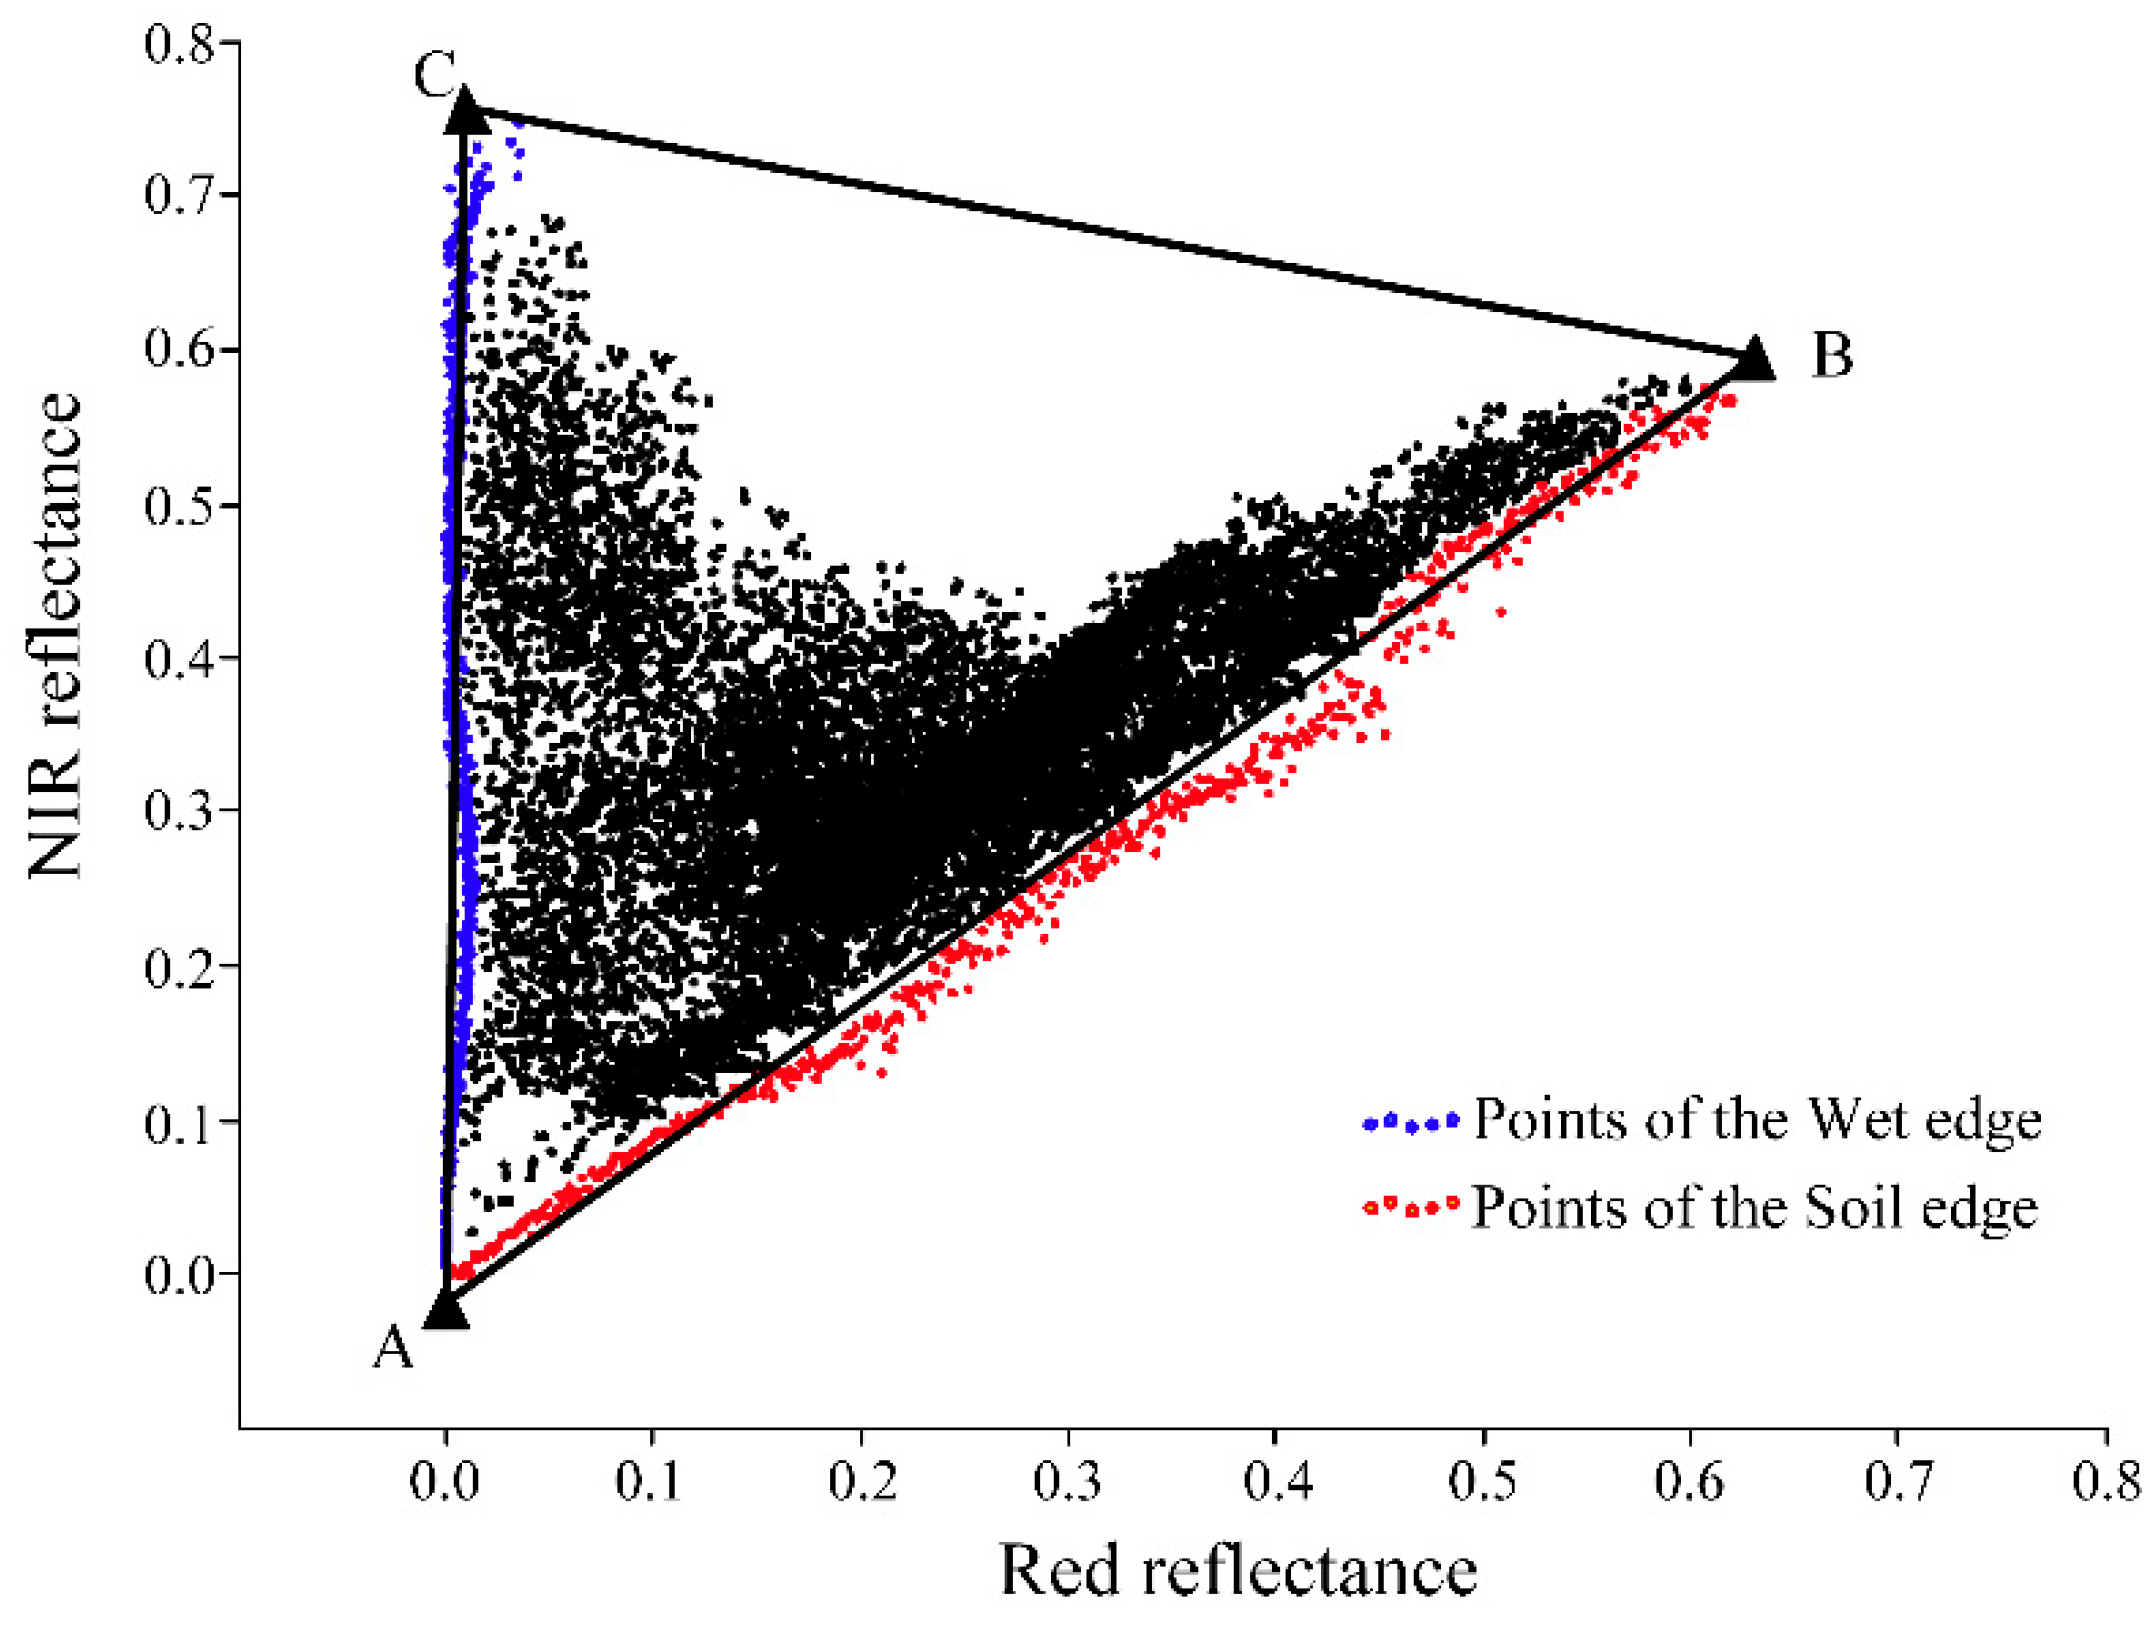
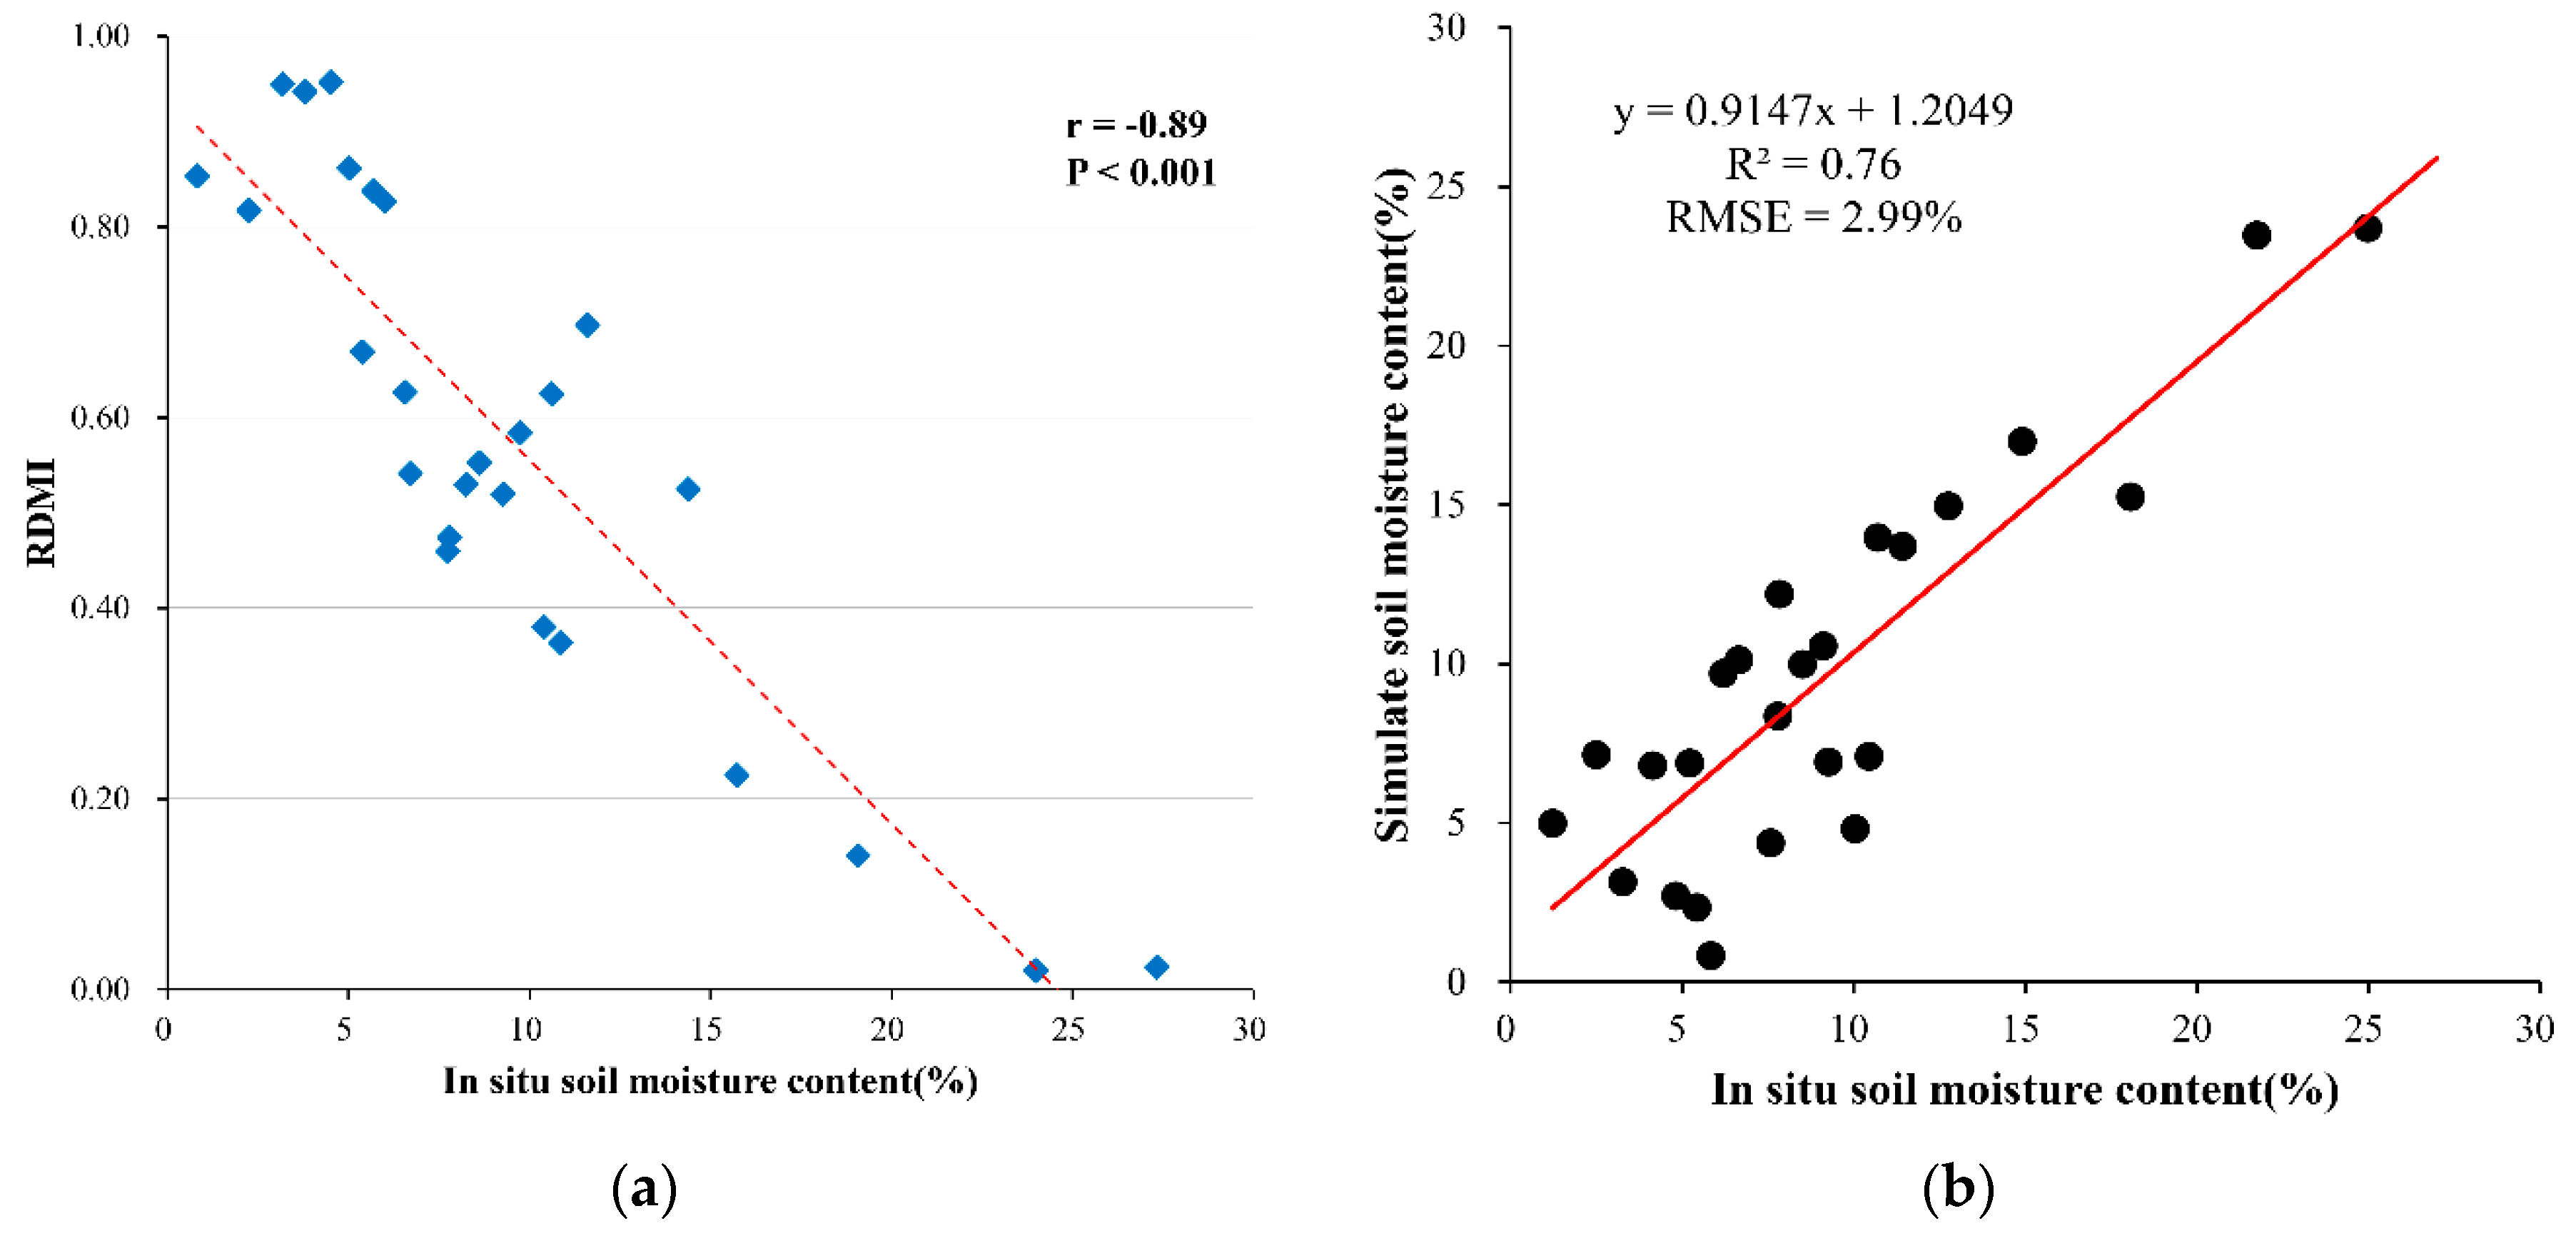
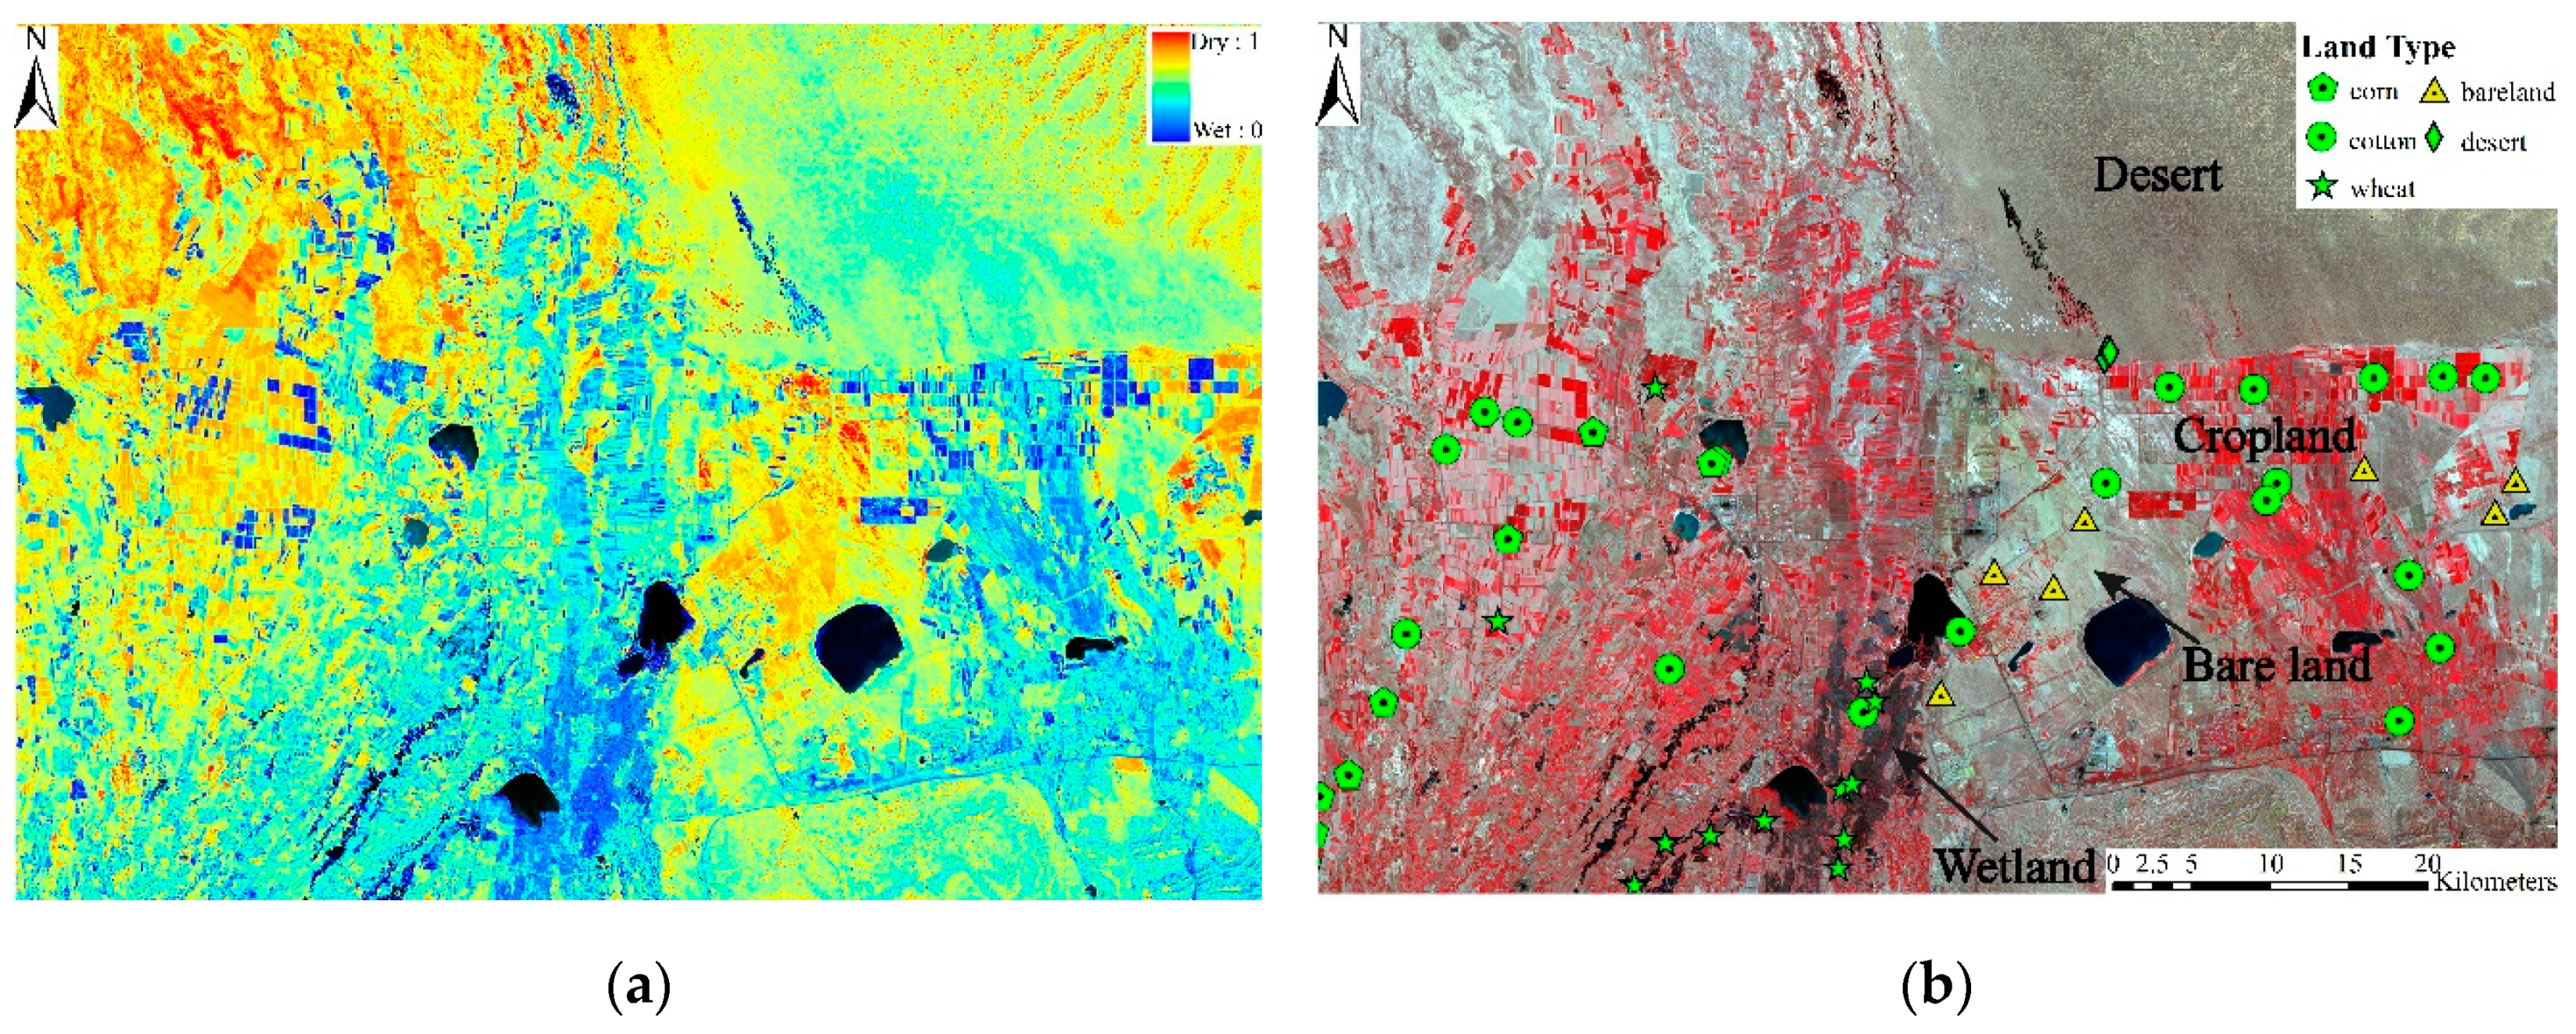
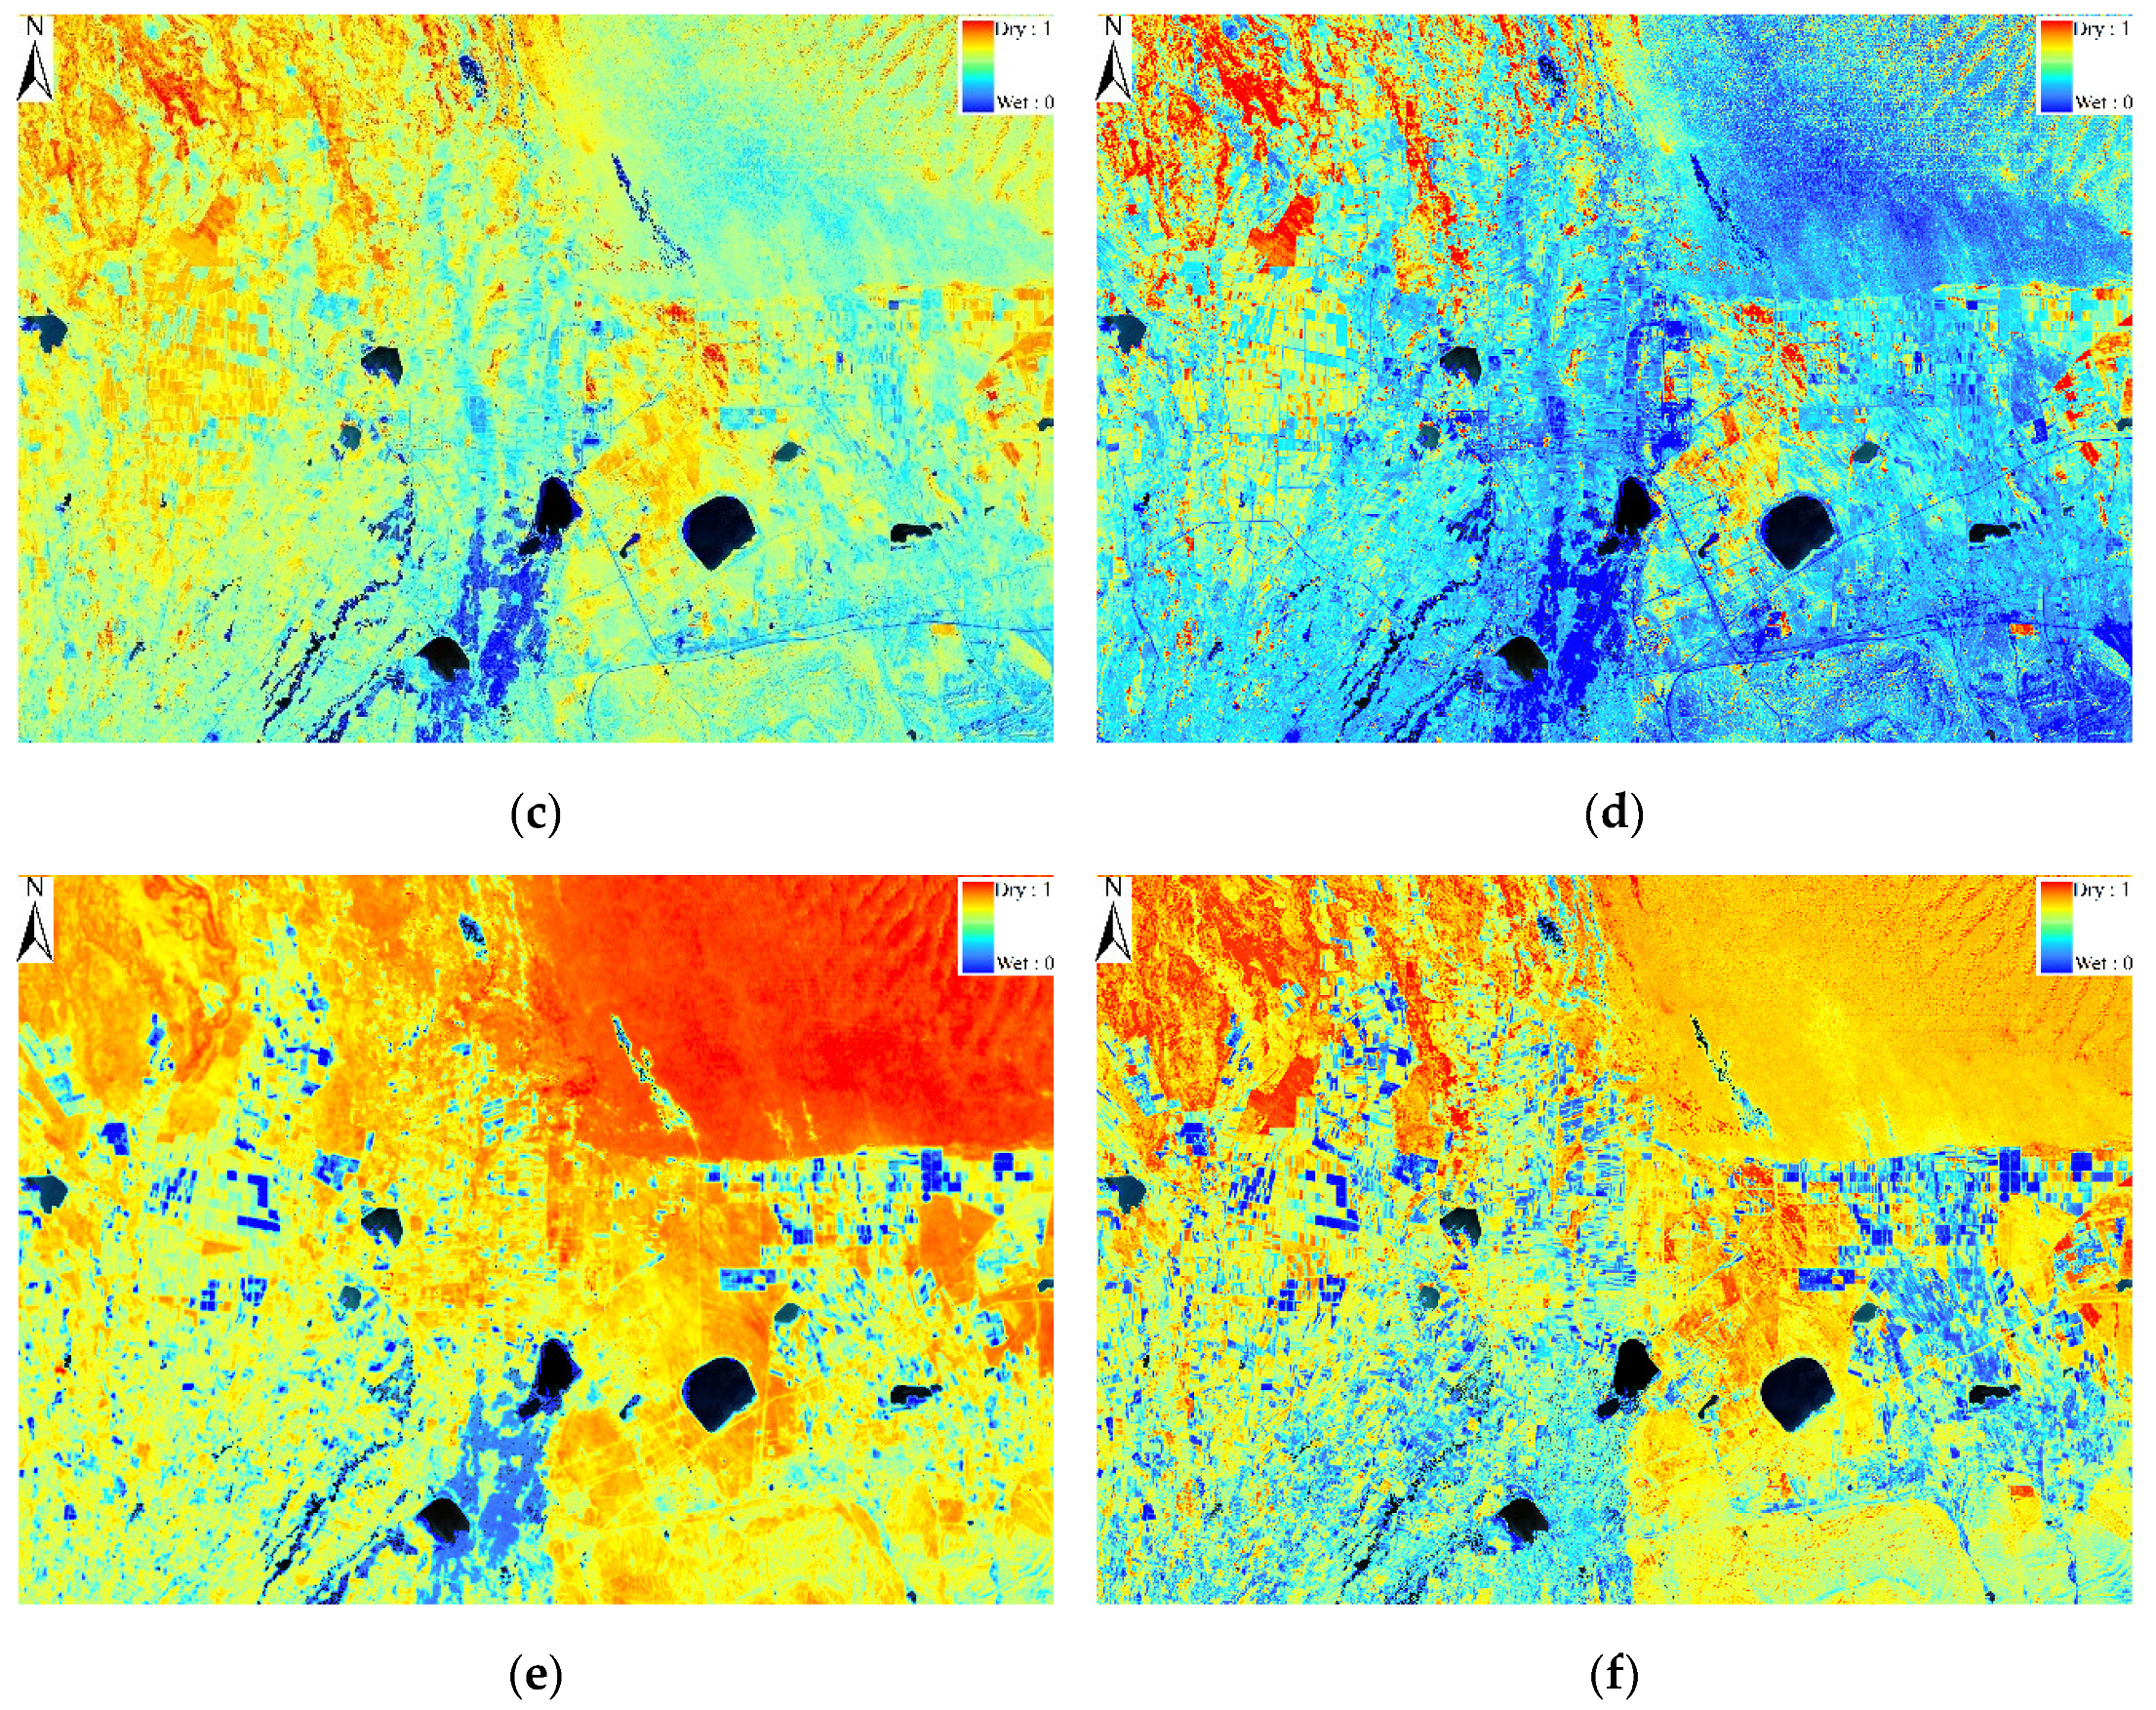
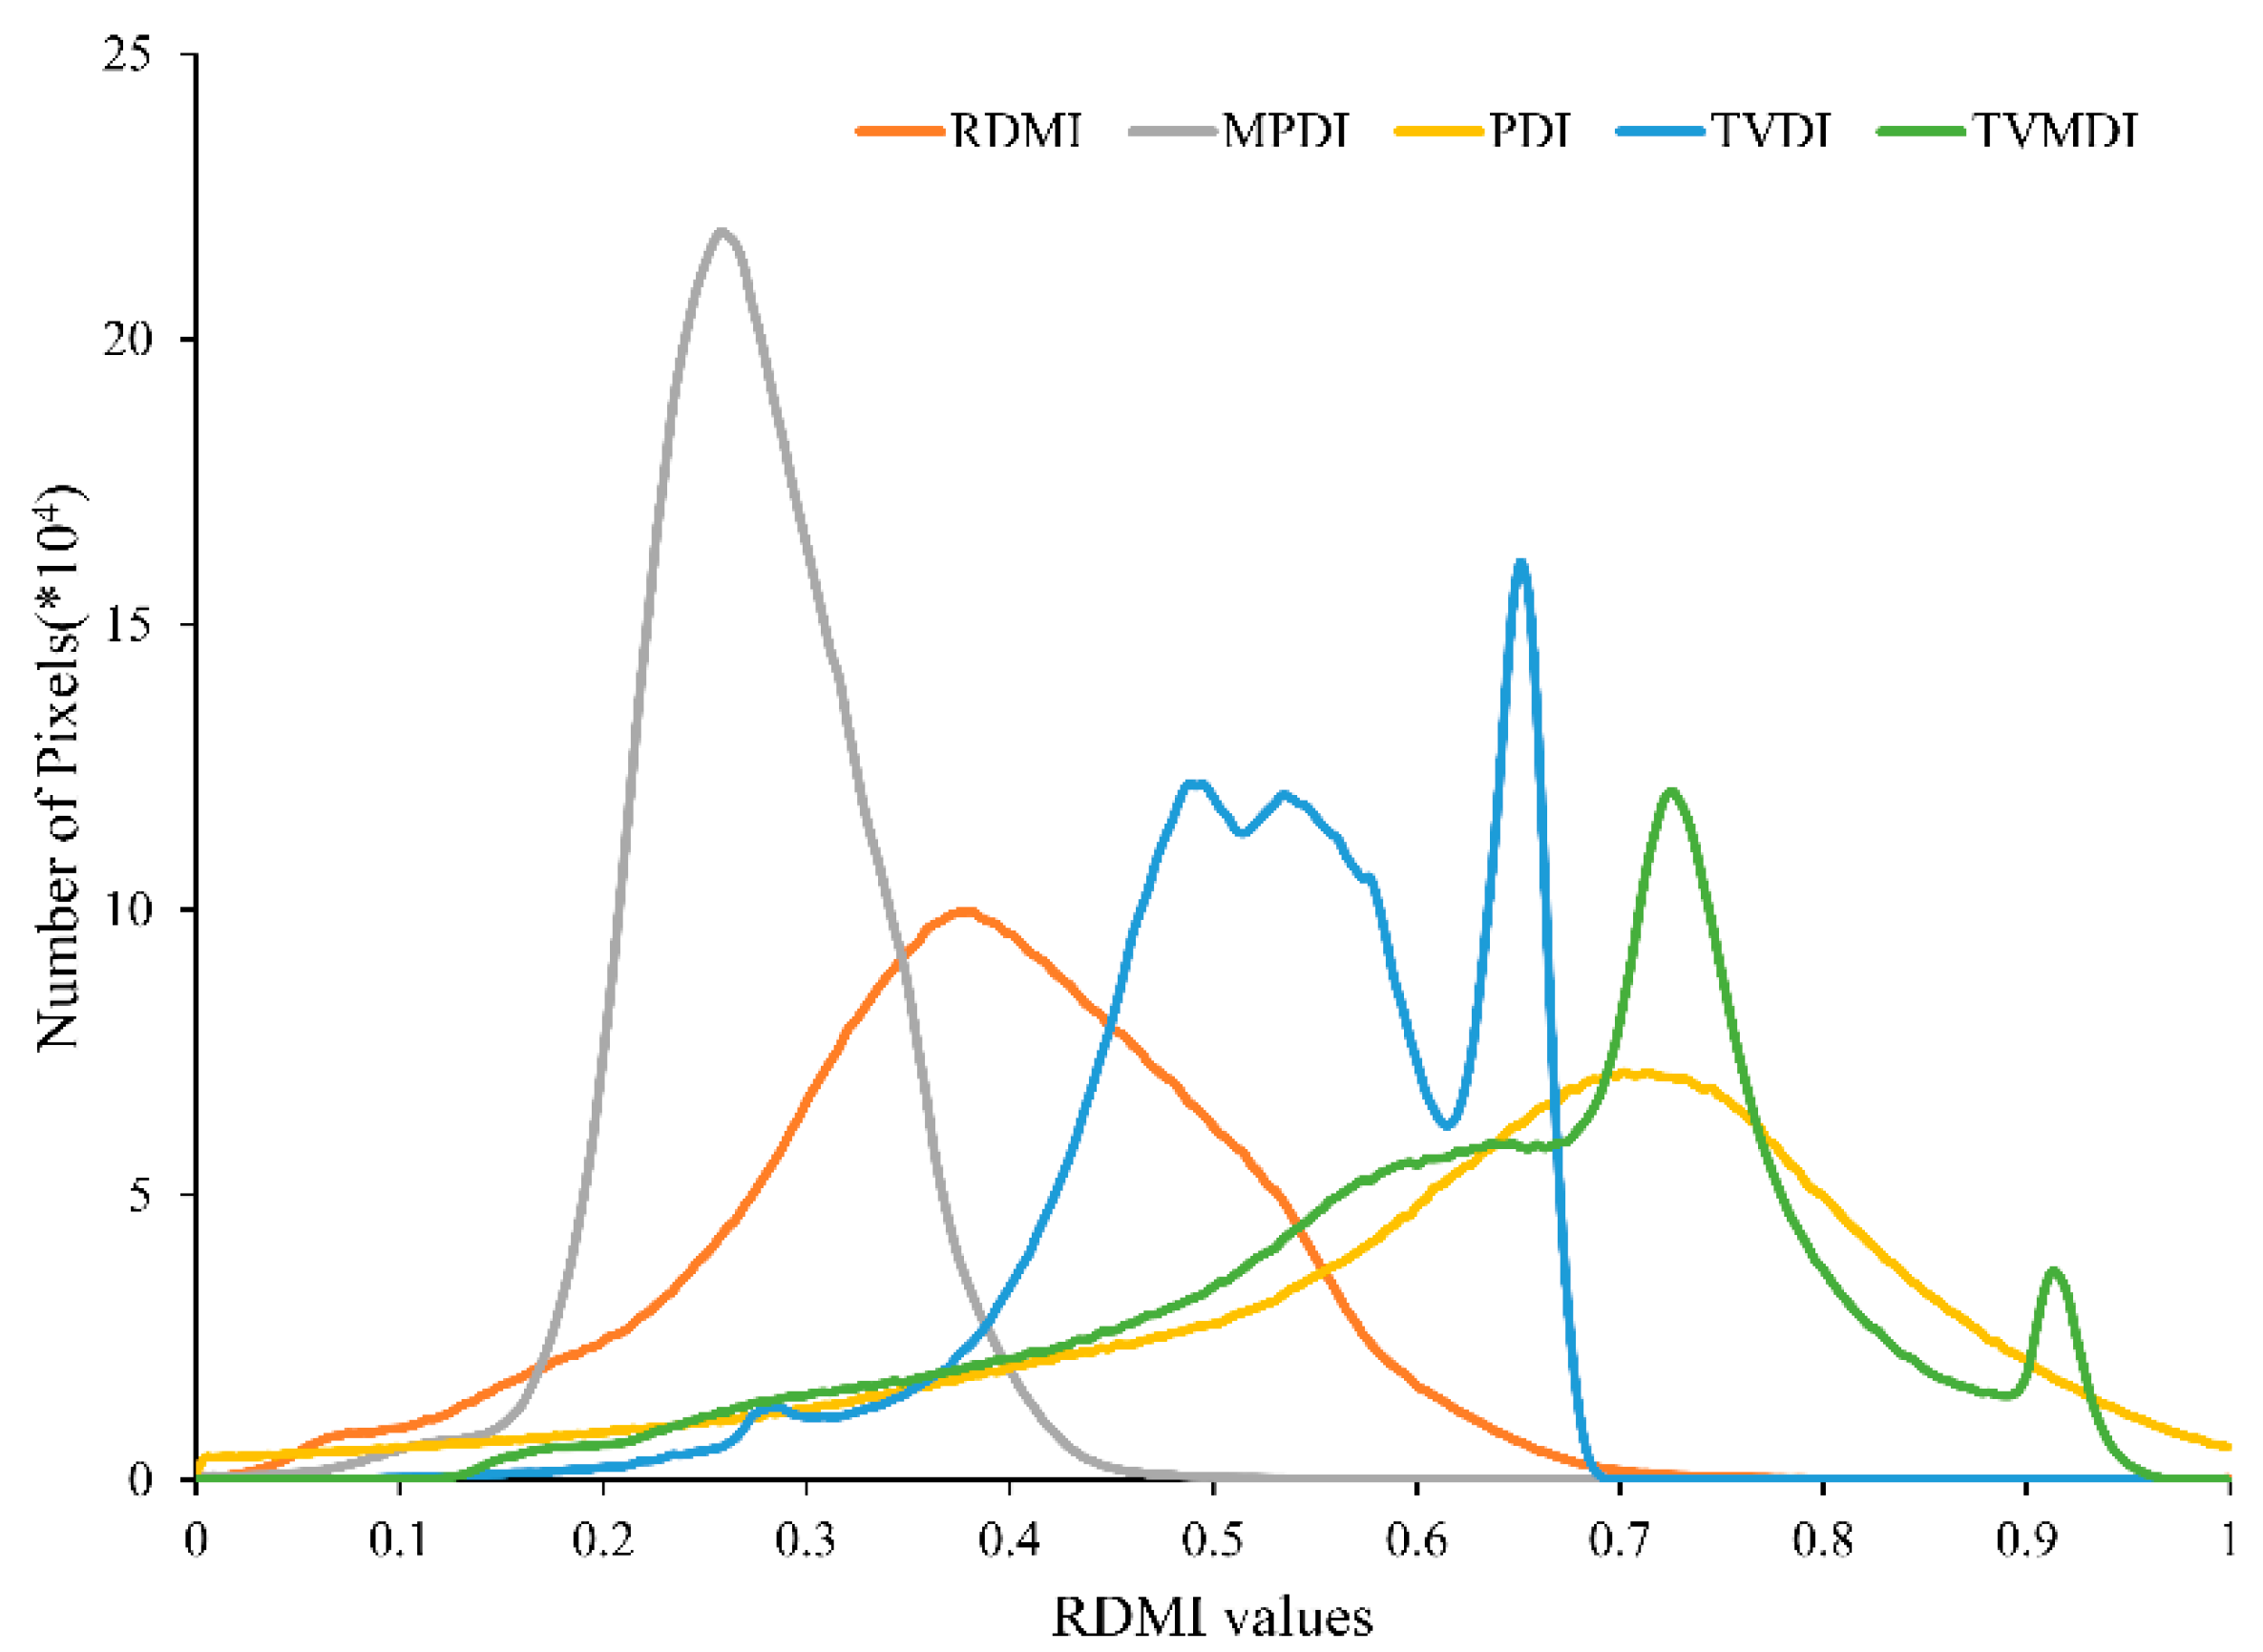
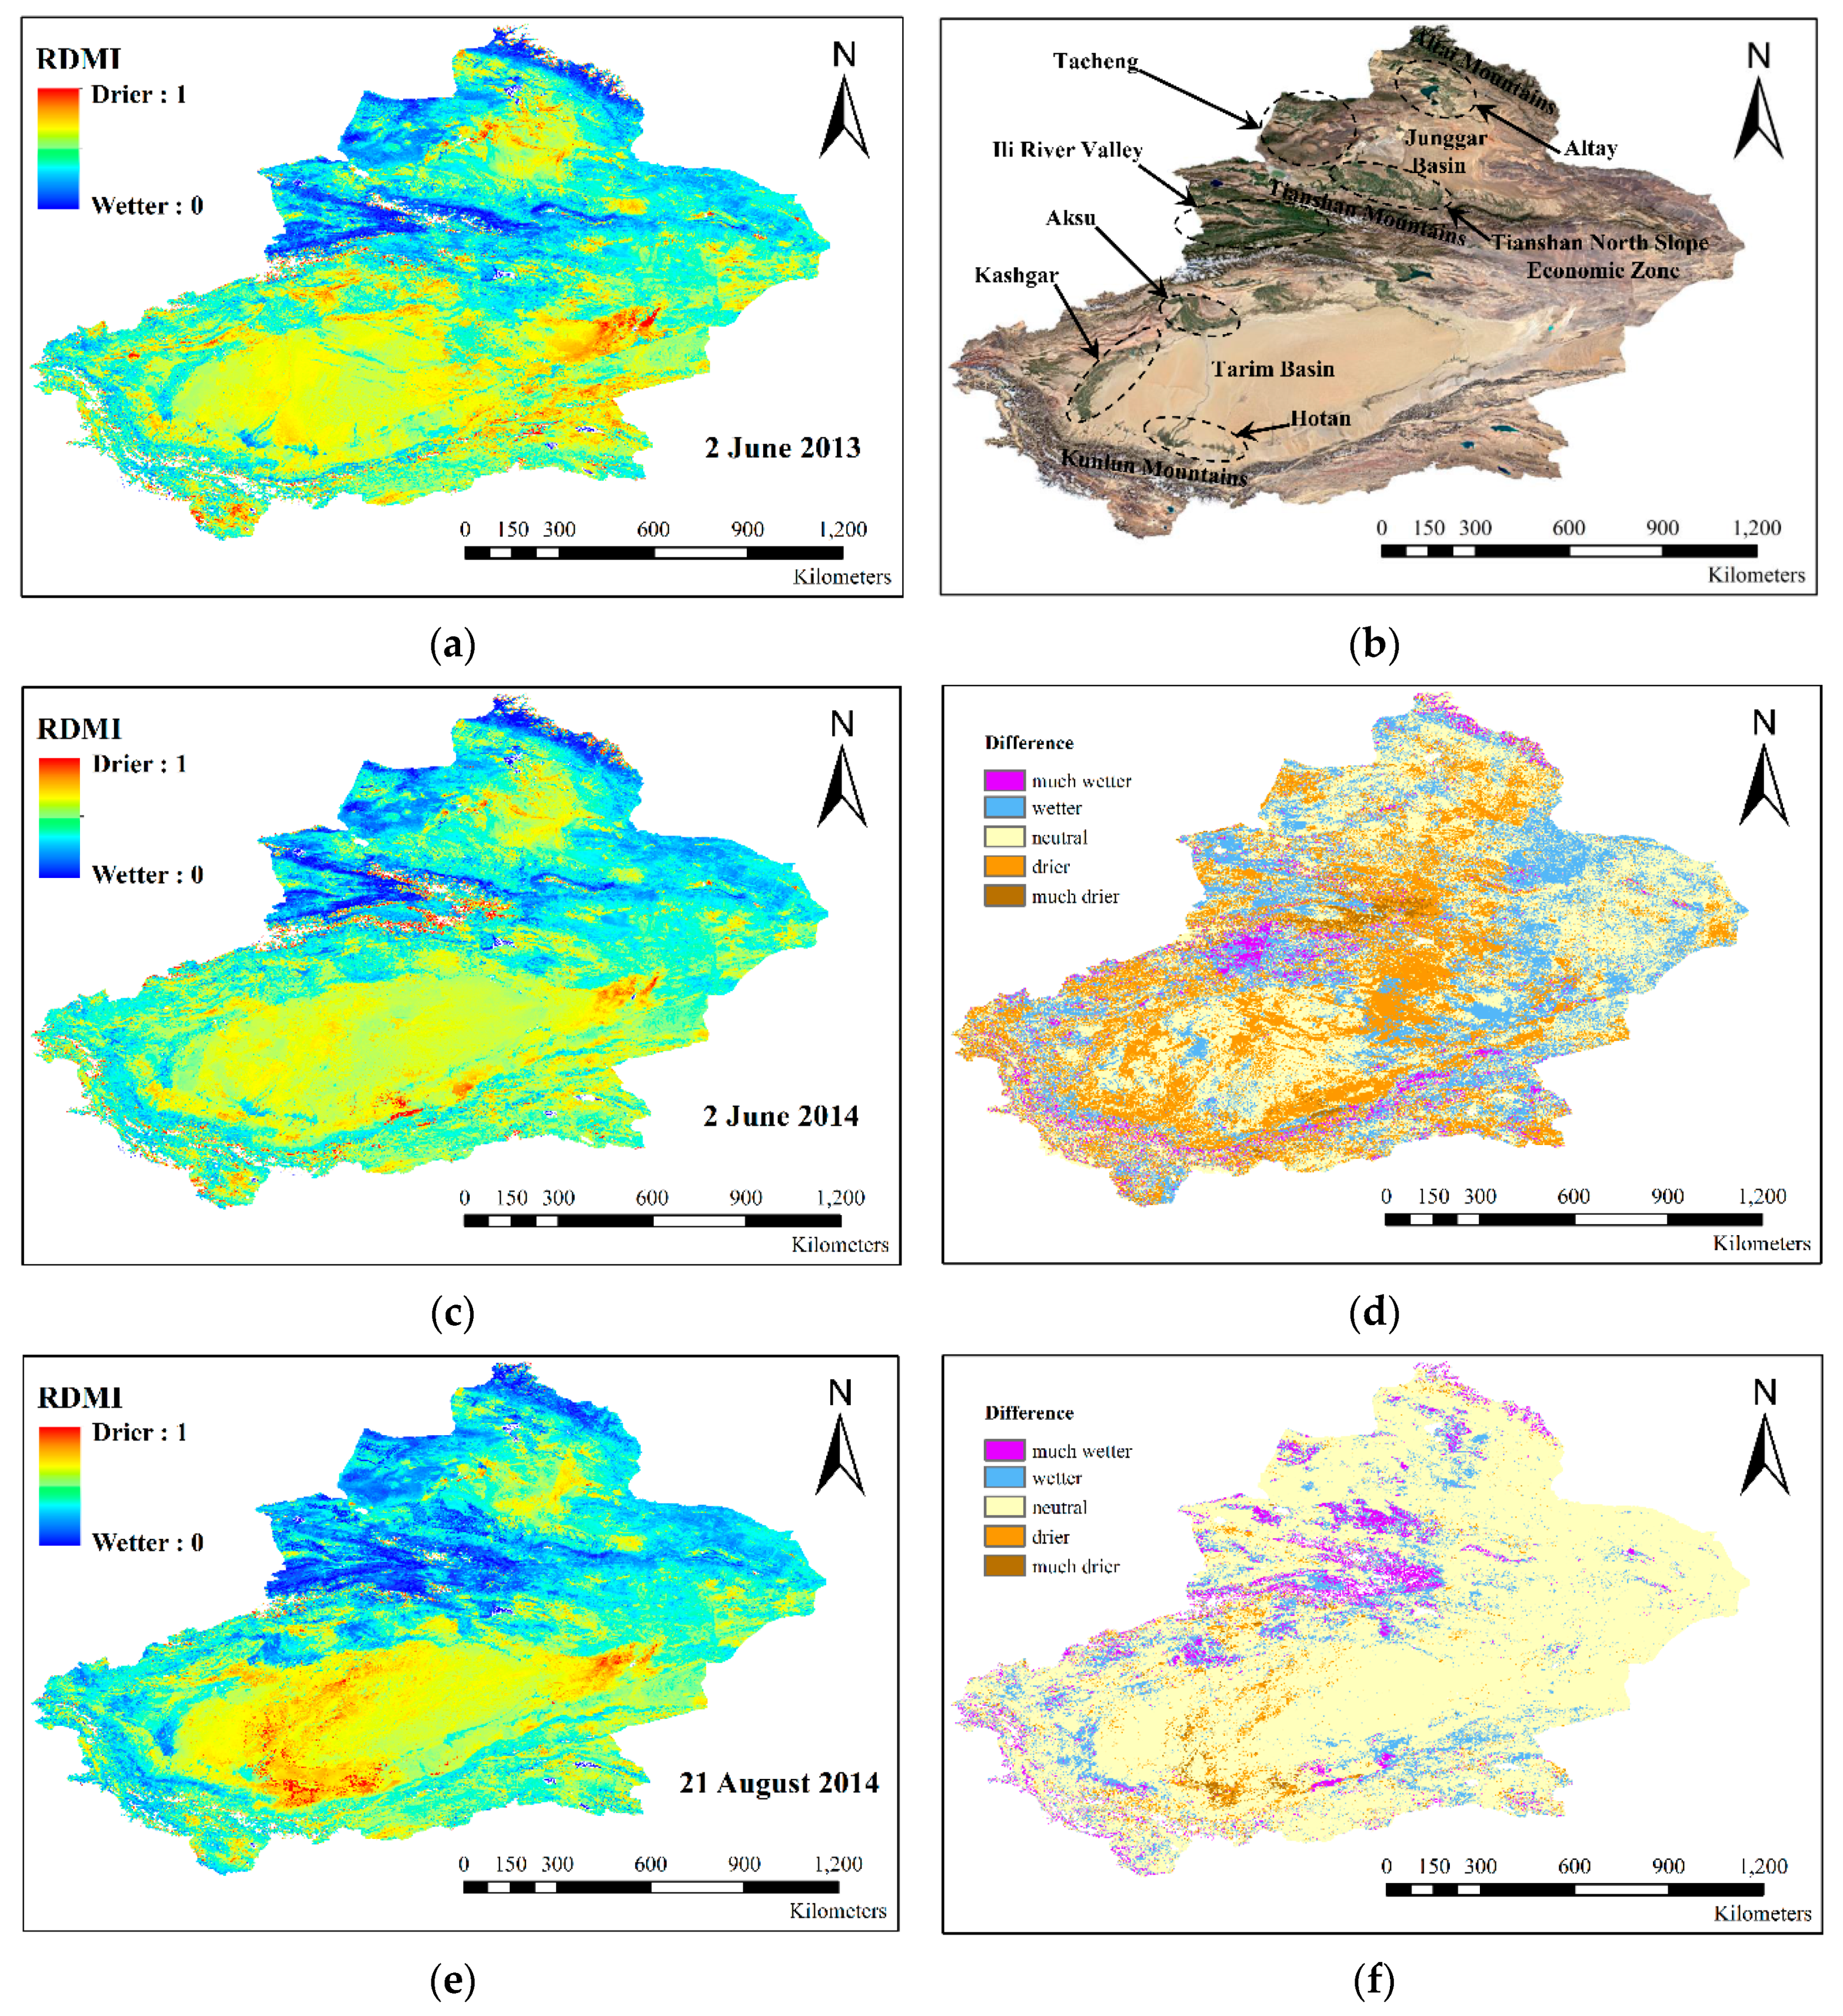
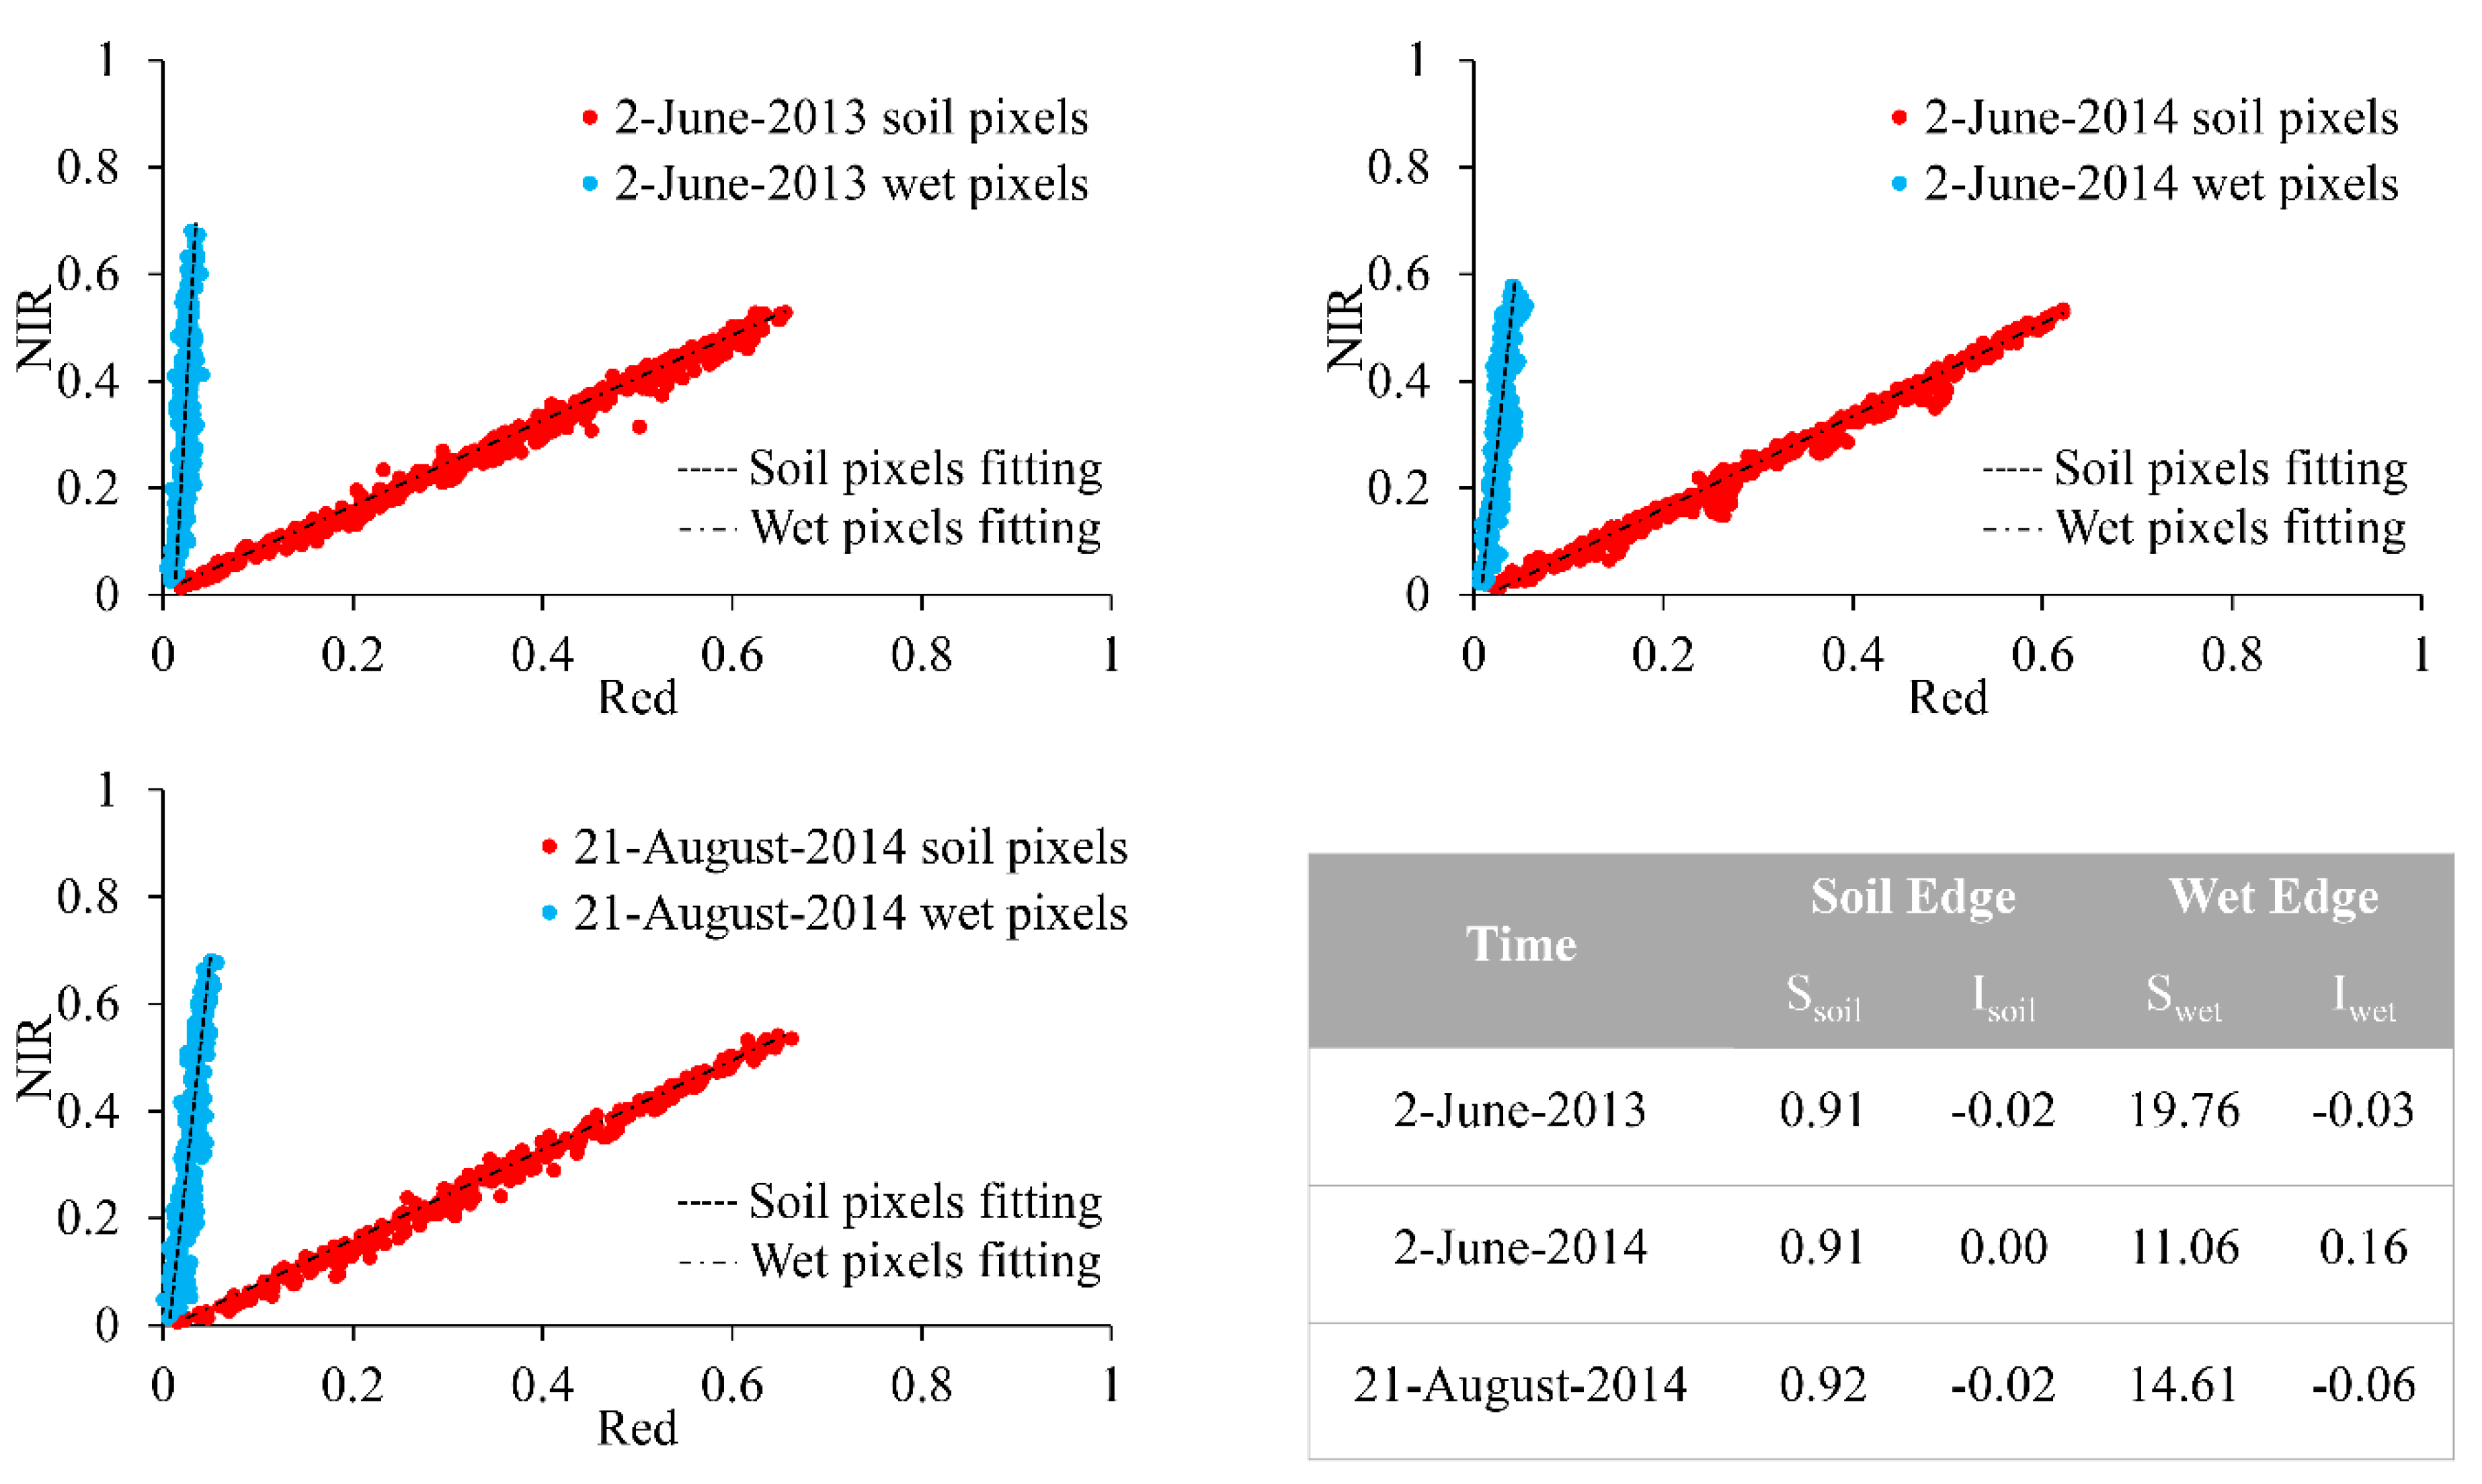
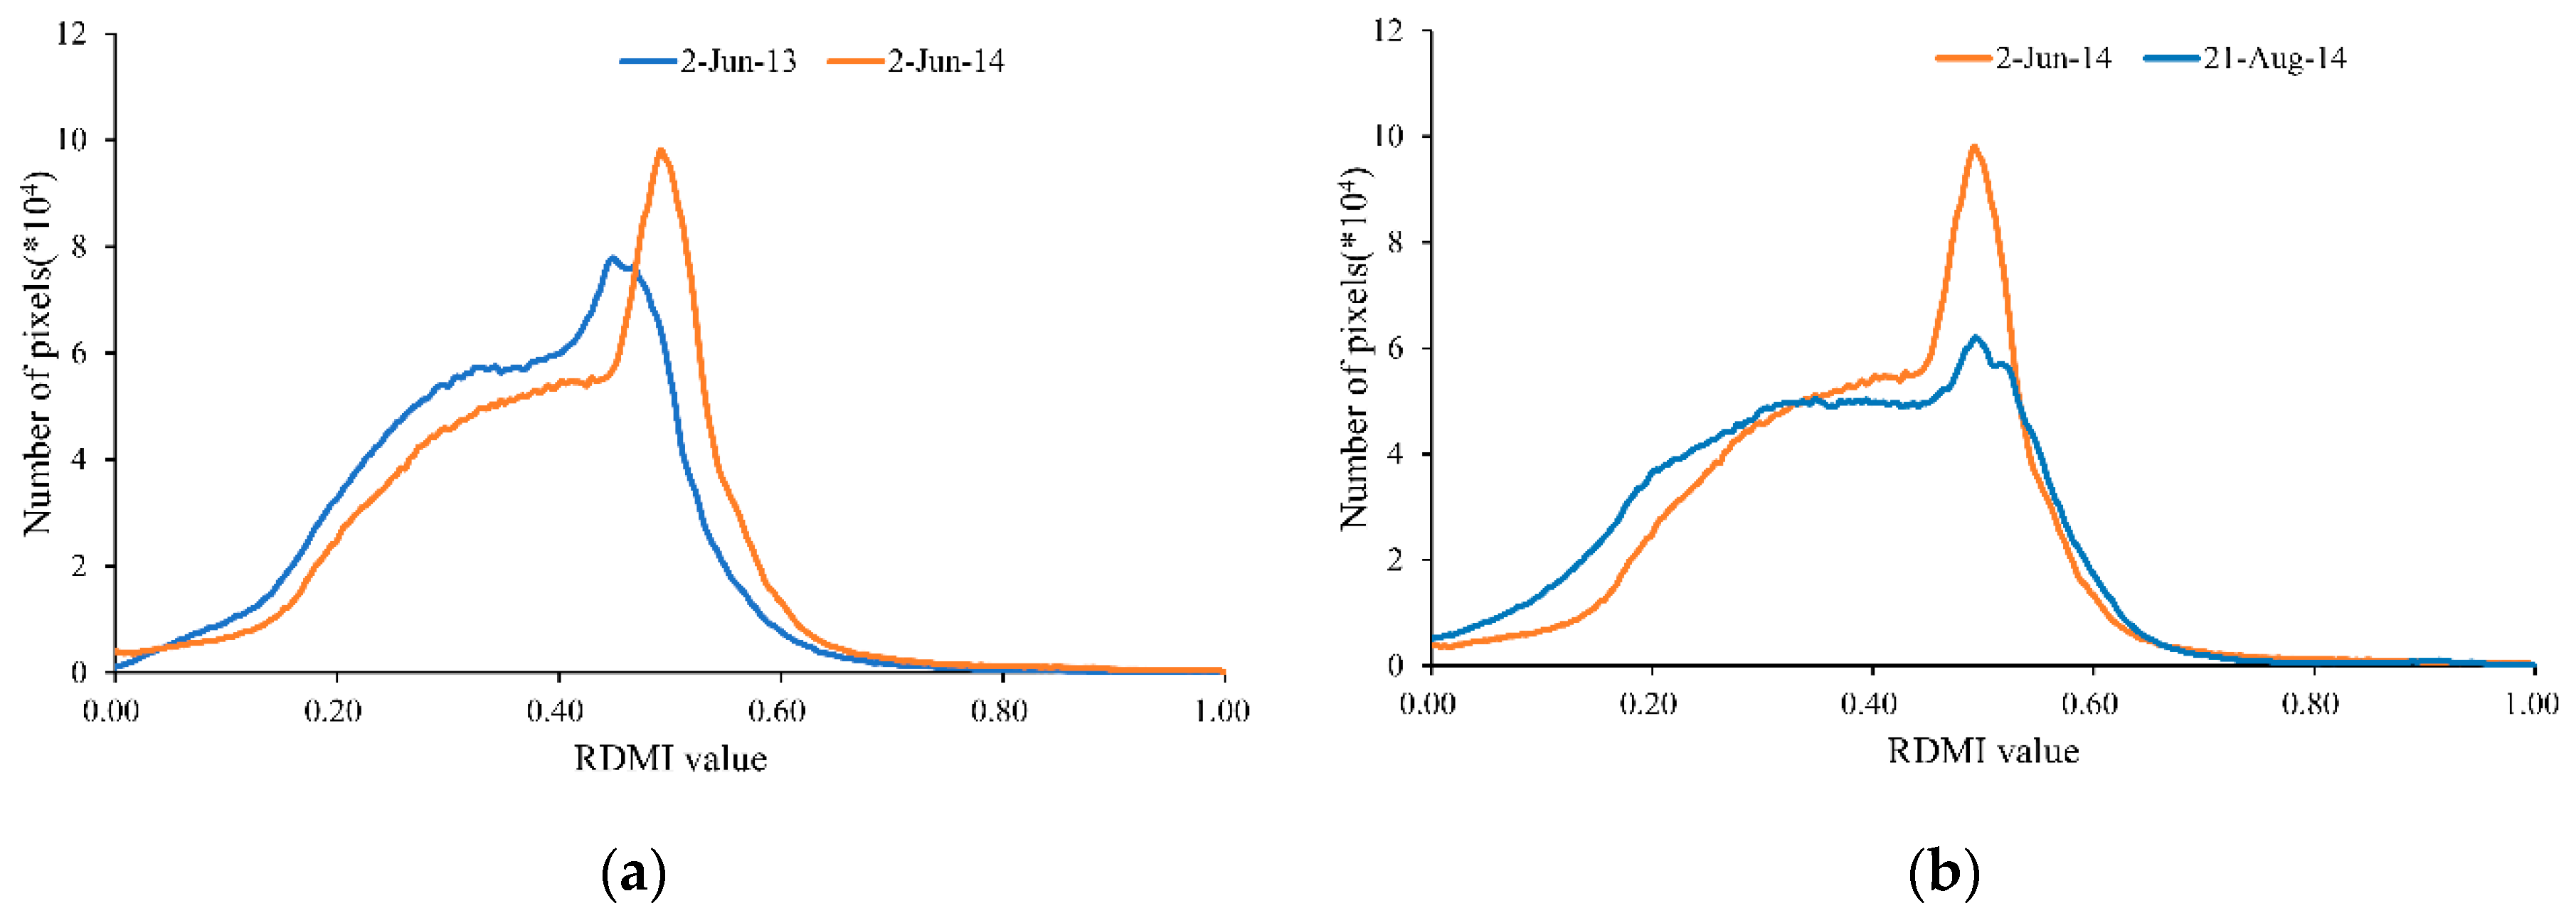
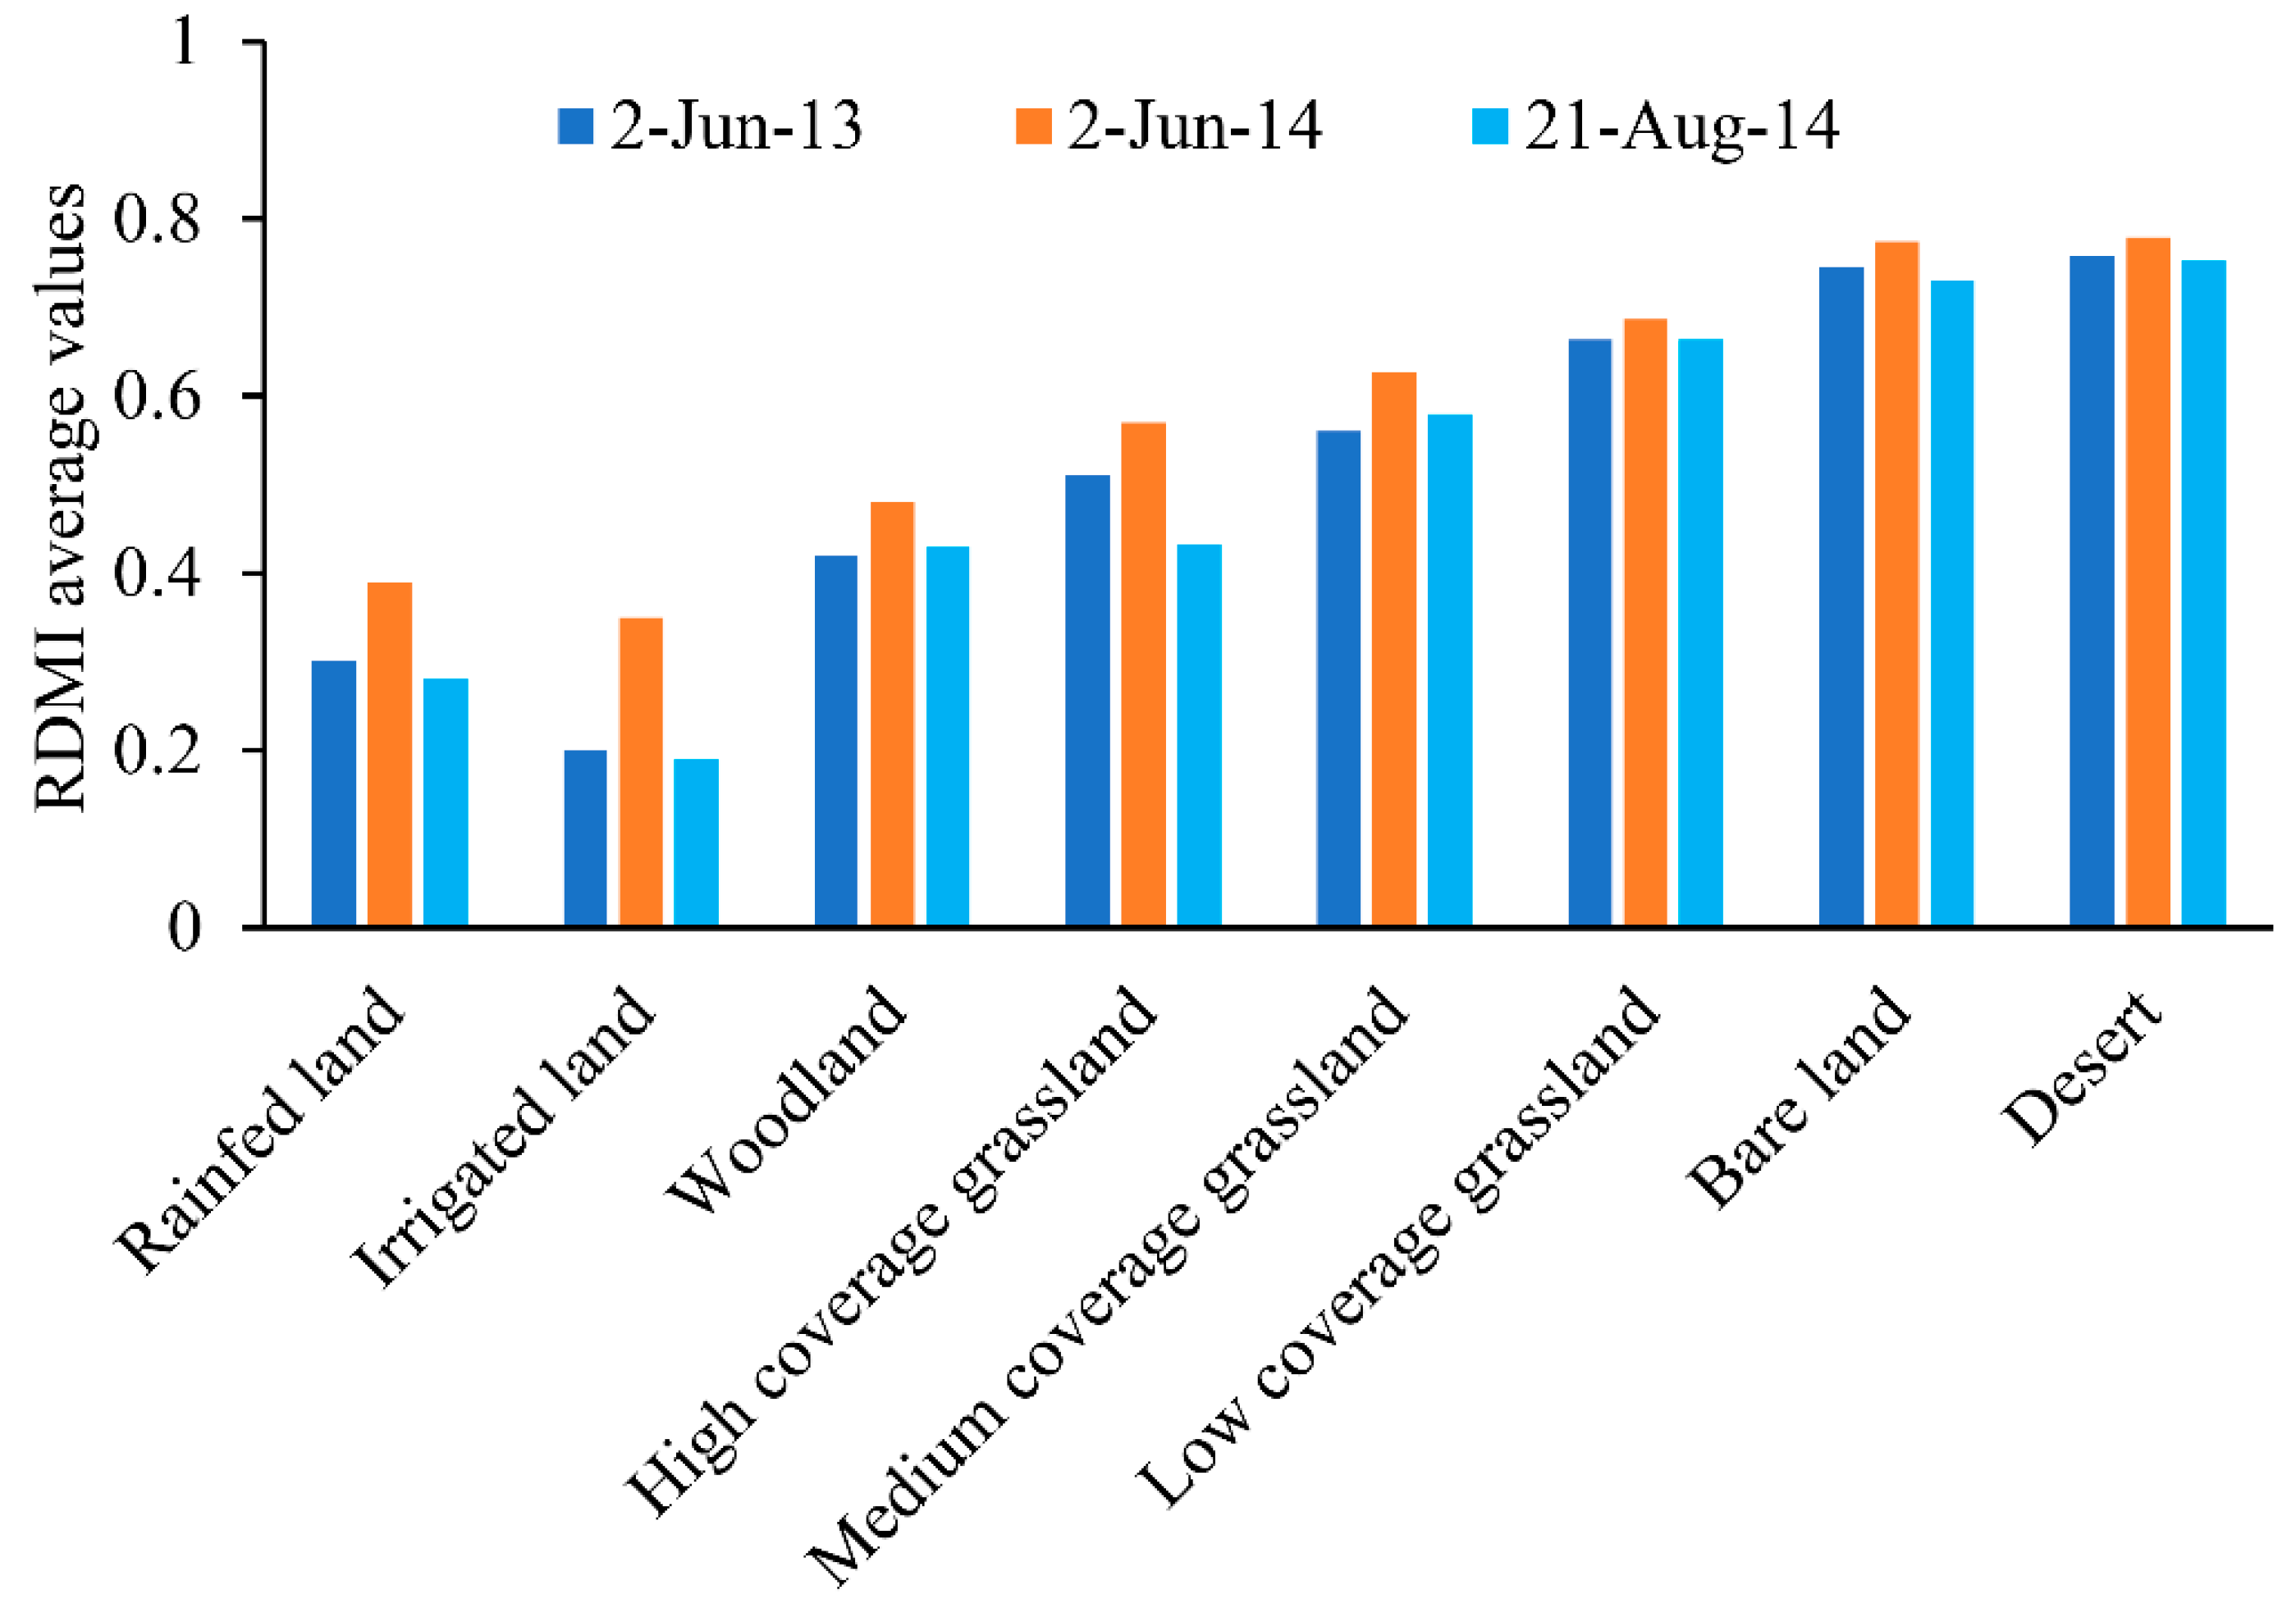
Table 1.
A summary of primary global satellite precipitation products.
| Precipitation | Spatial Resolution | Temporal Resolution | Launch Time | References |
|---|---|---|---|---|
| TRMM-TMPA | 0.25° | 3 h | 1998 | [30,31] |
| CMORPH | 0.25° | 3 h | 2002 | [32] |
| GSMaP | 0.10° | 1 h | 2005 | [33] |
| PERSIANN | 0.25° | 3 h | 2000 | [34] |
| GPCP | 0.25° | monthly | 1979 | [35] |
Table 2.
The major multispectral data sources for drought monitoring.
| Platform/Sensor | Number of Bands | Spectral Range (μm) | Spatial Resolution | Temporal Resolution | Launch Time |
|---|---|---|---|---|---|
| Landsat/TM | 7 | 0.4–2.35 | 30 m/120 m | 16 d | 1984 |
| Landsat/ETM+ | 8 | 0.45–2.35 | 15 m/30 m/60 m | 16 d | 1999 |
| Landsat/OLI | 9 | 0.43–1.39 | 30 m | 16 d | 2013 |
| Landsat/TIRS | 2 | 10.6–12.5 | 100 m | 16 d | |
| Terra/ASTER | 14 | 0.52–11.65 | 90 m | 16 d | 1999 |
| HJ-1B/CCD | 4 | 0.43–0.90 | 30 m | 4d | 2008 |
| HJ-1B/IRS | 4 | 0.75–12.50 | 300 m | 4 d | |
| Aqura/MODIS | 36 | 0.4–14.40 | 250 m/1000 m | 0.5 d | 2002 |
| Terra/MODIS | 0.5 d | 2000 | |||
| NOAA/AVHRR | 5 | 0.55–12.50 | 1100 m | 0.5 d | 1979 |
Table 3.
The dryness monitoring indices based on 2/3D space.
| Dryness Index | Indicators | Remote Sensors | Verification Area | References |
|---|---|---|---|---|
| PDI | Red band (0.63–0.69 µm) Near infrared (0.77–0.90 µm) | Landsat-7 ETM+ | The Shunyi Remote Sensing Experimental Base, Beijing, China | [61,62,63] |
| MPDI | Red band (0.63–0.69 µm) Near infrared (0.77–0.90 µm) | Landsat-7 ETM+ | The Shunyi Remote Sensing Experimental Base, Beijing, China | [64,65] |
| Red (0.62–0.67 µm) Near infrared (0.84–0.87 µm) | MODIS | Ningxia Huizu Autonomous Region of China | ||
| TVDI | NDVI and LST | NOAA-AVHRR | Senegal river valley in Senegal Sichuan Basin | [66,67] |
| MODIS | Fuxin, China | |||
| Landsat TM/ETM+ | Northern China | |||
| TVMDI | NDVI, LST and MPDI | Landsat-8 OLI | Yanco | [49] |
| MODIS | AustraliaIran |
Table 4.
The correlation coefficients, slope, intercept, and RMSE of RDMI, Perpendicular Drought Index (PDI), Modified Perpendicular Drought Index (MPDI), TVDI, and TVMDI, under different land cover conditions (n is the amount of in-situ data under this land cover).
Table 4.
The correlation coefficients, slope, intercept, and RMSE of RDMI, Perpendicular Drought Index (PDI), Modified Perpendicular Drought Index (MPDI), TVDI, and TVMDI, under different land cover conditions (n is the amount of in-situ data under this land cover).
| RDMI | PDI | MPDI | TVDI | TVMDI | ||
|---|---|---|---|---|---|---|
| Total (n = 51) | r | −0.89 | −0.72 | −0.74 | −0.84 | −0.87 |
| Slope | −0.04 | −0.03 | −0.03 | −0.03 | −0.03 | |
| Intercept | 0.92 | 0.87 | 0.89 | 0.89 | 0.81 | |
| RMSE | 0.09 | 0.17 | 0.14 | 0.11 | 0.11 | |
| Winter wheat (n = 8) | r | −0.76 | −0.60 | −0.65 | −0.64 | −0.73 |
| Slope | −0.03 | −0.04 | −0.04 | −0.02 | −0.03 | |
| Intercept | 0.79 | 1.08 | 1.14 | 0.72 | 0.86 | |
| RMSE | 0.08 | 0.19 | 0.15 | 0.09 | 0.09 | |
| Cotton (n = 19) | r | −0.64 | −0.26 | −0.47 | −0.61 | −0.62 |
| Slope | −0.05 | −0.05 | −0.02 | −0.03 | −0.03 | |
| Intercept | 1.01 | 1.01 | 0.78 | 0.91 | 0.87 | |
| RMSE | 0.09 | 0.17 | 0.13 | 0.11 | 0.10 | |
| Spring maize (n = 14) | r | −0.69 | −0.50 | −0.41 | −0.55 | −0.65 |
| Slope | −0.02 | −0.02 | −0.04 | −0.02 | −0.03 | |
| Intercept | 0.77 | 0.80 | 1.09 | 0.84 | 0.75 | |
| RMSE | 0.09 | 0.14 | 0.12 | 0.10 | 0.09 | |
| Bare land (n = 8) | r | −0.68 | −0.56 | −0.53 | −0.41 | −0.50 |
| Slope | −0.02 | −0.01 | −0.01 | 0.01 | 0.03 | |
| Intercept | 0.76 | 0.81 | 0.85 | 0.79 | 0.87 | |
| RMSE | 0.06 | 0.17 | 0.08 | 0.11 | 0.08 |
The number of samples with land cover for the desert was only 2, and the correlation coefficient was not calculated.
© 2019 by the authors. Licensee MDPI, Basel, Switzerland. This article is an open access article distributed under the terms and conditions of the Creative Commons Attribution (CC BY) license (http://creativecommons.org/licenses/by/4.0/).
Share and Cite
MDPI and ACS Style
Zhang, J.; Zhang, Q.; Bao, A.; Wang, Y. A New Remote Sensing Dryness Index Based on the Near-Infrared and Red Spectral Space. Remote Sens. 2019, 11, 456. https://doi.org/10.3390/rs11040456
AMA Style
Zhang J, Zhang Q, Bao A, Wang Y. A New Remote Sensing Dryness Index Based on the Near-Infrared and Red Spectral Space. Remote Sensing. 2019; 11(4):456. https://doi.org/10.3390/rs11040456
Chicago/Turabian StyleZhang, Jieyun, Qingling Zhang, Anming Bao, and Yujuan Wang. 2019. "A New Remote Sensing Dryness Index Based on the Near-Infrared and Red Spectral Space" Remote Sensing 11, no. 4: 456. https://doi.org/10.3390/rs11040456
Note that from the first issue of 2016, this journal uses article numbers instead of page numbers. See further details here.