Atmospheric Correction for Tower-Based Solar-Induced Chlorophyll Fluorescence Observations at O2-A Band


1
Key Laboratory of Digital Earth Science, Institute of Remote Sensing and Digital Earth, Chinese Academy of Sciences, Beijing 100094, China
2
College of Geomatics, Xi’an University of Science and Technology, Xi’an 710054, China
3
College of Resources and Environment, University of Chinese Academy of Sciences, Beijing 100049, China
*
Author to whom correspondence should be addressed.
Remote Sens. 2019, 11(3), 355; https://doi.org/10.3390/rs11030355
Submission received: 26 December 2018
/
Revised: 1 February 2019
/
Accepted: 4 February 2019
/
Published: 11 February 2019
Abstract
:Solar-induced chlorophyll fluorescence (SIF) has been proven to be an efficient indicator of vegetation photosynthesis. To investigate the relationship between SIF and Gross Primary Productivity (GPP), tower-based continuous spectral observations coordinated with eddy covariance (EC) measurements are needed. As the strong absorption effect at the O2-A absorption bands has an obvious influence on SIF retrieval based on the Fraunhofer Line Discrimination (FLD) principle, atmospheric correction is required even for tower-based SIF observations made with a sensor tens of meters above the canopy. In this study, an operational and simple solution for atmospheric correction of tower-based SIF observations at the O2-A band is proposed. The aerosol optical depth (AOD) and radiative transfer path length (RTPL) are found to be the dominant factors influencing the upward and downward transmittances at the oxygen absorption band. Look-up tables (LUTs) are established to estimate the atmosphere transmittance using AOD and RTPL based on the MODerate resolution atmospheric TRANsmission 5 (MODTRAN 5) model simulations, and the AOD is estimated using the ratio of the downwelling irradiance at 790 nm to that at 660 nm (E790/E660). The influences of the temperature and pressure on the atmospheric transmittance are also compensated for using a corrector factor of RTPL based on an empirical equation. A series of field measurements were carried out to evaluate the performance of the atmospheric correction method for tower-based SIF observations. The difference between the SIF retrieved from tower-based and from ground-based observations decreased obviously after the atmospheric correction. The results indicate that the atmospheric correction method based on a LUT is efficient and also necessary for more accurate tower-based SIF retrieval, especially at the O2-A band.

1. Introduction
Solar-induced chlorophyll fluorescence (SIF) has been proven to be an efficient indicator of vegetation photosynthesis [1]. In recent years, a series of algorithms has been developed for SIF retrieval from ground-based [2,3,4,5,6,7,8], airborne [9,10,11] and satellite [12,13,14,15] observations. The satellite-based SIF products have shown great potential for global monitoring of vegetation gross primary productivity (GPP) [16,17,18,19]. However, many uncertainties regarding the relationship between the SIF and GPP remain.
The tower-based eddy covariance (EC) technique is widely used for the measurement of the carbon flux at the ecosystem scale [20]. To investigate the relationship between the SIF and GPP, tower-based, continuous spectral observations in conjunction with EC measurements are needed. In recent years, a number of tower-based spectral observation systems have been installed at different EC sites. Examples include the Multiplexer Radiometer Irradiometer (MRI) [7,21], the NASA FUSION tower, the HyperSpectral Irradiometer (HSI) [22,23,24], the TriFLEX at Avignon in France [25], the UNIEDI System at the FluxNet Hyytiälä site in Finland [26], the FluoSpec [6], the SIF-Sys [8], and the ChinaSpec [27].
The most commonly used methods of retrieving SIF from ground-based observations based on the Fraunhofer Line Depth (FLD) principle need measurements of both the upwelling radiance and downwelling irradiance at the top-of canopy (TOC) level. For tower-based SIF observations, the downwelling irradiance is usually measured using a cosine corrector with a hemispherical field of view in the nadir direction, and the upwelling radiance is usually measured using a sensor with a conical or hemispherical field of view. For most configurations of tower-based SIF observation systems, the sensors used for both the downwelling and upwelling radiation observations are mounted on the tower at a height of between 5 m and 50 m, depending on the ecosystem type.
For tower-based SIF retrieval, the telluric oxygen absorption bands are most commonly used because these absorption features are relatively strong and broad. However, the depth of the oxygen absorption bands is sensitive to the sensor height. According to the study by Liu et al. [28,29], a bias of 10 m in the sensor height will lead to a bias of about 0.1 mW/m2/nm/sr in the retrieved SIF at the O2-A band. Sabater et al. [30] also reported that the 3FLD method produced large underestimates of SIF values if no oxygen compensation was applied. Therefore, atmospheric correction of observations of both the downwelling irradiance and upwelling radiance is important for tower-based SIF observations, especially for the O2-A band due to the strong absorption effect.
Sabater et al. [30] provided a comprehensive analysis of how atmospheric effects impact SIF estimates made using proximal sensing. The atmospheric absorption and scattering effects are mainly related to the radiative transfer path length (RTPL, determined by the sensor height, and the solar and view zenith angles), the aerosol optical depth, and the pressure and temperature. Although it is possible to measure these parameters for full-physics modelling of the atmospheric radiative transfer effects, it would be too time-consuming for long-term SIF observations, and the errors in the measured atmospheric parameters would accumulate. Therefore, operational and simple methods for estimating the atmosphere transmittance are needed for accurate tower-based SIF observations.
Both the O2-A and O2-B bands have potential for tower-based SIF retrieval, but in this study, we focused on the atmospheric correction at the O2-A band because, (1) the absorption effect at the O2-B band is much weaker than that at the O2-A band, so the atmospheric correction for tower-based SIF observation at the O2-B band is not so important as at the O2-A band; (2) in practice, the SIF retrieved at the O2-A band is more frequently used than that at the O2-B band due to the robustness of retrieval. Different from Sabater et al. [30] which mainly focused on theoretical analysis, this study aims to simplify the problem and to provide an operational solution for the atmospheric correction of tower-based observations of both the downwelling irradiance and upwelling radiance to support long-term, continuous spectral measurements. First, the radiative transfer process for tower-based SIF observation is analyzed theoretically; then, the atmospheric radiative transfer parameters are simulated using the MODerate resolution atmospheric TRANsmission 5 (MODTRAN 5) model [31] for different conditions; and, finally, look-up tables (LUTs) for fast estimation of the upward and downward atmosphere transmittances between the tower-based sensor and top of canopy (TOC) are constructed. The influences of the temperature and pressure on the atmospheric transmittance are also compensated for using a corrector factor of RTPL. The performance of the method is then evaluated using field measurements.
2. Materials and Methods
2.1. Radiative Transfer Process for Tower-Based SIF Observations
The upwelling radiance at the top of the canopy consists of the contributions from both the reflected radiance and the emitted SIF, as expressed in Equation (1):
where is the upwelling radiance at top of the canopy, is the downwelling irradiance arriving at the top of canopy, is the canopy reflectance, and is the emitted SIF at the top of the canopy.
Therefore, for the retrieval of the SIF, both the upwelling radiance and downwelling irradiance at the top of the canopy are needed. However, for tower-based spectral observations, only the upwelling radiance and downwelling irradiance arriving at the sensor height are available; due to the influence of atmospheric absorption and scattering, these are different from the TOC radiance and irradiance.
The upwelling radiance at height H can be calculated as:
where is the upwelling radiance arriving at the observation platform at a height H above the surface; is the upward transmittance of the atmospheric radiative transfer from TOC to the height of the tower-based sensor (H); is the surface reflectance; is the atmospheric spherical albedo; and is the atmospheric path radiance. For tower-based observations, the atmospheric scattering effect between the sensor and surface is relatively weak due to the low height. Therefore, the observed upwelling radiance and downwelling irradiance at the sensor height ( and ) can be approximately expressed as:
and
respectively, where and are the upward and downward atmospheric total transmittance (including the effects of absorption and scattering) from the TOC to height of the tower-based sensor, respectively, and <> represents convolution with the instrument spectral response function (ISRF).
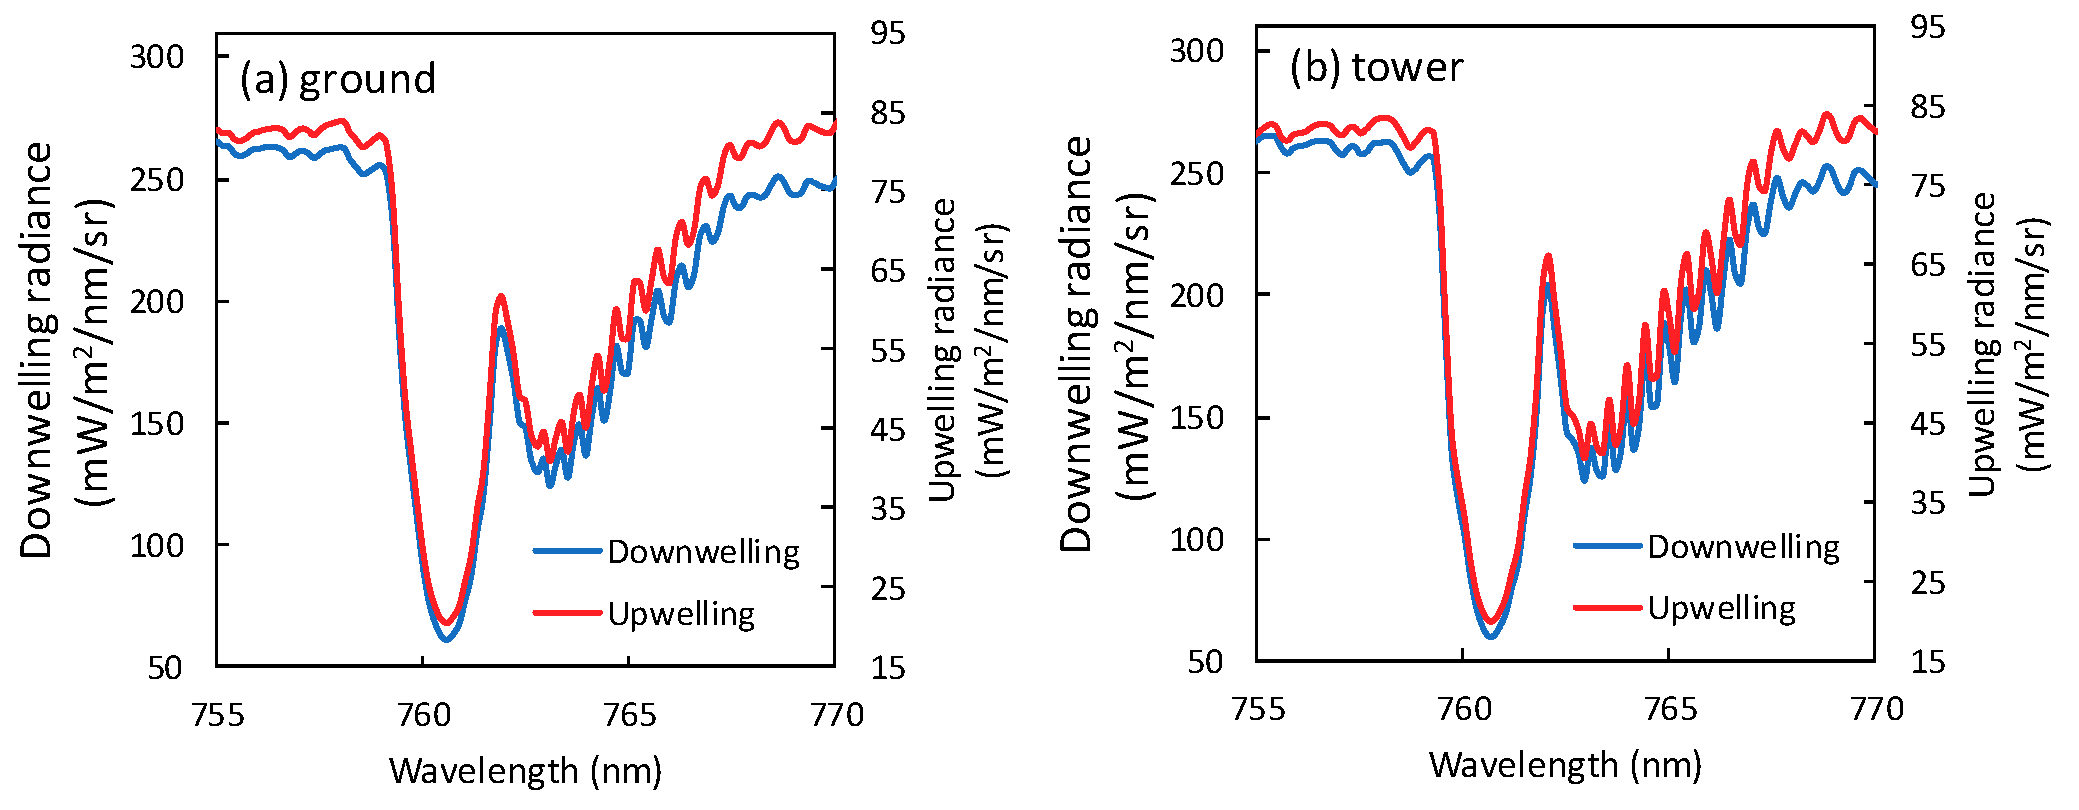
As the radiance or irradiance spectra by observed by spectrometers are already convolved with the ISRF, for the atmospheric absorption bands where the transmittance is spectrally unsmooth, it is not possible to calculate the top-of-canopy radiance or irradiance precisely using a fully physical approach due to the mathematical inequality between <a·b> and <a>·<b> [32], especially for data with high spectral resolution (as shown in Figure 1).
In this study, to calculate the upward and downward atmospheric transmittances from the TOC to the height of the tower-based sensor, the MODTRAN 5 model was used to simulate the downwelling irradiance and upwelling radiance arriving at the sensor height and at the TOC. Using the MODTRAN simulations, the upward and downward atmosphere transmittances can be calculated as:
and
respectively, where and are the upward and downward atmosphere transmittances from the TOC to the sensor height, respectively. It needs to be noted that due to the convolution with the ISRF before the division shown in the equations, is not strictly the “transmittance”. However, for convenience, “transmittance” is used to refer to in this paper.
The upward and downward atmosphere transmittances are related to the atmospheric absorption and scattering effects, which are mainly influenced by the atmospheric pressure, RTPL, and AOD [29]. To establish a model for estimating the atmospheric transmittances, a dataset including a range of altitudes, solar/view zenith angles (SZA/VZA), and values of the AOD was simulated using MODTRAN 5. The original full-width at half maximum (FWHM) of MODTRAN simulation is 1 cm−1 (about 0.06 nm at 760 nm). The detailed input parameters for MODTRAN are listed in Table 1. The sensor height and surface elevation were set as 25 m and 1.5 km to match the case of tower-based SIF observation system at the Daman site, which was used for validation in the study.
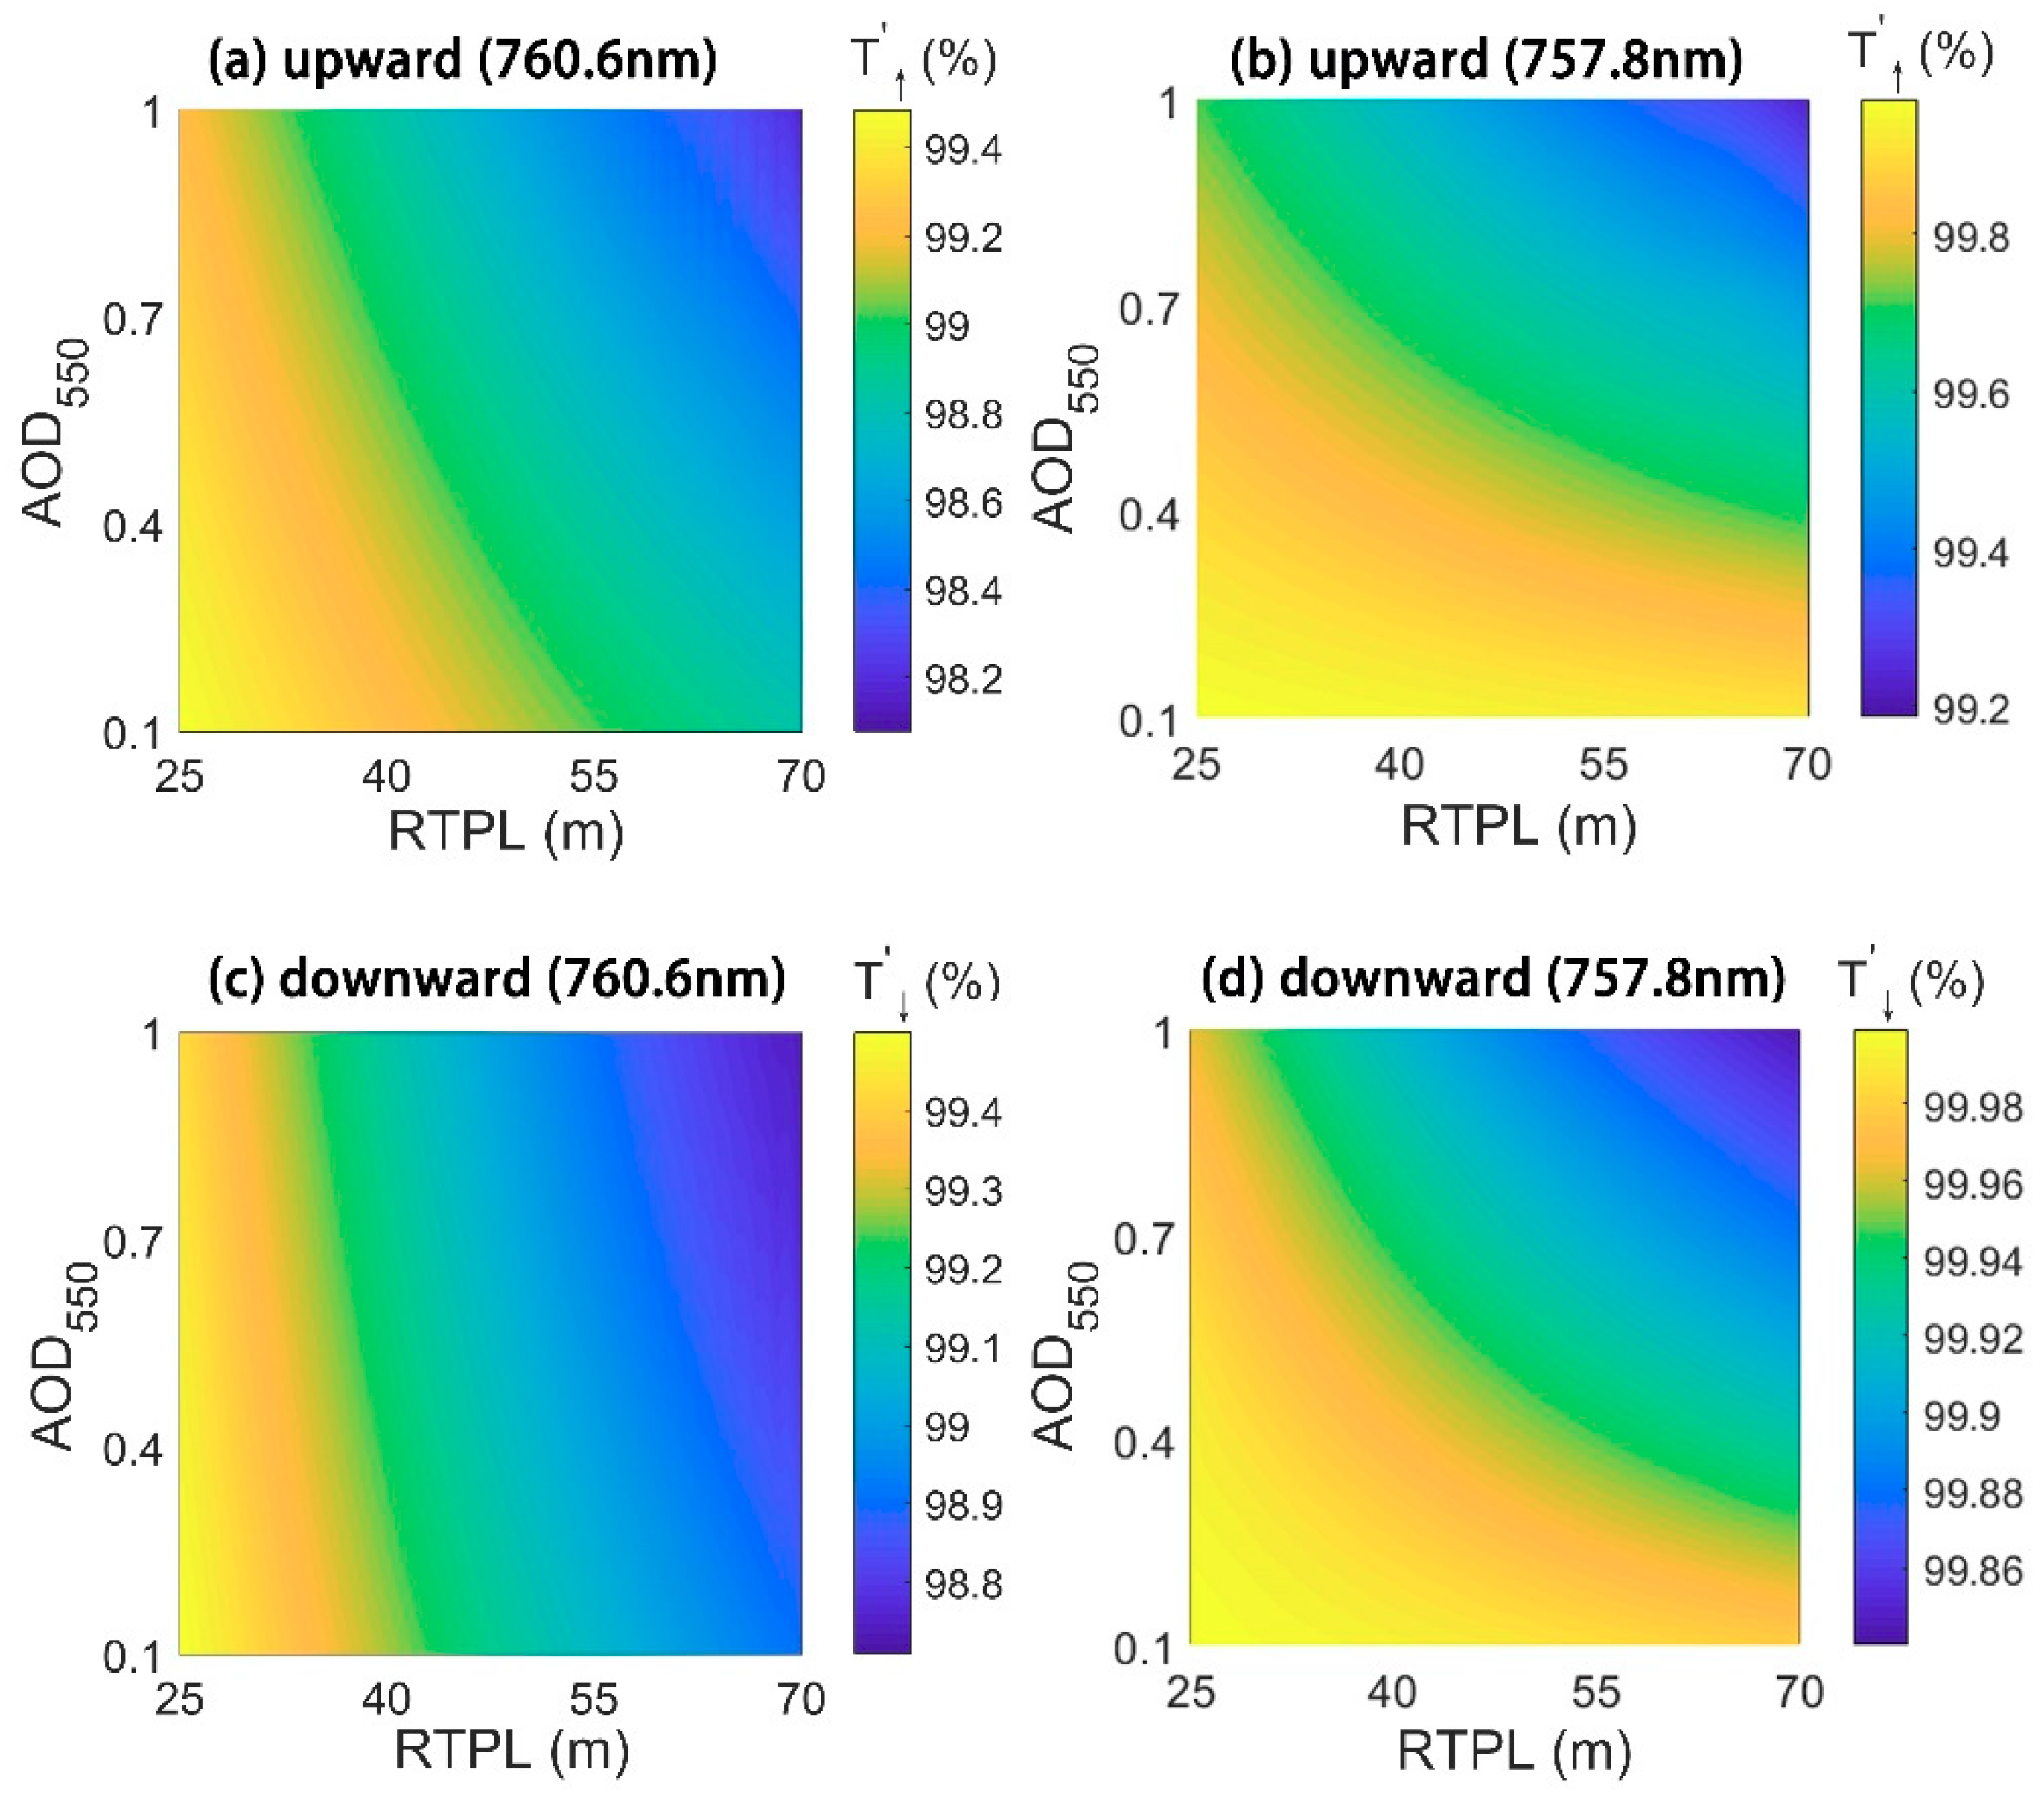
Figure 1 shows the relationships between the AOD, RTPL and the upward/downward atmospheric transmittance for a fixed elevation and atmospheric profile based on the simulations made by MODTRAN 5. To match the field observations that we conducted using an Ocean Optics QE Pro spectrometer, a Gaussian function with an FWHM of 0.31 nm was used as the ISRF and was convolved with the MODTRAN simulations. Based on the results shown in Figure 1, look-up tables for estimating the upward and downward atmospheric transmittances from the TOC to the tower-based sensor height at 760.6 nm (O2-A band) were established with the AOD550 and RTPL as inputs. The upward and downward atmospheric transmittances at 757.8 nm (shoulder of the O2-A band, where the scattering effect dominates) were also shown in Figure 1b,d for reference.
2.2. Estimation of the AOD
As illustrated in Figure 1, the AOD has influence on the atmospheric transmittance, especially for the O2-B band. However, it needs to be noted that, although AOD has influence on the atmospheric transmittance, the effect is spectrally smooth, which is different from the effect by absorption. On the basis of Fraunhofer Line Depth principle, the influence on absorption depth is the main factor influencing the errors in SIF retrieval. Thus, compared to absorption, the scattering effect is less important in atmospheric correction for tower-based SIF measurement. As synchronous measurements of the AOD are not available for all flux sites, in this study, a method for estimating the AOD based on the downwelling irradiance spectra is proposed.
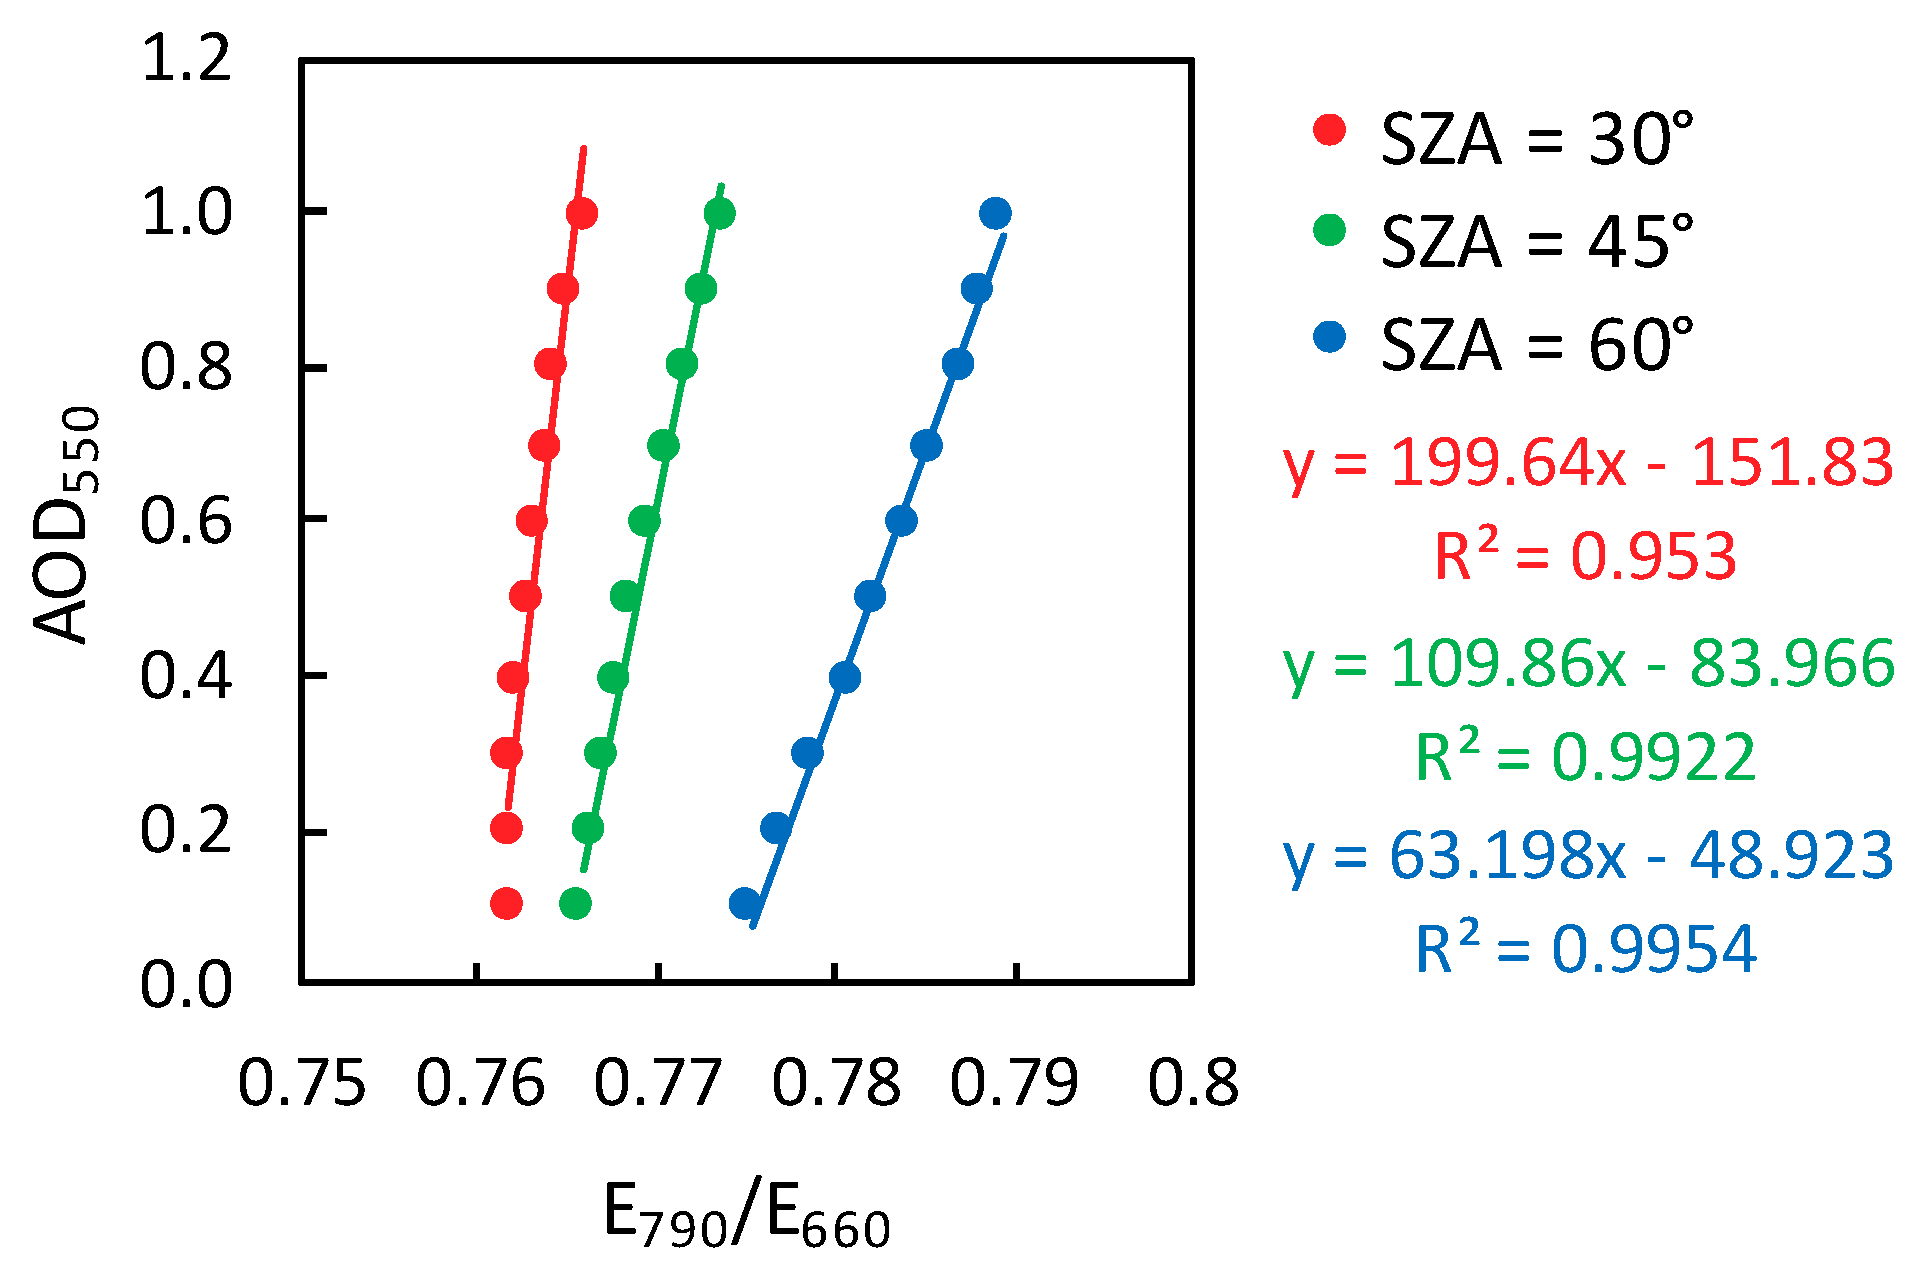
The amplitude of atmospheric scattering effects is spectrally variable and stronger at shorter wavelengths. Therefore, we analyzed the relationship between AOD550 and the ratio of the irradiance at 790 nm to that at 660 nm (E790/E660) based on the MODTRAN simulations. As shown in Figure 2, for a specific SZA, the value of E790/E660 increases with AOD550, and the relationship is close to linear. For a specific AOD550, the value of E790/E660 increases with the SZA. Accordingly, the AOD550 can be estimated using a look-up table that has E790/E660 and SZA as inputs.
2.3. Influence of Atmospheric Pressure and Temperature
The atmospheric pressure and temperature also have an influence on the atmospheric transmittance. Pressure and temperature measurements are usually available for most tower-based flux systems. However, if these values are included in the LUTs for the estimation of atmospheric transmittances, many more simulations are needed and more uncertainty will be introduced into the LUTs. Therefore, following Sabater et al. [30], we used an empirical equation to compensate for the influence of pressure and temperature by using an “equivalent” RTPL (ERTPL). According to Pierluissi et al. [33], the O2 transmittance can be empirically approximated as:
where p0 and T0 are the reference atmospheric pressure and temperature, respectively, U (atm·cm) is the total absorber amount in the path length, and C′ is the spectral coefficients. The MODTRAN code also follows this approximation. For oxygen absorption, the values of the parameters a, m, and n are set to 0.5641, 0.1936, and 0.9353 (refer to Pierluissi et al. [33] for details). According to the Beer–Lambert Law, assuming homogeneous extinction medium, the transmittance is exponentially related to RTPL. Therefore, the ERTPL compensating the influence of pressure and temperature can be expressed as:
If the pressure and temperature for a particular set of conditions are p and T, respectively, the ERTPL can be calculated using the equation. Therefore, only LUTs simulated under the reference pressure and temperature conditions are needed, and the influence of the varying pressure and temperature can be compensated for by using the ERTPL instead of the real RTPL.
2.4. Field Experiments for Validation
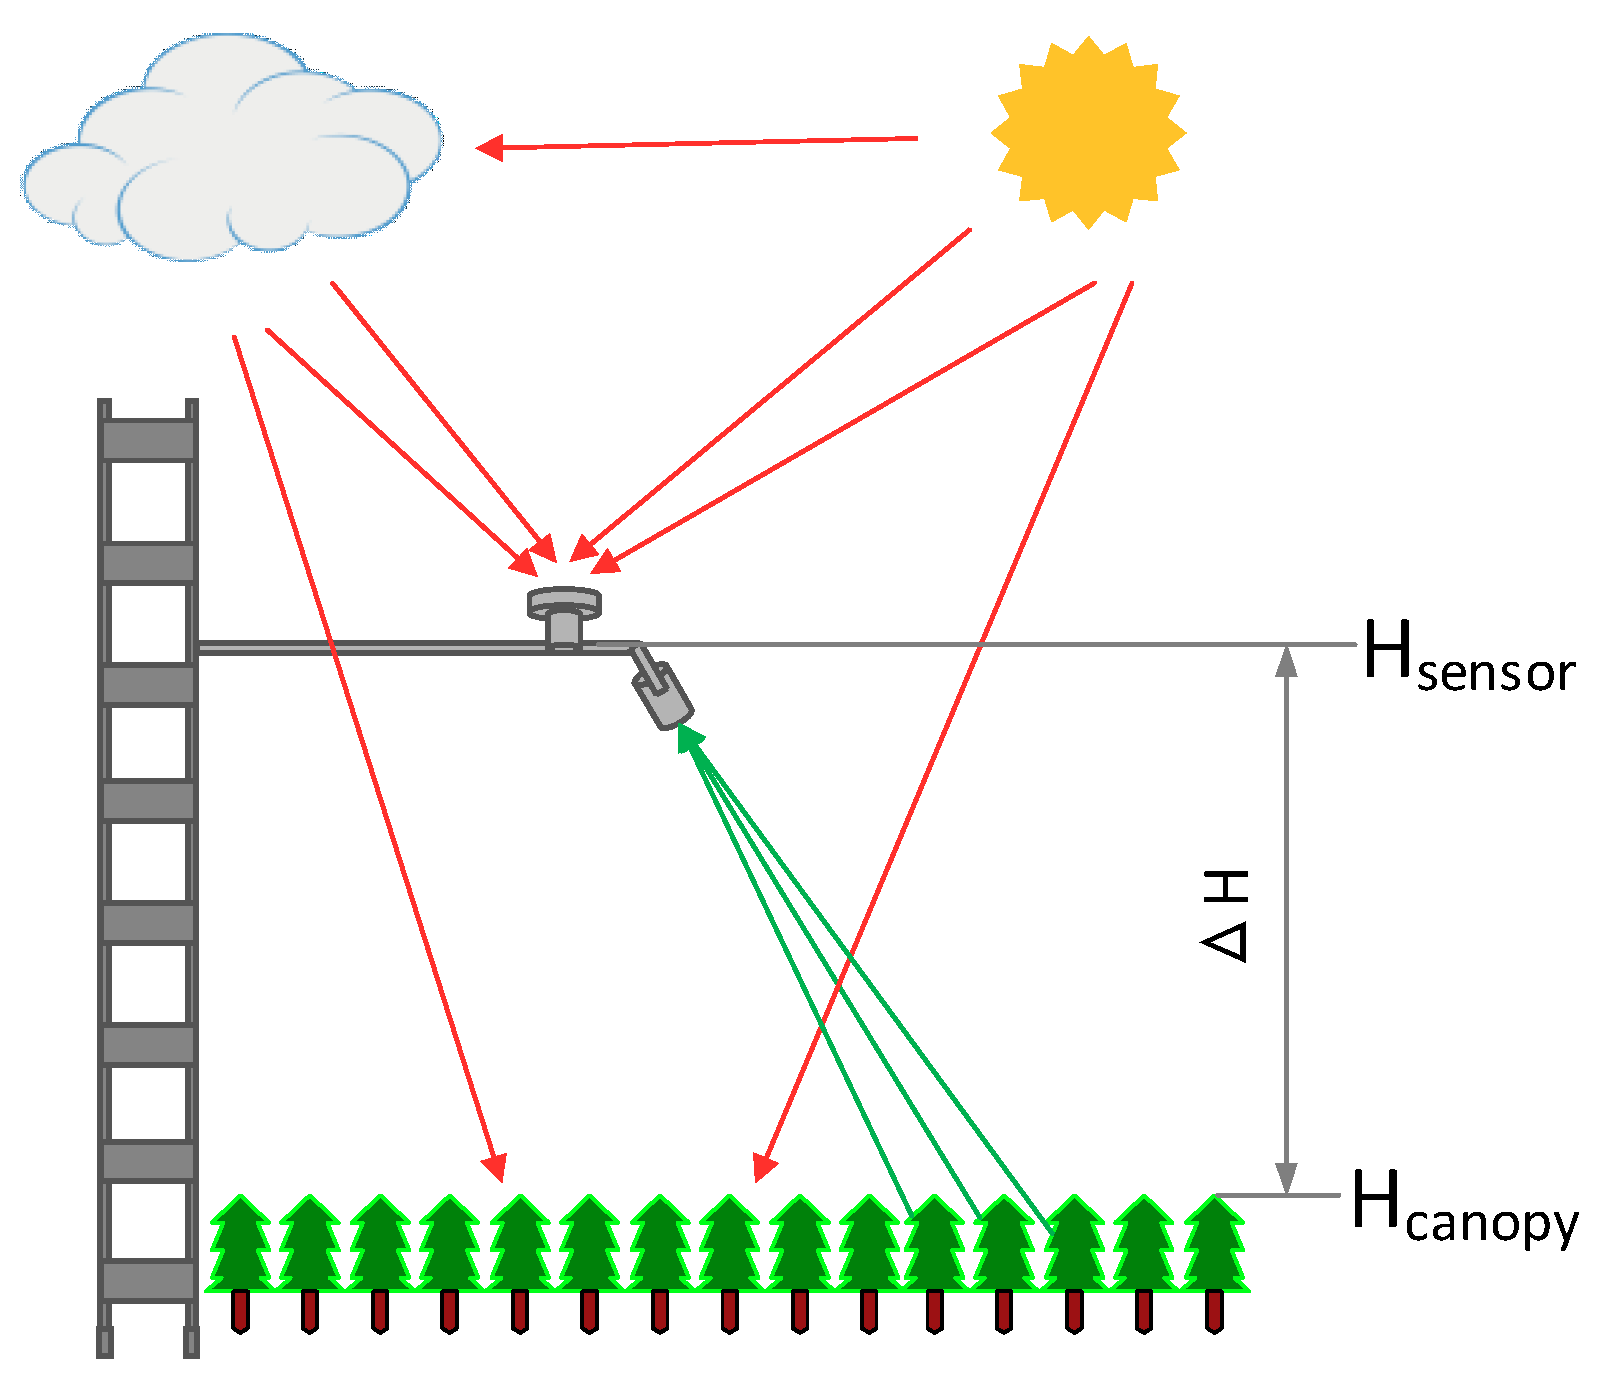
To evaluate the performance of the atmospheric correction method for tower-based SIF observations, two field experiments were carried out on an EC site (Daman site) at Zhangye, China (100.37° E, 38.86° N). The altitude of the EC site was 1560 km. A continuous spectral observation system, AutoSIF-1 (Bergsun Inc., Beijing, China), equipped with an Ocean Optic QE Pro spectrometer was mounted on the EC tower at a height of 25 m above the ground. The full-width at half maximum (FWHM) of the spectrometer was 0.31 nm. Two fibers with a switcher were connected to the spectrometer for the measurement of downwelling irradiance and upwelling radiance. A cosine corrector was used to obtain the downwelling irradiance using a hemispherical field of view. A bare fiber was used to observe the upwelling radiance with a conical field of view of 25° and a view zenith angle of 25° (Figure 3). The automatic spectral observation system collected the downwelling irradiance and upwelling radiance every 3 min, and the time lag between the collection of the downwelling irradiance and upwelling radiance was less than 10 s.
The first field experiment was carried out on 27 October 2017, when the summer maize around the EC site was mature and all leaves had turned yellow. Therefore, the SIF emission was expected to be zero. The automatic spectral observation system mounted on the EC tower was used for the collection of the downwelling irradiance and upwelling radiance.
The second field experiment was carried out on 7 September 2018. The summer maize was at the filling stage and the leaves were still green. Synchronous measurements were taken over the ground with an Ocean Optics QE Pro spectrometer with the same configuration as the continuous spectral observation system. The spectrometers used for ground and tower-based measurements were cross-calibrated. The downwelling irradiance was measured using a 40 cm × 40 cm BaSO4 reference panel (produced and calibrated by Anhui Institute of Optics and Fine Mechanics, Chinese Academy of Sciences). The measurements on the ground were made every 10 min from 10:00 to 17:00; the weather was clear and stable during this time.
2.5. SIF Retrieval Algorithm
For SIF retrieval at the canopy level, algorithms based on the Fraunhofer Line Discrimination (FLD) principle [34] are most commonly used. Several different FLD-based algorithms have been developed, including the standard FLD [34], the 3-band FLD (3FLD) [35], the improved FLD (iFLD) [36], and the principal component analysis-based FLD (pFLD) (Liu X. et al., 2015). The 3FLD algorithm has been proven to be relatively robust and simple to use for data with a spectral resolution of 0.3 nm [5], especially for the O2-A band. Using the 3FLD algorithm, only three spectral samples in the region of the absorption band are needed. Several spectral fitting methods (SFM) have also been proposed and have been proven to be more reliable for SIF retrieval from spectral data that have a relatively low spectral resolution and signal-to-noise ratio. However, the SFM methods require continuous spectral measurements, which means the atmospheric correction must be applied to many more wavelengths. Therefore, in this study, the 3FLD algorithm was selected for the SIF retrieval. Using this method, the SIF can be calculated as:
where w is the weight of the band and is inversely proportion to the distance between the left-hand/right-hand band and the inner band; E is the downwelling irradiance arriving at the TOC; L is the total upwelling radiance at the TOC; and the subscripts “in”, “left” and “right” refer to the bands inside, at the left of and at the right of the absorption band, respectively, as illustrated in Figure 4.
For tower-based observations, downwelling irradiance arriving at the sensor (Esensor) and upwelling radiance arriving at the sensor (Lsensor) were measured. Once the upward and downward atmosphere transmittances ( and ) were estimated using the LUT approach, the downwelling irradiance arriving at the TOC (Ecanopy) and upwelling radiance at the TOC (Lcanopy) can be calculated using Equations (5) and (6). And consequently, the SIF values at TOC can be retrieved using the 3FLD algorithm (Equation (9)).
3. Results
3.1. Validation of the Atmospheric Correction Using Measurements on Non-Fluorescent Mature Canopy
The performance of the atmospheric correction for tower-based SIF observations was evaluated using the field experiments introduced in Section 2.4.
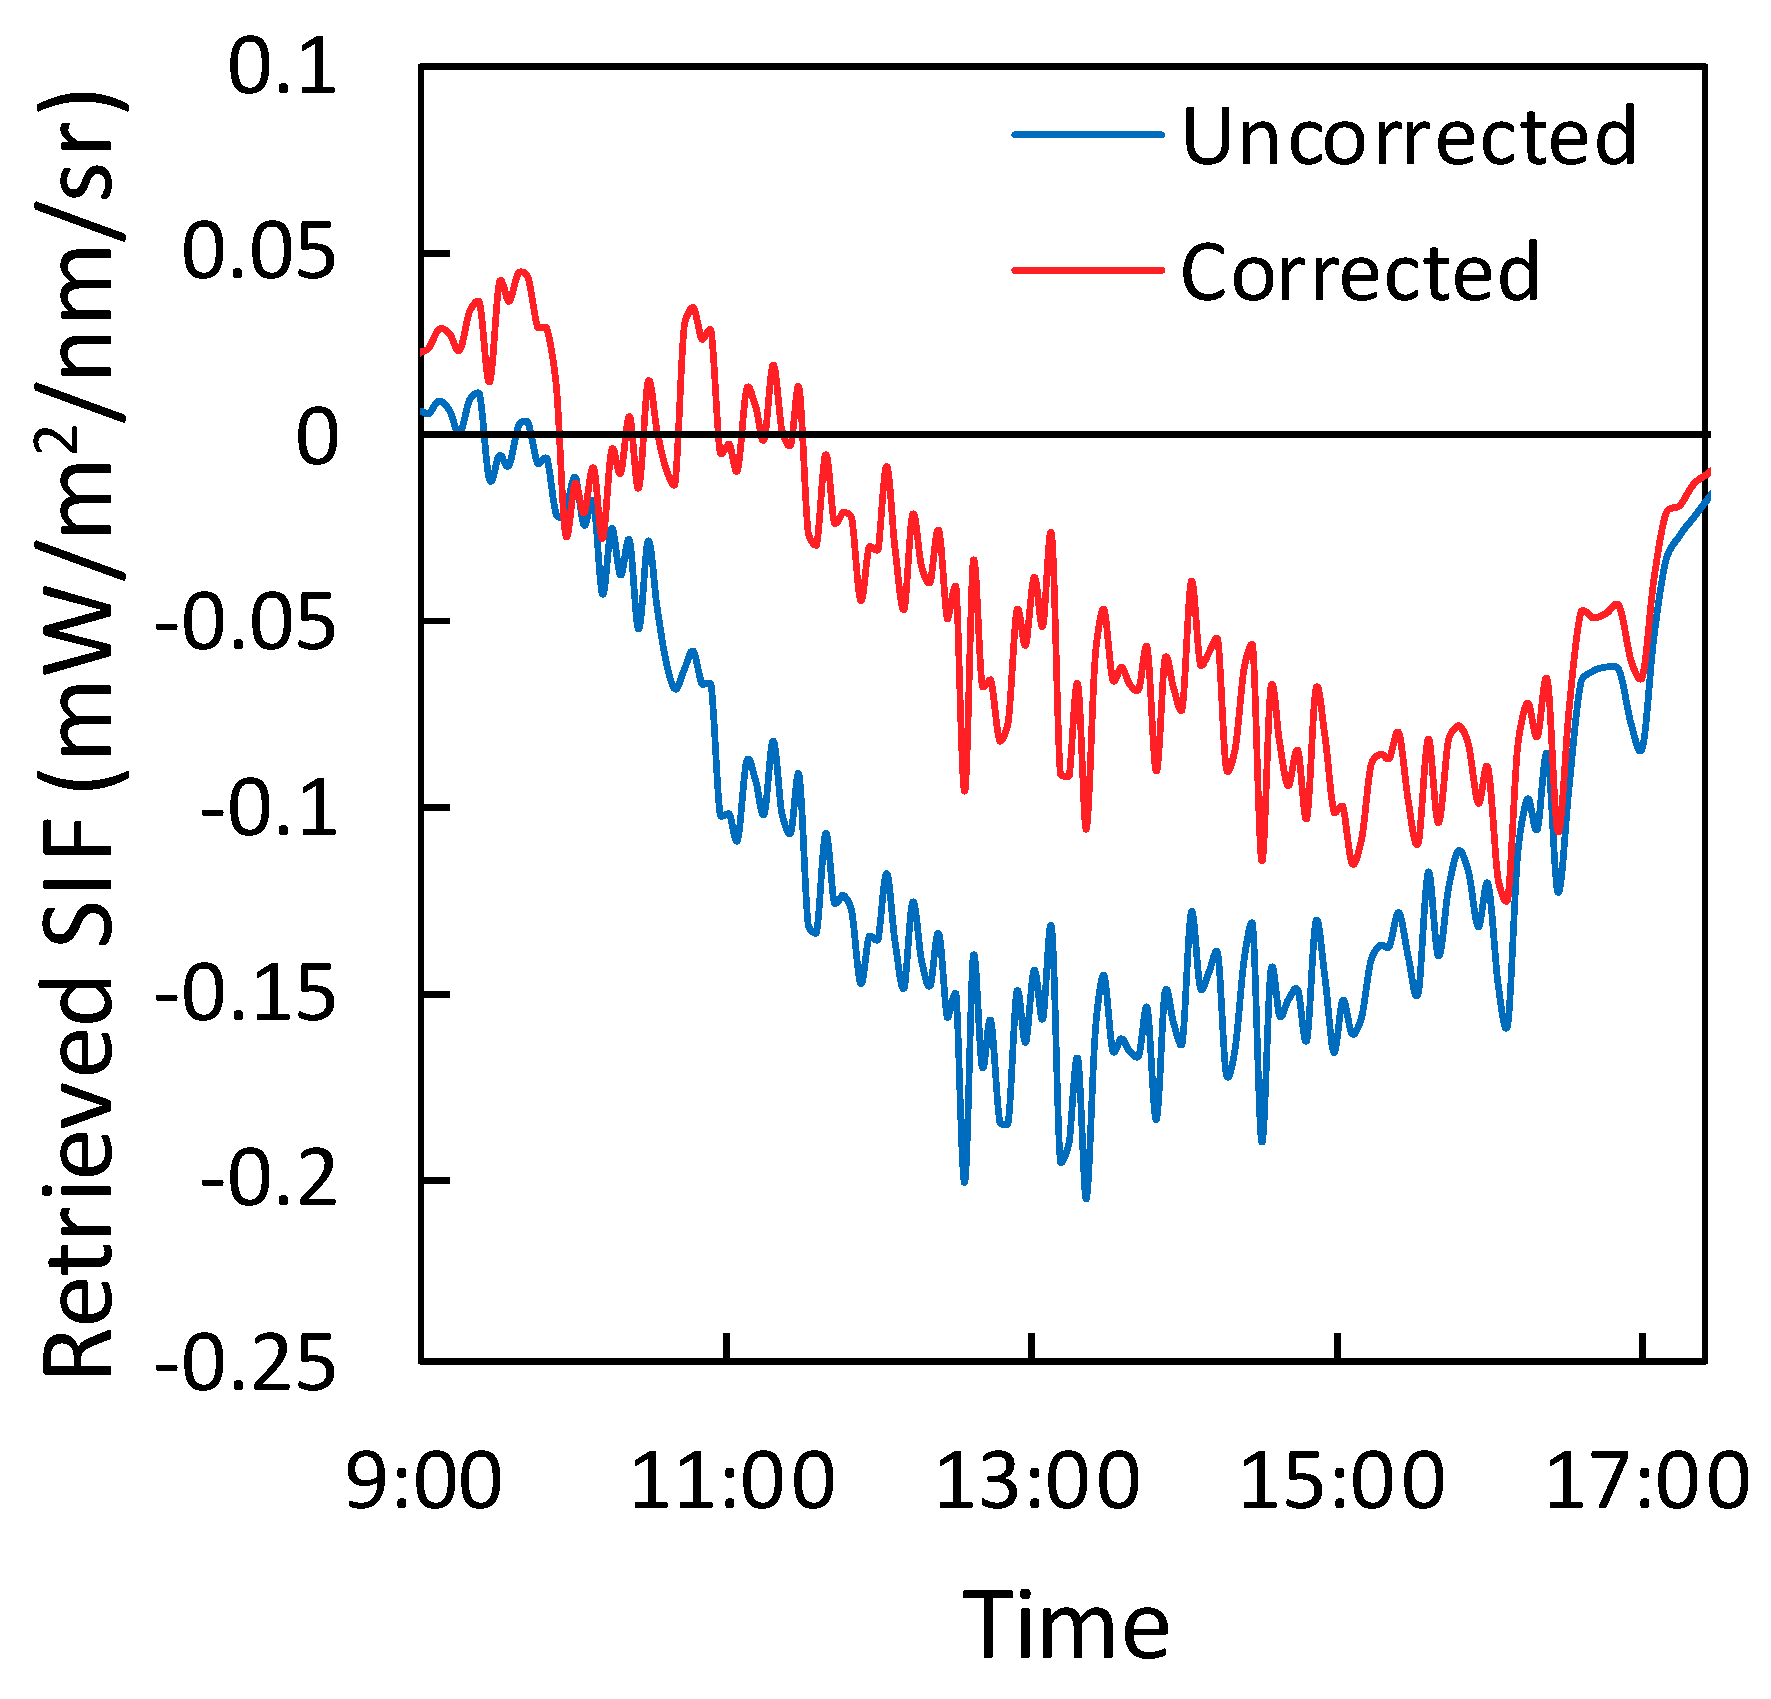
Figure 5 shows the SIF retrieval results at 760.6 nm from the observations of mature summer maize. As all the leaves had turned yellow, the SIF emission was expected to be zero. The SIF values retrieved from the tower-based observations without atmospheric correction form a “U” shape, decreasing from dawn to noon and increasing from noon to dusk. Most of the values are negative. After the atmospheric correction, the retrieved SIF values are still mostly negative (this is partly related to the so-called “direct radiation infilling effect” due to directional effect of the canopy reflectance, which is discussed in Section 4.1 but much closer to zero, which indicates that the atmospheric correction is effective.
3.2. Validation of the Atmospheric Correction Using Synchronous Tower-Based and Ground-Based Measurements
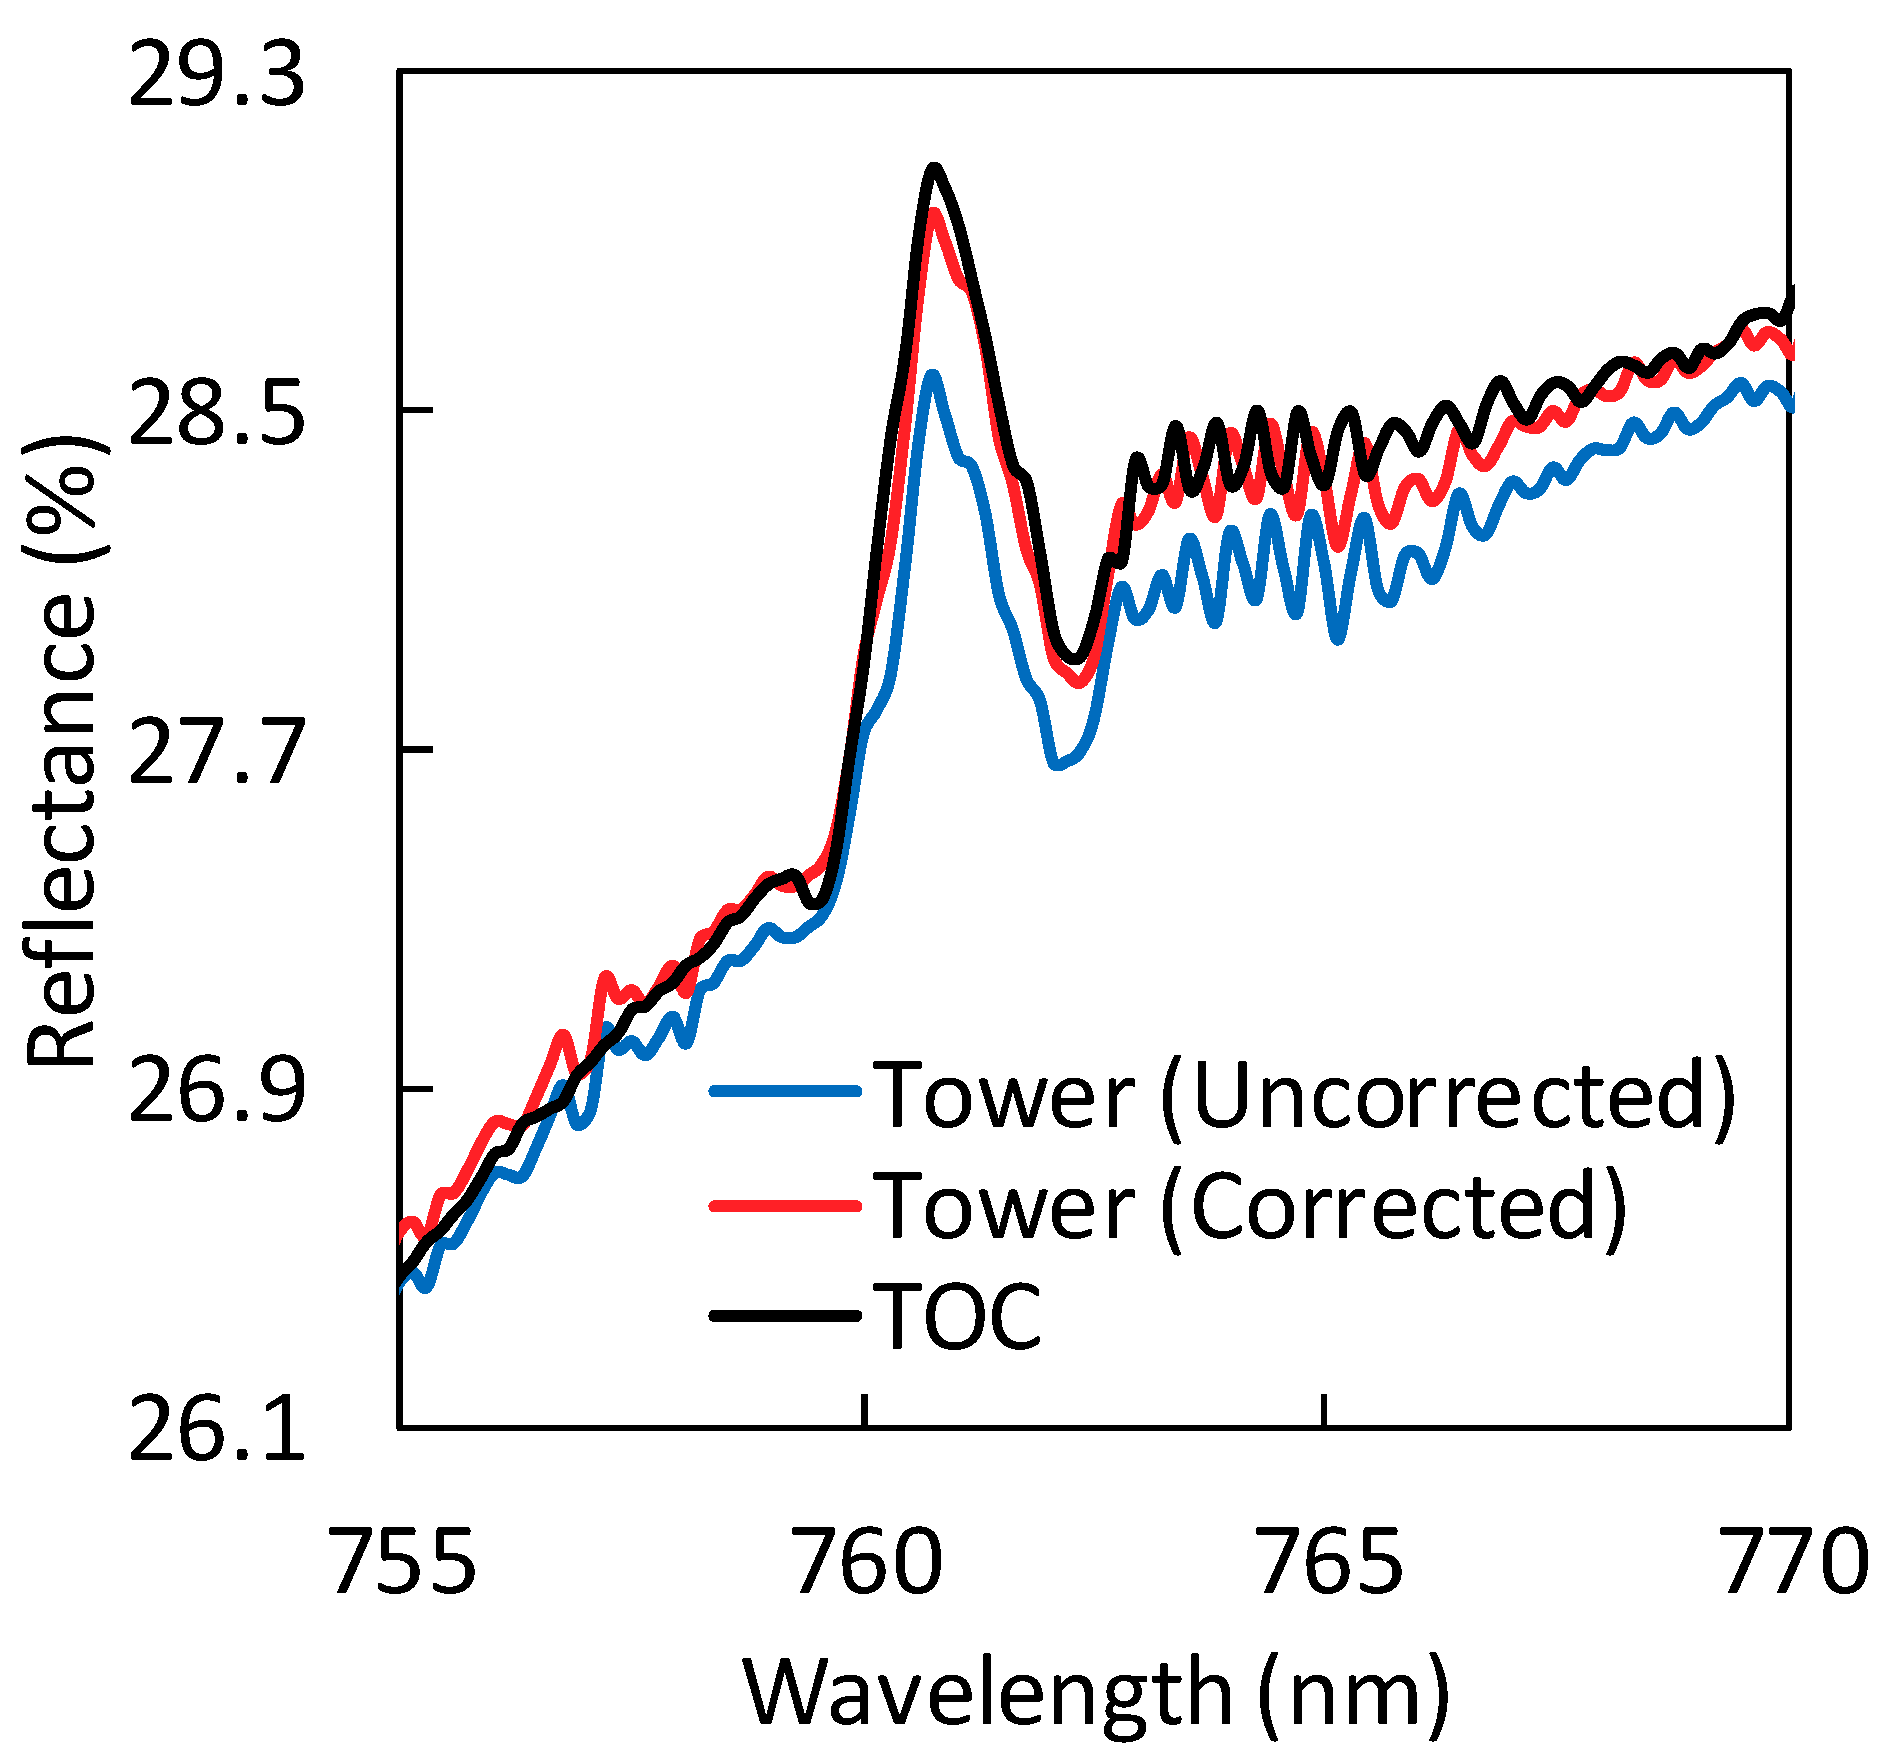
Figure 6 shows the apparent reflectance spectra at the O2-A band measured on the ground and measured on the tower with/without atmospheric correction. The peaks of the spectra are mainly caused by the SIF in-filling effect on the O2-A absorption feature. As shown in Figure 6, the peak of the spectrum measured on the tower without atmospheric correction is lower than that of the spectrum measured on the ground. After atmospheric correction, the peak of the spectrum measured on the tower is close to that of the spectrum measured on the ground. The results indicate that the atmospheric correction for tower-based SIF measurements is necessary and efficient.
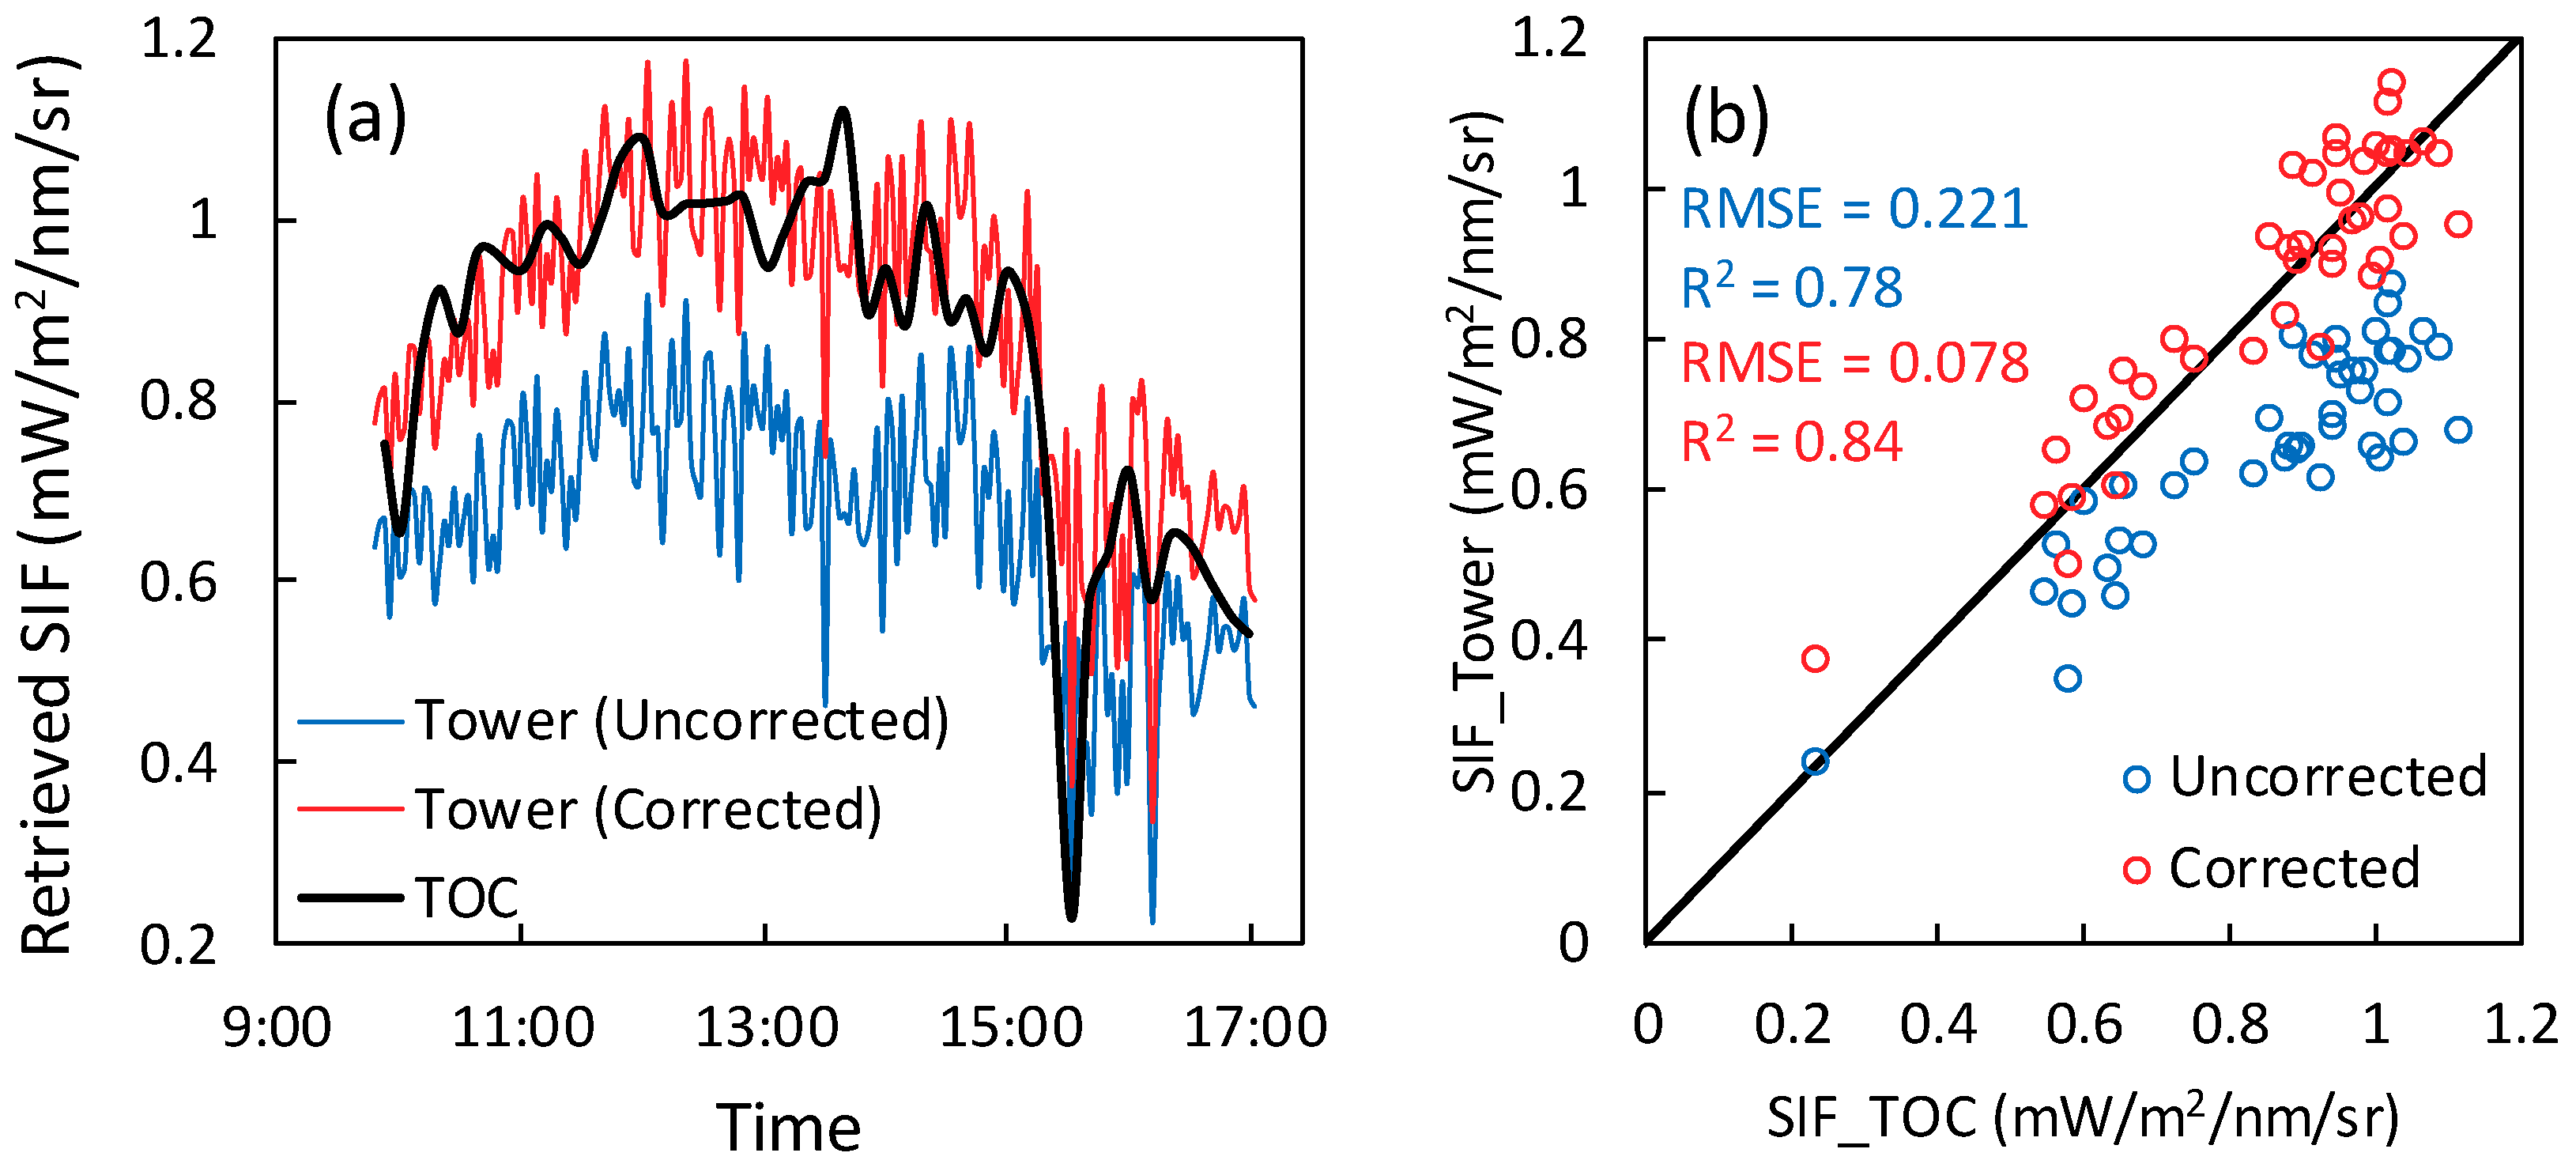
Figure 7 shows the results from the observations of summer maize at the filling stage with green leaves. Observations were made synchronously from the tower and on the ground. Figure 7a shows that for the O2-A band, the SIF values retrieved from the tower-based observations without atmospheric correction are obviously lower than the values retrieved from the ground-based observations. After the atmospheric correction, the retrieved SIF at the O2-A band matches well with the ground-based observations.
For quantitative analysis, the synchronous tower-based and ground-based observations with time lags of less than one minute were selected for comparison, as shown in Figure 7b. For the O2-A band, the data for the SIF from the tower-based observations after atmospheric correction are all close to the 1:1 line, the root-mean-square error (RMSE) between the tower-based and ground-based observations decreases from 0.221 to 0.078 mW/m2/nm/sr, and the coefficient of determination (R2) increases from 0.78 to 0.84. These results indicate that the performance of the atmospheric correction method proposed in this study is satisfactory for the O2-A band.
4. Discussion
4.1. Influence of the Direct Radiation Infilling Effect on the SIF Retrieval
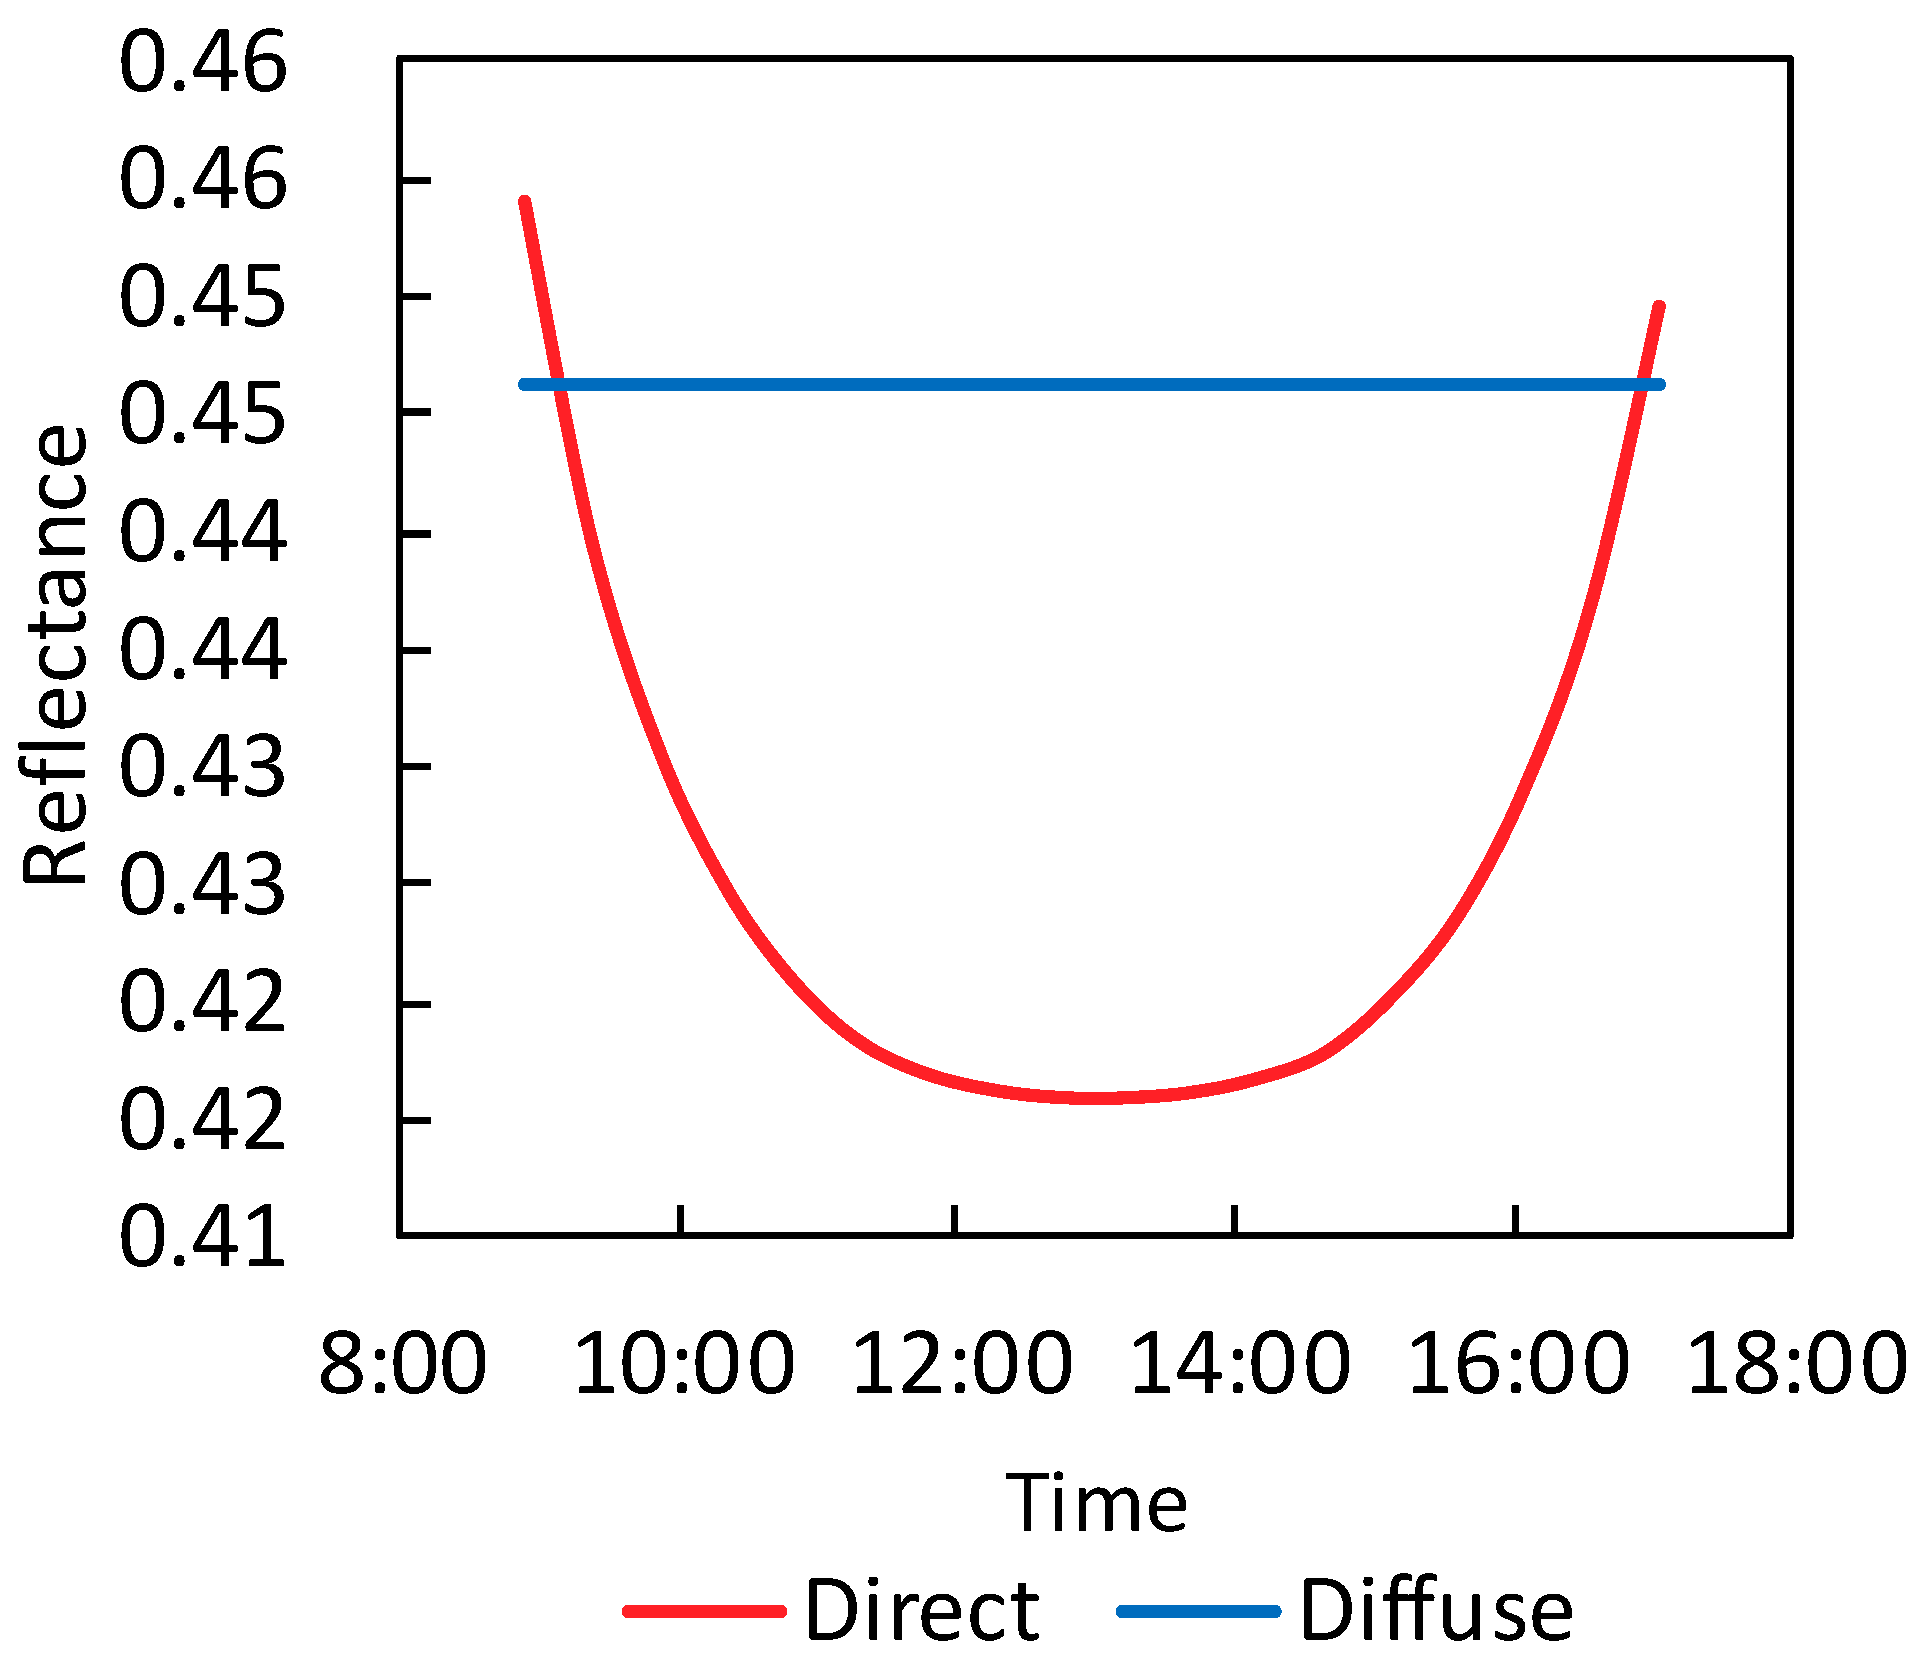
As mentioned in Section 3.2, the diurnal variation in the atmospherically corrected SIF still shows a “U” shape, with negative values at noon. This is partly due to the so-called “direct radiation infilling effect”, which was analyzed by Liu et al. [37]. Damm et al. [38] also pointed out that changes in the sun and observation geometry and in atmospheric properties have a significant influence on the reflectance spectra and, consequently, on SIF retrieval. According to the study by Liu et al. [37], the “direct radiation infilling effect” is proportional to the difference between the direct and diffuse radiation reflectance. Therefore, we simulated the diurnal variation in the direct and diffuse radiation canopy reflectance using the Soil Canopy Observation, Photochemistry and Energy fluxes (SCOPE) model [39], as shown in Figure 8. Here, the Leaf Area Index (LAI) was set to be 4 and the leaf inclination distribution function (LIDF) was spherical. The diffuse radiation canopy reflectance is constant during the day, while the direct radiation reflectance shows a “U” shape and most values are lower than the diffuse reflectance. According to Liu et al. [37], the lower reflectance for the direct radiation will lead to a negative “infilling” effect at the oxygen absorption bands, which can partly explain the “U” shape of the diurnal variation and also the negative values of the retrieved SIF for a mature maize canopy.
4.2. Uncertainties in MODTRAN Simulations and Field Measurements
In this study, the estimates of the atmosphere transmittances were based on the MODTRAN simulations. Therefore, the reliability of the results is directly related to the accuracy of the MODTRAN simulations. Although MODTRAN has been widely used for the modelling of atmospheric radiative transfer, in the case of this study, there are some uncertainties.
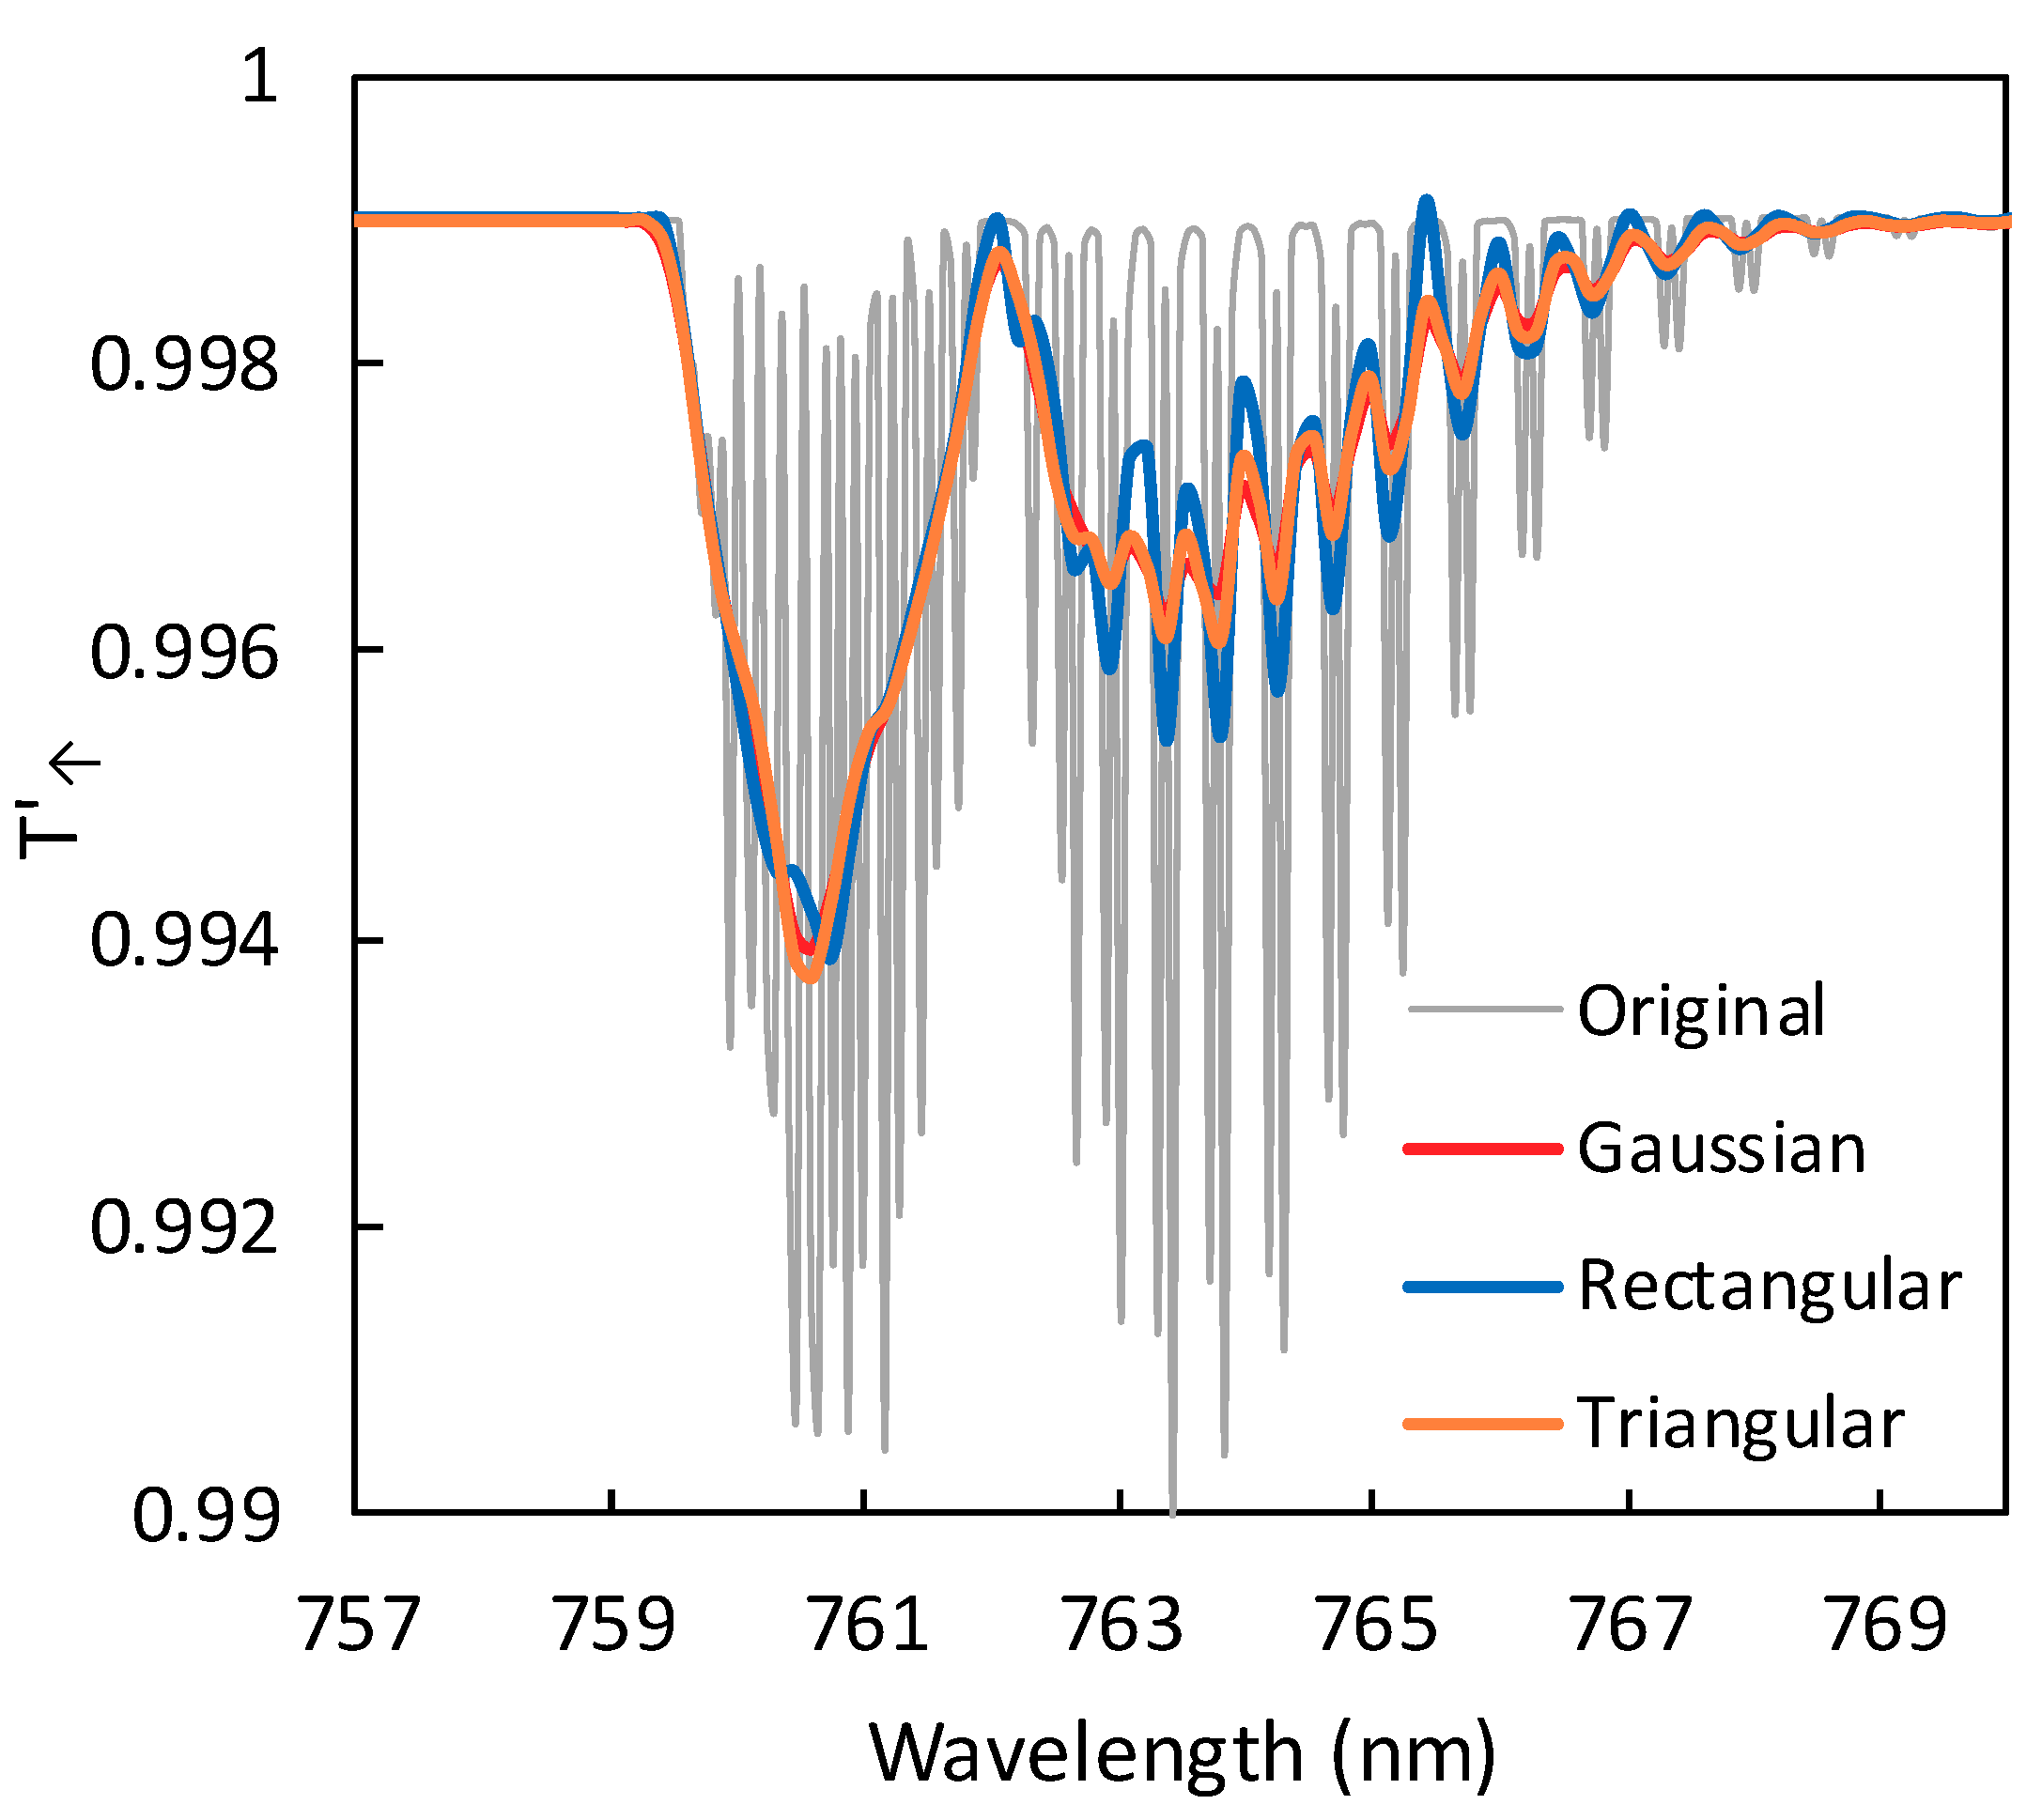
First, to match with the observations, the MODTRAN simulations need to be convolved with the ISRF of the specific spectrometers used. In this study, a Gaussian function with an FWHM of 0.31 nm was used as the ISRF for the Ocean Optic QE pro spectrometer. The difference between the Gaussian function and the real ISRF will lead to some error in the simulated atmosphere transmittances. But as the spectral resolution of the spectrometer is high and the O2-A absorption band is relatively wide, the uncertainties related to FWHM should be ignorable. Figure 9 shows the MODTRAN simulated up-welling transmittance convolved with Gaussian, rectangular, and triangular ISRF with an FWHM of 0.31 nm and resampled with spectral interval of 0.155 nm (Sensor height = 25 m, Surface elevation = 1.5 km, VZA = 25°, AOD550 = 0.1). For this case, the transmittances convolved by Gaussian, rectangular, and triangular functions at 760.6 nm are 0.9939, 0.9941, and 0.9937, respectively. The results indicate that the difference of transmittance caused by the ISRF is less than 0.04%, which is very tiny. The mismatch between the spectral sampling of simulations and observations may also lead to uncertainties in the estimation of atmospheric transmittances. Secondly, for tower-based SIF observations, the RTPL is relatively short and the atmospheric absorption effect is relatively weak, which means that accurate radiative transfer modelling is required. MODTRAN has been widely used and is regarded as a highly accurate radiative transfer model [31,40,41], and the LUT-based method used in this study could also improve the robust of the estimation of transmittance.
In this study, synchronous measurements on the ground and on the tower were carried out to validate the results of atmospheric correction. Although the two spectrometers were with very similar configurations and had been cross-calibrated, there could still be mismatch between the measurements by the two spectrometers. Besides, the footprints of the tower-based and ground-based measurements were somewhat different due to the different height of sensors. But as the surface as relatively homogeneous and the canopy was closed, it is reasonable to ignore the influence by different footprints. In addition, although the tower-based measurements of downwelling and upwelling radiance were conducted with the same spectrometer, two fibers were used (see Figure 3). The two fibers were connected to the same spectrometer using a Y-shaped assembly. So there can be slight difference in the light path of the downwelling and upwelling radiance, consequently leading to some spectral shift. Damm et al. [42] pointed out that the spectral shift has an obvious influence on FLD-based SIF retrieval.
Figure 10 shows the downwelling and upwelling radiance at O2-A band measured on the ground and on the tower (without atmospheric correction) at 13:01 on 7 September 2018, at the Daman site. The results show that the amplitude of the downwelling and upwelling radiance measured on the ground and on the tower can match quite well, and no obvious wavelength shift can be observed. Therefore, the comparison between tower-based and ground-based measurement is reliable.
Although the uncertainties in field measurements are unavoidable, the results in Figure 5 (validation using measurements on non-fluorescent canopy) and Figure 5 (validation using synchronous tower-based and ground-based measurements) show some consistency. In theory, the atmospheric absorption effect would lead to underestimation in SIF retrieval. Moreover, the results in both Figure 5 and Figure 7 show that the retrieved SIF increased after the atmospheric correction, which means the underestimation is successfully corrected. The consistency confirms that the atmospheric correction method proposed in this study is efficient.
4.3. Influence of Spectral Resolution on Transmittances
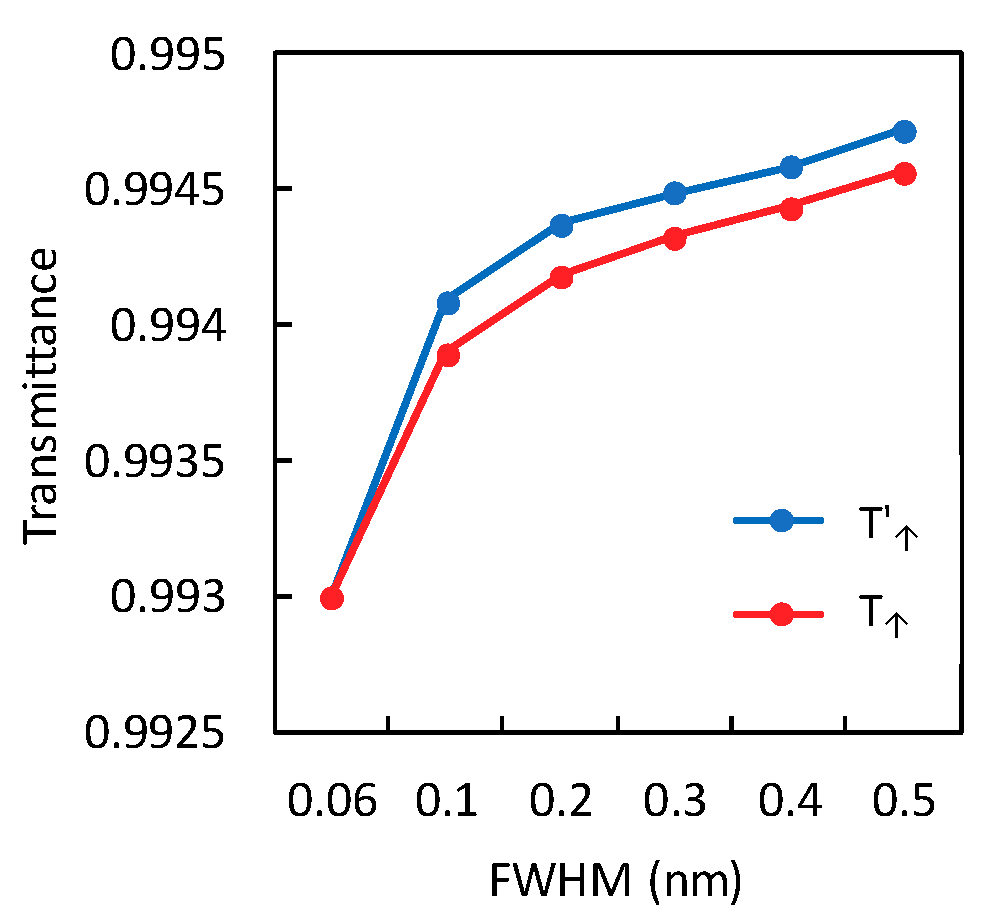
The absorption depth is related to the spectral resolution of the data. In this study, the irradiance and radiance were originally simulated with FWHM of 1 cm−1 (about 0.06 nm at 760 nm) by MODTRAN. To investigate the influence of spectral resolution on transmittance, the original spectra were convolved with a series of Gaussian functions with different FWHM (from 0.06 nm to 0.5 nm) to calculate the transmittances.
Figure 11 shows the upward atmosphere transmittances at 760.6 nm from MODTRAN simulations with different FWHM under a fixed atmospheric condition (mid-latitude summer profile, AOD550 = 0.1, VZA = 25°, sensor’s height is 25 m, and surface altitude is 1.5 km). The transmittances were calculated two ways: <Lsensor/Lcanopy> ( red points) and <Lsensor>/<Lcanopy> (, blue points). The results show that the transmittance inside the O2-A absorption band increases with the decrease of spectral resolution, and the difference between <Lsensor/Lcanopy> and <Lsensor>/<Lcanopy> is obvious.
This study aims to provide a simple and operational resolution for the process of tower-based measurements. The look-up tables were generated using data with the same spectral resolution of the spectrometers we used for field measurement. For application on different spectrometers, the specific dataset with corresponding spectral resolution was suggested to be simulated.
5. Conclusions
Tower-based SIF observations are important in the field of SIF retrieval and applications, especially for a better understanding of the relationship between SIF and GPP. However, the strong absorption effect at the oxygen absorption bands has an obvious influence on the SIF retrieval. This means that atmospheric correction is required, even for tower-based SIF observations made from a sensor at a height of tens of meters.
In this study, we analyzed the effects of atmospheric radiative transfer on tower-based SIF observations for both downwelling irradiance and upwelling radiance, and proposed an operational solution for atmospheric correction of tower-based SIF observations at the O2-A band. The aerosol optical depth (AOD) and radiative transfer path length (RTPL) were found to be the main factors influencing the transmittance at the oxygen absorption band. Consequently, LUTs based on MODTRAN simulations were established for the estimating the upward and downward atmosphere transmittances from the TOC to the height of the tower-based sensor. The RTPL (the ratio of the irradiance at 790 nm to that at 660 nm), the temperature, and pressure were required input parameters.
According to the results of the field experiments, the atmospheric correction based on LUTs produced more accurate tower-based SIF retrieval at the O2-A band. For observations of a mature summer maize canopy with no SIF emission, the retrieved SIF values after atmospheric correction were closer to zero than those without atmospheric correction. The negative SIF values found were partly due to the so-called “direct radiation infilling” effect. For observations of a green summer maize canopy, the SIF values retrieved from tower-based observations with atmospheric correction matched well with the synchronous retrievals from ground-based observations. The RMSE between the SIF values retrieved from tower-based and ground-based observations decreased from 0.221 to 0.078 mW/m2/nm/sr after the atmospheric correction. The results also indicated that the atmospheric correction for tower-based SIF measurements is important for the O2-A band due to the strong oxygen absorption effect.
Author Contributions
Conceptualization, X.L. and L.L.; methodology, X.L. and J.H.; software, J.G.; validation, J.G. and J.H.; formal analysis, X.L., J.G., and J.H.; investigation, X.L. and J.G.; resources, J.G.; data curation, J.G.; writing—original draft preparation, X.L.; writing—review and editing, L.L.; visualization, X.L.; supervision, L.L.
Funding
This research was funded by the National Key Research and Development Program of China, grant number 2017YFC0503803, and the National Natural Science Foundation of China, grant number 41701396 and 41871239.
Conflicts of Interest
The authors declare no conflict of interest.
References
- Porcar-Castell, A.; Tyystjärvi, E.; Atherton, J.; van der Tol, C.; Flexas, J.; Pfündel, E.E.; Moreno, J.; Frankenberg, C.; Berry, J.A. Linking chlorophyll a fluorescence to photosynthesis for remote sensing applications: Mechanisms and challenges. J. Exp. Bot. 2014, 65, 4065–4095. [Google Scholar] [CrossRef] [PubMed]
- Grossmann, K.; Frankenberg, C.; Magney, T.S.; Hurlock, S.C.; Seibt, U.; Stutz, J. PhotoSpec: A new instrument to measure spatially distributed red and far-red Solar-Induced Chlorophyll Fluorescence. Remote Sens. Environ. 2018, 216, 311–327. [Google Scholar] [CrossRef]
- Liu, L.Y.; Zhang, Y.J.; Wang, J.H.; Zhao, C.J. Detecting solar-induced chlorophyll fluorescence from field radiance spectra based on the fraunhofer line principle. IEEE Trans. Geosci. Remote Sens. 2005, 43, 827–832. [Google Scholar]
- Liu, L.; Liu, X.; Hu, J.; Guan, L. Assessing the wavelength-dependent ability of solar-induced chlorophyll fluorescence to estimate the gpp of winter wheat at the canopy level. Int. J. Remote Sens. 2017, 38, 4396–4417. [Google Scholar] [CrossRef]
- Liu, X.; Liu, L. Improving chlorophyll fluorescence retrieval using reflectance reconstruction based on principal components analysis. IEEE Geosci. Remote Sens. Lett. 2015, 12, 1645–1649. [Google Scholar]
- Yang, X.; Tang, J.; Mustard, J.F.; Lee, J.-E.; Rossini, M.; Joiner, J.; Munger, J.W.; Kornfeld, A.; Richardson, A.D. Solar-induced chlorophyll fluorescence correlates with canopy photosynthesis on diurnal and seasonal scales in a temperate deciduous forest. Geophys. Res. Lett. 2015, 2015, GL063201. [Google Scholar] [CrossRef]
- Cogliati, S.; Rossini, M.; Julitta, T.; Meroni, M.; Schickling, A.; Burkart, A.; Pinto, F.; Rascher, U.; Colombo, R. Continuous and long-term measurements of reflectance and sun-induced chlorophyll fluorescence by using novel automated field spectroscopy systems. Remote Sens. Environ. 2015, 164, 270–281. [Google Scholar] [CrossRef]
- Burkart, A.; Schickling, A.; Mateo, M.P.C.; Wrobel, T.J.; Rossini, M.; Cogliati, S.; Julitta, T.; Rascher, U. A method for uncertainty assessment of passive sun-induced chlorophyll fluorescence retrieval using an infrared reference light. IEEE Sens. J. 2015, 15, 4603–4611. [Google Scholar] [CrossRef]
- Damm, A.; Guanter, L.; Laurent, V.C.E.; Schaepman, M.E.; Schickling, A.; Rascher, U. Fld-based retrieval of sun-induced chlorophyll fluorescence from medium spectral resolution airborne spectroscopy data. Remote Sens. Environ. 2014, 147, 256–266. [Google Scholar] [CrossRef]
- Rascher, U.; Alonso, L.; Burkart, A.; Cilia, C.; Cogliati, S.; Colombo, R.; Damm, A.; Drusch, M.; Guanter, L.; Hanus, J. Sun-induced fluorescence—A new probe of photosynthesis: First maps from the imaging spectrometer hyplant. Glob. Chang. Biol. 2015, 21, 4673–4684. [Google Scholar] [CrossRef]
- Wieneke, S.; Ahrends, H.; Damm, A.; Pinto, F.; Stadler, A.; Rossini, M.; Rascher, U. Airborne based spectroscopy of red and far-red sun-induced chlorophyll fluorescence: Implications for improved estimates of gross primary productivity. Remote Sens. Environ. 2016, 184, 654–667. [Google Scholar] [CrossRef] [Green Version]
- Frankenberg, C.; Butz, A.; Toon, G.C. Disentangling chlorophyll fluorescence from atmospheric scattering effects in o2a-band spectra of reflected sun-light. Geophys. Res. Lett. 2011, 38. [Google Scholar] [CrossRef]
- Guanter, L.; Frankenberg, C.; Dudhia, A.; Lewis, P.E.; Gómez-Dans, J.; Kuze, A.; Suto, H.; Grainger, R.G. Retrieval and global assessment of terrestrial chlorophyll fluorescence from gosat space measurements. Remote Sens. Environ. 2012, 121, 236–251. [Google Scholar] [CrossRef]
- Joiner, J.; Yoshida, Y.; Vasilkov, A.P.; Corp, L.A.; Middleton, E.M. First observations of global and seasonal terrestrial chlorophyll fluorescence from space. Biogeosciences 2011, 8, 637–651. [Google Scholar] [CrossRef] [Green Version]
- Joiner, J.; Guanter, L.; Lindstrot, R.; Voigt, M.; Vasilkov, A.P.; Middleton, E.M.; Huemmrich, K.F.; Yoshida, Y.; Frankenberg, C. Global monitoring of terrestrial chlorophyll fluorescence from moderate spectral resolution near-infrared satellite measurements: Methodology, simulations, and application to gome-2. Atmos. Measur. Tech. 2013, 6, 2803–2823. [Google Scholar] [CrossRef]
- Guanter, L.; Zhang, Y.; Jung, M.; Joiner, J.; Voigt, M.; Berry, J.A.; Frankenberg, C.; Huete, A.R.; Zarco-Tejada, P.; Lee, J.-E. Global and time-resolved monitoring of crop photosynthesis with chlorophyll fluorescence. Proc. Natl. Acad. Sci. USA 2014, 201320008. [Google Scholar] [CrossRef] [PubMed]
- Zhang, Y.; Guanter, L.; Berry, J.A.; van der Tol, C.; Yang, X.; Tang, J.; Zhang, F. Model-based analysis of the relationship between sun-induced chlorophyll fluorescence and gross primary production for remote sensing applications. Remote Sens. Environ. 2016, 187, 145–155. [Google Scholar] [CrossRef]
- Migliavacca, M.; Perez-Priego, O.; Rossini, M.; El-Madany, T.S.; Moreno, G.; van der Tol, C.; Rascher, U.; Berninger, A.; Bessenbacher, V.; Burkart, A. Plant functional traits and canopy structure control the relationship between photosynthetic co2 uptake and far-red sun-induced fluorescence in a mediterranean grassland under different nutrient availability. New Phytol. 2017, 214, 1078–1091. [Google Scholar] [CrossRef] [PubMed]
- Sun, Y.; Frankenberg, C.; Wood, J.D.; Schimel, D.; Jung, M.; Guanter, L.; Drewry, D.; Verma, M.; Porcar-Castell, A.; Griffis, T.J. Oco-2 advances photosynthesis observation from space via solar-induced chlorophyll fluorescence. Science 2017, 358, eaam5747. [Google Scholar] [CrossRef] [PubMed]
- Baldocchi, D. ‘Breathing’ of the terrestrial biosphere: Lessons learned from a global network of carbon dioxide flux measurement systems. Aust. J. Bot. 2008, 56, 1–26. [Google Scholar] [CrossRef]
- Bresciani, M.; Rossini, M.; Morabito, G.; Matta, E.; Pinardi, M.; Cogliati, S.; Julitta, T.; Colombo, R.; Braga, F.; Giardino, C. Analysis of within- and between-day chlorophyll-a dynamics in mantua superior lake, with a continuous spectroradiometric measurement. Mar. Freshw. Res. 2013, 64, 303–316. [Google Scholar] [CrossRef]
- Meroni, M.; Barducci, A.; Cogliati, S.; Castagnoli, F.; Rossini, M.; Busetto, L.; Migliavacca, M.; Cremonese, E.; Galvagno, M.; Colombo, R. The hyperspectral irradiometer, a new instrument for long-term and unattended field spectroscopy measurements. Rev. Sci. Instrum. 2011, 82, 043106. [Google Scholar] [CrossRef] [PubMed]
- Rossini, M.; Cogliati, S.; Meroni, M.; Migliavacca, M.; Galvagno, M.; Busetto, L.; Cremonese, E.; Julitta, T.; Siniscalco, C.; Morra di Cella, U. Remote sensing-based estimation of gross primary production in a subalpine grassland. Biogeosciences 2012, 9, 2565–2584. [Google Scholar] [CrossRef] [Green Version]
- Rossini, M.; Migliavacca, M.; Galvagno, M.; Meroni, M.; Cogliati, S.; Cremonese, E.; Fava, F.; Gitelson, A.; Julitta, T.; Cella, U.M.D. Remote estimation of grassland gross primary production during extreme meteorological seasons. Int. J. Appl. Earth Observat. Geoinf. 2014, 29, 1–10. [Google Scholar] [CrossRef]
- Daumard, F.; Champagne, S.; Fournier, A.; Goulas, Y.; Ounis, A.; Hanocq, J.F.; Moya, I. A field platform for continuous measurement of canopy fluorescence. IEEE Trans. Geosci. Remote Sens. 2010, 48, 3358–3368. [Google Scholar] [CrossRef]
- Drolet, G.; Wade, T.; Nichol, C.J.; MacLellan, C.; Levula, J.; Porcar-Castell, A.; Nikinmaa, E.; Vesala, T. A temperature-controlled spectrometer system for continuous and unattended measurements of canopy spectral radiance and reflectance. Int. J. Remote Sens. 2014, 35, 1769–1785. [Google Scholar] [CrossRef]
- Zhang, Y.; Wang, S.; Liu, L.; Ju, W.; Zhu, X. Chinaspec: A Network of Sif Observations to Bridge Flux Measurements and Remote Sensing Data. In Proceedings of the AGU Fall Meeting, New Orleans, LA, USA, 11–15 December 2017. [Google Scholar]
- Liu, X.; Liu, L. Assessing band sensitivity to atmospheric radiation transfer for space-based retrieval of solar-induced chlorophyll fluorescence. Remote Sens. 2014, 6, 10656–10675. [Google Scholar] [CrossRef]
- Liu, X.; Liu, L.; Hu, J.; Du, S. Modeling the footprint and equivalent radiance transfer path length for tower-based hemispherical observations of chlorophyll fluorescence. Sensors 2017, 17, 1131. [Google Scholar] [CrossRef]
- Sabater, N.; Vicent, J.; Alonso, L.; Verrelst, J.; Middleton, E.; Porcar-Castell, A.; Moreno, J. Compensation of oxygen transmittance effects for proximal sensing retrieval of canopy–leaving sun–induced chlorophyll fluorescence. Remote Sens. 2018, 10, 1551. [Google Scholar] [CrossRef]
- Berk, A.; Anderson, G.P.; Acharya, P.K.; Bernstein, L.S.; Muratov, L.; Lee, J.; Fox, M.; Adler-Golden, S.M.; Chetwynd, J.H.; Hoke, M.L.; et al. Modtran (tm) 5, a Reformulated Atmospheric Band Model with Auxiliary Species and Practical Multiple Scattering Options. In Algorithms and Technologies for Multispectral, Hyperspectral, and Ultraspectral Imagery Xi; Shen, S.S., Lewis, P.E., Eds.; International Society for Optics and Photonics: Bellingham, WA, USA, 2005; Volume 5806, pp. 662–667. [Google Scholar]
- Sabater, N.; Vicent, J.; Alonso, L.; Cogliati, S.; Verrelst, J.; Moreno, J. Impact of atmospheric inversion effects on solar-induced chlorophyll fluorescence: Exploitation of the apparent reflectance as a quality indicator. Remote Sens. 2017, 9, 622. [Google Scholar] [CrossRef]
- Pierluissi, J.H.; Maragoudakis, C.E. Molecular transmittance band model for oxygen in thevisible. Appl. Opt. 1986, 25, 2458–2460. [Google Scholar] [CrossRef] [PubMed]
- Plascyk, J.A. The mk ii fraunhofer line discriminator (fld-ii) for airborne and orbital remote sensing of solar-stimulated luminescence. Opt. Eng. 1975, 14, 339–346. [Google Scholar] [CrossRef]
- Maier, S.W.; Günther, K.P.; Stellmes, M. Sun-induced fluorescence: A new tool for precision farming. In Digital Imaging and Spectral Techniques: Applications to Precision Agriculture and Crop Physiology; McDonald, M., Schepers, J., Tartly, L., Toai, T.v., Major, D., Eds.; American Society of Agronomy Special Publication: Madison, WI, USA, 2003; pp. 209–222. [Google Scholar]
- Alonso, L.; Gomez-Chova, L.; Vila-Frances, J.; Amoros-Lopez, J.; Guanter, L.; Calpe, J.; Moreno, J. Improved fraunhofer line discrimination method for vegetation fluorescence quantification. IEEE Geosci. Remote Sens. Lett. 2008, 5, 620–624. [Google Scholar] [CrossRef]
- Liu, X.; Liu, L. Influence of the canopy brdf characteristics and illumination conditions on the retrieval of solar-induced chlorophyll fluorescence. Int. J. Remote Sens. 2018, 39, 1782–1799. [Google Scholar] [CrossRef]
- Damm, A.; Guanter, L.; Verhoef, W.; Schläpfer, D.; Garbari, S.; Schaepman, M.E. Impact of varying irradiance on vegetation indices and chlorophyll fluorescence derived from spectroscopy data. Remote Sens. Environ. 2015, 156, 202–215. [Google Scholar] [CrossRef]
- Van der Tol, C.; Verhoef, W.; Timmermans, J.; Verhoef, A.; Su, Z. An integrated model of soil-canopy spectral radiances, photosynthesis, fluorescence, temperature and energy balance. Biogeosciences 2009, 6, 3109–3129. [Google Scholar] [CrossRef] [Green Version]
- Berk, A.; Acharya, P.; Anderson, G.; Gossage, B. Recent developments in the MODTRAN® atmospheric model and implications for hyperspectral compensation. In Proceedings of 2009 IEEE International Geoscience and Remote Sensing Symposium (IGARSS 2009), Cape Town, South Africa, 12–17 July 2009; pp. II-262–II-266. [Google Scholar]
- Berk, A.; Hawes, F. Validation of MODTRAN® 6 and its line-by-line algorithm. J. Quant. Spectrosc. Radiat. Transfer 2017, 203, 542–556. [Google Scholar] [CrossRef]
- Damm, A.; Erler, A.; Hillen, W.; Meroni, M.; Schaepman, M.E.; Verhoef, W.; Rascher, U. Modeling the impact of spectral sensor configurations on the fld retrieval accuracy of sun-induced chlorophyll fluorescence. Remote Sens. Environ. 2011, 115, 1882–1892. [Google Scholar] [CrossRef]
Figure 1.
Relationships between the aerosol optical depth (AOD), radiative transfer path length (RTPL), and the upward/downward atmospheric transmittance for a fixed elevation and atmospheric profile at the 760.6 nm (O2-A band) and 757.8 nm (shoulder of the O2-A band) based on the simulations made by MODTRAN 5. The spectral resolution is 0.31 nm. The mid-latitude summer atmospheric profile was used and the altitude was set as 1.5 km.

Figure 2.
The relationship between AOD550 and the ratio of the irradiance at 790 nm to that at 660 nm (E790/E660) based on the MODTRAN simulations for different solar zenith angles.
Figure 2.
The relationship between AOD550 and the ratio of the irradiance at 790 nm to that at 660 nm (E790/E660) based on the MODTRAN simulations for different solar zenith angles.

Figure 3.
Illustration of the tower-based automatic spectral observation system.

Figure 4.
Illustration of the bands used in 3FLD method for solar-induced chlorophyll fluorescence (SIF) retrieval in this study. The vertical dash lines shows the spectral position of the bands at the left of, inside, and at the right of the O2-A absorption feature.
Figure 4.
Illustration of the bands used in 3FLD method for solar-induced chlorophyll fluorescence (SIF) retrieval in this study. The vertical dash lines shows the spectral position of the bands at the left of, inside, and at the right of the O2-A absorption feature.

Figure 5.
Results for SIF retrieved from tower-based spectral observations made on mature summer maize with no green leaves (measured on 27 October 2017, at Daman site). The blue line shows the results without atmospheric correction; the red line shows the results with atmospheric correction.
Figure 5.
Results for SIF retrieved from tower-based spectral observations made on mature summer maize with no green leaves (measured on 27 October 2017, at Daman site). The blue line shows the results without atmospheric correction; the red line shows the results with atmospheric correction.

Figure 6.
Comparison of the apparent reflectance spectra at O2-A band measured on the ground and on the tower (with/without atmospheric correction) at 13:01 on 7 September 2018, at the Daman site.
Figure 6.
Comparison of the apparent reflectance spectra at O2-A band measured on the ground and on the tower (with/without atmospheric correction) at 13:01 on 7 September 2018, at the Daman site.

Figure 7.
Results of SIF retrieval from synchronous tower-based and ground-based spectral observations of summer maize at the filling stage (measured on 7 September 2018, at the Daman site). (a) Diurnal variation of SIF retrieved from tower-based observations before/after atmospheric correction, and from synchronous ground-based observations. (b) Relationship between the SIF values retrieved from synchronous ground-based observations and tower-based observations with and without atmospheric correction.

Figure 8.
Simulated diurnal variation in direct and diffuse radiation canopy reflectance at 760.6 nm using the Soil Canopy Observation, Photochemistry and Energy fluxes (SCOPE) model for an LAI of 4 and spherical leaf inclination distribution function (LIDF).
Figure 8.
Simulated diurnal variation in direct and diffuse radiation canopy reflectance at 760.6 nm using the Soil Canopy Observation, Photochemistry and Energy fluxes (SCOPE) model for an LAI of 4 and spherical leaf inclination distribution function (LIDF).

Figure 9.
MODTRAN simulated up-welling transmittance convolved with Gaussian, Rectangular and Triangular instrument spectral response function (ISRF) with a full-width at half maximum (FWHM) of 0.31 nm and resampled with spectral interval of 0.155 nm. The FWHM of the original simulation (grey line) is 1 cm−1 (~0.06 nm at 760 nm), the sensor height is 25 m, the surface elevation is 1.5 km, the view zenith angle (VZA) is 25°, and the AOD550 is 0.1.

Figure 10.
Downwelling and upwelling radiance at O2-A band measured on the ground and on the tower (without atmospheric correction) at 13:01 on 7 September 2018, at the Daman site.
Figure 10.
Downwelling and upwelling radiance at O2-A band measured on the ground and on the tower (without atmospheric correction) at 13:01 on 7 September 2018, at the Daman site.

Figure 11.
Upward atmospheric transmittances at 760.6 nm from MODTRAN simulations with different FWHM. The red points () are transmittances calculated as <Lsensor/Lcanopy>, and the blue points ( ) are transmittances calculated as <Lsensor>/<Lcanopy>. <> represents convolution with ISRF. The original FWHM of MODTRAN simulation is 1 cm−1 (about 0.06 nm at 760 nm), and the ISRF were modelled using Gaussian functions with different FWHM. The atmospheric profile is mid-latitude summer, AOD is 0.1, VZA is 25°, sensor’s height is 25 m, and surface altitude is 1.5 km.


Table 1.
Main input parameters for MODTRAN 5 simulations.
| Parameter | Description | Value/Range | Unit |
|---|---|---|---|
| SZA | Solar zenith angle | 0–70, in steps of 0.5 | degree |
| VZA | View zenith angle | 0–70, in steps of 0.5 | degree |
| Sensor height | Sensor height | 25 | m |
| Altitude | Surface elevation | 1.5 | km |
| Atmospheric profile | Atmospheric profile | Mid-latitude summer | - |
| AOD550 | Aerosol optical depth at 550 nm | 0.1–1.0, in steps of 0.1 | - |
| Aerosol model | Aerosol model | Rural | - |
| Reflectance | Surface reflectance | 0.5 | - |
| Band model | Band model algorithm | MODTRAN® correlated-k option | - |
| RT mode | Radiation transport mode of execution | Thermal plus Radiance | - |
| Multi-scattering | Program executes with multiple scattering | True | - |
| DISORT | DISORT discrete ordinate multiple scattering algorithm | True | - |
| Number of Streams | Number of streams to be used by DISORT | 8 | - |
© 2019 by the authors. Licensee MDPI, Basel, Switzerland. This article is an open access article distributed under the terms and conditions of the Creative Commons Attribution (CC BY) license (http://creativecommons.org/licenses/by/4.0/).
Share and Cite
MDPI and ACS Style
Liu, X.; Guo, J.; Hu, J.; Liu, L. Atmospheric Correction for Tower-Based Solar-Induced Chlorophyll Fluorescence Observations at O2-A Band. Remote Sens. 2019, 11, 355. https://doi.org/10.3390/rs11030355
AMA Style
Liu X, Guo J, Hu J, Liu L. Atmospheric Correction for Tower-Based Solar-Induced Chlorophyll Fluorescence Observations at O2-A Band. Remote Sensing. 2019; 11(3):355. https://doi.org/10.3390/rs11030355
Chicago/Turabian StyleLiu, Xinjie, Jian Guo, Jiaochan Hu, and Liangyun Liu. 2019. "Atmospheric Correction for Tower-Based Solar-Induced Chlorophyll Fluorescence Observations at O2-A Band" Remote Sensing 11, no. 3: 355. https://doi.org/10.3390/rs11030355
Note that from the first issue of 2016, this journal uses article numbers instead of page numbers. See further details here.