Remote Sensing for the Quantification of Land Surface Dynamics in Large River Delta Regions—A Review


1
German Remote Sensing Data Center (DFD), German Areaspace Center (DLR), Muenchener Strasse 20, D-82234 Wessling, Germany
2
Institute for Geography and Geology, University of Wuerzburg, Am Hubland, D-97074 Wuerzburg, Germany
3
Water Research Laboratory, School of Civil & Environmental Engineering, UNSW Sydney, NSW 2052, Australia
*
Author to whom correspondence should be addressed.
Remote Sens. 2019, 11(17), 1985; https://doi.org/10.3390/rs11171985
Submission received: 23 July 2019
/
Revised: 16 August 2019
/
Accepted: 19 August 2019
/
Published: 22 August 2019
(This article belongs to the Section Environmental Remote Sensing)
Abstract
:River deltas and estuaries belong to the most significant coastal landforms on our planet and are usually very densely populated. Nearly 600 million people live in river deltas, benefiting from the large variety of locational advantages and rich resources. Deltas are highly dynamic and vulnerable environments that are exposed to a wide range of natural and man-made threats. Sustainable management of river deltas therefore requires a holistic assessment of historic and recent ongoing changes and the dynamics in settlement sprawl, land cover and land use change, ecosystem development, as well as river and coastline geomorphology, all of which is difficult to achieve solely with traditional land-based surveying techniques. This review paper presents the potential of Earth Observation for analyses and quantification of land surface dynamics in the large river deltas globally, emphasizing the different geo-information products that can be derived from medium resolution, high resolution and highest resolution optical, multispectral, thermal and SAR data. Over 200 journal papers on remote sensing related studies for large river deltas and estuaries have been analyzed and categorized into thematic fields such as river course morphology, coastline changes, erosion and accretion processes, flood and inundation dynamics, regional land cover and land use dynamics, as well as the monitoring of compliance with respect to anthropogenic activity such as industry expansion-related habitat destruction. Additionally, our own exemplary analyses are interwoven into the review to visualize related delta work.
Keywords:
river deltas; delta; coasts; estuaries; Earth observation; remote sensing; review; flooding; land use; subsidence; stakeholder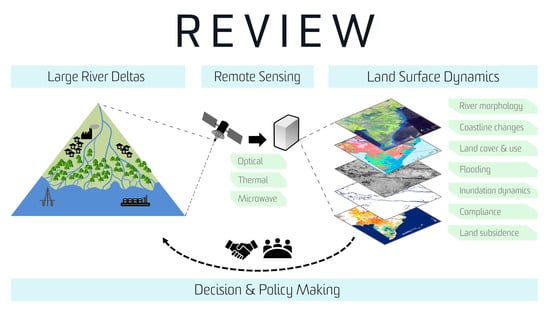
1. River Deltas: An Introduction
The coastal deltas of large rivers are not only the largest coastal landforms on our planet [1]; they are also among the most densely populated places on earth [2]. Although they only account for about 5% of the land surface, nearly 600 million delta inhabitants globally [3] benefit from a delta’s locational advantages, such as flat topography, fertile alluvial soils, access to freshwater and seawater, river and marine resources, eased waterway transportation, ice-free harbors and rich fauna and flora biodiversity in wetlands and marshes [2,4]. Hydrocarbon (oil and gas) and salt deposits in underground, compacted delta sediment layers are common [5,6], and the major deltas are often of strategic economic relevance for a complete nation. Be it the oil-rich and densely settled Mississippi Delta area and its hinterland in the USA, the bustling Pearl or Yangtze river deltas in China, the agriculturally highly productive Nile (Egypt) and Mekong deltas (Cambodia/Vietnam), or the densely urbanized deltas of the Ciliwung River (Jakarta, Indonesia), the Chao Pharya River (Bangkok, Thailand), or the Sumida River (Tokyo, Japan): a large part of many countries’ gross domestic product (GDP) is generated in these important geographic regions [2,7]. For example, the Pearl River Delta covers only 0.5% of China’s territory and is home to only 4.5% of its population, but it contributes 10% to the country’s GDP, and the Yangtze Delta contributes 20% [2,3]. A detailed review of river delta advantages and assets can be found in Kuenzer and Renaud [2].
At the same time, these highly dynamic, valuable environments are exposed to a variety of threats [8]. Urban areas, industry, infrastructure, agriculture and aquaculture all extend into formerly untouched land and disturb and/or replace valuable ecosystems such as wetlands, coastal forests and marshes [6,9]. Increasing water, soil and air pollution accompany this process. Sediment compaction through heavy structures and underground resource extraction adds to a natural subsidence component, prevalent in most deltas, and aggravates the already existing threat of sea level rise. Furthermore, deltas are vulnerable to upstream developments impacting water and sediment supplies. Upstream water diversion, control and pollution, hydropower dams leading to changes in flood pulse and sediment transport, as well as major land cover and land use change all inflict changes upon the respective delta environments [10,11]. Constant monitoring of these highly productive, fragile social-ecological systems is of the utmost relevance for understanding past and current land surface changes and anticipating possible future developments [8,12,13]. Figure 1 illustrates the location and complexity of the land surface of four selected river mouth areas (3 deltas, 1 estuary) that are the focus of many of the studies covered in this review.
The increasing vulnerability of river deltas has gained widespread international recognition in recent years [14,15,16,17]. Numerous recent initiatives, such the Delta Alliance [18], the World Estuary Alliance [19], the Connecting Delta Cities Network [20] and the Delta Coalition established during the Third United Nations Conference on Disaster Risk Reduction in Sendai, Japan, in March 2015 [21] have all focused on scientific linkage, joint applied research and information sharing, to gain a multi-facetted, comprehensive understanding of environmental changes in large river delta areas. Research projects under Future Coasts emphasize the importance of cross-disciplinary research in river deltas. Common to all interest groups is an awareness of a lack of information on delta dynamics and delta perturbations [14], and a call for freely available, reliable, quantitative scientific information to further improve knowledge and understanding of river delta environments [7,8,14].
2. River Deltas: Generic Challenges and Required Adaptation
Despite numerous locational advantages of river deltas, these social-ecological systems face a multitude of threats that arise from within as well as outside delta areas. Kuenzer and Renaud [2], Kuenzer et al. [22] and Wolters and Kuenzer [23] have systematically categorized these threats. As detailed elaborations are presented in the same publications, generic challenges are only briefly summarized in Figure 2. It should be underlined that this figure is by no means exhaustive, but presents the major generic threats that most settled deltas have to face. In contrast, sparsely settled—especially polar—delta environments are affected by additional processes, such as changes in freeze–thaw cycles, land erosion along thawing permafrost coasts [24], ground subsidence due to melting permafrost, increased green-house relevant methane release, as well as the loss of habitats due to reductions in offshore seas, lake ice and snow cover [25,26], all of which are mostly related to recent trends toward a warming climate. However, as these processes affect only few deltas and a very small fraction of the global river delta population, they will not be further elaborated upon here. The explicit impacts of recent climate trends (i.e. manifested changes in temperature and precipitation; sea level rise), as well as possible adaptation options, have been compiled and categorized by Kuenzer and Renaud [2].
Challenges which are common to all river deltas relate to the fact that river delta environments are inextricably connected to, and dependent on, any activities and changes in upstream areas. Upstream water diversion, flood pulse changes, water pollution, sediment retention, overall land use change, market changes and many other processes will all be felt in downstream deltas. This connectivity holds much potential for charged social-ecological and political conflict, especially in transboundary river basins, where possible upstream locations inflicting harm on a delta area are located in a country other than that of the delta itself [10,11]. Further generic challenges for all delta environments are their location on the coast, which goes along with increased exposure to ocean-borne threats such as sea level rise, storm surges, tsunamis, oil spills or algal blooms. The Fourth Assessment Report of the Intergovernmental Panel on Climate Change (IPCC) [27] suggests a sea level rise of up to 95 cm by 2100 for the high emission ‘business as usual’ scenario. The Fifth Assessment Report of the IPCC [28] suggests a global mean sea level rise of up to 82 cm as a result of recent and future water temperature increases and the melting of polar ice and glaciers. McCarthy et al. [29] underline associated effects, such as increased coastal inundation, higher storm surge flooding, landward intrusion of sea water and associated salinization [30]. Asian megadeltas in particular are considered to be the most vulnerable to future global climate change [11]. Internal threats include industry-, urban-, agriculture- and aquaculture-related water, soil and air pollution, land subsidence driven by geologic processes and underground extraction of resources such as hydrocarbons and also groundwater [7,31]. Other internal threats are the loss of natural ecosystems such as coastal protection forests, wetlands and marshes, land use change-driven loss of biodiversity via monoculture expansion or habitat fragmentation, as well as modification of the natural dynamic delta system via infrastructure and barrier developments.
Fröhle [32] categorizes the following five policies of coastal protection with respect to coastal engineering: do nothing, managed realignment, hold the line, move seaward and limited intervention, while at the same time underlining that a direct separation of these strategies is usually not possible. Regardless of which pathway is chosen, there is a clear need for extensive adaptation measures that increase a delta’s resilience to the aforementioned external and internal threats. Such adaptation measures can be technological (e.g., coastal defense structures), ecological (e.g., coastal reforestation), educational (e.g., environmental education in schools) and political (e.g., panels, bodies, rules, laws, etc.) in nature, and have been presented in depth in Kuenzer and Renaud [2]. Emphasis here was put on the fact that technological, ecological and educational adaptation measures cannot reveal their potential unless they are appropriately supported by political measures, e.g., detailed environmental regulations and laws such as water quality guidelines and thresholds, and, most of all, strict law enforcement. Environmental rules, regulations and laws are irrelevant if they are not properly enforced. Furthermore, all planning of adaptation measures misses its main purpose (increase of delta resilience) if it is not driven by multidisciplinary, well-informed groups. To be well-informed requires access to objective, quantitative information on the related area. Earth observation-based derivation of geo-information products is one way to supply objective, quantitative information for planning purposes.
3. Declared Information Needs and the Role of Earth Observation
High quality information and data are essential for implementing adaptation measures, increasing a river delta’s resilience to common threats, as well as for making informed decisions in the context of integrated land and water resource management [33,34]. The demand for a science-based global strategy to protect deltas has been repeatedly identified. Giosan et al. [8] call on the United Nations to establish an international body of experts to coordinate delta maintenance initiatives worldwide. Common to all interest groups is the awareness of a lack of information on delta dynamics and delta perturbations [14], and the call for freely available, reliable, quantitative scientific information to further knowledge of river delta environments [7,8,14].
Earth observation can definitely play a major role in the provision of spatial products representing land surface parameters and depicting land surface dynamics. However, a discrepancy might exist between user requirements and actual raw data availability, processing capability and achievable thematic depth. Repeatedly underlined was the demand for thematically detailed, up-to-date, high resolution land cover and land use information products, (ii) thematically detailed land use products indicating harvest cycles, land cover and land use change products, (iii) individual habitat and habitat-change products, especially for coastal protection forests and wetlands (iv) individual thematic products depicting the dynamics of urbanization, (v) information on coastlines, coastline change, coastal erosion and accretion (vi) the distribution of point pollution sources (vii) information products on flood and inundation status, and (viii) ocean- and water-related parameters. Earth observation-based analyses can contribute to information provision for both landward and seaward studies of delta regions (Figure 3).
At present, an unrivalled amount of remotely sensed Earth observation data is globally available in satellite data archives. Imagery from coarse-, medium-, high-, and highest-resolution optical, multispectral, radar and thermal infrared sensors is waiting to be exploited to reveal its full potential. The USA and Europe have set the pace in making Earth observation resources publicly available. Numerous archives of data from satellite sensors, such as the Moderate Resolution Imaging Spectroradiometer, MODIS, the Landsat fleet and the Advanced Synthetic Aperture Radar, ASAR, are freely accessible to the public [35,36,37,38]. These are just three examples of a bountiful bouquet of sensors with accessible archives, providing abundant data—and partially even value-added products—and offering global coverage [39,40,41]. Currently leading this global trend is the Sentinel program of the European Space Agency, ESA, a new fleet of satellites (some of which are already operational) that provide freely-available data for the systematic and long-term monitoring of the Earth system at unprecedented spatial and temporal resolutions [42].
This current trend in the public release of numerous satellite data archives is accompanied by rapidly increasing capabilities to handle and explore big data [43,44,45,46,47,48]. Up-to-date data processing techniques and high-performance server and cloud computing resources such as the Google Earth Engine [49] enable the application of large areal and dense temporal coverage in EO-based analyses [50]. This steadily increasing amount of available EO data and processing capabilities has made remote sensing the method of choice for the study of environmental processes over large spatial domains.
For instance, time series of optical satellite data are increasingly being used to track coastlines, coastal erosion and accretion patterns, as well as hazard-related disturbance impacts [51,52,53,54,55,56,57,58,59]. Highest-resolution optical data is sporadically employed for detailed habitat mapping or object extraction. Typical sensors employed include Landsat (MSS, TM, ETM+, DCM), SPOT and RapidEye, as well as Ikonos, QuickBird, and Worldview. In the thermal infrared domain, a few selected studies on land surface temperature (LST) retrieval in river delta areas, urban heat island, UHI, investigations [60] and thermal anomaly extraction have been published. Here, thermal Landsat data (60 m spatial resolution for TM and ETM+, 100 m spatial resolution for the new Landsat-8 DCM) are the preferred choice. Radar and SAR data provide the basic information for application fields such as flood and inundation mapping, wetland characterization, urban mapping, elevation derivation and land subsidence studies [61,62,63,64,65].
Earth observation methods and applications for studying oceanic processes are not considered in this review, as there are already numerous publications available on this topic [66,67,68,69,70,71,72,73,74,75,76,77,78,79,80,81,82,83,84,85,86,87,88,89,90,91,92,93,94,95,96,97,98,99], and ocean parameters retrieval is a very specialized discipline within remote sensing. These publications are usually concerned with the detection and monitoring of algal blooms, the derivation and quantification of colored dissolved organic matter, CDOM and the retrieval of sediment load information (suspended particulate matter, SPM), based on optical and multispectral data from sensors such as MODIS, the Medium Resolution Imaging Spectrometer, MERIS, the Sea-viewing Wide Field-of-view Sensor, SeaWiFS, and Landsat (MSS, TM, ETM+, DCM). In rare cases, also Advanced Very High Resolution Radiometer, AVHRR, data, Système pour l’Observation de la Terre, SPOT, data, Chinese Brazilian Environmental Satellite, CBERS, data or highest-resolution data from sensors such as Ikonos, QuickBird or WorldView are used for algal, CDOM and sediment plume analyses. The recent Sentinel-3 [100] mission enables near-daily global monitoring of important water, land and atmospheric parameters, and analyses thereof have now started [101,102,103]. Several chapters on the remote sensing of coastal waters and on the mapping of submerged vegetation in benthic habitats can be found in [13]. The monitoring of suspended sediment patterns and sediment concentrations in near coastal waters of river deltas based on different types of satellite remote sensing data, such as MODIS, MERIS, Spot, Landsat and ALOS-AVNIR-2, has been undertaken by Long and Pavelsky [104], Doxaran et al. [105], Zhang et al. [106], Doron et al. [107], Güttler et al. [108], Foidefond [109] and Loisel et al. [82], amongst many others. Studies focusing on algal blooms and general chlorophyll distribution in river delta areas have been undertaken by Keith [77], Wei et al. [110], Aurin and Dierssen [111], Le et al. [80,81], Gohin et al. [112], Shanmugam et al. [113] and Lavery et al. [79]. Sea surface temperature (SST) derivation and the detection of thermal plumes [114] are usually presented based on MODIS and Landsat data.
Radar and SAR data are mainly employed for wave height analyses and the detection of ships, oil spills and sea ice; the main workhorses for this are sensors such as ERS-1/2, ENVISAT ASAR and the German TerraSAR-X, but other SAR sensors are also employed, as presented in Kuenzer et al. [46]. Furthermore, altimetry mission data, from sensors such as the former TOPEX/Poseidon or follow-on missions, such as Jason, or also ERS-2 and ENVISAT data, are exploited to derive global sea level estimates [115,116,117,118,119,120,121,122,123]. A comprehensive overview of Earth observation satellite sensors and their common application fields, including ocean applications, and illustrated with an extensive set of figures and tables, has been presented by Kuenzer et al. [46].
For land-related Earth observation analyses of river delta areas, some coarse-resolution optical and multispectral MODIS data, and mainly data of Landsat-type resolution (30 m and better), are the preferred choice for characterizing land cover and land use. Many studies here have focused on mapping wetlands, mangroves or agriculture [124,125,126,127,128,129,130,131,132,133,134,135,136,137,138,139], as well as on extracting river courses. A review of typical remote sensing-based analyses undertaken in river delta environments is provided in the following chapter.
4. The Potential of Earth Observation of River Delta Areas
4.1. The Potential of Earth Observation for Analysing Delta Morphology, River Course, Coastline Dynamics, and Accretion and Erosion Processes
With fairly constant sea levels and continuous sediment supply, deltas usually grow seawards—a process termed progradation or coastal accretion. Where sediment supply and sea level rise are balanced—which happens only rarely—the delta aggrades upward, with the coastline remaining in place. Where sedimentation cannot keep up with sea level rise, the delta retreats landwards (retrogradation), and sediment accumulation mainly occurs offshore, where nearshore subaqueous sediments are covered with the material transported into the sea. Such deltas can eventually evolve into an estuary [3]. In many river deltas globally, such as the Yangtze Delta, but also the Chao Phraya, Colorado, Po and Nile deltas, the aggradation rates have very substantially decreased [140]. Delta morphology and especially coastline dynamics and resulting erosion and accretion patterns are not only impacted by relative sea level rise, basin land use change and upstream sediment retention, but also by downstream river course redirection and coastal protection activity (infrastructure measures). Here, Earth observation can play a crucial role in providing accurate information on these processes [5,6,141]. Additional ancillary data, which is commonly needed for delta morphology, coastline and accretion and erosion analysis, includes tide tables or other tidal information (to ensure that coastlines are mapped at comparable tide situations), as well as background information on the drivers of morphodynamics, such as the reasons behind river redirection, substantial land use change in the delta or coastal harnessing infrastructure projects [55].
Figure 4 depicts recent, human-induced river redirection in the Yellow River Delta, Shandong Province, China [6]. As elucidated by Kuenzer et al. [6], the Yellow River formerly discharged into the Bohai Bay at the northern end of the delta (Figure 4a), and was deliberately redirected from its original northern pathway—the Diao Kou He Canal—to the east into Quing Shui Gou Canal in late 1976. The reason was that large ice jam-related floods occurring in the Yellow River mouth area endangered the oil fields in the north and northeast delta. In 1995 (Figure 4b), Dongying City had already been established for over a decade, and extensive coastal progradation had occurred in the new river mouth area in the east.
In 1996 and 2006, the river was again redirected slightly towards the north, in the hope to increase accretion and sedimentation north of the river mouth, and therefore, to turn shallow coastal waters into a land area allowing for less expensive onshore oil exploration compared with offshore activities (see Figure 4c,d). All these processes are elucidated in detail in Kuenzer et al. [6]. Figure 5 depicts the consequences of this technocratic river redirection. Based on Landsat data at 15 m and 30 m spatial resolutions spanning 37 years (1976–2013, [6]), and considering comparable tide levels, land erosion and accretion patterns could clearly be mapped and quantified. Average annual coastal retreat and advance rates of between −355 m and +591 m could be detected. Furthermore, it was found that the delta’s natural functions of self-adjustment are declining, as man-made coastal harnessing (construction of solid sea dykes, piers and harbors) leads to less fluctuation in delta shape and the respective coastline [6]. The results presented are well in line with the prior findings of Yang et al. [142], Chu et al. [51], Cui and Li, [53] and Liu et al. [143].
With respect to river course or coastline extraction, several methods exist, such as image differencing, unsupervised land-water classification, supervised land-water classification, image segmentation and manual coastline digitization; all are based either on all multispectral bands or derived indices, such as the Normalized Difference Water Index (NDWI) [5,6,56,141,144,145]. A detailed review of the latest developments in coastline/shoreline derivation from remote sensing data has been presented by Gens [146]. However, it should be mentioned that while automatic digital image processing is fast and might seem more elegant, for coastline extraction, so far nothing can yield better results than a thorough human interpretation and manual digitization. This means that sometimes one has to accept handling data in an ‘old-fashioned’ or less computationally demanding way in order to retrieve the most accurate results [141], which can be of high relevance to stakeholders. For coastline change analysis and the quantification of erosion, methods which place orthogonal trajectories between two shorelines at different dates, and then allow the calculation of overall or annual erosion or progradation rates, can be employed [5,6,143].
Annual retreat or progradation rates of -355 m up to +591 m, as detected for the Yellow River Delta, are absolute extremes with respect to coastline change. In many deltas, coastline change is well below 100 m per year. Thus, it is self-evident that satellite data used for coastline change analyses and accretion and erosion pattern investigations must fulfil certain requirements. Coarse resolution satellite data from sensors such as AVHRR, MODIS or MERIS, or even ENVISAT AATSR and ASAR, have spatial resolutions which are too low to be suitable for this purpose. Highest-resolution optical data from sensors such as QuickBird, WorldView or IKONOS are suitable for the required purpose, but are usually too costly for delta-wide and repeated acquisition. Furthermore, these sensors only allow mapping back to the turn of the millennium (2000), which can be considered a relatively limited time span. The same applies to highest resolution SAR data from sensors such as TerraSAR-X, TanDEM-X, Radarsat, COSMO-SkyMed and others. The data is either costly, or—for scientific purposes—can only be accessed for a relatively limited area [144]; furthermore, monitoring before the year 2000 becomes difficult. For coastline mapping, it is therefore clearly the Landsat fleet of sensors (MSS, TM, ETM+, DCM), whose data is supplied freely, which should be considered as the main workhorse. Data gaps can theoretically be filled with freely available ASTER and SPOT data. Landsat enables monitoring starting in the early 1970s, and the existence of a panchromatic band from 1999 onwards (15 m) is an additional advantage.
Several recent studies have taken advantage of the full spatial (i.e. global) and temporal (i.e. multidecadal, 16-day revisit) resolution of Landsat imagery. Kuenzer et al. [5] illuminated the potential of long-term Landsat time series for coastline mapping for the coastal Niger Delta of Nigeria, Africa, revealing that between 1986–2002/2003, annual accretion rates were slightly higher than erosion rates, whereas after 2003, erosion rates increased in all coastal Niger Delta states except one. Coastal changes of up to 65 m per year (or 1.75 km over a 27-year time span) could be detected. Next to sea level rise and coastal alongshore transport, as well as upstream developments (land cover change, hydropower dams), oil industry-related activities such as the dredging of canals and destruction of mangrove forests might play a role [5]. Two recent studies quantified the annual changes (i.e. erosion and accretion) of sandy shorelines over the past three decades at the global scale [58,59], using the Landsat archive in conjunction with the Google Earth Engine platform [49]. The global satellite-derived shoreline dynamics of Luijendijk et al. [59] can be explored via the “shorelinemonitor” website [147]. For the Vietnamese Mekong Delta, the study found shoreline erosion rates of 25–30 m over the last three decades, which were attributed to sand mining in the river and delta channels and subsidence due to groundwater extraction [59]. Mentaschi et al. [58] exemplify the results of their global mapping for several river delta case studies, including the Indus Delta, which exhibited the largest shoreline retreat globally, i.e., about 40 km over the analysis period (1984–2015), driven by upstream dams and diversions that support one of the World’s largest irrigation complexes.
Another recent study by Ezcurra et al. [148] performed shoreline mapping based on the full Landsat archive to test how sediment trapping by hydroelectric dams affects the stability of the coastlines of estuaries on the Mexican Pacific coast. They found that the estuaries of the two rivers that were dammed for hydroelectricity experienced rapid coastal recessions of between 7.9 and 21.5 ha per year, in what should be an accreting coastline. Murray et al. [149] recently mapped the distribution and trajectories of tidal flats, one of the most extensive coastal ecosystems, at the global scale, using Landsat (1986–2016) and the Google Earth Engine [49]. The global intertidal change maps cover the majority of the World’s deltas and can be explored through an online mapping interface [150]. The authors found that 16.02% of global intertidal areas have been lost over the analysis period, partially due to the sinking of riverine deltas and reduced sediment delivery from major rivers. Bishop et al. [151] combined global tide modelling with Landsat imagery to derive an intertidal elevation model (15,387 km2) with 25 m resolution for the entire of the Australian coastline. Their open source approach could easily be applied to other deltaic areas around the World if accurate observations or hindcast predictions of tidal water level elevations are available.
A large potential to continue these long-term archives lies in the recently launched European Sentinel-1 SAR and Sentinel-2 multispectral sensor [42]. For in-depth details on sensor characteristics, time spans covered and data availability, see Kuenzer et al. [46]. Although not specifically applied in delta regions, a few applications have tested the suitability of Sentinel-2 for mapping coastline accretion and erosion dynamics at higher spatial and temporal resolutions than what is possible with Landsat [152,153,154]. For instance, Vos et al. [154] compared the accuracy and suitability of Landsat (5, 7 and 8) with that of Sentinel-2 for mapping inter-annual and intra-annual shoreline dynamics. Using a sub-pixel resolution shoreline detection technique, they found no improvement in shoreline accuracy for Sentinel-2 over Landsat 5, indicating that pixel size may not be the primary source of error (rather than errors due to georeferencing accuracy and uncertainty caused by instantaneous and localized water levels) [154]. Even though these findings are in line with [152,153], additional studies are required to test and exploit the full potential of Sentinel-1 and -2 for mapping and tracking deltaic coastline dynamics.
4.2. The Earth Observation Potential for the Analysis of Flood and Inundation Dynamics in River Deltas
Stern [155] forecasts that due to the combined effect of rising sea levels and increasing population densities along the coast, hundreds of millions more people will likely be affected by flooding each year, increasing pressure for coastal protection, especially in large coastal cities. Furthermore, Stern [156] predicts an increasing number of people who will be permanently displaced due to sea level rise, heavier or unpredictable floods or other processes. The majority of deltas are on course to drown [8]. According to Syvitzki et al. [7], since the year 2000, about 80% of the 33 river deltas analyzed were exposed to severe flooding, with over 260,000 km2 being frequently submerged. Areas at future risk of flooding are expected to grow by 50% [7,8]. But not only floods originating from the ocean side (SLR, storm surges, etc.) are a threat to delta areas. Many deltas experience severe flooding due to rainy season flood pulse patterns of the main stem river, due to unexpected rainfall upstream or in the delta, or simply due to human-induced water diversion schemes. Deltas are thus located in a sandwiched position, with excess water looming from the ocean side as well as from upstream locations or processes within the delta. Geospatial information derived from satellite Earth observation can support the visualization of flood and inundation dynamics in deltas globally. This potential has been discussed in depth by Kuenzer et al. [12,22,156,157,158,159], as well as in the recent review study of Huang et al. [160].
While numerous authors extract water areas based on SAR or optical/multispectral data from just single time steps or very few observations [159,160,161,162,163], and whereas flood and inundation mapping covering complete delta areas is very rare [164], Kuenzer et al. [22,156,157] have performed studies on extensive time series of SAR and multispectral data for several river deltas globally. The largest challenge for Earth observation-based derivation of flood and inundation dynamics lies in the weather conditions, which usually prevail during rainy seasons or during weather with excess precipitation. Cloud cover often hampers optical and multispectral observations, which seemingly leaves SAR data (microwaves can penetrate clouds) as the only resort to map flood and inundation dynamics. However, Kuenzer et al. [12] have shown that with coarse spatial resolution but temporally-dense time series of MODIS data, covering each place on earth two times/day with sensors on the Terra and Aqua platforms, it is possible to derive intra-annual dynamics. The method is presented in depth in Kuenzer et al. [12]. Based on thresholding approaches using twice-daily 250 m resolution NIR band data, it is possible to separate water from non-water and generate a daily water mask. Compositing all daily data for one year then yields products depicting water cover duration (in days per year) for each selected river delta. Figure 6 presents such data sets, revealing intra-annual inundation dynamics for the Mississippi River Delta (Figure 6a) and the Mekong River Delta (Figure 6b), as well as a spatial and temporal analysis of inundation dynamics in the polar Mackenzie Delta Region (Figure 6c–f). In the latter, obvious differences between the eastern and the western parts of the delta are not a processing artefact, but occur because the eastern part of the delta region is located up to 230 m above mean sea level, separated by a steep cliff from the western part. The eastern part is the westernmost fringe of the Canadian Shield, dominated by Quaternary glacial deposits and solid bedrock with embedded lakes, such as the Husky Lakes. The lakes are frozen for about half of the year, which is why they appear in shades of turquoise.
However, for many study areas, SAR data are the preferred choice for flood mapping. Multispectral MODIS data at 250 m is suitable for a delta-wide first revelation of general dynamics, but the products are too coarse for specific local planning. Thus, some authors have employed SAR data to extract water surfaces (flooded areas) from Earth observation imagery. Studies in river deltas—and especially studies covering complete river deltas—are rare, and also here, most authors present uni- or multi-temporal results, employing one or a few SAR scenes. An overview of existing studies, the preferred SAR sensor utilized, the preferred polarization and the algorithms developed have been presented by Kuenzer et al. [156]. Recent reviews of surface water and flood inundation mapping from SAR data are provided by Schumann and Moller [165] and Shen et al. [166]. SAR-based water surface extraction is based on the principle depicted in Figure 7, i.e., that water surfaces act as mirror reflectors for incident SAR waves, leading to very low backscatter values (appearing in black). Different methodological approaches for SAR-based water surface extraction have been compared by Martinis et al. [163] amongst others.
The SAR sensors which are most frequently used for water mapping are ENVISAT ASAR (over 70% of the studies), Radarsat, TerraSAR-X and COSMO SkyMed. However, as elaborated by Kuenzer et al. [46], ENVISAT has not been operational since April 2012, Radarsat data can only be acquired at high cost and TerraSAR-X data—for scientific purposes—is only available for relatively small case study areas. The potential of long ENVISAT ASAR-based time series analyses was, for the first time at that extent, presented by Kuenzer et al. [156]. Kuenzer et al [156] have furthermore demonstrated that SAR-based inundation analyses can be well correlated with land use and dyking schemes in the Mekong Delta. Furthermore, Kuenzer et al. [157] analyzed the impact of different sensor spatial resolutions on patterns of inundation. ASAR WSM, TerraSAR-X ScanSAR and TerraSAR-X StripMap data were processed to reveal water coverage in the urban area of Can Tho. The results revealed the spatial progression of floodwater over time, inundation frequency patterns, the disturbing effect of corner reflecting buildings on water surface extraction and an increasing accuracy of water cover derivation with increasing spatial SAR sensor resolution, indicating that water-covered areas are underestimated by more than half if coarser ENVISAT ASAR WSM data are used.
Figure 8 visualizes this potential of highest-resolution SAR data-based time series analysis. Based on 13 TerraSAR-X StripMap data sets at better than 3 m resolution, it has been possible to reveal inundation patterns that can be directly related to permanent water bodies, aquaculture, brine ponds, wetlands and agriculture [22]. The recent Sentinel-1, -2 and -3 hold great potential for mapping surface water dynamics in river deltas with high spatial and temporal resolution, although no studies have been published yet. Due to the spectral similarity, Sentinel-2 data can be used in conjunction with Landsat-8 data, and in the case of surface water, also with Sentinel-1, so that continuous monitoring of surface water dynamics is now technically possible at potentially less than 5-day intervals and at 10–20 m resolution. Importantly, not all global land surface areas are sampled with the same frequency; the respective coverage maps for Sentinel-1 and Sentinel-2 are available online [167]. Studies on Sentinel-1-based inundation mapping in delta regions are still scarce, but some of the recent advancements in this field could be easily applied in this context. For instance, Chini et al. [168] proposed an algorithm for mapping inundation in urban areas with high accuracy from Sentinel-1 SAR and interferometric SAR data. Shen et al. [169] developed a near real-time flood mapping algorithm that can quickly ingest and process imagery from all relevant SAR sensors, including Sentinel-1. Notably, Wang et al. [170] developed a sub-pixel water body mapping algorithm that generates near-daily surface water maps at 30m resolution from 300m resolution Sentinel-3 OLCI images.
In the context of surface water dynamics in river deltas, the rapid expansion of aquaculture ponds is of particular relevance. Ottinger et al. [171] used Sentinel-1 SAR time series over a 2-year period to detect aquaculture on the level of individual ponds at a regional scale, based on the method illustrated in Figure 9. Using some of the world’s most significant aquaculture production regions as case studies, i.e., the Mekong, Red, Pearl and Yellow Rivers, the method achieved an overall classification accuracy of 0.83. Extending this dataset, Ottinger et al. [172] integrated the remotely-sensed pond maps with pond yield statistics from the literature to estimate aquaculture production in each mega delta, highlighting the great potential of EO for monitoring and management of aquaculture in these regions.
4.3. Earth Observation Potential for Land Cover and Land Use Information Derivation and Analysis
Global, remote-sensing-derived information products are often too coarse in spatial resolution or too unspecific in thematic depth to capture the level of detail needed by decision-makers, scientists and engineers working in selected ecosystems, such as river deltas. Figure 10 presents the major challenges for global land cover products, which have been addressed in depth by Kuenzer et al. [173]. They remain even after the harmonization of different global product legends based on the Land Cover Classification System (LCCS). The Figure presents six excerpts of different global land cover products for the larger Mekong Delta area, including the northern delta in Cambodia and the large Tonle Sap Lake. The University of Minnesota land cover product of 1992/1993, the Global Land Cover Product of 2000, the GlobCover products of 2004 and 2009 and the MODIS Land Cover products of 2001 and 2009 are depicted. For information on the sensors used to generate the products, resolution, classification algorithms and land cover legend harmonization, etc., please refer to Kuenzer et al. [173]. What is directly striking when visually analyzing Figure 10 is that harmonized—and thus comparable—land cover products of different origin are strongly divergent, even if products based on the same years are being compared. The GLC 2000 and the MODIS Land Cover product 2001 (upper right and lower left in Figure 10) cover the same time frame but seem to depict completely different land cover proportions, especially with respect to vegetation classes. Table 1 presents these changes in a quantitative way. Whereas 93.1% of the subset displayed is cultivated vegetation and agriculture in the GLC 2000 product, in the MODIS 2001 Land Cover product, only 69.1% is considered to fall into this class. Furthermore, there are classes that occur in one product but not in the other (even though according to ground knowledge, they definitely exist, e.g., “barren” or “urban” landscapes). Similar patterns can be observed when the MERIS derived Globcover 2009 and the MODIS 2009 Land Cover product are quantitatively compared. The MODIS-based product indicates a five-fold areal coverage with broadleaf evergreen trees and a 10 times smaller coverage with herbaceous vegetation; furthermore, only 63% of the subset depicts cultivated vegetation and agriculture, compared to 86% in the Globcover product.
These examples are representative of many other areas as well, and clearly illustrate that global land cover products have to be handled with great care if used in regional or local studies. Outcomes of hydrologic, biomass or micro-climate-related modelling will clearly be skewed and yield large differences depending on, for example, a 63% or 86% agricultural area [173]. This also clearly indicates the need to generate specific local and regional land cover and land use thematic products for (delta) areas of interest.
Numerous authors have presented land cover- or land use-related studies for selected river deltas. However, most of them focus on the extraction of one specific land cover or land use class, or only on a few classes. Additionally, global uni-class datasets can be used for river delta land use assessment. For examples, the well-known Global Urban Footprint [174,175], which is based on TerraSAR-X SAR imagery, allows for a first characterization of a delta area. In contrast to polar river deltas in Asia (especially Russia), which are extremely sparsely urbanized (according to the GUF, all under 40/km2), the extremely large mega-urbanizations of the deltas in Japan, Vietnam, Thailand and Myanmar are well reflected in the data. The Chao Phraya Delta, for example, has an urban area extent of 3482 km2, accounting for 25% of the total delta area (see Figure 11). A number of recent studies have leveraged the long-term nature of the Landsat record and high spatial and temporal resolution of Sentinel-1 and -2 for mapping urban areas and their trajectories. The Global Human Settlement Layer, (GHSL) developed by the Joint Research Center at the European Commission [176], provides four decadal Landsat-based global settlement layers since 1975, making it possible to trace recent trajectories of urbanization in delta areas. Using Landsat and the Google Earth Engine, Liu et al. [177] mapped global urbanization between 1990–2010 at 5-yearly intervals, revealing that China, the United States of America and India are responsible for 43% of the global increase in urban areas during this period. Sun et al. [178] recently combined 13,976 Sentinel-1 SAR scenes and 8359 Sentinel-2 images from the Google Earth Engine to map urban land areas for all of China at 10 m resolution. However, by far the most extensive global dataset enabling urban trajectory analyses, also in deltas, is the novel World Settlement Footprint (WSF) of the German Aerospace Center, DLR [174]. The WSF integrates multitemporal Landsat-8 optical and Sentinel-1 SAR imagery to generate global, 10 m spatial resolution, settlement maps [174], that can be explored in ESA’s Urban Thematic Exploitation Platform [179].
A presentation of delta-wide, multi-class land cover and land use products is rare. Bouvet and Toan [124] have employed ENVISAT ASAR wide swath data to derive rice fields in the Mekong Delta, Vietnam, for 2007. Also, Son et al. [136] mapped flood affected rice cultivation areas, but with MODIS data and for the Chao Phraya River Delta area in Thailand. Invasive vegetation species have been mapped by Laba et al. [180] for the Hudson River National Estuarine Research Reserve using IKONOS data, by Hestir et al. [181] for the California Delta ecosystem-based on hyperspectral data, and by Zhang et al. [182] for the Minjiang River Estuary. Delta-specific mapping of wetland vegetation has been undertaken and presented by Zhao et al. [138], who monitored wetland vegetation succession for the Yangtze River Delta, China, based on MODIS data, by Grings et al. [61], who explored the capacity of ENVISAT ASAR data to map wetlands of the Paraná Delta in Argentina, and by Lee and Yeh [131], who monitored shifting wetland vegetation in the Danshui River Estuary of Taiwan based on SPOT, Landsat, and QuickBird data. The most commonly performed land cover class extraction in suptropical and tropical river delta areas is the mapping of mangrove ecosystems. A comprehensive review of studies based on optical, multispectral, hyperspectral and SAR data can be found in Kuenzer et al. [183].
Recent mangrove mapping studies in deltas have been presented by Santos et al. [135], who employed CBERS and SPOT data for analyses of mangroves in the Sao Francisco River Estuary in Brazil, by Kuenzer and Vo Quoc [9] who employed SPOT data to map mangroves in the Can Gio Estuary complex in Vietnam and by Vo Quoc et al. [184], who analyzed SPOT data for mangrove characterization in Ca Mau province of the Mekong Delta. A comprehensive review of the use of remote sensing of mangrove forests is provided by Wang et al. [185]. Ullman et al. [25] presented a six-class tundra and arctic wetland-related, supervised land cover classification based on TerraSAR-X Quadpol data for part of the arctic Mackenzie Delta, namely Richards Island, which has an extent of about 80 × 35 km; however, the data covered only part of the delta. The authors concluded that better classification results could be achieved with optical (Landsat) data than with (higher resolution) SAR data. Classification based on optical data is based on the spectral signature of objects, which makes it possible to differentiate among classes in the n-dimensional feature space spanned by the respective sensitive bands of the satellite sensor. Figure 12 depicts this principle, based on typical spectral signatures for different land cover types, as derived from atmospherically corrected RapidEye data at 6.25 m spatial resolution. The land cover/land use map for the central Mekong Delta consists of 10 classes. Here, a subset is shown to illustrate the level of spatial detail. Image classification based on spectral signatures is the most common approach to create up-to-date thematic land cover and land use maps. A variety of image classifications methods exist, such as unsupervised classification approaches—which do not require prior class knowledge, but usually lead to lower classification accuracies—as well as supervised approaches, where training data supports the definition of class statistics, which then guide the classification process. Commonly applied supervised classification approaches include maximum likelihood classifiers, decision tree classifiers and random forest classifiers, as well as approaches such as spectral angle mapping, binary encoding, spectral feature fitting, mixture tuned matched filtering and linear spectral unmixing.
Spectra-based classifications spanning a complete river delta area have been presented by Kuenzer et al. [5] for the complete Niger Delta in Africa, and by Ottinger et al. [186] spanning the complete Yellow River Delta district of Dongying. For the Niger Delta, which is covered by five Landsat frames overall, Kuenzer et al. [5] presented a land cover classification with 10 classes for an area spanning about 400 km × 250 km covering two time steps, 1986/87 and 2013. Rapid expansion of urban areas within this time span catches the eye; notably, the delta cities of Port Harcourt, Warri, Aba and Owerri have grown substantially. The agricultural area has also increased, at the cost of natural forest ecosystems, including mangroves. Swamp wetlands and forest along the Niger’s main stem further inland in the delta have thinned out. Drivers of change are population growth and inward migration. The area experiences drastic disturbances induced by the oil and gas extraction activities of international companies, which was also demonstrated by Kuenzer et al. [5]. For the complete Yellow River Delta, Ottinger et al. [186] presented a comprehensive, 17-class classification for 1995, 2004 and 2010. Classification was performed on georectified and atmospherically corrected Landsat TM reflectance bands, and additional three Tasseled Cap layers, as well as three index layers, using a C5.0 based decision tree classifier [186]. The results illustrate an extreme growth of urban areas, as well as an expansion of sparse built-up areas along the river course, an increasing cultivation of arable land in the southern premises of Dongying District and, especially, a massive expansion of coastal aquaculture areas (Figure 13).
Although spectral reflectance-based land cover and land use-based classification is the preferred method to generate thematic information products employed by about 95% of all studies published, a larger (and often time still untapped) potential lies in the exploitation of temporal spectra retrieved from intra-annual time series generated from temporally-dense satellite data. Intra-annual and long-term multi-annual or even decadal and multi-decadal time series make it possible to extract a seasonal, as well as a trend, component. This is depicted in Figure 14, in which an intra-annual time series-based classification result for the Mekong Delta for 2010 is presented. Land use types such as single, double and triple season croplands (rice) could be differentiated, which would be impossible based on a uni-temporal spectral reflectance data set. The classification was performed based on a stack consisting of a smoothed MODIS EVI 16-day composite time series, including in the classification process additional information layers of extracted phenological metrics, such as base level, maximum value, amplitude, start of season, end of season, season length, small integral and large integral. Details on phenological metrics, as well as on the time series-based classification process, can be found in Kuenzer et al. [36] and in Leinenkugel et al. [187].
In regions with strong seasonality, a time series-based approach allows for the identification of different crop types, different cropping cycles of similar crop types and the differentiation of seasonal forest or water body types. However, in river deltas where cultivation or seasonality does not play a role, a time series-based approach would not necessarily be the preferred choice. Here, reflectance-based classification based on a uni-temporal data set might deliver a good result much more quickly. Also, when focusing on the extraction of single individual classes (mangroves only, a certain wetland species only, etc.), the latter approach is usually sufficient. Recent advances in EO of delta land use include the application of Sentinel-1 and -2 data, as well as increases in spatial and temporal coverage of Landsat-based studies. Notably, Lymburner et al. [139] have recently mapped the spatio-temporal dynamics of all mangrove forests on the Australian continent (i.e. including all estuaries and deltas), using Landsat imagery between 1987 and 2016. This first continental-scale, multi-decadal assessment of annual mangrove distribution showed that mangrove forest extent in Australia peaked in 2010 and has since declined by about 240 km2 [139].
Several recent studies have used Sentinel-1 SAR time series data to map the distribution of rice paddies and aquaculture ponds in river deltas, taking advantage of the unique seasonal inundation dynamics and microwave backscattering characteristics of these features [171,172,188,189,190]. Advances in SAR-based mapping of aquaculture ponds are already covered in the previous chapter, and therefore, are not repeated here. Kersten et al. [188] used a Sentinel-1 SAR time series to estimate rice production in the Vietnamese Mekong Delta for three rice growing seasons. At the district level, their estimated rice production volumes showed very good correlations of 0.86 to 0.93 with data from local government agencies. Bazzi et al. [190] used machine learning to map different rice crops in the Rhone Delta, France, from Sentinel-1 SAR time series, achieving an accuracy of around 96%. A study by Minh et al. [189] illustrated that Sentinel-1 SAR can detect different rice cropping patterns (i.e. single- vs. double- vs. triple-rice cropping) and phenological growth stages with an overall classification accuracy of around 80.7%.
Ndikumana et al. [191] tested the capabilities of Sentinel-1 SAR data and deep learning techniques for agricultural land cover mapping in the Rhone River Delta, France, achieving an overall classification accuracy greater than 86%. Tavares et al. [192] combined Sentinel-1 SAR and Sentinel-2 optical data for improved land use land cover mapping in sub-region of the Amazon estuary. The combination of Sentinel-1 and -2 imagery achieved a slightly better overall classification accuracy, i.e., 91.07%, compared to 89.45% for Sentinel-2 only, while Sentinel-1 alone only achieved an accuracy of 56.01%. Alan [193] tested the suitability of Sentinel-1 and -2 data for quantifying above-ground biomass of mangrove forests in the Philippines, finding that these sensors can satisfactorily retrieve and predict the above-ground biomass of mangroves and their replacement land uses. Poursanidis et al. [194] tested the suitability of the Sentinel-2 coastal aerosol band (443 nm) for the mapping of coastal underwater habitats with high spatial variability (e.g. seagrass) and shallow water bathymetry, showing promising initial results. Notably, using a convolutional neural network, Feng et al. [195] fused multitemporal Sentinel-1 SAR and Sentinel-2 optical imagery to map land cover in the Yellow River Delta National Nature Reserve with an overall accuracy of 93.78%.
4.4. Earth Observation Potential for Monitoring Compliance with Environmental Regulations
Still a niche topic in Earth observation, but one of ever-increasing relevance, is the potential of satellite-based mapping for monitoring compliance with environmental regulations and the installation of related long-term monitoring and implementation schemes. As early as 2003, Hettling [196] addressed the topic of remote sensing satellites for verification in international law, and Peter [197], Kuriyama [198], and Purdy [199] also elaborated on the use of remote sensing to support the application of multilateral environmental agreements and the better regulatory compliance and enforcement of environmental laws. A good overview of the function of remote sensing in support of environmental policy has recently been presented by De Leeuw et al. [200]. Case study-related articles in this field often address ocean and water body related topics, such as water quality monitoring for a case study area in Finland, using remote sensing to support the EU Water Framework Directive [201]. SAR-based alert systems to detect oil spills were introduced by Ferraro et al. [202] and Glasgow et al. [203], who reviewed real-time remote monitoring of water quality, and Kourti et al. [204], who discussed the integration of remote sensing into fisheries control. A few land-related studies have been published [205,206].
Kuenzer et al. [5,6] and Vo Quoc et al. [207] have demonstrated the potential of Earth observation for monitoring compliance. In the Yellow River Delta, two nature reserves were established in the late 1990s/early 2000s, and even declared Ramsar wetland sites in 2013. These reserves consist of a core zone, a buffer zone, and an experimental zone. In the core zones, no economic or human activity is allowed. Settlement, agriculture, aquaculture, reed harvesting, tree cutting, bird shooting, oil pump installation, pipeline installation and new road construction are forbidden. In the buffer zone, only tree cutting, bird shooting and oil pump installation are forbidden, and in the experimental zone, only tree cutting and bird shooting are forbidden (see Kuenzer et al. [6]). However, despite the fact the oil pump (as well as gas pump) installation is forbidden in the core and the buffer zones of the two reserves, Kuenzer et al. [6] used highest resolution QuickBird, WorldView, SPOT, and Landsat data to prove that a rapid expansion of pumps has taken place even in these restricted zones over the past years (see also Figure 15b). Within both reserves, the number of oil pumps more than tripled from 1995 to 2013, and it could be demonstrated that the less frequented northern reserve (depicted in Figure 15b) experienced a much larger increase in illegal pumps in the core and buffer zones than did the much more frequented eastern reserve, which is a magnet for tourists and where a visitor center was set up in recent years; this information was shared with local politicians and conservationists. The spatial information could guide stricter control and provide in-depth information on what is happening when and where. However, in an area where 80% of the population profits from the oil industry, law enforcement is a major challenge. For the Niger Delta, Kuenzer et al. [5] proved the suitability of Landsat thermal band data for detecting oil industry-related gas flaring activities. Currently, the only satellite sensors in orbit with sufficient spatial resolution for flare detection are Landsat-DCM (also termed Landsat 8), which was launched in February 2013, and Sentinel-2 a and b, available since 2015 and 2017 respectively. Thermal anomaly extraction using a moving window approach revealed that nowadays, most permanent flare locations exist east of the Niger main stem, especially in the area south of Port Harcourt, as well as along a stretch between the towns of Ahoada and Ihiala, and many are located directly within the ecologically-valuable mangrove forests of the delta (see Figure 15d).
Access canals dredged by oil companies to access wells, flare sites and other infrastructure further harm the mangrove ecosystems (Figure 15c). Flare location information, as well as the timely detection of flares in thermal satellite data, is especially relevant, as several Nigerian government and NGO-driven programs in the delta aim at substantially reducing flaring by 2017 [5]. The Niger Delta is, in large parts, an area that is very difficult to access. Many locations can only be reached by boat since mangroves, wetlands, swamps and political conflict all hinder easy access. Here, Earth observation allows features and processes to be mapped for a very large area, something that could not be undertaken in situ. A number of studies have highlighted the potential of remote sensing for detecting near-coastal oil spills in aquatic environments, although delta-specific studies are still scarce. A recent review of oil spill remote sensing techniques and applications is provided by Fingas and Brown [208]. Garcia-Pineda et al. [209] used SAR imagery from multiple sensors to detect oil near shorelines during the Deepwater Horizon oil spill. Kolokoussis and Karathanassi [210] presented a method for detecting oil spills from known natural outflows and minor spills from Sentinel-2 imagery.
For Ca Mau Province in the Mekong Delta, where the dominant land use pattern is a mix of aquaculture and remaining natural mangrove patches, Vo Quoc et al. [207] demonstrated that it is possible to map mangrove density within cadastre segments to reveal whether a farmer’s land contains less than 30%, 30–70% or over 70% of mangroves. This is important information in a province where local government regulations have delineated certain zones in which mangrove cover must remain at certain percentage levels [207]. As depicted in Figure 15a, a mangrove cover map could be derived from 10 m resolution SPOT data and 2.5 m resolution TerraSAR-X data using an object-oriented approach (for methodological details see [207]). The IUCN, for example, requested such data in 2013, and declared its intention to develop a “green shrimp” farming certificate for farmers who comply with regulations not to decrease mangrove cover on their land below the required threshold. However, as De Leeuw et al. [200] correctly observed, many studies claim the potential to support the creation of policies, but so far, there is hardly any evidence of Earth observation contributing to an actual policy. They report that “the remote sensing academic community only recently started to get involved in cross-disciplinary research”, and suggest that Earth observation and social sciences need to be linked more closely to bridge the gap between the disciplines involved, and that a scientific debate on the available potential of Earth observation for the purposes of compliance monitoring needs to be nurtured (De Leeuw et al. [200]).
4.5. Earth Observation Potential for Monitoring of River Delta Land Subsidence
Extensive human development is rapidly transforming deltas through increasing urbanization, flow and sediment flux modification and agricultural intensification [16]. As a common side effect of this development, many deltas in the world are experiencing dangerous rates of land-subsidence, sometimes exceeding current rates of eustatic sea level rise, creating a situation of high vulnerability for ecosystems and humans alike [4]. Rapid subsidence in delta regions typically results from the compaction of delta sediments, triggered either by the extraction of groundwater or hydrocarbons from underlying sedimentary layers, or an increase in surface loading (i.e. construction of roads and cities) [4,7,211]. In addition, the trapping of sediments in upstream reservoirs and controlled routing of river flows across delta plains indirectly contribute to subsidence by limiting the deposition of new sediment [4,7,211]. Some prominent examples of river delta subsidence are the Chao Praya Delta (Thailand), which is sinking at a rate of 5–15cm per year, the Po Delta (Italy), which sank by about 3–5 m over the course of the 20th century [8] and embanked areas in the Ganges-Brahmaputra Delta, which have lost about 1–1.5 m in elevation since the 1960s [212].
The main challenge for quantifying subsidence in large river deltas is the lack of suitable datasets with sufficient spatial (i.e. covering the entire delta) and temporal (extending over multiyear periods) coverage, which is typically difficult and costly to generate with ground-based surveying techniques. As an alternative, Earth observation, in particular Interferometric Synthetic Aperture Radar (InSAR), provides a suitable source of data for quantifying land subsidence. InSAR is increasingly being used to quantify the land subsidence resulting from groundwater extraction, tectonic activities, sediment compaction and mining and a range of applications are summarized in Wang et al. [213].
With InSAR, quantifying vertical movements of the land surface is achieved by differencing phase observations between pairs of complex-valued radar images obtained at different points in time, which results in a series of interferograms, from which elevation change rates can be inferred (Figure 16) [213,214]. Multi-image or multi-sensor InSAR analysis techniques make it possible to derive vertical surface changes at mm-level accuracy [215]. A review of recent advances in InSAR techniques for retrieval of surface displacement time-series is provided in Pepe & Calò [215].
Numerous delta-related analysis techniques have been published. Wang et al. [213] combined multi-track interferograms from different viewing geometries generated from Envisat/ASAR data to infer subsidence time series. They found that, on average, the Pearl River Delta in China is sinking at a rate of around 3 mm per year. Higgins et al. [216] used InSAR to study vertical land subsidence in the Ganges-Brahmaputra Delta and Dhaka (Bangladesh). They used 34 ALOS Palsar L-Band SAR scenes (2007–2011) to generate a series of interferograms, revealing subsidence rates of 0 to more than 18 mm per year, with the highest rates being found in and around cities. An important result of this study is that subsidence rates in deltas are highly variable across space.
Erban et al. [217] used ALOS Palsar data from 2006–2010 to calculate subsidence rates in the lower Mekong Delta based on 78 interferograms. They compared the resulting InSAR-based subsidence rates against compaction of sedimentary layers resulting from groundwater extraction, as calculated from in situ measurements at 79 wells. Subsidence rates of around 1–4 cm per year were found over large areas in the delta, consistent with the rates of sediment compaction. The highest subsidence rates (~4 cm per year) were again found in and around cities. The authors conclude that, considering projected additional sea level rise of around 0.1 m and continuing land subsidence, the inundation hazard in the delta might increase by up to 1 m by 2050.
Minderhoud et al. [218] extended on this dataset and analyzed the connection between land-use change and locally-variable subsidence rates. Comparing the land subsidence record with annual land-use maps (2006–2010) derived from Landsat 5 images made it possible to calculate mean subsidence rates for common land-use classes (Figure 17). The highest subsidence rates (~18–20 mm per year) were found for areas with anthropogenic influence such as mixed-crop agriculture and cities, whereas the lowest rates (~6–7 mm per year) corresponded with undeveloped areas such as marshland and wetland forests. Changes in surface and groundwater tables, as well as enhanced surface loading, were identified as the primary mechanisms behind variable subsidence rates.
A number of recent subsidence studies have taken advantage of the high spatial (~20 m) and temporal (up to 5-day revisit) consistency of the Sentinel-1A and B twin satellite constellation of the European space agency [42], as well as higher-resolution platforms such as COSMO-SkyMed (ASI, Italian Space Agency) and TerraSAR-X (DLR, German Aerospace Centre). Zhang et al. [219] developed an InSAR method that exploits both persistent and distributed scatterers to map ground subsidence over the entire Yellow River Delta. They applied their method using 30 ENVISAT/ASAR images (2007–2010) and 49 Sentinel-1A images (2015–2018), and achieved a 15- and 5.1-fold higher measuring point density in mapping land subsidence for the ENVISAT and Sentinel-1A datasets respectively (compared to approaches that only use either persistent or distributed scatterers). Their results show that subsidence in the Yellow River Delta is accelerating, already showing maximum subsidence rates of 4.3 cm per year in some areas, such as the Dongying Port area shown in Figure 18. The authors identified overextraction of underground brine for salt production as the main driver of rapid ground subsidence, while groundwater extraction for industry and agriculture was established as a key driver in other areas of the delta. Ma et al. [220] recently used Sentinel-1, COSMO-SkyMed and TerraSAR-X images jointly to study subsidence patterns across the Guangdong-Hong Kong-Macao Greater Bay Area, the world’s largest deltaic city cluster, at various spatial scales. Sentinel-1 provided regional subsidence rates for the entire bay area of 0–11.23 cm per year over the 2015–2017 period; furthermore, these rates were found to be highly correlated to the distribution of sediments and largely driven by groundwater extraction and artificial loading. The high-resolution COSMO-SkyMed and TerraSAR-X datasets were applied to study fine-scaled subsidence patterns/events including the settlement (compaction) of recently reclaimed land. Apart from a few pilot studies, Sentinel-1 based studies for river delta subsidence still remain scarce.
5. Conclusions, Research Gaps, and Future Perspectives
Due to the complex nature of river deltas, delta research has always been driven by a variety of disciplines, including geomorphology, geology, sedimentology, paleontology, mineralogy, hydrology, ecology, biology, waterway and coastal engineering, agricultural sciences, resource extraction sciences and many others.
Whereas coarse resolution sensor data have been available for several decades, higher resolution data, such as the Landsat or Sentinel archives, have only become freely available in the last decade. At a time of increasing access to free data, ever-increasing computing power and ways to handle big data, transparent, standardized, and documented open source developments for image processing and the increasing technology and information affinity of society, Earth observation has experienced and will continue to experience major breakthroughs in the coming years and decades. It is even possible to envision realistic citizen science applications. Applications will no longer primarily be determined by what data is available. Comprehensive access to a variety of multisensor data will increasingly enable for stakeholder requirements and the application itself to define the scale and type of data to be employed to answer pressing, society-relevant questions and to supply planning-relevant information, ideally in a consistent service environment. According to Martinez et al. [221], for the land surface especially, the “rate of population increase in the coastal zone is higher than for the whole world and more than 50% of the coastal countries have 80-100% of their population living within 100 km of the coast” (Jennerjahn [222]). Coastal zones, and especially river delta areas with their large variety of appealing locational advantages at the interface between the ocean and the land surface, are among the most densely inhabited regions in the world, which makes them especially vulnerable to internal and external threats and general environmental change. Numerous coastal science authors, as well as river delta initiatives, have called for the provision of planning-relevant, reliable geospatial information. Thus, it has been the goal of this paper to demonstrate the potential of Earth observation for the sustainable management of natural resources in large river delta areas.
Although global remote sensing products provide a general overview of environmental parameters and land use in the selected deltas, it has to be concluded that most earth observation-derived products at the global scale are too coarse, and partially too inaccurate, to be of relevance for local stakeholders and decision makers, and can even lead to erroneous results when integrated into modelling approaches. Thus, the potential of Earth observation for individual river deltas has been elucidated, emphasizing the chances to understand delta dynamics based on the comprehensive exploitation of time series. For an understanding of delta morphology, river course development, coastline dynamics and erosion and accretion processes, the potential of Earth observation for providing planning-relevant quantitative information has been presented for selected deltas. Here, the immeasurable value of the freely available Landsat archives, now covering a time span of over three decades, could be demonstrated. Novel and freely available data of the Sentinel mission make it possible to extend and densify the Landsat-based observation time span. The potential of Earth observation for analyzing flood and inundation patterns has been laid out based on optical intra-annual MODIS time series as well as higher resolution SAR data. It has been shown that intra-annual, temporally-dense coarse resolution time series allow inundation characterization to be made of deltas globally, reflecting patterns of local geology, geomorphology and land use. Flood and inundation mapping derived from high-resolution SAR time series have made it possible to provide detailed monitoring of flooding, the relation of inundation patterns to seasonality of crops and diking patterns, as well as the derivation of permanently flooded aquaculture, which is common especially to the large river delta environments in Asia. The challenges and chances for deriving land cover and land use information were elucidated at the global scale by Kuenzer et al. [173], quantifying and underlining the large discrepancies in freely available global land cover products, even for identical years. A determination of specific regional-to-local land cover and land use was presented for selected deltas. Classification results based on the spectral reflectance signatures of uni-temporal data sets, as well as on land cover and land use maps derived from intra-annual time series (temporal signatures), were presented, and the advantages and disadvantages of both approaches discussed. The potential of Earth observation to provide information products enabling compliance monitoring has been demonstrated using the examples of the revelation of oil pump distribution in the Yellow River Delta, in some cases, within pristine protected Ramsar wetlands, where industrial activity is forbidden, and of mangrove logging and decreasing mangrove densities in Ca Mau Province of the Mekong Delta, where specific percentages of mangrove cover on farmland are required. Furthermore, oil industry impacts manifested via gas flaring and mangrove destruction in the Niger Delta have been quantified [5,6,207]. High spatial resolution remote sensing at the Landsat scale enables the detection of illegal activities.
Overall, it has already been elucidated that freely available, coarse resolution data are only of limited value for deriving delta information for local planning purposes, unless they are analyzed as temporally-dense, intra-annual time series. An example of a suitable application is the derivation of patterns of inundation dynamics or crop seasonality parameters (e.g. cycles of single, double and triple rice crops), which could not be extracted from higher resolution data on a daily basis, which has just recently become possible through time series densification (i.e. by combining Landsat, Sentinel-1 and Sentinel-2 data). For most river deltas, up-to-date geospatial information at a resolution of the Landsat/Sentinel scale or better is in demand. Here, great potential lies in synergetic analysis of this data, jointly with highest resolution data of sensors such as IKONOS, QuickBird and WolrdView. However, the latter sensors are not continuously tasked, and thus, do not usually cover complete delta areas, besides not being currently available free of charge for large areas. The research gaps identified with respect to the potential of Earth observation to aid in routinely analyzing large river delta areas are mainly information-product gaps. Long-term, continuous sensor lines and data that can be accessed without interruption are of highest relevance to enable the development of truly sustainable services.
With respect to SAR data, the following improvements and the development of so far still lacking geospatial products should be encouraged for all major river deltas globally:
- Sentinel-1 holds large potential for flood mapping services in a fully operational context. Water cover information could be derived automatically for every acquired Sentinel-1 data set. Automated derivation of snow and ice information might be an additional asset, especially for applications relating to polar deltas. Depending on the availability of the TerraSAR-X/Tandem-X-based WorldDEM at the highest resolution, the calculation of sea level rise-related flood scenarios using a refined Manning roughness coefficient is strongly encouraged at a global scale for varying scenarios of 50, 100, 150 and 200 cm of sea level rise, possibly including information on river delta subsidence rates. Furthermore, 3D information on areas within the delta, e.g., sandbar heights, mangrove canopy heights, building heights, etc., is important for assessing the functionality of storm surge protection barriers or flood impacts, for example.
- River delta subsidence should be re-assessed in a standardized, well-documented approach based on differential SAR interferometry, utilizing Sentinel-1 data for all river deltas globally. Local subsidence phenomena can then be investigated with respect to cause (such as land compaction through urbanization or underground resource extraction) and relative to sea level rise modelling.
With respect to optical and multispectral data analysis, the following product improvements and development of so far still lacking geospatial products should be encouraged:
- High-quality land cover and land use maps at 30 to 10 m spatial resolution and higher are needed for each major delta (as well as globally). These should be derived based on intra-annual time series, which will be possible to undertake once temporally-dense time series can be compiled based on Landsat 5 TM, Landsat 8 DCM, as well as Sentinel-2 data, which can provide twice-per-week coverage. An intra-annual time series approach is needed to differentiate agricultural crops and other types of vegetation and land use, and to monitor usage intensity and land use change over time
- Flood and inundation mapping, as well as inland water quality assessments of colored dissolved organic matter and sediment load, will also become possible based on such high resolution optical and multispectral data, if such data can be provided in a temporally-dense manner, such as with twice-per-week coverage. This will then not only make it possible to monitor coastal waters and large inland lakes, but will even enable the derivation of water quality statuses in large, near-shore (inland) aquaculture areas, as well as in small lakes, pools and delta/estuary river branches and canals.
- Another field offering the possibility of new applications and services is Earth observation-based geo-health analysis. While remote sensing-based rapid mapping for disaster relief is already well established, Earth observation still has to reveal its full potential in the field of geo-health. Studies based on coarse resolution data to very roughly delineate areas of malaria, dengue or schistosomiasis risk have been published, but the availability of an intra-annual time series with up to 5 or 10 m spatial resolution would offer more chances to develop seasonal health risk indicators and warning systems for selected densely-populated deltas of interest.
- Highest-resolution data from sensors such as IKONOS, QuickBird, WorldView or even Skybox and the Planet Doves and similar sensors could, if made freely available, open up a completely new field in Earth observation: “inventorying and accounting”. Inventorying refers to actually counting relevant objects in river deltas that cannot be explicitly extracted from data at the spatial resolution of Sentinel-2. This would enable the retrieval of information such as the number of ships anchored in harbors, the number of large industrial plants present in the delta, or the number of oil-pumps within wetlands, to give only three examples. Multi-temporal studies in this context could yield highly quantitative indicators on a region’s socio-economic development, trends of hazard exposure, and the general “shift of things” (rather than changes in land use). Here, novel remote sensing algorithms from the field of Artificial Intelligence, AI, using Graphical Processing Unit, GPU, computing power are currently on the advance. However, no large-scale studies have been published so far.
There is surely a large number of further river delta-related research and product gaps that could be addressed, but the ones mentioned here are expected to be the most crucial and intriguing within the next five years. Based on such improved decision support products indicating environmental change, the speed of change, change trends, threatened ecosystem services, exposure, vulnerability, resilience and many more can be derived. However, while pioneering fundamental research will always be needed and must be encouraged and financially supported, at the same time, scientists in applied research fields should not neglect the applicability and usability of their results. To support decision makers and stakeholders in formulating their needs and interests with respect to geospatial information products, it is also the responsibility of the Earth observation community to showcase and illustrate what is, what will be, and what might never be possible with remote sensing data.
Author Contributions
C.K. performed the literature review, designed the exemplary research examples and wrote the majority of the manuscript. V.H. added additional literature and critical feedback into the manuscript and wrote the part on land subsidence. J.H. helped with the design of figures and critically reviewed the manuscript. S.D. guided the research over consecutive years of river delta related research at EOC of DLR.
Funding
This research received no external funding.
Conflicts of Interest
The authors declare no conflict of interest.
References
- Evans, G. Deltas: The Fertile Dustbins of the Continents. Proc. Geol. Assoc. 2012, 123, 397–418. [Google Scholar] [CrossRef]
- Kuenzer, C.; Renaud, F. Climate Change and Environmental Change in River Deltas Globally. In The Mekong Delta System—Interdisciplinary Analyses of a River Delta; Kuenzer, C., Renaud, F., Eds.; Springer: Dordrecht, The Netherlands, 2012; pp. 7–48. [Google Scholar] [CrossRef]
- Anthony, E.J. Deltas. In Coastal Environments and Global Change; Masselink, G., Gehrels, R., Eds.; John Wiley & Sons: Chichester, UK, 2014. [Google Scholar]
- Syvitski, J.P.M. Deltas at Risk. Sustain. Sci. 2008, 3, 23–32. [Google Scholar] [CrossRef]
- Kuenzer, C.; Van Beijma, S.; Gessner, U.; Dech, S. Land Surface Dynamics and Environmental Challenges of the Niger Delta, Africa: Remote Sensing-Based Analyses Spanning Three Decades (1986–2013). Appl. Geogr. 2014, 53, 354–368. [Google Scholar] [CrossRef]
- Kuenzer, C.; Ottinger, M.; Liu, G.; Sun, B.; Baumhauer, R.; Dech, S. Earth Observation-Based Coastal Zone Monitoring of the Yellow River Delta: Dynamics in China’s Second Largest Oil Producing Region over Four Decades. Appl. Geogr. 2014, 55, 92–107. [Google Scholar] [CrossRef]
- Syvitski, J.P.M.; Kettner, A.J.; Overeem, I.; Hutton, E.W.H. Sinking Deltas Due to Human Activities. Nat. Geosci. 2009, 2, 681–686. [Google Scholar] [CrossRef]
- Giosan, L.; Syvitski, J.; Is, S.C.; Day, J. Protect the World’s Deltas. Nature 2014, 516, 31–33. [Google Scholar] [CrossRef] [PubMed]
- Kuenzer, C.; Tuan, V.Q. Assessing the Ecosystem Services Value of Can Gio Mangrove Biosphere Reserve: Combining Earth-Observation- and Household-Survey-Based Analyses. Appl. Geogr. 2013, 45, 167–184. [Google Scholar] [CrossRef]
- Kuenzer, C.; Campbell, I.; Roch, M.; Leinenkugel, P.; Vo, T.; Dech, S. Understanding the Impacts of Hydropower Developments in the Context of Upstream–Downstream Relations in the Mekong River Basin. Sustain. Sci. 2013, 8, 565–584. [Google Scholar] [CrossRef]
- Saito, Y.; Chaimanee, N.; Jarupongsakul, T.; Syvitski, J. Shrinking Megadeltas in Asia: Sea-Level Rise and Sediment Reduction Impacts from Case Study of the Chao Phraya Delta. LOICZ Inprint 2007, 2007, 3–9. [Google Scholar]
- Kuenzer, C.; Klein, I.; Ullmann, T.; Georgiou, E.; Baumhauer, R.; Dech, S. Remote Sensing of River Delta Inundation: Exploiting the Potential of Coarse Spatial Resolution, Temporally-Dense MODIS Time Series. Remote Sens. 2015, 7, 8516–8542. [Google Scholar] [CrossRef] [Green Version]
- Yang, X. Remote Sensing and Geospatial Technologies for Coastal Ecosystem Assessment and Management; Springer: Berlin, Germany, 2009. [Google Scholar]
- Foufoula-Georgiou, E.; Syvitski, J.; Paola, C.; Hoanh, C.T.; Tuong, P.; Vörösmarty, C.; Kremer, H.; Brondizio, E.; Saito, Y.; Twilley, R. International Year of Deltas 2013: A Proposal. EosTrans. Am. Geophys. Union 2011, 92, 340–341. [Google Scholar] [CrossRef]
- McFadden, L. Governing Coastal Spaces: The Case of Disappearing Science in Integrated Coastal Zone Management. Coast. Manag. 2007, 35, 429–443. [Google Scholar] [CrossRef]
- Renaud, F.G.; Syvitski, J.P.M.; Sebesvari, Z.; Werners, S.E.; Kremer, H.; Kuenzer, C.; Ramesh, R.; Jeuken, A.; Friedrich, J. Tipping from the Holocene to the Anthropocene: How Threatened Are Major World Deltas? Curr. Opin. Environ. Sustain. 2013, 5, 644–654. [Google Scholar] [CrossRef]
- Sebesvari, Z.; Renaud, F.; Haas, S.; Tessler, Z.; Kloos, J.; Szabo, S.; Vogt, N.; Tejedor, A.; Brondizio, E.; Kuenzer, C. Vulnerability Indicators for Deltaic Social-Ecological Systems: A Review. Sustain. Sci. 2016, 11, 575–590. [Google Scholar] [CrossRef]
- Delta Alliance. Available online: www.delta-alliance.org (accessed on 19 July 2019).
- World Estuarine Alliance. Available online: http://www.climatedeltaconference.org/networks/world-estuarine-alliance (accessed on 19 July 2019).
- Connecting Delta Cities. Available online: https://www.c40.org/networks/connecting_delta_cities (accessed on 19 July 2019).
- UN World Conference on Disaster Risk Reduction. Available online: www.un.org/sustainabledevelopment/un-world-conference-on-disaster-risk-reduction (accessed on 19 July 2019).
- Kuenzer, C.; Huth, J.; Martinis, S.; Lu, L.; Dech, S. SAR Time Series for the Analysis of Inundation Patterns in the Yellow River Delta, China. In Remote Sensing Time Series Analyses revealing Land Surface Dynamics; Kuenzer, C., Dech, S., Wagner, W., Eds.; Springer: Dordrecht, The Netherlands, 2015; pp. 427–441. [Google Scholar]
- Wolters, M.L.; Kuenzer, C. Vulnerability Assessments of Coastal River Deltas—Categorization and Review. J. Coast. Conserv. Plan. Manag. 2015, 19, 345–368. [Google Scholar] [CrossRef]
- Dolgopolova, E. Response of River Mouths of Permafrost Zone of Russia to Climate Changes. In Proceedings of the Deltas in Times of Climate Change, International Conference, Rotterdam, The Netherlands, 29 September–1 October 2010; pp. 40–41. [Google Scholar]
- Ullmann, T.; Schmitt, A.; Roth, A.; Duffe, J.; Dech, S.; Hubberten, H.W.; Baumhauer, R. Land Cover Characterization and Classification of Arctic Tundra Environments by Means of Polarized Sythetic and C-Band Radar (PolSAR) and Landsat 8 Multispectral Imagery—Richards Island, Canada. Remote Sens. 2014, 6, 8565–8593. [Google Scholar] [CrossRef]
- Syvitski, J.P.M.; Harvey, N.; Wolanski, E.; Burnett, W.C.; Perillo, G.M.E.; Gornitz, V. Dynamics of the Coastal Zone. In Coastal Change and the Anthropocene: The Land-Ocean Interactions in the Coastal Zone Project of the International Geosphere-Biosphere Programme; Global Change—The IGBP Series; Crossland, C.J., Kremer, H.H., Lindeboom, H.J., Crossland, J.I.M., Le Tissier, M.D.A., Eds.; Springer: Berlin/Heidelberg, Germany, 2005; pp. 39–94. [Google Scholar]
- IPCC (Intergovernmental Panel on Climate Change). Climate Change 2007: The Physical Science Basis. Working Group I Contribution to the Fourth Assessment Report of the IPCC; Cambridge University Press: New York, NY, USA, 2007. [Google Scholar]
- IPCC (Intergovernmental Panel on Climate Change). Climate Change 2013—The Physical Science Basis: Contribution of Working Group I to the Fifth Assessment. Report of the Intergovernmental Panel on Climate Change; Cambridge University Press: New York, NY, USA, 2013. [Google Scholar]
- IPCC (Intergovernmental Panel on Climate Change). Climate Change 2001: Impacts, Adaptation, and Vulnerability. Contribution of Working Group II to the Third Assessment Report of the Intergovernmental Panel on Climate Change (IPCC); Cambridge University Press: New York, NY, USA, 2001. [Google Scholar]
- Rozema, J. Perspective of Saline Agriculture for Deltas in Times of Changing Climate. In Proceedings of the Deltas in Times of Climate Change, International Conference, Rotterdam, The Netherlands, 29 September–1 October 2010; p. 67. [Google Scholar]
- Törnqvist, T.; Yu, S.; González, J.; Hu, P.; Meffert, D. Sea-Level Rise and Subsidence: A Dual Threat for the Mississippi Delta. In Proceedings of the Deltas in Times of Climate Change, International Conference, Rotterdam, The Netherlands, 29 September–1 October 2010; pp. 9–10. [Google Scholar]
- Fröhle, P. Sea Level Rise and Coastal Protection—Adaptation Strategies for Sandy Coasts. In Continents under Climate Change; Endlicher, W., Gerstengarbe, F.-W., Eds.; Nova Acta Leopoldina: Munich, Germany, 2010; pp. 77–88. [Google Scholar]
- Pham, D.Q. The Urbanized Mekong Delta in Vietnam: From “living with Floods” to Adaptation. In Proceedings of the Deltas in Times of Climate Change, International Conference, Rotterdam, The Netherlands, 29 September–1 October 2010; p. 109. [Google Scholar]
- Kuenzer, C.; Vo Kakh, T.; Wehrmann, T.; Le Van, T.; Gebhardt, S.; Lam Dao, N.; Renaud, F.; Thanh Tran, B.; Waibel, G.; Huynh Ngoc, T.; et al. An Information System for the Sustainable Development of the Mekong Delta. In Proceedings of the Deltas in Times of Climate Change, International Conference, Rotterdam, The Netherlands, 29 September–1 October 2010; p. 212. [Google Scholar]
- Wulder, M.A.; Masek, J.G.; Cohen, W.B.; Loveland, T.R.; Woodcock, C.E. Opening the Archive: How Free Data Has Enabled the Science and Monitoring Promise of Landsat. Remote Sens. Environ. 2012, 122, 2–10. [Google Scholar] [CrossRef]
- Kuenzer, C.; Dech, S.; Wagner, W. Remote Sensing Time Series Revealing Land Surface Dynamics: Status Quo and the Pathway Ahead. In Remote Sensing Time Series Analyses Revealing Land Surface Dynamics; Kuenzer, C., Dech, S., Wagner, W., Eds.; Springer: Dordrecht, The Netherlands, 2015; pp. 2–25. [Google Scholar]
- Hostert, P.; Griffiths, P.; Van der Linden, S.; Pflugmacher, D. Time Series Analyses in a New Era of Optical Satellite Data. In Remote Sensing Time Series: Revealing Land Surface Dynamics; Kuenzer, C., Dech, S., Wagner, W., Eds.; Springer International Publishing: Cham, Switzerland, 2015; pp. 25–41. [Google Scholar] [CrossRef]
- Wulder, M.A.; Coops, N.C. Satellites: Make Earth Observations Open Access. Nature 2014, 513, 30–31. [Google Scholar] [CrossRef]
- Friedl, M.A.; McIver, D.K.; Hodges, J.C.F.; Zhang, X.Y.; Muchoney, D.; Strahler, A.H.; Woodcock, C.E.; Gopal, S.; Schneider, A.; Cooper, A.; et al. Global Land Cover Mapping from MODIS: Algorithms and Early Results. Remote Sens. Environ. 2002, 83, 287–302. [Google Scholar] [CrossRef]
- Friedl, M.A.; Sulla-Menashe, D.; Tan, B.; Schneider, A.; Ramankutty, N.; Sibley, A.; Huang, X. MODIS Collection 5 Global Land Cover: Algorithm Refinements and Characterization of New Datasets. Remote Sens. Environ. 2010, 114, 168–182. [Google Scholar] [CrossRef]
- Roy, D.P.; Wulder, M.A.; Loveland, T.R.; Woodcock, C.E.; Allen, R.G.; Anderson, M.C.; Helder, D.; Irons, J.R.; Zhu, Z. Landsat- Science and Product Vision for Terrestrial Global Change Research. Remote Sens. Environ. 2014, 8, 154–172. [Google Scholar] [CrossRef]
- Rott, H.; Cihlar, J.; Schaepman, M.E.; García-santos, G.; Fernandes, R.; Berger, M. Sentinels for Science: Potential of Sentinel-1, -2, and -3 Missions for Scientific Observations of Ocean, Cryosphere, and Land. Remote Sens. Environ. 2012, 120, 91–101. [Google Scholar] [CrossRef]
- Shneiderman, B. The Big Picture for Big Data: Visualization. Science 2014, 343, 730. [Google Scholar] [CrossRef] [PubMed]
- Cate, F.H. The Big Data Debate. Science 2014, 346, 818. [Google Scholar] [CrossRef]
- Andreas, D.; Kuenzer, C.; Conrad, C. Snow Cover Variability in Central Asia between 2000 and 2011 Derived from Improved MODIS Daily Snow Cover Products. Int. J. Remote Sens. 2013, 34, 3879–3902. [Google Scholar] [CrossRef]
- Kuenzer, C.; Ottinger, M.; Wegmann, M.; Guo, H.; Wang, C.; Zhang, J.; Dech, S.; Wikelski, M. Earth Observation Satellite Sensors for Biodiversity Monitoring: Potentials and Bottlenecks. Int. J. Remote Sens. 2014, 35, 6599–6647. [Google Scholar] [CrossRef]
- Lasaponara, R.; Lanorte, A. Satellite Time-Series Analysis. Int. J. Remote Sens. 2012, 33, 4649–4652. [Google Scholar] [CrossRef]
- Jönsson, P.; Eklundh, L. TIMESAT—A Program for Analyzing Time-Series of Satellite Sensor Data. Comput. Geosci. 2004, 30, 833–845. [Google Scholar] [CrossRef]
- Gorelick, N.; Hancher, M.; Dixon, M.; Ilyushchenko, S.; Thau, D.; Moore, R. Google Earth Engine: Planetary-Scale Geospatial Analysis for Everyone. Remote Sens. Environ. 2017. [Google Scholar] [CrossRef]
- Nativi, S.; Mazzetti, P.; Santoro, M.; Papeschi, F.; Craglia, M.; Ochiai, O. Big Data Challenges and Solutions in Building the Global Earth Observation System of Systems. Environ. Model. Softw. 2015, 68, 26. [Google Scholar] [CrossRef]
- Chu, Z.X.; Sun, X.G.; Zhai, S.K.; Xu, K.H. Changing Pattern of Accretion/Erosion of the Modern Yellow River (Huanghe) Subaerial Delta, China: Based on Remote Sensing Images. Mar. Geol. 2006, 227, 13–30. [Google Scholar] [CrossRef]
- Chu, Z.; Yang, X.; Feng, X.; Fan, D.; Li, Y.; Shen, X.; Miao, A. Temporal and Spatial Changes in Coastline Movement of the Yangtze Delta during 1974–2010. J. Asian Earth Sci. 2013, 66, 166–174. [Google Scholar] [CrossRef]
- Cui, B.; Li, X.-Y. Coastline Change of the Yellow River Estuary and Its Response to the Sediment and Runoff (1976–2005). Geomorphology 2011, 127, 32–40. [Google Scholar] [CrossRef]
- Fan, H.; Huang, H.; Zeng, T.Q.; Wang, K. River Mouth Bar Formation, Riverbed Aggradation and Channel Migration in the Modern Huanghe (Yellow) River Delta, China. Geomorphology 2006, 74, 124–136. [Google Scholar] [CrossRef]
- Li, X.; Damen, M. Coastline Change Detection with Satellite Remote Sensing for Environmental Management of the Pearl River Estuary, China. J. Mar. Syst. 2010, 82, 54–61. [Google Scholar] [CrossRef]
- Petropoulos, G.P.; Kalivas, D.P.; Griffiths, H.M.; Dimou, P.P. Remote Sensing and GIS Analysis for Mapping Spatio-Temporal Changes of Erosion and Deposition of Two Mediterranean River Deltas: The Case of the Axios and Aliakmonas Rivers, Greece. Int. J. Appl. Earth Obs. Geoinf. 2015, 35, 217–228. [Google Scholar] [CrossRef]
- Zhao, B.; Guo, H.; Yan, Y.; Wang, Q.; Li, B. A Simple Waterline Approach for Tidelands Using Multi-Temporal Satellite Images: A Case Study in the Yangtze Delta. Estuar. Coast. Shelf Sci. 2008, 77, 134–142. [Google Scholar] [CrossRef]
- Mentaschi, L.; Vousdoukas, M.I.; Pekel, J.; Voukouvalas, E.; Feyen, L. Global Long-Term Observations of Coastal Erosion and Accretion. Sci. Rep. 2018, 11. [Google Scholar] [CrossRef]
- Luijendijk, A.; Hagenaars, G.; Ranasinghe, R.; Baart, F.; Donchyts, G.; Aarninkhof, S. The State of the World’s Beaches. Sci. Rep. 2018, 11. [Google Scholar] [CrossRef]
- Klok, L.; Van Harmelen, T.; Janssen, S. Urban Heat and Heat Stress in Rotterdam. In Proceedings of the Deltas in Times of Climate Change, International Conference, Rotterdam, The Netherlands, 29 September–1 October 2010; pp. 141–142. [Google Scholar]
- Grings, F.; Salvia, M.; Karszenbaum, H.; Ferrazzoli, P.; Kandus, P.; Perna, P. Exploring the Capacity of Radar Remote Sensing to Estimate Wetland Marshes Water Storage. J. Environ. Manag. 2008, 90, 2189–2198. [Google Scholar] [CrossRef]
- Raspini, F.; Loupasakis, C.; Rozos, D.; Adam, N.; Moretti, S. Ground Subsidence Phenomena in the Delta Municipality Region (Northern Greece): Geotechnical Modeling and Validation with Persistent Scatterer Interferometry. Int. J. Appl. Earth Obs. Geoinf. 2014, 28, 78–89. [Google Scholar] [CrossRef]
- Higgins, S.; Overeem, I.; Tanaka, A.; Syvitski, J. Land Subsidence at Aquaculture Facilities in the Yellow River Delta, China. Geophys. Res. Lett. 2013, 40, 3898–3902. [Google Scholar] [CrossRef]
- Dickins, D.; Hearon, G.; Morris, K.; Ambrosius, K.; Horowitz, W. Mapping Sea Ice Overflood Using Remote Sensing: Alaskan Beaufort Sea. Cold Reg. Sci. Technol. 2011, 65, 275–285. [Google Scholar] [CrossRef]
- Syvitski, J.P.M.; Overeem, I.; Brakenridge, G.R.; Hannon, M. Floods, Floodplains, Delta Plains—A Satellite Imaging Approach. Sediment. Geol. 2012, 267, 14. [Google Scholar] [CrossRef]
- Bowers, D.G.; Evans, D.; Thomas, D.N.; Ellis, K.; Williams, P.L.B. Interpreting the Colour of an Estuary. Estuar. Coast. Shelf Sci. 2004, 59, 13–20. [Google Scholar] [CrossRef]
- Brito, A.C.; Benyoucef, I.; Jesus, B.; Brotas, V.; Gernez, P.; Mendes, C.R.; Launeau, P.; Dias, M.P.; Barillé, L. Seasonality of Microphytobenthos Revealed by Remote-Sensing in a South European Estuary. Cont. Shelf Res. 2013, 66, 83–91. [Google Scholar] [CrossRef]
- Chen, Z.; Li, Y.; Pan, J. Distributions of Colored Dissolved Organic Matter and Dissolved Organic Carbon in the Pearl River Estuary, China. Cont. Shelf Res. 2004, 24, 1845–1856. [Google Scholar] [CrossRef]
- Chen, C.; Tang, S.; Pan, Z.; Zhan, H.; Larson, M.; Jönsson, L. Remotely Sensed Assessment of Water Quality Levels in the Pearl River Estuary, China. Mar. Pollut. Bull. 2007, 54, 1267–1272. [Google Scholar] [CrossRef]
- Chung, H.W.; Liu, C.C.; Chiu, Y.S.; Liu, J.T. Spatiotemporal Variation of Gaoping River Plume Observed by Formosat-2 High Resolution Imagery. J. Mar. Syst. 2014, 132, 28–37. [Google Scholar] [CrossRef]
- Davies, P. Nutrient Processes and Chlorophyll in the Estuaries and Plume of the Gulf of Papua. Cont. Shelf Res. 2004, 24, 2317–2341. [Google Scholar] [CrossRef]
- Dogliotti, A.I.; Ruddick, K.G.; Nechad, B.; Doxaran, D.; Knaeps, E. A Single Algorithm to Retrieve Turbidity from Remotely-Sensed Data in All Coastal and Estuarine Waters. Remote Sens. Environ. 2015, 156, 157–168. [Google Scholar] [CrossRef]
- Matthews, M.W. A Current Review of Empirical Procedures of Remote Sensing in Inland and Near-Coastal Transitional Waters. Int. J. Remote Sens. 2011, 32, 6855–6899. [Google Scholar] [CrossRef]
- Hoepffner, N.; Zibordi, G. Optical Remote Sensing of Coastal Waters; Cochran, J.K., Hoepffner, H.J., Eds.; Academic Press: Cambridge, MA, USA, 2019. [Google Scholar] [CrossRef]
- Ingleton, T.; McMinn, A. Thermal Plume Effects: A Multi-Disciplinary Approach for Assessing Effects of Thermal Pollution on Estuaries Using Benthic Diatoms and Satellite Imagery. Estuar. Coast. Shelf Sci. 2012, 99, 132–144. [Google Scholar] [CrossRef]
- Islam, M.R.; Begum, S.F.; Yamaguchi, Y.; Ogawa, K. Distribution of Suspended Sediment in the Coastal Sea off the Ganges-Brahmaputra River Mouth: Observation from TM Data. J. Mar. Syst. 2002, 307–321. [Google Scholar] [CrossRef]
- Keith, D.J. Satellite Remote Sensing of Chlorophyll a in Support of Nutrient Management in the Neuse and Tar–Pamlico River (North Carolina) Estuaries. Remote Sens. Environ. 2014, 153, 61–78. [Google Scholar] [CrossRef]
- Larouche, P.; Boyer-Villemaire, U. Suspended Particulate Matter in the St. Lawrence Estuary and Gulf Surface Layer and Development of a Remote Sensing Algorithm. Estuar. Coast. Shelf Sci. 2010, 90, 241–249. [Google Scholar] [CrossRef]
- Lavery, P.; Pattiaratchi, C.; Wyllie, A.; Hick, P. Water Quality Monitoring in Estuarine Waters Using the Landsat Thematic Mapper. Remote Sens. Environ. 1993, 46, 268–280. [Google Scholar] [CrossRef]
- Le, C.; Hu, C.; English, D.; Cannizzaro, J.; Chen, Z.; Feng, L.; Boler, R.; Kovach, C. Towards a Long-Term Chlorophyll-a Data Record in a Turbid Estuary Using MODIS Observations. Prog. Oceanogr. 2013, 109, 90–103. [Google Scholar] [CrossRef]
- Le, C.; Hu, C.; English, D.; Cannizzaro, J.; Kovach, C. Climate-Driven Chlorophyll-a Changes in a Turbid Estuary: Observations from Satellites and Implications for Management. Remote Sens. Environ. 2013, 130, 11–24. [Google Scholar] [CrossRef]
- Loisel, H.; Mangin, A.; Vantrepotte, V.; Dessailly, D.; Dinh Ngoc, D.; Garnesson, P.; Ouillon, S.; Lefebvre, J.; Meriaux, X.; Minh Thu, P. Variability of Suspended Particulate Matter Concentration in Coastal Waters under the Mekong’s Influence from Ocean Color (MERIS) Remote Sensing over the Last Decade. Remote Sens. Environ. 2014, 150, 218–230. [Google Scholar] [CrossRef]
- Mendes, R.; Vaz, N.; Fernández-Nóvoa, D.; Da Silva, J.C.B.; DeCastro, M.; Gómez-Gesteira, M.; Dias, J.M. Observation of a Turbid Plume Using MODIS Imagery: The Case of Douro Estuary (Portugal). Remote Sens. Environ. 2014, 154, 127–138. [Google Scholar] [CrossRef]
- Menon, H.; Lotliker, A.; Nayak, S. Analysis of Estuarine Colour Components during Non-Monsoon Period through Ocean Colour Monitor. Estuar. Coast. Shelf Sci. 2006, 66, 523–531. [Google Scholar] [CrossRef]
- Mishra, A.K. Retrieval of Suspended Sediment Concentration in the Estuarine Waters Using IRS-1C WiFS Data. Int. J. Appl. Earth Obs. Geoinf. 2004, 6, 83–95. [Google Scholar] [CrossRef]
- Moreira, D.; Simionato, C.; Gohin, F.; Cayocca, F.; Luz Clara, M. Suspended Matter Mean Distribution and Seasonal Cycle in the Rio de La Plata Estuary and the Adjacent Shelf from Ocean Color Satellite (MODIS) and in-Situ Observations. Cont. Shelf Res. 2013, 68, 51–66. [Google Scholar] [CrossRef]
- Petus, C.; Marieu, V.; Novoa, S.; Chust, G.; Bruneau, N.; Froidefond, J.-M. Monitoring Spatio-Temporal Variability of the Adour River Turbid Plume (Bay of Biscay, France) with MODIS 250-m Imagery. Cont. Shelf Res. 2013, 74. [Google Scholar] [CrossRef]
- Qing, S.; Zhang, J.; Cui, T.; Bao, Y. Retrieval of Sea Surface Salinity with MERIS and MODIS Data in the Bohai Sea. Remote Sens. Environ. 2013, 136, 117–125. [Google Scholar] [CrossRef]
- Shen, F.; Zhou, Y.; Li, J.; He, Q.; Verhoef, W. Remotely Sensed Variability of the Suspended Sediment Concentration and Its Response to Decreased River Discharge in the Yangtze Estuary and Adjacent Coast. Cont. Shelf Res. 2013, 69, 52–61. [Google Scholar] [CrossRef]
- Simionato, C.; Luz Clara, M.; Campetella, C.; Guerrero, R.; Moreira, D. Patterns of Sea Surface Temperature Variability on Seasonal to Sub-Annual Scales at and Offshore the Río de La Plata Estuary. Cont. Shelf Res. 2010, 30, 1983–1997. [Google Scholar] [CrossRef]
- Stumpf, R.P.; Tyler, M.A. Satellite Detection of Bloom and Pigment Distributions in Estuaries. Remote Sens. Environ. 1988, 24, 385–404. [Google Scholar] [CrossRef]
- Sun, D.; Hu, C.; Qiu, Z.; Cannizzaro, J.P.; Barnes, B.B. Influence of Red Band-Based Water Classification Approach on Chlorophyll Algorithms for Optically Complex Estuaries. Remote Sens. Environ. 2014, 155. [Google Scholar] [CrossRef]
- Tang, D.R.; Kester, D.; Ni, I.-H.; Qi, Y.; Kawamura, H. In Situ and Satellite Observations of a Harmful Algal Bloom and Water Condition at the Pearl River Estuary in Late Autumn 1998. Harmful Algae 2003, 2, 89–99. [Google Scholar] [CrossRef]
- Vaz, N.; Mateus, M.; Plecha, S.; Sousa, M.; Leitão, P.; Neves, R.; Dias, J. Modeling SST and Chlorophyll Patterns in a Coupled Estuary-Coastal System of Portugal: The Tagus Case Study. J. Mar. Syst. 2014, 147. [Google Scholar] [CrossRef]
- Walker, N.D. Satellite Assessment of Mississippi River Plume Variability: Causes and Predictability. Remote Sens. Environ. 1996, 58, 21–35. [Google Scholar] [CrossRef]
- Woodruff, D.; Stumpf, R.; Scope, J.A.; Paerl, H. Remote Estimation of Water Clarity in Optically Complex Estuarine Waters. Remote Sens. Environ. 1999, 68, 41–52. [Google Scholar] [CrossRef]
- Xie, H.; Aubry, C.; Bélanger, S.; Song, G. The Dynamics of Absorption Coefficients of CDOM and Particles in the St. Lawrence Estuarine System: Biogeochemical and Physical Implications. Mar. Chem. Mar Chem. 2011, 128. [Google Scholar] [CrossRef]
- Zhu, W.; Tian, Y.; Yu, Q.; Becker, B. Using Hyperion Imagery to Monitor the Spatial and Temporal Distribution of Colored Dissolved Organic Matter in Estuarine and Coastal Regions. Remote Sens. Environ. 2014, 134, 342–354. [Google Scholar] [CrossRef]
- Gholizadeh, M.H.; Assefa, M.M.; Reddi, L. A Comprehensive Review on Water Quality Parameters Estimation Using Remote Sensing Techniques. Sensors 2016, 16, 1298. [Google Scholar] [CrossRef]
- Donlon, C.; Berruti, B.; Buongiorno, A.; Ferreira, M.H.; Féménias, P.; Frerick, J.; Goryl, P.; Klein, U.; Laur, H.; Mavrocordatos, C.; et al. The Global Monitoring for Environment and Security (GMES) Sentinel-3 Mission. Remote Sens. Environ. 2012, 120, 37–57. [Google Scholar] [CrossRef]
- Ogashawara, I. The Use of Sentinel-3 Imagery to Monitor Cyanobacterial Blooms. Ennvironments 2019, 6, 60. [Google Scholar] [CrossRef]
- Wang, Q.; Atkinson, P.M. Spatio-Temporal Fusion for Daily Sentinel-2 Images. Remote Sens. Environ. 2018, 204, 31–42. [Google Scholar] [CrossRef]
- Dibarboure, G.; Pujol, M.I. Improving the Quality of Sentinel-3A Data with a Hybrid Mean Sea Surface Model, and Implications for Sentinel-3B and SWOT. Adv. Space Res. 2019. [Google Scholar] [CrossRef]
- Long, C.M.; Pavelsky, T.M. Remote Sensing of Suspended Sediment Concentration and Hydrologic Connectivity in a Complex Wetland Environment. Remote Sens. Environ. 2013, 129, 197–209. [Google Scholar] [CrossRef]
- Doxaran, D.; Froidefond, J.-M.; Castaing, P.; Babin, M. Dynamics of the Turbidity Maximum Zone in a Macrotidal Estuary (the Gironde, France): Observations from Field and MODIS Satellite Data. Estuar. Coast. Shelf Sci. 2009, 81, 321–332. [Google Scholar] [CrossRef]
- Zhang, M.; Dong, Q.; Cui, T.; Xue, C.; Zhang, S. Suspended Sediment Monitoring and Assessment for Yellow River Estuary from Landsat TM and ETM+ Imagery. Remote Sens. Environ. 2014, 146, 136–147. [Google Scholar] [CrossRef]
- Doron, M.; Bélanger, S.; Doxaran, D.; Babin, M. Spectral Variations in the Near-Infrared Ocean Reflectance. Remote Sens. Environ. 2011, 115, 1617–1631. [Google Scholar] [CrossRef]
- Güttler, F.N.; Niculescu, S.; Gohin, F. Turbidity Retrieval and Monitoring of Danube Delta Waters Using Multi-Sensor Optical Remote Sensing Data: An Integrated View from the Delta Plain Lakes to the Western–northwestern Black Sea Coastal Zone. Remote Sens. Environ. 2013, 132, 86–101. [Google Scholar] [CrossRef]
- Froidefond, J.-M.; Castaing, P.; Mirmand, M.; Ruch, P. Analysis of the Turbid Plume of the Gironde (France) Based on SPOT Radiometric Data. Remote Sens. Environ. 1991, 36, 149–163. [Google Scholar] [CrossRef]
- Wei, G.; Tang, D.; Wang, S. Distribution of Chlorophyll and Harmful Algal Blooms (HABs): A Review on Space Based Studies in the Coastal Environments of Chinese Marginal Seas. Adv. Space Res. 2008, 41, 12–19. [Google Scholar] [CrossRef]
- Aurin, D.A.; Dierssen, H.M. Advantages and Limitations of Ocean Color Remote Sensing in CDOM-Dominated, Mineral-Rich Coastal and Estuarine Waters. Remote Sens. Environ. 2012, 125, 181–197. [Google Scholar] [CrossRef]
- Gohin, F.; Saulquin, B.; Oger-Jeanneret, H.; Lozach, L.; Lampert, L.; Alain, L.; Riou, P.; Bruchon, F. Towards a Better Assessment of the Ecological Status of Coastal Waters Using Satellite-Derived Chlorophyll-a Concentrations. Remote Sens. Environ. 2008, 112, 3329–3340. [Google Scholar] [CrossRef]
- Shanmugam, P.; Ahn, Y.-H.; Ram, P.S. SeaWiFS Sensing of Hazardous Algal Blooms and Their Underlying Mechanisms in Shelf-Slope Waters of the Northwest Pacific during Summer. Remote Sens. Environ. 2008, 112, 3248–3270. [Google Scholar] [CrossRef]
- Mustard, J.F.; Carney, M.A.; Sen, A. The Use of Satellite Data to Quantify Thermal Effluent Impacts. Estuar. Coast. Shelf Sci. 1999, 49, 509–524. [Google Scholar] [CrossRef] [Green Version]
- He, L.; Li, G.; Li, K.; Shu, Y. Estimation of Regional Sea Level Change in the Pearl River Delta from Tide Gauge and Satellite Altimetry Data. Estuar. Coast. Shelf Sci. 2014, 141, 69–77. [Google Scholar] [CrossRef]
- Kouraev, A.V.; Zakharova, E.A.; Samain, O.; Mognard, N.M.; Cazenave, A. Ob’River Discharge from TOPEX/Poseidon Satellite Altimetry (1992–2002). Remote Sens. Environ. 2004, 93, 238–245. [Google Scholar] [CrossRef]
- Kuo, C.Y. Determination and Characterization of the 20th Century Global Sea Level Rise; Geodetic Science and Surveying, Report. No. 478; Ohio State University: Columbus, OH, USA, 2006; Available online: http://hdl.handle.net/1811/78643 (accessed on 22 August 2019).
- Laiz, I.; Gómez-Enri, J.; Tejedor, B.; Aboitiz, A.; Villares, P. Seasonal Sea Level Variations in the Gulf of Cadiz Continental Shelf from In-Situ Measurements and Satellite Altimetry. Cont. Shelf Res. 2013, 53, 77–88. [Google Scholar] [CrossRef]
- Nerem, R.S.; Beckley, B.D.; Fasullo, J.T.; Hamlington, B.D.; Masters, D.; Mitchum, G.T. Climate-Change–driven Accelerated Sea-Level Rise Detected in the Altimeter Era. Proc. Natl. Acad. Sci. USA 2018. [Google Scholar] [CrossRef] [PubMed]
- Lehner, S.; Schulz-Stellenfleth, J.; Niedermeier, A.; Horstmann, J.; Rosenthal, W.; In, B.L. Extreme Waves Observed by Synthetic Aperture Radar. In Ocean Wave Measurement and Analysis; Edge, B.L., Hemsley, J.M., Eds.; American Society of Civil Engineers: Reston, VA, USA, 2002; pp. 125–134. [Google Scholar]
- Lehner, S.; Hoja, D.; Schulz-Stellenfleth, J. Marine Parameters from Synergy of Optical and Radar Satellite Data. Adv. Space Res. 2002, 29, 23–32. [Google Scholar] [CrossRef]
- Akbor, S.; Hossain, F.; Lee, H.; Shum, C.K. Inter-Comparison Study of Water Level Estimates Derived from Hydrodynamic–Hydrologic Model and Satellite Altimetry for a Complex Deltaic Environment. Remote Sens. Environ. 2011, 115. [Google Scholar] [CrossRef]
- Trisirisatayawong, I.; Naeije, M.; Simons, W.; Fenoglio-Marc, L. Sea Level Change in the Gulf of Thailand from GPS-Corrected Tide Gauge Data and Multi-Satellite Altimetry. Glob. Planet. Chang. 2011, 76, 137–151. [Google Scholar] [CrossRef]
- Bouvet, A.; Le Toan, T. ENVISAT/ASAR Wide-Swath Data for Timely Rice Fields Mapping in the Mekong River Delta. Remote Sens. Environ. 2011, 115, 1090–1101. [Google Scholar] [CrossRef]
- Brix, H.; Ye, S.; Laws, E.A.; Sun, D.; Li, G.; Ding, X.; Yuan, H.; Zhao, G.; Wang, J.; Pei, S. Large-Scale Management of Common Reed, Phragmites Australis, for Paper Production: A Case Study from the Liaohe Delta, China. Ecol. Eng. 2014, 73, 760–769. [Google Scholar] [CrossRef]
- Dipson, P.T.; Chithra, S.V.; Amarnath, A.; Smitha, S.V.; Harindranathan Nair, M.V.; Shahin, A. Spatial Changes of Estuary in Ernakulam District, Southern India for Last Seven Decades, Using Multi-Temporal Satellite Data. J. Environ. Manag. 2014, 148, 134–142. [Google Scholar] [CrossRef] [PubMed]
- Fromard, F.; Vega, C.; Proisy, C. Half a Century of Dynamic Coastal Change Affecting Mangrove Shorelines of French Guiana. A Case Study Based on Remote Sensing Data Analyses and Field Surveys. Mar. Geol. 2004, 208, 265–280. [Google Scholar] [CrossRef]
- Gao, Z.; Zhang, L. Multi-Seasonal Spectral Characteristics Analysis of Coastal Salt Marsh Vegetation in Shanghai, China. Estuar. Coast. Shelf Sci. 2006, 69, 217–224. [Google Scholar] [CrossRef]
- Kaufmann, R.; Seto, K.C. Change Detection, Accuracy, and Bias in a Sequential Analysis of Landsat Imagery in the Pearl River Delta, China: Econometric Techniques. Agric. Ecosyst. Environ. 2001, 85, 95–105. [Google Scholar] [CrossRef]
- Lagomasino, D.; Price, R.M.; Whitman, D.; Campbell, P.K.E.; Melesse, A. Estimating Major Ion and Nutrient Concentrations in Mangrove Estuaries in Everglades National Park Using Leaf and Satellite Reflectance. Remote Sens. Environ. 2014, 154, 202–218. [Google Scholar] [CrossRef]
- Lee, T.-M.; Yeh, H.-C. Applying Remote Sensing Techniques to Monitor Shifting Wetland Vegetation: A Case Study of Danshui River Estuary Mangrove Communities, Taiwan. Ecol. Eng. 2009, 35, 487–496. [Google Scholar] [CrossRef]
- Lo, C.P. LANDSAT Images as a Tool in Regional Analysis: The Example of Chu Chiang (Pearl River) Delta in South China. Geoforum 1977, 8, 79–87. [Google Scholar] [CrossRef]
- Nagler, P.L.; Glenn, E.P.; Huete, A.R. Assessment of Spectral Vegetation Indices for Riparian Vegetation in the Colorado River Delta, Mexico. J. Arid Environ. 2001, 49, 91–110. [Google Scholar] [CrossRef]
- Rakotomavo, A.; Fromard, F. Dynamics of Mangrove Forests in the Mangoky River Delta, Madagascar, under the Influence of Natural and Human Factors. Ecol. Manag. 2010, 259, 1161–1169. [Google Scholar] [CrossRef]
- Santos, L.; Reis Matos, H.; Schaeffer-Novelli, Y.; Cunha-Lignon, M.; Bitencourt, M.; Koedam, N.; Dahdouh-Guebas, F. Anthropogenic Activities on Mangrove Areas (São Francisco River Estuary, Brazil Northeast): A GIS-Based Analysis of CBERS and SPOT Images to Aid in Local Management. Ocean Coast. Manag. 2014, 89, 39–50. [Google Scholar] [CrossRef]
- Son, N.T.; Chen, C.F.; Chen, C.R.; Chang, L.Y. Satellite-Based Investigation of Flood-Affected Rice Cultivation Areas in Chao Phraya River Delta, Thailand. ISPRS J. Photogramm. Remote Sens. 2013, 86, 77–88. [Google Scholar] [CrossRef]
- Ulrich, M.; Grosse, G.; Chabrillat, S.; Schirrmeister, L. Spectral Characterization of Periglacial Surfaces and Geomorphological Units in the Arctic Lena Delta Using Field Spectrometry and Remote Sensing. Remote Sens. Environ. 2009, 113, 1220–1235. [Google Scholar] [CrossRef]
- Zhao, B.; Yan, Y.; Guo, H.; He, M.; Gu, Y.; Li, B. Monitoring Rapid Vegetation Succession in Estuarine Wetland Using Time Series MODIS-Based Indicators: An Application in the Yangtze River Delta Area. Ecol. Indic. 2009, 346–356. [Google Scholar] [CrossRef]
- Lymburner, L.; Bunting, P.; Lucas, R.; Scarth, P.; Alam, I.; Phillips, C.; Ticehurst, C.; Held, A. Mapping the Multi-Decadal Mangrove Dynamics of the Australian Coastline. Remote Sens. Environ. 2019, 111185. [Google Scholar] [CrossRef]
- Syvitski, J.P.M.; Kettner, A.J.; Society, A. Sediment Flux in the Anthropocene. Philos. Trans. R. 2011, 369, 957–975. [Google Scholar] [CrossRef]
- Kummu, M.; Lu, X.X.; Rasphone, A.; Sarkkula, J.; Koponen, J. Riverbank Changes along the Mekong River: Remote Sensing Detection in the Vientiane–Nong Khai Area. Quat. Int. 2008, 186, 100–112. [Google Scholar] [CrossRef]
- Yang, X.; Damen, M.C.J.; Van Zuidam, R.A. Satellite Remote Sensing and GIS for the Analysis of Channel Migration Changes in the Active Yellow River Delta, China. Int. J. Appl. Earth Obs. Geoinf. 1999, 1, 146–157. [Google Scholar] [CrossRef]
- Liu, Y.; Huang, H.; Qiu, Z.; Fan, J. Detecting Coastline Change from Satellite Images Based on Beach Slope Estimation in a Tidal Flat. Int. J. Appl. Earth Obs. Geoinf. 2013, 23, 165–176. [Google Scholar] [CrossRef]
- Yang, C.-S.; Ouchi, K. Analysis of Bar Morphology Using Multi-Temporal and Multi-Sensor Satellite Images: Example from the Han Estuary, Korea. Mar. Geol. 2013, 311–314, 17–31. [Google Scholar] [CrossRef]
- Ghoneim, E.; Mashaly, J.; Gamble, D.; Halls, J.; AbuBakr, M. Nile Delta Exhibited a Spatial Reversal in the Rates of Shoreline Retreat on the Rosetta Promontory Comparing Pre- and Post-Beach Protection. Geomorphology 2015, 228, 14. [Google Scholar] [CrossRef]
- Gens, R. Remote Sensing of Coastlines: Detection, Extraction and Monitoring. Int. J. Remote Sens. 2010, 31, 1819–1836. [Google Scholar] [CrossRef]
- Shoreline Monitor. Available online: http://shorelinemonitor.deltares.nl (accessed on 19 July 2019).
- Ezcurra, E.; Barrios, E.; Ezcurra, P.; Ezcurra, A.; Vanderplank, S.; Vidal, O. A Natural Experiment Reveals the Impact of Hydroelectric Dams on the Estuaries of Tropical Rivers. Sci. Adv. 2019, 5. [Google Scholar] [CrossRef] [PubMed]
- Murray, N.J.; Phinn, S.R.; DeWitt, M.; Ferrari, R.; Johnston, R.; Lyons, M.B.; Clinton, N.; Thau, D.; Fuller, R.A. The Global Distribution and Trajectory of Tidal Flats. Nature 2019, 565, 222–225. [Google Scholar] [CrossRef] [PubMed]
- Global Intertidal Change. Available online: https://www.intertidal.app/ (accessed on 19 July 2019).
- Bishop-Taylor, R.; Sagar, S.; Lymburner, L.; Beaman, R.J. Between the Tides: Modelling the Elevation of Australia’s Exposed Intertidal Zone at Continental Scale. Estuar. Coast. Shelf Sci. 2019, 223, 115–128. [Google Scholar] [CrossRef]
- Pardo-Pascual, J.E.; Elena, S.; Almonacid-Caballer, J. Assessing the Accuracy of Automatically Extracted Shorelines on Microtidal Beaches from Landsat 7, Landsat 8 and Sentinel-2 Imagery. Remote Sens. 2018, 10, 326. [Google Scholar] [CrossRef]
- Hagenaars, G.; De Vries, S.; Luijendijk, A.P.; De Boer, W.P. On the Accuracy of Automated Shoreline Detection Derived from Satellite Imagery: A Case Study of the Sand Motor Mega-Scale Nourishment. Coast. Eng. 2018, 133, 113–125. [Google Scholar] [CrossRef]
- Vos, K.; Harley, M.D.; Splinter, K.D.; Simmons, J.A.; Turner, I.L. Sub-Annual to Multi-Decadal Shoreline Variability from Publicly Available Satellite Imagery. Coast. Eng. 2019, 150, 160–174. [Google Scholar] [CrossRef]
- Stern, N. The Economics of Climate Change: The Stern Review; Cambridge University Press: Cambridge, UK, 2007. [Google Scholar] [CrossRef]
- Kuenzer, C.; Guo, H.; Huth, J.; Leinenkugel, P.; Li, X.; Dech, S. Flood Mapping and Flood Dynamics of the Mekong Delta: ENVISAT-ASAR-WSM Based Time Series Analyses. Remote Sens. 2013, 5, 687–715. [Google Scholar] [CrossRef] [Green Version]
- Kuenzer, C.; Guo, H.; Schlegel, I.; Tuan, V.Q.; Li, X.; Dech, S. Varying Scale and Capability of Envisat ASAR-WSM, TerraSAR-X Scansar and TerraSAR-X Stripmap Data to Assess Urban Flood Situations: A Case Study of the Mekong Delta in Can Tho Province. Remote Sens. 2013, 5, 5122–5142. [Google Scholar] [CrossRef] [Green Version]
- Huang, C.; Chen, Y.; Zhang, S.; Wu, J. Detecting, Extracting and Monitoring Surface Water from Space Using Optical Sensors—A Review. Rev. Geophys. 2018, 1–28. [Google Scholar] [CrossRef]
- Werle, D.; Martin, T.C.; Hasan, K. Flood and Coastal Zone Monitoring in Bangladesh with Radarsat ScanSAR: Technical Experience and Institutional Challenges. John Hopkins Dig. 2001, 21, 148–154. [Google Scholar]
- Henry, J.-B.; Chastanet, P.; Fellah, K.; Desnos, Y.L. Envisat Multi-Polarized ASAR Data for Flood Mapping. Int. J. Remote Sens. 2006, 27, 1921–1929. [Google Scholar] [CrossRef]
- Lian, L.; Jianfei, C. Spatial-Temporal Change Analysis of Water Area in Pearl River Delta Based on Remote Sensing Technology. Procedia Environ. Sci. 2011, 10, 2170–2175. [Google Scholar] [CrossRef]
- Mason, D.C.; Speck, R.; Devereux, B.; Schumann, G.; Neal, J.; Bates, P.D. Flood Detection in Urban Areas Using TerraSAR-X. IEEE Trans. Geosci. Remote Sens. 2010, 48, 882–894. [Google Scholar] [CrossRef]
- Martinis, S.; Kuenzer, C.; Wendleder, A.; Huth, J.; Twele, A.; Roth, A.; Dech, S. Comparing Four Operational SAR-Based Water and Flood Detection Approaches. Int. J. Remote Sens. 2015, 36, 3519–3543. [Google Scholar] [CrossRef]
- Sakamoto, T.; Van Nguyen, N.; Kotera, A.; Ohno, H.; Ishitsuka, N.; Yokozawa, M. Detecting Temporal Changes in the Extent of Annual Flooding within the Cambodia and the Vietnamese Mekong Delta from MODIS Time-Series Imagery. Remote Sens. Environ. 2007, 109, 295–313. [Google Scholar] [CrossRef]
- Schumann, G.J.; Moller, D.K. Microwave Remote Sensing of Flood Inundation. Phys. Chem. Earth 2015, 83–84, 84–95. [Google Scholar] [CrossRef]
- Shen, X.; Wang, D.; Mao, K.; Anagnostou, E.; Hong, Y. Inundation Extent Mapping by Synthetic Aperture Radar: A Review. Remote Sens. 2019, 11, 879. [Google Scholar] [CrossRef]
- Eodc Eomex+ Sentinel Coverage Maps. Available online: https://eomex.eodc.eu/cm#s2a_prd_msil1c (accessed on 19 July 2019).
- Chini, M.; Pelich, R.; Pulvirenti, L.; Pierdicca, N.; Hostache, R.; Matgen, P. Sentinel-1 InSAR Coherence to Detect Floodwater in Urban Areas: Houston and Hurricane Harvey as A Test Case. Remote Sens. 2019, 11, 107. [Google Scholar] [CrossRef]
- Shen, X.; Anagnostou, E.N.; Allen, G.H.; Robert Brakenridge, G.; Kettner, A.J. Near-Real-Time Non-Obstructed Flood Inundation Mapping Using Synthetic Aperture Radar. Remote Sens. Environ. 2019, 221, 302–315. [Google Scholar] [CrossRef]
- Wang, X.; Ling, F.; Yao, H.; Liu, Y.; Xu, S. Unsupervised Sub-Pixel Water Body Mapping with Sentinel-3 OLCI Image. Remote Sens. 2019, 11, 327. [Google Scholar] [CrossRef]
- Ottinger, M.; Clauss, K.; Kuenzer, C. Large-Scale Assessment of Coastal Aquaculture Ponds with Sentinel-1 Time Series Data. Remote Sens. 2017, 9, 440. [Google Scholar] [CrossRef]
- Ottinger, M.; Clauss, K.; Kuenzer, C. Opportunities and Challenges for the Estimation of Aquaculture Production Based on Earth Observation Data. Remote Sens. 2018, 10, 1076. [Google Scholar] [CrossRef]
- Kuenzer, C.; Leinenkugel, P.; Vollmuth, M.; Dech, S. Comparing Global Land-Cover Products—Implications for Geoscience Applications: An Investigation for the Trans-Boundary Mekong Basin. Int. J. Remote Sens. 2014, 35, 2752–2779. [Google Scholar] [CrossRef]
- Esch, T.; Bachofer, F.; Heldens, W.; Hirner, A.; Marconcini, M.; Palacios-Lopez, D.; Roth, A.; üreyen, S.; Zeidler, J.; Dech, S.; et al. Where We Live-A Summary of the Achievements and Planned Evolution of the Global Urban Footprint. Remote Sens. 2018, 10, 895. [Google Scholar] [CrossRef]
- Esch, T.; Heldens, W.; Hirner, A.; Keil, M.; Marconcini, M.; Roth, A.; Zeidler, J.; Dech, S.; Strano, E. Breaking New Ground in Mapping Human Settlements from Space—The Global Urban Footprint. ISPRS J. Photogramm. Remote Sens. 2017, 134, 30–42. [Google Scholar] [CrossRef]
- Pesaresi, M.; Ehrlich, D.; Ferri, S.; Florczyk, A.J.; Freire, S.; Halkia, M.; Julea, A.; Kemper, T.; Soille, P.; Syrris, V. Operating Procedure for the Production of the Global Human Settlement Layer from Landsat Data of the Epochs 1975, 1990, 2000, and 2014; Publications Office of the European Union: Ispra, Italy, 2016. [Google Scholar] [CrossRef]
- Liu, X.; Hu, G.; Chen, Y.; Li, X.; Xu, X.; Li, S.; Pei, F.; Wang, S. High-Resolution Multi-Temporal Mapping of Global Urban Land Using Landsat Images Based on the Google Earth Engine Platform. Remote Sens. Environ. 2018, 209, 227–239. [Google Scholar] [CrossRef]
- Sun, Z.; Xu, R.; Du, W.; Wang, L.; Lu, D. High-Resolution Urban Land Mapping in China from Sentinel 1A/2 Imagery Based on Google Earth Engine. Remote Sens. 2019, 11, 752. [Google Scholar] [CrossRef]
- ESA Thematic Exploitation Platform—Urban. Available online: https://urban-tep.eu/#! (accessed on 23 July 2019).
- Laba, M.; Blair, B.; Downs, R.; Monger, B.; Philpot, W.; Smith, S.; Sullivan, P.; Baveye, P.C. Use of Textural Measurements to Map Invasive Wetland Plants in the Hudson River National Estuarine Research Reserve with IKONOS Satellite Imagery. Remote Sens. Environ. 2010, 114, 876–886. [Google Scholar] [CrossRef]
- Hestir, E.L.; Khanna, S.; Andrew, M.E.; Santos, M.J.; Viers, J.H.; Greenberg, J.A.; Rajapakse, S.S.; Ustin, S.L. Identification of Invasive Vegetation Using Hyperspectral Remote Sensing in the California Delta Ecosystem. Remote Sens. Environ. 2008, 112, 4034–4047. [Google Scholar] [CrossRef]
- Zhang, W.; Zeng, C.; Tong, C.; Zhang, Z.; Huang, J. Analysis of the Expanding Process of the Spartina Alterniflora Salt Marsh in Shanyutan Estuary by Remote Sensing. Procedia Environ. Sci. 2011, 10, 2472–2477. [Google Scholar] [CrossRef]
- Kuenzer, C.; Bluemel, A.; Gebhardt, S.; Vo, T.; Dech, S. Remote Sensing of Mangrove Ecosystems: A Review. Remote Sens. 2011, 3, 878–928. [Google Scholar] [CrossRef] [Green Version]
- Vo, T.; Kuenzer, C.; Oppelt, N. How Remote Sensing Supports Mangrove Ecosystem Service Valuation: A Case Study in Ca Mau Province, Vietnam. Ecosyst. Serv. 2015, 14, 64–75. [Google Scholar]
- Wang, L.; Jia, M.; Yin, D.; Tian, J. A Review of Remote Sensing for Mangrove Forests: 1956–2018. Remote Sens Environ. 2019, 231. [Google Scholar] [CrossRef]
- Ottinger, M.; Kuenzer, C.; Liu, G.; Wang, S.; Dech, S. Monitoring Land Cover Dynamics in the Yellow River Delta from 1995 to 2010 Based on Landsat 5 TM. Appl. Geogr. 2013, 44, 53–68. [Google Scholar] [CrossRef]
- Leinenkugel, P.; Kuenzer, C.; Oppelt, N.; Dech, S. Characterisation of Land Surface Phenology and Land Cover Based on Moderate Resolution Satellite Data in Cloud Prone Areas—A Novel Product for the Mekong Basin. Remote Sens. Environ. 2013, 136, 180–198. [Google Scholar] [CrossRef]
- Clauss, K.; Ottinger, M.; Leinenkugel, P.; Kuenzer, C. Estimating Rice Production in the Mekong Delta, Vietnam, Utilizing Time Series of Sentinel-1 SAR Data. Int. J. Appl. Earth Obs. Geoinf. 2018, 73, 574–585. [Google Scholar] [CrossRef]
- Minh, H.V.T.; Avtar, R.; Mohan, G.; Misra, P.; Kurasaki, M. Monitoring and Mapping of Rice Cropping Pattern in Flooding Area in the Vietnamese Mekong Delta Using Sentinel-1A Data: A Case of An Giang Province. ISPRS Int. J. Geo-Inf. 2019, 8, 211. [Google Scholar] [CrossRef]
- Bazzi, H.; Baghdadi, N.; El Hajj, M.; Zribi, M.; Minh, D.H.T.; Ndikumana, E.; Courault, D.; Belhouchette, H. Mapping Paddy Rice Using Sentinel-1 SAR Time Series in Camargue, France. Remote Sens. 2019, 11, 887. [Google Scholar] [CrossRef]
- Ndikumana, E.; Ho, D.; Minh, T.; Baghdadi, N.; Courault, D.; Hossard, L. Deep Recurrent Neural Network for Agricultural Classification Using Multitemporal SAR Sentinel-1 for Camargue, France. Remote Sens. 2018, 10, 16. [Google Scholar] [CrossRef]
- Tavares, P.A.; Ely, N.; Beltr, S.; Silva, U.; Cl, A. Integration of Sentinel-1 and Sentinel-2 for Classification and LULC Mapping in the Urban Area of Belém, Eastern Brazilian Amazon. Sensors 2019, 19, 1140. [Google Scholar] [CrossRef] [PubMed]
- Alan, J.; Castillo, A.; Apan, A.A.; Maraseni, T.N.; Salmo, S.G. Estimation and Mapping of Above-Ground Biomass of Mangrove Forests and Their Replacement Land Uses in the Philippines Using Sentinel Imagery. ISPRS J. Photogramm. Remote Sens. 2017, 134, 70–85. [Google Scholar] [CrossRef]
- Poursanidis, D.; Traganos, D.; Reinartz, P.; Chrysoulakis, N. On the Use of Sentinel-2 for Coastal Habitat Mapping and Satellite-Derived Bathymetry Estimation Using Downscaled Coastal Aerosol Band. Int. J. Appl. Earth Obs. Geoinf. 2019, 80, 58–70. [Google Scholar] [CrossRef]
- Feng, Q.; Yang, J.; Zhu, D.; Liu, J.; Guo, H.; Bayartungalag, B.; Li, B. Integrating Multitemporal Sentinel-1/2 Data for Coastal Land Cover Classification Using a Multibranch Convolutional Neural Network: A Case of the Yellow River Delta. Remote Sens. 2019, 11, 1006. [Google Scholar] [CrossRef]
- Hettling, J.K. The Use of Remote Sensing Satellites for Verification in International Law. Space Policy 2003, 19, 33–39. [Google Scholar] [CrossRef]
- Peter, N. The Use of Remote Sensing to Support the Application of Multilateral Environmental Agreements. Space Policy 2004, 20, 189–195. [Google Scholar] [CrossRef]
- Kuriyama, I. Supporting Multilateral Environmental Agreement with Satellite Earth Observation. Space Policy 2005, 21, 151–160. [Google Scholar] [CrossRef]
- Purdy, R. Using Earth Observation Technologies for Better Regulatory Compliance and Enforcement of Environmental Laws. J. Environ. Law 2009, 22, 59–87. [Google Scholar] [CrossRef]
- De Leeuw, J.; Georgiadou, P.Y.; Kerle, N.; De Gier, A.; Yoshio, I.; Jelle, F.; Smies, M.; Davaa, N. The Function of Remote Sensing in Support of Environmental Policy. Remote Sens. 2010, 2, 1731–1750. [Google Scholar] [CrossRef] [Green Version]
- Chen, Q.; Zhang, Y.; Hallikainen, M. Water Quality Monitoring Using Remote Sensing in Support of the EU Water Framework Directive (WFD): A Case Study in the Gulf of Finland. Environ. Monit. Assess. 2007, 124, 157–166. [Google Scholar] [CrossRef] [PubMed]
- Ferraro, G.; Baschek, B.; De Montpellier, G.; Njoten, O.; Perkovic, M.; Vespe, M. On the SAR Derived Alert in the Detection of Oil Spills According to the Analysis of the EGEMP. Mar. Pollut. Bull. 2009, 60, 91–102. [Google Scholar] [CrossRef] [PubMed]
- Glasgow, H.B.; Burkholder, J.; Reed, R.E.; Lewitus, A.; Kleinman, J.E. Real-Time Remote Monitoring of Water Quality: A Review of Current Applications, and Advancements in Sensor, Telemetry, and Computing Technologies. J. Exp. Mar. Biol. Ecol. 2004, 300, 409–448. [Google Scholar] [CrossRef]
- Kourti, N.; Shepherd, I.; Greidanus, H.; Alvarez, M.; Aresu, E.; Bauna, T.; Chesworth, J.; Lemoine, G.; Schwartz, G. Integrating Remote Sensing in Fisheries Control. Fish. Manag. Ecol. 2005, 12, 295–307. [Google Scholar] [CrossRef]
- Seto, K.C.; Fragkias, M. Mangrove Conversion and Aquaculture Development in Vietnam: A Remote Sensing-Based Approach for Evaluating the Ramsar Convention on Wetlands. Glob. Environ. Chang. 2007, 17, 486–500. [Google Scholar] [CrossRef]
- Rudorff, B.; Adami, M.; Risso, J.; Aguiar, D.; Pires, B.; Amaral, D.; Fabiani, L.; Cecarelli, I. Remote Sensing Images to Detect Soy Plantations in the Amazon Biome—The Soy Moratorium Initiative. Sustainability 2012, 4, 1074–1088. [Google Scholar] [CrossRef]
- Vo Quoc, T.; Oppelt, N.; Leinenkugel, P.; Kuenzer, C. Remote Sensing in Mapping Mangrove Ecosystems—An Object-Based Approach. Remote Sens. 2013, 5, 183–201. [Google Scholar] [CrossRef]
- Fingas, M.; Brown, C. Review of Oil Spill Remote Sensing. Mar. Pollut. Bull. 2014, 83, 9–23. [Google Scholar] [CrossRef]
- Garcia-Pineda, O.; Holmes, J.; Rissing, M.; Jones, R.; Wobus, C.; Svejkovsky, J.; Hess, M. Detection of Oil near Shorelines during the Deepwater Horizon Oil Spill Using Synthetic Aperture Radar (SAR). Remote Sens. 2017, 9, 567. [Google Scholar] [CrossRef]
- Kolokoussis, P.; Karathanassi, V. Oil Spill Detection and Mapping Using Sentinel 2 Imagery. J. Mar. Sci. Eng. 2018, 6, 4. [Google Scholar] [CrossRef]
- Anthony, E.J.; Brunier, G.; Besset, M.; Goichot, M. Linking Rapid Erosion of the Mekong River Delta to Human Activities. Nat. Publ. Gr. 2015, 12. [Google Scholar] [CrossRef] [PubMed]
- Auerbach, L.W.; Goodbred, S.L.; Mondal, D.R.; Wilson, C.A.; Ahmed, K.R.; Roy, K.; Steckler, M.S.; Small, C.; Gilligan, J.M.; Ackerly, B.A. Flood Risk of Natural and Embanked Landscapes on the Ganges-Brahmaputra Tidal Delta Plain. Nat. Clim. Chang. 2015, 5, 153–157. [Google Scholar] [CrossRef]
- Wang, H.; Wright, T.J.; Yu, Y.; Lin, H.; Jiang, L.; Li, C.; Qiu, G. InSAR Reveals Coastal Subsidence in the Pearl River Delta, China. Remote Sens. 2012, 10, 1119–1128. [Google Scholar] [CrossRef]
- Sansosti, E.; Casu, F.; Manzo, M.; Lanari, R. Space-borne Radar Interferometry Techniques for the Generation of Deformation Time Series: An Advanced Tool for Earth’s Surface Displacement Analysis. Geophys. Res. Lett. 2010, 37, 9. [Google Scholar] [CrossRef]
- Pepe, A.; Calò, F. A Review of Interferometric Synthetic Aperture RADAR (InSAR) Multi-Track Approaches for the Retrieval of Earth’s Surface Displacements. Appl. Sci. 2017, 7, 1264. [Google Scholar] [CrossRef]
- Higgins, S.A.; Overeem, I.; Steckler, M.S.; Syvitski, J.P.M.; Seeber, L.; Akhter, S.H. InSARmeasurements of Compaction and Subsidence in the Ganges-Brahmaputra Delta, Bangladesh Stephanie. J. Geophys. Res. Earth Surf. 2014, 119, 1768–1781. [Google Scholar] [CrossRef]
- Erban, L.E.; Gorelick, S.M.; Zebker, H.A. Groundwater Extraction, Land Subsidence, and Sea-Level Rise in the Mekong Delta, Vietnam. Environ. Res. Lett. 2014, 9. [Google Scholar] [CrossRef]
- Minderhoud, P.S.J.; Coumou, L.; Erban, L.E.; Middelkoop, H.; Stouthamer, E.; Addink, E.A. The Relation between Land Use and Subsidence in the Vietnamese Mekong Delta. Sci. Total Environ. 2018, 634, 715–726. [Google Scholar] [CrossRef]
- Zhang, B.; Wang, R.; Deng, Y.; Ma, P.; Lin, H.; Wang, J. Mapping the Yellow River Delta Land Subsidence with Multitemporal SAR Interferometry by Exploiting Both Persistent and Distributed Scatterers. ISPRS J. Photogramm. Remote Sens. 2019, 148, 157–173. [Google Scholar] [CrossRef]
- Ma, P.; Wang, W.; Zhang, B.; Wang, J.; Shi, G.; Huang, G.; Science, E.I.; Chinese, T.; Kong, H.; Kong, H. Remotely Sensing Large- and Small-Scale Ground Subsidence: A Case Study of the Guangdong—Hong Kong—Macao Greater Bay Area of China. Remote Sens. Environ. 2019, 232, 111282. [Google Scholar] [CrossRef]
- Martínez, M.L.; Intralawan, A.; Vázquez, G.; Pérez-Maqueo, O.; Sutton, P.; Landgrave, R. The Coasts of Our World: Ecological, Economic and Social Importance. Ecol. Econ. 2007, 63, 254–272. [Google Scholar] [CrossRef]
- Jennerjahn, T. Biogeochemical Response of Tropical Coastal Systems to Present and Past Environmental Change. Earth-Sci. Rev. 2012, 114, 19–41. [Google Scholar] [CrossRef]
Figure 1.
Four selected deltas from top to bottom: Niger Delta, Nigeria (a,b); Mekong Delta, Vietnam (c,d); Can Gio estuary complex, Vietnam (e,f); and Yellow River Delta, China (g,h). Left column: Location of each delta. Right column: True color Landsat (b,d,f) and Seninel-2 (h) images of the same excerpt.

Figure 2.
Major external (red) and internal (blue) threats generic to most settled river delta areas. External: 1: sea level rise, 2: storm surges and tsunamis, 3: offshore oil spills, 4: allochthonous sea water pollution, 5: allochthonous air pollution, 6: upstream water diversion/related flood pulse changes/sediment retention/water pollution, 7: upstream related floods, 8: droughts, 9: hydrocracy interests, 10: in-migration, food security tele-connections, extensive tourism. Internal: 1: oils and gas spills and related pollution, 2: industry and urban related water and soil pollution, 3: agriculture- and aquaculture-related water and soil pollution, 4: autochthonous air pollution, 5: geologic/ compaction/ underground resource extraction related land subsidence, 6: coastal forest/wetland destruction, 7: plant disease outbreaks, 8: monoculture expansion, 9: hydrocracy interests, 10: out-migration of the delta population, 11: barriers and infrastructure development, 12: overfishing and wildlife collection.

Figure 3.
Remote sensing of river delta environments: land- and water-related applications and information derivation.
Figure 3.
Remote sensing of river delta environments: land- and water-related applications and information derivation.

Figure 4.
River course changes of the Yellow River in the Yellow River Delta from 1976 to 2010 as extracted from Landsat MSS and Landsat TM data for four time steps. To better illustrate the river course, RGB images are displayed in grey scale. From 1976 (a) to 1995 (b) the river was substantially re-directed from its northern outlet to the East. Redirections in the late 1990’s (c,d) occurred due to management decisions of Shengli Oilfield, as explained in the text.

Figure 5.
Coastline changes over the course of 34 years in the Yellow River Delta, based on Landsat MSS and Landsat TM satellite data (a), as well as shoreline accretion and erosion between 1976 and 2010 (b–d).
Figure 5.
Coastline changes over the course of 34 years in the Yellow River Delta, based on Landsat MSS and Landsat TM satellite data (a), as well as shoreline accretion and erosion between 1976 and 2010 (b–d).

Figure 6.
Intra-annual inundation patterns (2013) in the Mississippi Delta, USA (a) and the Mekong Delta, Vietnam (b), and intra-annual (2013) water cover dynamics of the Mackenzie Delta region showing a water cover duration map (c), location and true color satellite image (d), and quantitative analyses of inundation dynamics at daily (e) and monthly (f) intervals (Kuenzer et al. [12]).

Figure 7.
General schematic principle of water surface extraction from SAR data: water surfaces act as mirror reflectors for incident SAR waves, and thus backscatter values are low. Excerpt of a SAR image showing the Mekong Delta during the dry season (a) surface water areas mapped from the same image (b), SAR image for same excerpt (c) and mapped surface water (d) during the rainy season.

Figure 8.
Inundation frequency patterns in the Yellow River Delta, as extracted from a time series of 13 TerraSAR-X StripMap data sets (2.5 m) for 2013/14. Inundation frequency is the number of times a given pixel was flagged as inundated in the time series. (Adapted with permission from Kuenzer et al. [22]).

Figure 9.
(Top) Examples of radar interaction with aquaculture ponds: (a) specular reflection (smooth water surface); (b) corner/embankment; and (c) diffuse reflection (rough water surface). (Bottom) S1A image (d); related histogram and classification threshold (e); and binary image of water and non-water after application of threshold (f). (Modified from Ottinger et al. [171]).

Figure 10.
Comparison (after legend harmonization) and discrepancies in globally available land cover products showing the UMD (1992/93), GLC 2000, GlobCover (2004/06; 2009) and MODIS LandCover (2001 and 2009) for the larger Mekong Delta.
Figure 10.
Comparison (after legend harmonization) and discrepancies in globally available land cover products showing the UMD (1992/93), GLC 2000, GlobCover (2004/06; 2009) and MODIS LandCover (2001 and 2009) for the larger Mekong Delta.

Figure 11.
Urban surfaces (built-up area) in the Chao Pharya River Delta area in Bangkok, Thailand. Shown are a true color aerial image of the delta (a), built-up areas (red) for the same area (b) and a smaller excerpt (c), see (b) for location of bounding box) as mapped by the Global Urban Footprint for 2015 from TerraSAR-X data.

Figure 12.
The spectral reflectance “fingerprint” of surfaces. Excerpt of Mekong Delta land use classification based on 6.25 m resolution Rapid Eye data. Spectral profiles depict spectral reflectance in % (y-axis) for the five Rapid Eye spectral bands (1: 440–510 nm (blue), 2: 520–590 nm (green), 3: 630–685 nm (red),4: 690–730 nm (red edge), 5: 760–850 nm (near infrared).

Figure 13.
Results of a decision tree-based land cover, land use classification for the Yellow River Delta in China for the year 1995 (left) and for the year 2013 (right). (Adapted with permission from Ottinger et al. [186]).
Figure 13.
Results of a decision tree-based land cover, land use classification for the Yellow River Delta in China for the year 1995 (left) and for the year 2013 (right). (Adapted with permission from Ottinger et al. [186]).

Figure 14.
The temporal, intra-annual signature “fingerprint” of surfaces. Excerpt of a Mekong Basin land use classification based on an intra-annual MODIS Enhanced Vegetation Index, EVI time series for 2010. Despite the low spatial resolution of 500 m, twelve land use classes can be extracted for the Mekong Delta alone.

Figure 15.
Examples for monitoring compliance. (a): mangrove percentage on a farmer’s land in Ca Mau Province, Mekong Delta, (b): spread of oil pumps in the northern Yellow River Delta Nature Reserve between 1995 and 2013, (c): spread of oil industry related access channels in the Niger Delta, (d): development of gas flares in part of the Niger Delta.

Figure 16.
Illustration of the technical principles of InSAR-based land subsidence remote sensing. Two SAR images of the same area are acquired at different times by a satellite. If the surface moves between the two acquisitions a phase shift is recorded. An interferogram maps this phase shift spatially. (Adapted with permission from Commonwealth of Australia (Geoscience Australia) 2019. This product is released under the Creative Commons Attribution 4.0 International Licence.
http://creativecommons.org/licenses/by/4.0/legalcode).
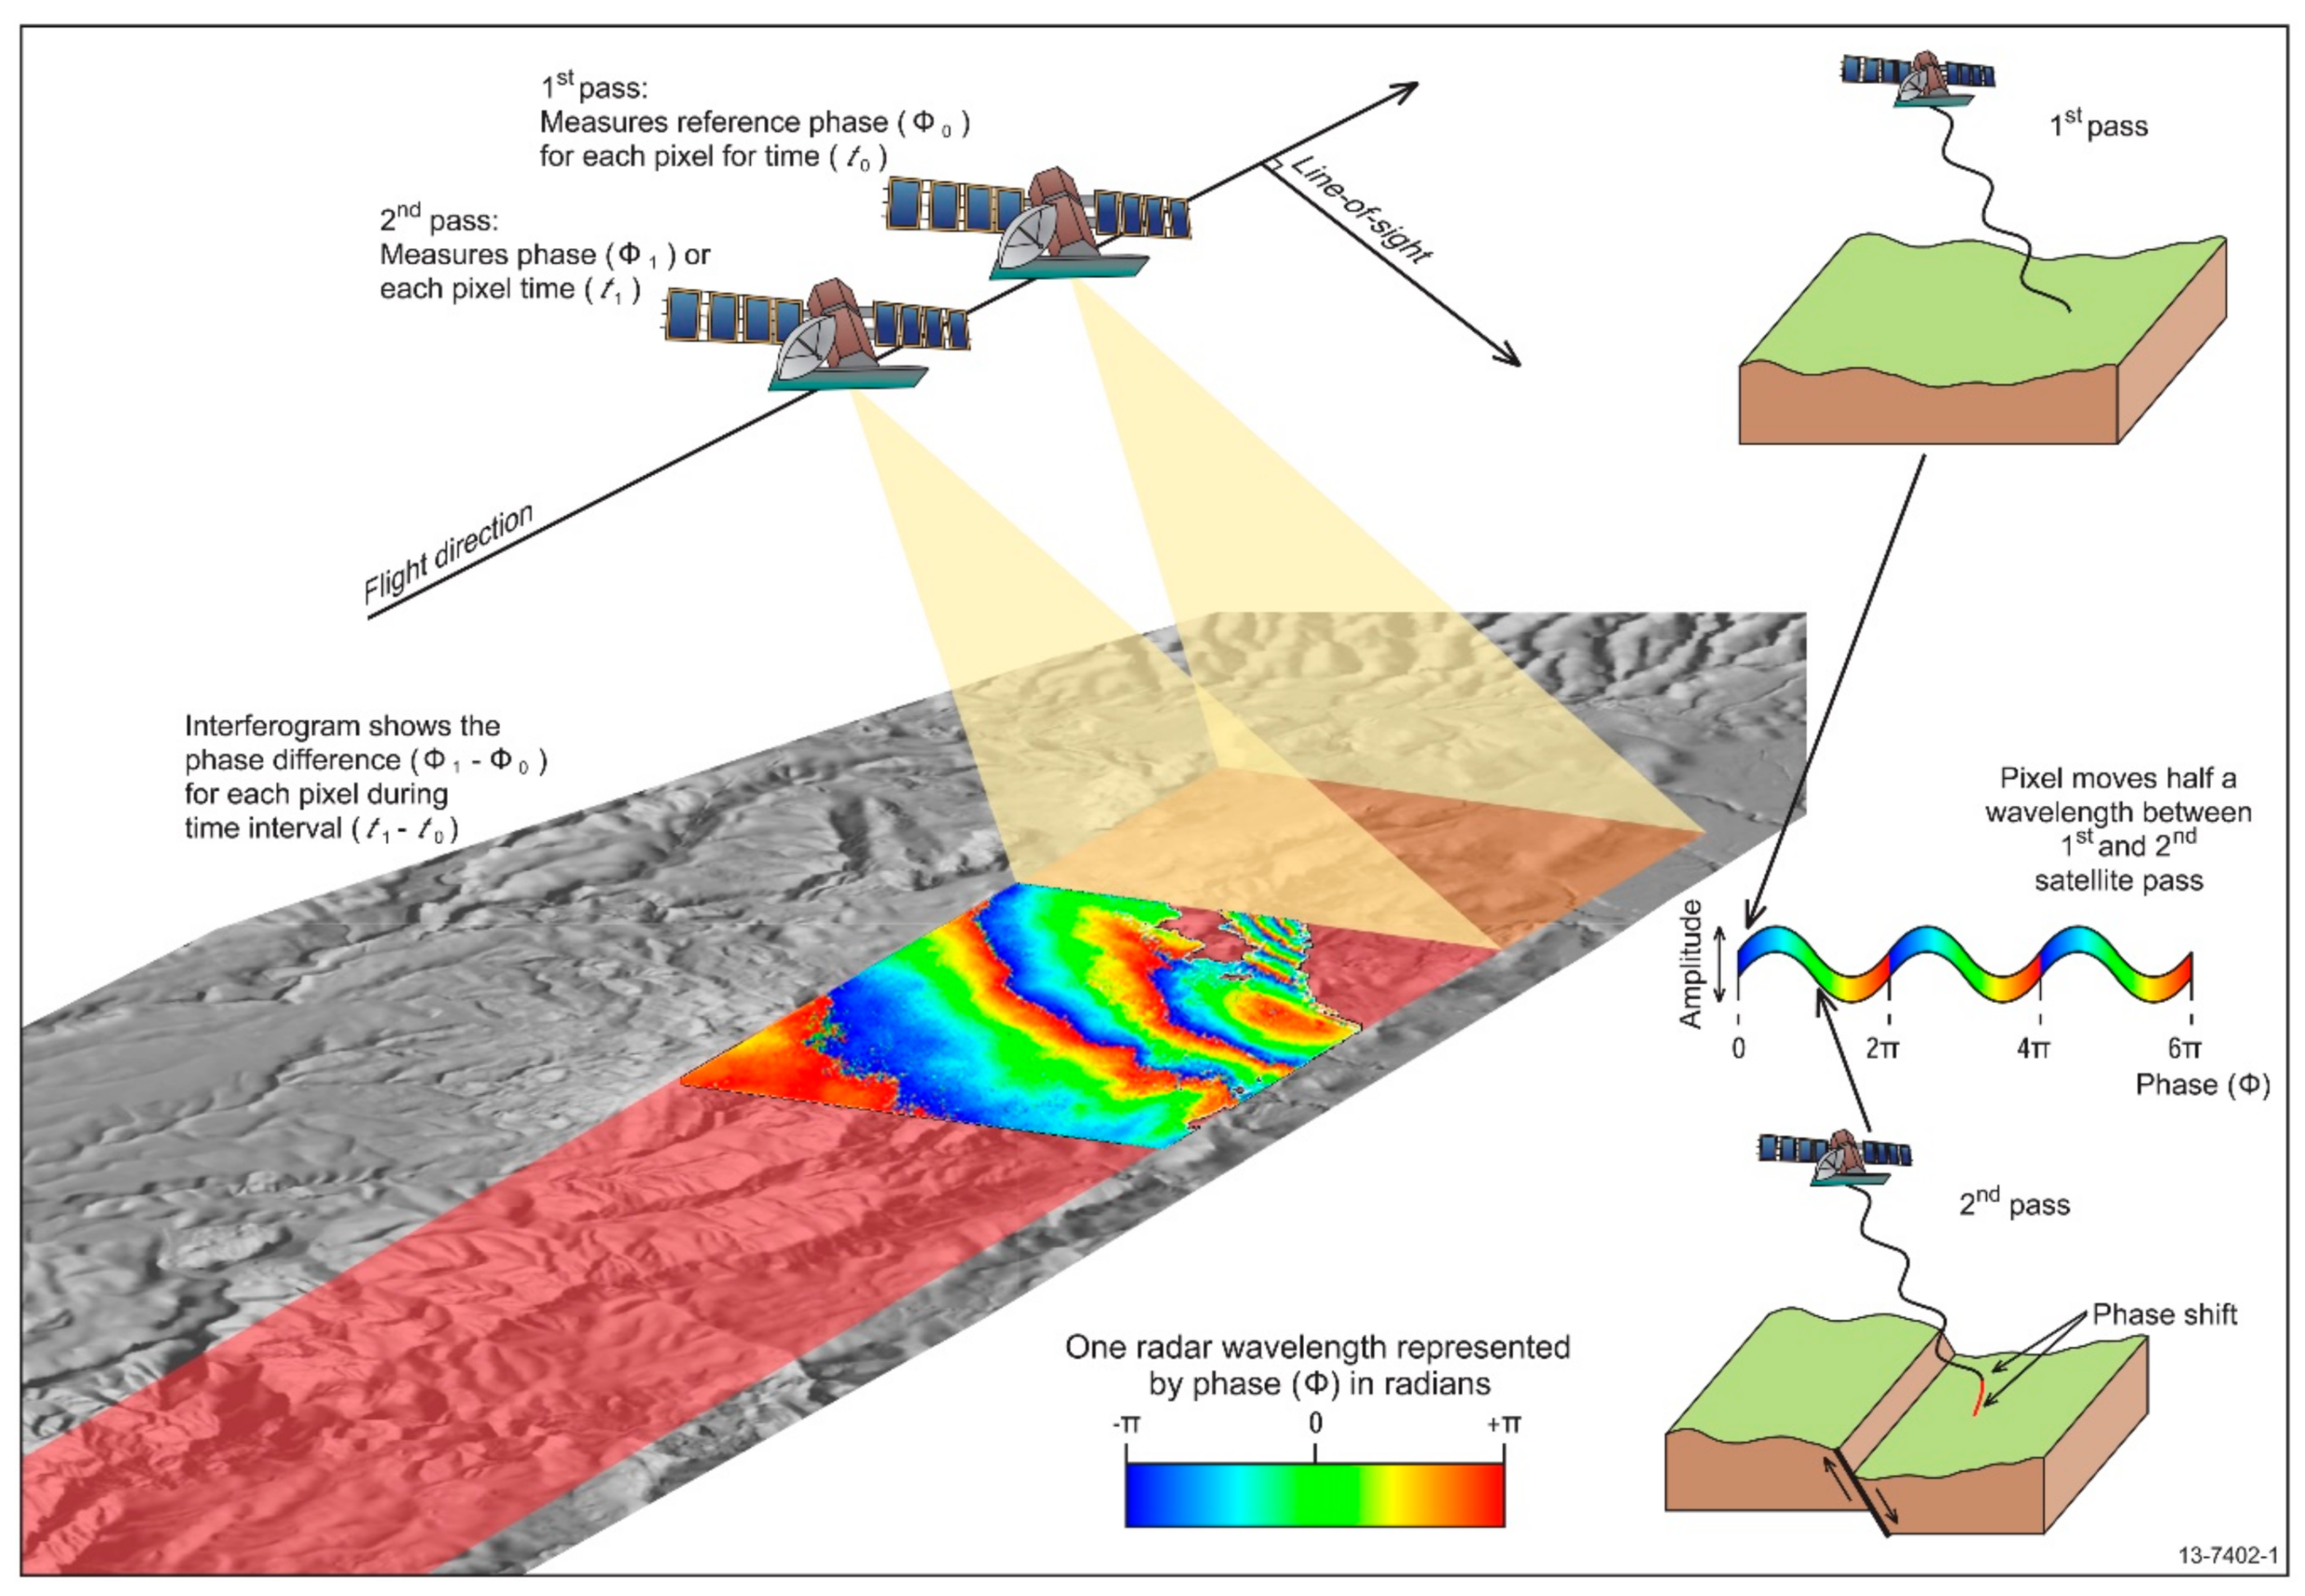
Figure 17.
Mean InSAR-based subsidence rates for important land-use classes in the Vietnamese Mekong River Delta for the 2006–2010 analysis period and breakdown of mechanisms causing the subsidence provided in Minderhoud et al. [218]. (Adapted with permission from Minderhoud et al. [218]).

Figure 18.
Vertical subsidence velocity map near Dongying Port in the Yellow River Delta, China, for the periods of (a) 2007–2010 and (b) 2015–2018. (Adapted with permission from [219]).
Figure 18.
Vertical subsidence velocity map near Dongying Port in the Yellow River Delta, China, for the periods of (a) 2007–2010 and (b) 2015–2018. (Adapted with permission from [219]).


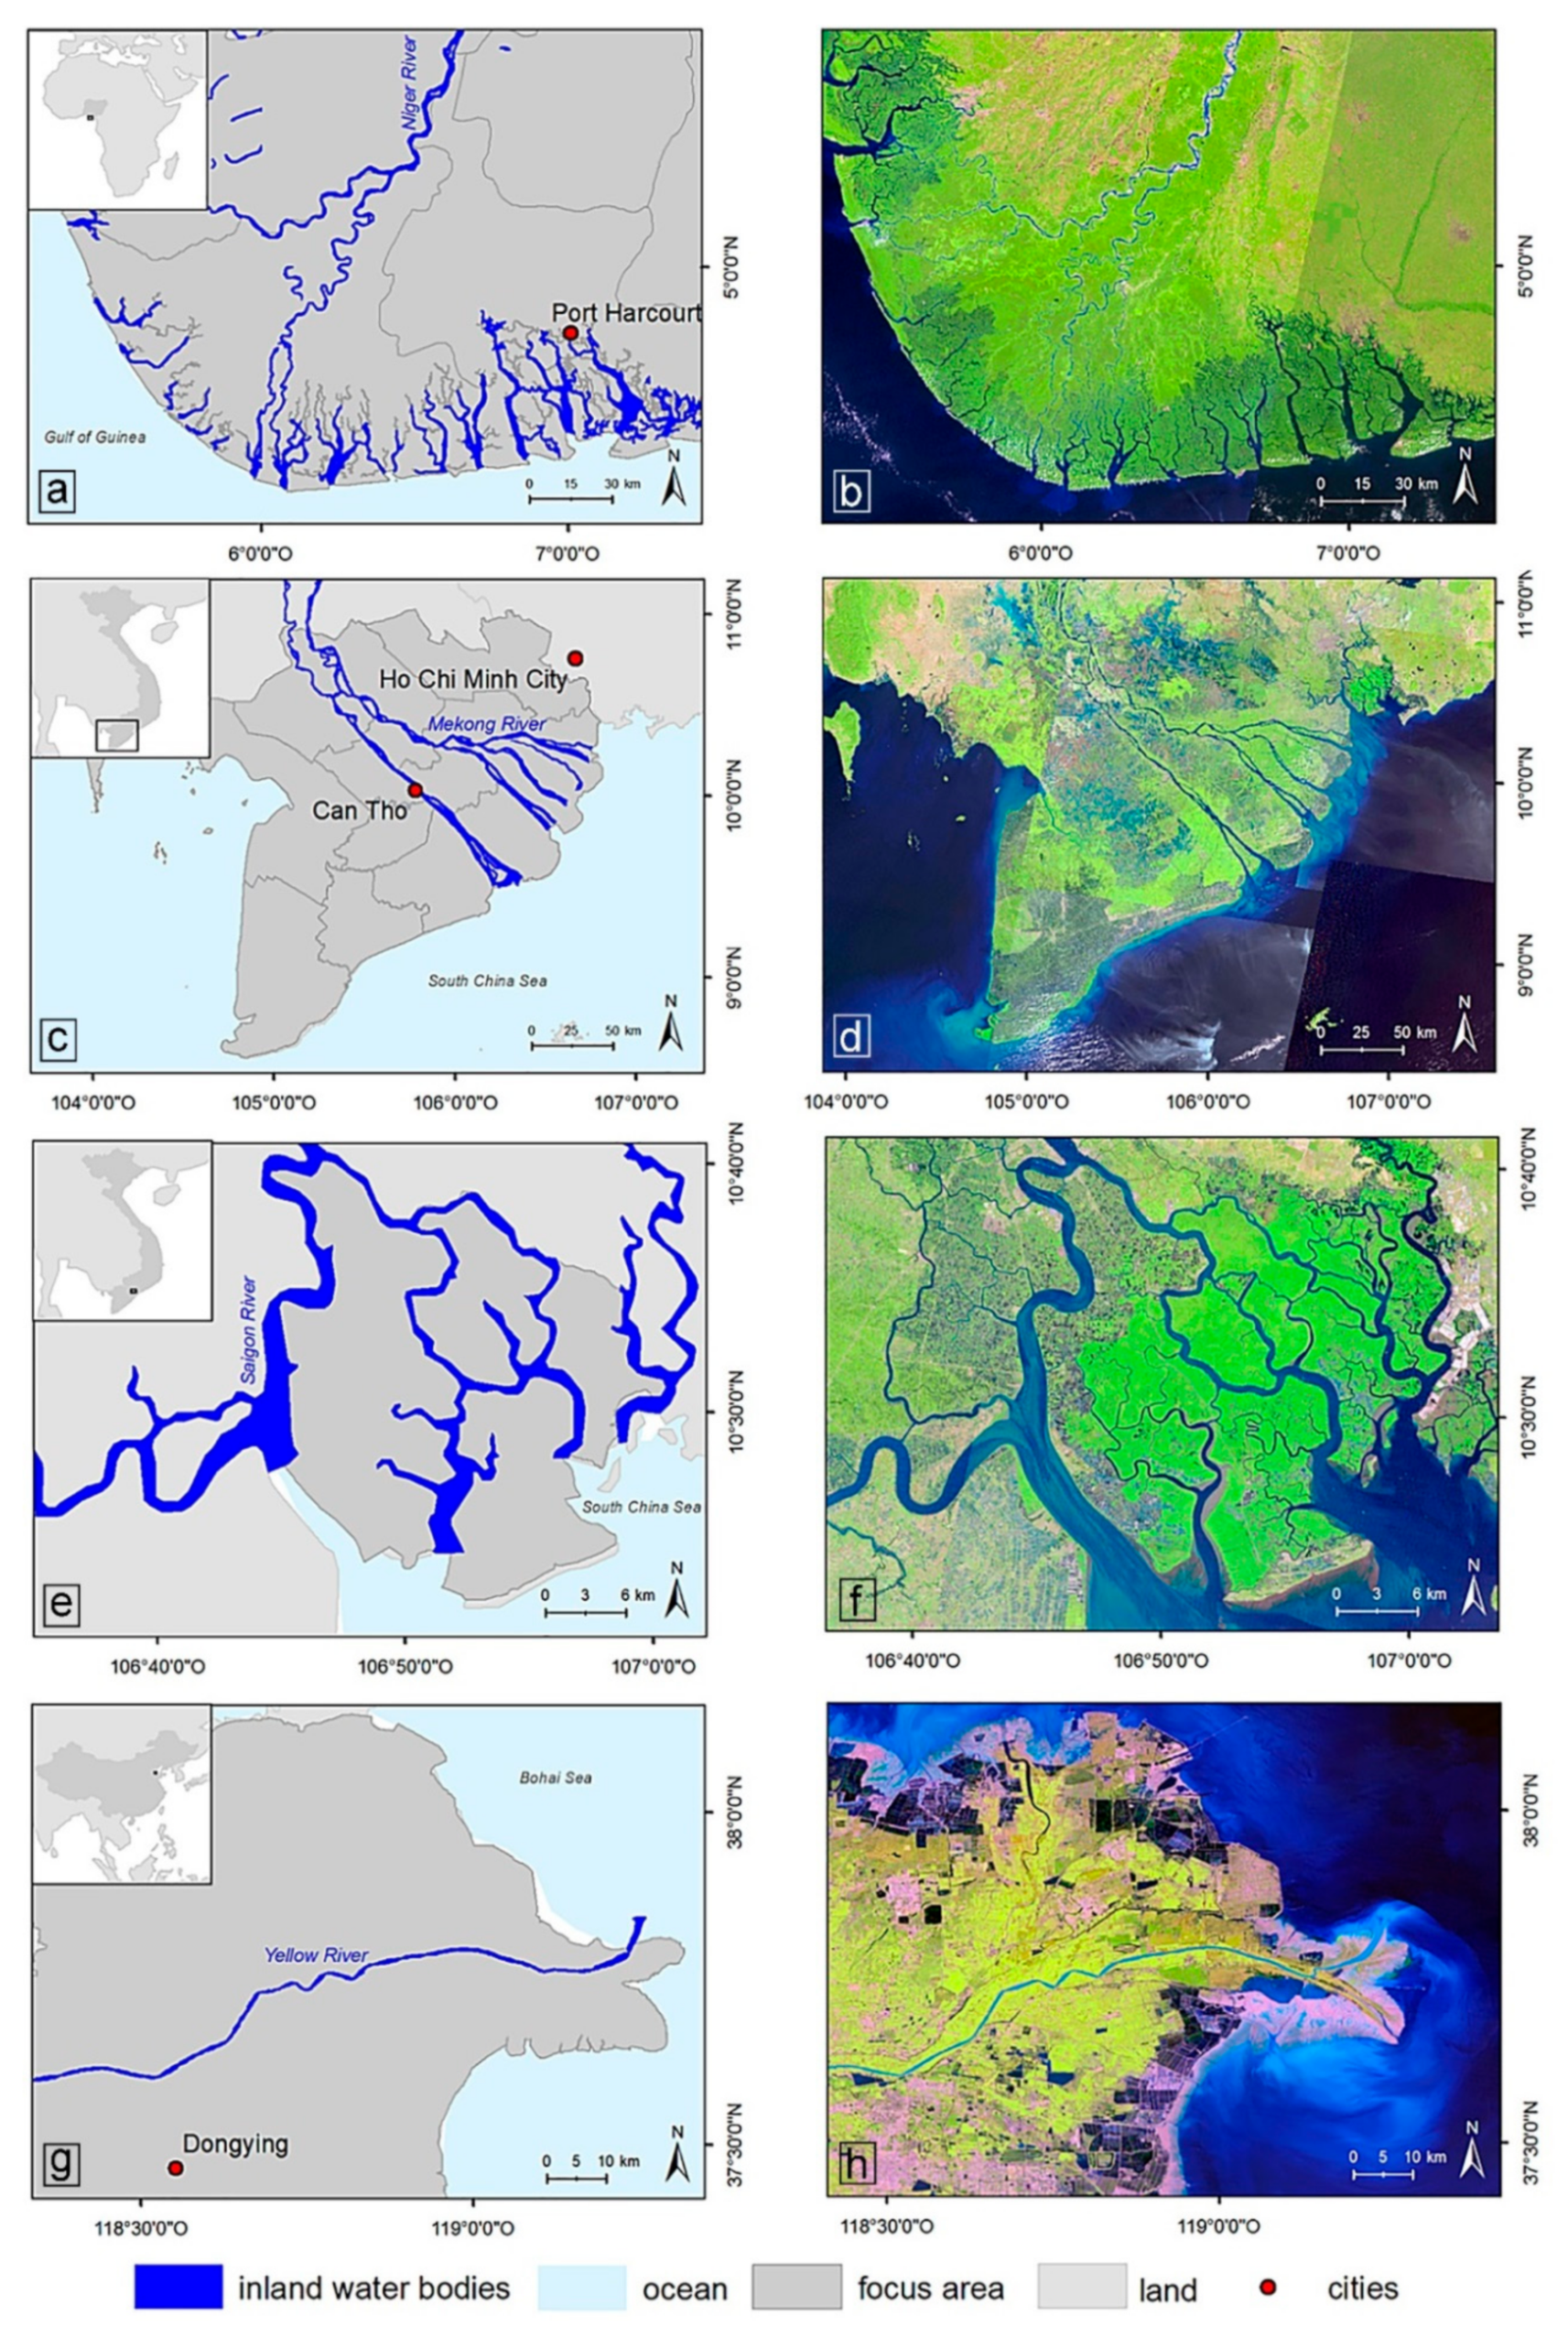
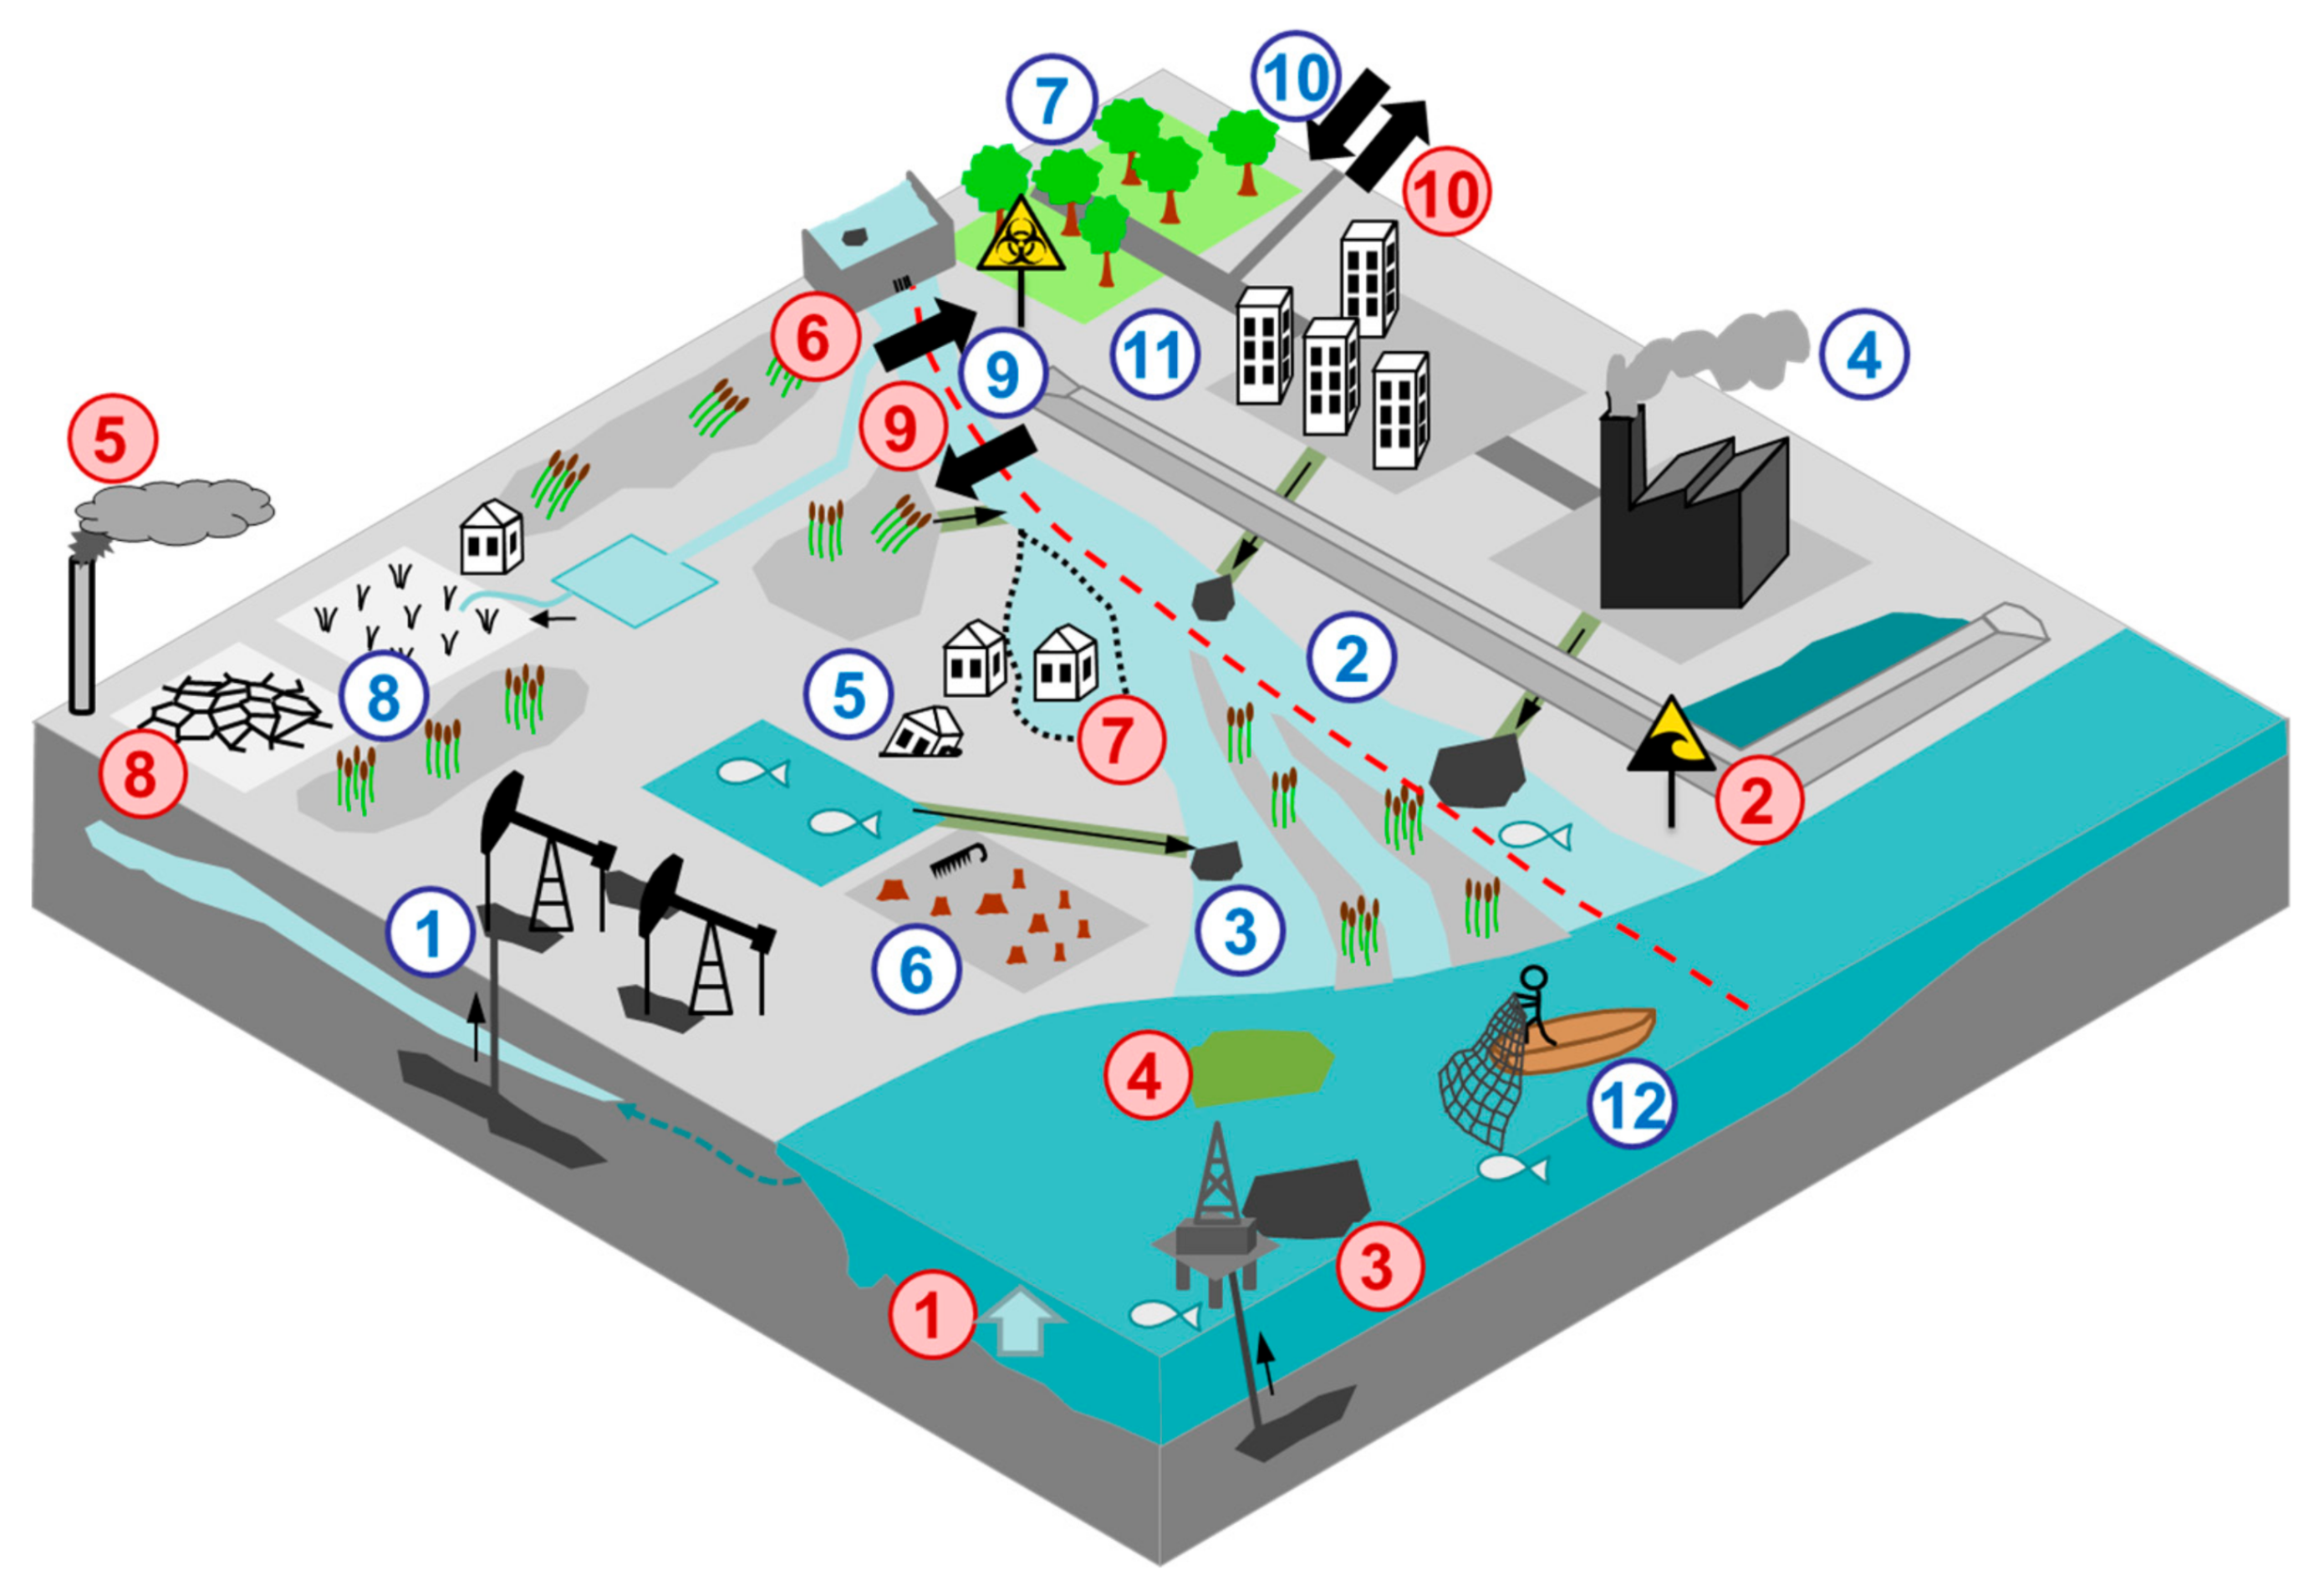
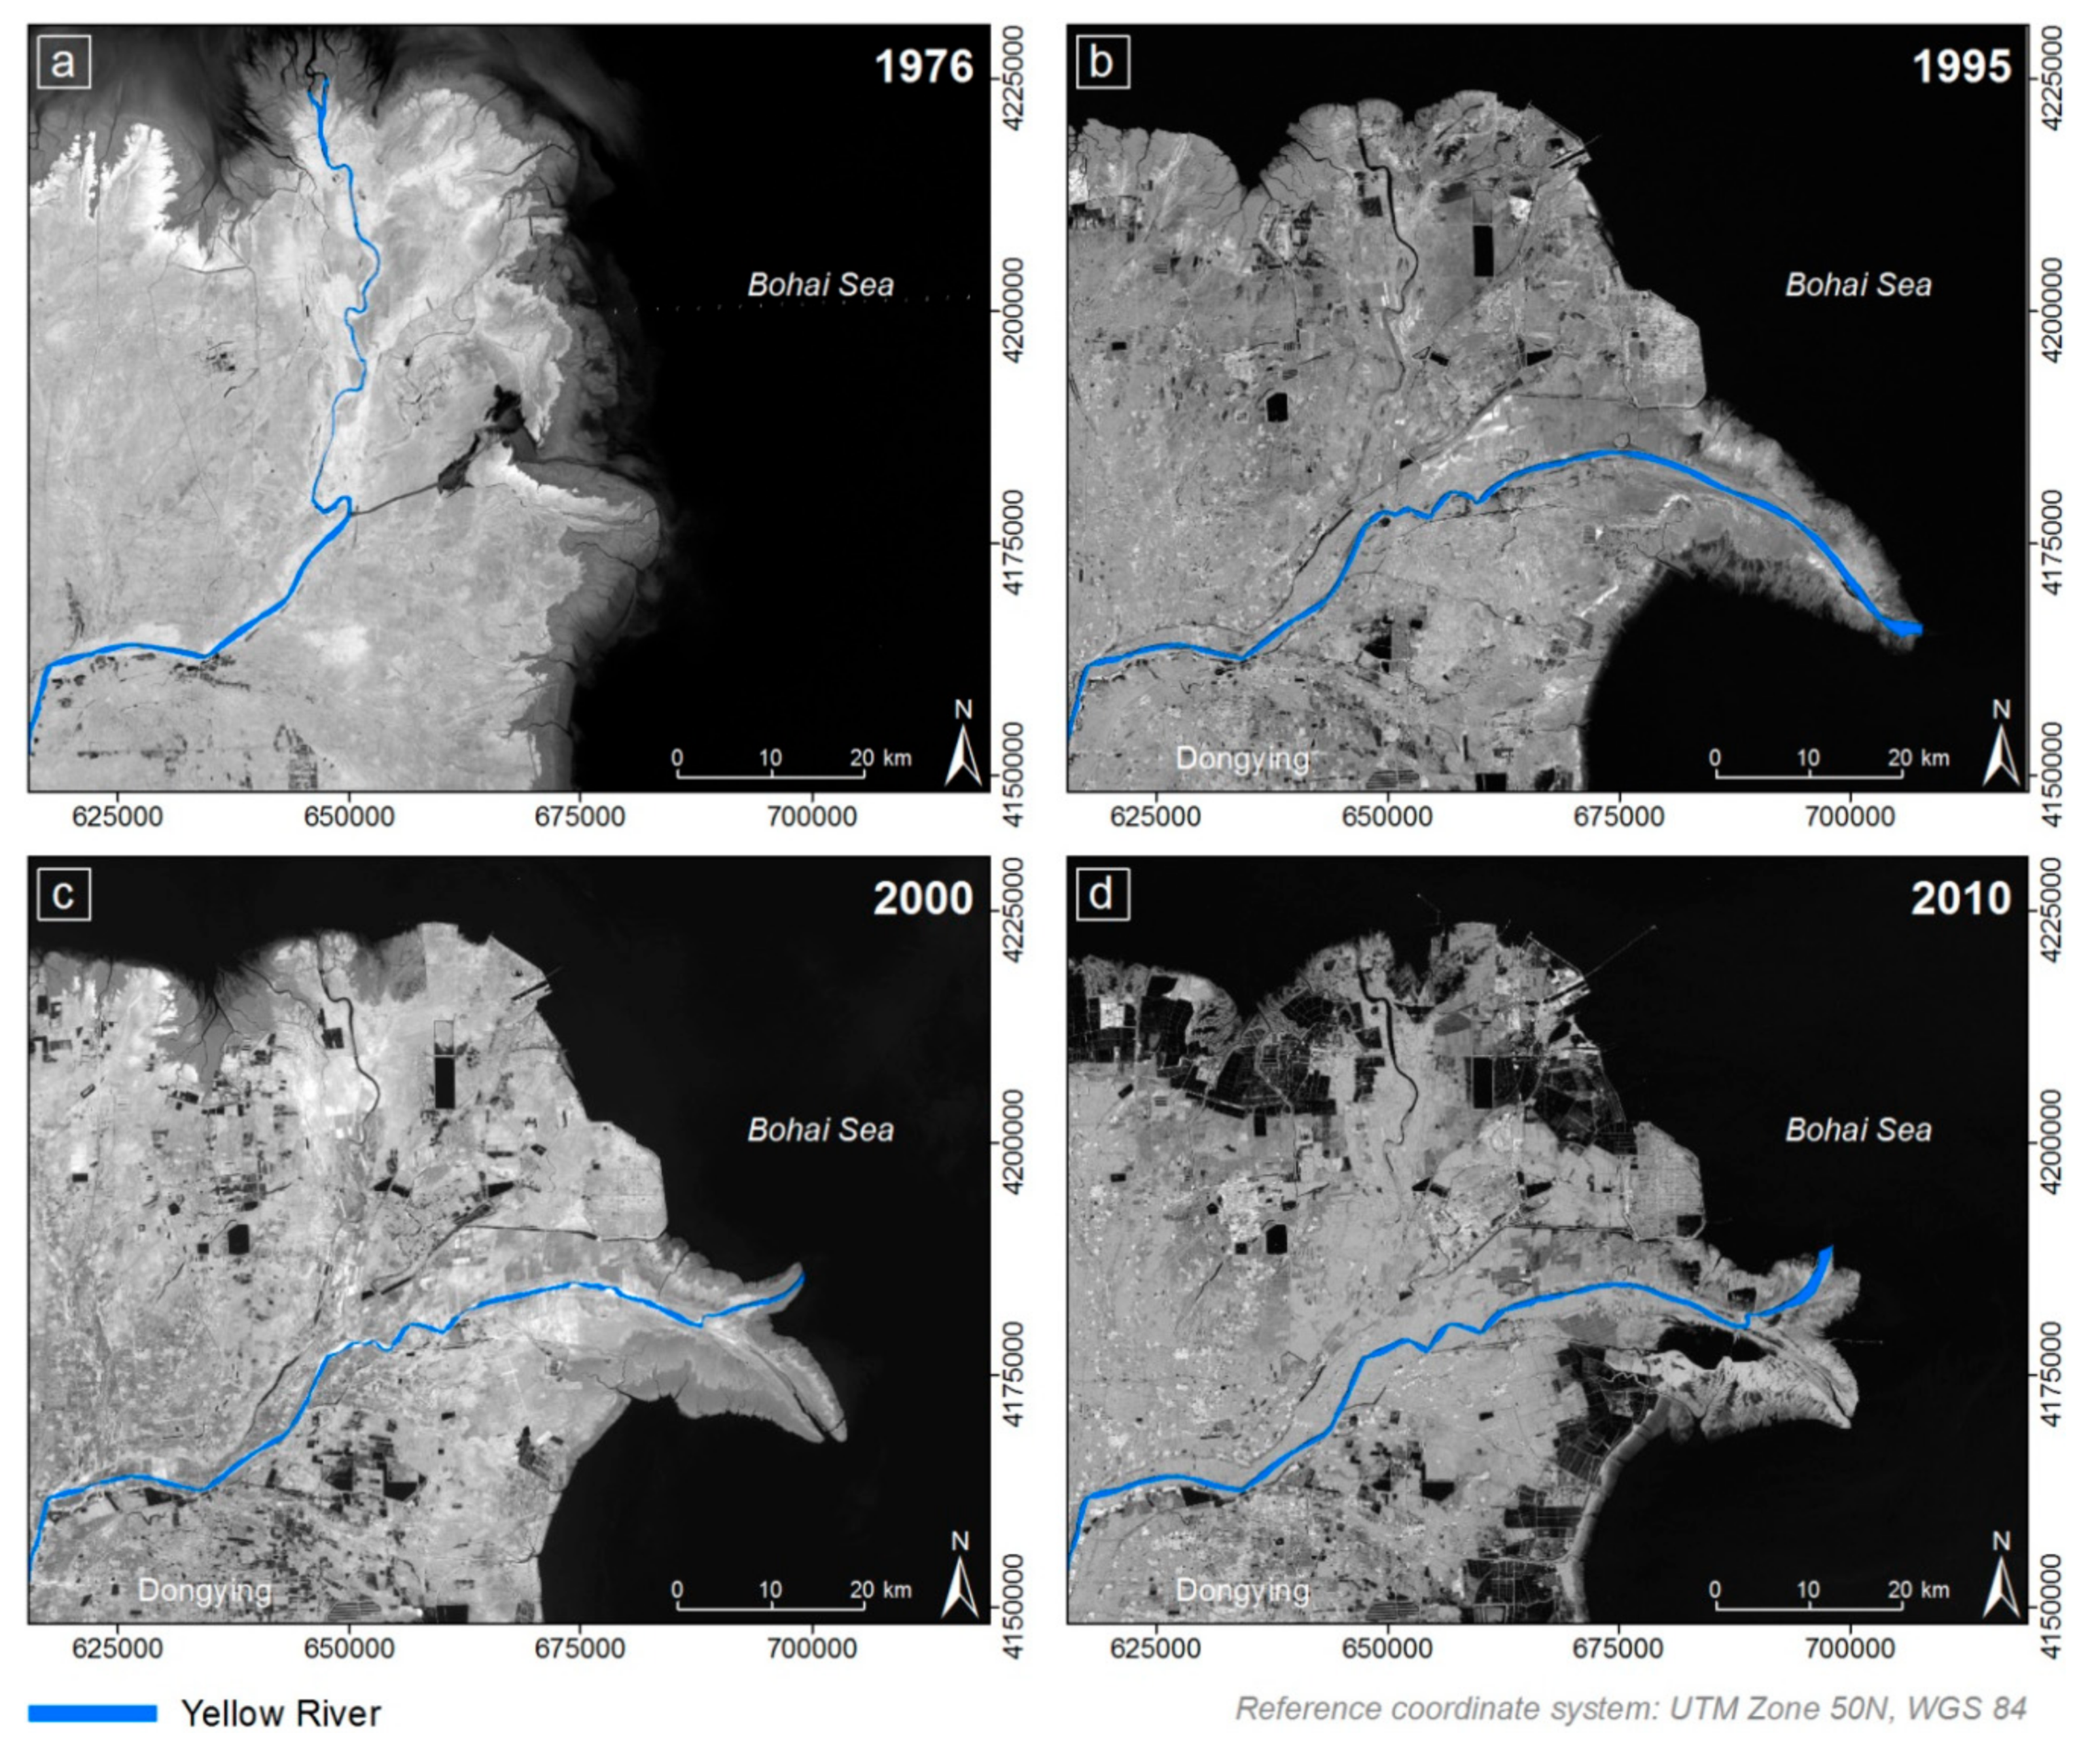
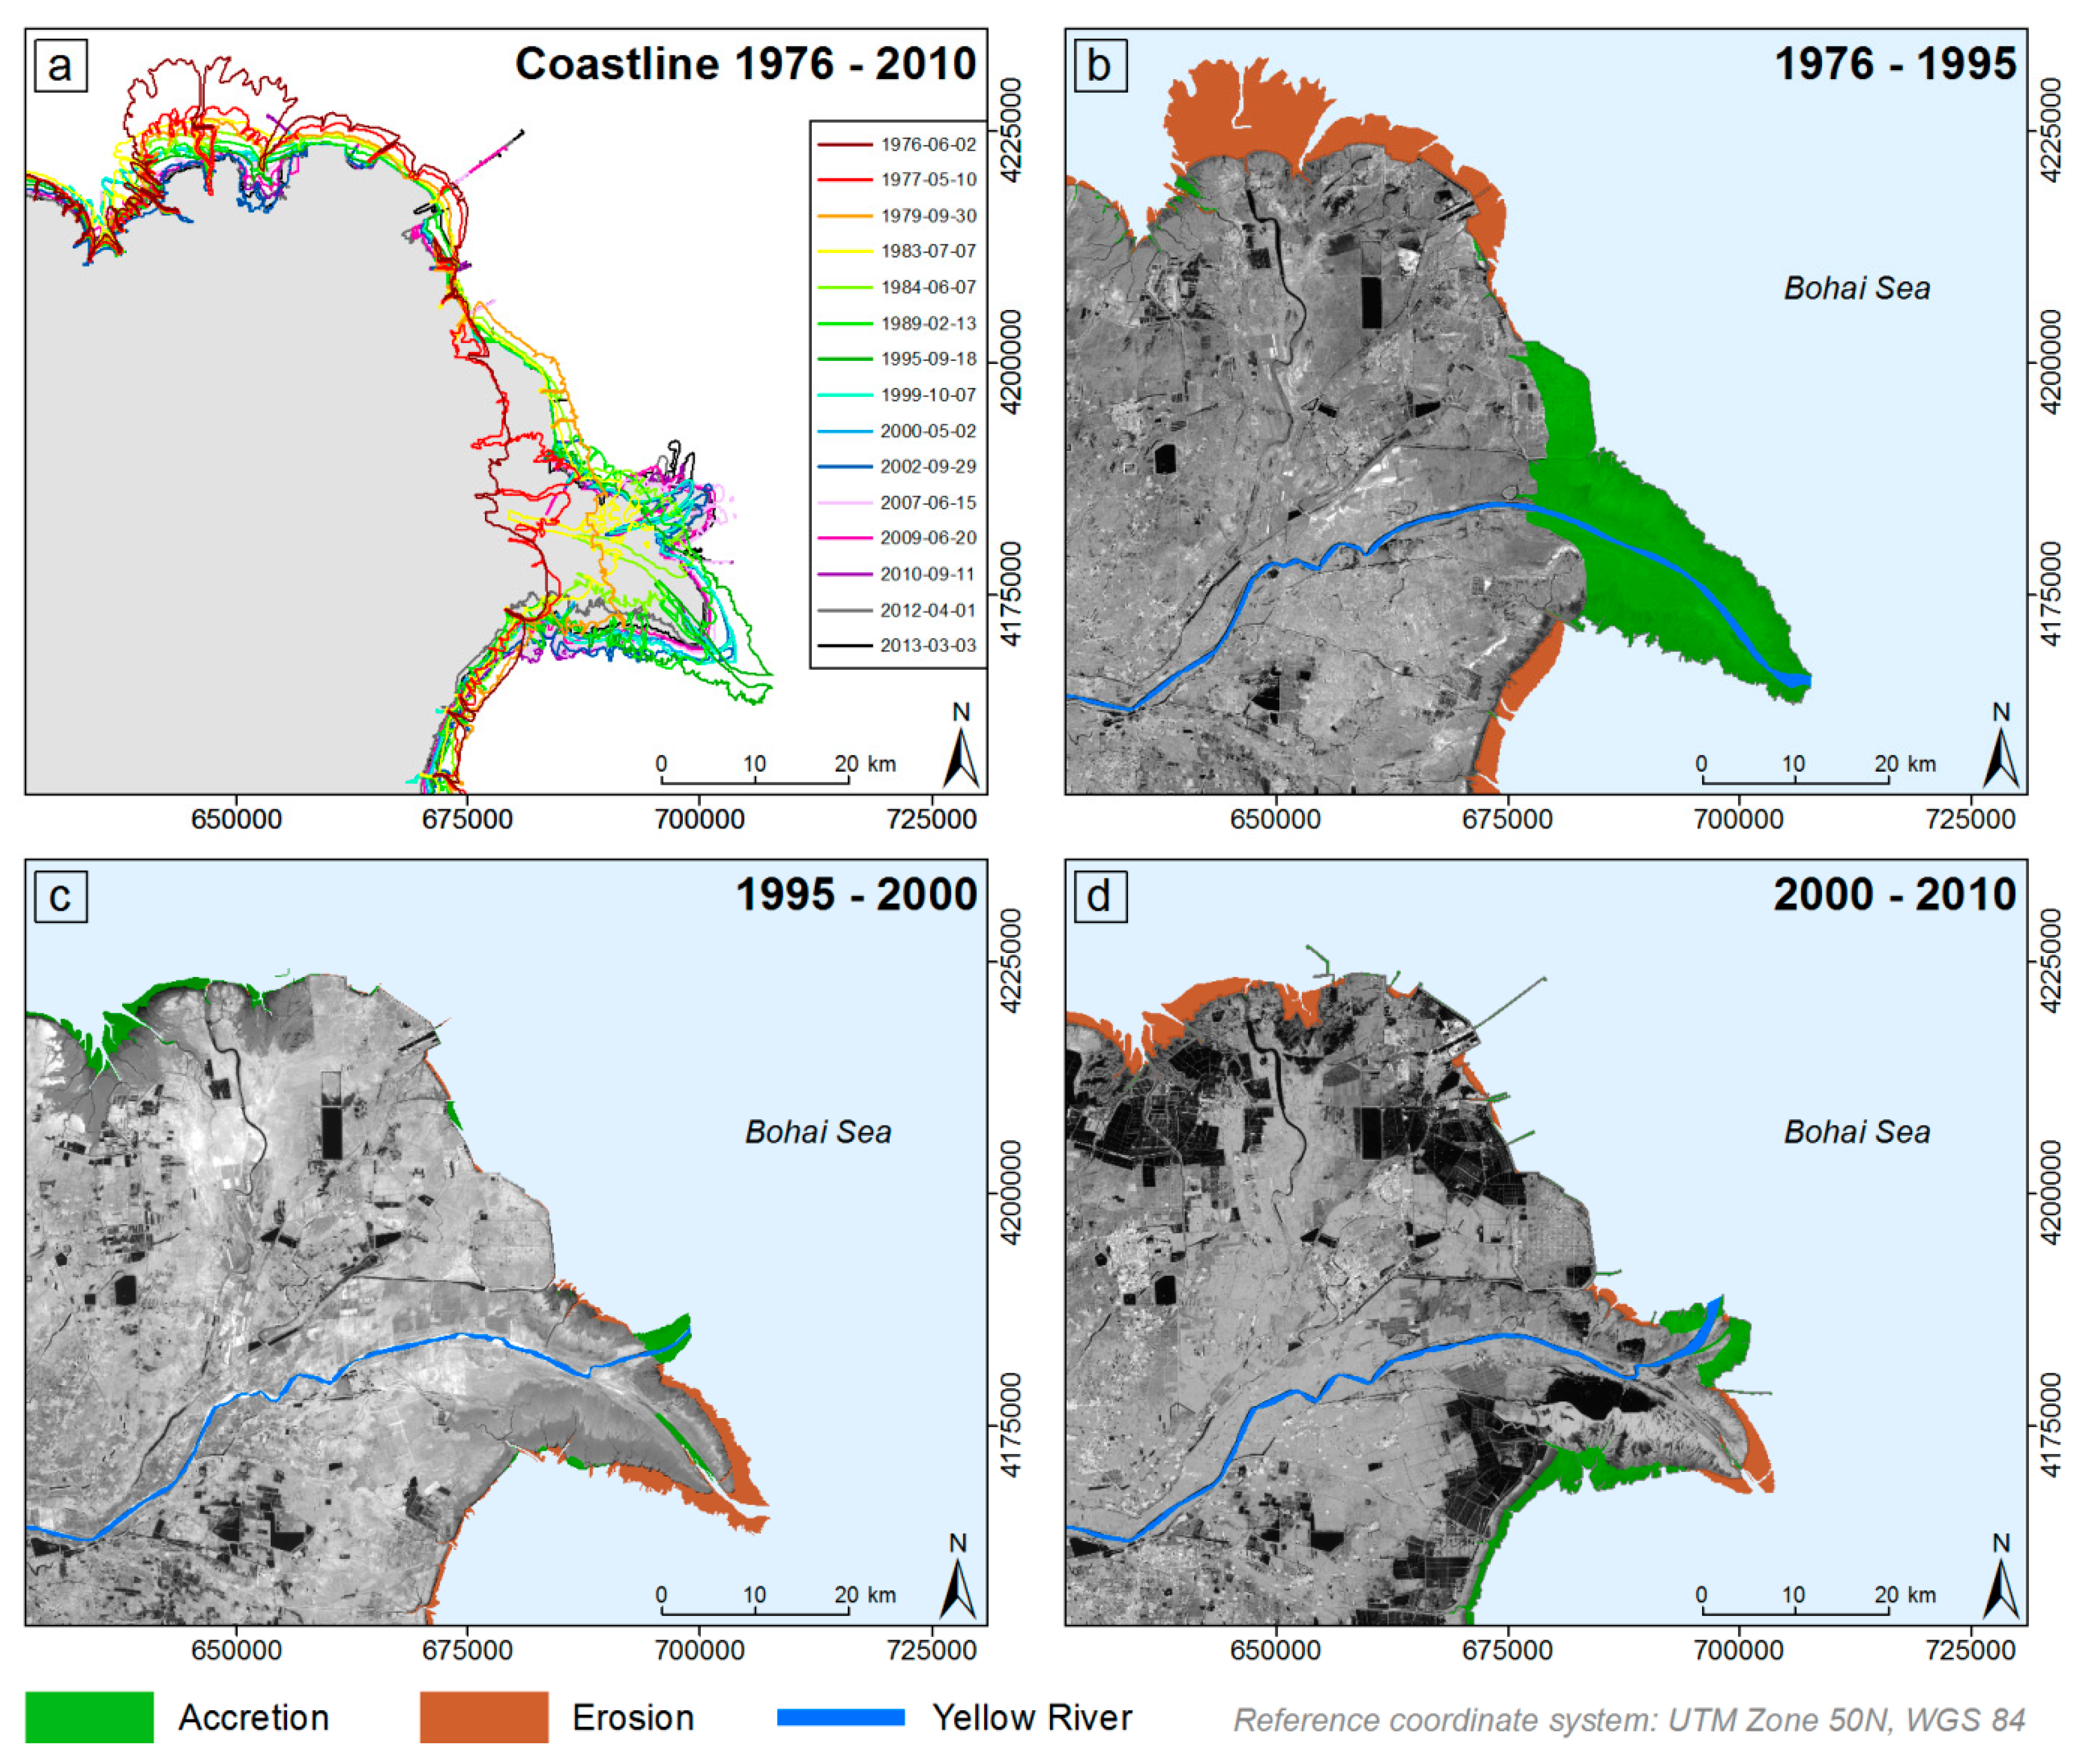
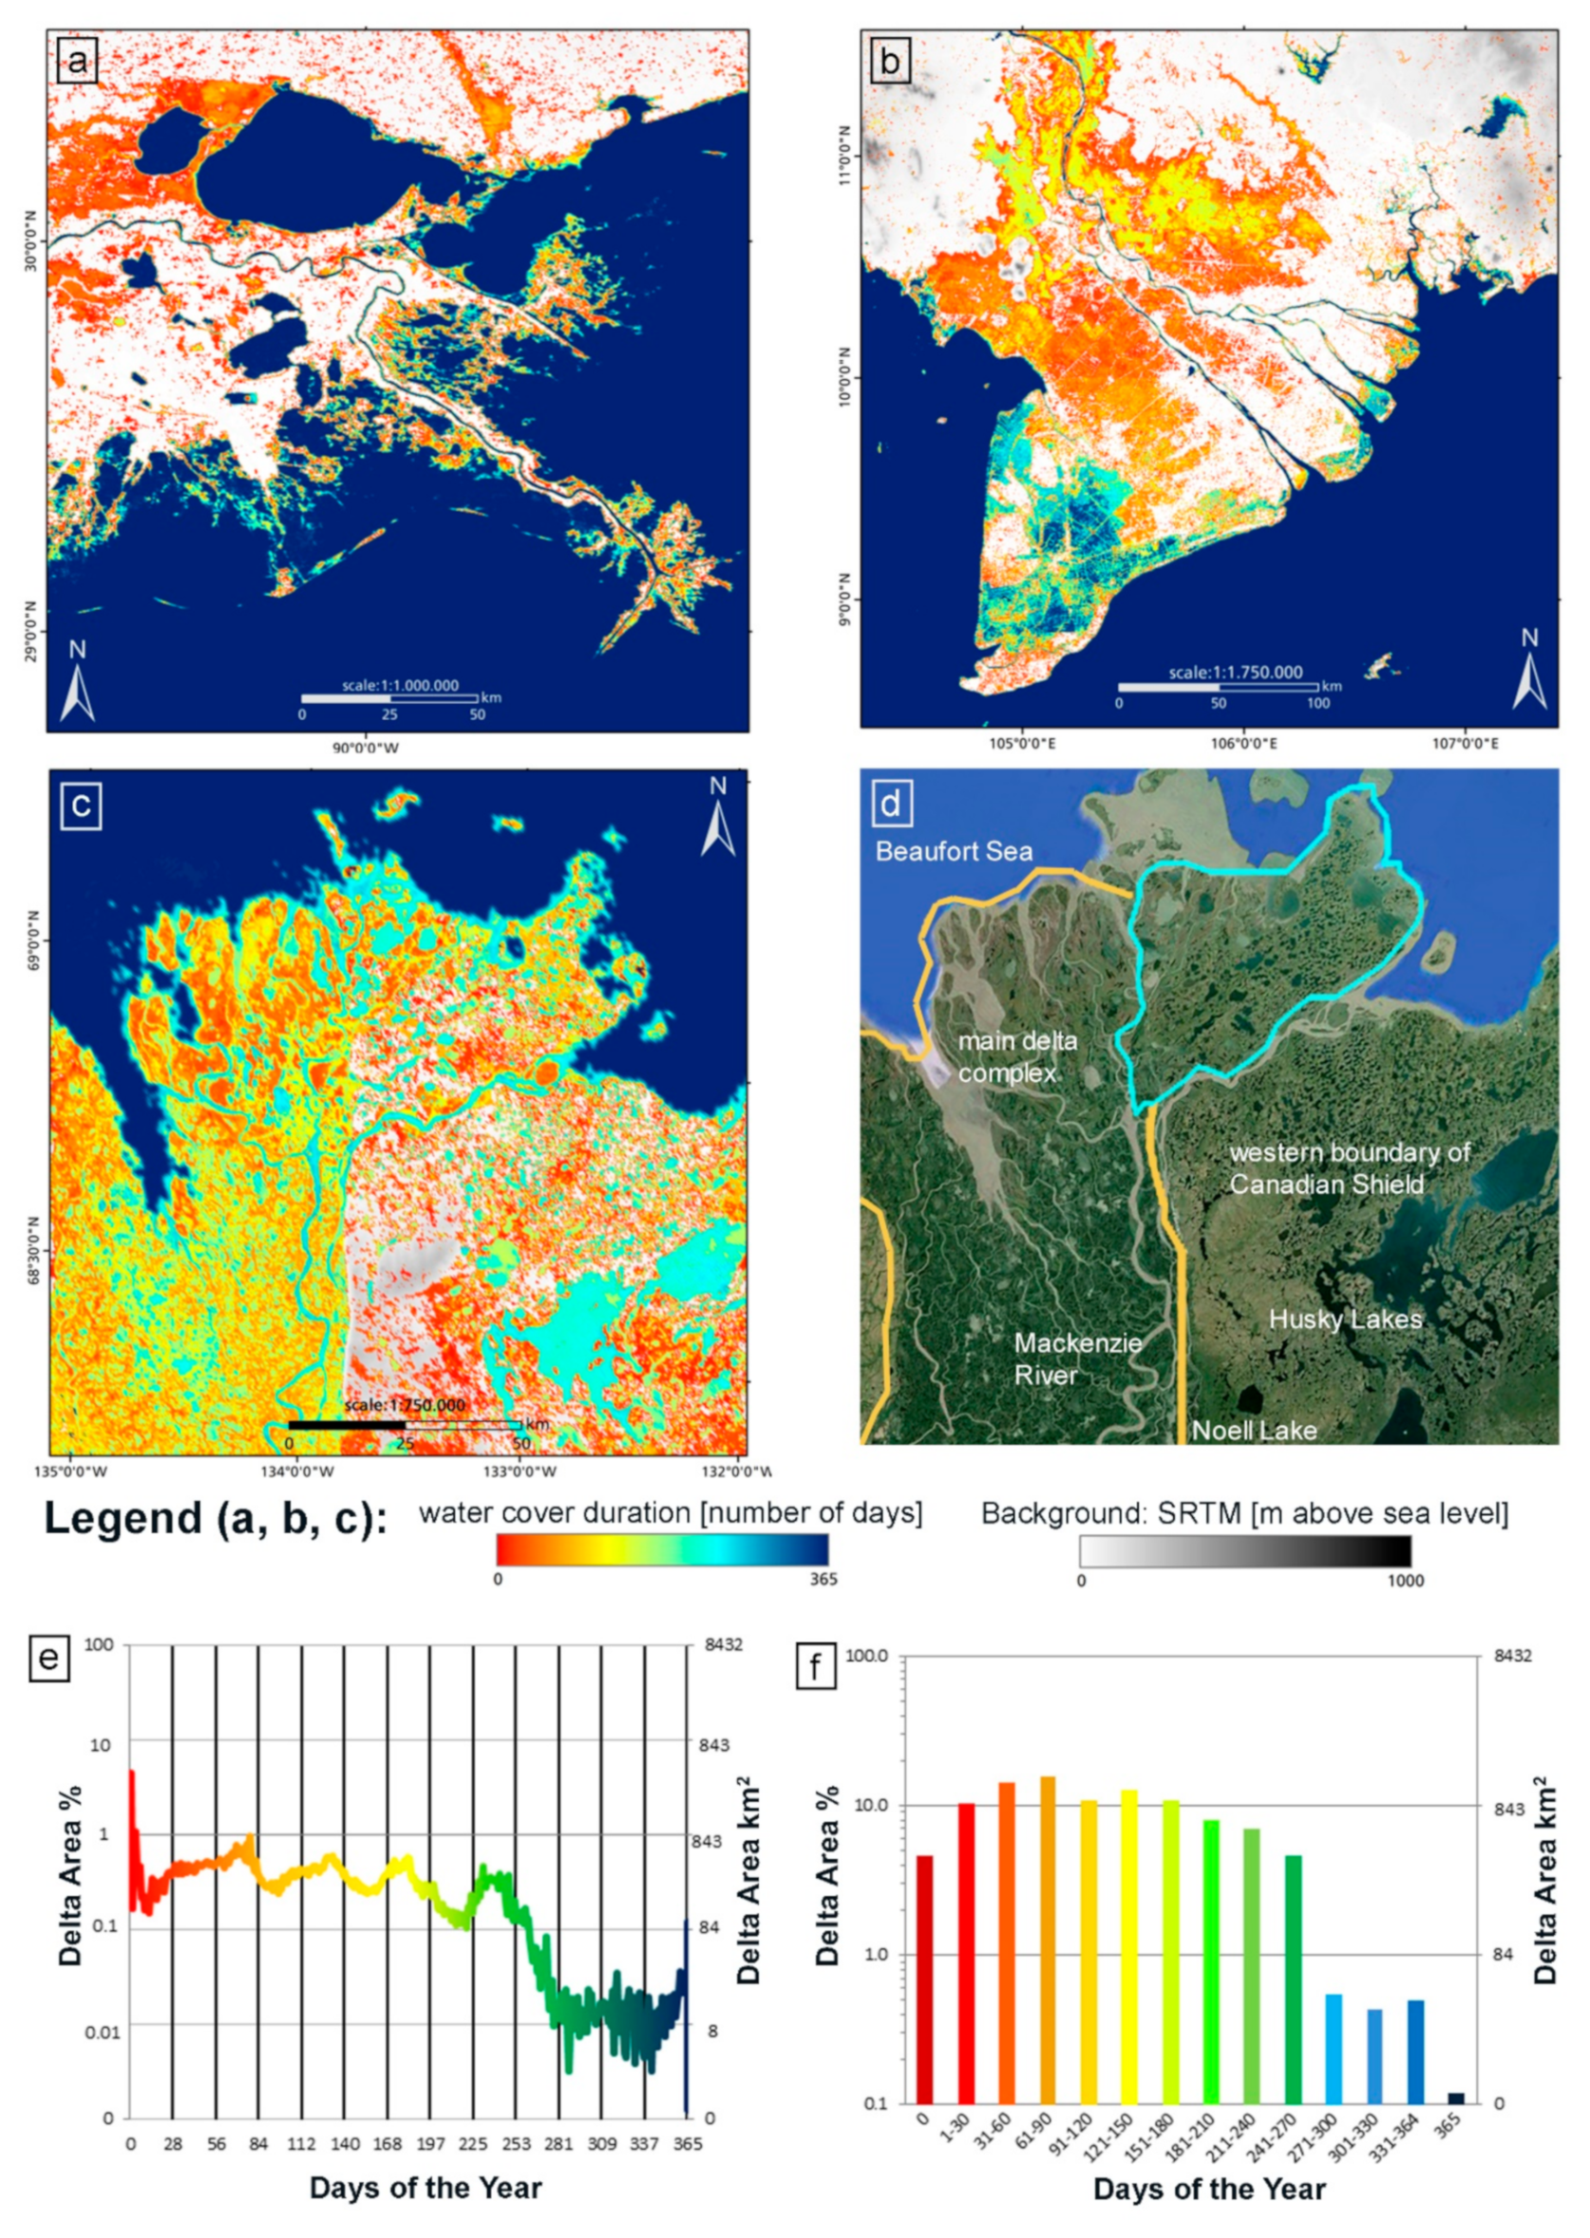
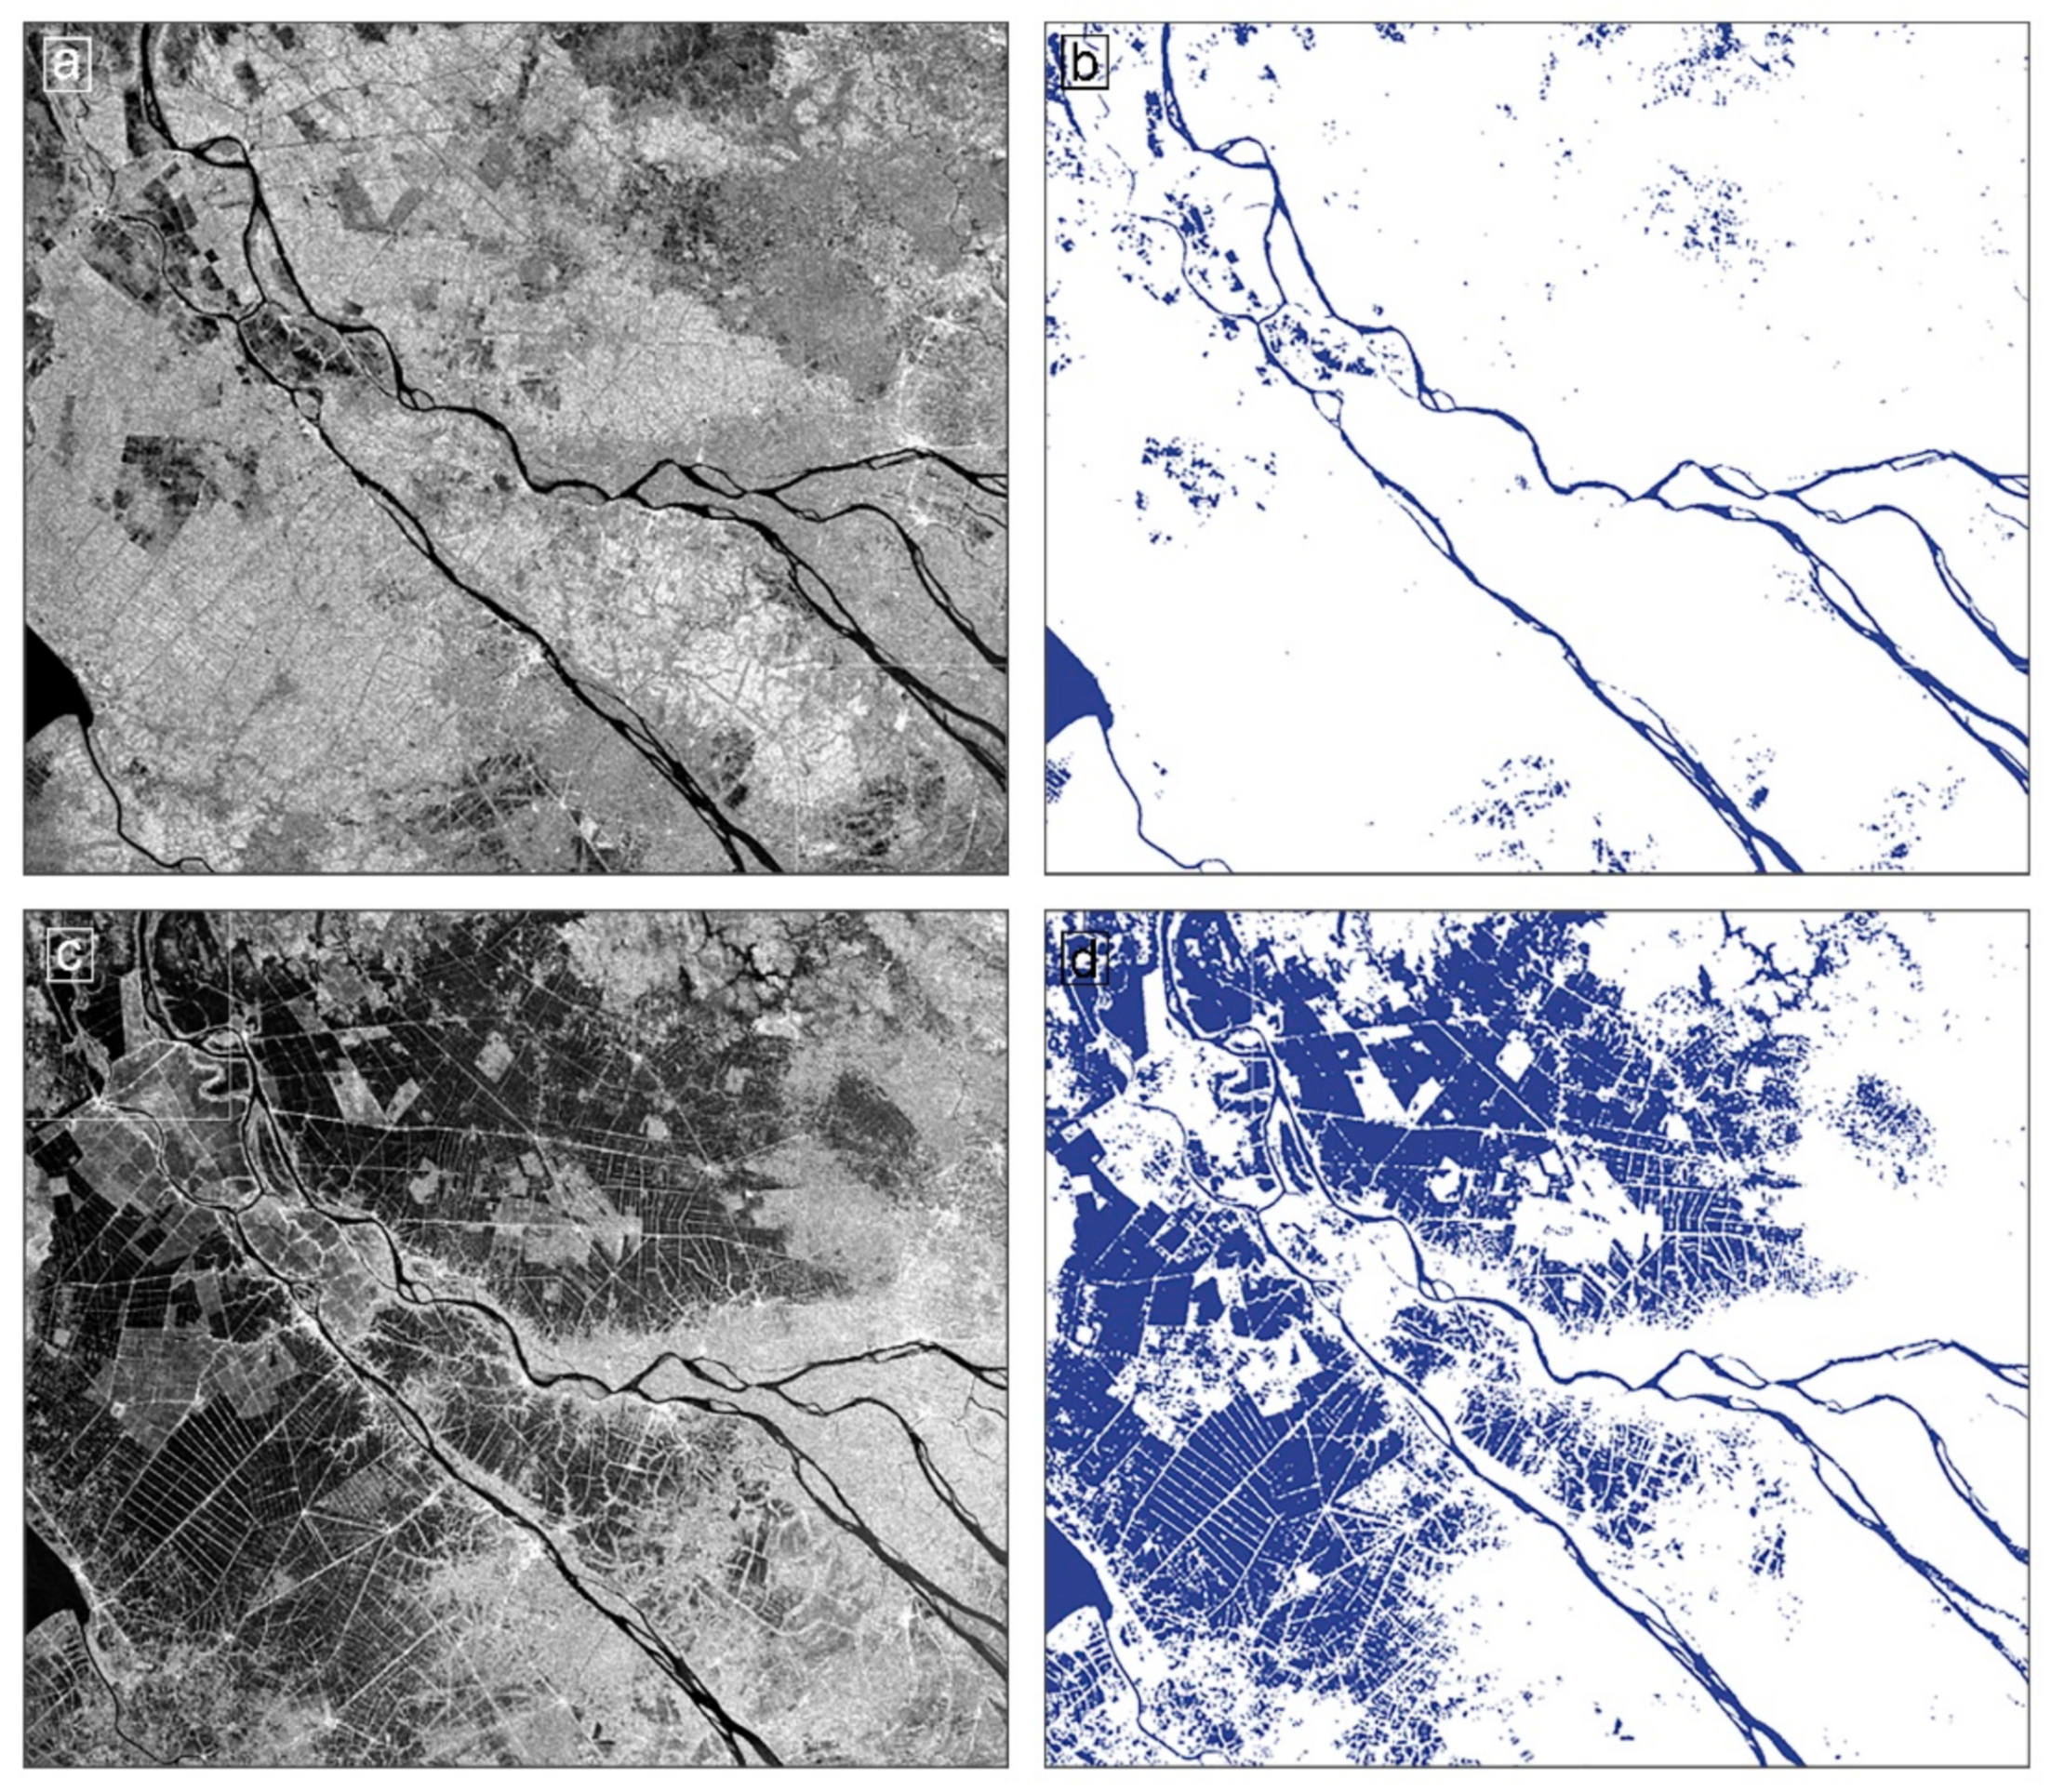
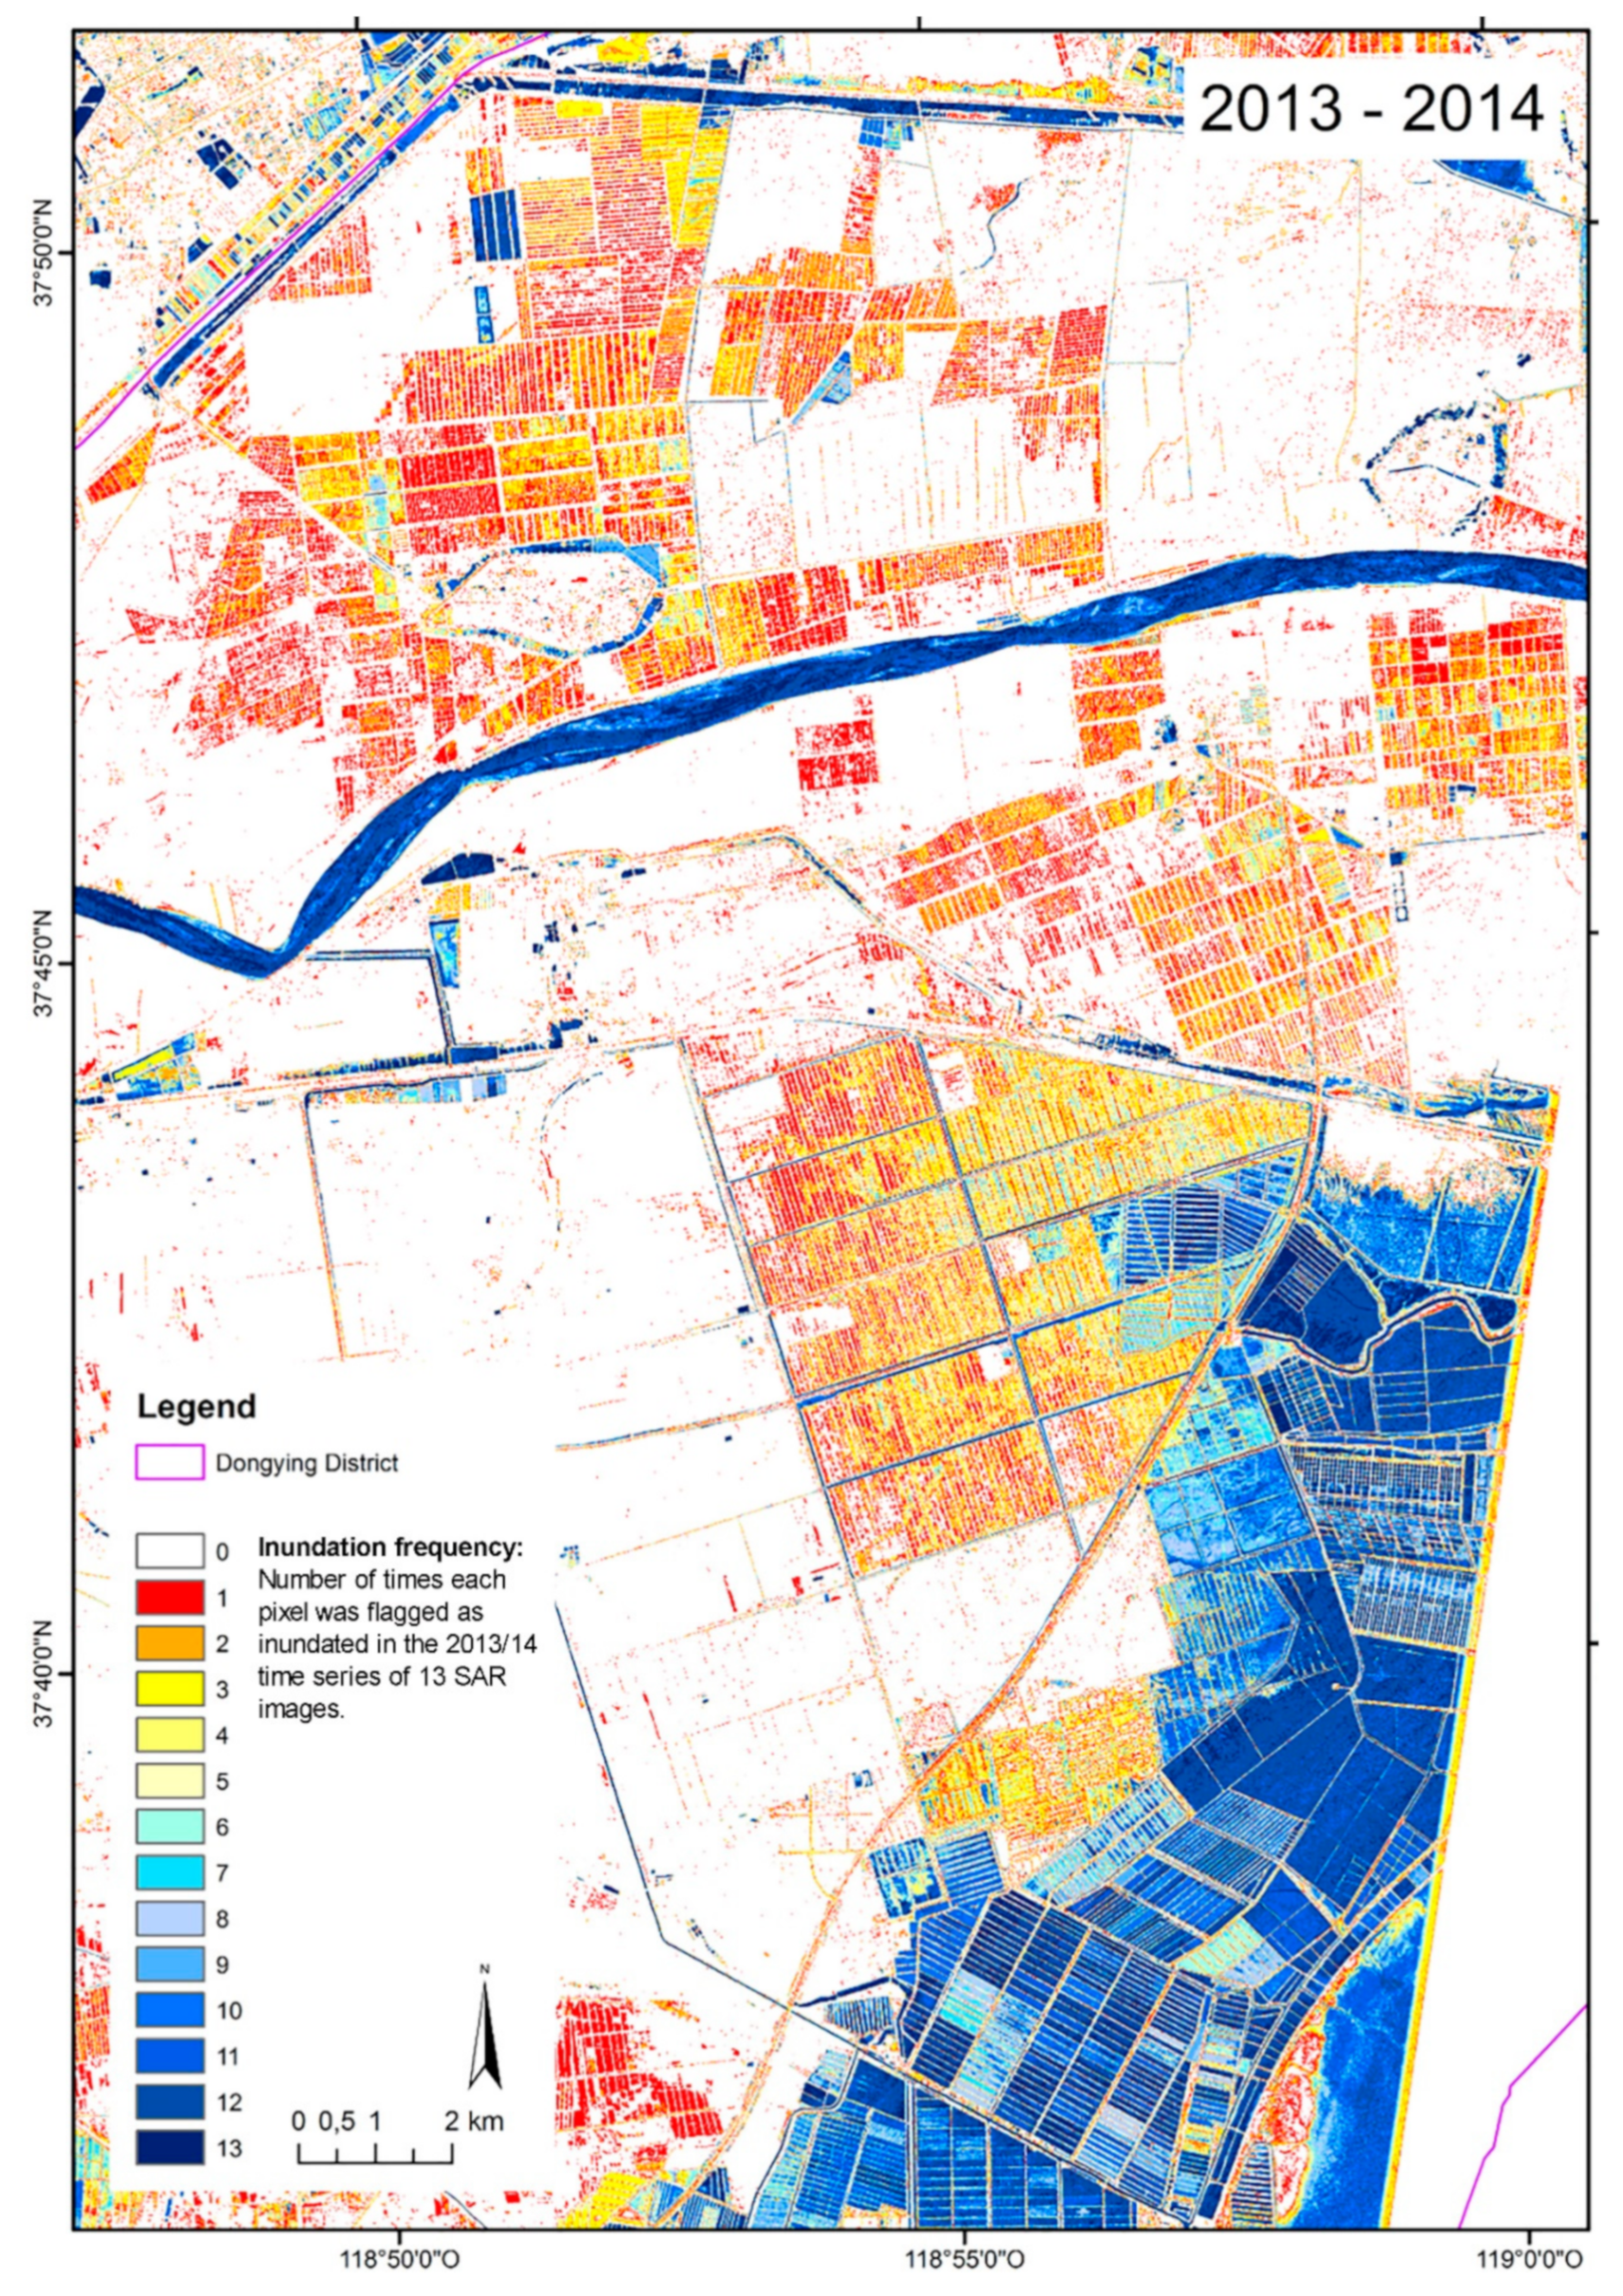
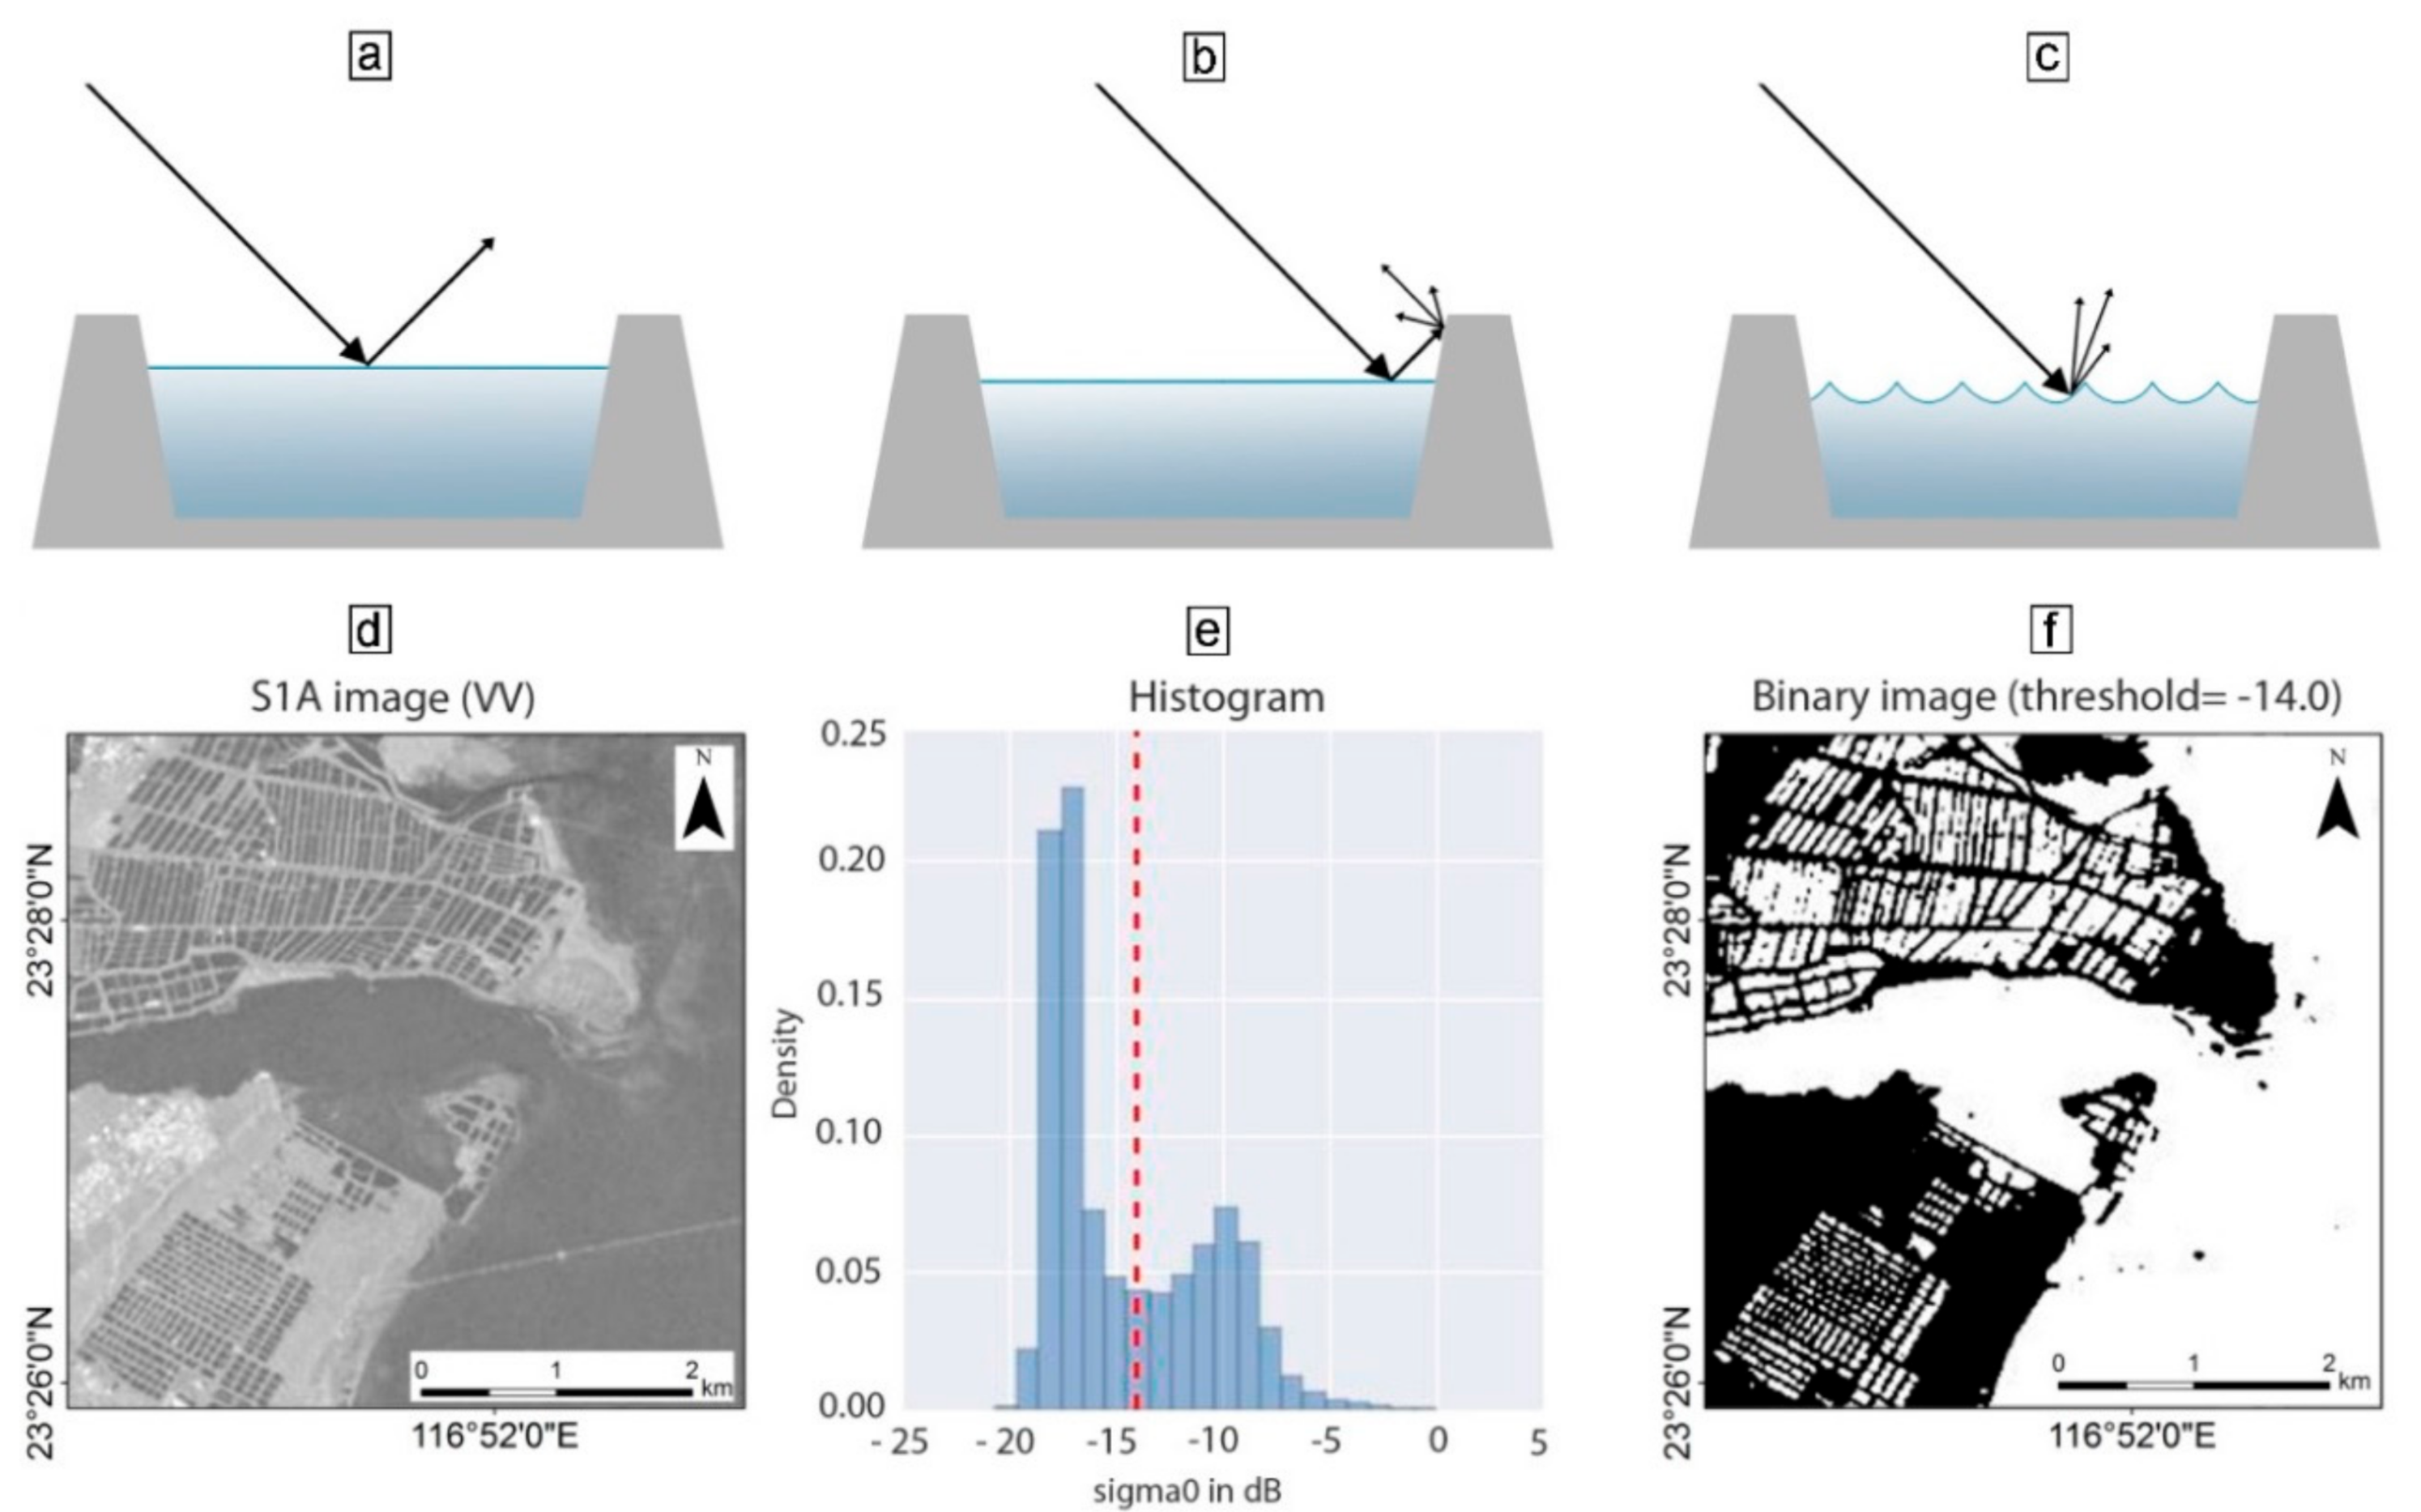
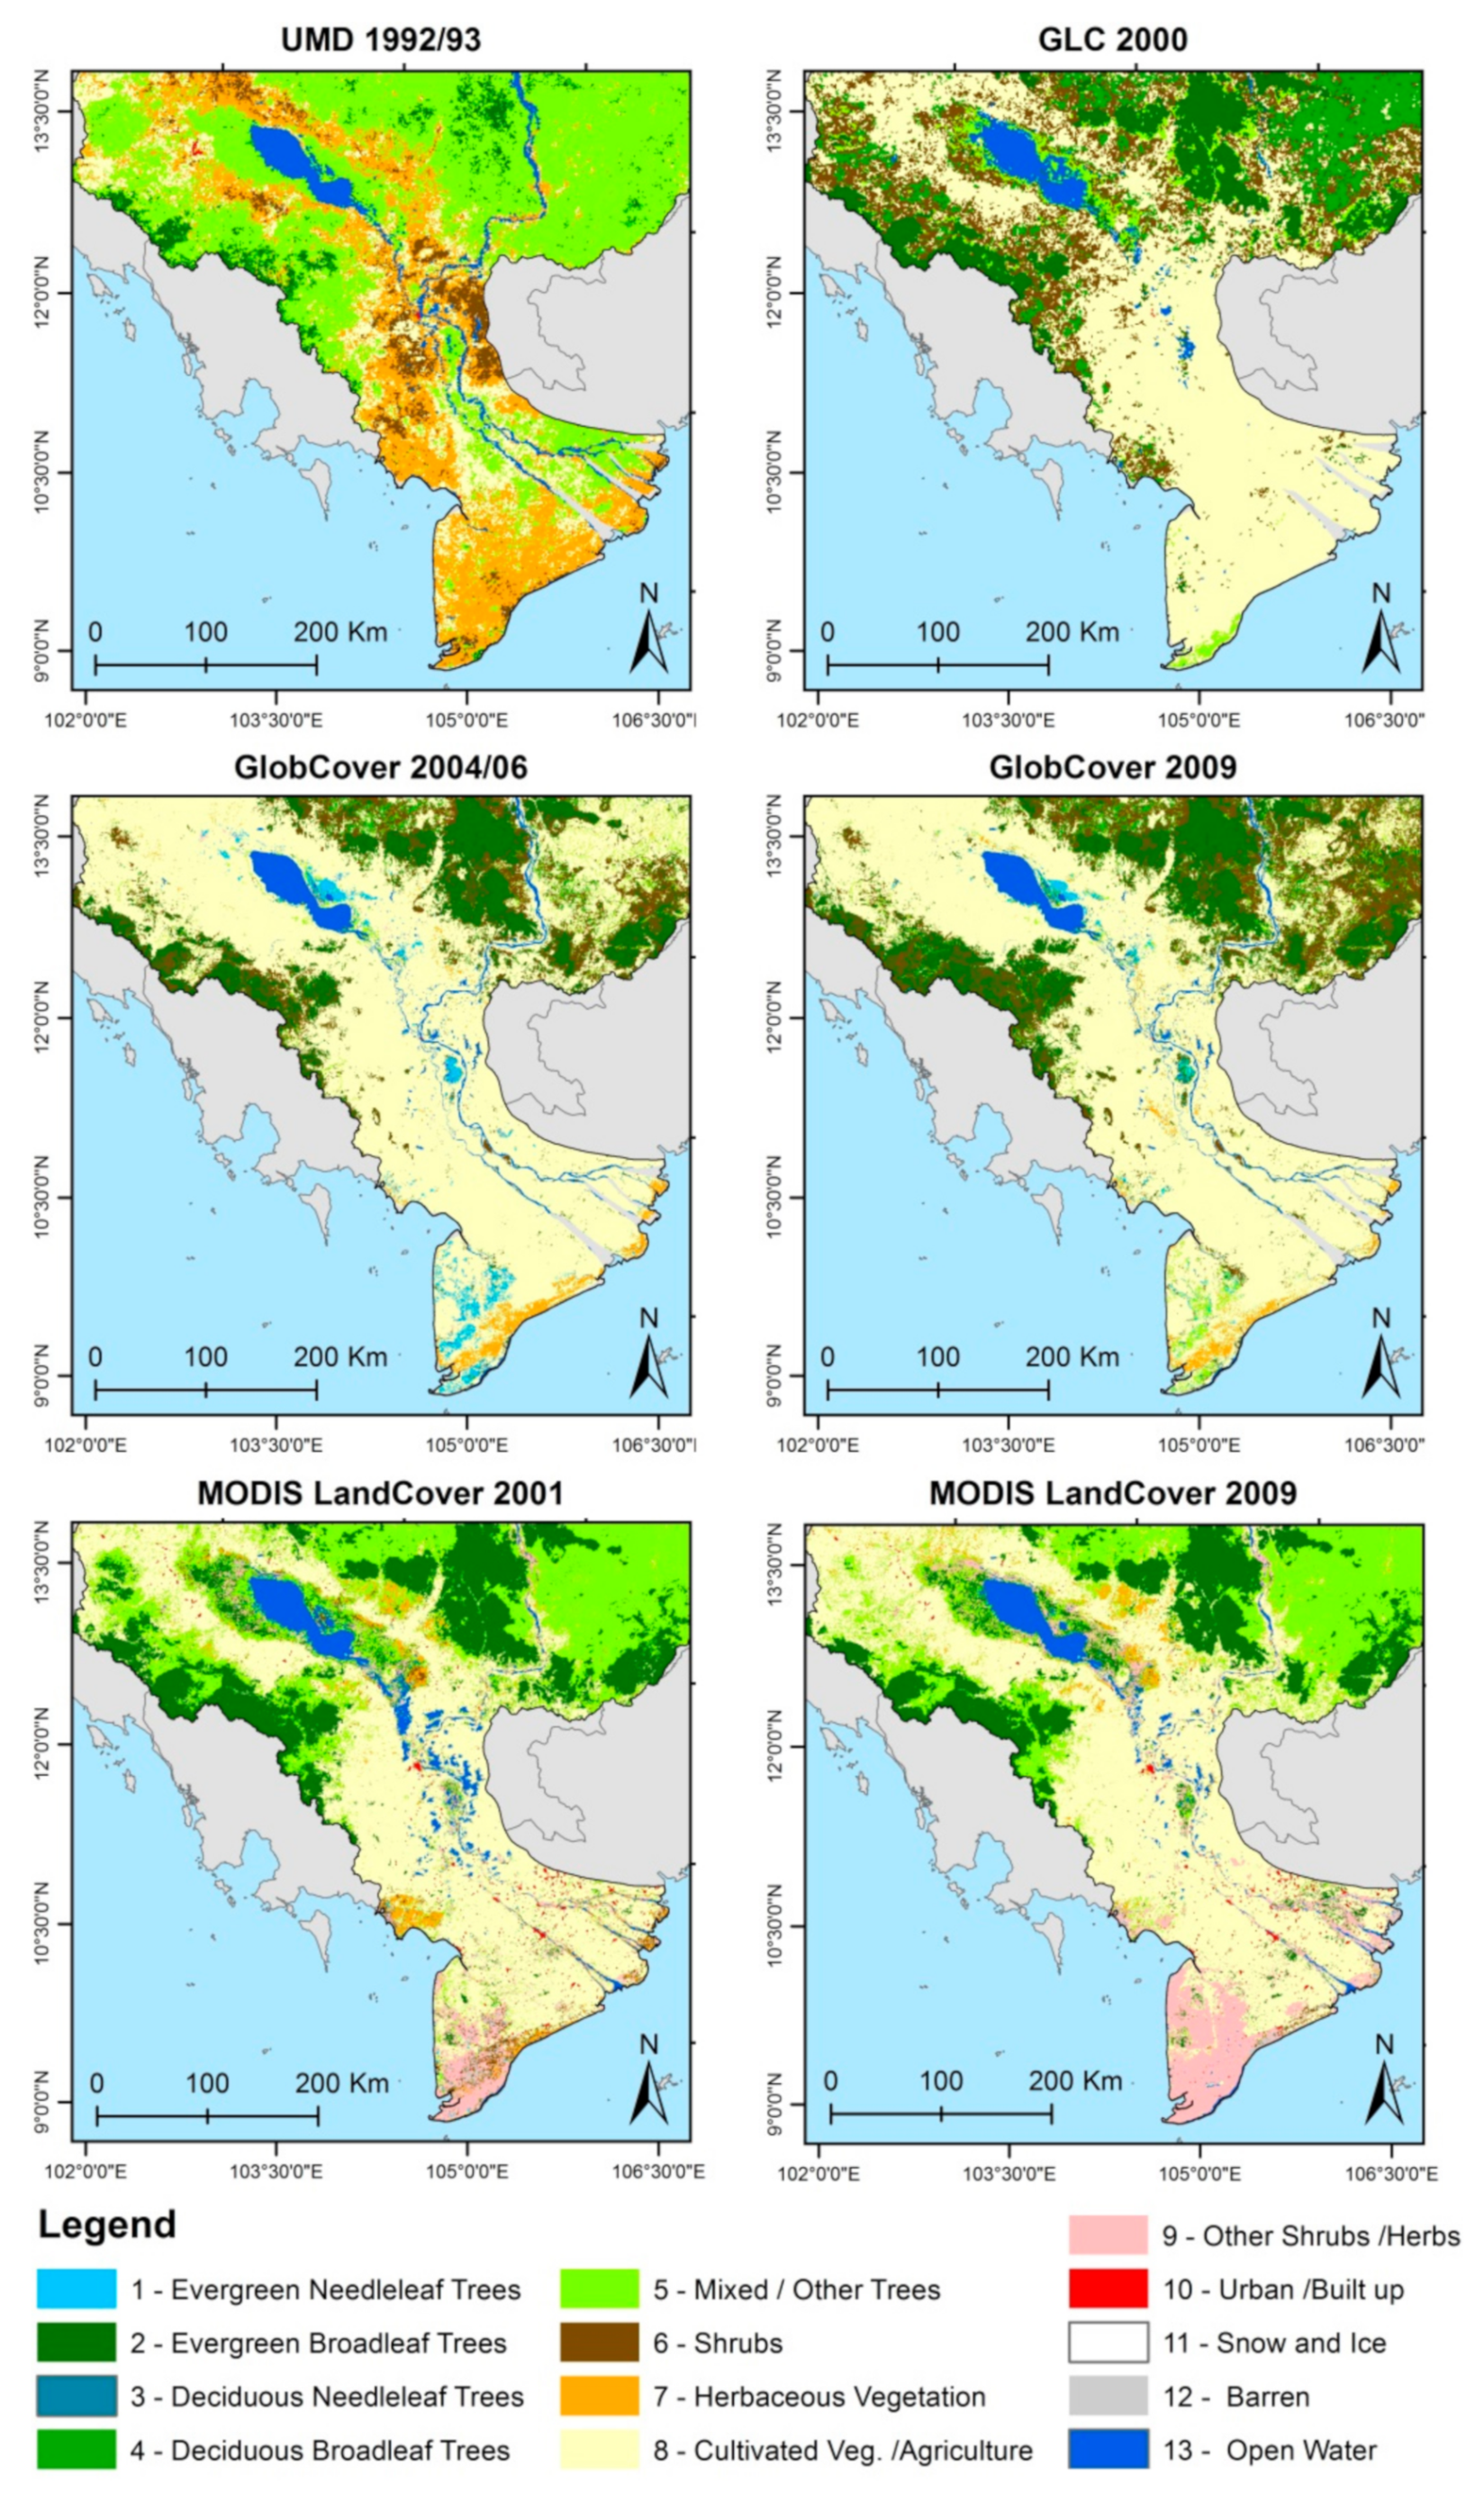
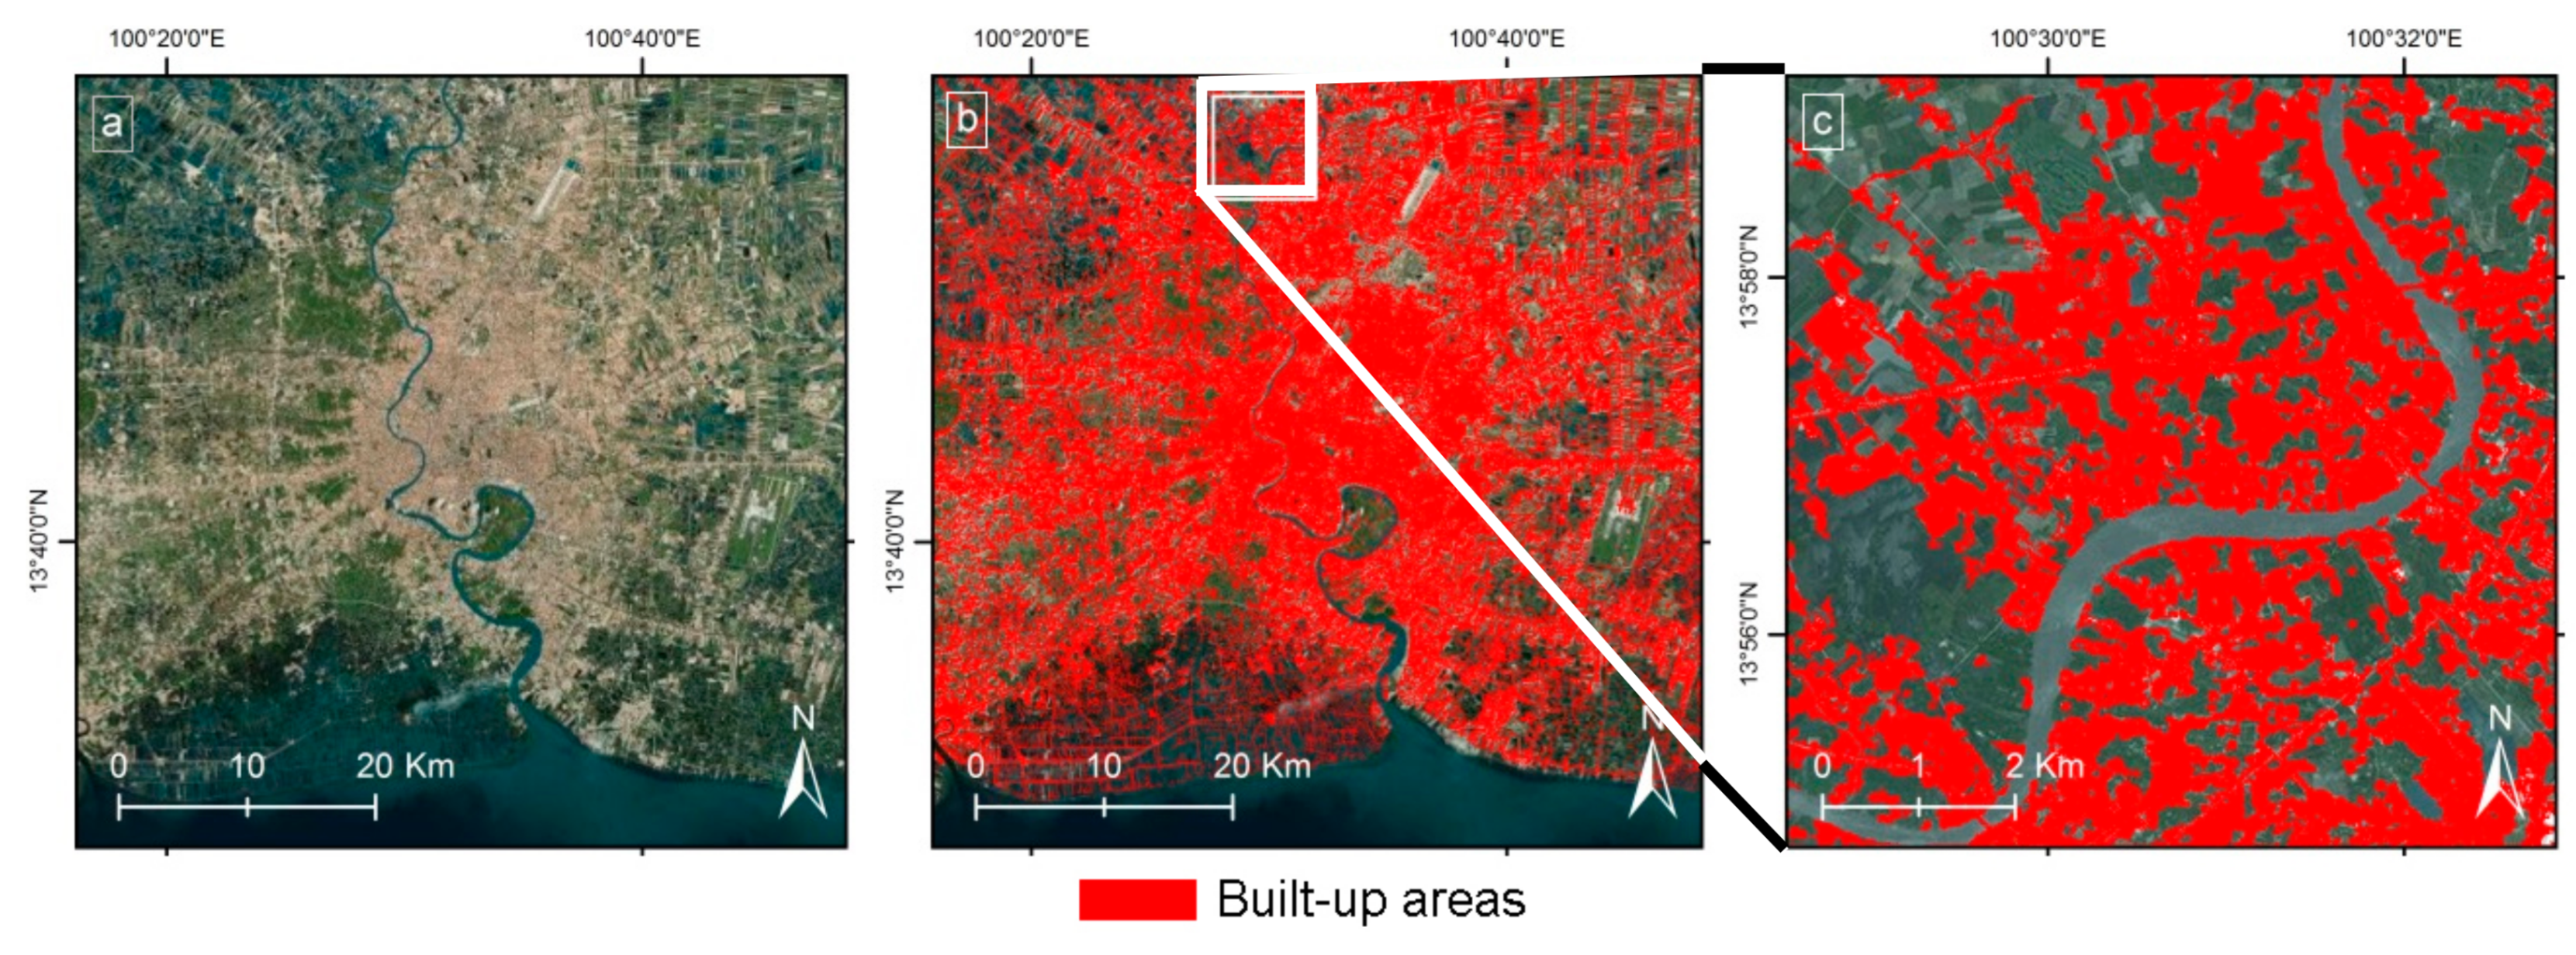
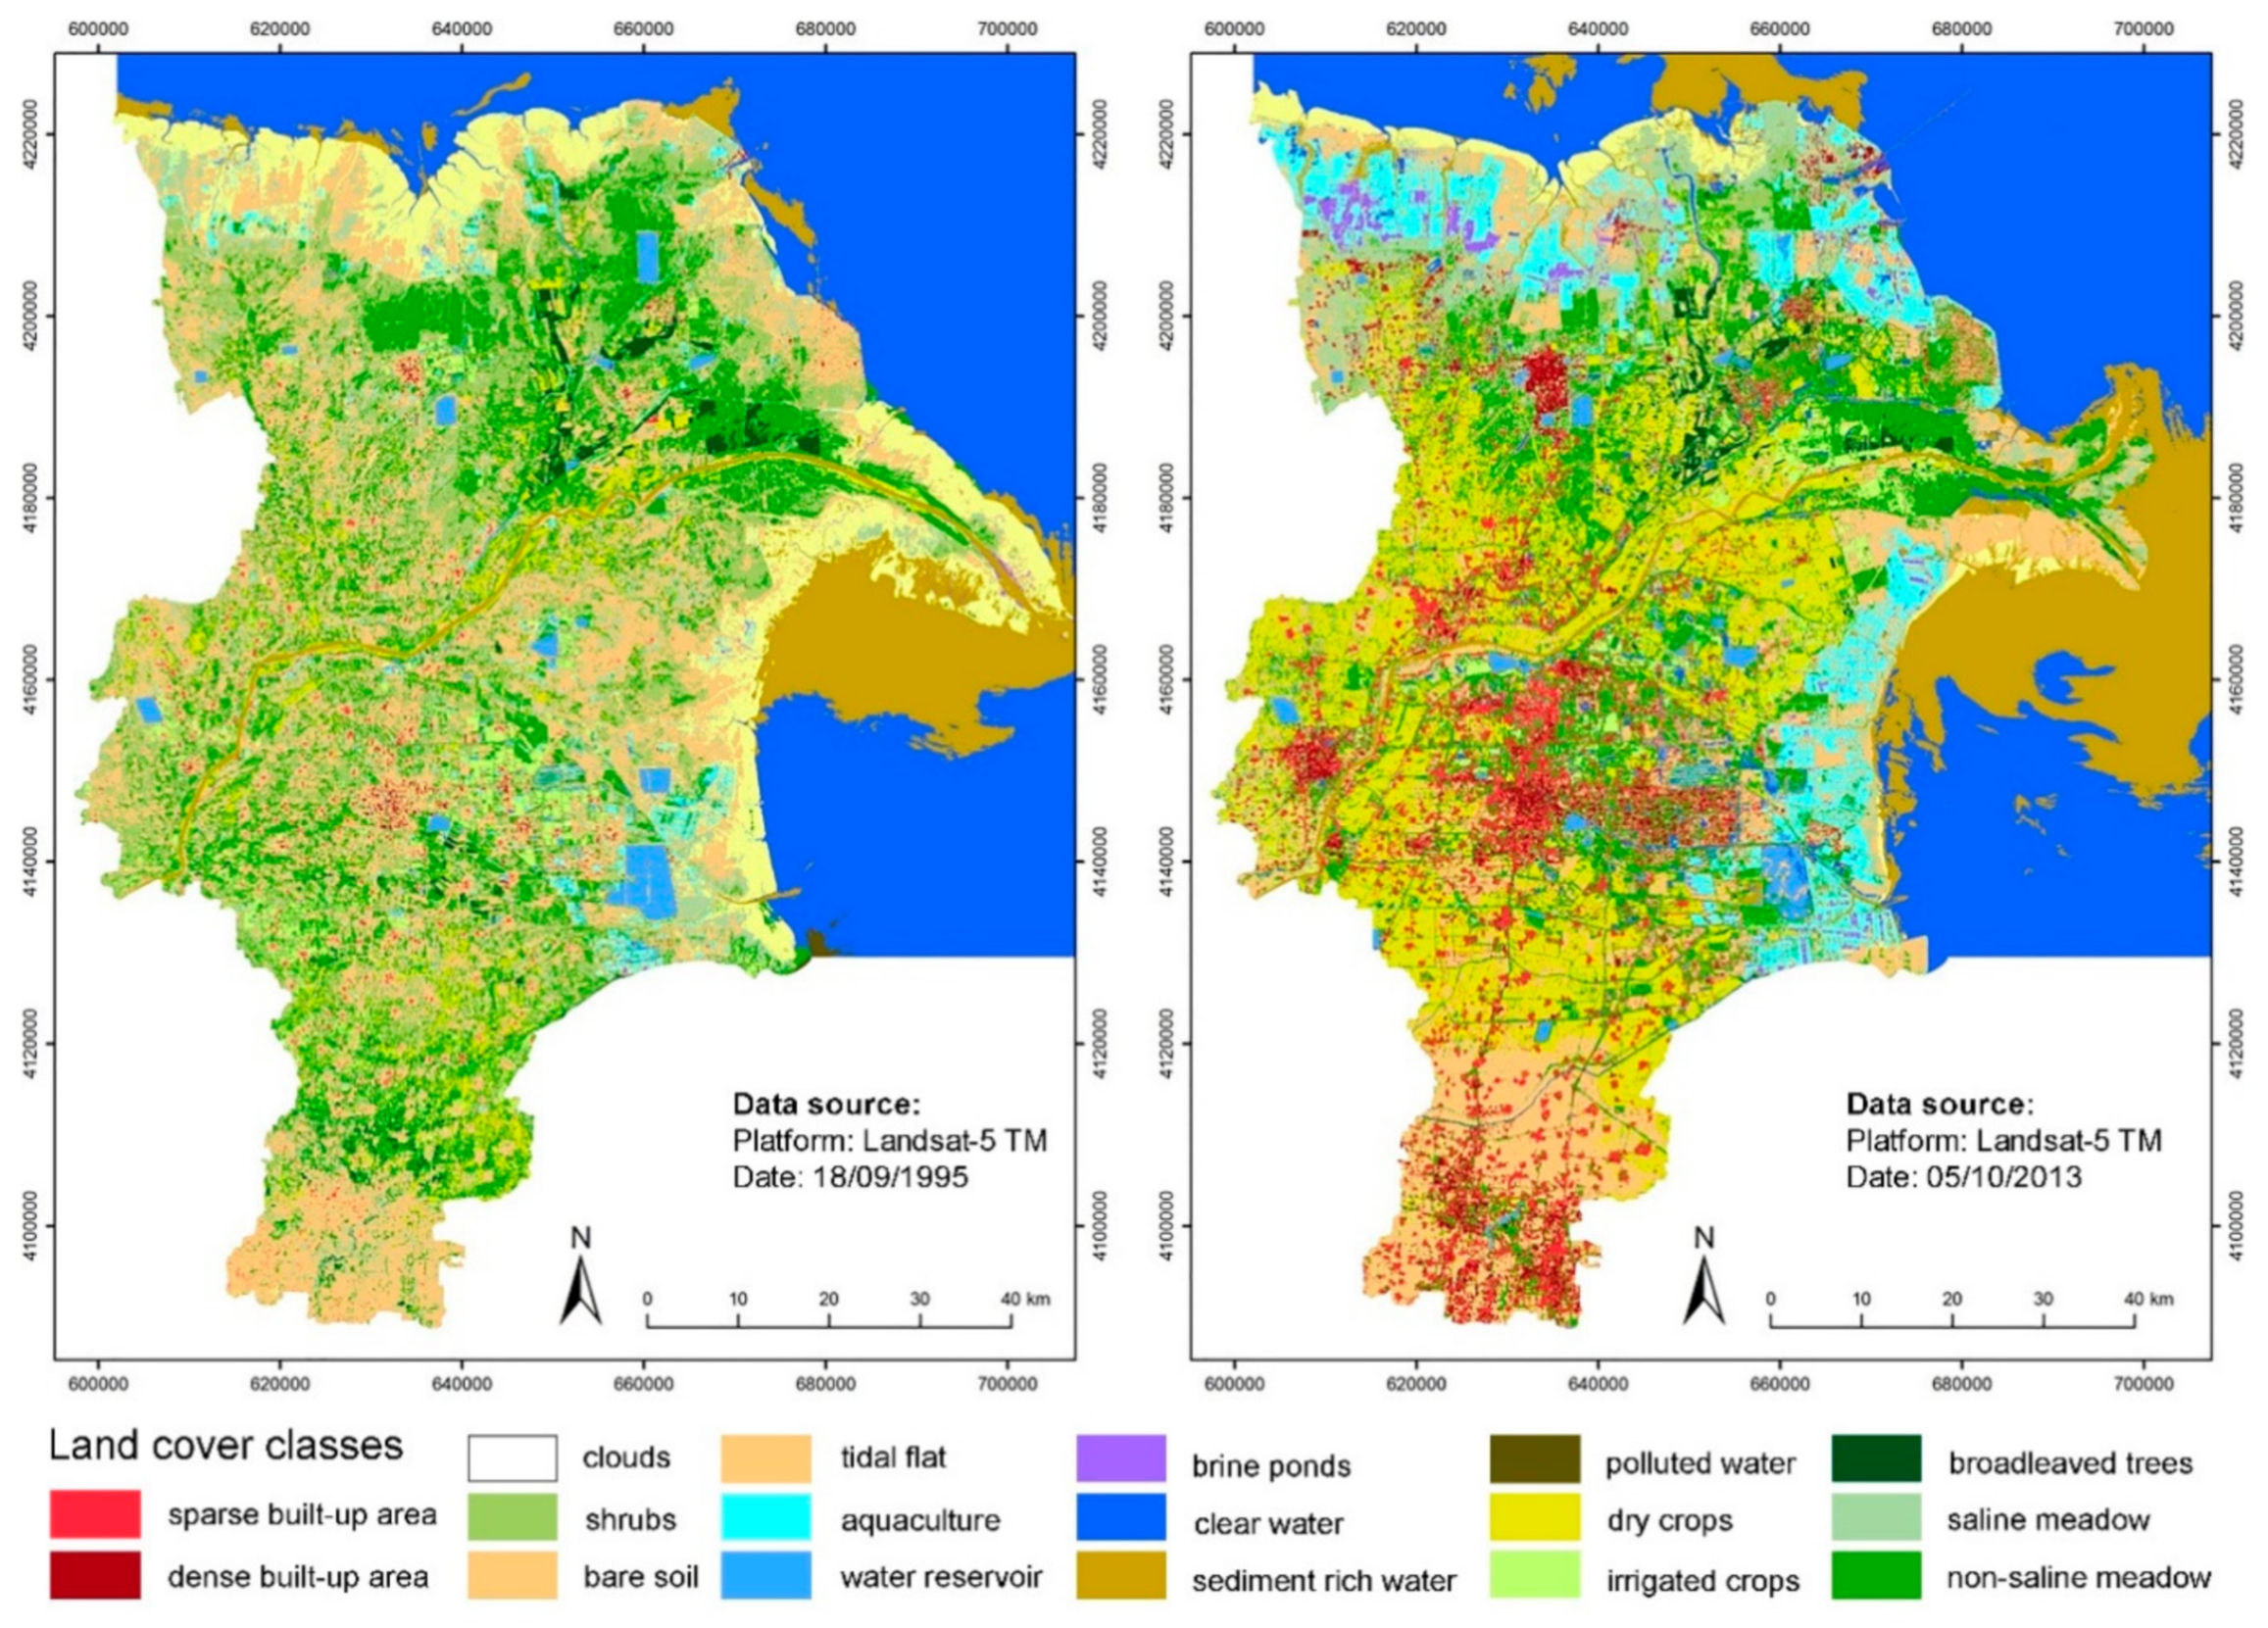
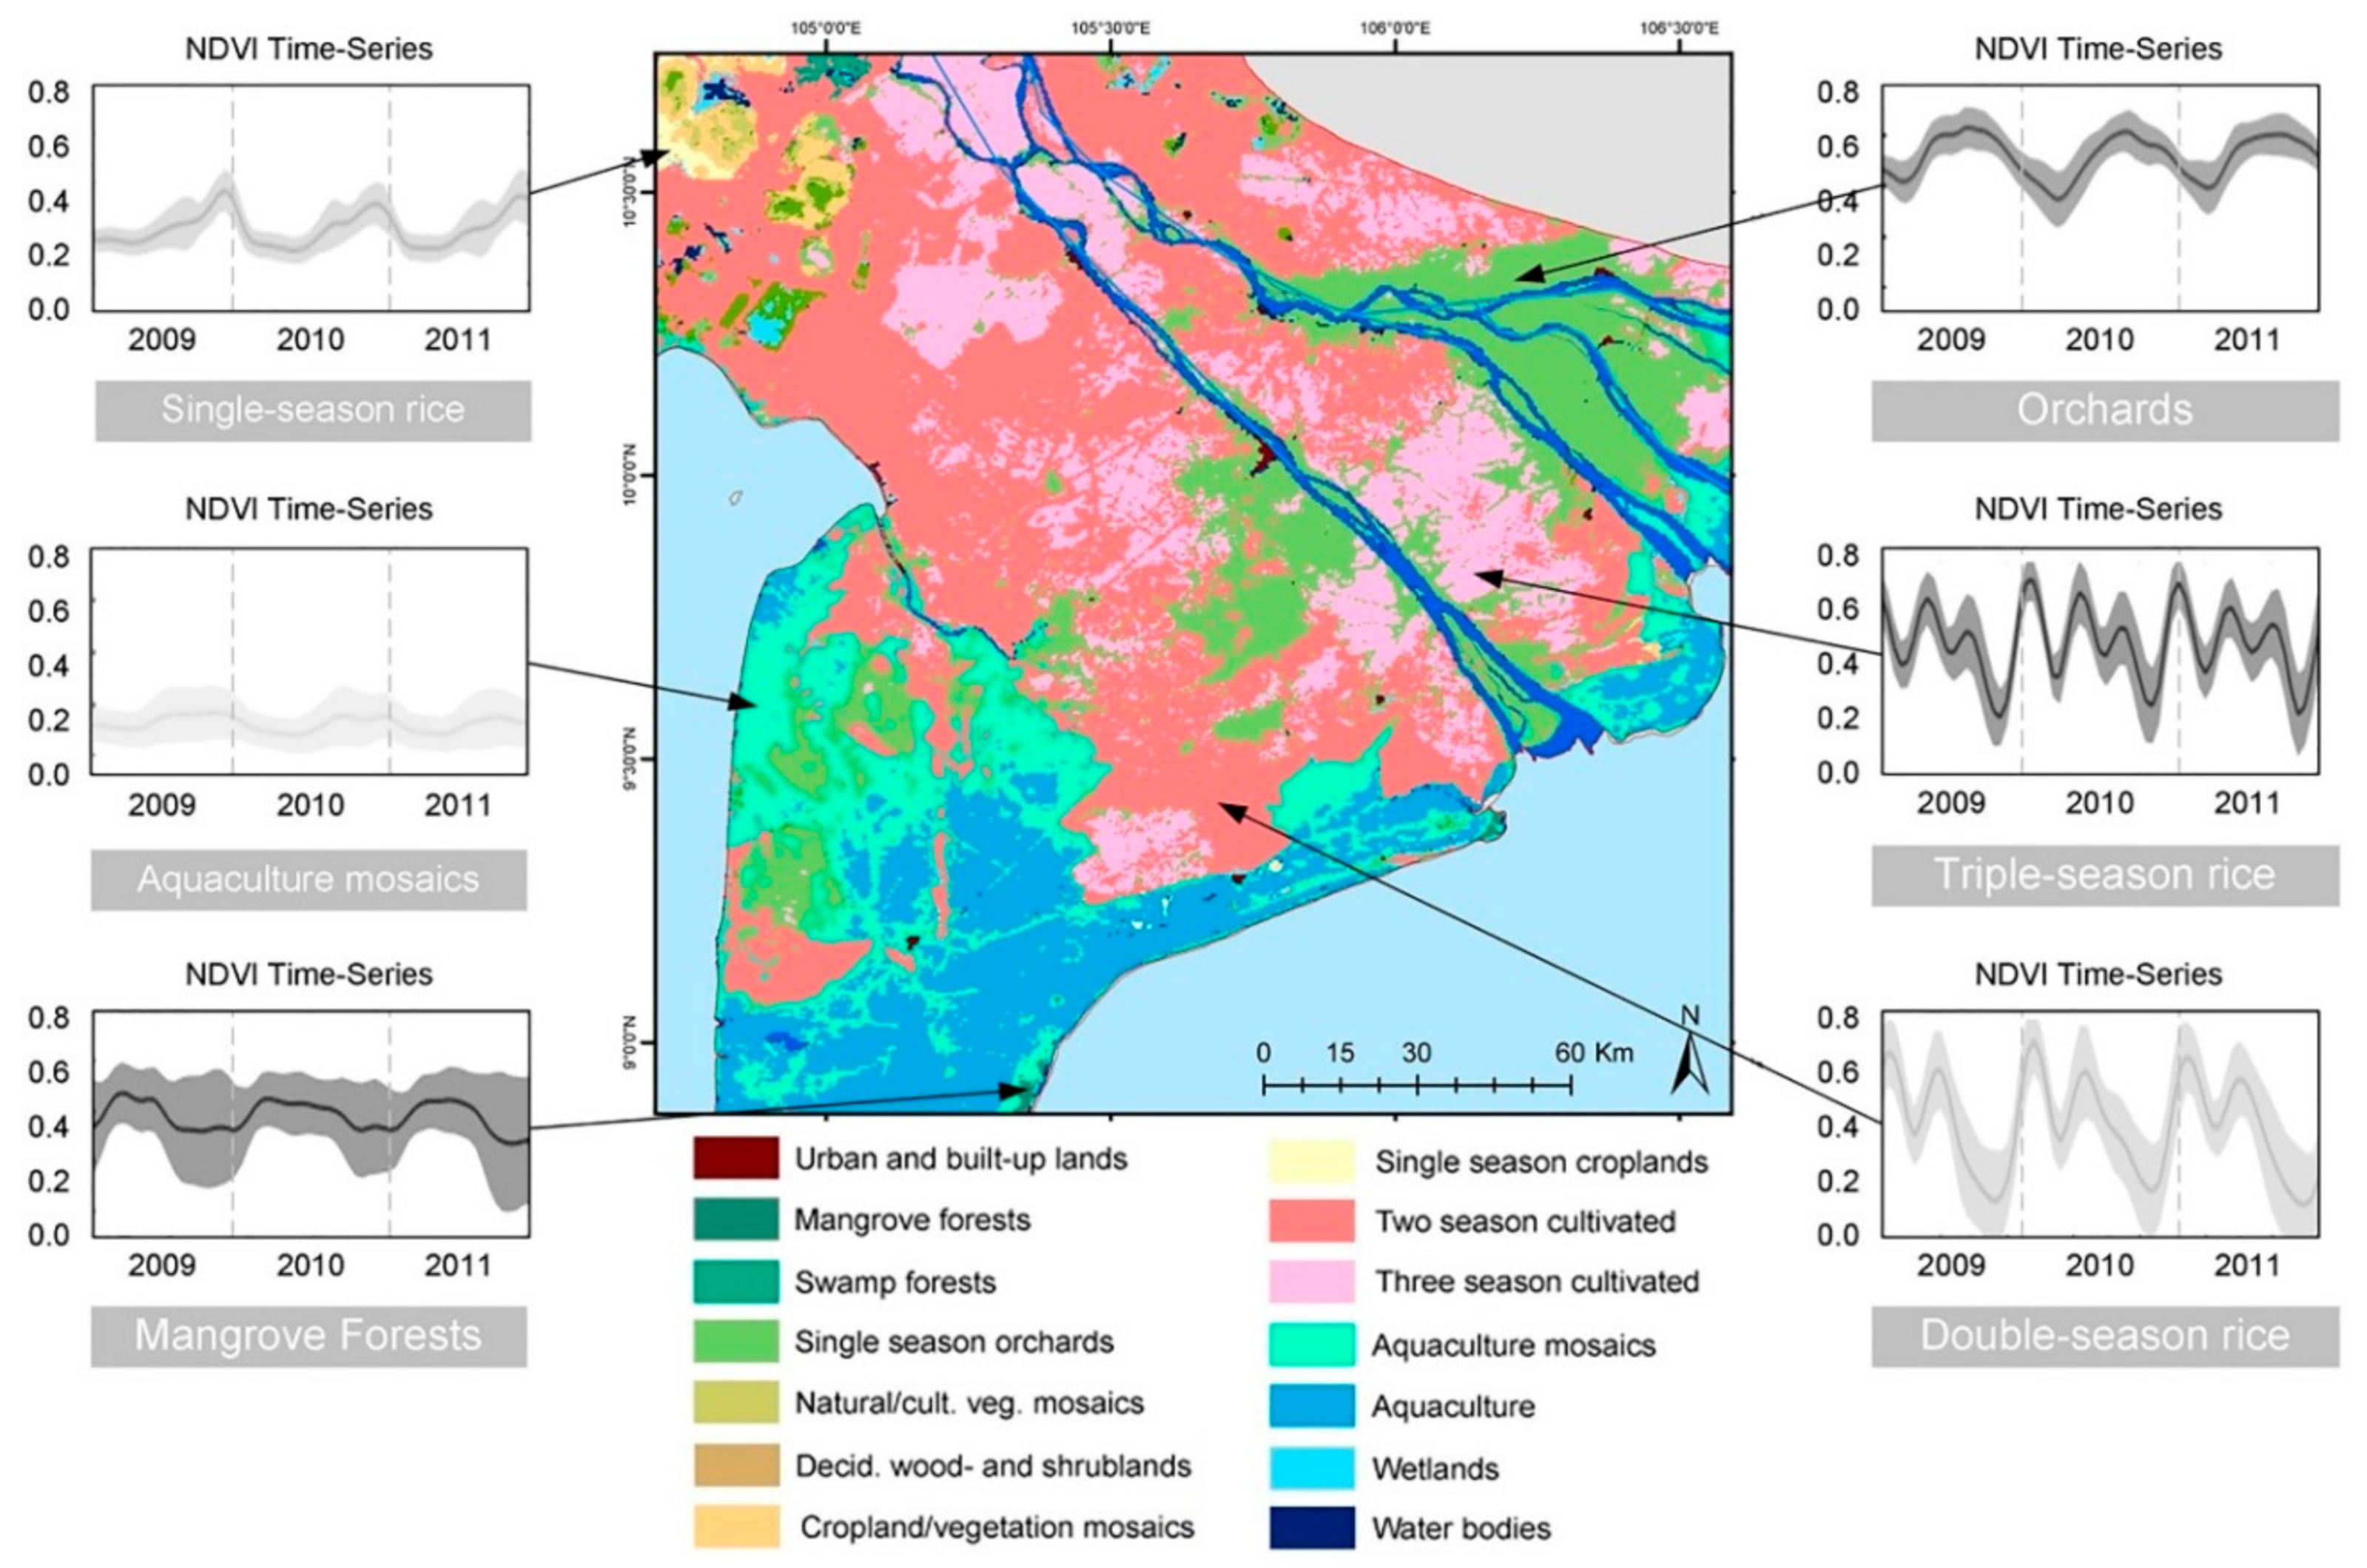
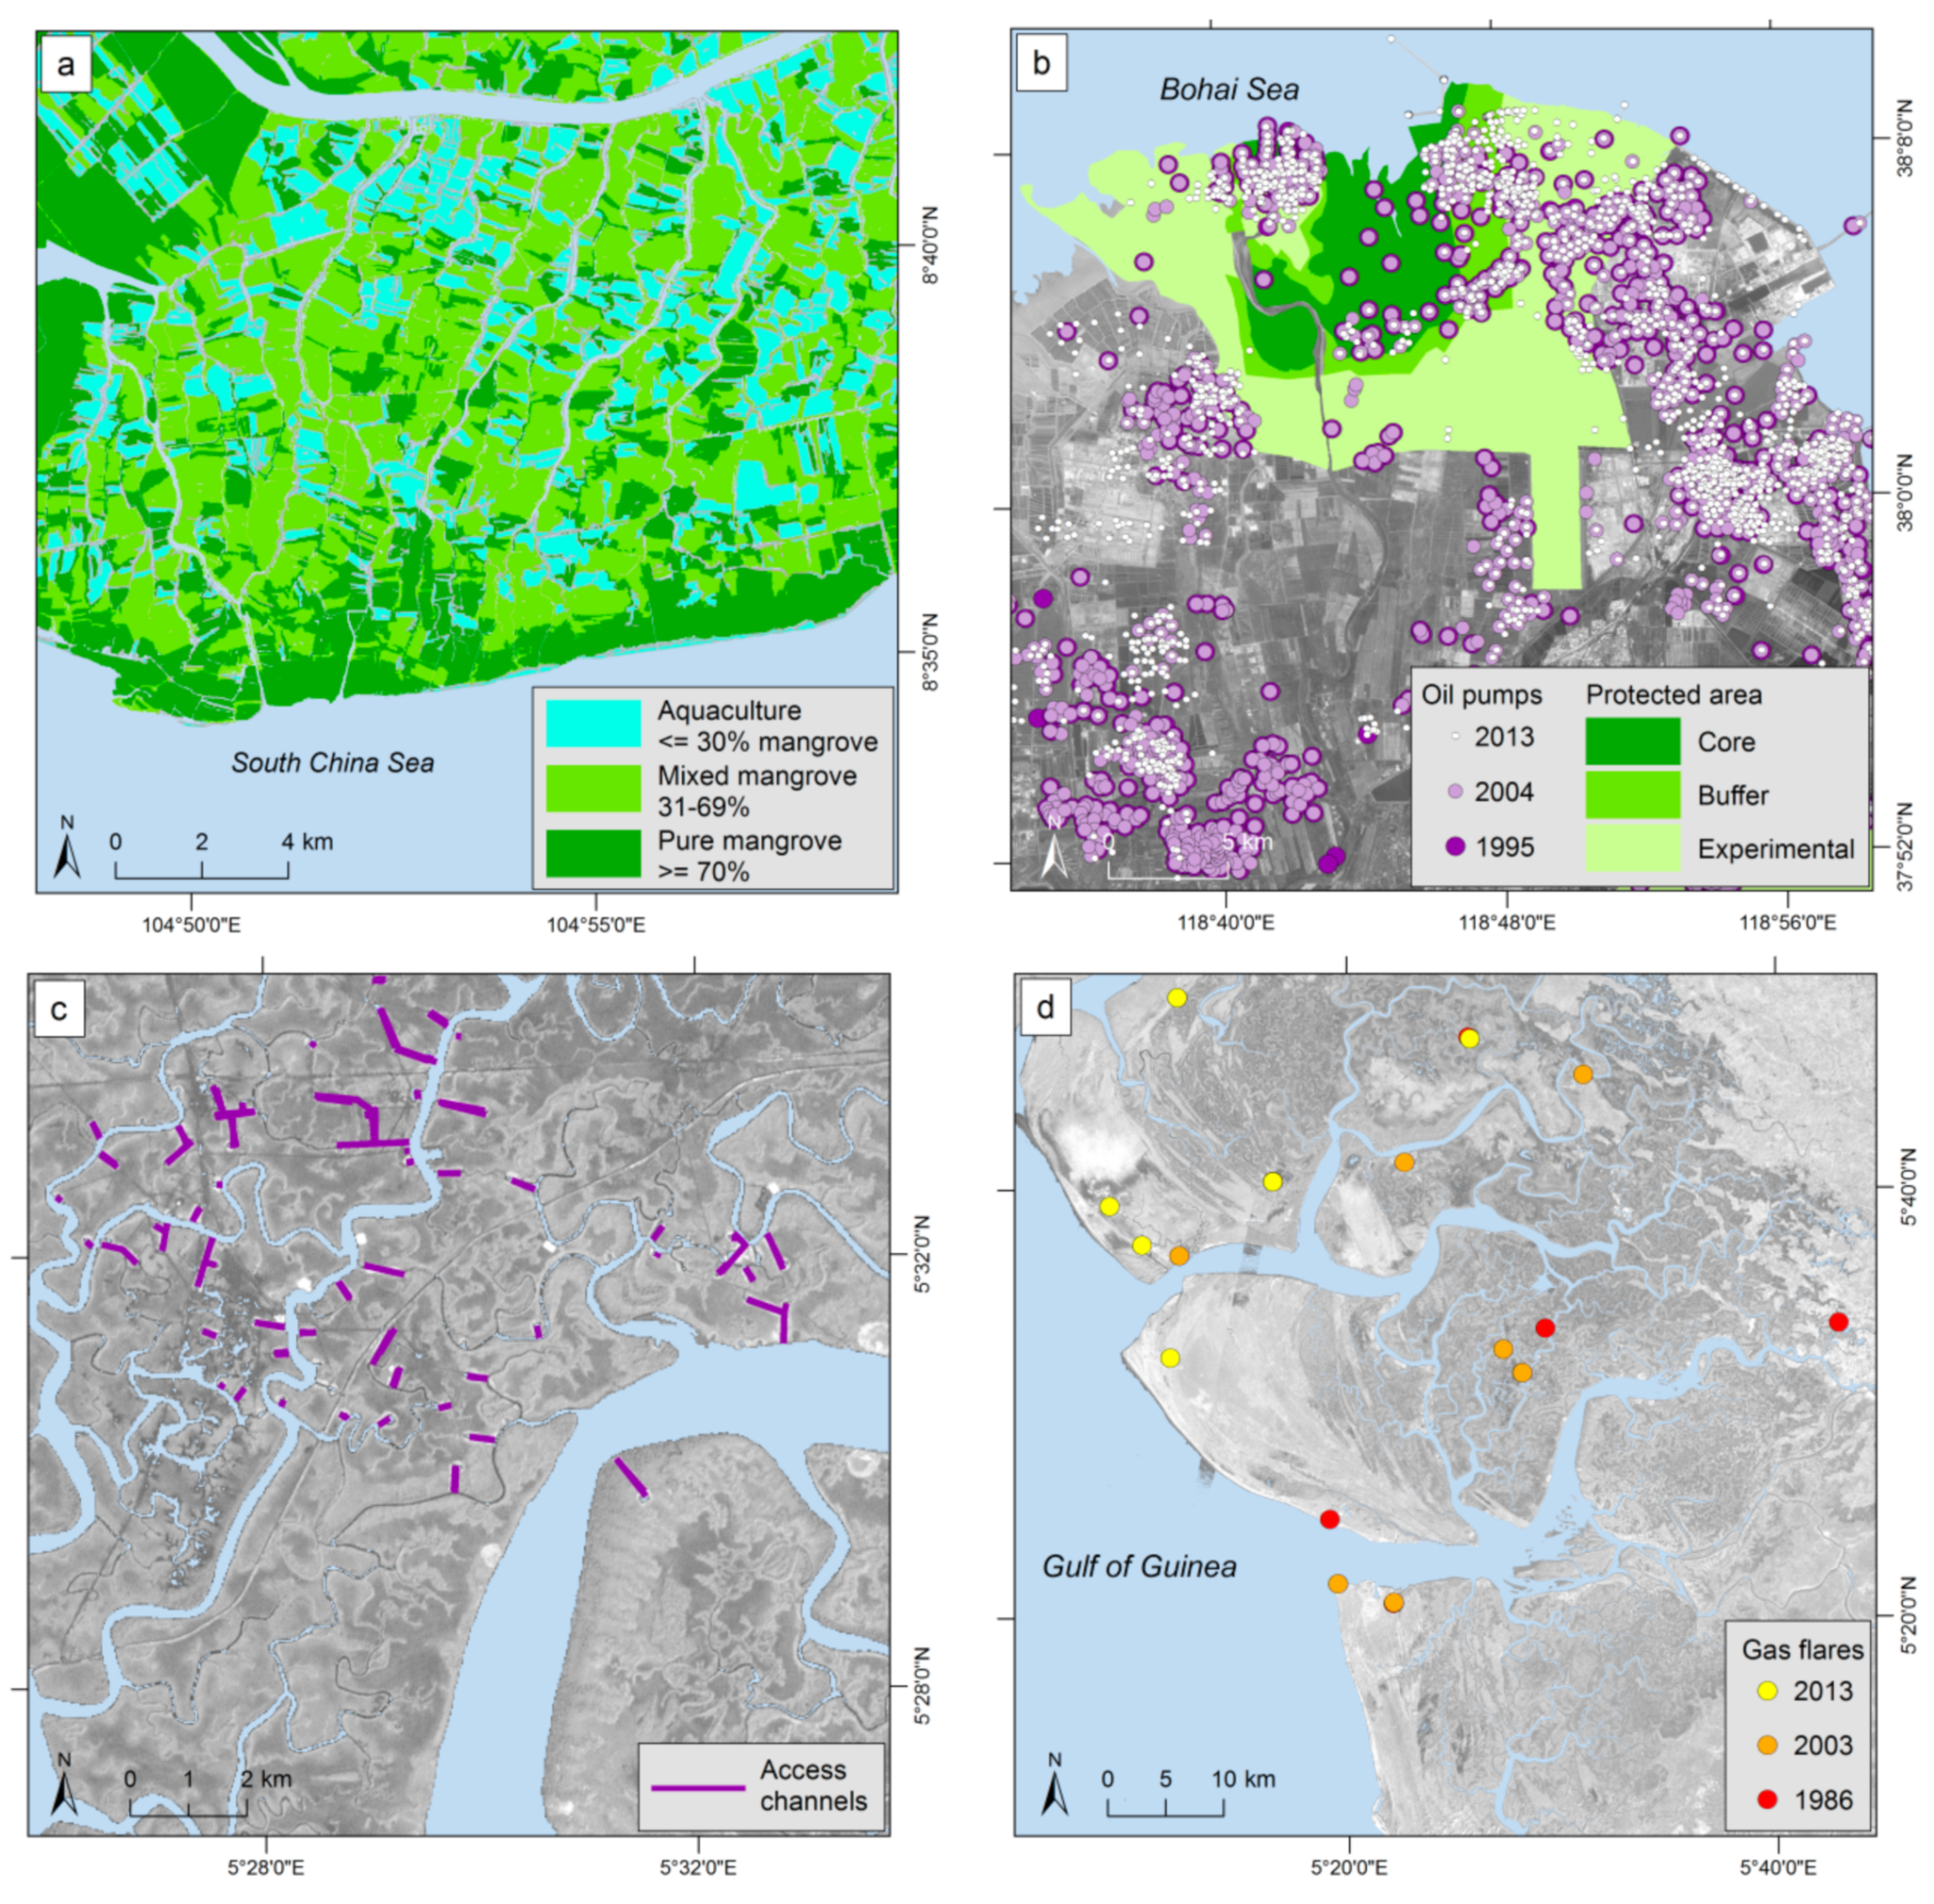
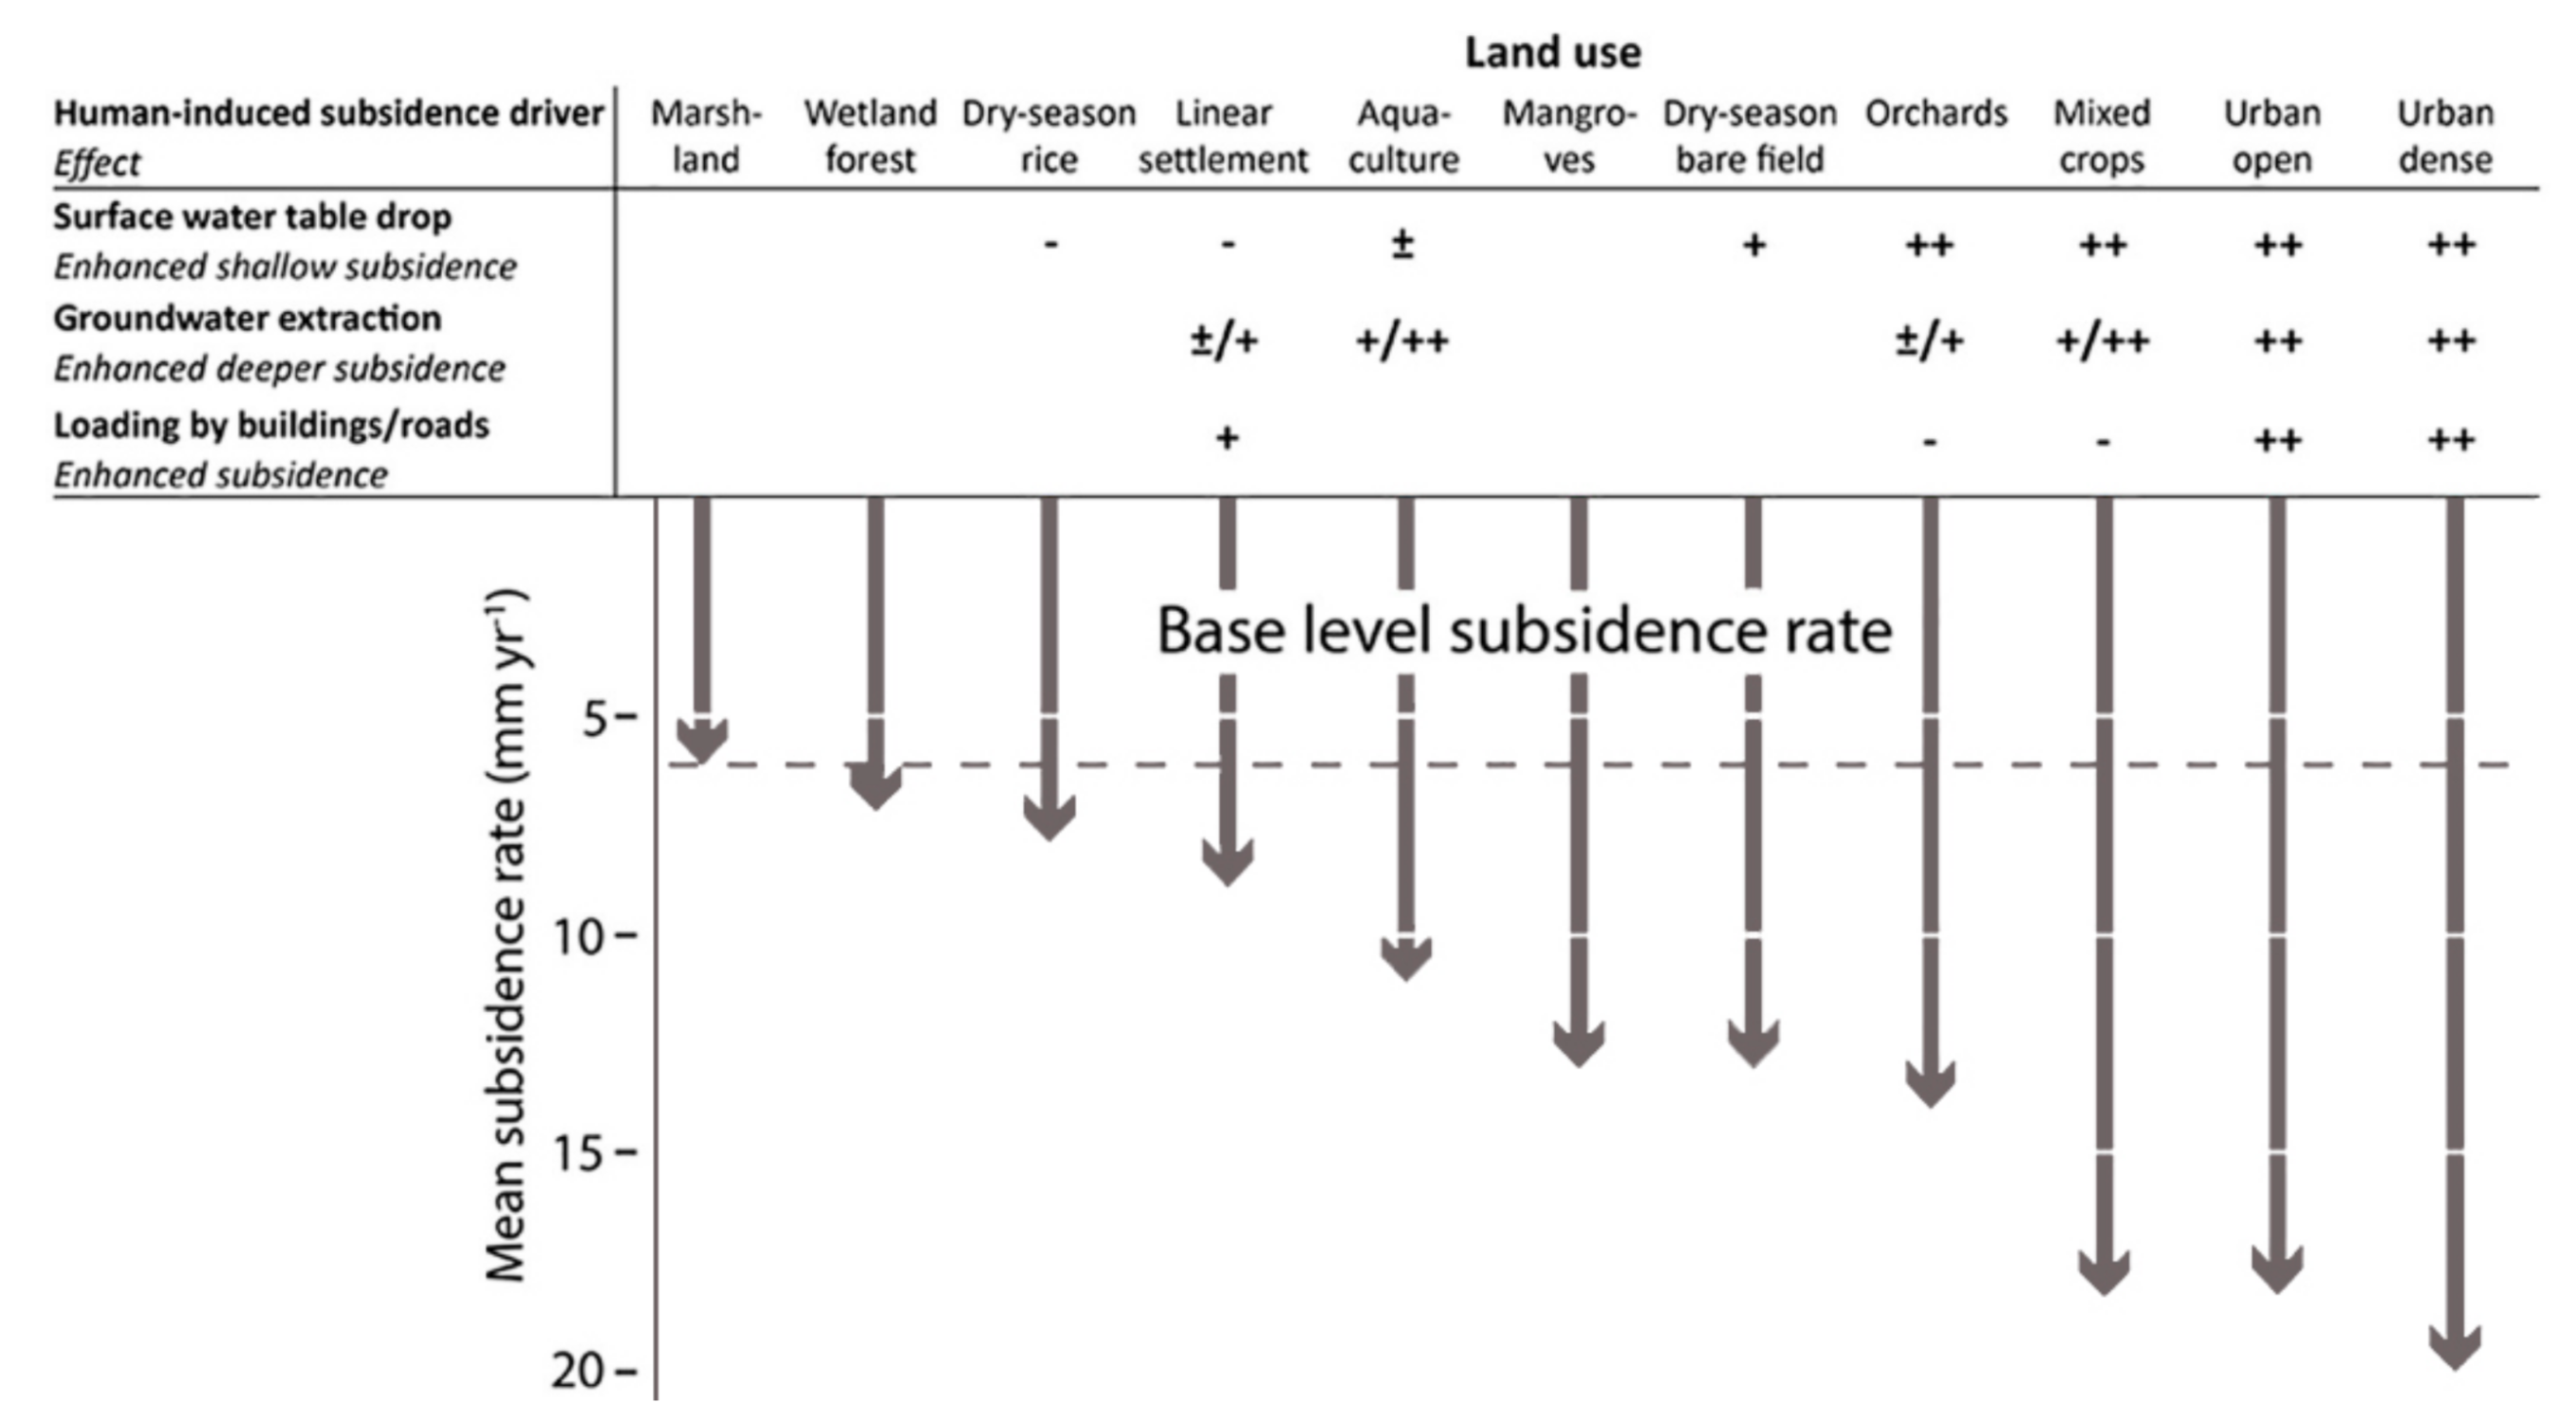
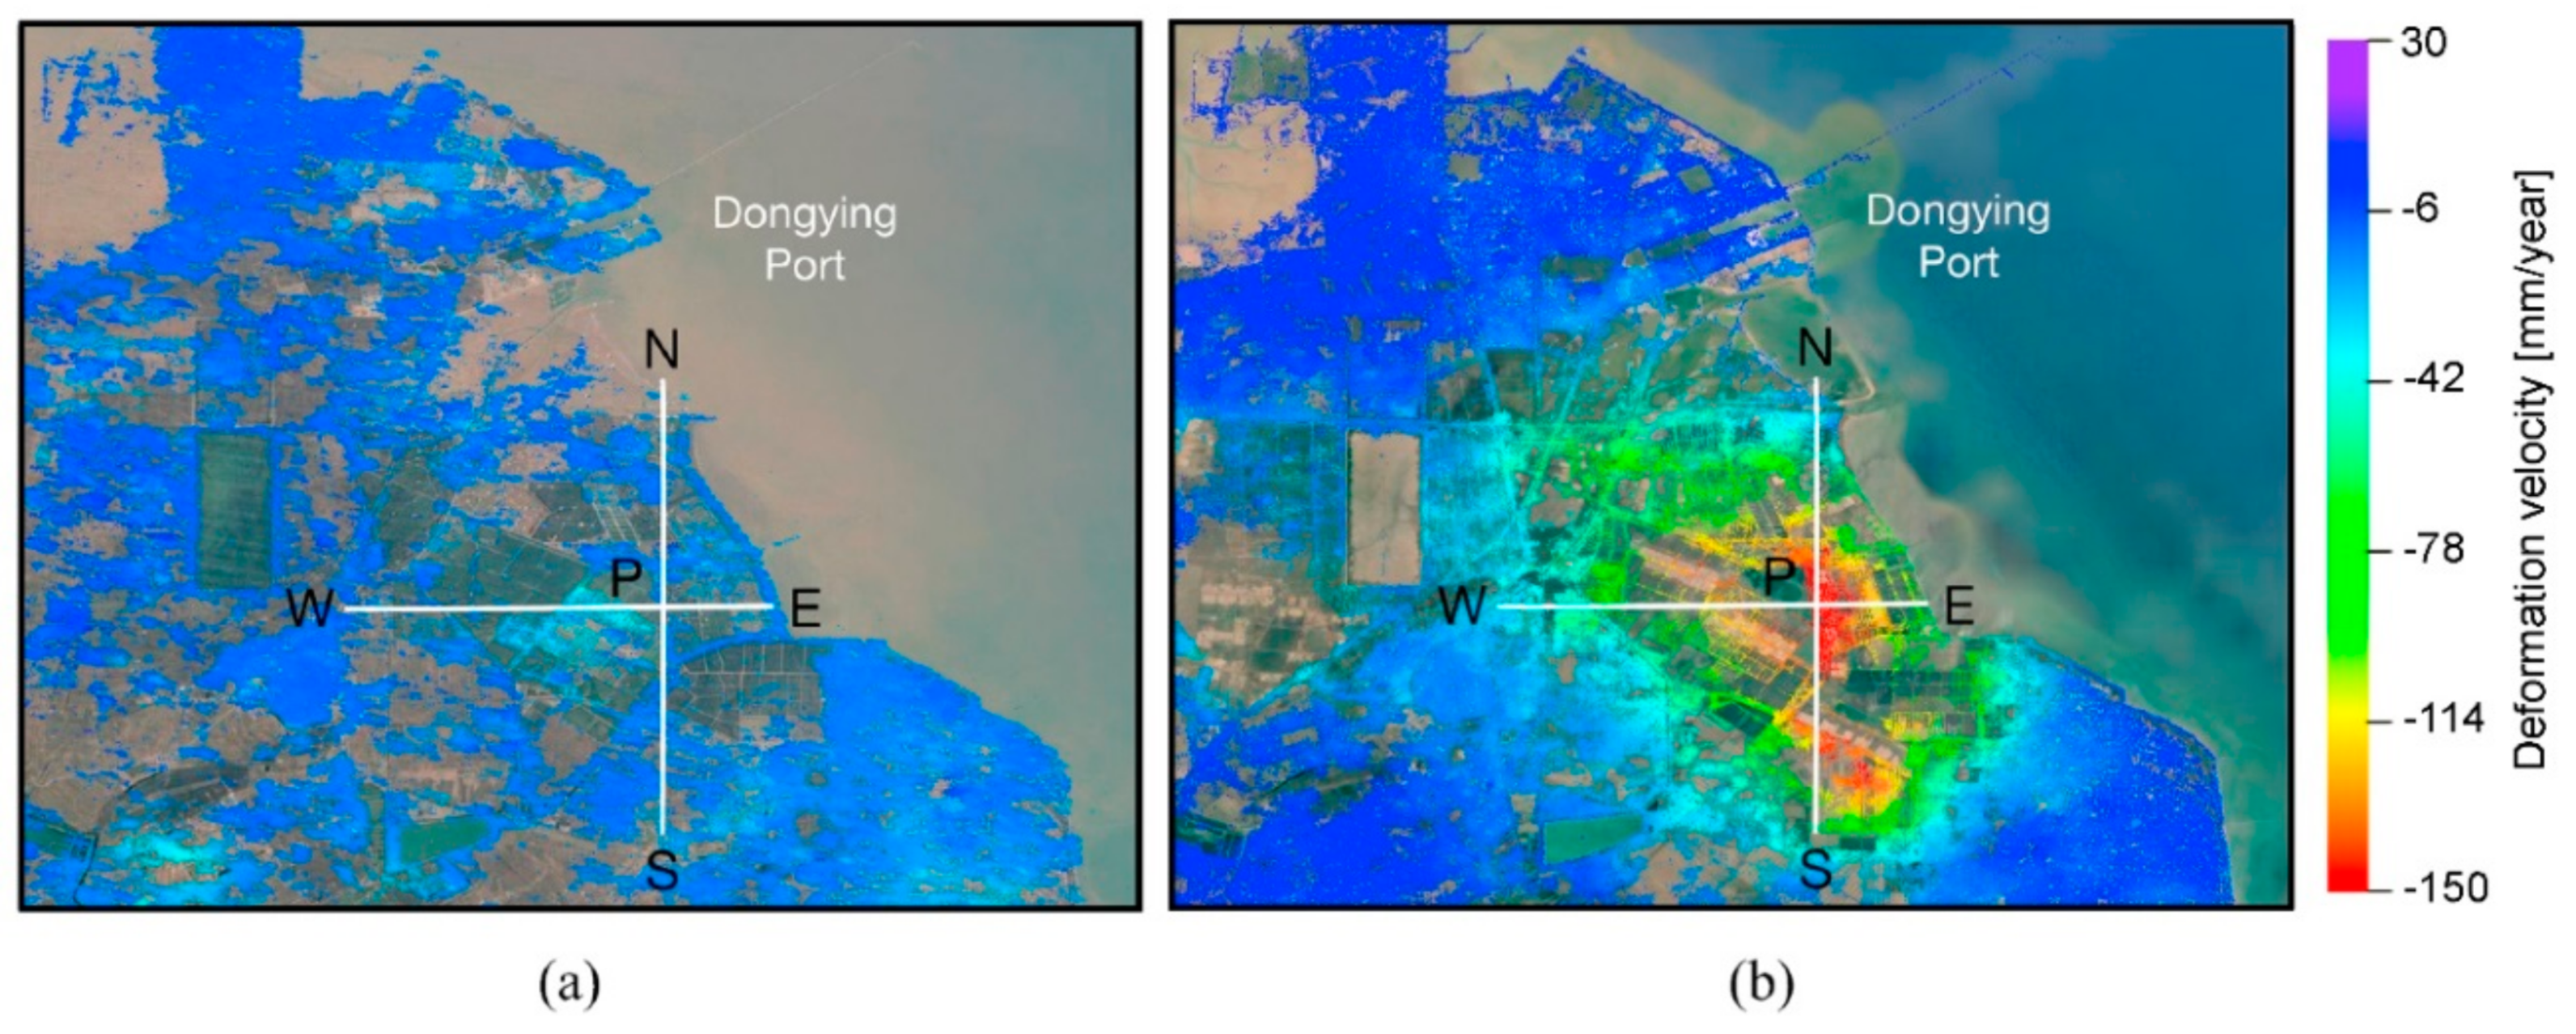
Table 1.
Quantitative comparison of the GLC 2000 and the MODIS 2001 land cover products for the larger Mekong Delta and Tonle Sap Lake area, displayed in km2 and %.
Table 1.
Quantitative comparison of the GLC 2000 and the MODIS 2001 land cover products for the larger Mekong Delta and Tonle Sap Lake area, displayed in km2 and %.
| Class Description | GLC 2000 (km2) | MODIS 2001 (km2) | GLC 2000 (%) | MODIS 2001 (%) |
|---|---|---|---|---|
| Evergreen Needleleaf Trees | 111 | 0.3% | ||
| Evergreen Broadleaf Trees | 181 | 563 | 0.6% | 1.7% |
| Deciduous Needleleaf Trees | 8 | 0.0% | ||
| Deciduous Broadleaf Trees | 247 | 62 | 0.8% | 0.2% |
| Mixed/Other Trees | 635 | 1224 | 2.0% | 3.8% |
| Shrubs | 1070 | 1023 | 3.3% | 3.2% |
| Herbaceous Vegetation | 1242 | 3.8% | ||
| Cultivated Vegetation/Agriculture | 30,181 | 22,356 | 93.1% | 69.1% |
| Other Shrubs/Herbs | 4215 | 13.0% | ||
| Urban/Built up | 614 | 1.9% | ||
| Snow and Ice | ||||
| Barren | 366 | 1.1% | ||
| Open Water | 97 | 587 | 0.3% | 1.8% |
© 2019 by the authors. Licensee MDPI, Basel, Switzerland. This article is an open access article distributed under the terms and conditions of the Creative Commons Attribution (CC BY) license (http://creativecommons.org/licenses/by/4.0/).
Share and Cite
MDPI and ACS Style
Kuenzer, C.; Heimhuber, V.; Huth, J.; Dech, S. Remote Sensing for the Quantification of Land Surface Dynamics in Large River Delta Regions—A Review. Remote Sens. 2019, 11, 1985. https://doi.org/10.3390/rs11171985
AMA Style
Kuenzer C, Heimhuber V, Huth J, Dech S. Remote Sensing for the Quantification of Land Surface Dynamics in Large River Delta Regions—A Review. Remote Sensing. 2019; 11(17):1985. https://doi.org/10.3390/rs11171985
Chicago/Turabian StyleKuenzer, Claudia, Valentin Heimhuber, Juliane Huth, and Stefan Dech. 2019. "Remote Sensing for the Quantification of Land Surface Dynamics in Large River Delta Regions—A Review" Remote Sensing 11, no. 17: 1985. https://doi.org/10.3390/rs11171985
Note that from the first issue of 2016, this journal uses article numbers instead of page numbers. See further details here.