JupyTEP IDE as an Online Tool for Earth Observation Data Processing


1
Institute of Geodesy, Faculty of Geodesy, Geospatial and Civil Engineering, University of Warmia and Mazury in Olsztyn, Oczapowskiego 1, 10-719 Olsztyn, Poland
2
WASAT Sp. z o.o., 80-172 Gdańsk, Trzy Lipy 3, Poland
*
Author to whom correspondence should be addressed.
Remote Sens. 2019, 11(17), 1973; https://doi.org/10.3390/rs11171973
Submission received: 18 June 2019
/
Revised: 15 August 2019
/
Accepted: 16 August 2019
/
Published: 21 August 2019
Abstract
:The paper describes a new tool called JupyTEP integrated development environment (IDE), which is an online integrated development environment for earth observation data processing available in the cloud. This work is a result of the project entitled “JupyTEP IDE—Jupyter-based IDE as an interactive and collaborative environment for the development of notebook style EO algorithms on network of exploitation platforms infrastructure” carried out in cooperation with European Space Agency. The main goal of this project was to provide a universal earth observation data processing tool to the community. JupyTEP IDE is an extension of Jupyter software ecosystem with customization of existing components for the needs of earth observation scientists and other professional and non-professional users. The approach is based on configuration, customization, adaptation, and extension of Jupyter, Jupyter Hub, and Docker components on earth observation data cloud infrastructure in the most flexible way; integration with accessible libraries and earth observation data tools (sentinel application platform (SNAP), geospatial data abstraction library (GDAL), etc.); adaptation of existing web processing service (WPS)-oriented earth observation services. The user-oriented product is based on a web-related user interface in the form of extended and modified Jupyter user interface (frontend) with customized layout, earth observation data processing extension, and a set of predefined notebooks, widgets, and tools. The final IDE is addressed to the remote sensing experts and other users who intend to develop Jupyter notebooks with the reuse of embedded tools, common WPS interfaces, and existing notebooks. The paper describes the background of the system, its architecture, and possible use cases.
1. Introduction
Earth observation (EO) data processing is a complex process that requires specialized tools. In each field, there is software that performs various functions that are important from the user’s point of view. The functionality of most known programs is implemented permanently, and the user is unable to change the algorithms they contain. In most cases, this is sufficient and even desirable. However, there is a group of users who want to expand the capabilities of their software by developing new processing algorithms according to their own concepts for some of the unusual tasks they encounter. These are advanced users, such as engineers or scientists, often with programming skills. The choice of software for this group is much narrower. There are various types of general-purpose development environments or a few cloud platforms such as the Google Earth Engine. However, advanced users, including academics, often look for free open-source software, with the aim of building their own solution from the available components. This provides the basis for the question that constitutes the main purpose of this article: Is it possible to create such software based only on open-source components? If so, what would this software be like?
This article concerns a system called JupyTEP integrated development environment (IDE), created on the basis of available open-source components. It operates in the cloud, being an integrated development environment (IDE) focused on the processing of EO data.
1.1. Motivation
EO satellites play a significant role in many aspects of modern life. EO data are used in climate change [1], emergency response and crisis applications [2,3], food security, water use, greenhouse gas emission, disease transmission [4], estimates of crop yield [5], settlement and population mapping [6], and forest cover change [7], to name only those that are the most prominent. The volume of EO data that is stored by different agencies and private companies is growing rapidly.
With increasingly richer spatial data resources at their disposal, researchers from around the world need newer tools that provide the opportunity to integrate data from different sources and use them together. The optimal solution seems to be software based upon the architecture of distributed systems and cloud-based systems. The data in question contain a lot of information. The way they are processed and the result that can be achieved often depends on the researcher’s knowledge, skills, and inventiveness. Therefore, the tools should be structured in such a way that they do not limit the user to using only built-in functions and provide the possibility to construct their own analytical algorithms. Users should receive a tool that, despite being online, functions similarly to a desktop application. Therefore, a tool of this kind should be equipped with additional components that allow the user to perform typical operations on files and directories such as creating, copying, or editing. It should be possible to independently configure the environment, not only of the program itself, but also of the platform on which it is installed. This can be obtained by providing the user with the system console.
The main objective of building the Jupyter notebook IDE for EO data processing was for the extension of the Jupyter software ecosystem [8] and customization of the existing components for the needs of EO scientists and other professional and non-professional users strongly related to the EO data community. The general approach was based on the configuration, customization, adaptation, and mostly the extension of Jupyter, Docker, EO data cloud infrastructure, and on integration with accessible libraries’ EO data tools (application programming interface (API) to European Space Agency (ESA) sentinel application platform (SNAP) [9], Orfeo toolbox (OTB) [10], geospatial data abstraction library (GDAL) [11], etc.).
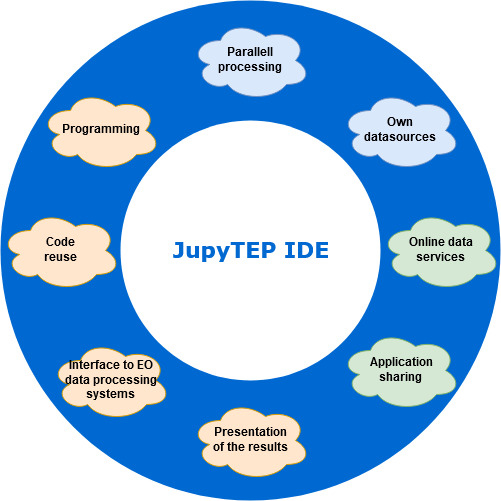
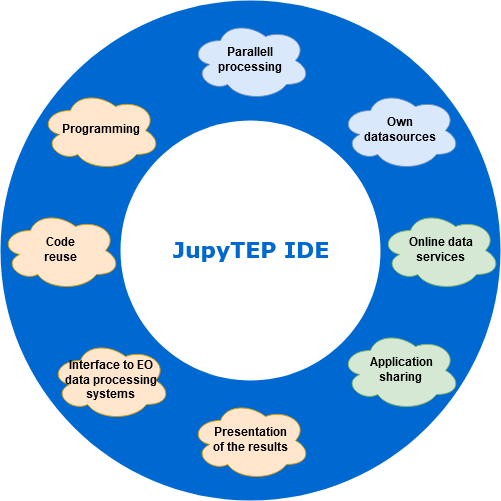
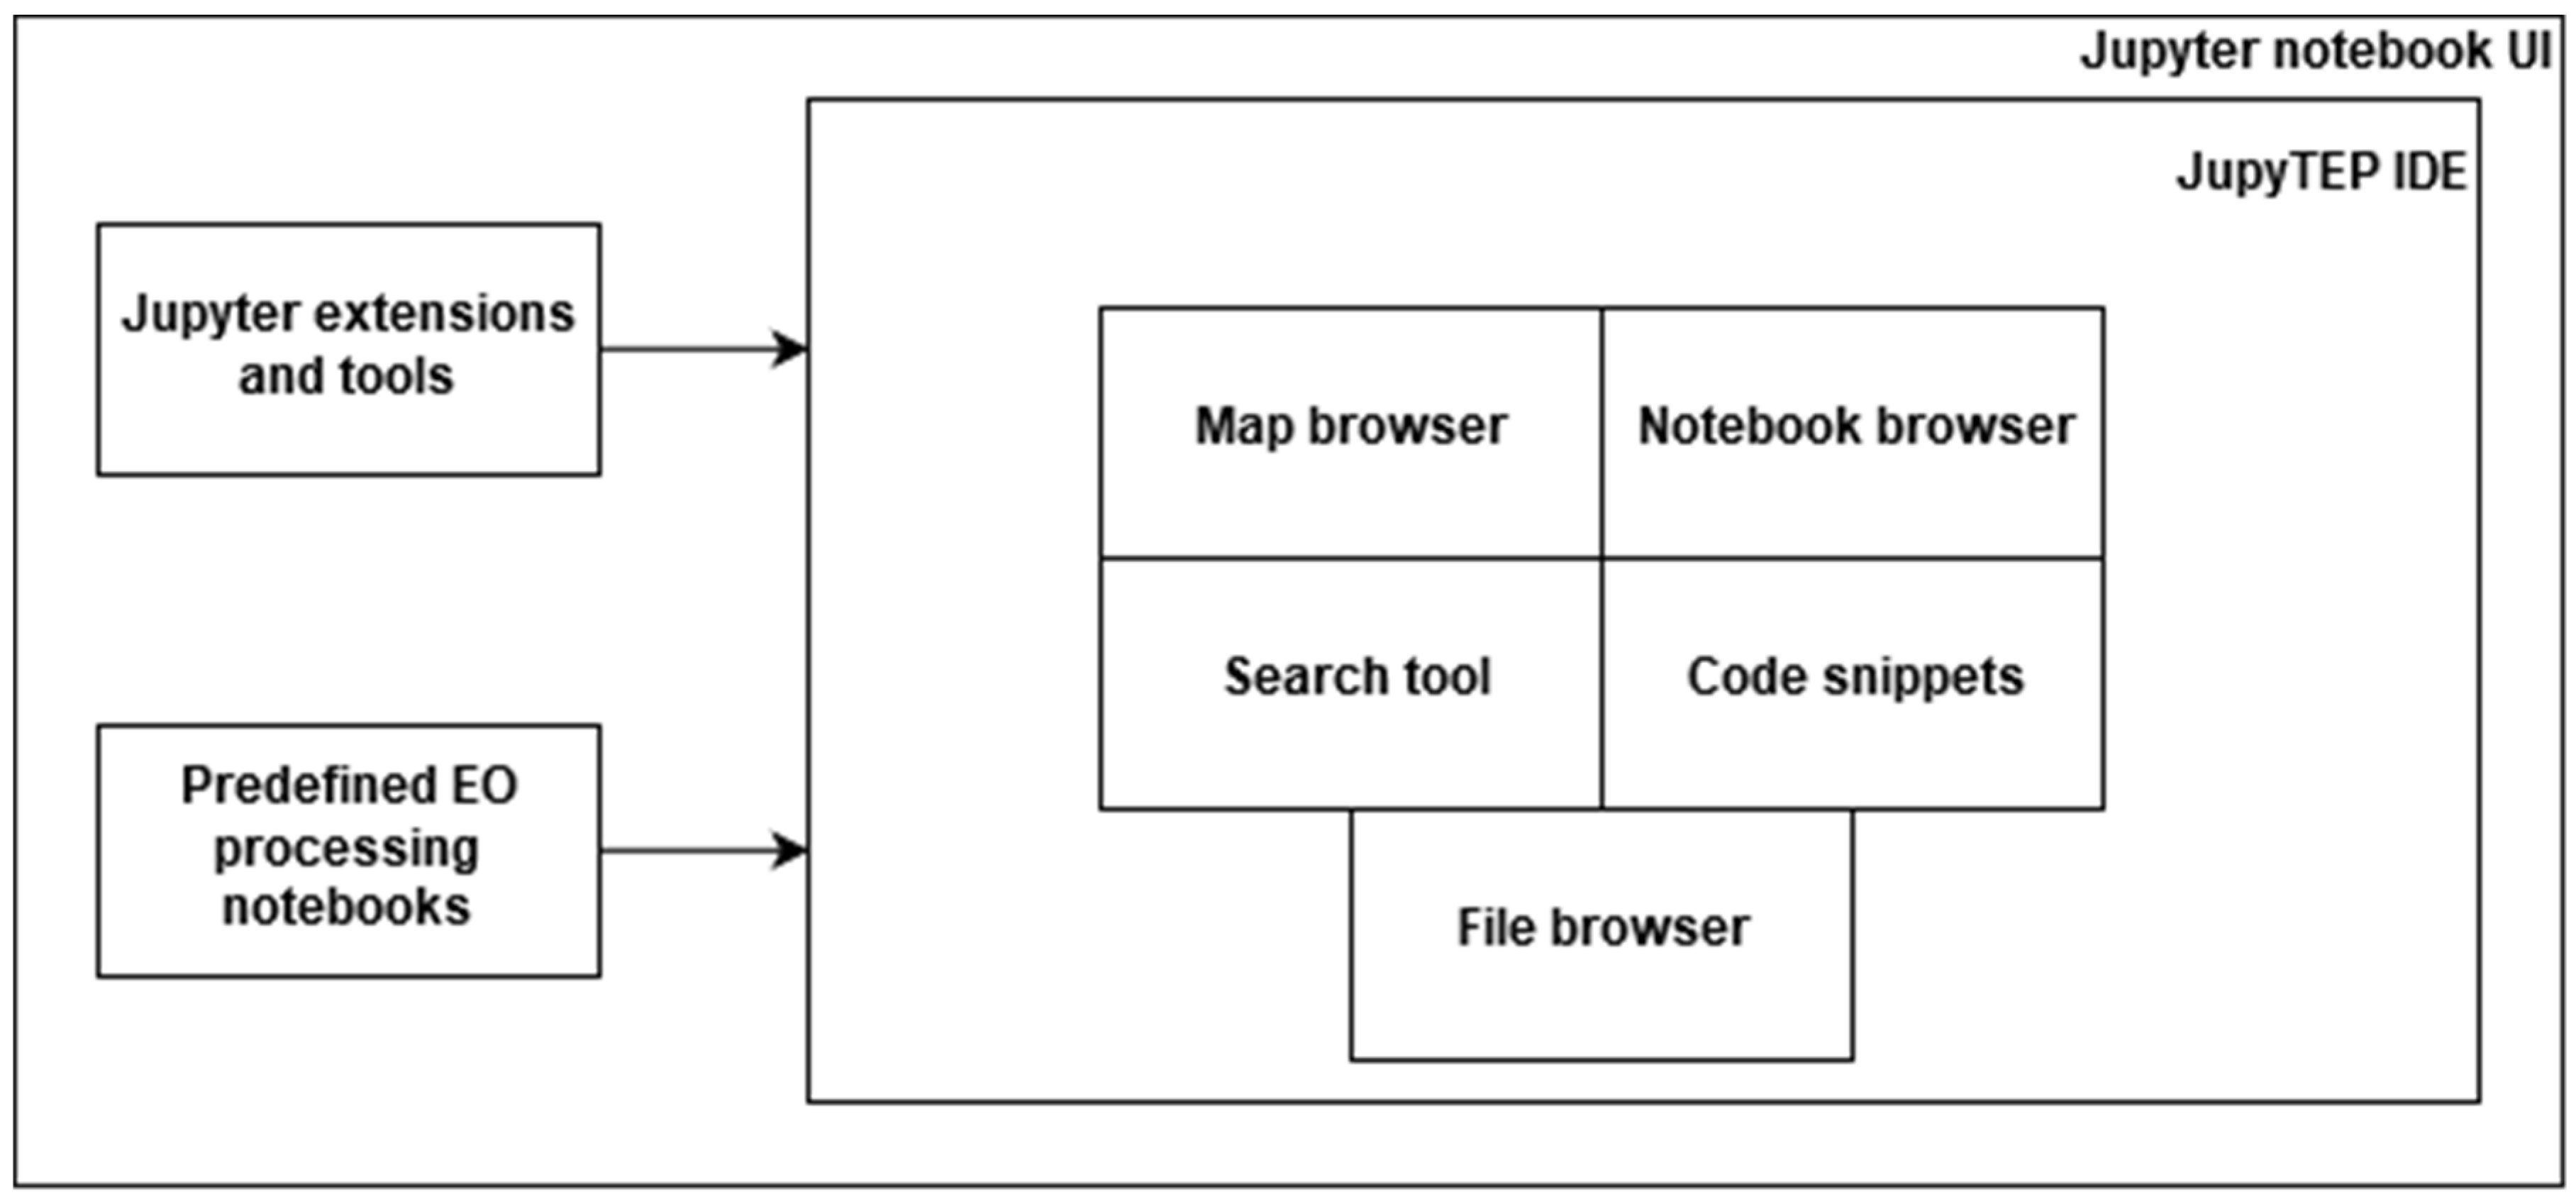
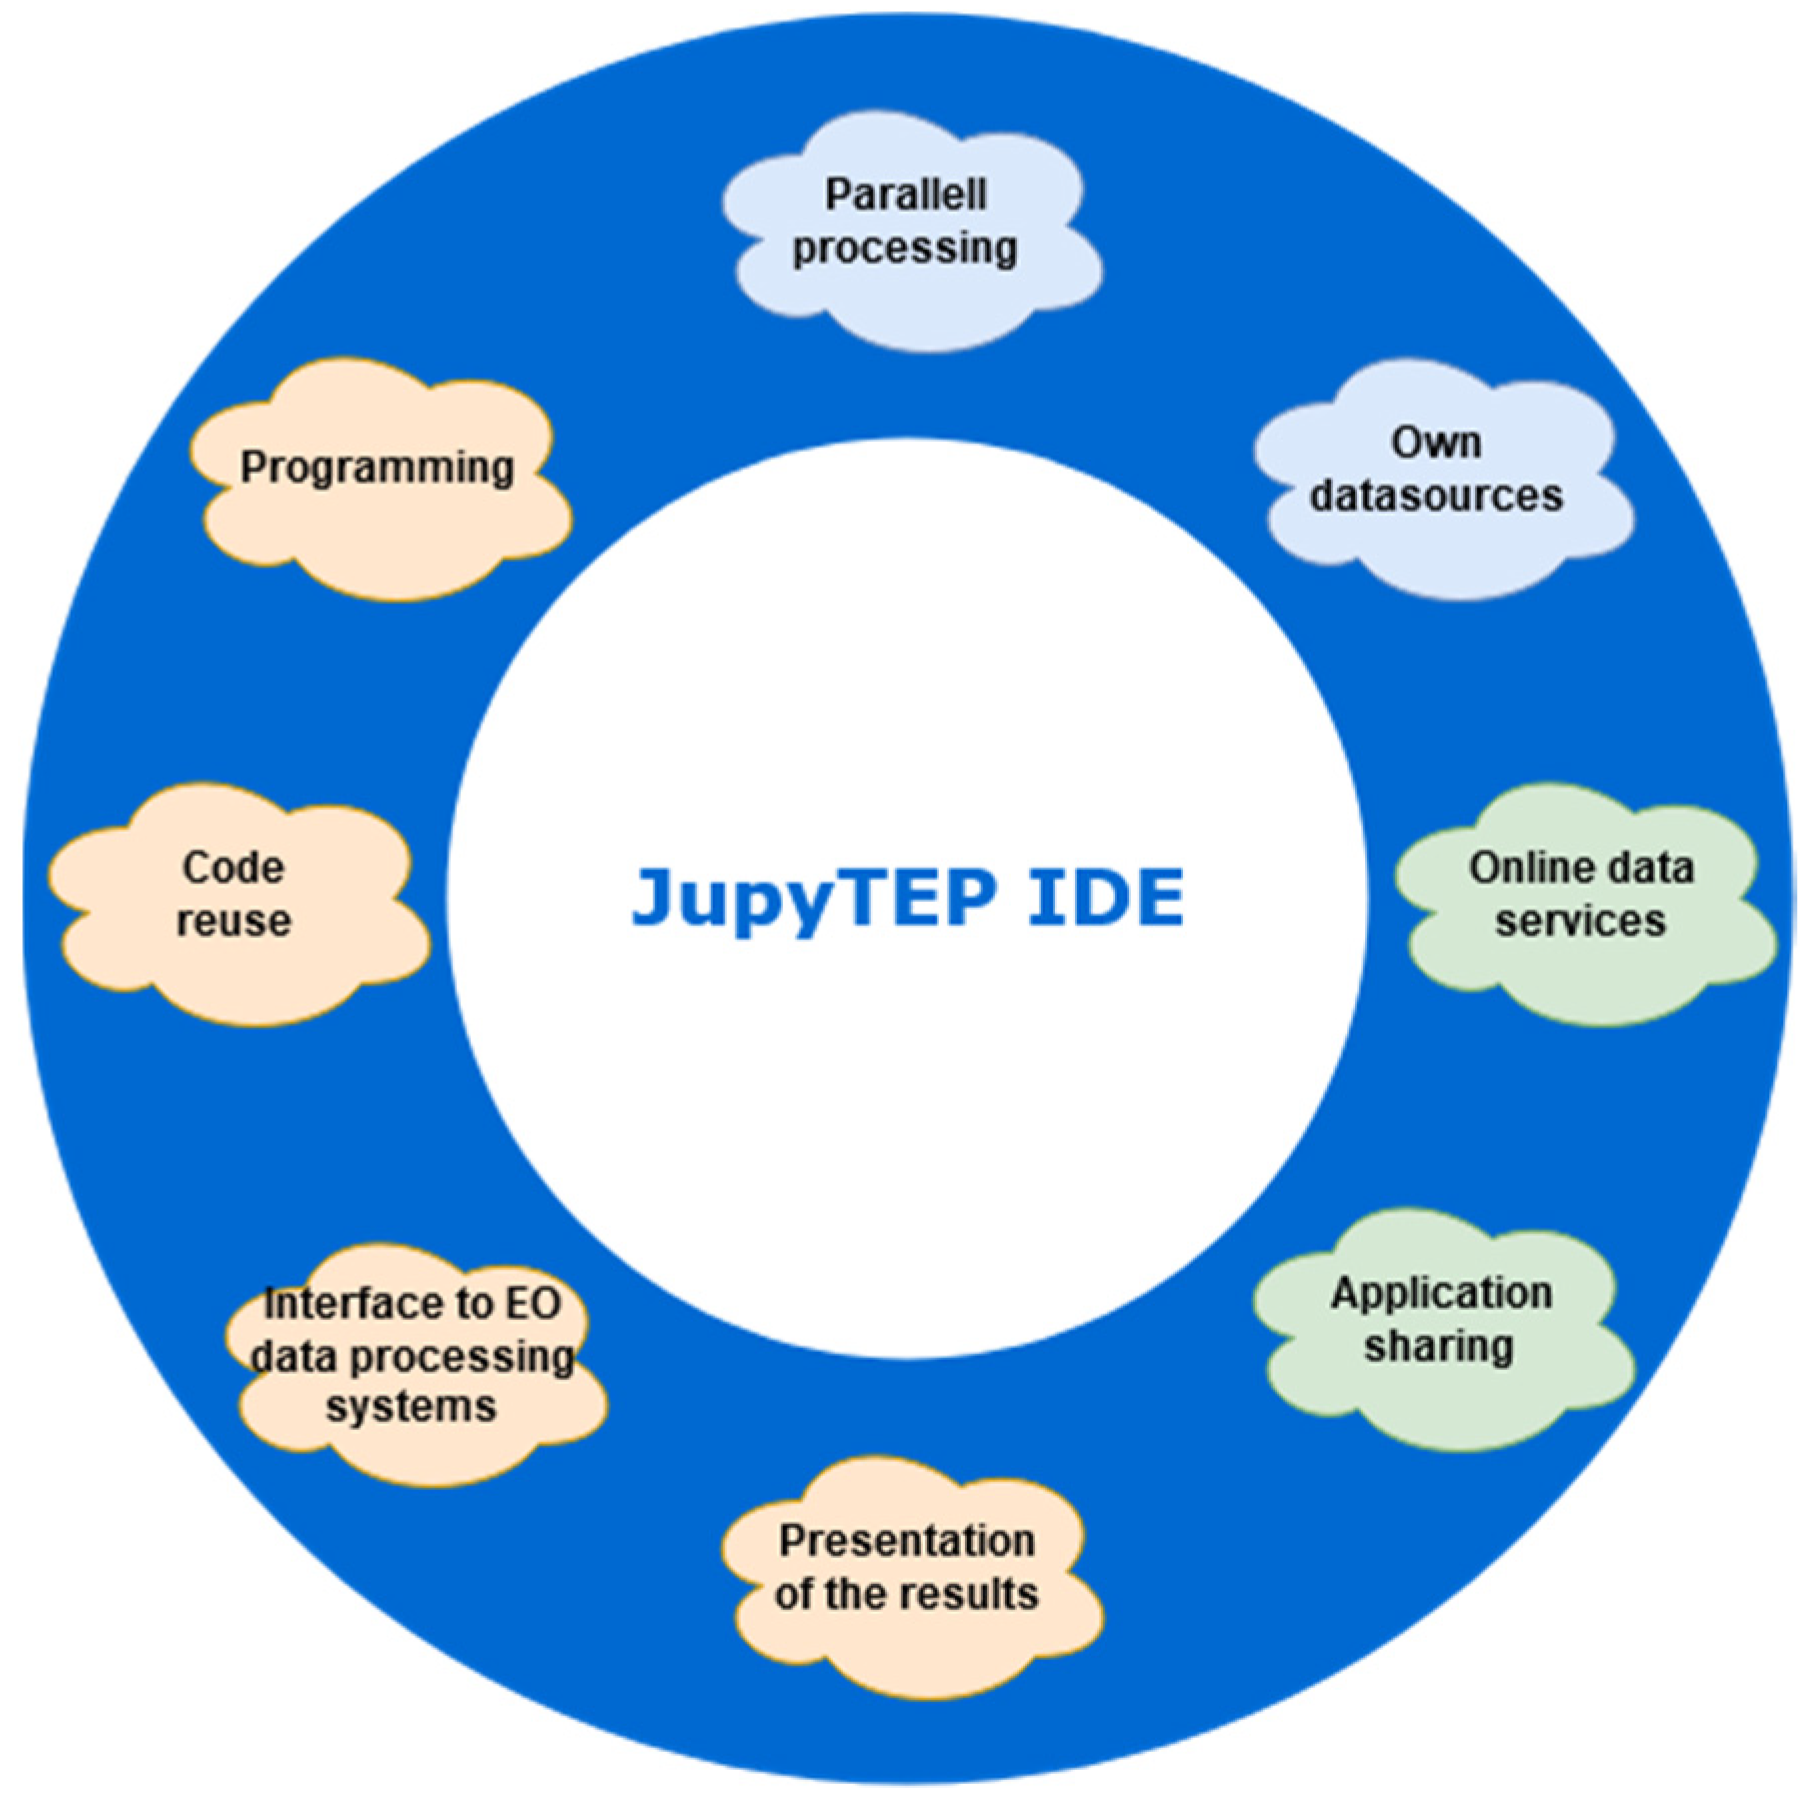
The JupyTEP IDE user-oriented product is based on a web-related user interface in the form of an extended and modified Jupyter user interface (UI) with a customized layout, EO data processing extension, and a set of predefined notebooks, widgets, and tools (Figure 1). The final IDE is targeted at remote sensing experts and scientists, as well as users who can develop the Jupyter notebook by reusing embedded open source tools, common WPS interfaces, and existing notebooks. A fully scalable Docker environment was suitable for the demanding and resource-consuming EO data processing community and most of the automatic tasks related to processing and the development of new scripts and algorithms.
The project was developed in cooperation with the European Space Research Institute (ESRIN), a center for earth observation of ESA, which oversaw the formulation of the system’s functionality requirements.
1.2. Current Trends among Tools for EO Data Processing
EO data processing is rapidly moving from desktop to cloud computing. This trend is visible across many applications. New EO data processing platforms are being developed all over the world [12,13].
Modern scientific computations require high-level, efficient, easy-to-use programming languages with low entry points. Moreover, the possibility to visualize data, create tables, charts, comments, and equations is as important as the calculations themselves. For this reason, the Jupyter notebook is gaining popularity. Among scientists and ordinary users, high-level programming languages such as Python or R have recently gained great popularity. The wealth of libraries and functions they contain is so large that they have become an important component of many analytical tools and geographic information systems (GIS). The philosophy of spatial data processing with the possibility of programming one’s own analytical algorithms requires the user to some achieve degree of proficiency; however, it results in much higher flexibility and gives incomparably greater possibilities in relation to systems with closed and permanently programmed functionalities. All of these features are available within Jupyter notebooks.
Spatial data are a specific type of data. The combination of online processing philosophy with GIS and remote sensing (RS) technologies can yield interesting results and new, more efficient tools for data processing.
There are more and more earth observation datasets available online provided by NASA, ESA, and third-party companies. On 14 December 2017, the European Commission and the European Space Agency signed contracts under the Copernicus program with four consortia to create DIAS platforms (data and information access services) [14]. Currently, the following DIAS platforms are available: ONDA [15], Mundi [16], CreoDIAS [17], Sobloo [18], and WEkEO [19]. It is much easier to process these data remotely in the cloud without downloading large datasets to a local computer. The number of online EO data processing platforms is growing and there is a constant need for new solutions in this field. Among the existing platforms for the processing of satellite data, the following can be mentioned for example: ESA thematic exploitation platform (TEP) (Website), Google Earth Engine [12], Earth on AWS [20], or openEO.org [21]. Every online EO data processing tool has its own purpose, its advantages, and disadvantages. For example, TEP [22] websites are oriented towards a specific topics and applications. Google Earth Engine is a very powerful tool, but its configuration options are limited, it is not open source, and it cannot be scaled or reconfigured by users. OpenEO.org goal is to integrate cloud, software, and service infrastructure with a very large API while JupyTEP IDE is a platform designed for users (backend). JupyTEP IDE is open source, can be self-hosted, is scalable, and fully configurable. These features distinguish it from other online EO data processing tools. Additional benefit is that in JupyTEP IDE, one can use the programming language of his choice. Another major difference is the access to virtual machine system shell, which grants full configuration options not just for JupyTEP IDE, but for the entire virtual machine.
The huge size of EO data makes researchers look for new ways to process them. One of the new paradigms in this field is the use of EO data cubes (EODC), revolutionizing the way users can interact with EO data and a promising solution to store, organize, manage, and analyze EO data [23,24].
Assumptions for this project have been developed by observing and analyzing existing trends in the development of EO data tools and is based on suggestions from ESA associates, who are unquestionable experts in this field. The main assumptions underlying the JupyTEP IDE design process were formulated so that the system would have the following capabilities:
- Interoperability;
- Integration with existing data sources and interfaces;
- Reusability;
- Parallelization in processing;
- Multi tenancy/multi user;
- Scalability.
The authors refer to the capabilities mentioned above in detail in the context of JupyTEP IDE in the following section.
2. Platform Overview, Design, Methods, and Tools
This work presents an integrated development environment (IDE) for geospatial data processing, created especially for EO (earth observation) data (Figure 2). The solution mentioned, called JupyTEP IDE, is based on Jupyter notebook extended in a such a way as to be able to easily process EO data. It allows users to use scripting programming language (Python) and also prepared scripts and services to compute and process the data. The users also have the ability to develop and share online applications (notebooks) of their own. JupyTEP IDE is targeted to meet the needs of EO scientists and other professional and non-professional users, especially in the field of geospatial processing. It integrates the most common EO-based, geospatial tool, software, libraries, and toolboxes for EO data (SNAP, OTB), vector and raster data processing (GRASS GIS, GDAL, PostGIS, etc.), visualization, and presentation in the most suitable form. Combining the basis of the Jupyter approach and an extended Python environment integrated with a Docker prerogative allows for interconnection with most existing services (WPS, web map services (WMS), TEP interfaces) and tools for geo-data storage and distribution (PostGIS, GeoServer, Mapnik, etc.).
2.1. Tools and Libraries Used for the Project
The JupyTEP IDE environment is built with the reuse paradigm. The following core components are used for building the JupyTEP IDE solution:
- Python environment: Implementation and configuration Anaconda (Python 2.7, 3.6) with Jupyter kernels (Python 2.7, Python 3.6, R, SciLab).
- Jupyter-related tools: Jupyter, JupyterHub, JupyterLab, Jupyter extensions.
- Container platform: Docker, DockerHub, Docker Stacks, Docker Swarm.
- EO-based tools: SNAP with Snappy bindings, OTB, snaphu, rasterio.
- Spatial data storage and sharing tools: PostgreSQL/PostGIS, GeoServer, PyWPS, Mapnik.
- Spatial data processing tools: GRASS GIS [25], GIS tools/libs (GeoPandas, Fiona, Shapely, etc.), GDAL.
- Deep Learning tools: TensorFlow, Keras, Scikit-learn.
- Monitoring tool: Based on a Swarmprom solution for Docker Swarm monitoring with Prometheus, Grafana, cAdvisor, Node Exporter, Alert Manager, and unsee.
- Management for Docker Swarm tools: Portainer with Docker API CLI.
The entire system is composed of tools and libraries integrated on top of Docker and Jupyter solutions to extend the functionality of the Jupyter notebook idea.
Docker platform makes creating, deploying, and running applications much easier by using containers. Containers allow one to package an entire application with all of its requirements (such as libraries) and deploy it as one package. This way, the application will run on any other Linux machine regardless of any host machine settings.
The IDE idea is based on separate cells containing fragments of code, which can be run separately. It allows for easier modification of code parts and strongly supports code reuse. In Jupyter, there are input cells (for writing code) and output cells for showing results. Input cells use programming language (kernel) defined for a certain notebook. As kernels are based on IPython, its magic commands are also available (called cell magic). These magic commands are a set of predefined functions that can be called with a command line style syntax [8].
2.2. Platform Design
JupyTEP IDE is designed for a cloud-based environment and operates as a typical web-based application. The design process of the UI focuses on convenient and user-friendly search and discovery of EO data with the use of GIS tools and IDE functionalities. The application is designated to be a responsive web application for all screen sizes and resolutions. The target operating system for the server side of the JupyTEP IDE is Ubuntu, based on Docker stacks, while the client can run on any platform equipped with web browser.
The main goal was to create a solution and a platform for online EO data processing and visualization. To reach JupyTEP IDE goals, all system components were implemented with a close connection to the EO data repository. The assumptions for the project mentioned in the previous section have been implemented as follows:
- JupyTEP IDE adaptation of a Jupyter web-based environment with predefined tools for EO data access to provide a development environment that is easy to use and easy to integrate with any platform infrastructure—it allows interoperability objectives to be attained;
- EO tools integration is achieved as simplified access to EO data for the developer community by customization of JupyTEP IDE. Proposed integration tasks provide access to multiple sources, large volumes, and time series of EO data with predefined interfaces by integration with a cloud-based EO repository, i.e., innovative platform restbed (IPT);
- The reuse paradigm of JupyTEP IDE is achieved by the integration of open-source components and sharing notebooks with results of developed algorithms and services. Additionally, the provision of WPS, which can run notebooks and EO processing, fulfills the reuse aspects. All of these actions enhance the production of EO-based information and reuse processing algorithms in Jupyter-notebook form;
- To achieve the parallelization objective, components responsible for parallel processing in Jupyter environment (i.e., parallel ipython-cluster-helper, built-in mechanisms in EO data processing libraries) were integrated;
- Implementation of JupyTEP IDE in addition to JupyterHub and distribution as a Docker container allows multi-tenancy objectives to be resolved. All developments in WP3 were focused on obtaining an operational software, which covered the requirements of the JupyterHub and Docker environment;
- Scalability objectives were met thanks to the integration of cloud elements, integration with platforms’ infrastructure, all the components integrated within JupyTEP IDE, and functionalities implemented as a part of that environment.
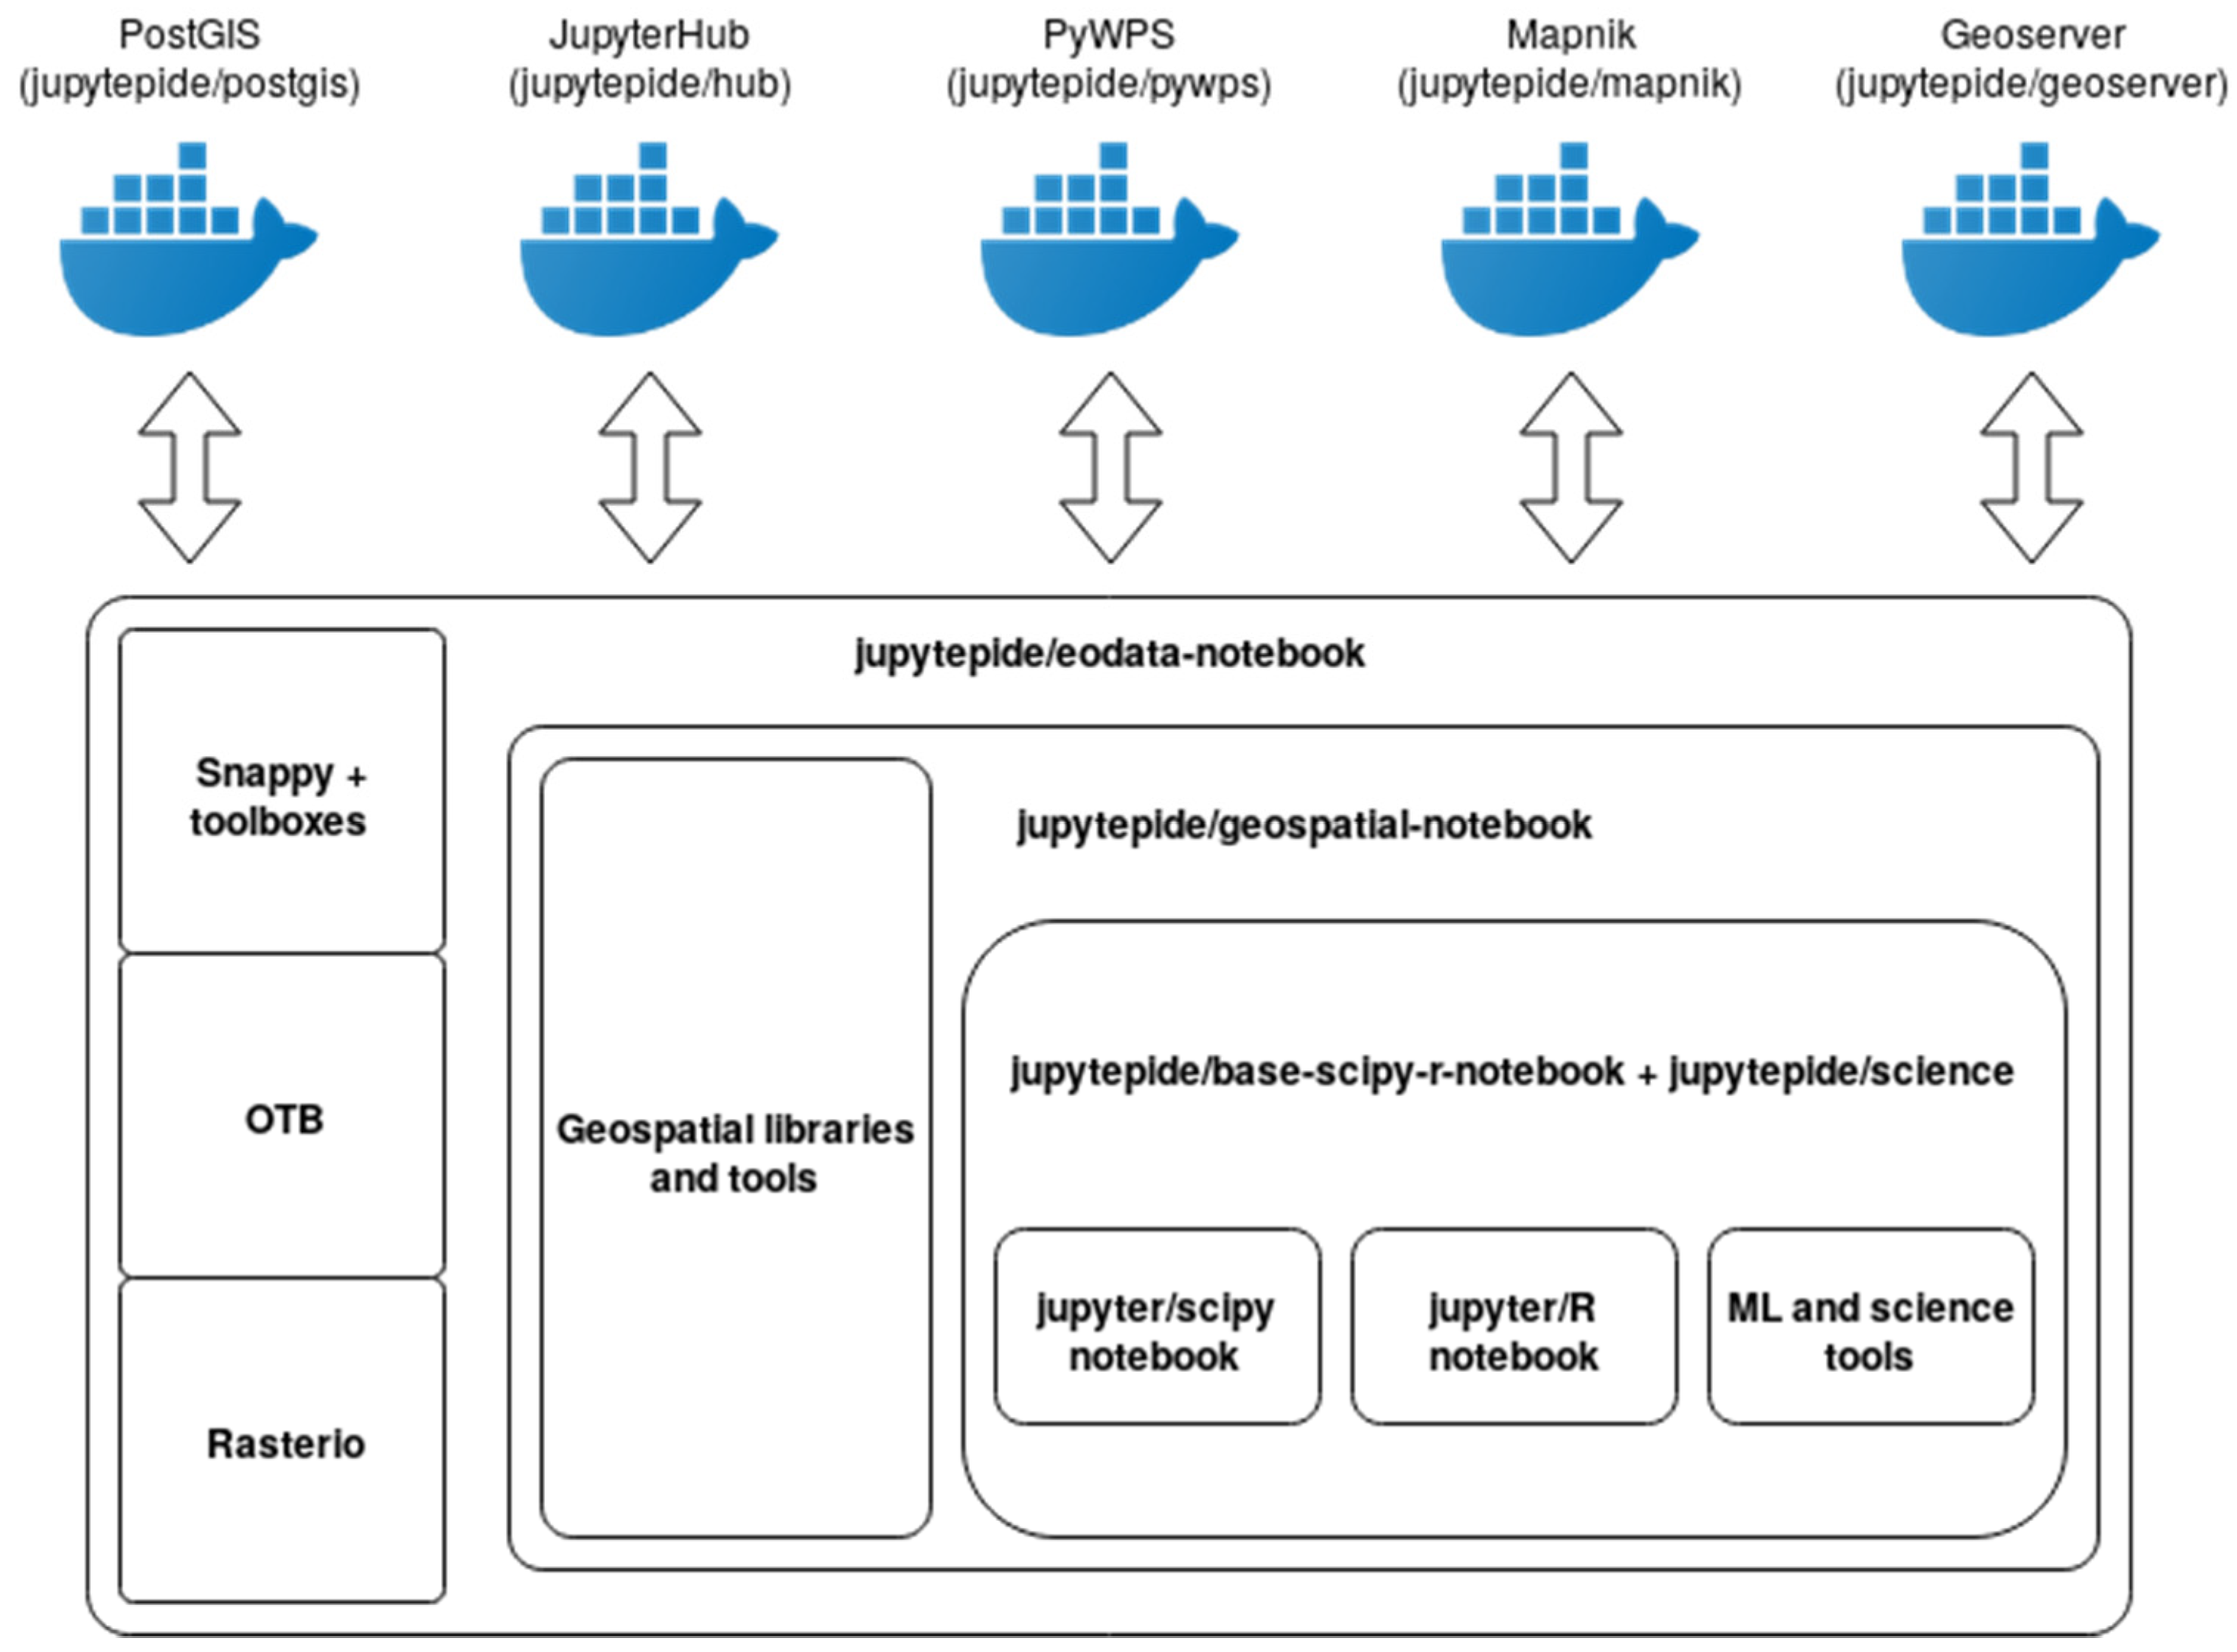
The JupyTEP IDE solution is built as a multiservice platform with components in the form of running Docker containers in swarm mode. Every component plays a different role. As the user database and storage, a PostgreSQL/PostGIS is used. It is a modified and adapted version of an existing Docker image, based on PostgreSQL 9.6 and PostGIS 2.4 extension. The PostGIS container is linked to JupyTEP IDE via an internal network and is complemented by a set of tools and object-relational mappers (ORM) such as SQLAlchemy, GeoAlchemy, etc.
For the sharing of results and the implementation of WPS, web feature service (WFS), web coverage service (WCS), and web map service WMS, a GeoServer and Mapnik are used: Adapted an existing Docker image (GeoServer) and a newly built one (Mapnik). Both can be accessed via an HTTP protocol and application programming interface (API). On top of each API, software development kit (SDK) methods are added to provide full service functionalities from a notebook cell perspective.
As a WPS functionality, a PyWPS server extension is integrated for sharing results in the form of a WPS interface. It works in the form of a Docker container as a WPS server. The main role of PyWPS is to provide advanced functionalities for developing and providing user services. PyWPS is integrated via Docker interfaces and API.
To have functionalities such as those in a typical IDE, a PixieDust debugger is used. The Jupyter-based debugger provides real-time debugging functionalities and is integrated as a tool and called cell magic.
2.3. Platform Infrastructure
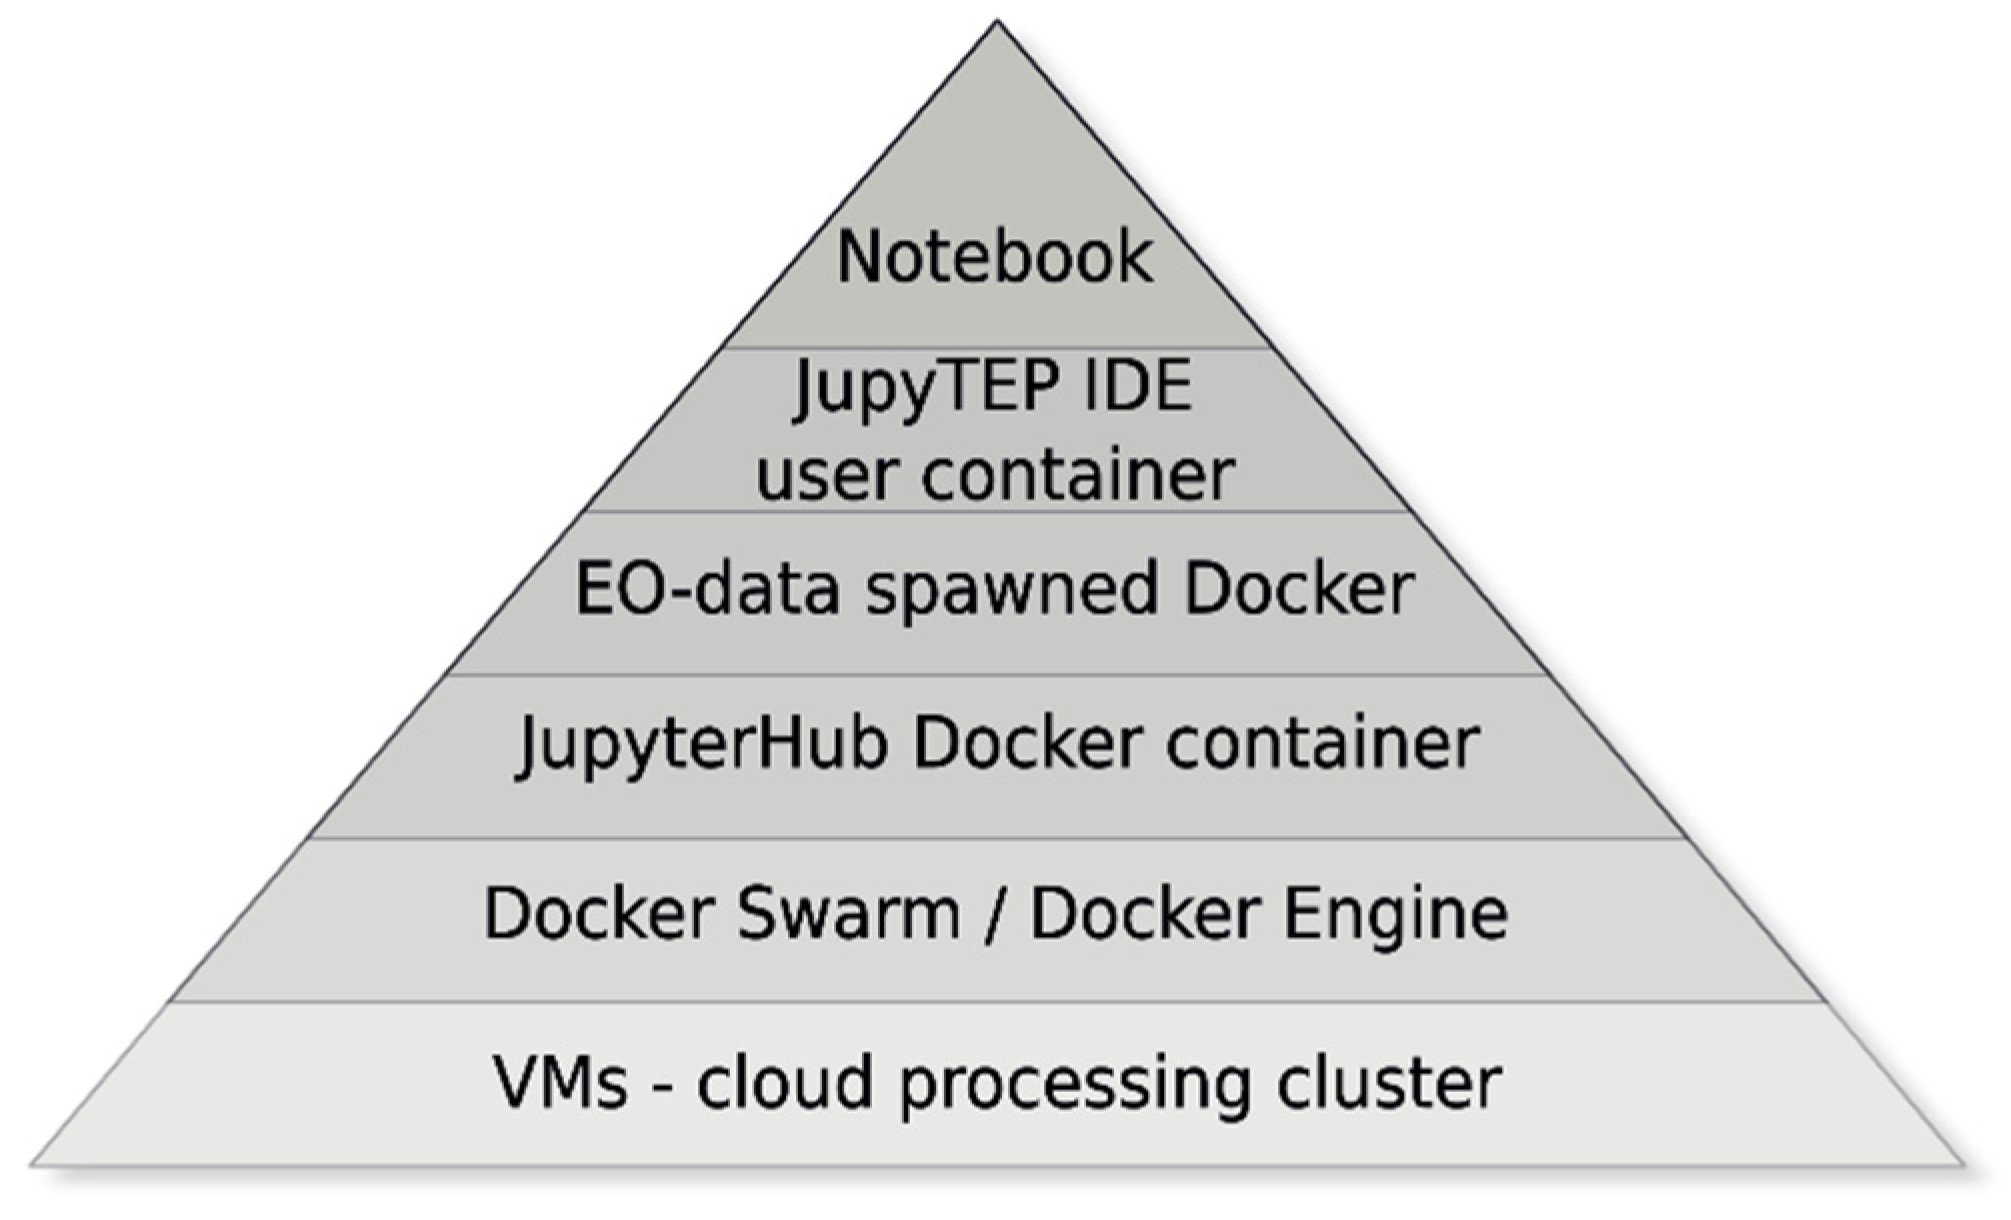
In terms of building a new platform infrastructure, JupyTEP IDE software provides a highly configured and optimized environment for any EO cloud infrastructure software. At the stage of development, JupyTEP IDE runs on its first candidate—“EO innovation platform testbed Poland” (IPT), which is a powerful Earth observation data repository established in Poland and launched worldwide. The repository gathers optical data provided by satellites within the framework of missions such as: Landsat, Envisat, Sentinel, and others. The project is implemented by a consortium headed by Creotech Instruments SA and also embracing a Polish company CloudFerro Ltd. and a German company Brockmann Consult Ltd., based on the contract concluded with the European Space Agency [26]. Finally, JupyTEP IDE is located on CreoDIAS with wide support and integration with the EO data repository. This type of integrated cloud infrastructure allows us to perform any development and EO data processing task without any data transfer, which results in high performance. From the infrastructure (cloud) side, JupyTEP is built on top of the Docker environment. It integrates Docker, Docker Compose, Docker Engine, Docker Machine, and Docker Swarm, composed in separated JupyTEP Docker Stacks images with a predefined set of tools. This kind of architecture allows the user to choose the optimal environment for the planned task with all necessary tools and user environment configurations (Figure 3).
JupyTEP IDE extends the paradigm of a collaborative platform in the form of data and information exchange. Data sharing is resolved with the use of two types of volumes: User- and host-oriented [27]:
- User volumes (work directory) store private data with access limited to user,
- Host volumes (shared directory) store data available for any user (public folder).
In terms of authorization and authentication, the JupyTEP IDE platform is integrated with GitHub. In order to start using JupyTEP IDE, a user should login with their GitHub account using their GitHub credentials via the GitHub OAuth mechanism.
JupyTEP IDE is based on Docker client–server architecture [28]. Docker is an open-source platform used to package, distribute, and run applications. From the point of view of JupyTEP IDE, it provides an easy and efficient way to encapsulate applications from infrastructure to run as a single Docker image shared through a central Docker registry. The Docker JupyTEP IDE final image is used to launch a JupyTEP IDE user container, which makes the contained JupyTEP IDE available. In simple words, the Docker is a containerization platform, OS-level virtualization method used to deploy and run a distributed JupyTEP IDE application and all EO-related dependencies together in the form of a Docker container. By using the Docker Platform, JupyTEP IDE can multiply isolated instances of JupyTEP IDE services run on a single host, access the same Jupyter kernel, and ensure that the application works seamlessly for any JupyTEP IDE user (Figure 4).
From the JupyTEP IDE perspective, JupyterHub interfaces with the Docker Swarm service running on the same host machine and Docker Swarm takes care of launching containers across the other nodes. Each container launches a Jupyter notebook server for a single user, then JupyterHub proxies the container port to the users. Users do not connect directly to the nodes in the Docker Swarm pool. The JupyterHub architecture addresses the issues of locality and network topology of JupyTEP IDE. From the JupyTEP IDE perspective, the Hub and Proxy reside on a known host under the control of the site administrator, and user notebook servers are safely configured to accept connections from that host. Communication with the per-user servers is secured and authenticated via GitHub OAuth exchange between the Hub and the notebook server. By adopting the appropriate network security measures, this host allows one to safely bridge between the restricted internal network domain and a broader network domain from which users can connect, potentially including the public Internet (Figure 4).
In addition to the Jupyter and Docker configuration, we developed our own set of functions and modules for easy notebook script writing. All elements were developed in Python 3.6 and implemented the most important functions for working with JupyTEP IDE, which enabled communication between components, map manipulation, and easier work, coding, and presentation of results on the map in JupyTEP IDE.
At the time of development, the EO Data repository available at the JupyTEP IDE platform consists mostly of the Copernicus’ Sentinel satellites data, ESA/Landsat, and Envisat data:
- Full Sentinel-2 Level 1 data worldwide;
- Full Sentinel-3 data worldwide;
- Full ESA/Landsat data worldwide;
- Full Envisat/Meris data worldwide;
- Sentinel-1 SLC and GRD data for most of Europe;
- Sentinel-5P data (NEW).
However, the JupyTEP IDE philosophy is aimed at complete freedom of configuration. This offers great opportunities to adapt the software environment, which means that any other data source can be connected according to the user’s needs.
2.4. Reuse of Existing EO Data Processing Tools
One of the main concepts of JupyTEP IDE is the reuse of existing EO data processing tools. An API to ESA SNAP, OTB, and GRASS GIS are available for users. These platforms are integrated with JupyTEP IDE through Python bindings.
SNAP, developed by ESA, is a common architecture for Sentinel Toolboxes. It provides many tools and processing algorithms in a desktop application available for many operating systems. It also has a command line interface and application programming interface (API) in Java with Python bindings [9].
SNAPHU is an implementation of the statistical-cost, network-flow algorithm for phase unwrapping [29]. Python binding is available through the JupyTEP IDE library. It is implemented using the subprocess Python module.
OTB is an open source project for remote sensing data processing. It can be used to work with optical, multispectral, and radar images. The performance of this software is relatively high, and it can process high-resolution images at a terabyte scale. Applications such as ortho-rectification, pan sharpening, classification, SAR processing, and much more are available. OTB algorithms are accessible from Python, but also QGIS, C++, or command line. The OTB is available for many operating systems such as Linux, Windows, and macOS, among others.
3. Application of Developed Tools in EO Data Processing
As a result of this project, an online tool for Earth Observation data processing, namely JupyTEP IDE, has been created. Using this system, users gain access to datasets and functions that are useful for EO data processing, visualization, and results sharing. The main advantage that distinguishes this product from other tools, apart from using ready-made algorithms, is the ability to quickly and easily create users’ own algorithms or scripts. As a result, the data processing can be controlled strictly at every stage and in a formula adapted to any user needs. Although the basic programming language in JupyTEP IDE is Python, it is possible to create code in other languages by launching additional interpreter engines (called kernels) offered by the integrated Jupyter notebooks functionality. JupyTEP IDE, by default, offers the ability to create scripts in Python 2.7, Python 3.6, R, Scilab, Bash, Octave, and indirectly—by launching the “cell magic” technique—it gives access to JavaScript programming capabilities.
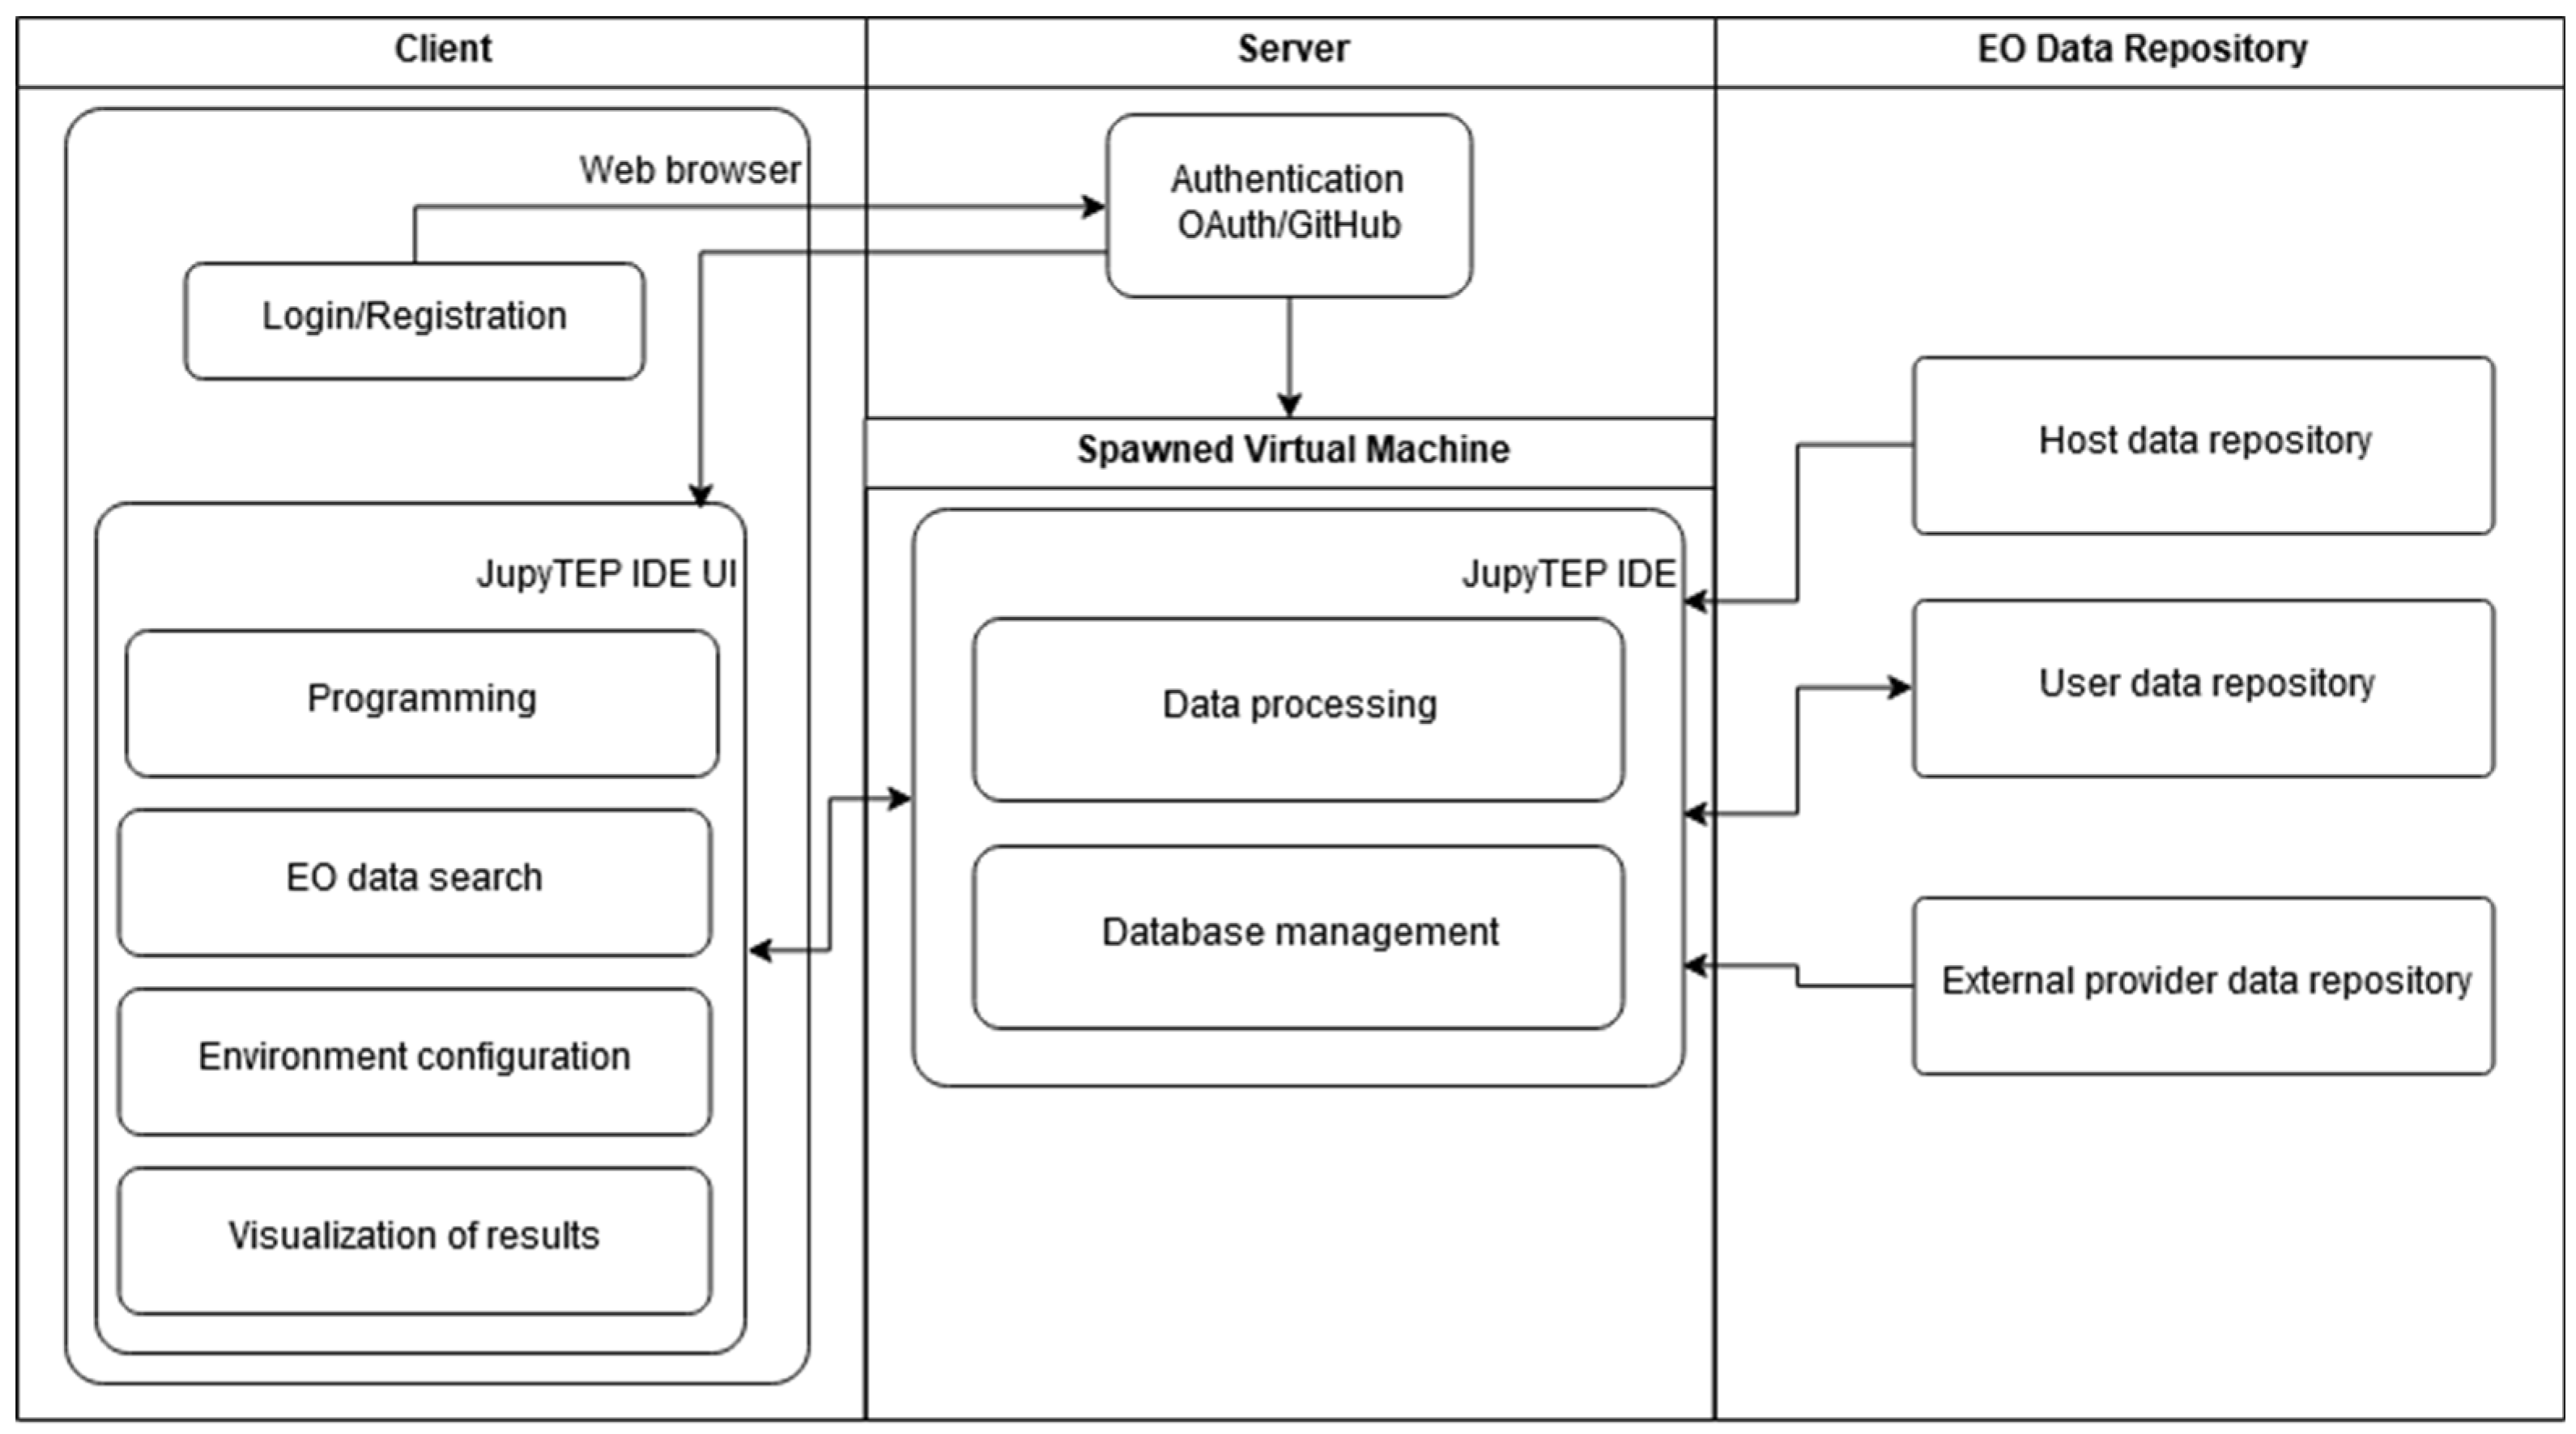
Figure 5 depicts the functional view of the system. From the user’s perspective, the most important part is the Client part. The entire interaction of a user with JupyTEP IDE is through web browser.
To better depict the possibilities and functionalities of JupyTEP IDE, a few use case diagrams are presented below.
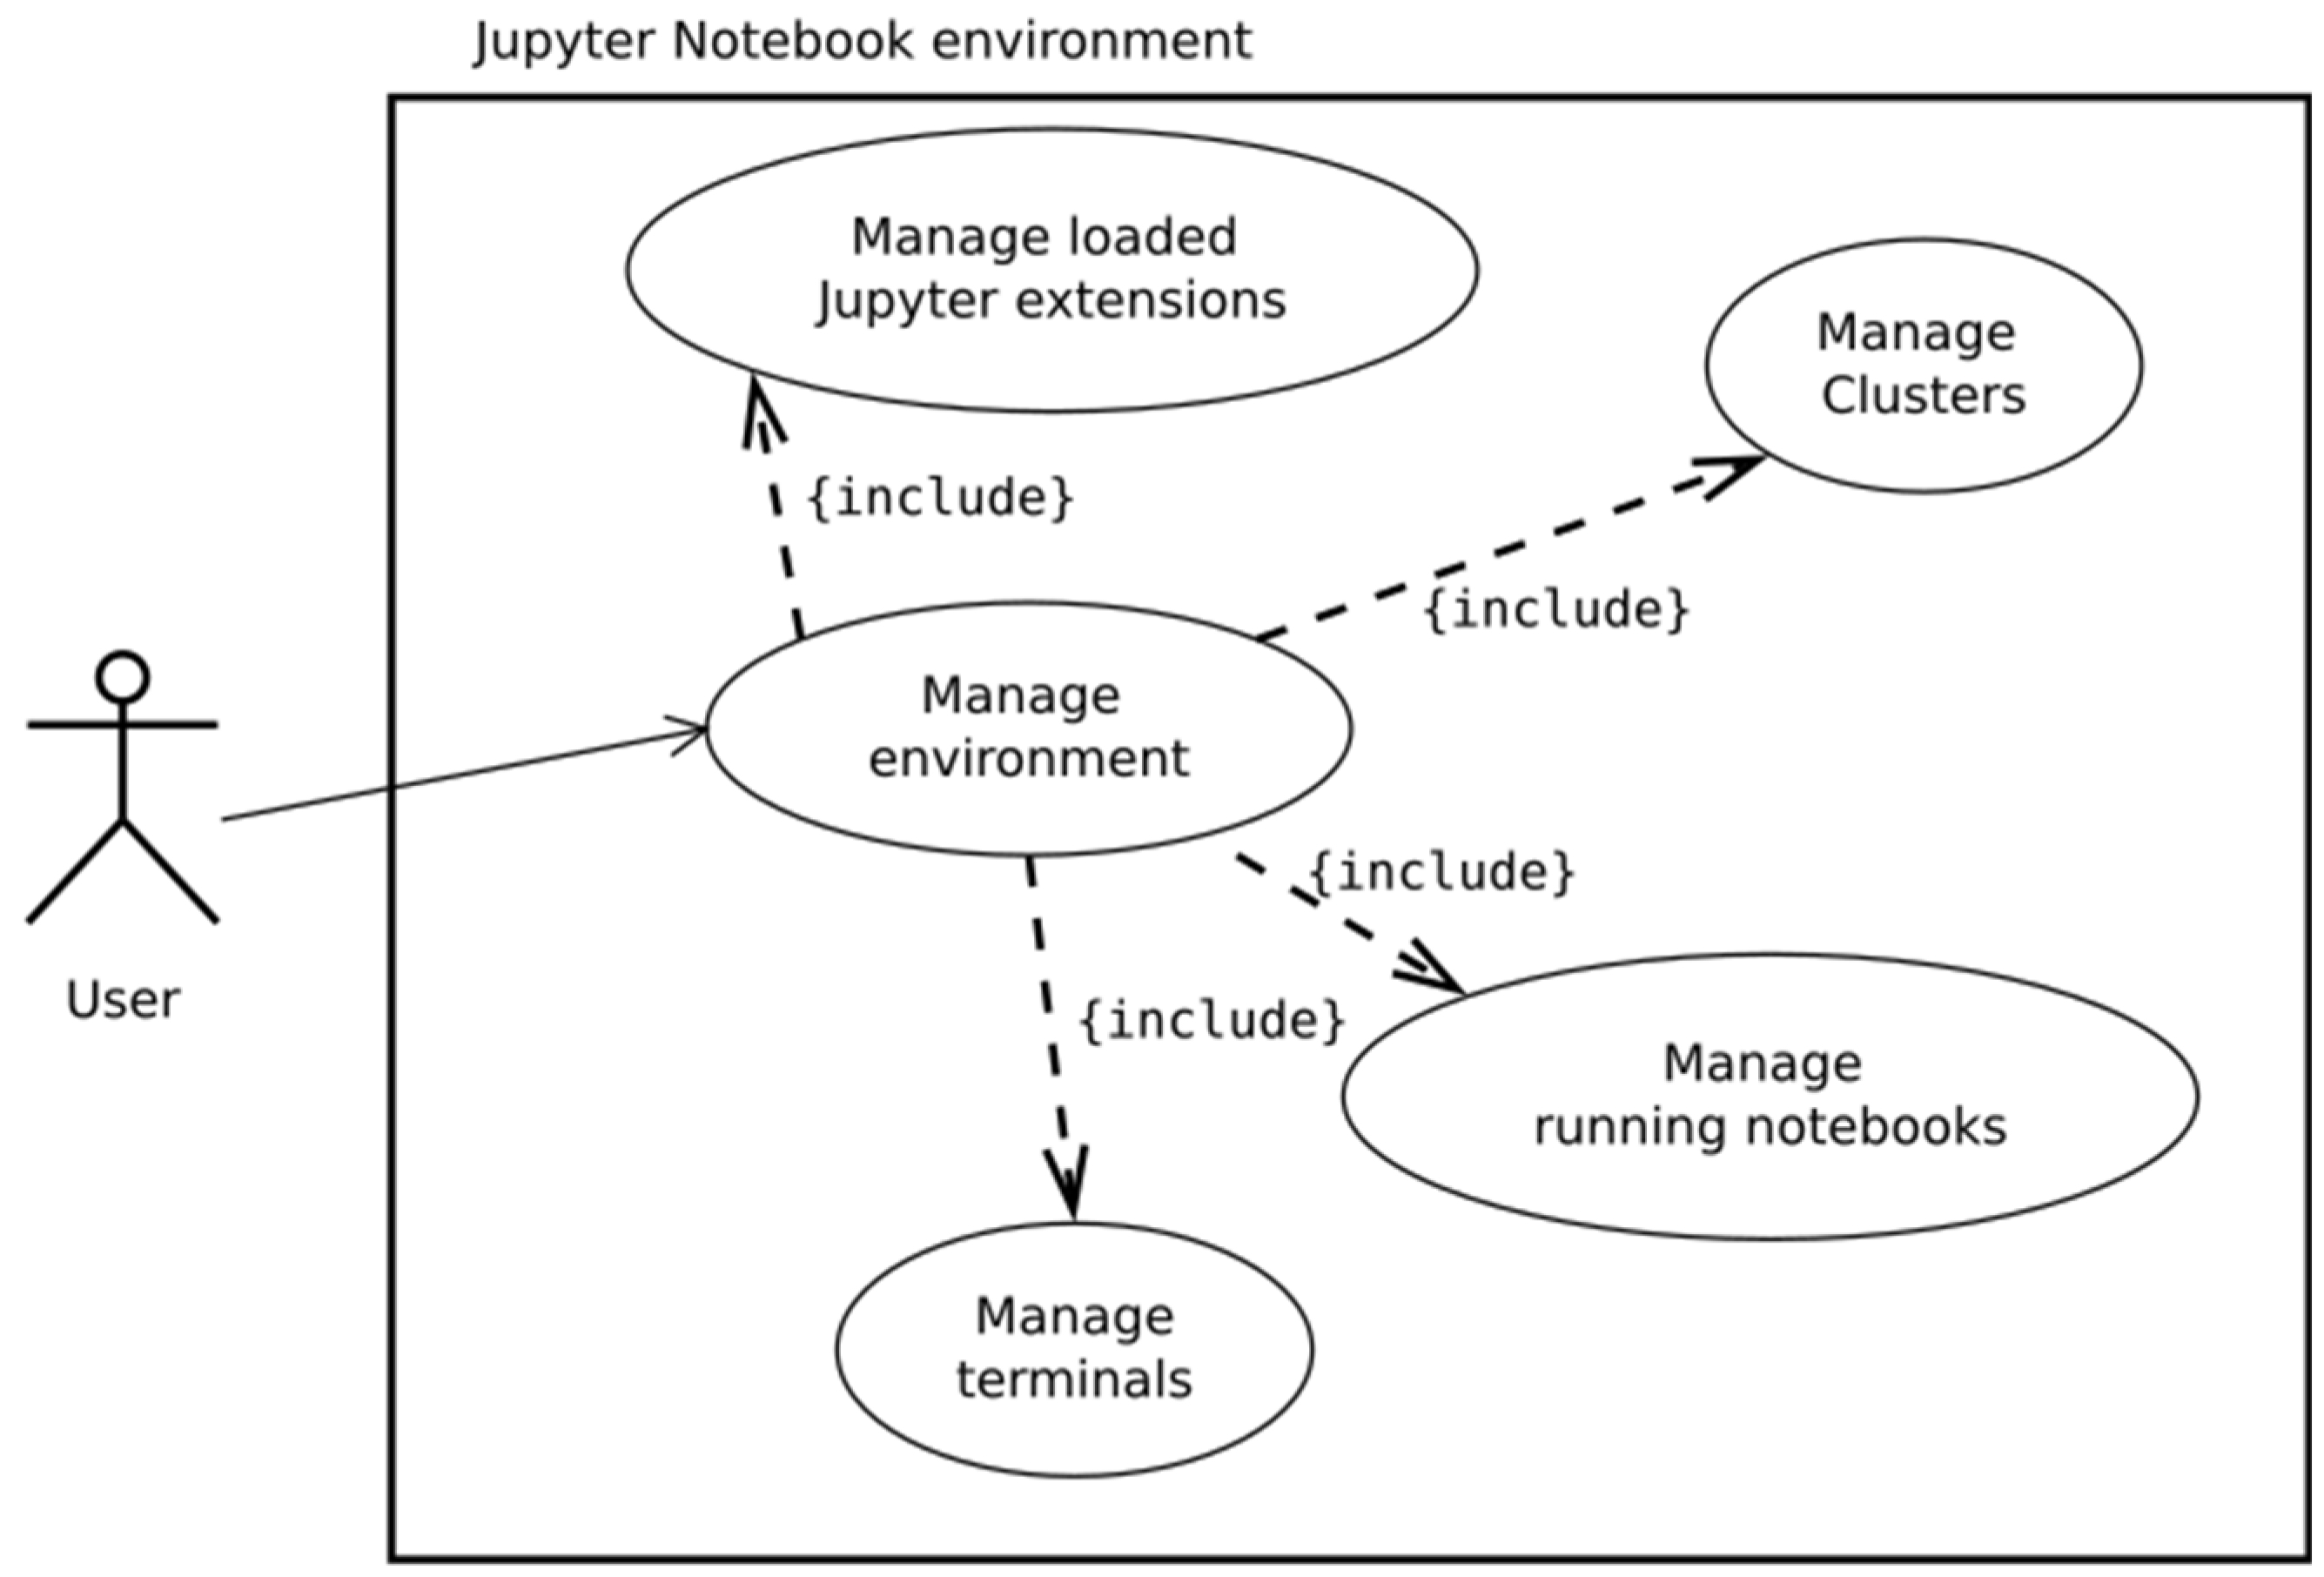
As mentioned, JupyTEP IDE is based on Jupyter and it is an extension of Jupyter notebook web application. As shown in Figure 6, the user is able to manage the JupyTEP IDE environment by adding, removing, or switching Jupyter extensions. This gives the great possibilities of configuring the software according to users’ needs. While working with own source code, one can run several notebooks at the same time and then manage them from user interface. It is also possible to manage clusters for parallel notebook execution on remote machines.
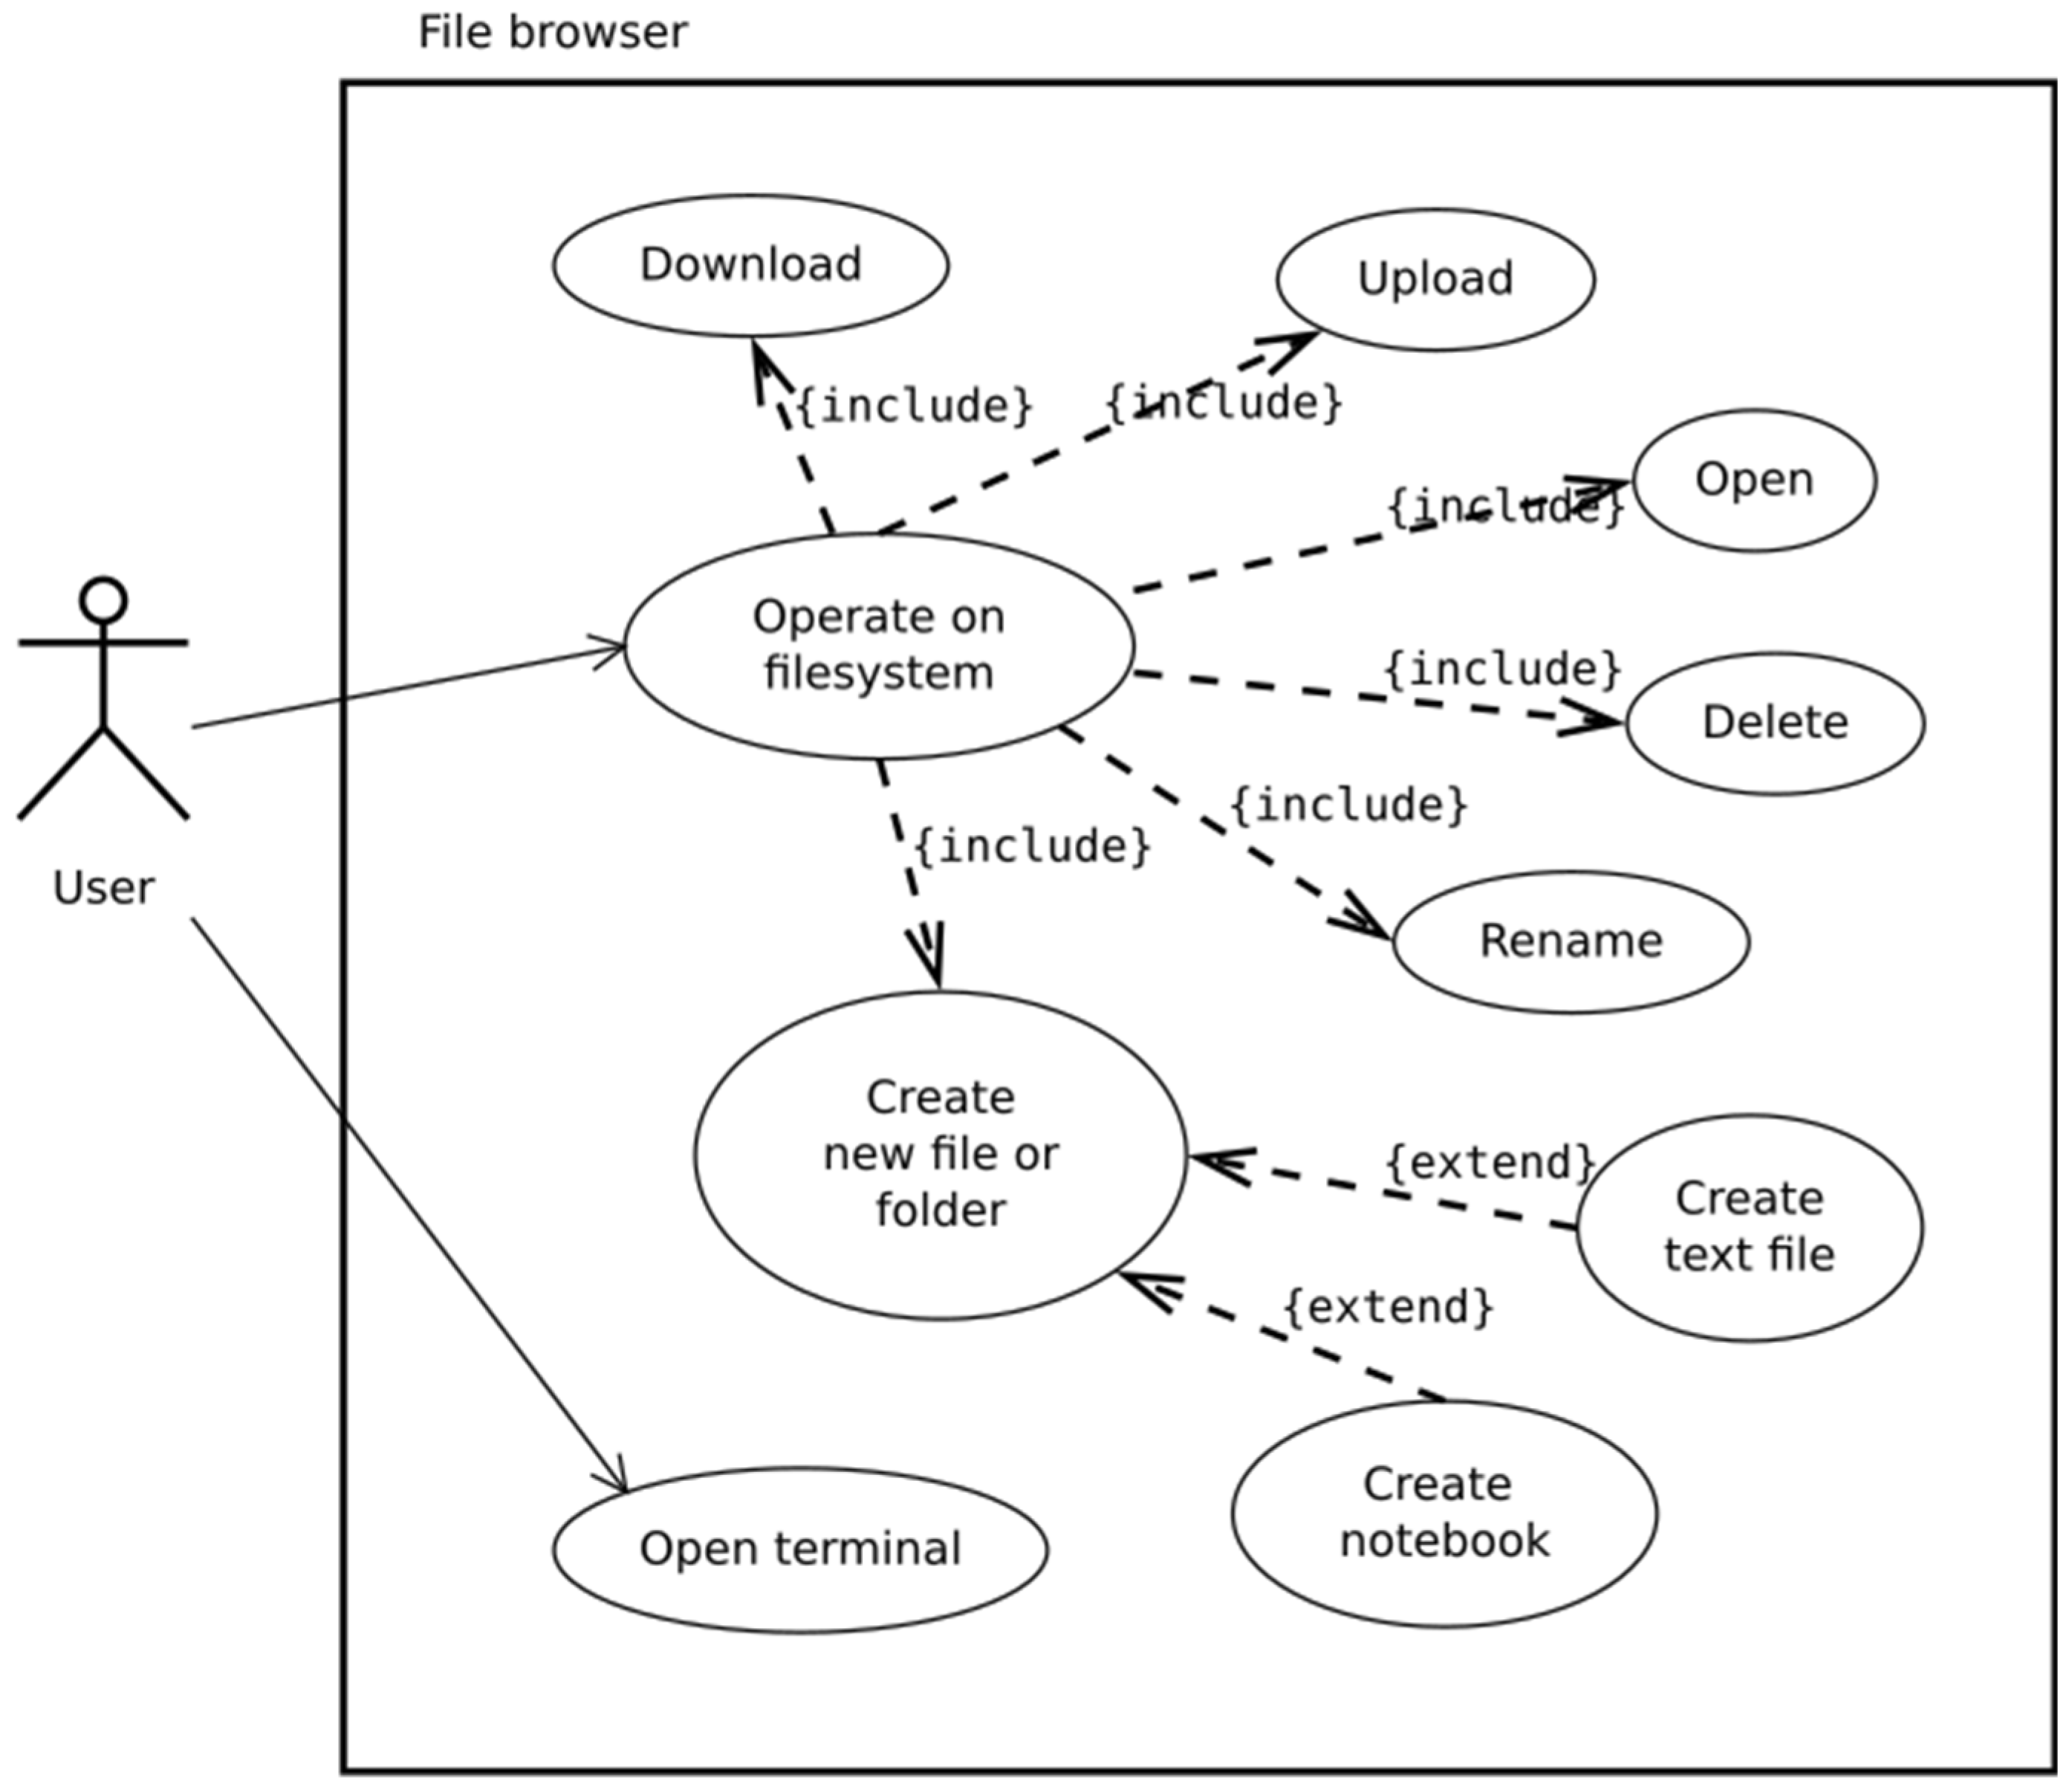
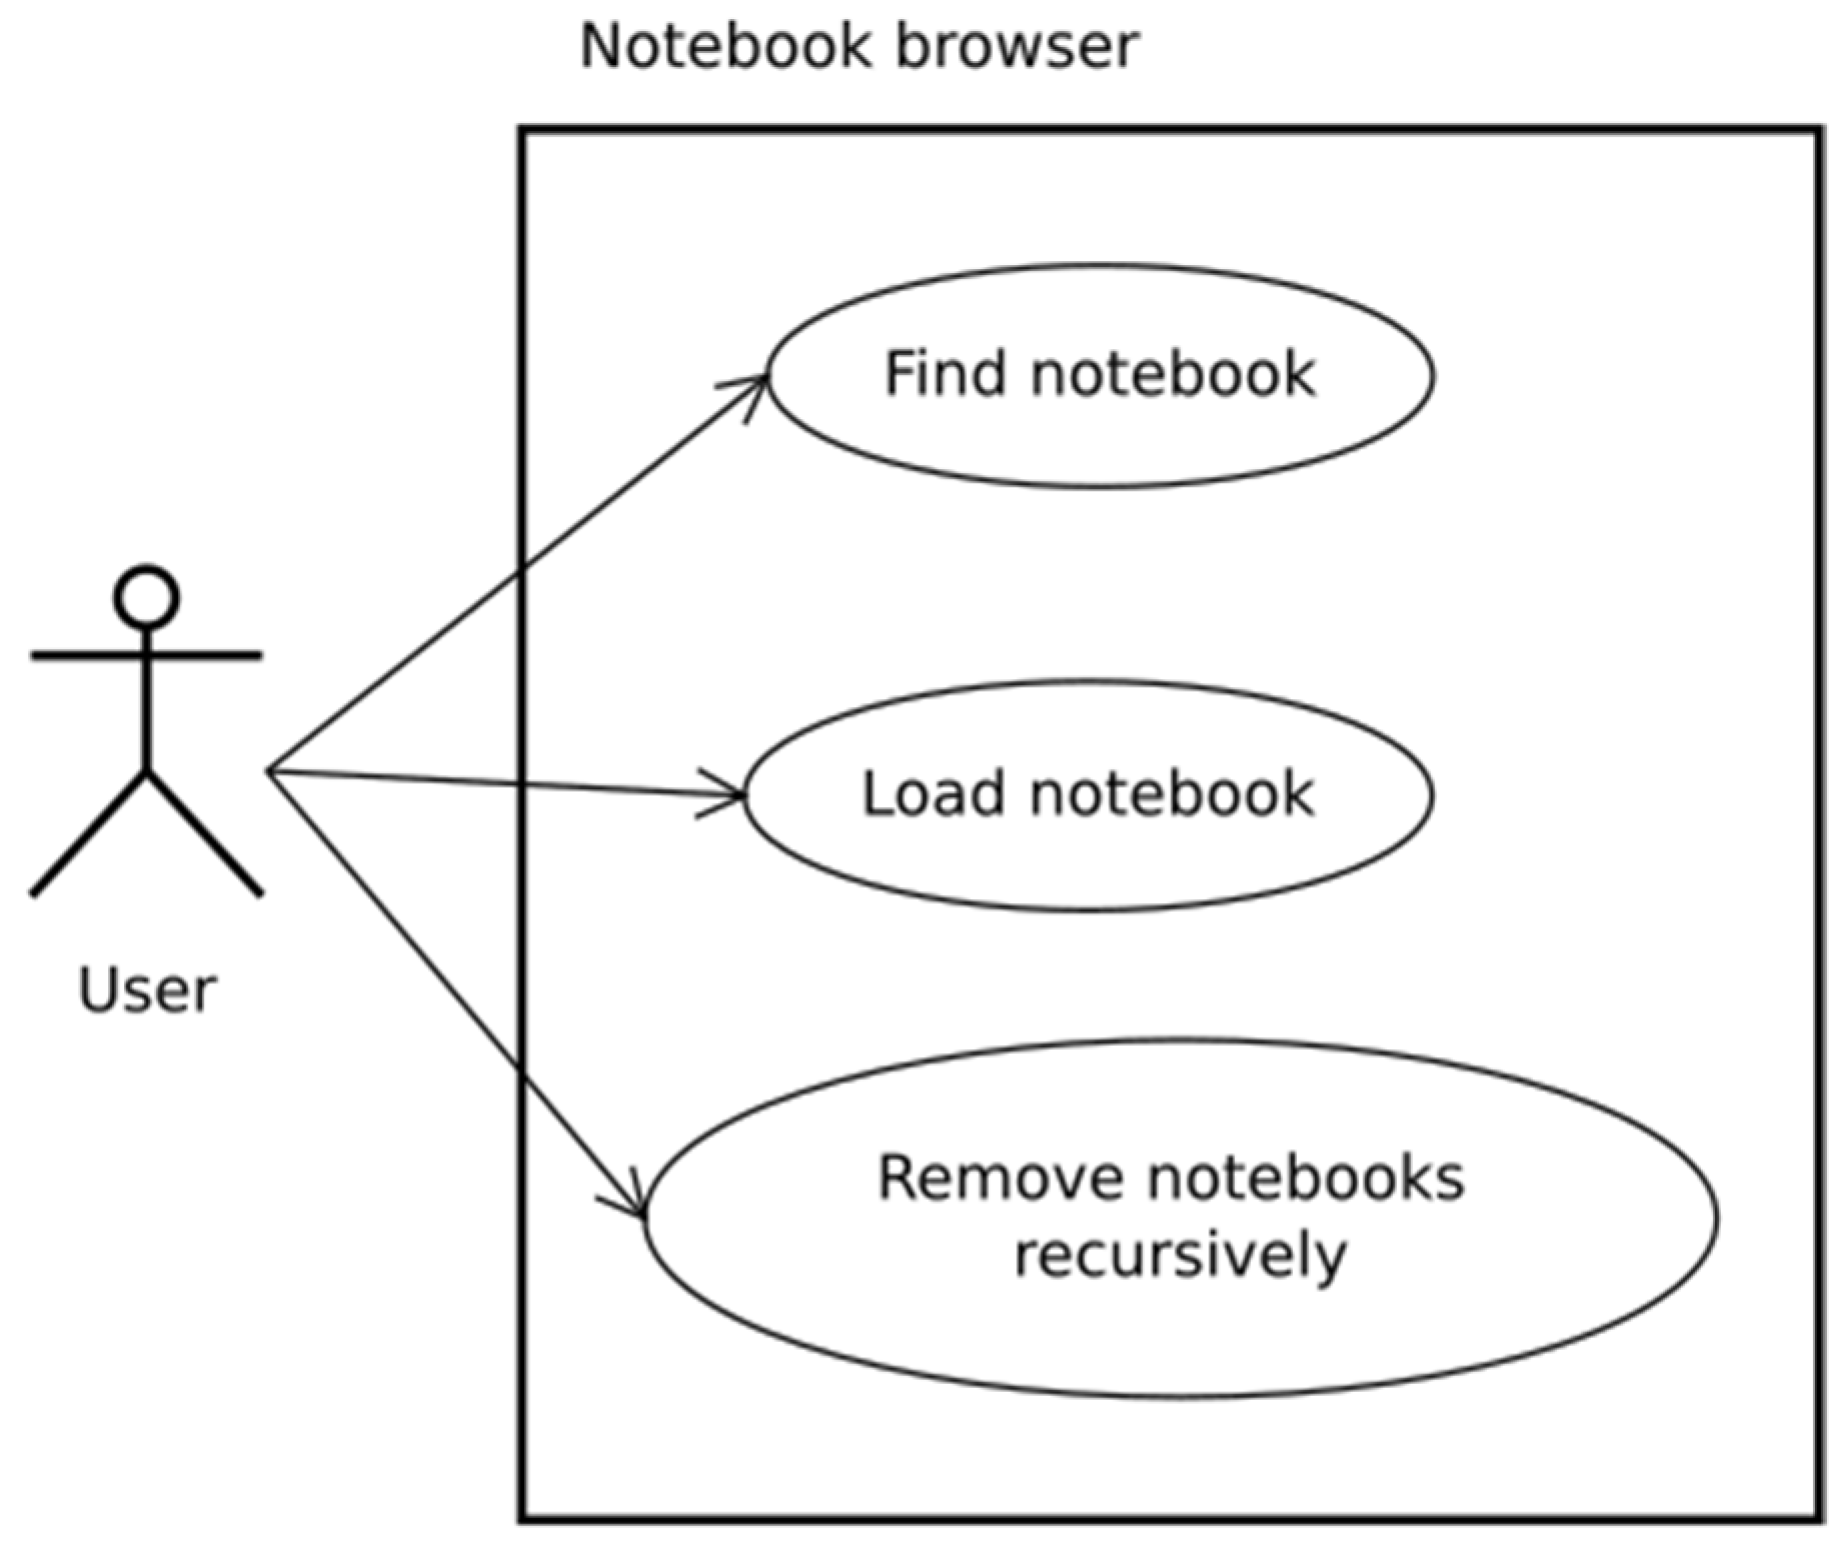
Each Jupytep IDE user gains access to his own remote data storage. That is why all of the most important operations on filesystem are possible, such as upload, download, create new, rename, and delete. Because the user has access to the virtual operating system, he can also run the terminal and perform any operations on the operating system. All these use cases are illustrated in Figure 7. Applications created by users and provided with JupyTEP IDE are stored in form of notebook files (*.ipynb). To make notebook browsing more convenient, one can use the notebook browser, which displays only * .ipynb files. It also allows recursive file deletion (Figure 8). This functionality is not available in standard Jupyter.
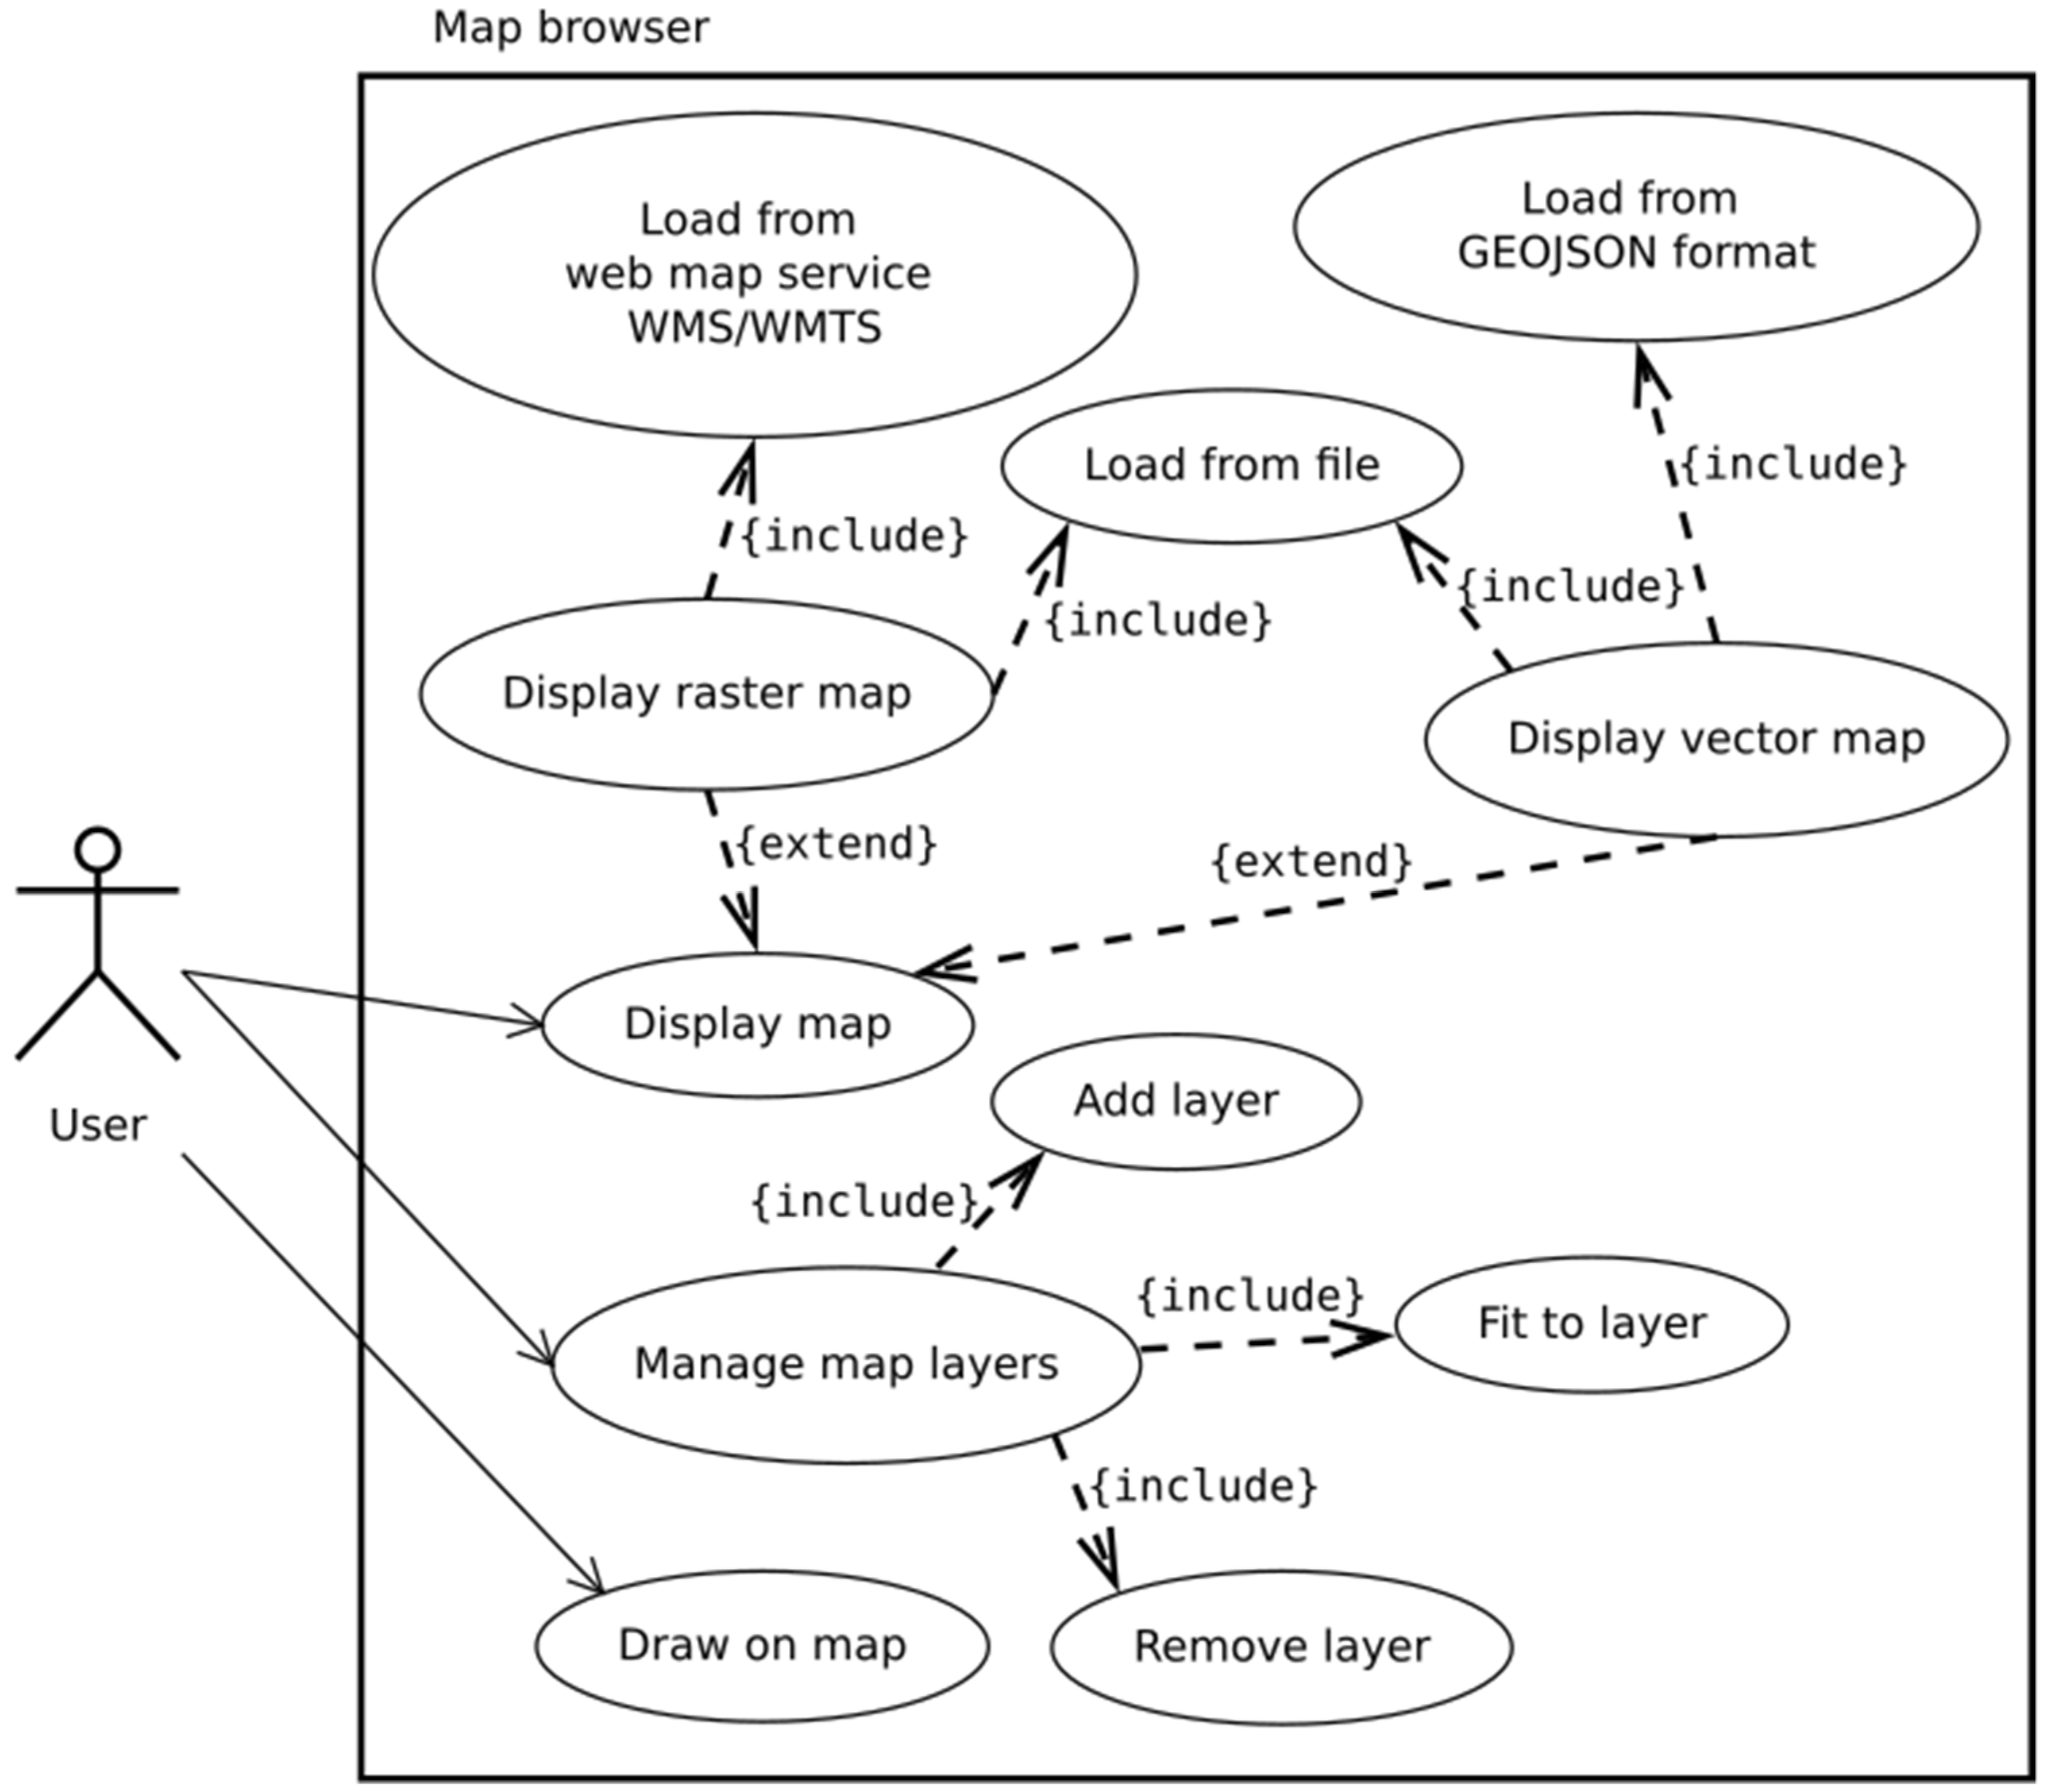
Because JupyTEP IDE is designed for spatial data processing, using a map becomes an important functionality. The user is able to display raster and vector maps, organized into layers in map browser as shown in Figure 9. Layers can be loaded as output data from processing or from external data sources like files or web map services/web map tile service (WMS/WMTS). Furthermore, map browser serves as the output for the Earth observation data search tool, as depicted in use case diagram in Figure 10.
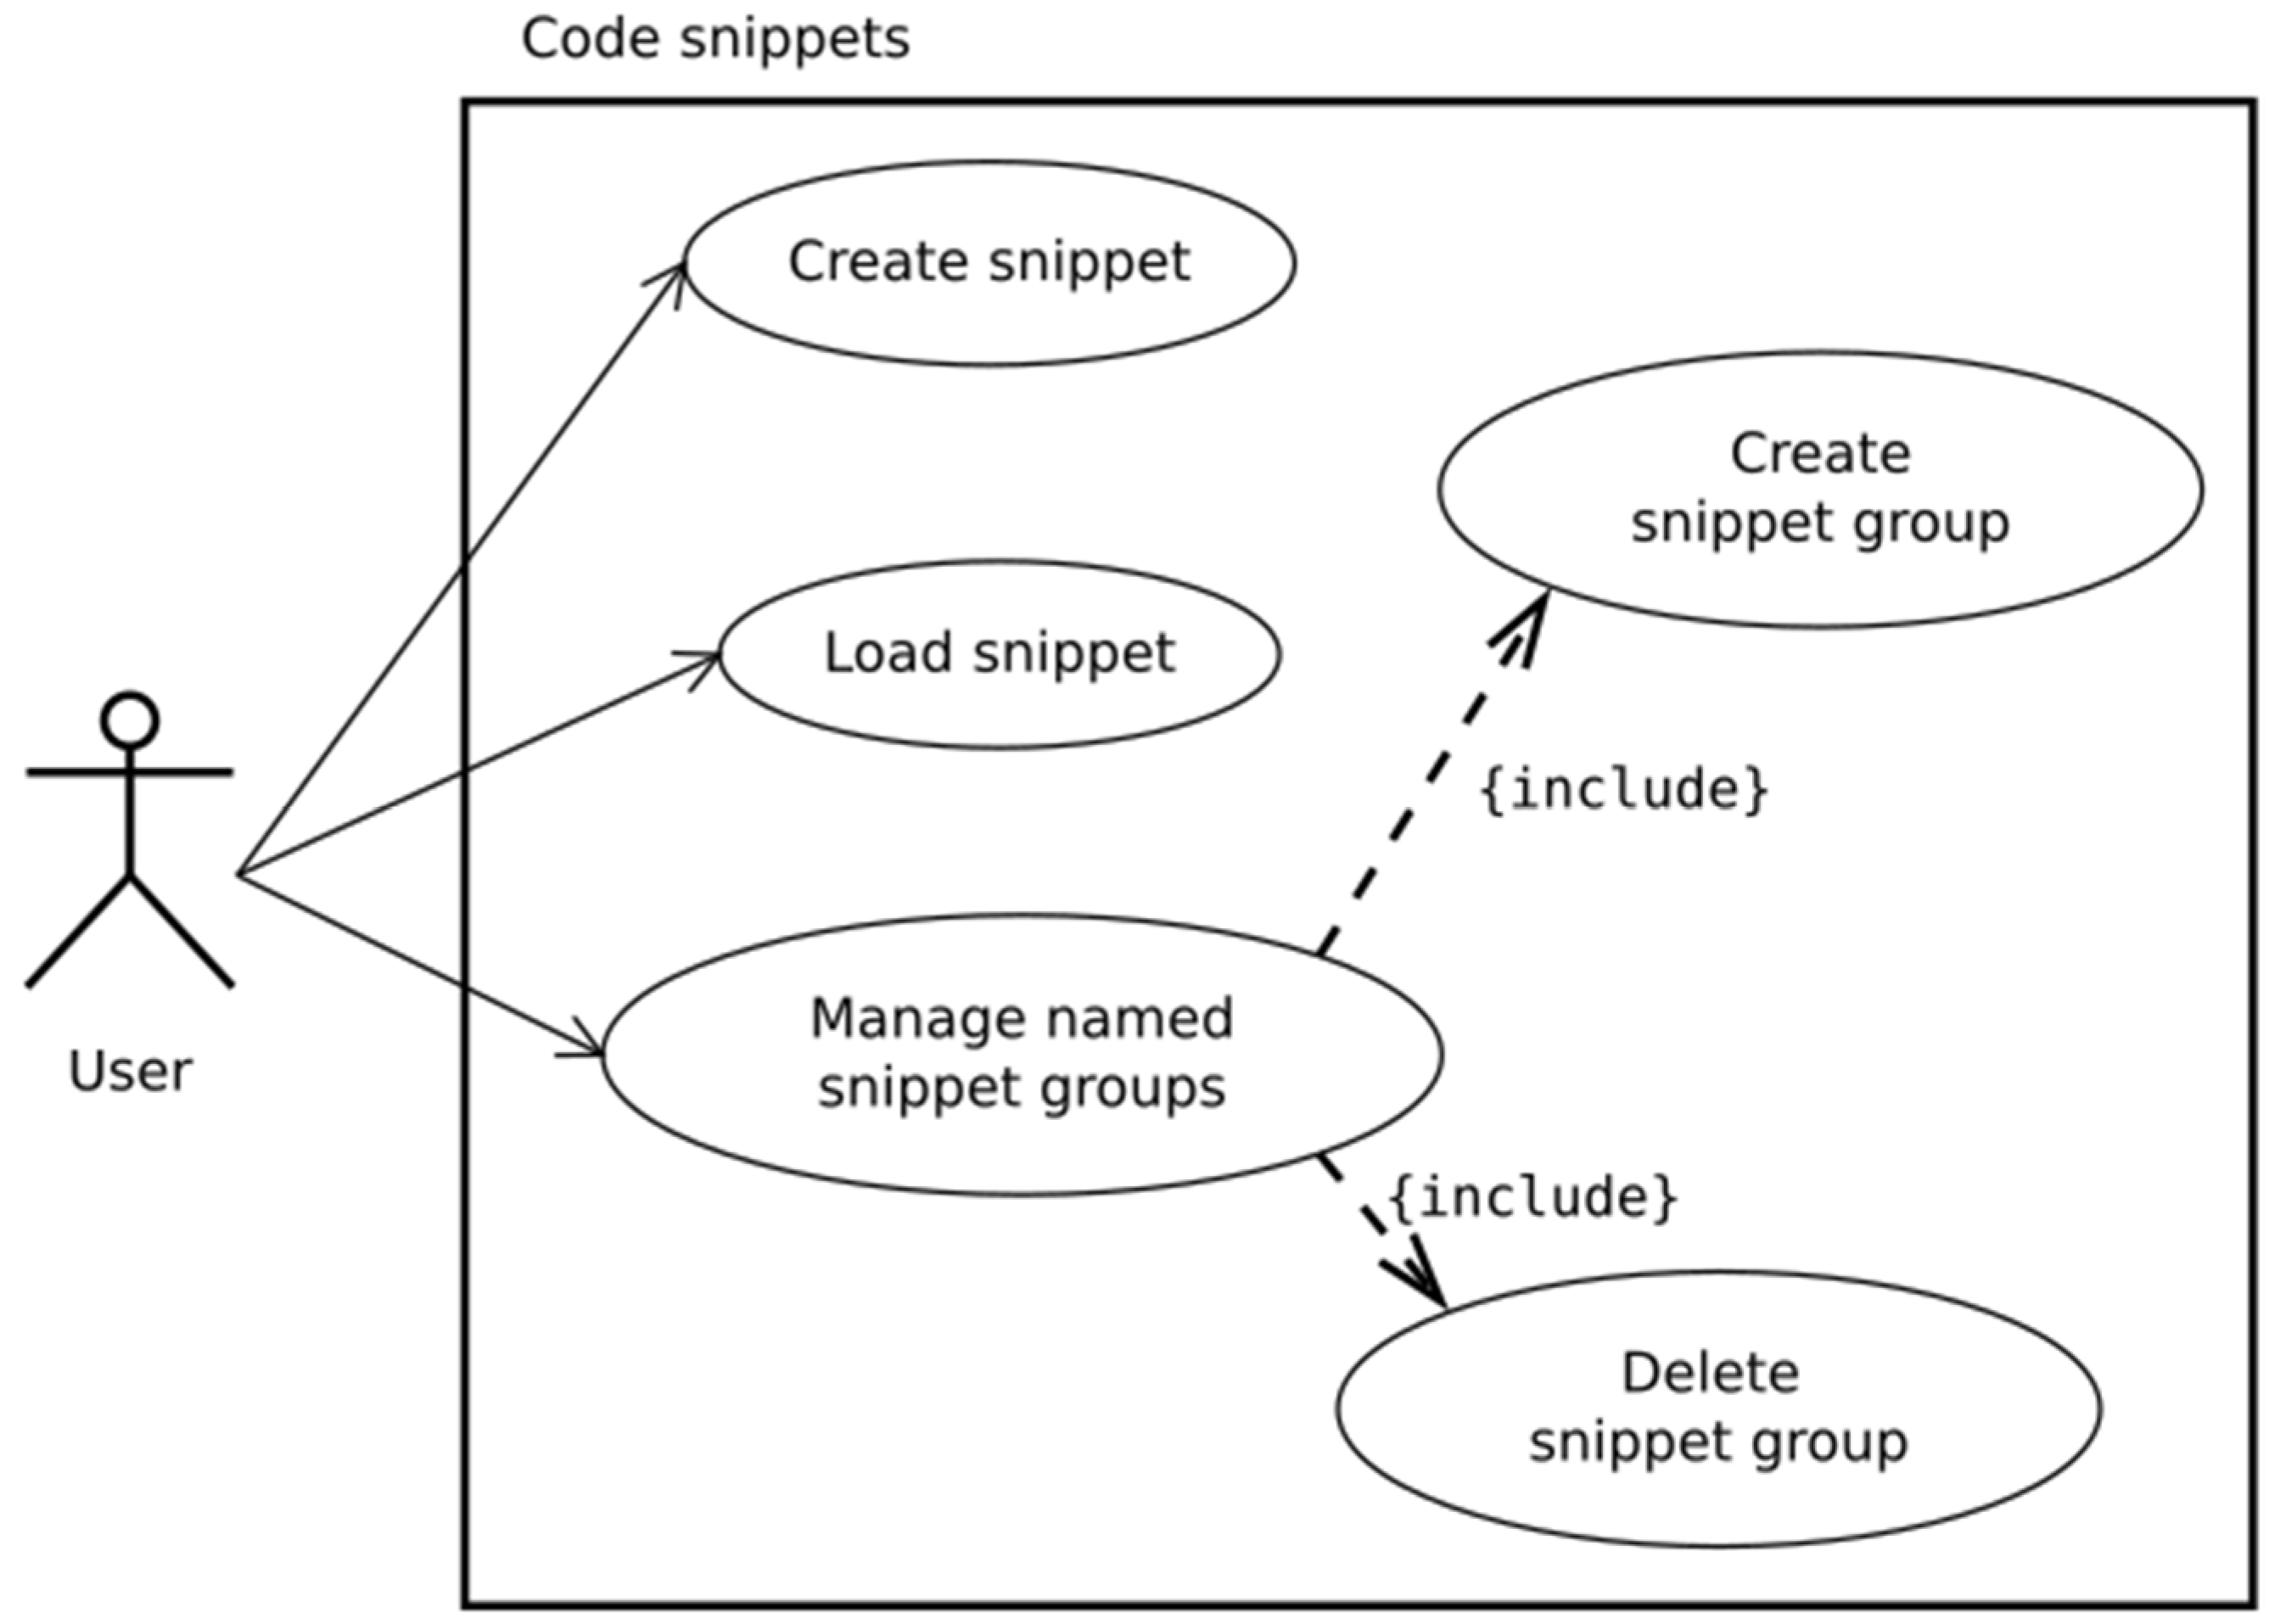
When writing many different programs in the same scope, we often deal with repeating fragments of code or algorithm, or we want to save some code fragments for later use. In such a case, code snippets functionality is very handy. This is also implemented in JupyTEP IDE as shown in Figure 11. JupyTEP IDE comes with working and ready-to-use examples of notebooks and code snippets.
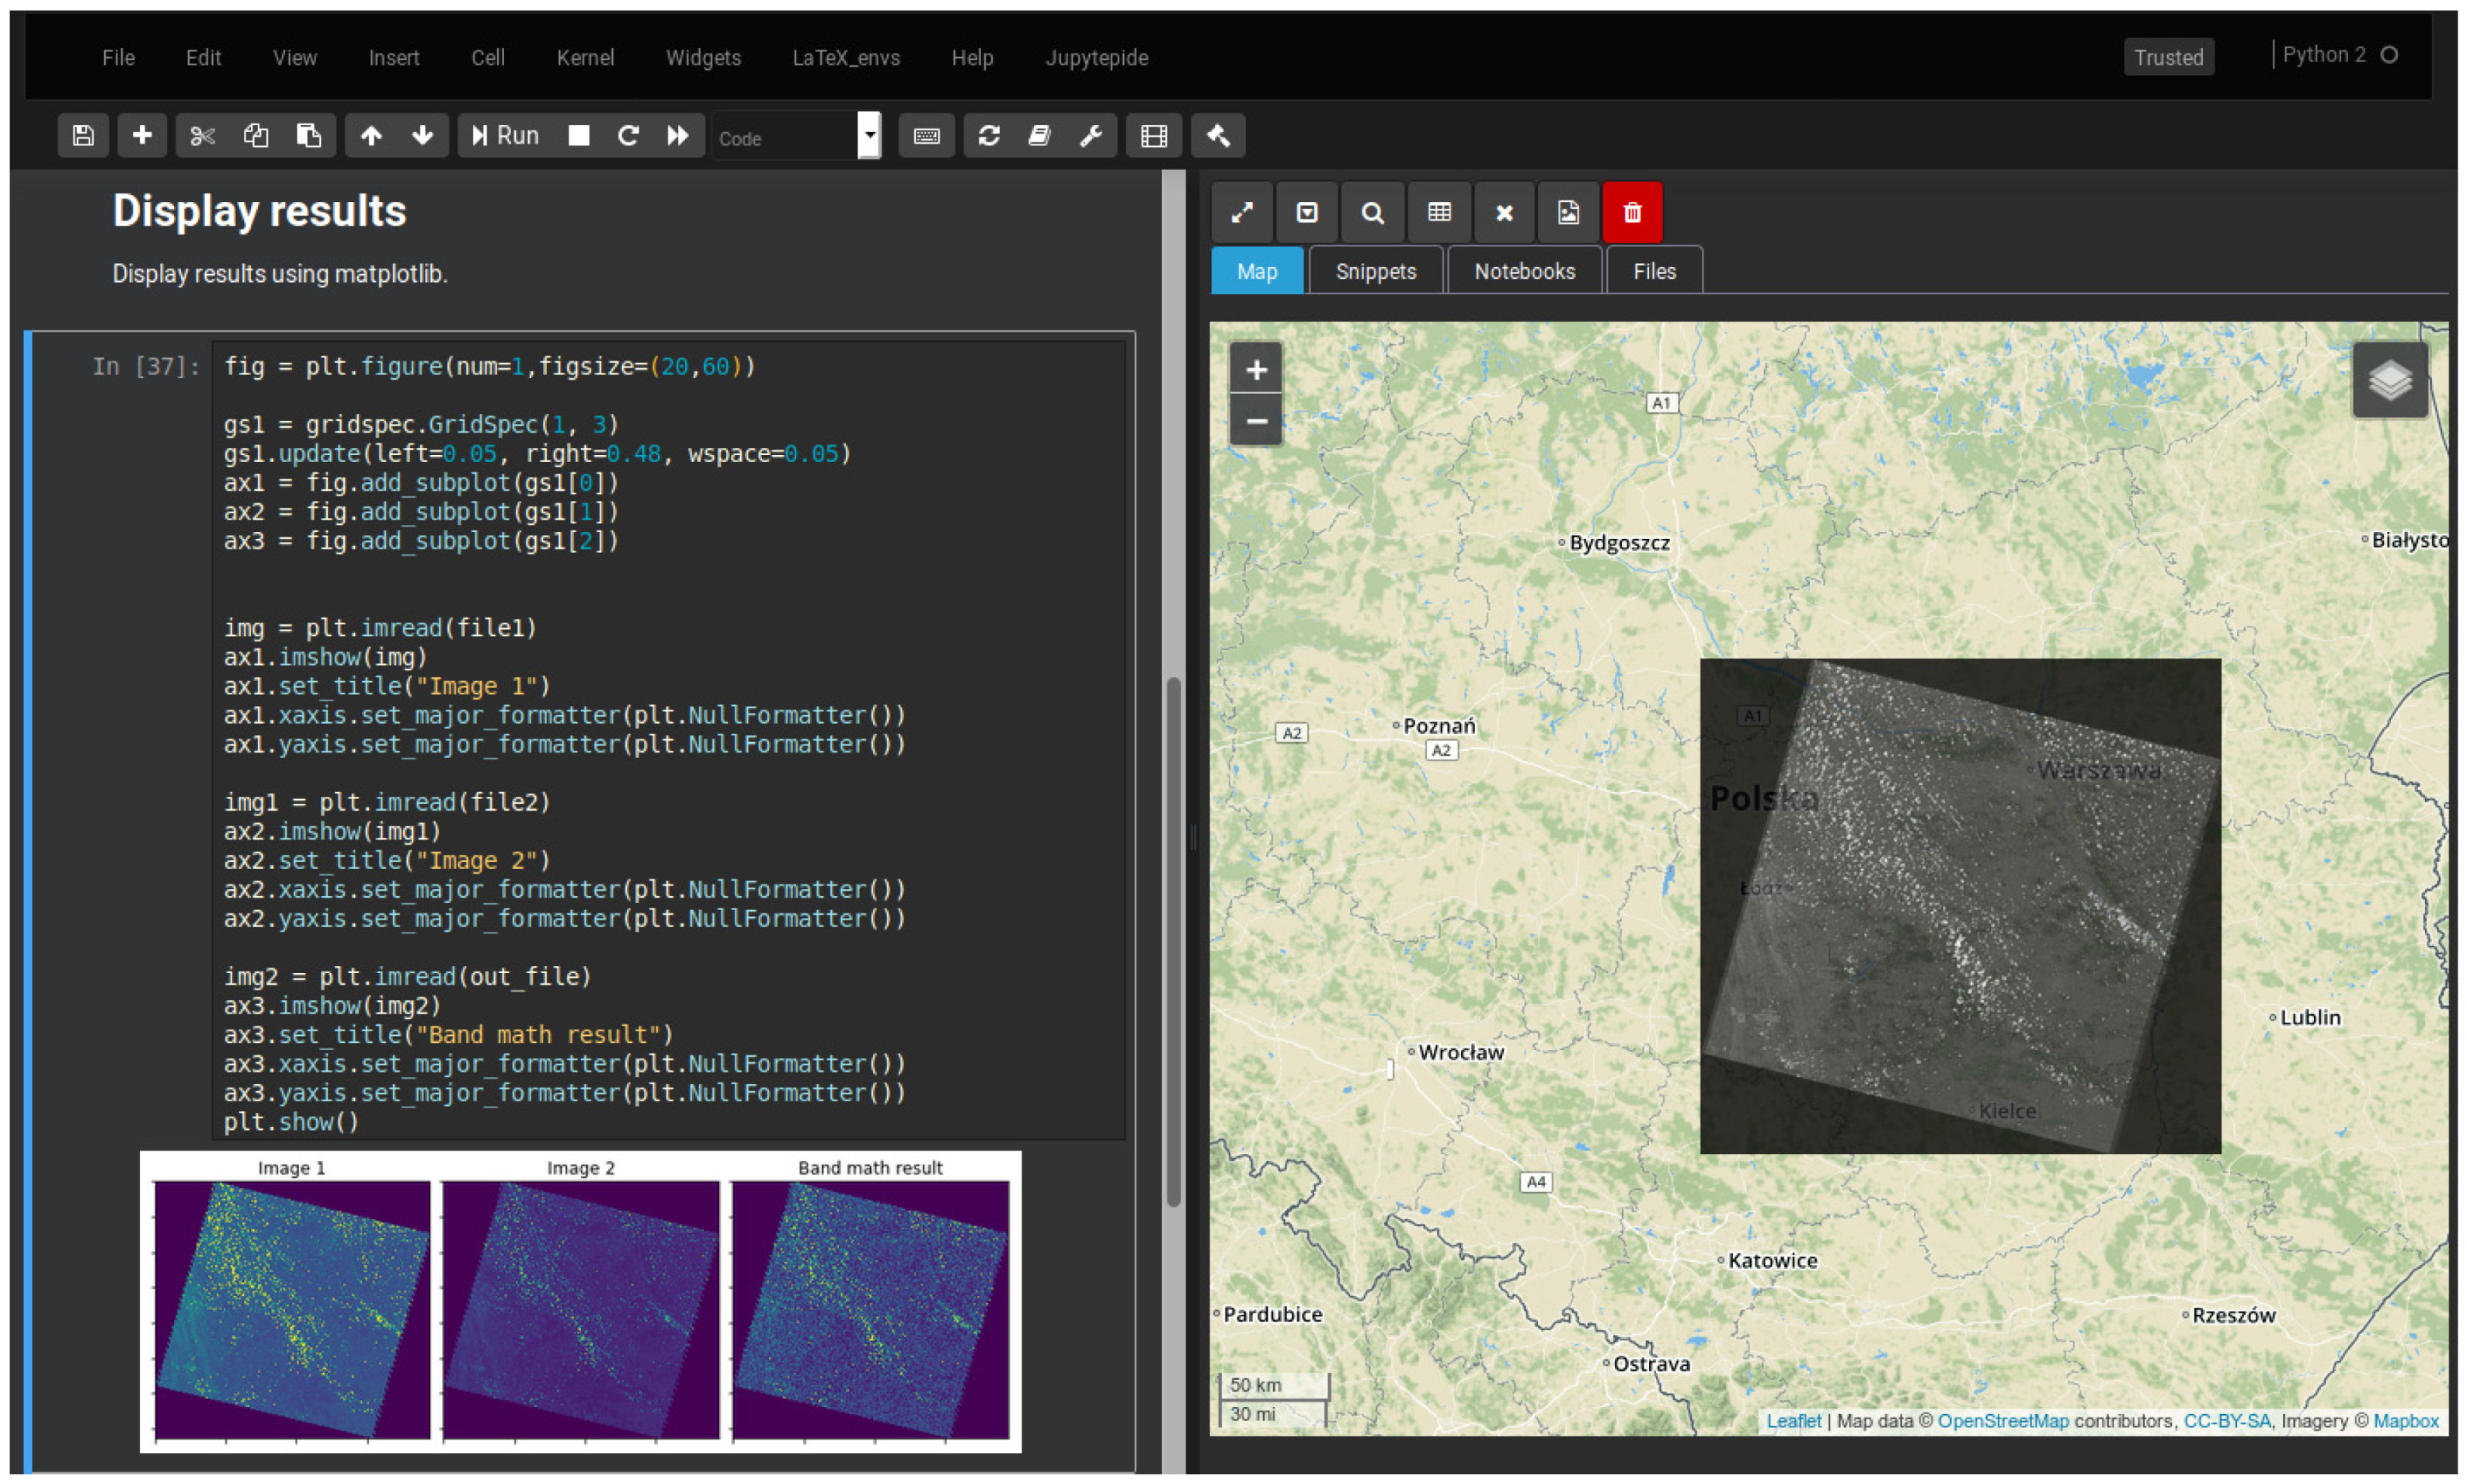
The first steps in the JupyTEP IDE environment involve logging into a JupyTEP IDE account and automatically launching the web service. A user gains access to their own separate virtual environment based on Docker virtualization technology. A fully functional application along with the disk space for data storage is at the user’s disposal (Figure 12). Work can be started by opening one of the many provided notebooks or by creating one’s own script from scratch. Regardless of the chosen programming language, an algorithm can be divided into parts called cells, each of which can be run separately. The created script source code contained in a single cell can be run online by issuing the “run cell” command or pressing the ctrl+Enter combination. It is also possible to run all cells at once as the entire program, depending on the user’s preferences. The processing result from each cell is visible directly below it and is presented in a text or graphic form, depending on what value is given as an output. The program, created in this way, can be saved as a script in a *.ipynb file, whose internal format is JSON. It will be saved to a user’s account and can be launched at any time or downloaded to a desktop computer.
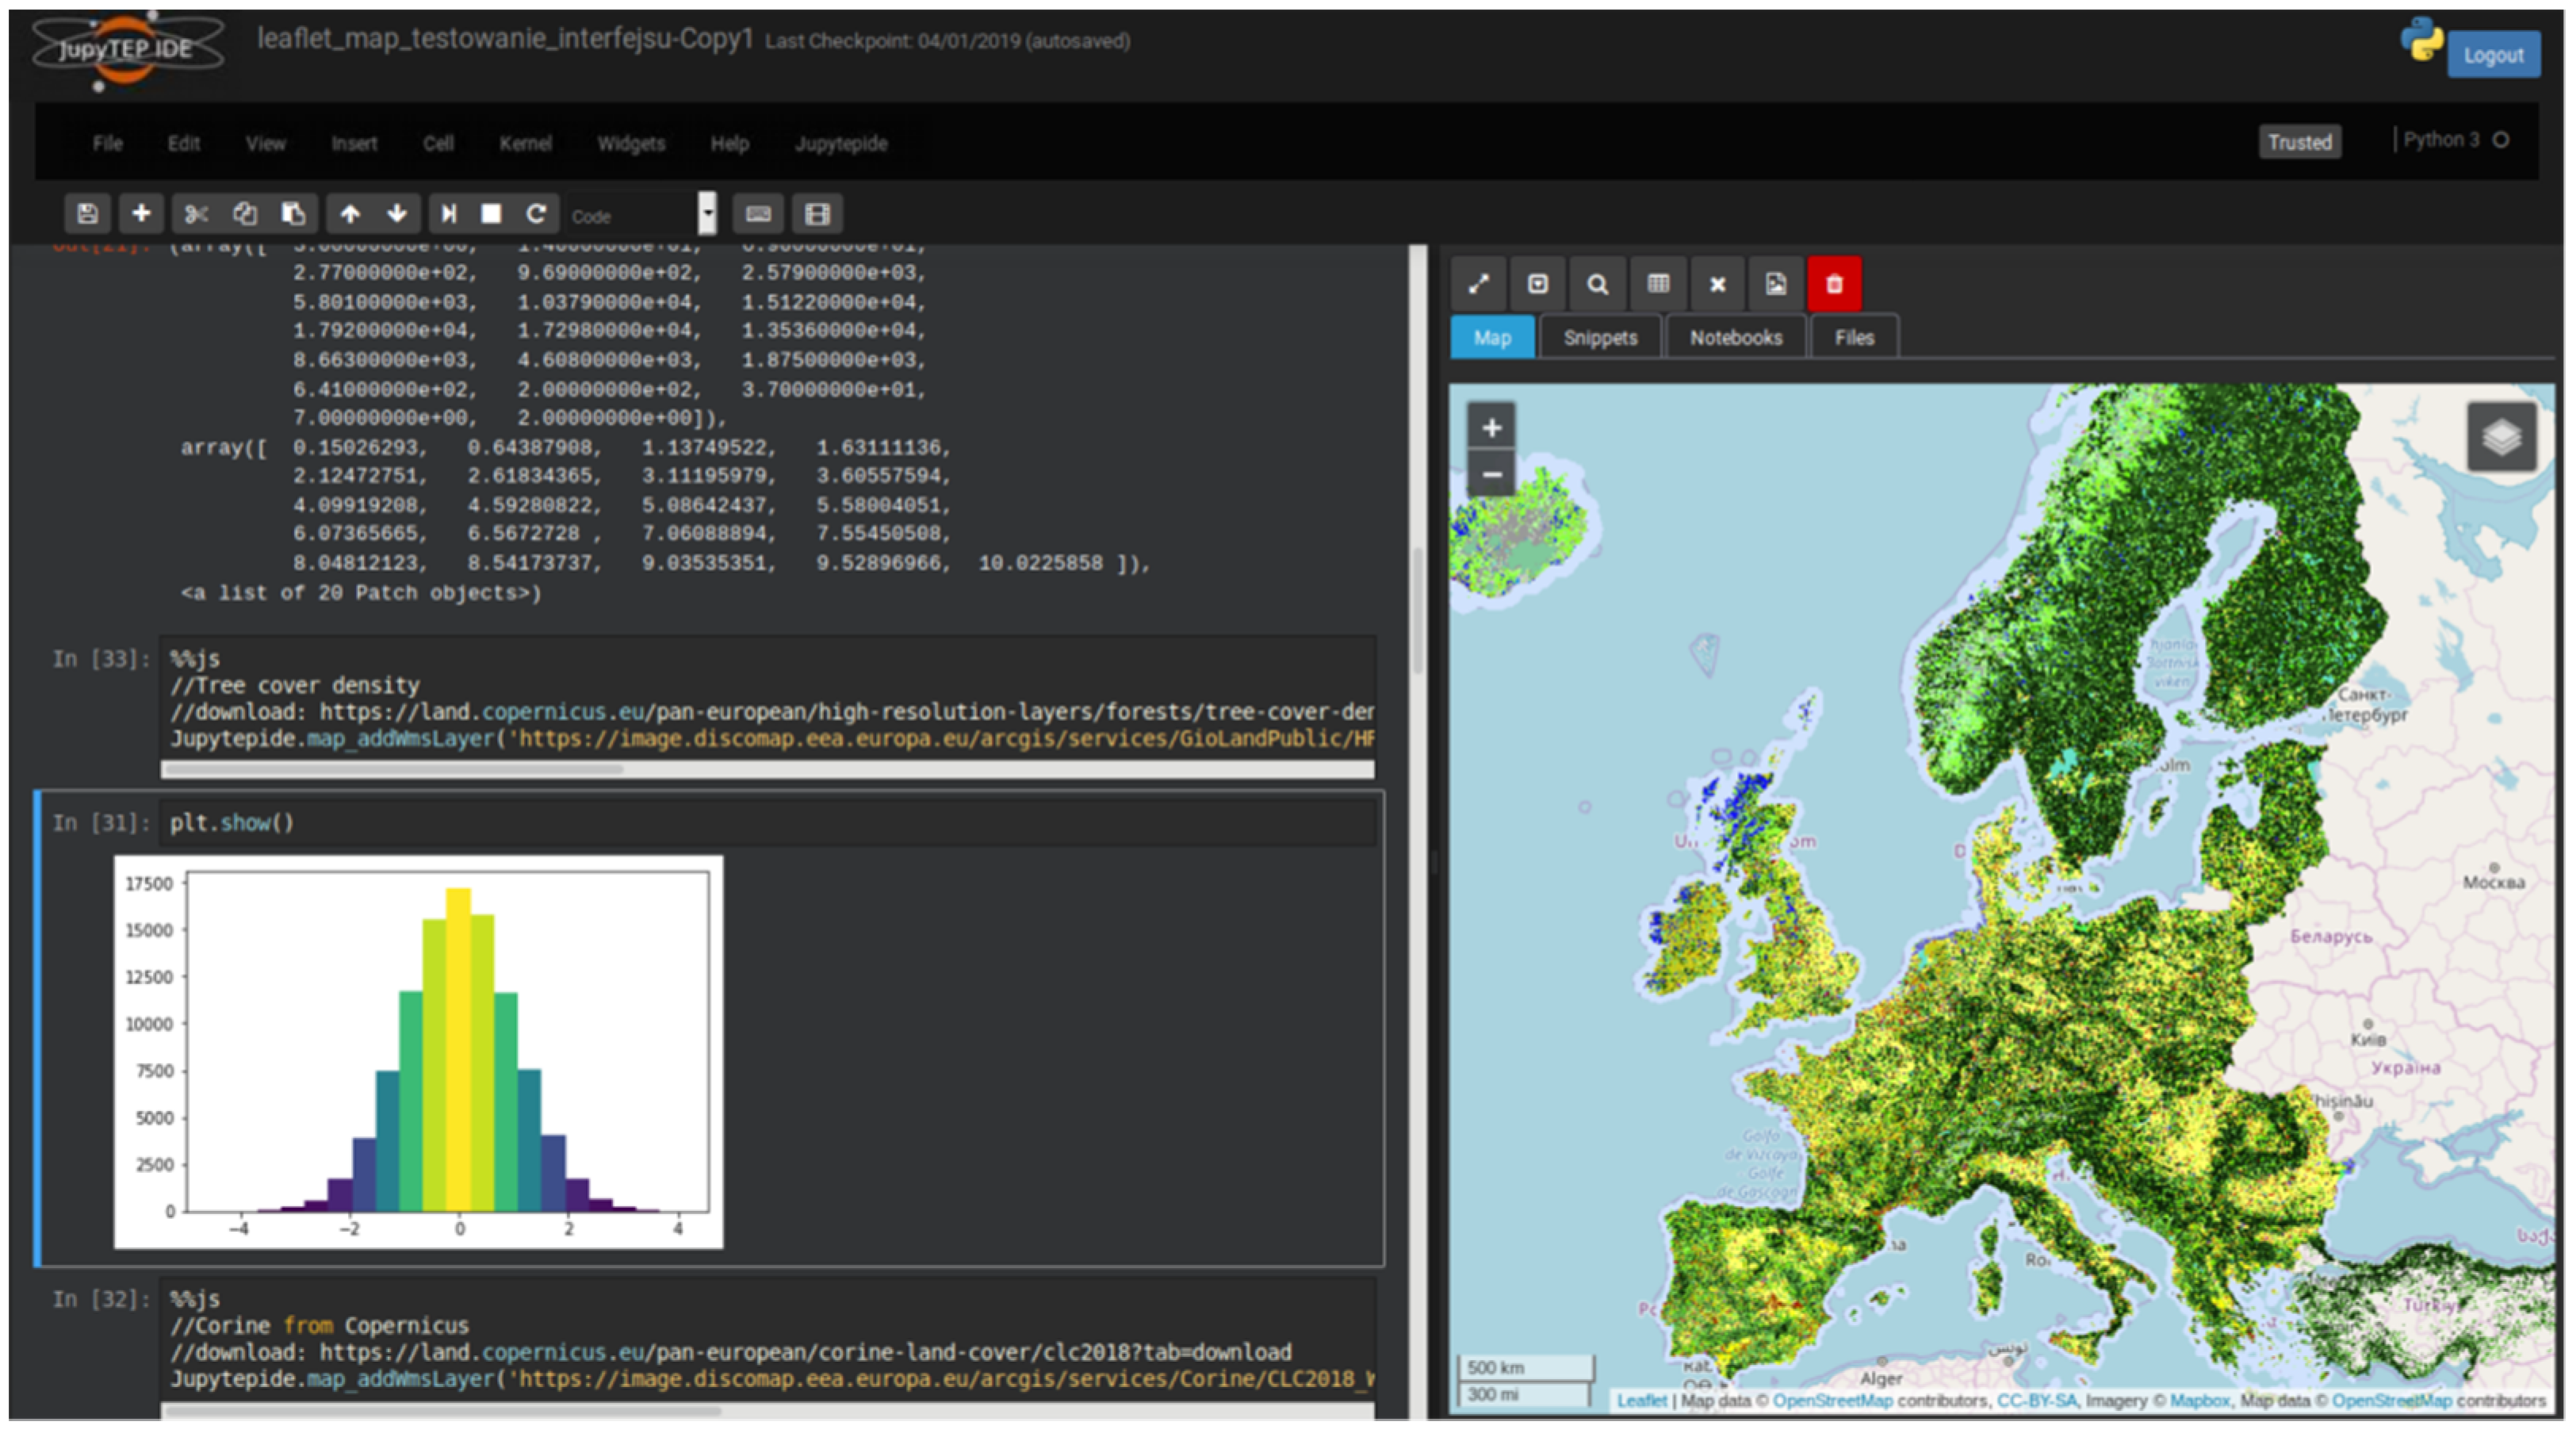
The map component is a feature that distinguishes JupyTEP IDE and adapts it to the needs of the community interested in EO data processing. The side panel on the right side of the screen is divided into tabs. One of them provides a map, which allows the user to search for a particular EO product and to automatically present the results of the processing. Its functionality has been taken from popular GIS systems. Thus, any result of the algorithm in the form of spatial data can be added to a map on an ongoing basis. These can be raster data formats such as PNG, JPG, BMP, vector formats such as GeoJSON, or services such as TMS or WMS (Figure 13B). A user has an option to create, launch, and share their own WPS service, which processes data and sends results to a specific location or to use the results of data processing services from other providers.
Another useful feature of JupyTEP IDE is the ability to create code snippets that can be reused at any time. A user can find a set of pre-prepared snippets in the “Snippets” tab on the side panel (Figure 13A).
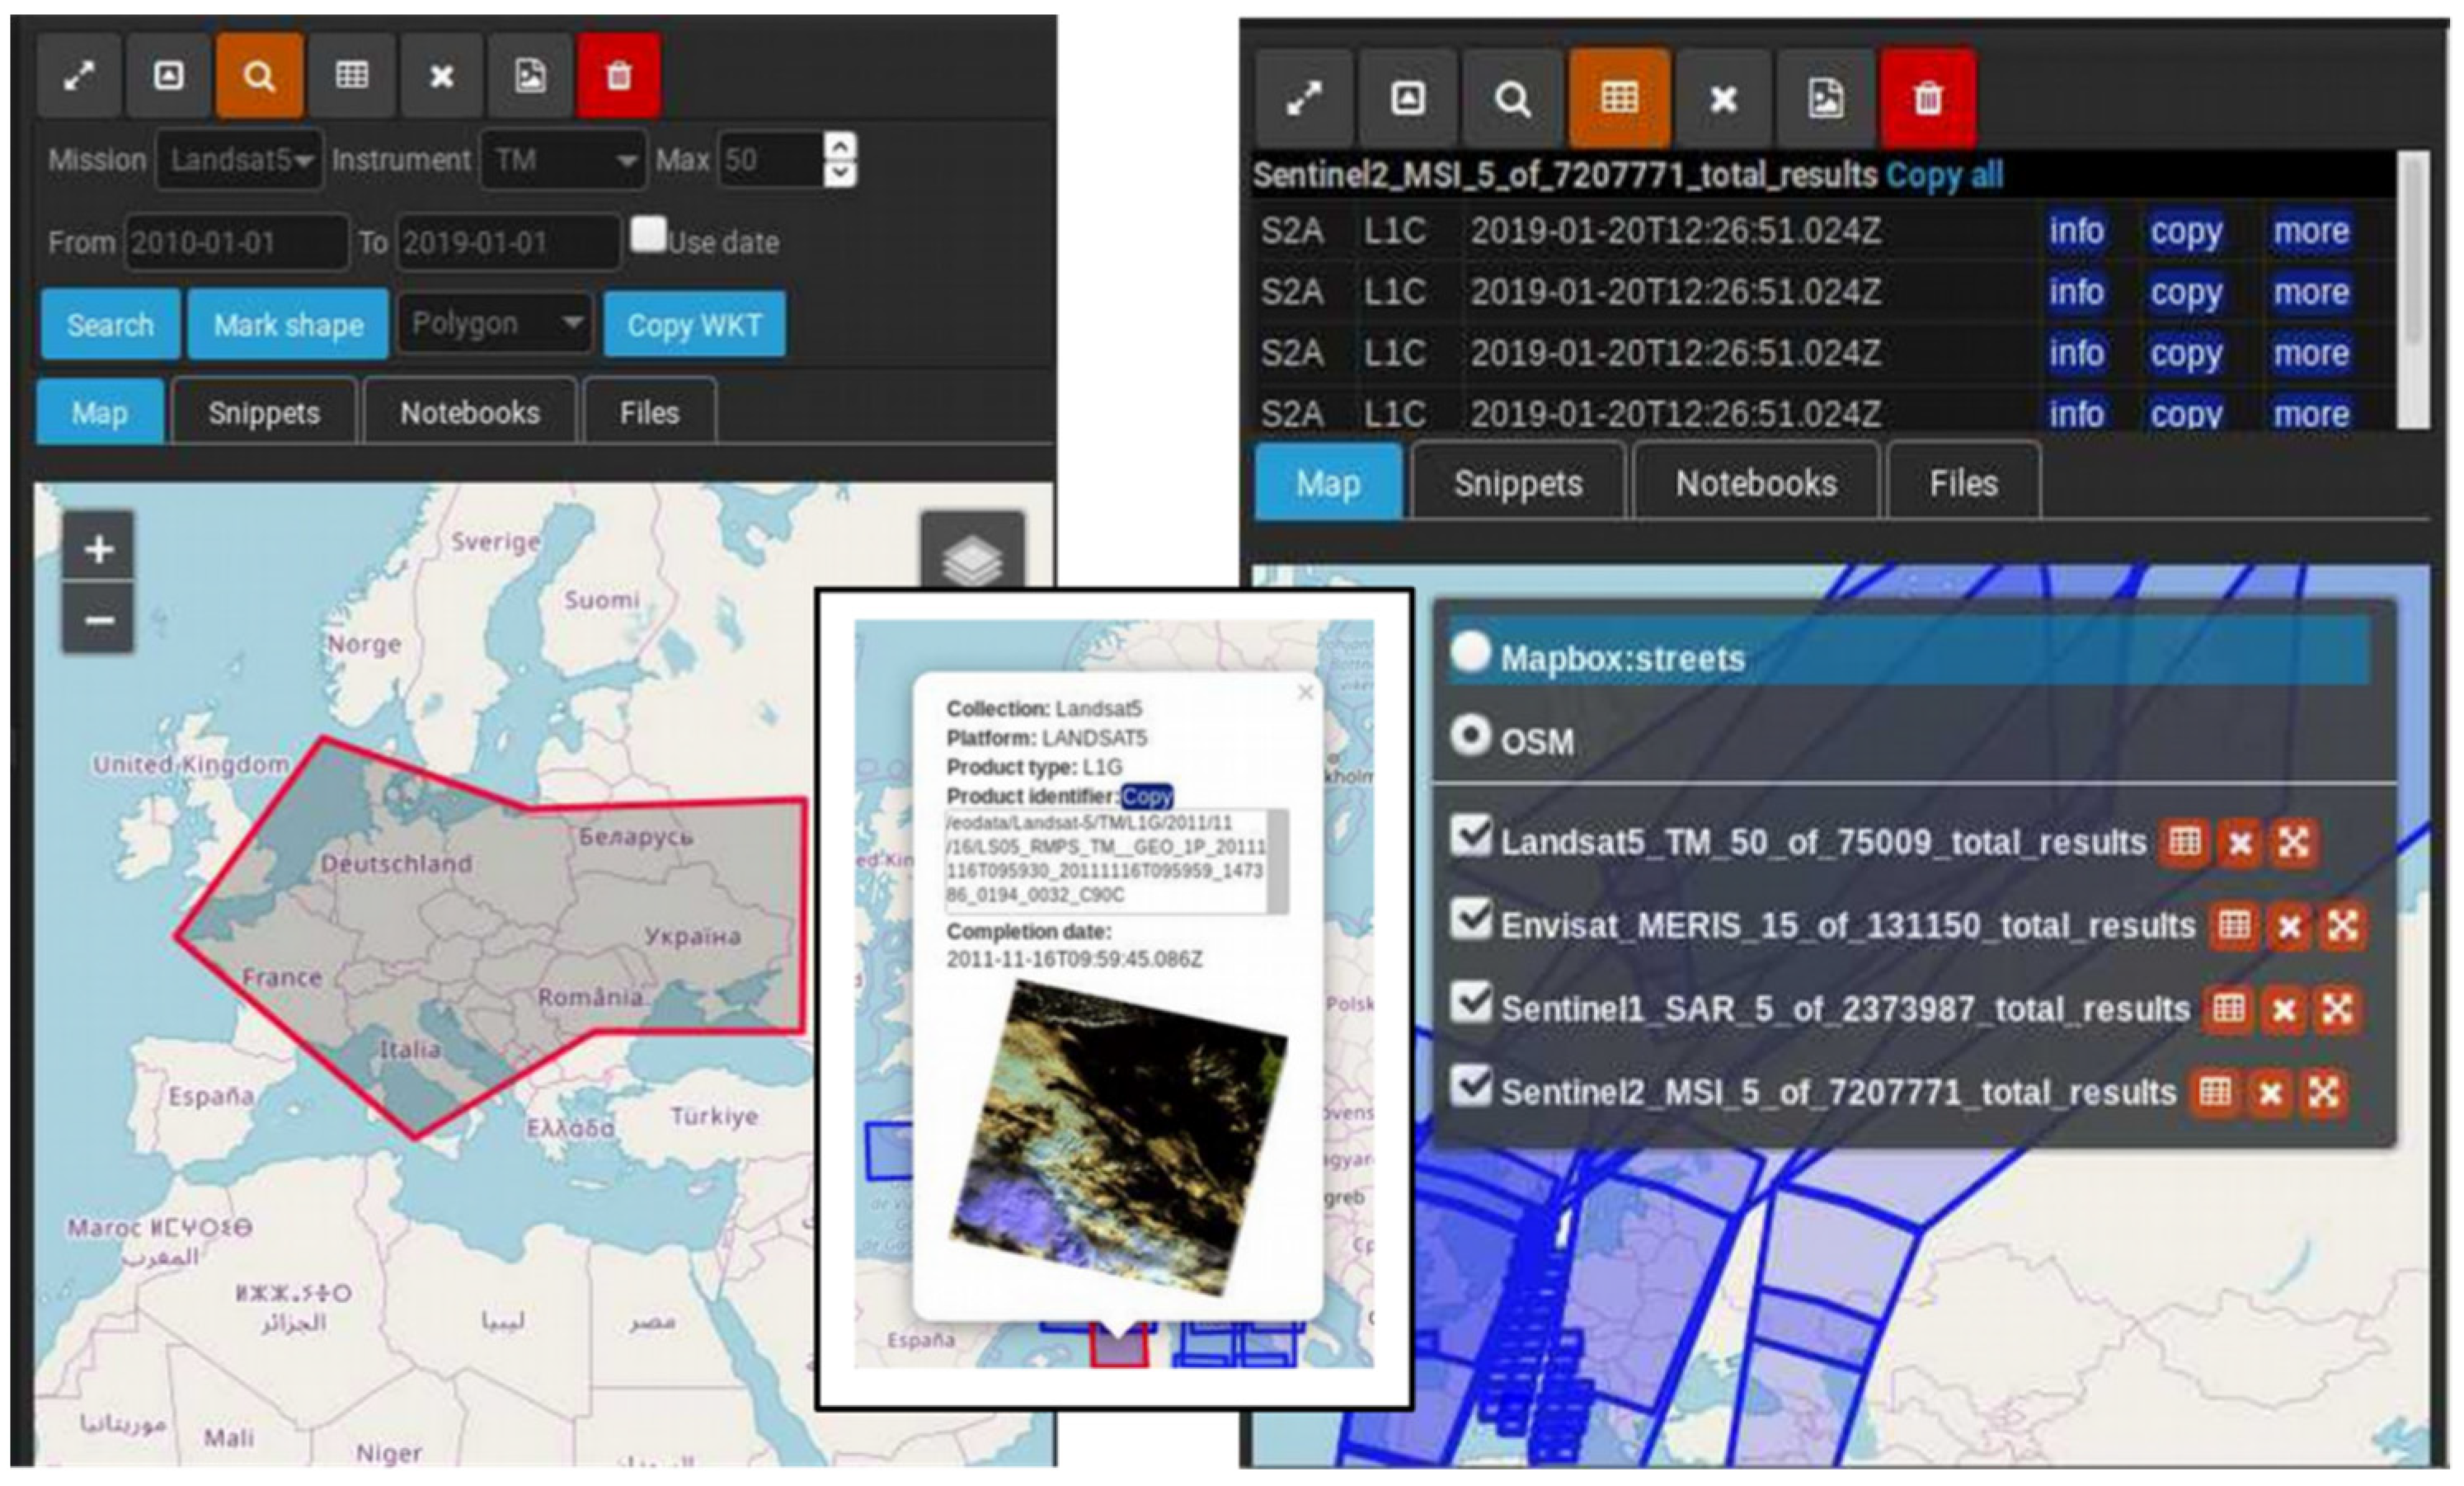
JupyTEP IDE also provides the possibility to search spatial data services by using functions located in the side panel toolbar. After selection of the area of interest and entering search parameters (such as mission, sensor, time span, etc.), a user will obtain a result in the form of a list of products. The coverage of these products is visualized as a graphical layer on the map. Each product has attributes that allow it to read metadata of the material and download or connect it to one’s own algorithm (Figure 14).
As already mentioned, a user of JupyTEP IDE gets their own virtual environment, which gives the possibility of quite an extensive interference and control over the installed software components. It is possible to switch to the terminal view at any time, which gives direct access to the virtual system shell. One can add or remove libraries or Python packages on which JupyTEP IDE is based and customize the system’s functionality to suit the user’s needs. A user can also make other changes within the installed applications or additions to the system platform itself and configure it for strictly defined needs. JupyTEP IDE has a built-in text editor through which a user can make changes to any file saved on their account. All files can be freely downloaded, placed on the server, or shared with other users.
Example of Processing Chain
For the purpose of JupyTEP IDE functionality, an example of a simple band math operation with its visualization is presented below. The results are presented in Figure 15. In [1] and Out [1]: Statements in the code stands for input and output IPython/Jupyter cells, respectively. In the algorithm, we have omitted obvious operations like importing standard libraries, preparing plots using matplotlib, etc.
![Remotesensing 11 01973 i001]()

4. Discussion
Taking into account the initial assumptions, our team have managed to develop software that meets all the project requirements. The above-mentioned assumptions are a result of the analysis of existing solutions and possibilities found in the open-source software and ESA/ESRIN recommendations.
We have obtained interoperability, integration with existing data sources and interfaces, reusability, parallelization in processing, multi-tenancy, and scalability of the created solution.
As benefits of our work we can mention:
- Easy and user-friendly entry point for everyone who want to process the EO data,
- Development environment that allows fast prototyping with use of EO data,
- Predefined environment with most of popular EO data processing tools pre-installed,
- Fast and easy access to wide range of EO data,
- Flexible “on-the-fly” environment customization and modification of any library and programming language for specific user purposes,
- Real time visualization of processing results.
- The proposed solution, due to the complex nature of both EO data and infrastructure, has its limitations, which are, among others:
- Quite large amount of resources necessary to process EO data,
- Costs of infrastructure of DIAS-es or any other commercial clouds.
After talks with representatives of all European DIAS-es, JupyTEP IDE will be integrated with all of them starting from Onda and Mundi. Right now, it is present on CreoDIAS, to which we are planning to migrate from IPT infrastructure. Following the latest trends, in the near future, we plan to develop several new functionalities enhancing services and performance (migration to JupyterLab, integration with Data Cubes, new modules, and tools).
5. Conclusions
JupyTEP IDE aims to be an all-in-one cloud online software tht integrates the most common open-source EO-based geospatial tools, software, libraries, and toolboxes for EO data (SNAP, OTB), vector and raster data processing (GRASS GIS, GDAL, PostGIS, etc.), visualization, and presentation in the most suitable form. Based on the Jupyter approach and extended Python environment integrated with a Docker ecosystem prerogative, it allows for interconnection with most of the existing services (WPS, WMS, TEP interfaces) and tools for geospatial data storage and distribution (PostGIS, GeoServer, Mapnik, etc.). JupyTEP IDE based on the configuration, customization, adaptation, and extension of Jupyter and Docker Swarm components provides highly configured and optimized software for any EO cloud infrastructure. It allows for the development of EO data processing tasks with high performance to be put in place without the need for data transfer.
The use of open source gives a great deal of freedom to expand and configure a created solution. This is thanks to the variety of available open-source software. Moreover, JupyTEP IDE user is able to fully configure his environment and easily add or remove components. JupyTEP IDE combines the capabilities of a cloud-based application with full access to the configuration of the platform on which it operates. This gives users great freedom in configuring their own research environment that is compliant with their requirements. It can be concluded that the most important advantages of JupyTEP IDE are:
- JupyTEP IDE provides the online environment for EO oriented programming.
- JupyTEP IDE provides ready-to-use algorithms (notebooks and snippets) for EO data processing.
- Different programming languages can be used, even in the same application (notebook).
- Direct access to data and information access services (DIAS).
- Access to the virtual machine shell (Ubuntu). User can configure it according to his needs (e.g., install/uninstall software or packages, configure services, etc.)
- JupyTEP IDE virtual machine account can be used in exactly the same way as any other hosted virtual operating system, which is why it performs similarly to an operating system installed locally on user’s hardware.
JupyTEP IDE is intended for advanced users since, due to the programming-based approach, it offers immense opportunities to work with, process, and modify data. Thanks to the OS shell access, it is also very flexible and highly configurable. Although it is an online tool placed in a virtual operating system and accessible via a web browser, working with it is similar to working with a desktop application.
Author Contributions
Conceptualization, J.R., M.B. and D.Z.; methodology, J.R., M.B. and D.Z.; software, J.R., M.B. and D.Z.; resources, D.Z.; writing—original draft preparation, J.R., M.B.; writing—review and editing, J.R.; visualization, M.B.; supervision, J.R.; project administration, D.Z.; funding acquisition, D.Z.
Funding
This research was funded by European Space Agency, contract number ESA 4000120770/17/I-EF.
Acknowledgments
The JupyTEP IDE platform is the result of “JupyTEP IDE—Jupyter-based IDE as an interactive and collaborative environment for the development of notebook style EO algorithms on Network of Exploitation Platforms infrastructure” project (contract number ESA 4000120770/17/I-EF). Test version of the platform is available at https://jupyteo.com.
Conflicts of Interest
The authors declare no conflict of interest. The funders had no role in the design of the study; in the collection, analyses, or interpretation of data; in the writing of the manuscript, or in the decision to publish the results.
References
- Merchant, C.J.; de Leeuw, G.; Wagner, W. Selecting algorithms for Earth observation of climate within the European Space Agency Climate Change Initiative: Introduction to a special issue. Remote Sens. Environ. 2015, 162, 239–241. [Google Scholar] [CrossRef]
- Denis, G.; de Boissezon, H.; Hosford, S.; Pasco, X.; Montfort, B.; Ranera, F. The evolution of Earth Observation satellites in Europe and its impact on the performance of emergency response services. Acta Astronaut. 2016, 127, 619–633. [Google Scholar] [CrossRef]
- Hoyos, U.D.; Urien, A.L.; Noriega, A.T.; Gil, C.S.; Huarte, L.A.; Labiano, R.C.; del Barrio-Arellano, F. Aplicación de imágenes Sentinel-1 y Sentinel-2 en la detección y delineación de información de crisis de desastres naturales en el marco de los servicios Copernicus EMS. Rev. Teledetec. Rev. Asoc. Esp. Teledetec. 2017, 49–57. [Google Scholar] [CrossRef]
- Dong, J.; Xiao, X.; Menarguez, M.A.; Zhang, G.; Qin, Y.; Thau, D.; Biradar, C.; Moore, B. Mapping paddy rice planting area in northeastern Asia with Landsat 8 images, phenology-based algorithm and Google Earth Engine. Remote Sens. Environ. 2016, 185, 142–154. [Google Scholar] [CrossRef] [PubMed] [Green Version]
- Lobell, D.B.; Thau, D.; Seifert, C.; Engle, E.; Little, B. A scalable satellite-based crop yield mapper. Remote Sens. Environ. 2015, 164, 324–333. [Google Scholar] [CrossRef]
- Patel, N.N.; Angiuli, E.; Gamba, P.; Gaughan, A.; Lisini, G.; Stevens, F.R.; Tatem, A.J.; Trianni, G. Multitemporal settlement and population mapping from Landsat using Google Earth Engine. Int. J. Appl. Earth Obs. Geoinf. 2015, 35, 199–208. [Google Scholar] [CrossRef] [Green Version]
- Hansen, M.C.; Potapov, P.V.; Moore, R.; Hancher, M.; Turubanova, S.A.; Tyukavina, A.; Thau, D.; Stehman, S.V.; Goetz, S.J.; Loveland, T.R.; et al. High-Resolution Global Maps of 21st-Century Forest Cover Change. Science 2013, 342, 850–853. [Google Scholar] [CrossRef] [PubMed] [Green Version]
- Fernández, L.; Hagenrud, H.; Zupanc, B.; Laface, E.; Korhonen, T.; Andersson, R. Jupyterhub at the ESS. An Interactive Python Computing Environment for Scientists and Engineers. In Proceedings of the 7th International Particle Accelerator Conference (IPAC2016), Busan, Korea, 8–13 May 2016. [Google Scholar]
- Zuhlke, M.; Fomferra, N.; Brockmann, C.; Peters, M.; Veci, L.; Malik, J.; Regner, P. SNAP (Sentinel Application Platform) and the ESA Sentinel 3 Toolbox; L. Ouwehand: Venice, Italy, 2015; Volume 734, p. 21. [Google Scholar]
- Grizonnet, M.; Michel, J.; Poughon, V.; Inglada, J.; Savinaud, M.; Cresson, R. Orfeo ToolBox: open source processing of remote sensing images. Open Geospatial Data Softw. Stand. 2017, 2, 15. [Google Scholar] [CrossRef] [Green Version]
- Warmerdam, F. The Geospatial Data Abstraction Library. In Open Source Approaches in Spatial Data Handling; Hall, G.B., Leahy, M.G., Eds.; Advances in Geographic Information Science; Springer: Berlin/Heidelberg, Germany, 2008; ISBN 978-3-540-74831-1. [Google Scholar]
- Gorelick, N.; Hancher, M.; Dixon, M.; Ilyushchenko, S.; Thau, D.; Moore, R. Google Earth Engine: Planetary-scale geospatial analysis for everyone. Remote Sens. Environ. 2017, 202, 18–27. [Google Scholar] [CrossRef]
- Navarro, J.A. First Experiences with Google Earth Engine. In Proceedings of the 3rd International Conference on Geographical Information Systems Theory, Applications and Management, Porto, Portugal, 27–28 April 2017; pp. 250–255. [Google Scholar]
- Copernicus. Available online: https://www.copernicus.eu/en (accessed on 20 August 2019).
- ONDA DIAS. Available online: https://www.onda-dias.eu/cms/ (accessed on 20 August 2019).
- Mundi Web Services. Available online: https://mundiwebservices.com/ (accessed on 20 August 2019).
- CREODIAS. Available online: https://creodias.eu/ (accessed on 20 August 2019).
- Sobloo. Available online: https://sobloo.eu/ (accessed on 20 August 2019).
- Wekeo. Available online: https://www.wekeo.eu/ (accessed on 20 August 2019).
- Earth on AWS. Available online: https://aws.amazon.com/earth/ (accessed on 20 August 2019).
- Pebesma, E.; Wagner, W.; Soille, P.; Kadunc, M.; Gorelick, N.; Verbesselt, J.; Reiche, J.; Appel, M.; Dries, J.; Jacob, A.; et al. openEO: an open API for cloud-based big Earth Observation processing platforms. In Proceedings of the Geophysical Research Abstracts; European Geosciences Union: Vienna, Austria; p. 1.
- TEP—Thematic Exploitation Platform. Available online: https://tep.eo.esa.int/about-tep (accessed on 20 August 2019).
- Appel, M.; Pebesma, E. On-Demand Processing of Data Cubes from Satellite Image Collections with the gdalcubes Library. Data 2019, 4, 92. [Google Scholar] [CrossRef]
- Kopp, S.; Becker, P.; Doshi, A.; Wright, D.J.; Zhang, K.; Xu, H. Achieving the Full Vision of Earth Observation Data Cubes. Data 2019, 4, 94. [Google Scholar] [CrossRef]
- Neteler, M.; Bowman, M.H.; Landa, M.; Metz, M. GRASS GIS: A multi-purpose open source GIS. Environ. Model. Softw. 2012, 31, 124–130. [Google Scholar] [CrossRef] [Green Version]
- EO CLOUD | CreoTech. Available online: https://creotech.pl/en/3477-2/ (accessed on 20 August 2019).
- Martin, J.P.; Kandasamy, A.; Chandrasekaran, K. Exploring the support for high performance applications in the container runtime environment. Hum.-Centric Comput. Inf. Sci. 2018, 8, 1. [Google Scholar] [CrossRef] [Green Version]
- Merkel, D. Docker: Lightweight Linux Containers for Consistent Development and Deployment. Linux J. 2014, 2014, 239. [Google Scholar]
- Chen, C.W.; Zebker, H.A. Phase unwrapping for large SAR interferograms: statistical segmentation and generalized network models. IEEE Trans. Geosci. Remote Sens. 2002, 40, 1709–1719. [Google Scholar] [CrossRef] [Green Version]
Figure 1.
JupyTEP integrated development environment (IDE) extension related to the Jupyter notebook.
Figure 1.
JupyTEP integrated development environment (IDE) extension related to the Jupyter notebook.

Figure 2.
JupyTEP IDE the idea of processing integration.

Figure 3.
Diagram of JupyTEP IDE infrastructure components.

Figure 4.
JupyTEP IDE architecture with service components in the form of Docker containers.

Figure 5.
Functional scheme of system architecture.

Figure 6.
Jupyter notebook environment use case diagram.

Figure 7.
File browser use case diagram.

Figure 8.
Notebook browser use case diagram.

Figure 9.
Map browser use case diagram.

Figure 10.
Earth observation (EO) data search use case diagram.

Figure 11.
Code snippets use case diagram.

Figure 12.
Sample general view of JupyTEP IDE user interface.

Figure 13.
Side panel—(A) tab Snippets view, (B) tab Map view with web map service (WMS) layers added.
Figure 13.
Side panel—(A) tab Snippets view, (B) tab Map view with web map service (WMS) layers added.

Figure 14.
Data search in JupyTEP IDE.

Figure 15.
The result of processing.

© 2019 by the authors. Licensee MDPI, Basel, Switzerland. This article is an open access article distributed under the terms and conditions of the Creative Commons Attribution (CC BY) license (http://creativecommons.org/licenses/by/4.0/).
Share and Cite
MDPI and ACS Style
Rapiński, J.; Bednarczyk, M.; Zinkiewicz, D. JupyTEP IDE as an Online Tool for Earth Observation Data Processing. Remote Sens. 2019, 11, 1973. https://doi.org/10.3390/rs11171973
AMA Style
Rapiński J, Bednarczyk M, Zinkiewicz D. JupyTEP IDE as an Online Tool for Earth Observation Data Processing. Remote Sensing. 2019; 11(17):1973. https://doi.org/10.3390/rs11171973
Chicago/Turabian StyleRapiński, Jacek, Michał Bednarczyk, and Daniel Zinkiewicz. 2019. "JupyTEP IDE as an Online Tool for Earth Observation Data Processing" Remote Sensing 11, no. 17: 1973. https://doi.org/10.3390/rs11171973
Note that from the first issue of 2016, this journal uses article numbers instead of page numbers. See further details here.