Article

A New Retrieval Algorithm for Soil Moisture Index from Thermal Infrared Sensor On-Board Geostationary Satellites over Europe and Africa and Its Validation

by
Nicolas Ghilain
1,*,
Alirio Arboleda
1,
Okke Batelaan
2,
Jonas Ardö
3,
Isabel Trigo
4,
Jose-Miguel Barrios
1 and
Francoise Gellens-Meulenberghs
1
1
Royal Meteorological Institute of Belgium, B-1180 Brussels, Belgium
2
College of Science and Engineering, Flinders University, Adelaide SA 5001, Australia
3
Department of Physical Geography and Ecosystem Science, Lund University, SE-221 00 Lund, Sweden
4
Instituto do Mar e Atmosfera, 1749-077 Lisbon, Portugal
*
Author to whom correspondence should be addressed.
Remote Sens. 2019, 11(17), 1968; https://doi.org/10.3390/rs11171968
Submission received: 23 July 2019 / Revised: 14 August 2019 / Accepted: 16 August 2019 / Published: 21 August 2019
(This article belongs to the Special Issue Remote Sensing of Regional Soil Moisture)

Abstract

:
Monitoring soil moisture at the Earth’surface is of great importance for drought early warnings. Spaceborne remote sensing is a keystone in monitoring at continental scale, as satellites can make observations of locations which are scarcely monitored by ground-based techniques. In recent years, several soil moisture products for continental scale monitoring became available from the main space agencies around the world. Making use of sensors aboard polar satellites sampling in the microwave spectrum, soil moisture can be measured and mapped globally every few days at a spatial resolution as fine as 25 km. However, complementarity of satellite observations is a crucial issue to improve the quality of the estimations provided. In this context, measurements within the visible and infrared from geostationary satellites provide information on the surface from a totally different perspective. In this study, we design a new retrieval algorithm for daily soil moisture monitoring based only on the land surface temperature observations derived from the METEOSAT second generation geostationary satellites. Soil moisture has been retrieved from the retrieval algorithm for an eight years period over Europe and Africa at the SEVIRI sensor spatial resolution (3 km at the sub-satellite point). The results, only available for clear sky and partly cloudy conditions, are for the first time extensively evaluated against in-situ observations provided by the International Soil Moisture Network and FLUXNET at sites across Europe and Africa. The soil moisture retrievals have approximately the same accuracy as the soil moisture products derived from microwave sensors, with the most accurate estimations for semi-arid regions of Europe and Africa, and a progressive degradation of the accuracy towards northern latitudes of Europe. Although some possible improvements can be expected by a better use of other products derived from SEVIRI, the new approach developped and assessed here is a valuable alternative to microwave sensors to monitor daily soil moisture at the resolution of few kilometers over entire continents and could reveal a good complementarity to an improved monitoring system, as the algorithm can produce surface soil moisture with less than 1 day delay over clear sky and non-steady cloudy conditions (over 10% of the time).

1. Introduction

Soil moisture at the surface of the Earth affects everyday life of people across the globe. The infiltration and hence soil moisture influence various meteorological processes [1], natural hazards as floodings [2], land slides and droughts, depriving populations of agricultural yield due to lack of soil moisture. Hence, water required to irrigate fields in semi-arid areas determines the long-term natural resources availability at regional level and may impact local [3] to international economics and policy [4,5].
Since late 1980’s, efforts, based on numerical meteorological modelling, have resulted in estimation of soil moisture at continental scale [6]. Yet, observation-based systems are required for realistic data without a priori knowledge. This aspect is especially important in regions where few ground-based observations are available to confront model results with reality. The launch of the first Earth-observing satellites into space brought hopes and promises in characterizing and monitoring the Earth natural resources [7], especially water [8]. Njoku and Entekhabi [9] were among the first to use sensors aboard polar orbiting satellites for retrieving soil moisture. Recent success stories in near-real time soil moisture monitoring at global scale at 25 km resolution independently from the weather type are with micro-wave sensors [10,11,12], with a revisiting time of one or two passages per day. Geostationary satellites, initially designed for weather monitoring and forecasting, have long been discarded from this research effort. However, the imagery in the visible and infra-red spectra covers whole continents at a few kilometers resolutions in less than an hour and is potentially powerful in detecting rapid changes of the land surface [13]. They can potentially reduce the noise in data of other satellite sensors by bringing a wealth of observations every day. The Spinning Enhanced Visible and Infrared Imager (SEVIRI) instruments onboard the european Meteosat Second Generation (MSG) satellites provide 96 images per day in the visible and infra-red spectral bands, providing a detailed information on the sub-daily variations of the atmosphere and the surface.
Information from infrared spectral channels of sensors can be converted to a physical land surface temperature [14]. From the early 1980s, the thermal inertia concept, consisting of linking the amplitude of the surface heating over a day with the quantity of water present in the soil [15,16,17,18,19,20,21], has been applied to space-based observations [20,22,23,24]. This concept has been applied with various degrees of success to local and regional studies [25,26,27,28,29], and though most studies based on thermal inertia show potential for soil moisture monitoring, the success of this measurement methodology has not be quantified for large datasets so far. With the increasing interest on dynamical water resources assessment, new international initiatives [30] have brought a wealth of soil moisture ground-based observations to the public through a unique internet-based platform, otherwise locally managed, pushing forward model developments and remote sensing validation exercises. With these new opportunities, we applied a new retrieval algorithm based on the thermal inertia concept to SEVIRI observations over European and African continents, spanning an eight years period (2007–2014). Its success could be quantified in an extensive sample of climate zones, therefore filling some of the gaps left by other studies on thermal inertia by providing quantitative information regarding its accuracy and performance against in-situ ground measurements in a large panel of conditions.
Thanks to its unprecedented temporal and spatial observation resolution, the SEVIRI instument allows an accurate estimation of the daily surface heating rates, allowing a well-sampled tracking of soil moisture, for clear sky and partly cloudy weather over semi-arid areas. In this paper, we present first the new approach of the thermal inertia model. Then, to characterize the accuracy of the resulting soil moisture time series, we present the comparison with in situ measurements and discuss the limitations of both the method and the data.

2. Material and Methods

Thermal infra-red sensitive channels aboard satellites are particularly suited to derive land surface temperature (LST) by clear sky conditions. LST can be derived from two spectral channels [14], or even from a single thermal channel [31]. The impact of soil moisture on the land surface temperature is evident [32] and several attempts have been carried out to derive soil moisture from thermal imagery for various landscapes, at different scales and spatial resolutions, using the thermal inertia property of surface elements. The concept of thermal inertia is the following: a surface element with high thermal inertia will heat and cool more slowly than a surface element with a low thermal inertia, subjected to the same radiation. This concept does apply to compare different surface materials: sandy soil has a low thermal inertia compared to most rocks, and so heat and cool more rapidly. This technique is very popular in geological and planetary sciences (e.g., [33]). Thermal inertia property also applies to changes in the same soil over time, as it depends on soil moisture [32,34]. A soil with high soil moisture has a higher thermal inertia than the same soil when it is dry. Over time, detection of changes of thermal inertia at the same location can help to detect variations of soil moisture [35].
Various approaches have been suggested to derive soil moisture from thermal inertia variations observed from space. Two popular approaches are: the establishment of direct empirical relations between soil moisture and the changes in land surface temperature [26,28,35,36,37] and physical approaches, based on the estimation of evapotranspiration from land surface temperature changes and the deduction of soil moisture (for example Merlin et al. [38] using polar satellites, and Wetzel et al. [39], Anderson et al. [40], Hain et al. [41], Parinussa et al. [42] using geostationary satellites).
In several studies, at least two polar satellites passes are used to derive a soil moisture index based on land surface temperature, exploiting the diurnal heating or the heating over several days. While polar orbiters offer the possibility of global data coverage, these data are generally exploited for local applications. They are often limited by the relatively low temporal sampling and further hampered by cloud coverage and deficient cloud screening or atmospheric correction. Geostationary satellites offer an interesting alternative to polar satellite because of their high temporal sampling rate at the expense of coarser spatial resolutions. Verstraeten et al. [35] (referred as V2006) made a first attempt to derive a soil moisture index from thermal inertia concept and MSG/SEVIRI data for various forested sites across Europe during a vegetation period spanning April to October. The methodology proposed in V2006 is fairly simple and easily applicable, but does not exploit the full capabilities of the satellite, as it only uses two observations per day, as would be the case for a system of one sun-synchronous polar orbiter like MODIS/Terra or Aqua. The methodology has been further examined in Van Doninck et al. [37], where reconstructed LST signal from MODIS suite of satellites (4 overpasses per day) was used over Southern Africa and also more recently by Garcia et al. [26] with MSG/SEVIRI data over two sites in Mali and Southern Spain. It has been shown that a more robust estimate could be obtained by using a full morning dataset of LST, as Stisen et al. [43] showed for evaporative fraction from the same satellite. The present derivation has been built upon those previous studies to set up a new simple model to retrieve a soil moisture estimate from a single input variable, the MSG/SEVIRI LST produced by the Land Surface Analysis Satellite Application Facility (LSA-SAF) [44].

2.1. A New Thermal Infrared-Based Soil Moisture Retrieval

The new method for soil moisture retrievals presented here is based on the assumption that the algorithm can rely on only thermal infrared (TIR) observations from geostationnary satellites over entire continents. More specifically, we focus on the MSG/SEVIRI land surface temperatures (LST), and the exploitation of its exceptionnal temporal sampling, to derive surface soil moisture, not only for fully clear sky days, but also for days with intermittent cloud cover. In the following section, we describe the satellite data, the advantages and disadvantages of the data, the calibration of the empirical retrieval algorithm, and the processing methodology used to generate daily averaged surface soil moisture maps.

2.1.1. MSG Satellite and Its SEVIRI Sensors

The necessary input variables are derived from thermal infrared data acquired by the SEVIRI sensor onboard the series of MSG satellites of the European Organization for the Exploitation of Meteorological Satellites (EUMETSAT).
SEVIRI is one of the sensors aboard MSG suite of satellites. SEVIRI has 12 spectral channels recording the radiance from the Earth in the visible, near infrared and thermal infrared wavelengths. Every 15 min the whole field of view of MSG, covering Europe, Africa, South America and Middle East, is scanned in all the considered wavelengths. SEVIRI has a spatial footprint of 3.1 km at the sub-satellite location. Because of its position at the equator and of the associated angle of view (Figure 1), the spatial resolution is variable over the field of view and the surface elements are not seen from the same perspective.
Several EUMETSAT decentralized thematic centers, called Satellite Application Facilities (SAF), have been created to generate further exploitations of its satellites, including the MSG suite. One particular component focus on land surface: the Satellite Application Facility on Land Surface Analysis, LSA-SAF [44]. Several variables of interest for the land surface and land-atmosphere transfers are produced in near-real time over the entire SEVIRI field of view using MSG/SEVIRI acquired data. The thermal infra-red channels are particularly exploited for the generation of the land surface temperature (LST). The LST product is estimated every 15 min for clear-sky areas using a split-window algorithm applied to brightness temperatures measured in the 10.8 and 12.0 μ m [45] of the SEVIRI instrument. The reported accuracy from comparison over selected locations in Portugal, Senegal, and Namibia, is of the order of 1.7 to 2.7 K, with a bias generally less than 1 K [46,47,48,49]. LST is provided with uncertainty bars and a quality indicator reflecting the state of the input data or the nature of the surface. Over the period covered by this study, from 2007 to 2014, consecutive versions of retrieval algorithm have been used to generate LST maps, versions 5.0 to 7.7, mostly including minor changes to files technical specifications (attributes) (http://landsaf.ipma.pt), and 2 changes of satellites, although the longest period was covered by MSG-2: MSG-1 (1 March 2007–10 April 2007, operating from 3.4 longitude west), MSG-2 (11 April 2007–20 January 2013, operating from 0 longitude), MSG-3 (21 January 2013–31 December 2014, operating from 0 longitude).
Because of the specific view of the MSG satellites, LST derived from MSG can be affected by anisotropy effects and be not fully compatible in all areas with devices operating with other viewing geometries. Vegetation density and structure play a role, affecting for example the observation of shaded and sunlit areas [50]. In a hotspot configuration, the surface is seen by the sensor within a few degrees of the sunrays direction, and an enhancement in the land surface temperature retrieved is observed [51]. Another cause that can affect the retrieval is the estimation of the humidity in the total thickness of the atmosphere [46].

2.1.2. The Soil Moisture Retrieval Algorithm

Initial Signal from the Land Surface Temperature

In the present study, we compute morning surface heating rates per pixel through linear regression on LST data between local dawn and noon, excluding one hour on each side of the time series [43], therefore aiming at exploiting the daily changes of thermal inertia. A surface submitted to the same water stress has been evidenced to exhibit higher amplitude of LST diurnal cycle under high than under low insulation Garcia et al. [26], Verstraeten et al. [35], Van Doninck et al. [37]. Therefore, in those studies, the daily amplitude of the LST signal was normalized by an astronomical factor accounting for seasonality in sun zenithal angle. This was also supported by Prigent et al. [52], where LST amplitudes were normalized with incoming solar radiation. Here, because we derive heating rates and not amplitude, we already take into account the length of the morning, and no normalization is needed. An error range is calculated indicating the goodness of the linear fit: a poor linear fit can find its roots in a change of atmospheric conditions within the sampling period, a systematically poor cloud masking, or a rain event occurring during the estimation period.

Geometric Correction

Because of the specific viewing geometry of MSG/SEVIRI the heating rates should be corrected from viewing anisotropy effects. The correction we apply follows other studies for correction of LST observations from geostationary satellites (Ermida et al. [53] for MSG/SEVIRI, Vinnikov et al. [54] for GOES). It consists of a multiplicative factor accounting for the effects of surface heterogeneity and land use, see Equation (1), and relies on viewing zenith angle (VZA) from the satellite, θ s a t and the solar zenith angle, θ s u n . It is composed of two additive kernels, the emissivity and solar kernels, incorporating several effects related to shading and hotspot.
H R M S G H R V Z A = 0 = 1 + A Φ ( θ s a t ) + B Ψ ( θ s u n , θ s a t )
Φ = 1 c o s ( θ s a t )
Ψ = s i n ( θ s a t ) c o s ( θ s u n ) s i n ( θ s u n ) c o s ( θ s u n θ s a t )
Because the major effect on heating rates is expected to be from surface heterogeneity, we use the set of Equations (1)–(3) to correct the heating rate calculated in the view of the satellite H R M S G to nadir view. The emissivity kernel parameter (Equation (2)) is set constant, A = 0 . 2 . A map of the constant of the solar kernel (Equation (3)), B, has been obtained by calculating the ratio of the maximum heating rate obtained per pixel (percentile 97 of the distribution) with the regional average of maxima (60 × 60 pixels), such as effects from terrain complexity are clearly visible (not shown).

Calibration

Because higher heating rates appear in water stress affected regions, the signal is generally inversely correlated to the soil moisture. A linear relation between soil moisture and heating rate or normalized difference of temperatures is usually assumed. However, no evidence of that linearity has been provided over a large set of conditions. A series of adaptations have therefore been brought to the original algorithm to account for the behaviour of the signal locally observed. The selection of the model and its calibration was based on pairing daily soil moisture in-situ measurements with daily heating rates, estimated from at least 40% of daily LST measurements and smoothened by a low-pass exponential filter with a decay time of 3 days, at a single calibration site (Tojal, Portugal) over one year (2007), which present the characteristic to have clear moist and dry seasons, and a low vegetation cover. Soil moisture and heating rates have been both normalized between 0 and 1. Three functions have been tested (linear, exponential, double exponential) and the coefficients optimalized using the bayesian inversion algorithm Shuffled Complex Evolution Metropolis algorithm, SCEM-UA [55].
As a result, the relation with the smallest residuals was selected: it is exponential (Equation (4)), increasingly sensitive to variations towards high soil moisture contents (Figure 2), with k 1 = 1 . 6 , k 2 = 1 . 05 and k 3 = 0 . 6 .
S S M 0 1 = k 1 . e x p k 2 . H R H R m i n H R m a x H R m i n + k 3

Processing Steps

The production of daily averaged surface soil moisture (SSM) from MSG/SEVIRI LST follows the following sequence:
  • Daily surface heating rates ( H R ) are computed for each pixel on land, by a linear regression through the LST observations from 1 h after dawn to 1 h before noon. Only the H R computed with at least 10% of LST over the morning are retained.
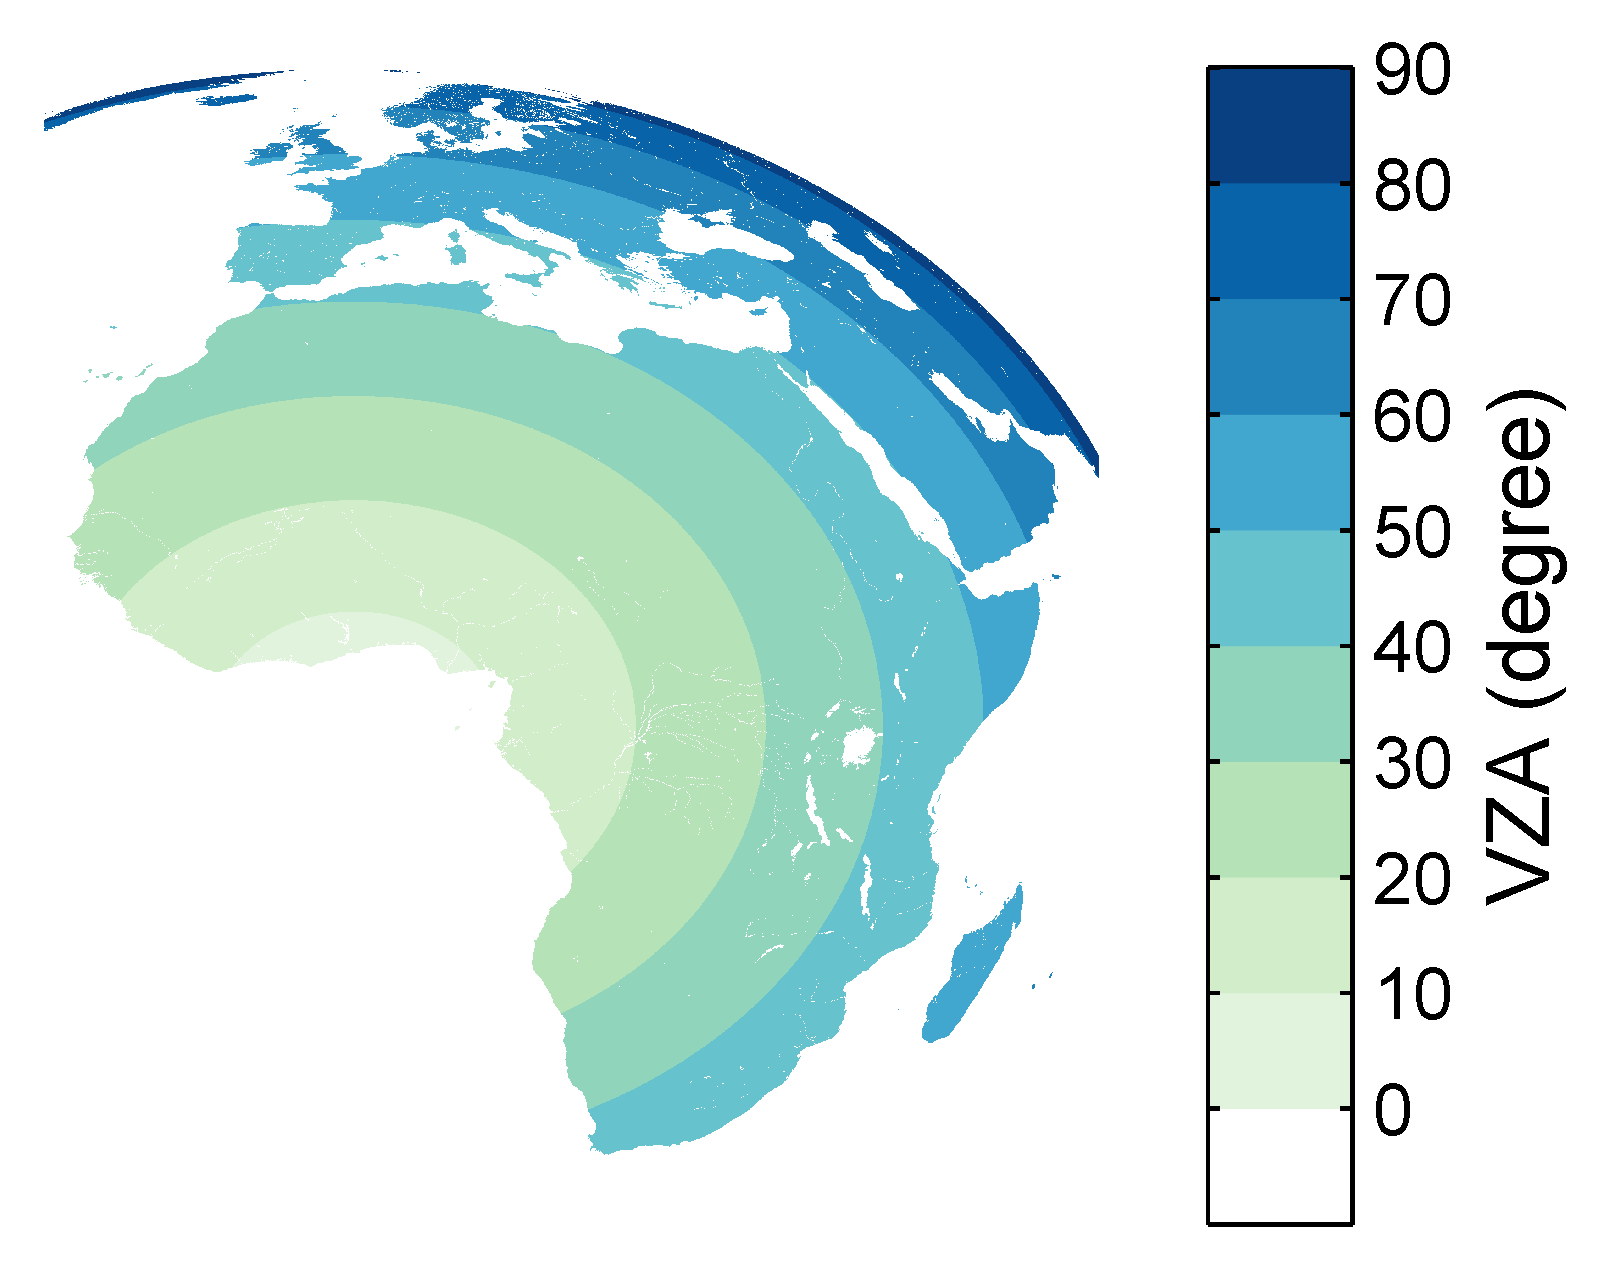
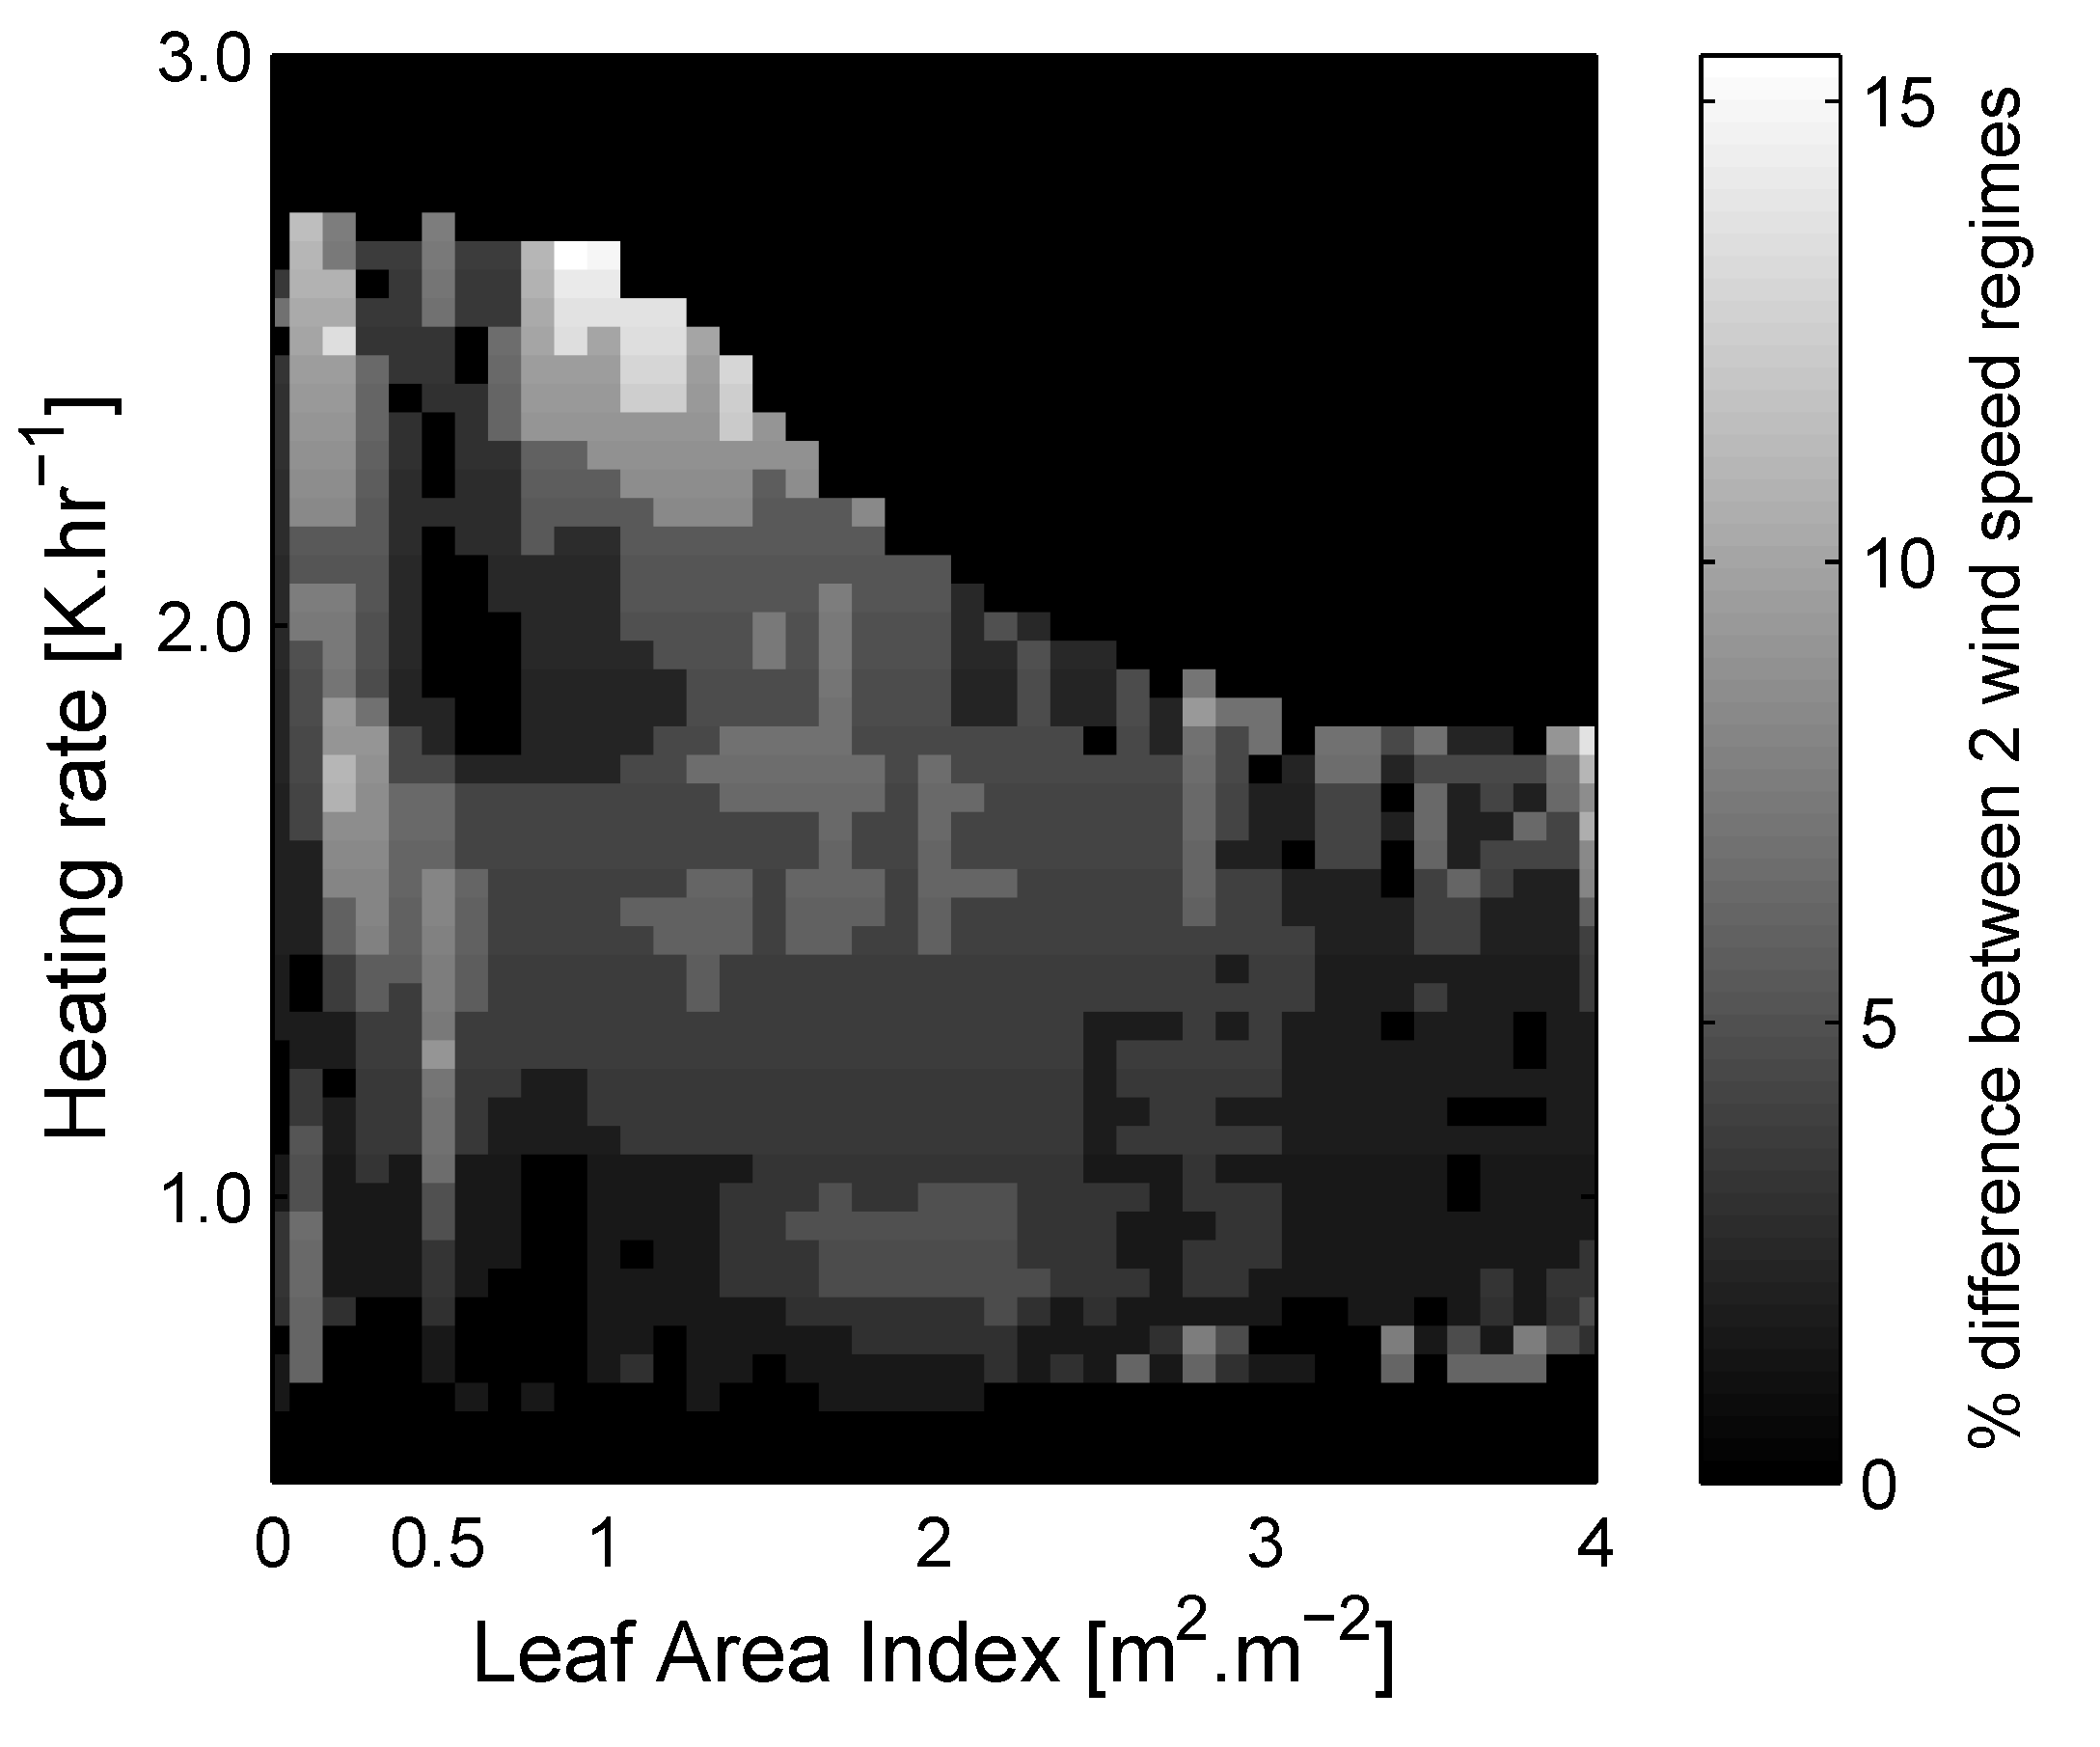
  • The heating rates are corrected for the viewing anisotropy effects (Equation (1)). The inclusion of this viewing anisotropy correction has effects, for example, at latitudes above 40 N and in hilly areas, where it forces the signal to exhibit a larger soil moisture in winter, which is not seen without the correction.
  • The heating rates are normalized between the minimum M i n and maximum M a x , determined pixelwise as the value corresponding to respectively 97% and 3% of the cumulative distribution function of the pixel heating rates over one year. The thresholds have been chosen as to avoid false extremes caused by wrong detection of clouds, dust or any failure in the retrieval of the LST. Because full variability of soil moisture between the wilting point (pwp) and the field capacity (fc) can be assumed if the series is sufficiently long, the extrema could be set to fc and pwp, as proposed by V2006.
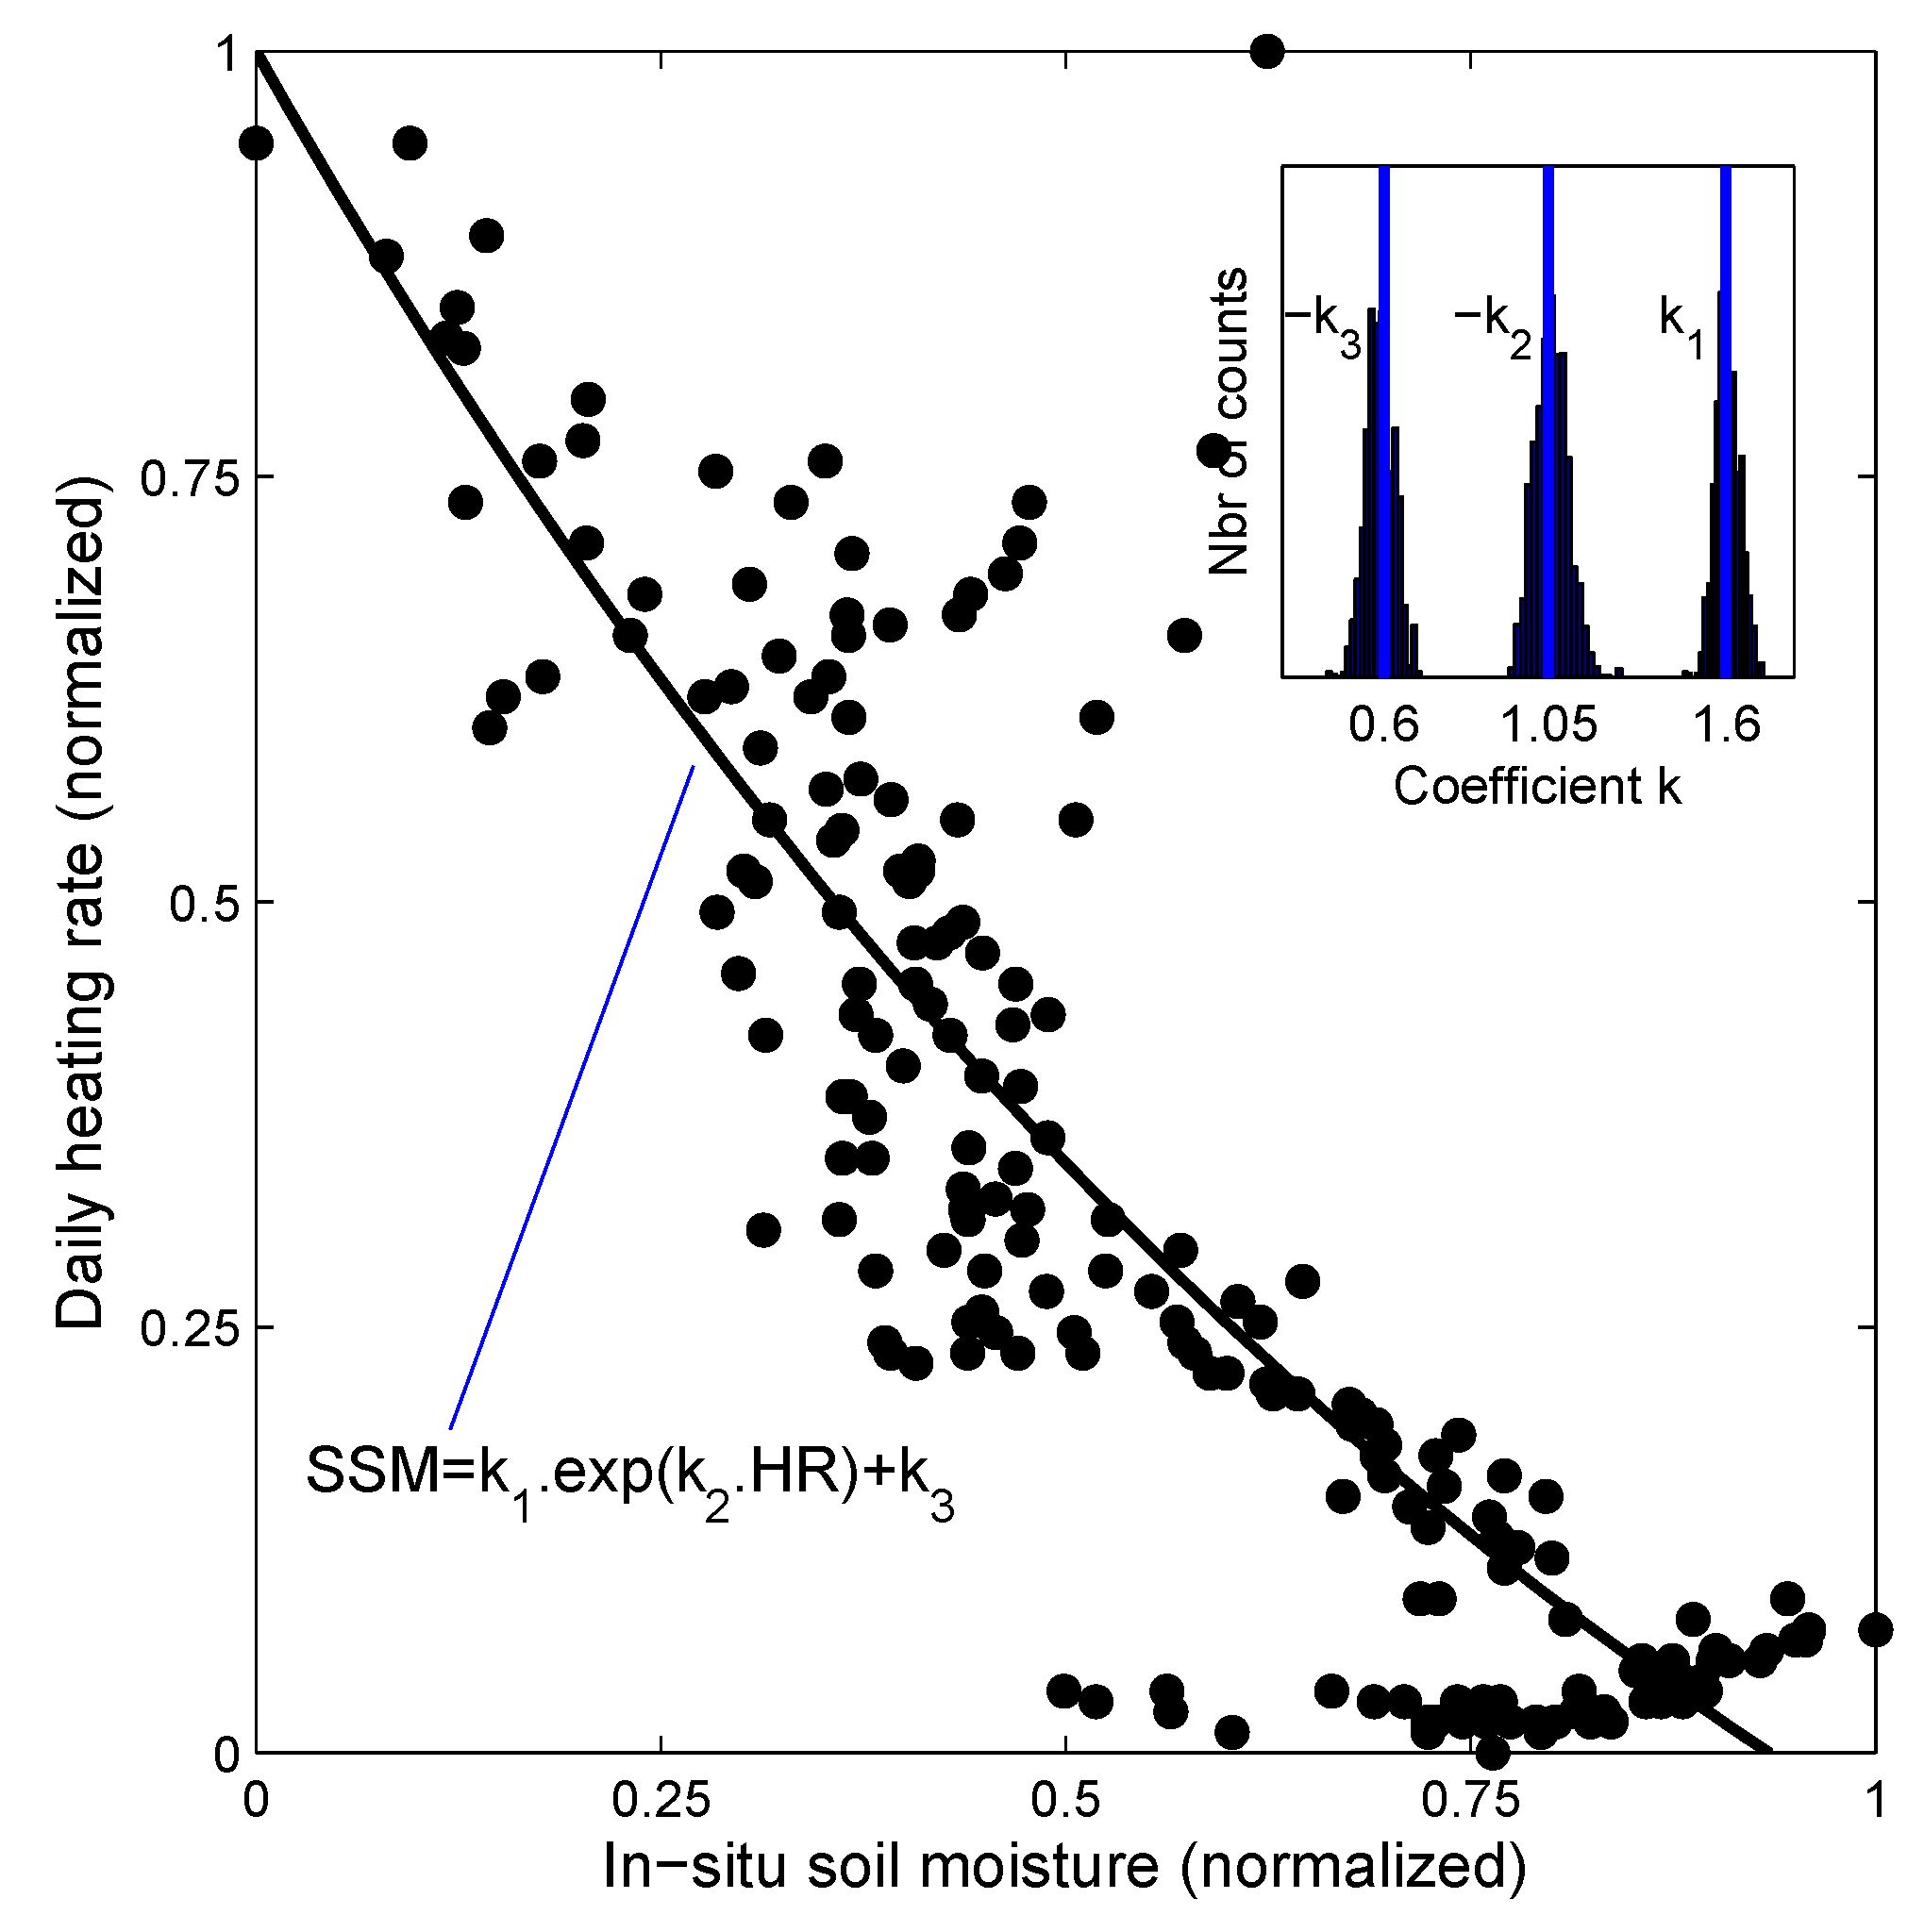
  • The exponential function is applied on the normalized corrected heating rates, resulting in daily surface soil moisture estimates (Equation (4)).
  • A low-pass filter is applied, because of day-to-day apparent variability of the thermal inertia making the time series instable for some periods [37], an effect that maybe due to aerosol load variations, wind speed at the surface or fuzzy geolocation of the MSG/SEVIRI signal. It consists of a running exponential filter over the previous 30 days, with a characteristic time T = 3 days (Equation (5)), which allows to smoothen the signal with moderate loss of day-to-day information. This has been shown to be also beneficial for ASCAT SM products [56], while low-pass filters have been shown to reduce noise on SMOS soil moisture product [57].
    S M F i n a l ( t n ) = i = n 30 n S M ( t i ) · e ( t n t i T ) i = n 30 n e ( t n t i T )

2.2. Validation Material

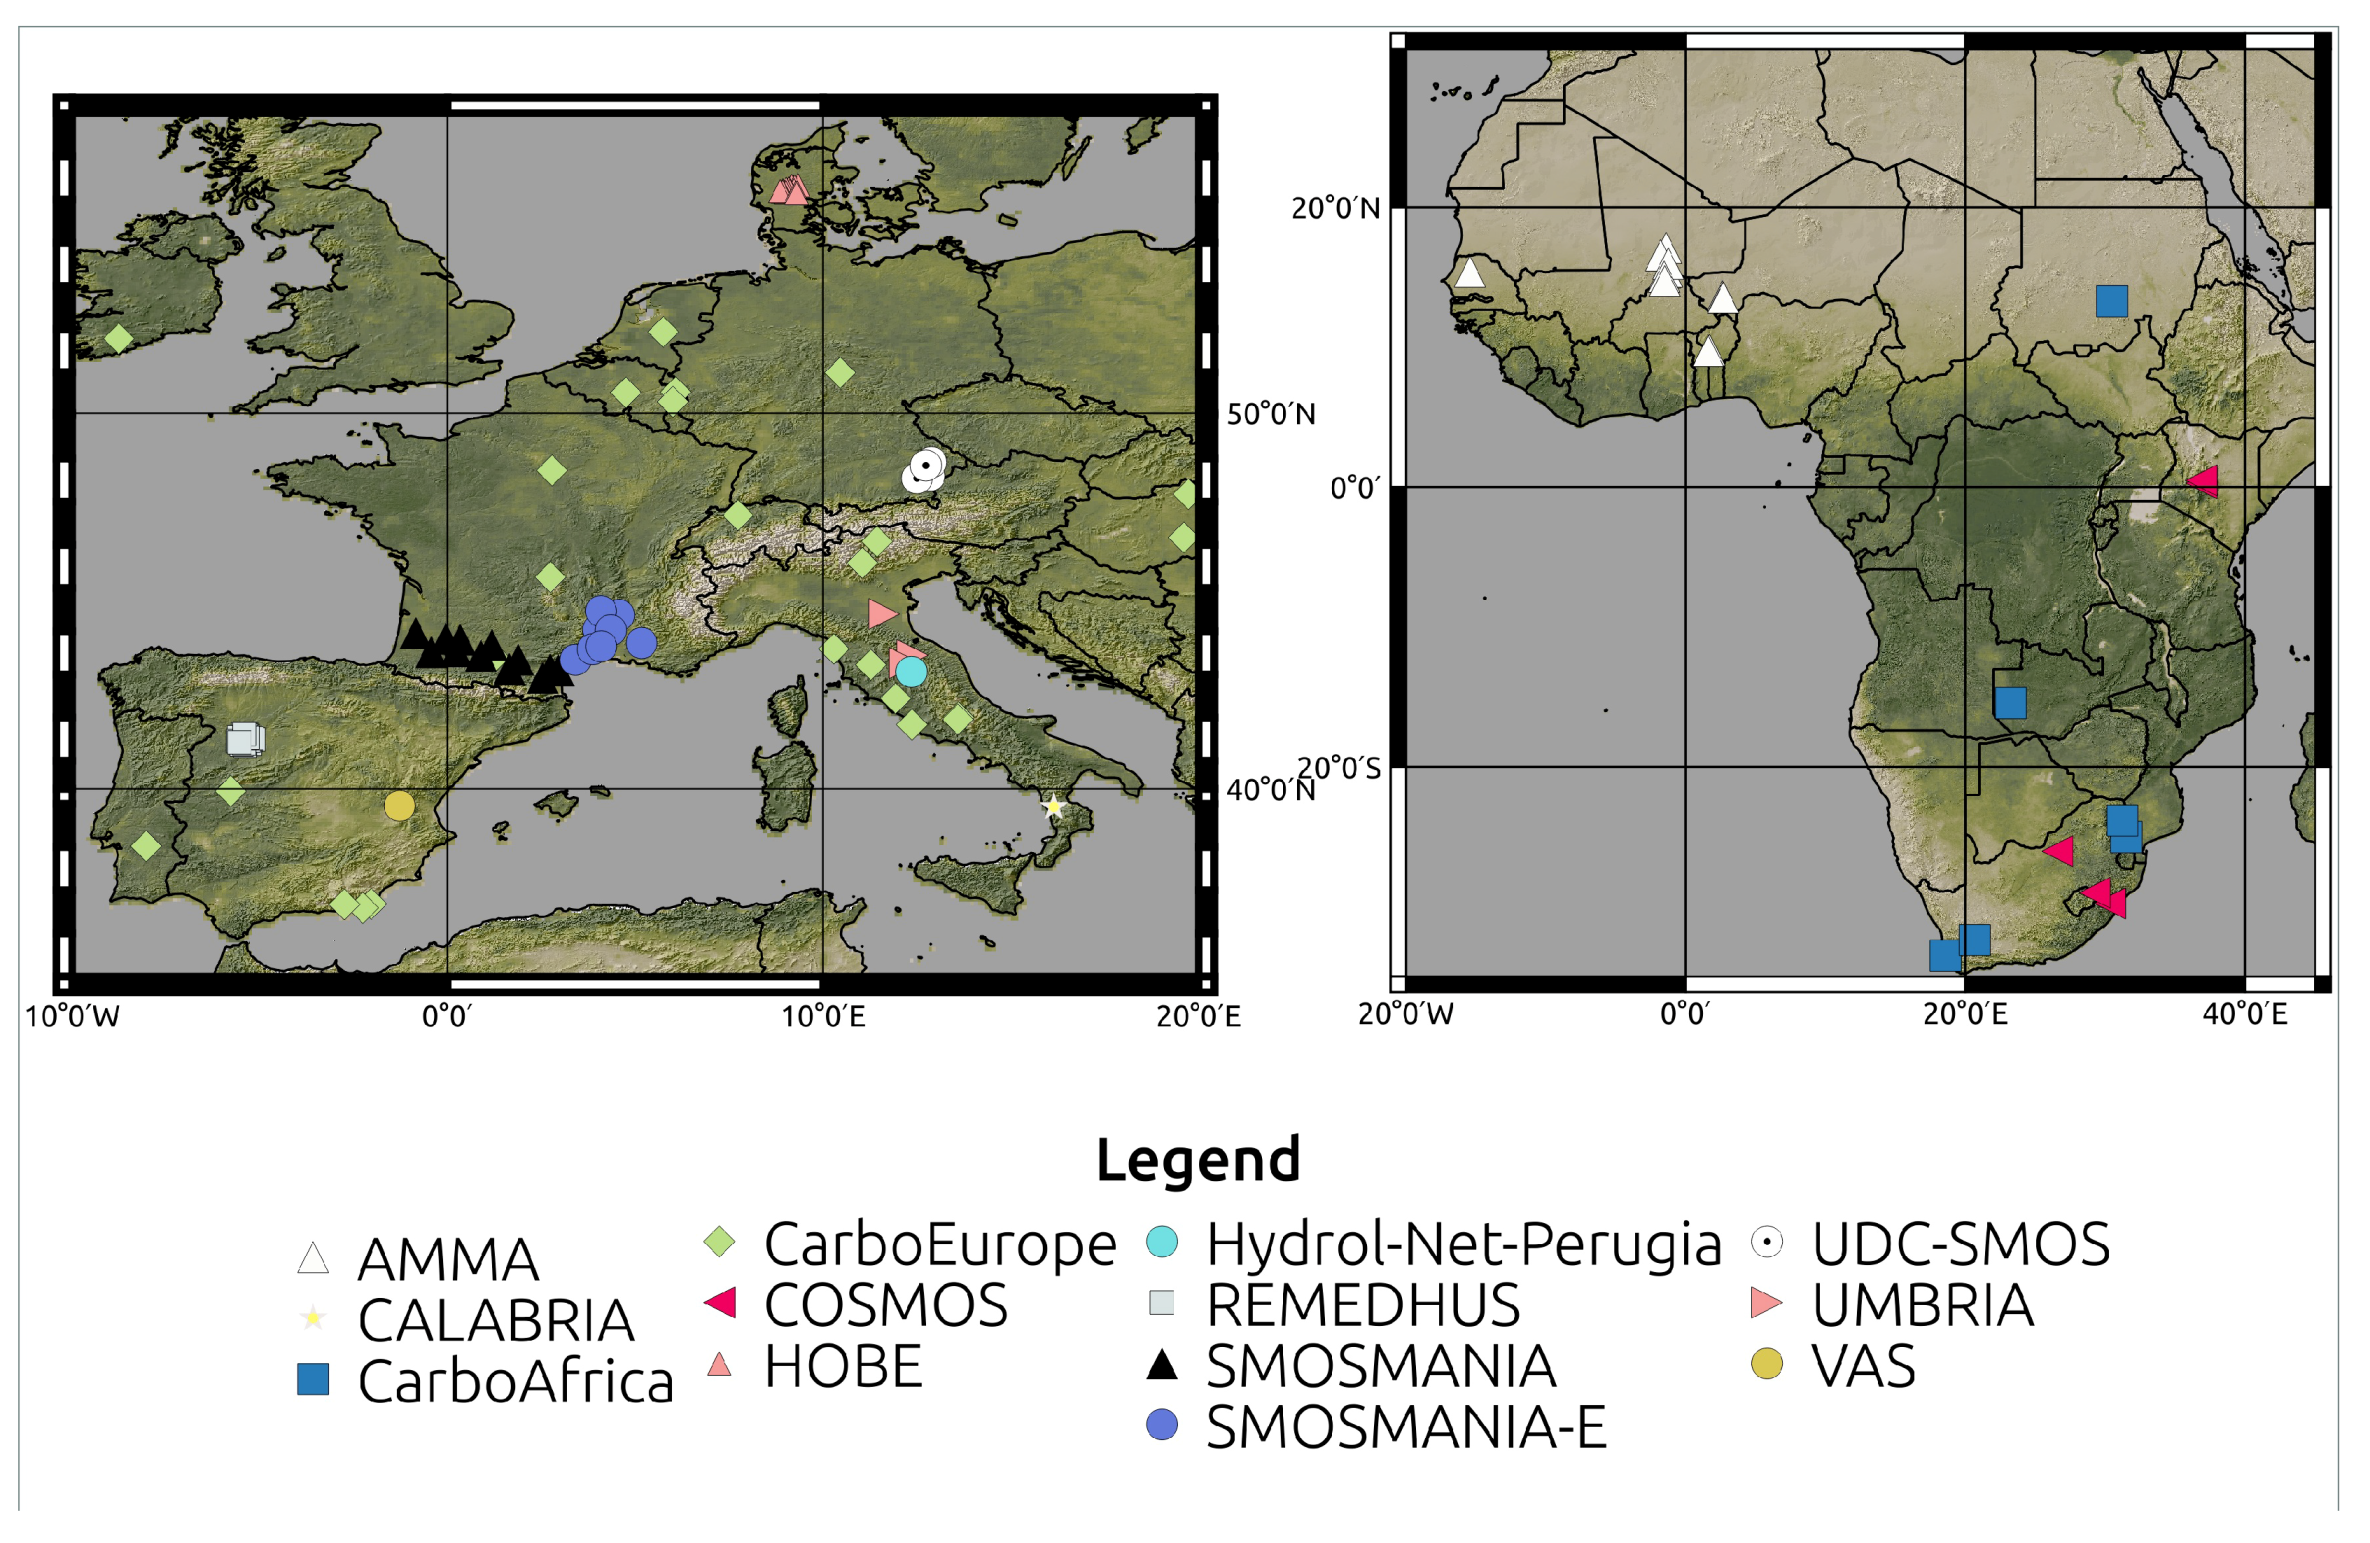
2.2.1. In-Situ Soil Moisture Measurements

Datasets have been acquired for 8 yearly periods from March 2007 to December 2014 across Europe and Africa. Half-hourly measurements, if available, or hourly measurements otherwise, of soil moisture at depths of 2, 5, 10 or 30 cm have been made available from CarboEurope, CarboAfrica [58], AMMA [59,60,61,62], SMOSMANIA [63,64], REMEDHUS [65,66], HOBE [67], UMSUOL, CALABRIA, PERUGIA, VAS, UMBRIA [68,69,70], COSMOS [71] and UDC-SMOS [72] networks, with 161 station-years in total, sampling Spain, Portugal, Italy, France, Denmark, Mali, Niger, Sudan, Germany, Senegal, South Africa and Kenya (Figure 3).
The in-situ set-up of the networks intent to provide local observations of soil moisture under various land cover types (coniferous, broadleaf or mixed forests, grasslands, croplands, wetlands, savannahs) submitted to a large range of climatic regimes. Sites considered for the validation are listed in Table 1, together with information on geographical location, climate regime, ground measurement depth and measurement technique (see Albergel et al. [73] for an overview of the various experimental set-ups). When possible, at least two yearly periods have been selected per site, with a sampling of the first years of operations of the LST product and of more recent years, where overlap is possible with other missions, for instance SMOS. Each time series has been rescaled between 0 and 1, 0 being considered as the permanent wilting point and 1, the field capacity.

2.2.2. Soil Moisture Products from Microwave Sensors

In addition, available products from current soil moisture missions have been used to compare their relative fit to the proposed retrieval during clear sky conditions. Products derived from the operational EUMETSAT MetOp/Advanced Scatterometer (ASCAT), an active sensor, and the research European Satellite Agency Soil Moisture Ocean Salinity Earth explorer mission (SMOS), a passive sensor. Both operate in the microwave domain, C-Band (5.255 GHz) and L-Band (1.4 GHz) respectively, and provide global imagery at 25 to 50 km and 35 km resolution every 1 to 3 days, respectively. The retrieval principles for both ASCAT and SMOS products can be found in Srivastava et al. [74].
In this study, we have used the ASCAT SSM L3 product delivered as time series granules by the EUMETSAT Hydrology SAF (H25 product, http://hsaf.meteoam.it) for its easy handling of time series. The SMOS SSM L3 product has been obtained for the period starting at 1 January 2010 from the Centre Aval de Traitement des Données SMOS (CATDS) (http://www.catds.fr/). Both products have global coverage. Time series files for ASCAT H25 and daily files for SMOS SSM L3 are provided with the instantaneous retrievals, the time of acquisition and the acquisition mode (descending or ascending). In most files, there are one to two observations per day. The spatial resolution of the products is 25 km, with sampling at 12.5 km, for ASCAT H25 [75] and 25 km for SMOS L3. A buffer zone on land surface at the coast is foreseen by the products. Because SMOS and ASCAT L3 products are instantaneous, the direct comparison with MSG/SEVIRI derived daily soil moisture was not possible. Therefore, we applied a running exponential filter with a decay time of 3 days to smoothen the signal from instataneous values to daily values. It follows a similar strategy as used to produce the soil water index (SWI) product from MetOp/ASCAT SSM in the frame of Copernicus Global Land Services (http://land.copernicus.eu/global/ [56]).

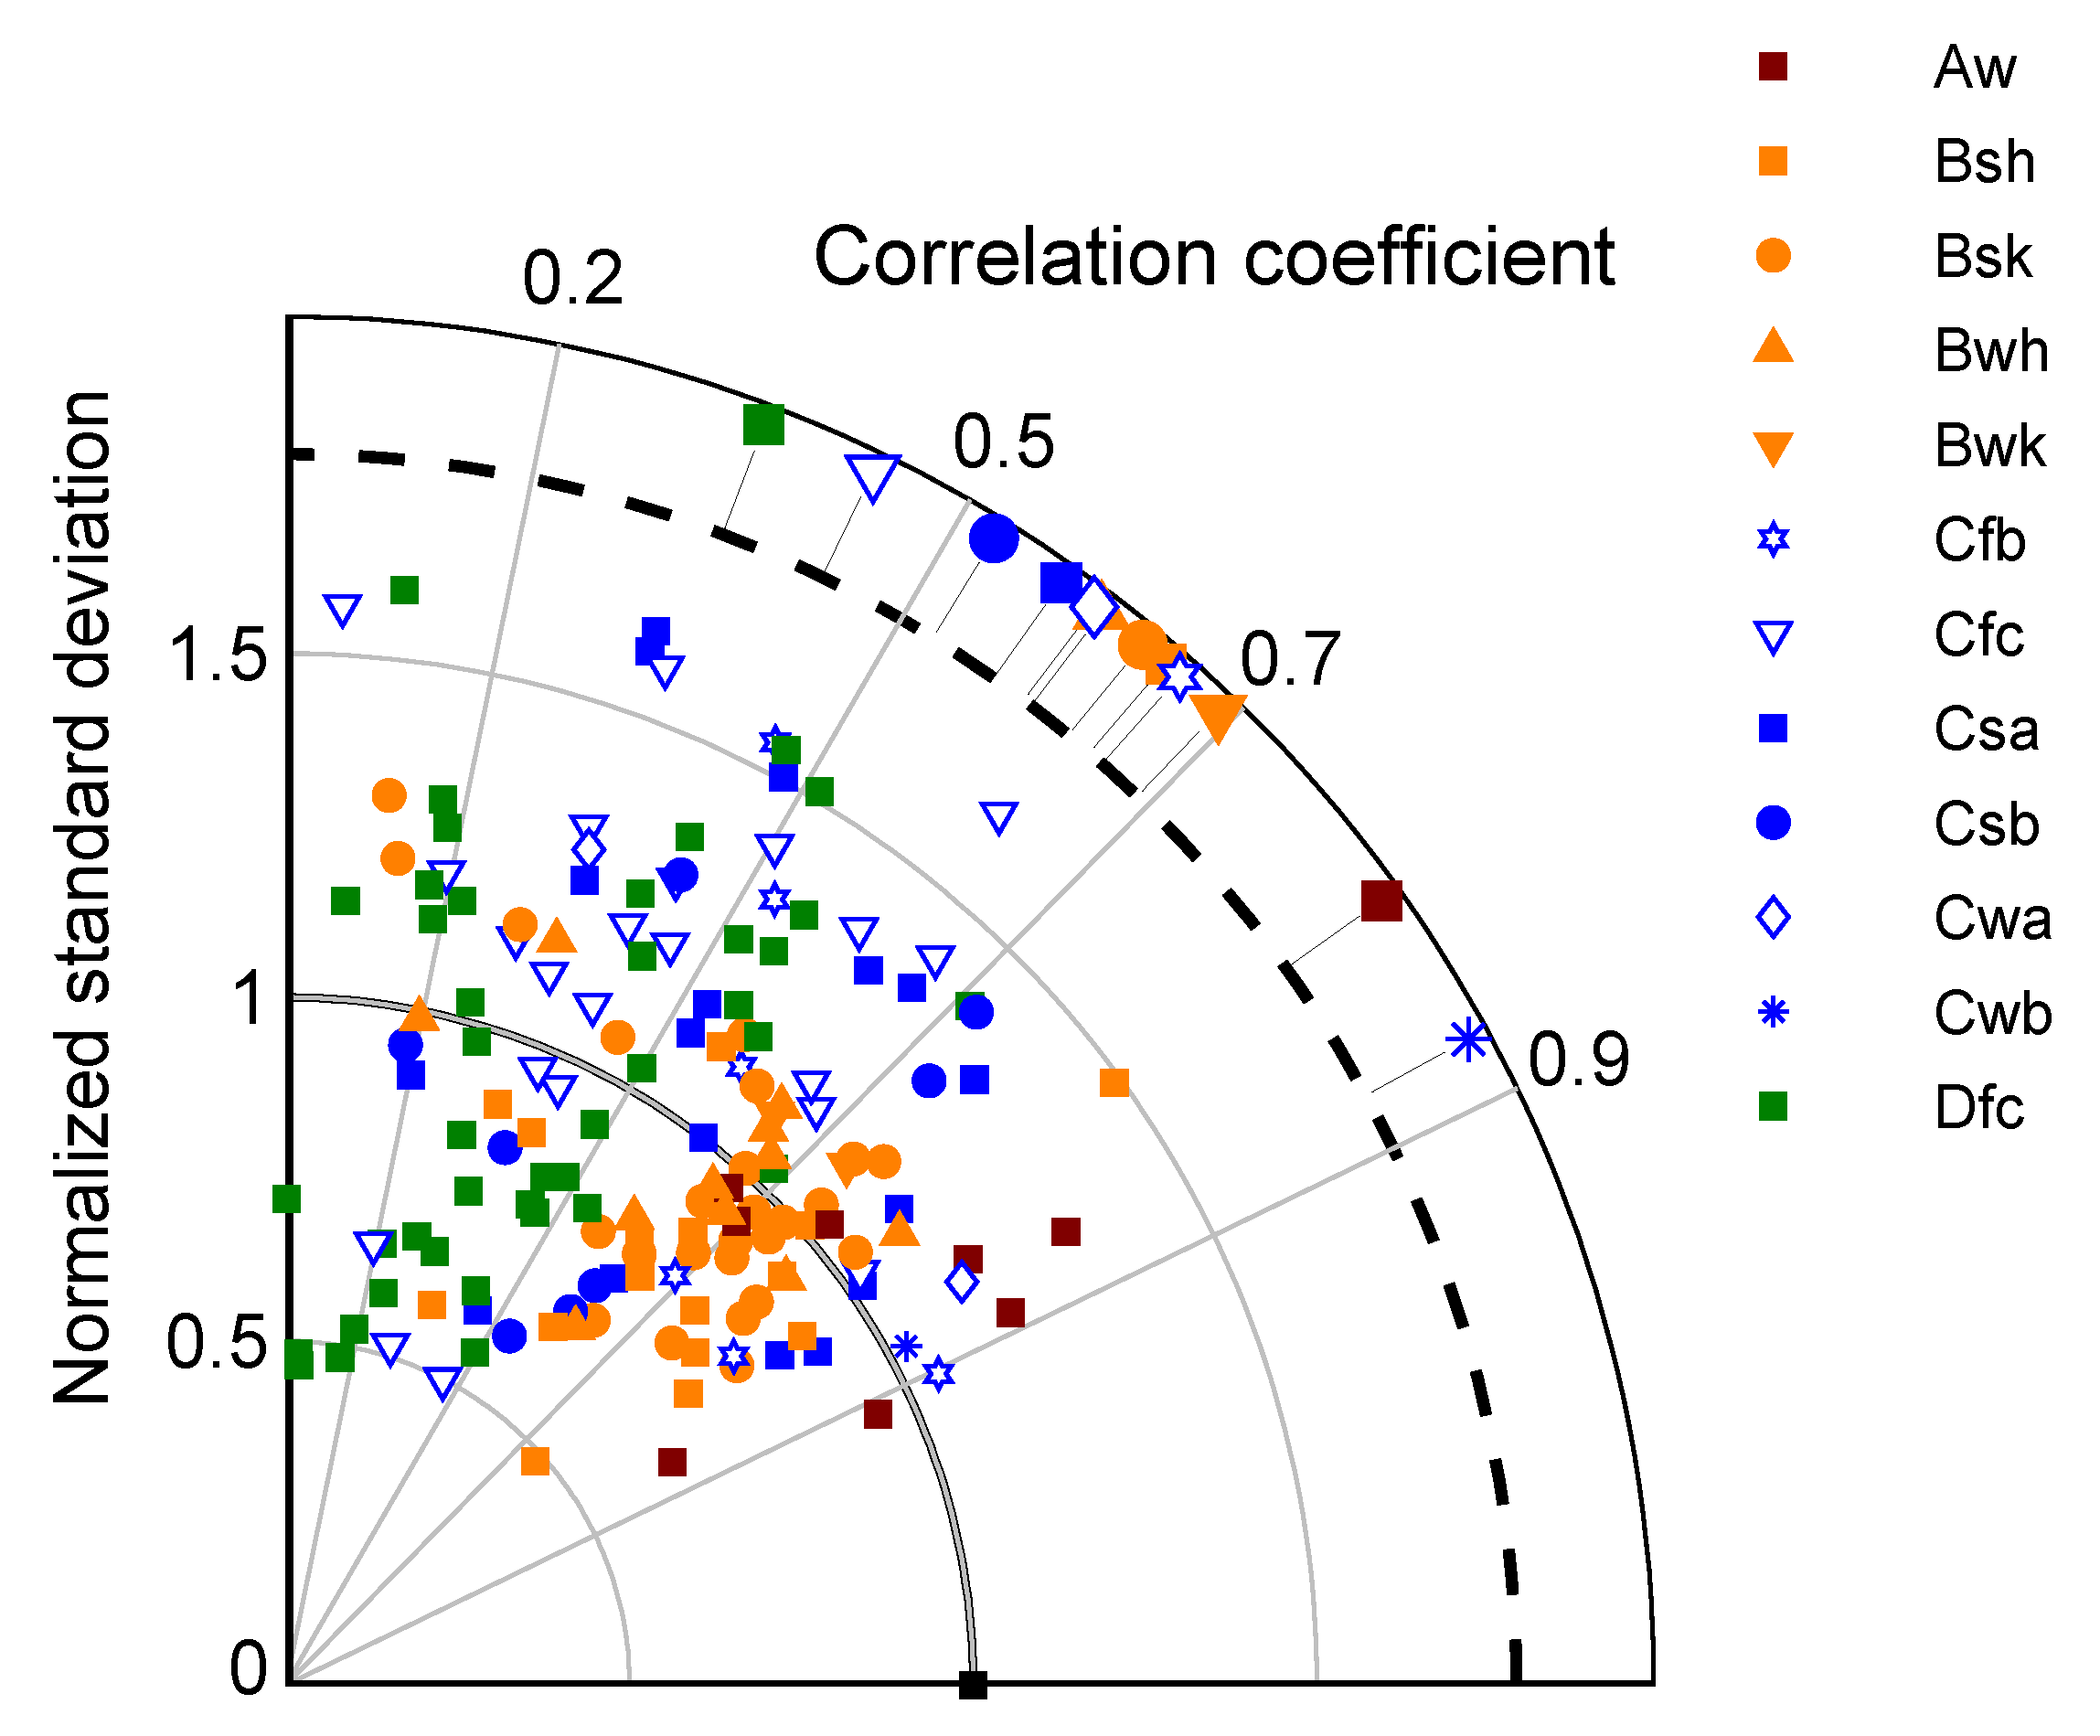
2.3. Benchmarking Protocol
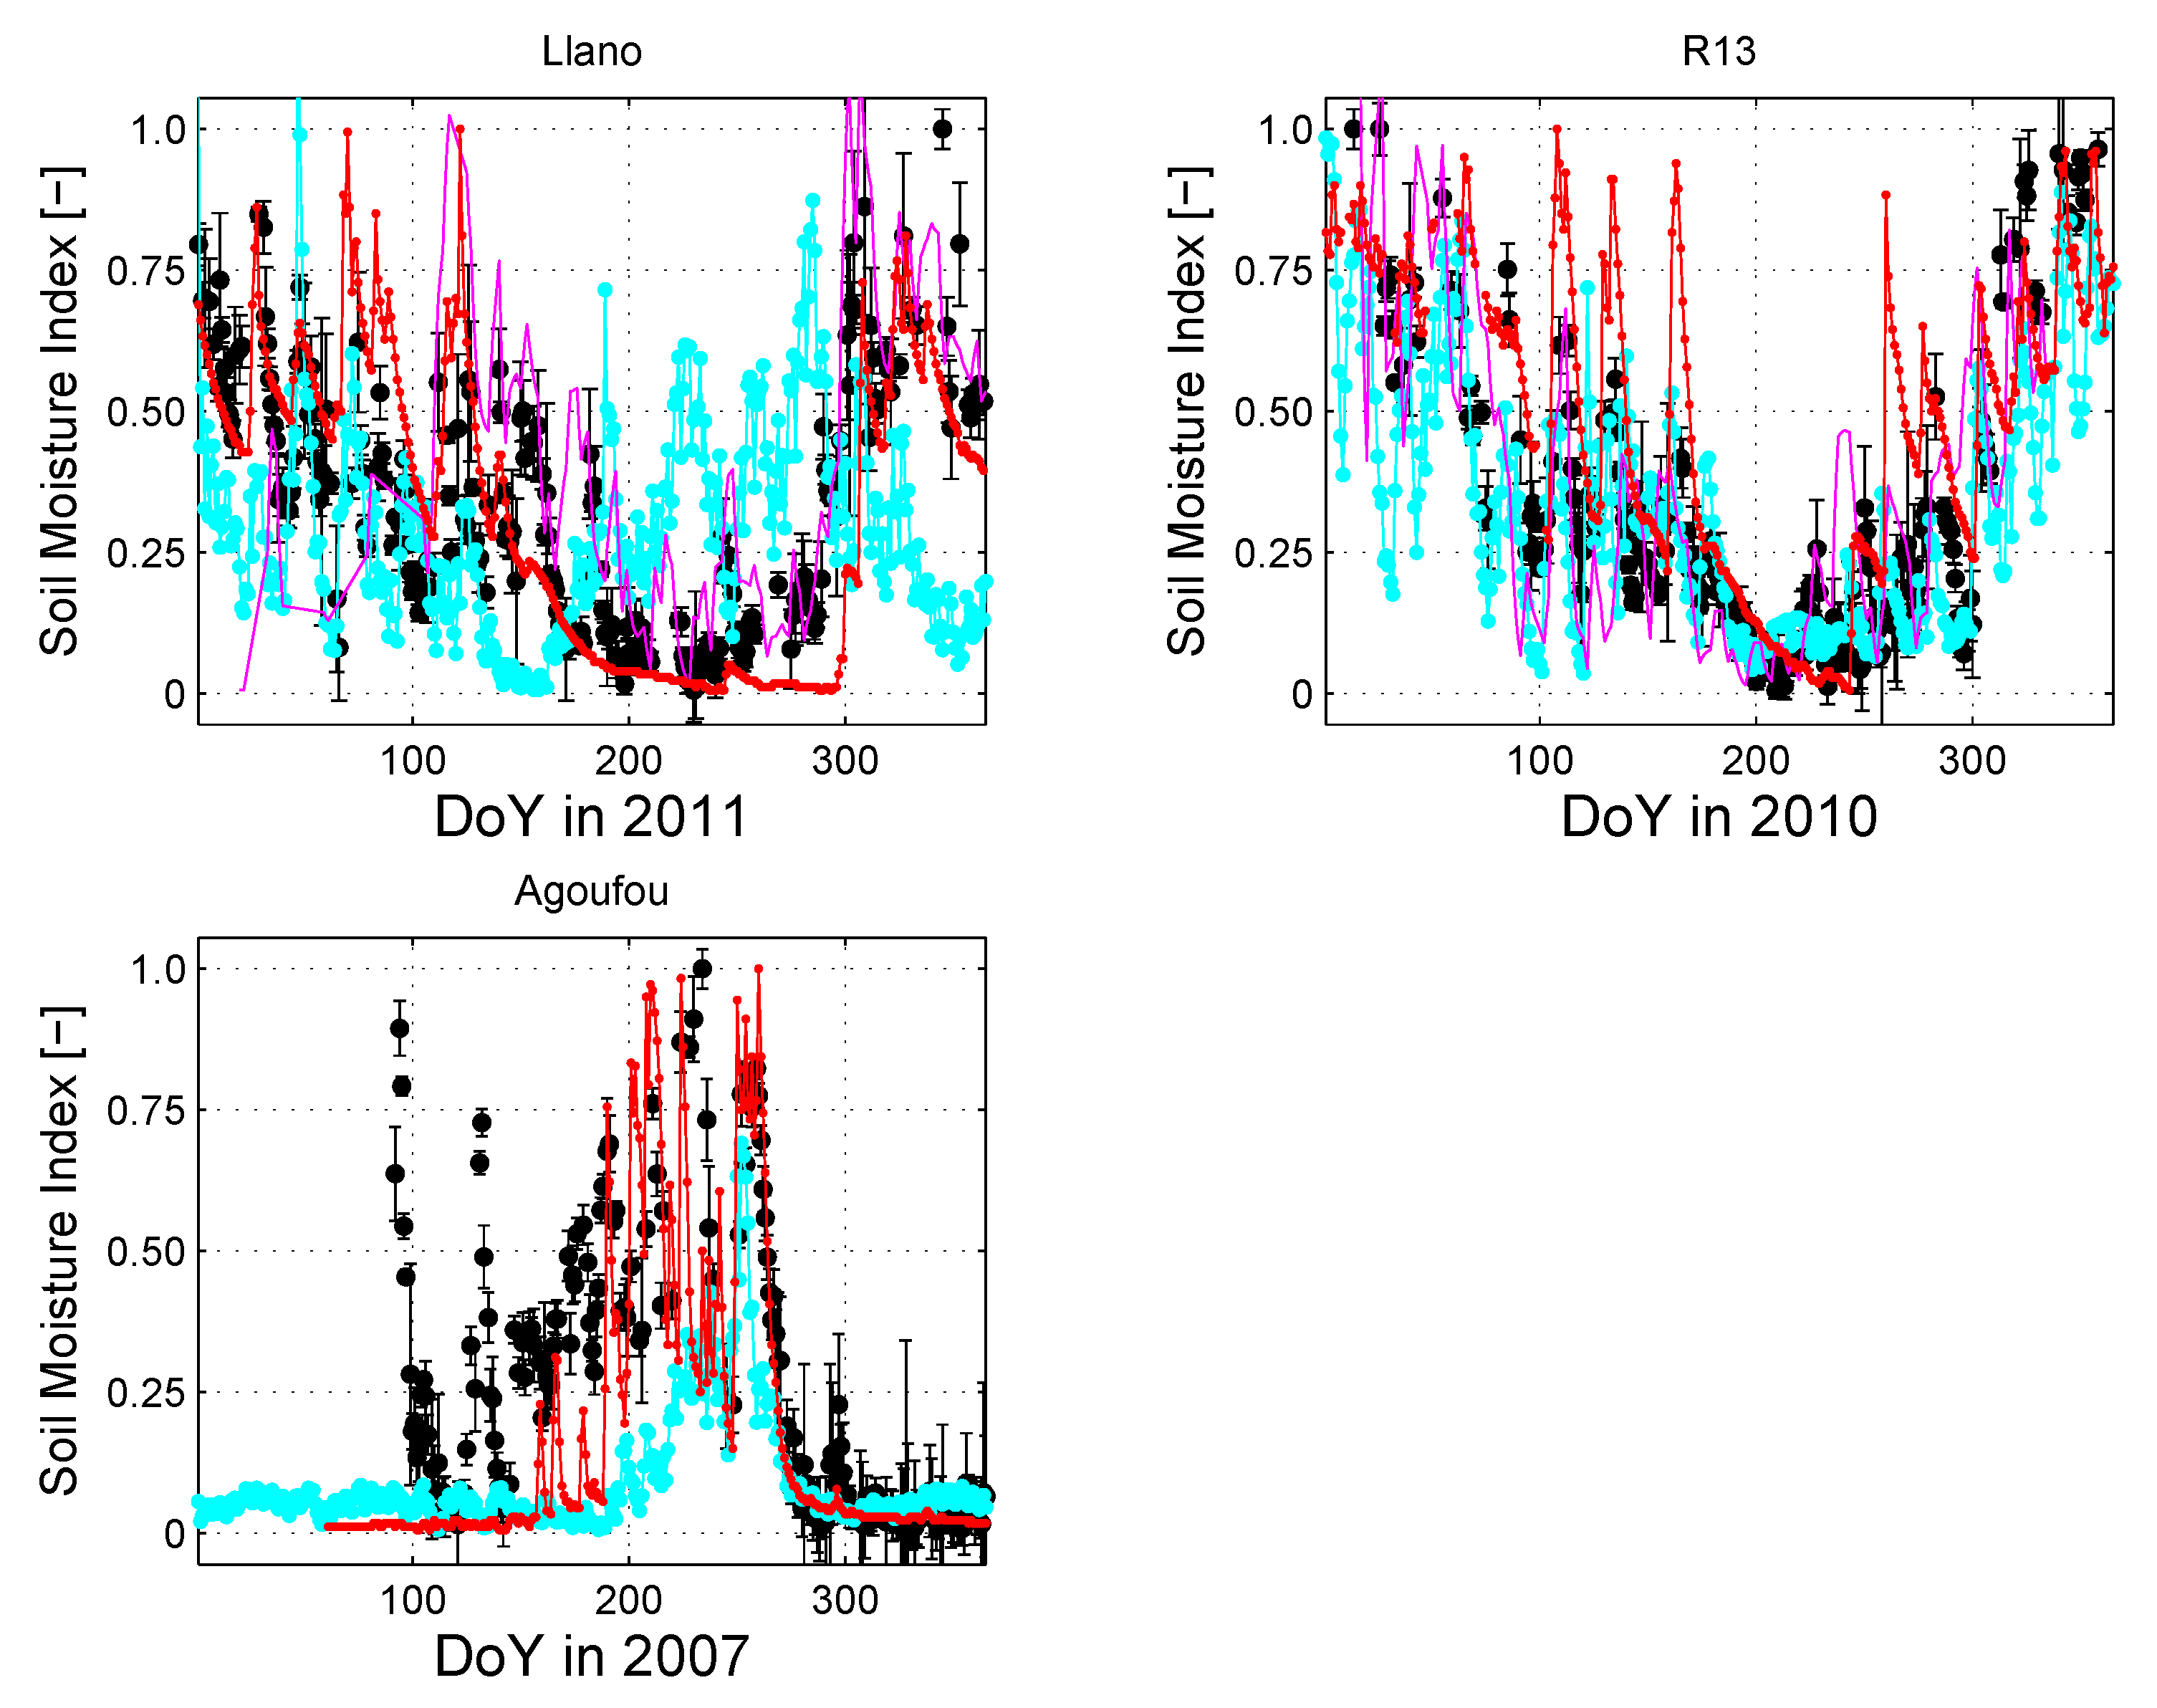
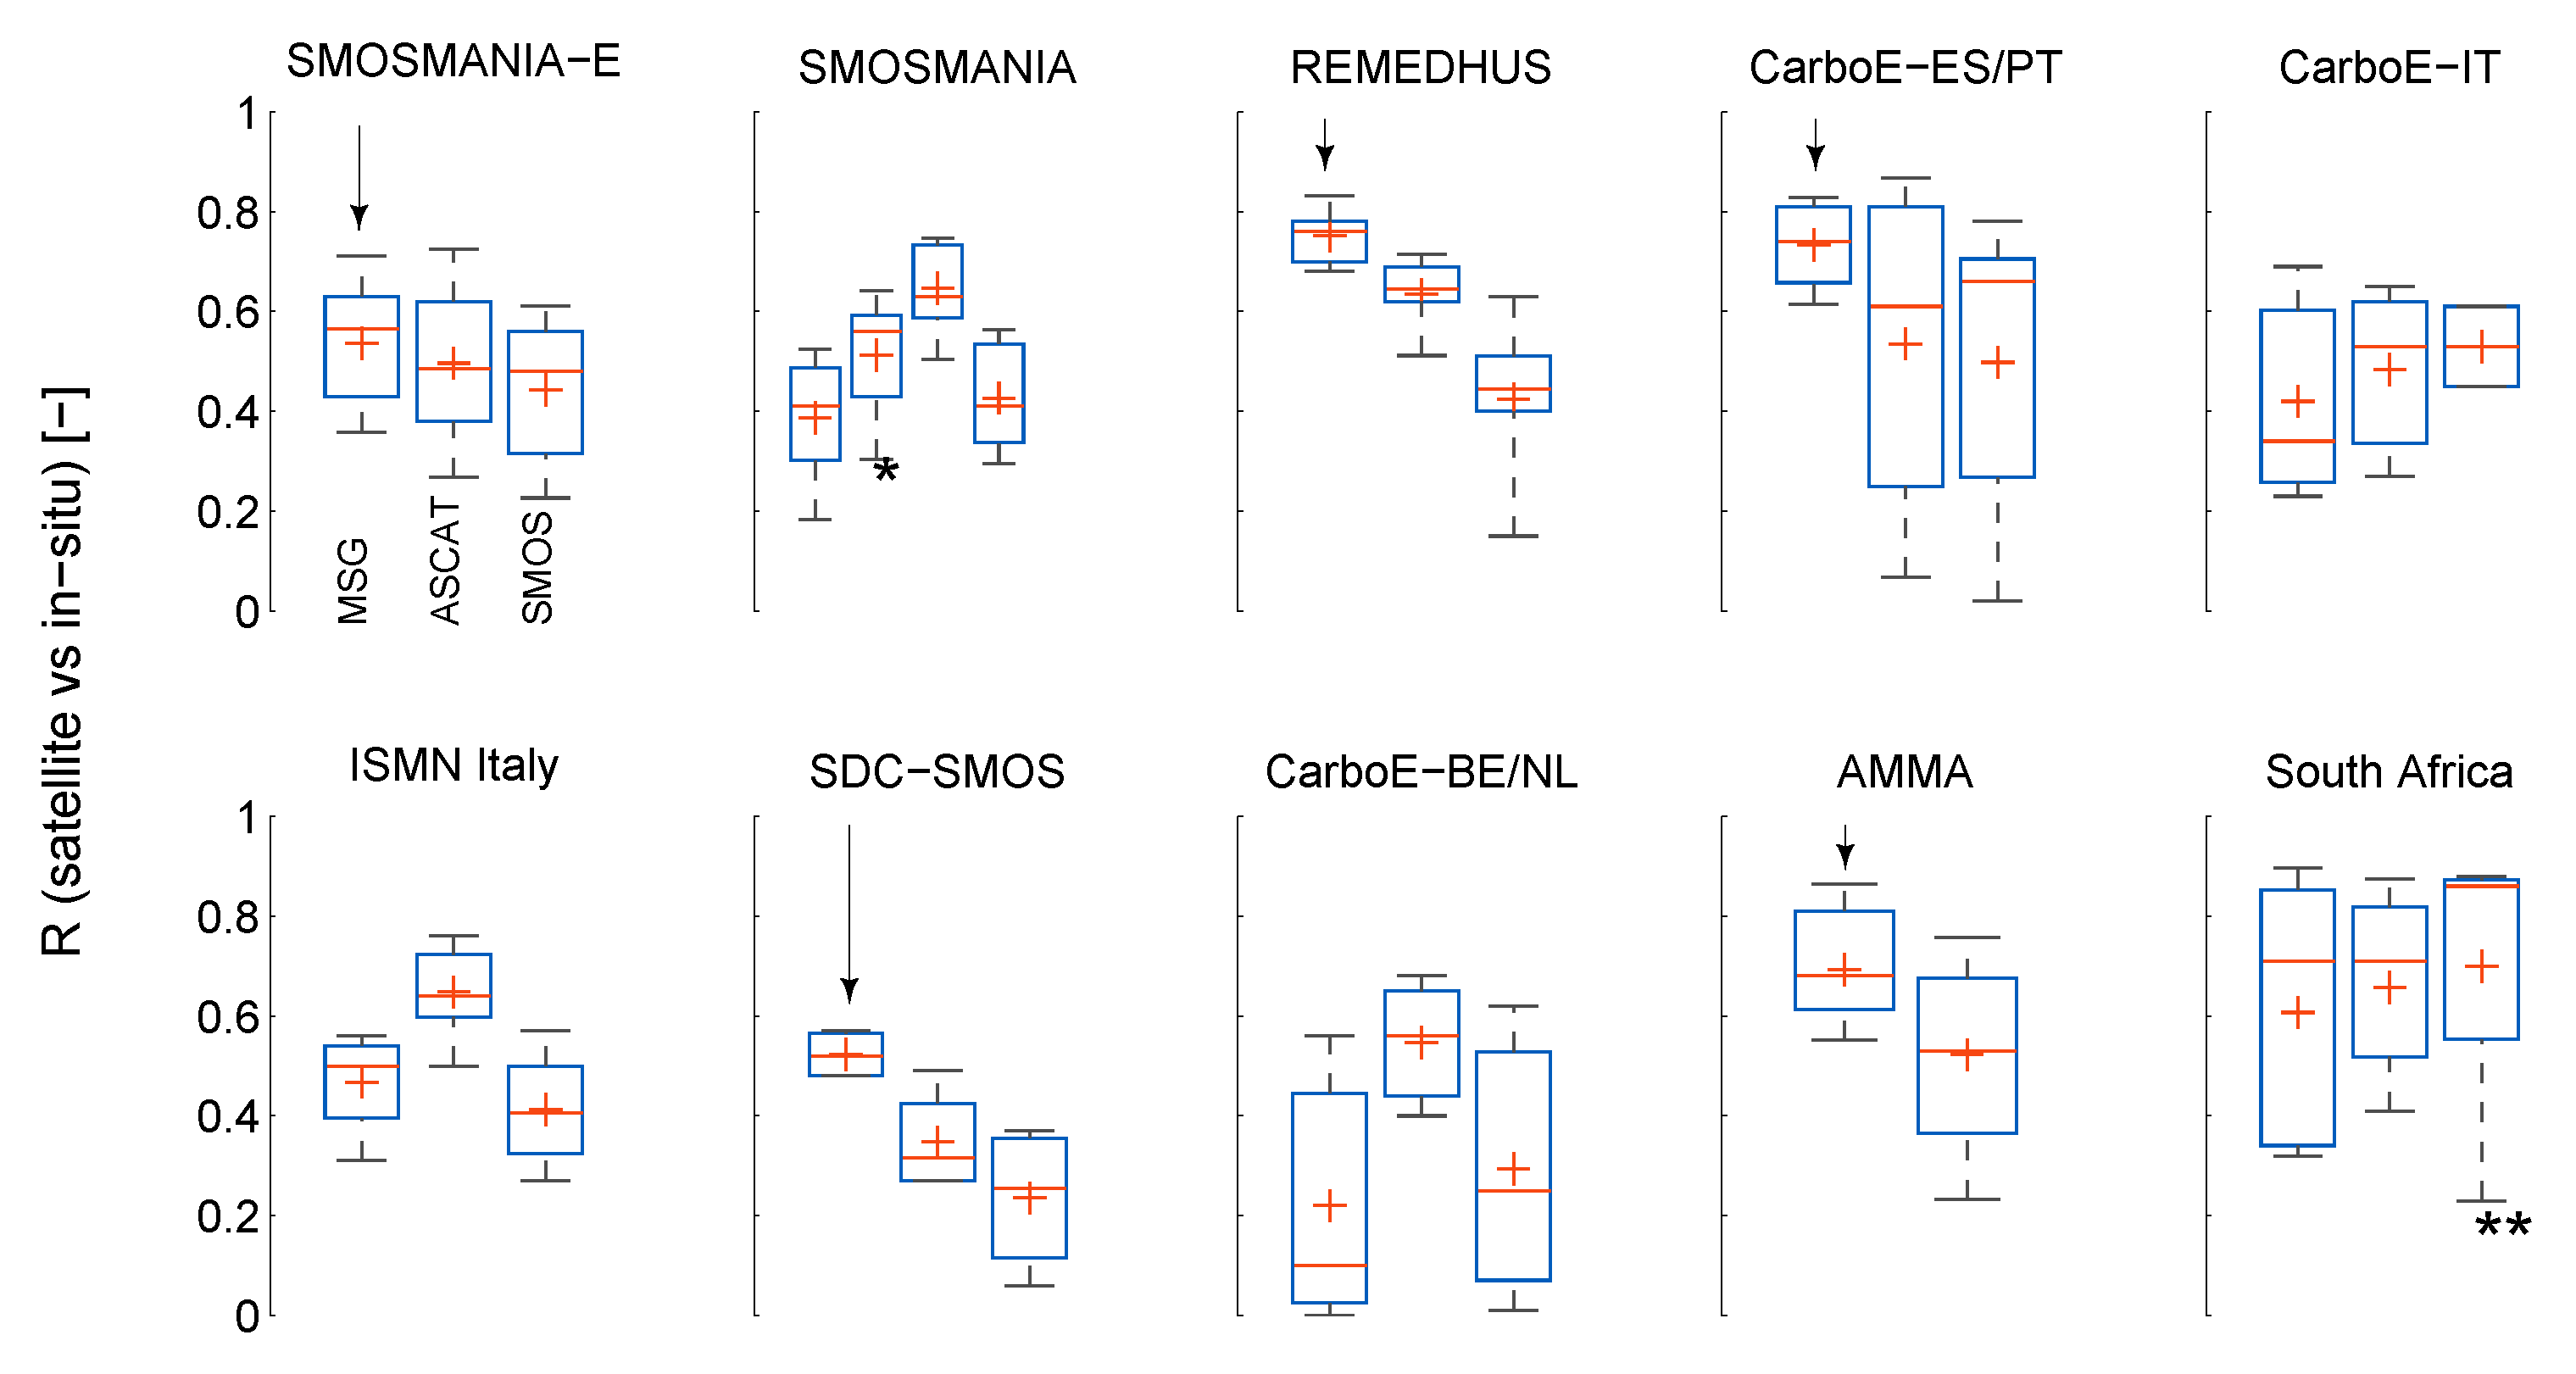
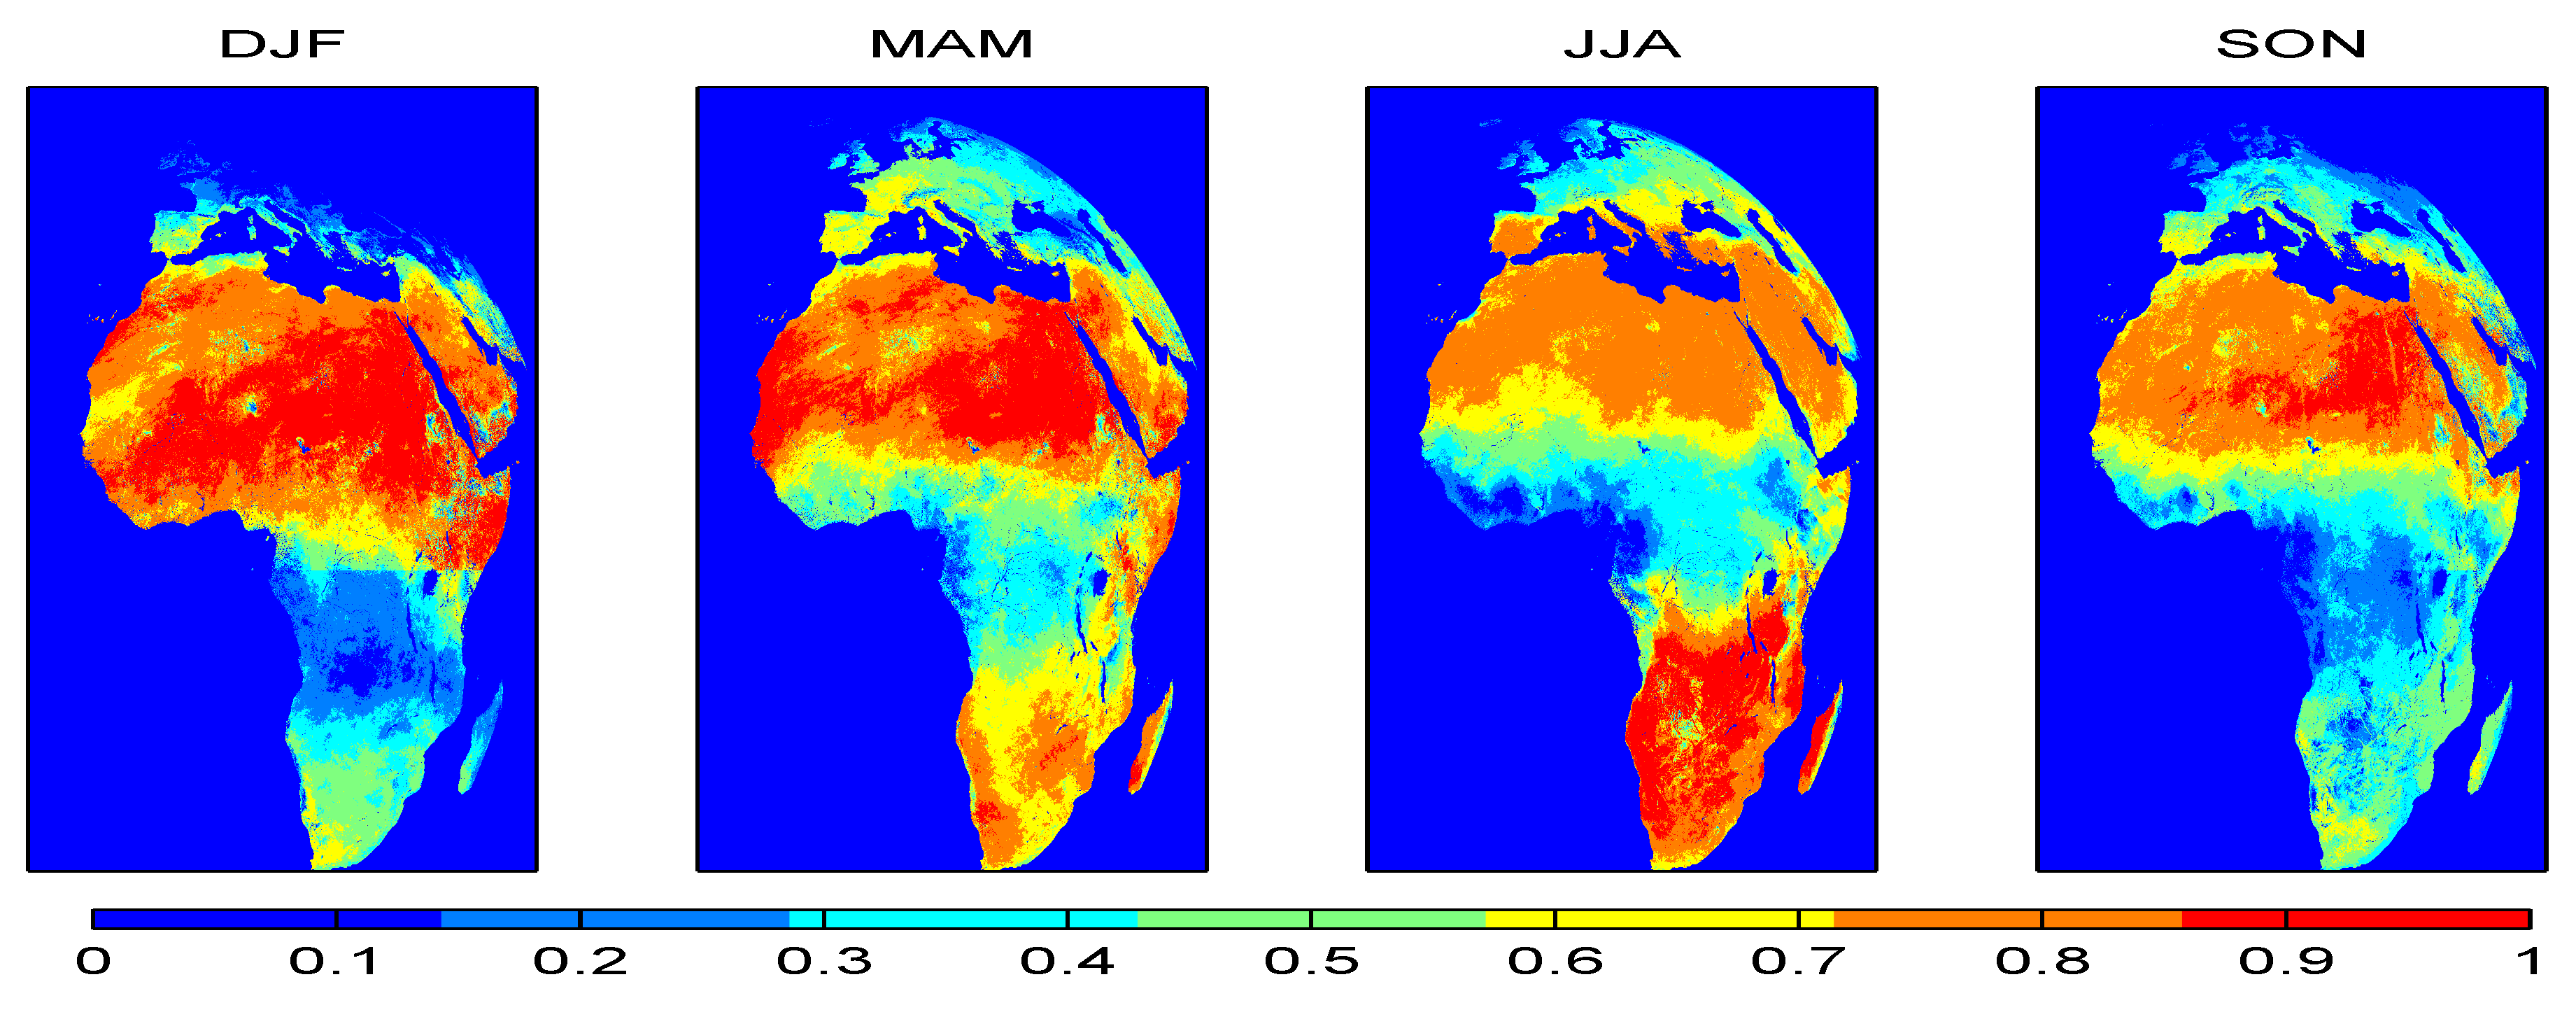
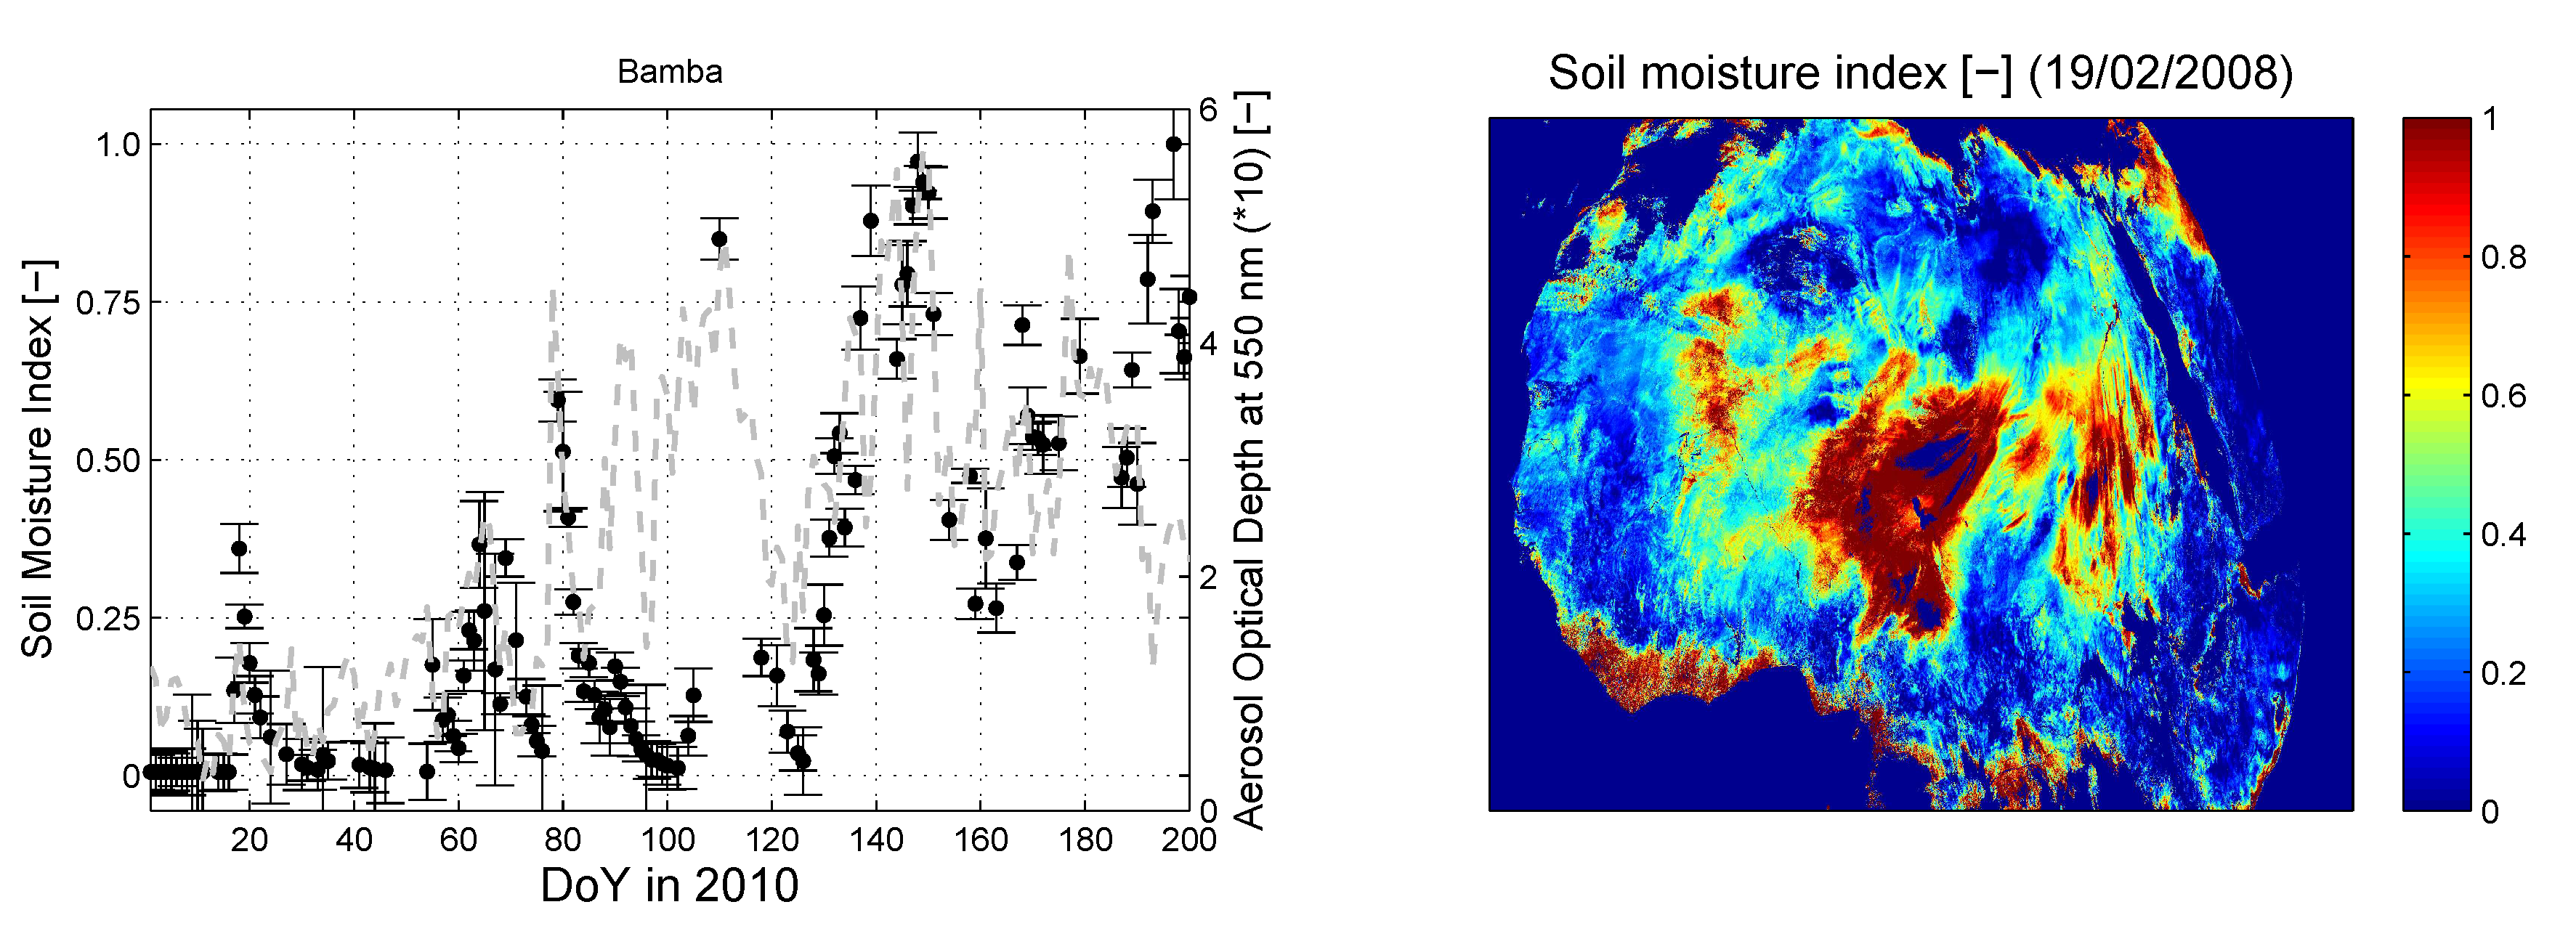
The time series of daily soil moisture derived from TIR remote sensing have been compared to daily averaged local surface soil moisture measurements. Time series are compared to time collocated daily averaged surface soil moisture data. The statistical scores, the standard deviation of both observations and remote sensing retrieval, the root mean square difference between both datasets (RMSD), the bias (in-situ minus satellite) and the correlation coefficient (R), have been calculated for each time series [73].
A synthesis of the statistical scores is presented in a Taylor diagram [76], which allows both a quantitative evaluation of per-time series comparison and a visual interpretation of how the site specific scores compare to each other. It requires the standard deviations from all retrievals to be normalized by the standard deviation of each individual in-situ dataset. Visually, the distance between the observation and the retrieval point gives the relative performance compared to other points. The normalized standard deviation (SDV) indicates if the remote sensing based retrieval can reproduce the locally observed variability: underestimated if less than 1, overestimated otherwise. The correlation coefficient indicates the match in the temporal evolution of the soil moisture, at both diurnal and seasonal scales: 1 is perfect match. In-situ data are represented by a point on the x axis at R = 1 and S D V = 1 , every single time series comparison is displayed in polar coordinates. For the ease of interpretation, we group the results by network, and by climate classes, according to Köppen-Geiger classification [77], reflecting a variety of precipitation and air temperature regimes.
The validation is carried out on the total set of sites, where environmental conditions seem to be the best suitable for MSG/SEVIRI (marked in bold in Table 2), and also encompassing conditions that can be not optimal, but can nevertheless showcase the performance of the new method.
It is clear that a mismatch can be expected between local observations and retrieval from satellite data because of the difference in spatial scale between the observations and remote sensing data [78]. Though this issue has not been considered in Albergel et al. [73], higher correlation between coarser scale soil moisture retrieval and local observations may be found if the local nature of the surface corresponds to the coarse pixel. Several sites are concerned with this representativity issue at MSG/SEVIRI scale. For example, both SMOSMANIA transects in Southern France are concerned in our study: the South-Western transect (SMOSMANIA) consists of sites situated in heavily irrigated areas during summer, and both transects, but mostly the South-Eastern (SMOSMANIA-E), consists of sites nested in hilly to montaineous landscapes. The mapping tool available from french government (http://www.geoportail.gouv.fr/accueil) suggests irrigation fractions within a MSG SEVIRI pixel being around 80% for Montaut and Urgons, between 20% and 80% for Sabrès, 60% around Créon d’Armagnac, 30% around Savenes, between 10% and 20% around Peyrusse-Grande, and less than 5% around Lézignan, Saint-Félix, Lahas and Narbonne. As MSG/SEVIRI is expected to be sensitive to irrigation effects, this will obviously lead to discrepancies. In order to get the most benefits from the SMOSMANIA observations, the statistical scores have been calculated for both the annual time series and on a reduced time series, excluding only the Summer irrigation period, which extends from 20 June to 20 August for maize, the dominant crop type in the area [79], and the results reflected in the comparison with SMOS and ASCAT derived products. For SMOSMANIA-E, some sites are situated at the bottom of steep slopes, leading also potential discrepancies with the satellite signal which encompass terrains at higher altitudes, and slopes (Figure 4).

3. Results

The comparison of surface soil moisture time series shows that the remote sensing data and model seem well adapted to reproduce the observed signal in regions where vegetation is experiencing water stress: seasonality and shorter fluctuations are very well reproduced over arid to semi-arid areas of Spain and Africa, while the signal tends to be noisier and less correlated for temperate sites of Southern France, with scattering increasing for higher latitudes (Figure 5). The retrieved signal is discontinuous at African sites, mostly during the wet season, and at temperate sites throughout the year because of persitent clouds during entire days. For the temperate sites, the retrieved soil moisture captures the dry spells and wet events, however the signal does not match very well the observed amplitude over most SMOSMANIA sites during summer, e.g., St Felix, possibly due to intensive irrigation in the region, as expected (see another example in Figure 6). For the site in Germany, the estimations are less accurate and sparser, a summertime dry spell is correctly retrieved from the satellite information, but another one in Spring is not detected in the local measured soil moisture. For Spain, soil moisture is globally well retrieved compared to in-situ observations. For sites in Africa, the seasonal course is well reproduced, apart from isolated apparent wet events, e.g., in Agoufou, Mali, which coincide with strong dust storm. In this case, the amplitude of top-of-atmosphere brightness temperatures in the infrared spectral window tends to be attenuated over high aerosol loads, if not identified, these may be wrongly interpreted as a wet event. This will be further discussed in the next section.
The statistical scores for each yearly dataset grouped in averages by network and climate zones are provided in Table 3 and Figure 7, along with additional information about the number of daily observations used. This latter information reflects both the availability of the soil moisture retrieved from the satellite and availability of local observations. Averaged correlations for Sahelian (AMMA network) and Iberian sites (REMEDHUS, CarboEurope ES & PT) are around 0.7 (0.69, 0.75 and 0.68, respectively), and with values as high as 0.87 (Figure 7). Retrievals over Southern France and Italy are less correlated to in-situ data, with averages between 0.45 and 0.55, except for one site in CALABRIA which exhibits even lower correlation. Correlations tend to decrease with colder climates. While high correlations are found for the group of sites with Aw climate with an average correlation of 0.81, average correlations between 0.61 and 0.69 are found for the Arid climates (BSk, BSh, Bwk, Bwh). Correlations for the temperate climates C range between 0.44 and 0.66, except for one site (Cwb, 0.88). The cold climate Dfc present a low average correlation of 0.36. Retrievals have a bias around 10%, but a variability comparable to observations. In Figure 7, it is clear that the retrievals have a variation fairly comparable to the observations, with a normalized standard deviation between 0.5 and 1.5 and centered around 1. For most climate groups, the variability of correlations is contained in intervals of approximately 0.2, such that the average correlation gives a good idea of the performance in each class.
Highest scores are found in semi-arid and arid areas with a strong annual cycle in the precipitation regime. Less high correlations are found in Southern France and in Italy, where results are more scattered, and low correlations are found in temperate cold Europe, where variability of soil moisture is not dominated by an annual cycle. This result is not in agreement with the findings of Verstraeten et al. [35], who reported high correlations for european forested sites, with an average correlation of 0.556, during the growing season 1997. Possible explanations for this lower correlation for temperate Europe can be a less accurate retrieval of land surface temperature due to a large viewing angle of the surface and associated problems (a long optical path through the atmosphere leading to a weakened signal from the surface compared to noise generated by atmospheric motion, azimuthal anisotropy effects) and to a decreased contrast in the thermal infrared signal in the presence of denser vegetation covers, that, for Europe, increases with latitude.
Compared to the results of Prigent et al. [52], higher correlations have been found in the present study, which can be attributed either to the modifications of the model or to the selected regions. The application of V2006 model with MODIS data by Veroustraete et al. [80] revealed correlations varying between 0.17 and 0.85 with an average of 0.56 against TDR observations at six sites in China at 1 m depth (deeper than in this study). In a recent study, Zhao and Li [27] reported low correlation between soil moisture from SEVIRI and local observations at the REMEDHUS network, presenting poorer validation results than those shown here. Compared to studies combining two sources of satellite data, for example SMOS and MSG/SEVIRI [81] or ESA CCI and MODIS [82], the results from MSG/SEVIRI alone presented here show a better correlation for daily values for both SMOSMANIA and REMEDHUS sites, which shows the potential of such combinations of products.
The comparison with SMOS and ASCAT products as described in the methodology section allows the observation of similarities and disagreement between the observation techniques from space. In Figure 8, three sites have been chosen to showcase some of those comparisons, which have been extended to all the datasets from 2010 to 2014 and synthetized in Figure 9. The visual comparison of the time series show very good consistency of the satellite retrievals for the site in REMEDHUS network in Spain: a clear marked seasonal pattern and weekly fluctuations are in agreement with the satellite retrievals, although not always exactly in line with the ground observations, especially during summer precipitation events. The comparison over a site in the Southern Spain in 2011 shows a high consistency between surface soil moisture from SMOS, MSG and the ground observation, but a different seasonal pattern from ASCAT SSM, which is quite rare within the datasets examined. The comparison over Agoufou in Mali in 2007 reveals a better consistency of MSG surface soil moisture with observation during the onset of rainy season, while the end of wet season and the beginning of the dry season is equally well reproduced by ASCAT and MSG retrievals. At the end of the dry season (day 100 to 180), MSG retrievals are affected by the attenuation of the signal by aerosols, while ASCAT surface soil moisture shows a consistent dry condition of the soil. These are only visual illustrations of agreements and disagreements between space-based retrieval of surface soil moisture. A more extensive analysis has been conducted to better classify the performance of the three retrieval techniques, and the result presented here.
Scores for various networks are similar to results obtained with ASCAT and SMOS products, which are available at coarser resolution than SEVIRI [73]. The results presented here reveal higher correlations for REMEDHUS, HOBE, UDC-SMOS, but lower correlations for the SMOSMANIA sites. The comparison of the in-situ observations with the datasets from the three different families of sensors aboard satellites, i.e., MSG/SEVIRI, MetOp/ASCAT and SMOS, reveals the high complementarity of the systems for clear to partial cloud cover days over the different climate zones of Europe and Africa (Figure 9). While ASCAT derived daily soil moisture outperforms SMOS for 8 groups over 9 in terms of averaged correlation, SMOS derived soil moisture displays best scores for CarboEurope sites in Italy and for Southern African sites. For the AMMA sites, there was no common timeframe for SMOS and in-situ data, except for Dahra, Senegal, where corrrelation of 0.75 was found.
The soil moisture derived from MSG/SEVIRI in this study performs best over the two other systems in the REMEDHUS, SMOSMANIA-E, CarboEurope-Spain/Portugal and AMMA sites, suggesting a good capability of the new system to monitor surface soil moisture for semi-arid and arid climate zones with a marked dry season (Aw, BSk, Csb). The exclusion of the irrigation period in the evaluation of the TIR based soil moisture at the SMOSMANIA sites shows an improved correlation, from 0.40 to 0.50 in average, in agreement with the scores obtained at SMOSMANIA-E sites.

4. Discussion

The method used to retrieve daily soil moisture has several limitations, related to the nature of the surface, the composition of the local atmosphere and the geometry of viewing, as most remote sensing data for surface analysis from space do. A dense vegetation cover will probably screen or alter the signal from the soil, daily retrieval is not possible for persistent cloudy situations, while transport of dust by wind induces wrong estimations if not properly accounted for. Similar limitations have been documented for the triangle method in [83]. The two last factors are discussed here to give an insight on limitations.

4.1. Availability of Retrievals

Compared to retrievals from microwave sensors aboard polar satellites, the proposed retrieval algorithm has the advantage of being based on high repetition rate data at spatial resolution of 3 to 5 km. However, no information on the surface can be retrieved under persistent cloudy sky situations, contrarily to microwave sensors such as ASCAT onboard MetOp satellites. This inherent limitation due to the observing system affects the use of the retrieval for continuous monitoring of soil moisture. We have analyzed for each year between 2007 and 2011 the proportion of days that were sampled with a sufficient accuracy by the retrieval algorithm over the five years. The respective seasonal averages (December to February, March to May, June to August, September to November) are shown in Figure 10. This analysis reveals that most temperate Europe is sampled less than 10% during winter. Over most of the African continent, the availability varies between 90% during the dry season and down to 40% during the rain season. The Western coast of central Africa could be only sampled up to 30% due to almost constant cloud coverage even during the dry season [84].

4.2. Aerosol Loads and Wind Speed

During the annual dry period over Sahel and Sahara desert, apparent wet events are seen in the soil moisture retrieved from remote sensing. However, such events are not supported by local observations of soil moisture. Those apparent wet peaks may be due to either sand or dust storms, leading to a significant increase in aerosol loads, which in turn affect the radiation budget at the surface and may contribute to smaller daily LST amplitudes. Under very high aerosol optical depth, the LST retrievals may also be subject to higher errors: directly associated to the atmospheric correction or indirectly caused by poorer cloud screening [85,86,87,88]. A physical effect of cooling of the surface by the wind cannot be rulled out either. Surface heating rates seem sensitive to the wind, but most of its influence is limited to almost bare surfaces as shown on Figure 11, where the relative difference of HR between two distinct wind speed regimes (0 to 3 m·s 1 and 6 to 9 m·s 1 , obtained from the European Center for Medium-range Weather Forecasts deterministic short-term forecasts of wind speed at 10 m from the surface) is displayed in the two dimensional space delimitated by the possible heating rates obtained by vegetation density, leaf area index obtained from LSA-SAF, for latitudes under 45 N (Figure 11). However, it is still difficult to disentangle the effect of wind speed and aerosol, as aerosol load may affect the retrievals, especially over the bare soil areas.
In Figure 12, an example of an apparent wet event associated to dust presence in the atmosphere is shown for the 19 February 2008. According to Ben-Ami et al. [89], this released dust was a result of two consecutive days of active emission from the Bodélé depression in Saharian desert, with possible mixing with wild fires. Another example in Bamba, Mali, is shown in Figure 12. The evolution of the retrieved soil moisture seems directly correlated to the evolution of high concentrations of aerosols, as monitored by the MACCII aerosol optical depth product at 1.125 resolution (Addition of 5 types of aerosols: sea salt, dust, organic matter, black carbon and sulphates). Therefore, problems can occur when high aerosol optical depths are not properly taken into account. This is particularly relevant during the agricultural and wild fire season. Whether the poorer performance of soil moisture estimates is associated to enhanced LST errors, associated to deficiencies in the atmospheric correction, poorer cloud screening, or to the impact of those high aerosol loads toghether with near surface wind on the LST dynamics remains to be investigated. It is likeky that all these factors play a role and therefore a proper screening of those retrievals should be conducted with the help of a dedicated aerosol product derived from satellites or assimilation systems. MACC service, now evolved to Copernicus Atmospheric Monitoring Service (CAMS), is an available candidate, however, as its spatial resolution is coarse compared to MSG/SEVIRI, other products could be considered, as AOD products derived from MSG/SEVIRI and produced by the ICARE Data and Service center, AERUS-GEO [90,91].

4.3. Temperate and Cold Climates versus Viewing Angles

In this study, the coldest climate zones sampled are all located in areas where viewing angle is already large. In that case, it is difficult to separate the effects originating from the specific nature of the surface and its response to solar illumination and from the consequences of large viewing angles and long optical paths. Scores presented in the Results section show a poorer performance for the temperate and cold than for warmer climates. It is possible to mitigate the global effect by spatial and temporal averaging. For two sites (BE-Lonzée, BE-Vielsalm, CarboEurope network), we have obtained a time series of heating rates from the average of nine up to twenty five adjacent pixels. The results show a better performance compared to the retrieval based on only one pixel, especially in terms of availability of data: 66 to 70 estimations over 9 months for one pixel and 114 to 120 over the same period for 25 pixels averaged. The correlation is also slightly improved by 10%. Over Belgium in Europe ( 51 N, 1 E), the new applied resolution is therefore approximately 15 km for nine pixels and 25 km for twenty five pixels, which remains below or equal to present time SSM products. Nevertheless, future studies should concentrate on the disentanglement of the effects to better understand the mechanisms.

5. Conclusions

This study aimed at deriving daily surface soil moisture from land surface temperature data retrieved from geostationary satellites under the assumption that only the observation of variations of land surface temperature were necessary. The new proposed retrieval algorithm relies on the local morning heating rates of the land surface based on the 15 min data provided by the Satellite Application Facility on Land Surface Analysis from EUMETSAT MSG/SEVIRI sensor, and is designed to produce surface soil moisture with less than 1 day delay over clear sky and non-steady cloudy (over 10% of the time) conditions. A dataset of eight years (from 2007 to 2014) has been generated over Europe and Africa at the MSG/SEVIRI variable resolution, being 3 km over equatorial Africa, and around 5 km over northern Europe. An extensive quantitative validation of the retrieved soil moisture against in-situ daily averaged ground measurements over 161 site-years across Europe and Africa reveals a good capability of this monitoring system in semi-arid to arid areas, with correlation as high as 0.85, and around 0.7 in average in Sahel, Spain, and Portugal. In those regions, the seasonal behaviour, as well as the day-to-day variations, are well reproduced. Reduced capabilities have been found over temperate areas of Europe. Although warm temperate climates show relatively fair correlations of 0.5 in average, scores in Belgium, the Netherlands and Denmark show poorer results (between 0.25 and 0.40), but the deterioration of scores could potentially be partly mitigated by some minor adaptations, including averaging the data spatially over mutiple pixels (correlation improved of 10% in Belgium). Effects of irrigation on the retrieved surface soil moisture is observed at that resolution, and as been clearly evidenced in South-West of France.
The limitations of the new method are (1) a viewing geometry of the satellite that is optimal neither for northern regions of Europe nor for areas with high topography complexity, (2) a reduced capability over dense vegetated areas, where the ratio noise over signal is significant, (3) a discontinuous monitoring when the sky is overcast during a whole morning, and (4) a high sensitivity to atmospheric aerosol load, giving spurious moist detection in case of a deficient land surface data screening over semi-desert overpassed by dust storms. While the limitations can be mitigated by solutions proposed in this paper, they should be further investigated.
The comparison of scores with available global products for surface soil moisture derived from passive and active microwave satellite data (SMOS L3 SSM and MetOp/ASCAT H25 SSM) shows the competitiveness of the new TIR method in sampling wide areas over clear and non-steady cloudy sky conditions. Especially, the TIR method allowed better surface soil moisture sampling in the Sahel and in Spain, and similar performances over Southern France at the daily time scale. The comparison revealed that none of the three observational techniques works best everywhere, leaving some more research avenues in studying their complementarity.
The study has pointed out several shortcomings in validating satellite retrievals by direct comparison with in-situ observations. Especially, this is the case for partly irrigated districts and some hilly areas, where further instrumentation equipment could be installed in places with spatially scalable observations.
The method proposed in this study relies on an empirical relation between heating rates and surface soil moisture. Given the relatively high degree of success of this model to sample surface soil moisture in large areas of Africa and Europe, future work should focus on the physical interpretation and modeling to better understand the mechanisms.
The methodology is already recommended to derive daily surface soil moisture at the MSG SEVIRI spatial resolution of 3.1 km over Africa and 4 km over Southern Europe, and can potentially be applied to other geostationary satellites to cover other continents. It is expected to be useful in applications needing continental to global soil moisture states to be assimilated by models, especially in regions where in-situ data are scarse and if details about the surface is needed, as for example irrigation. The results could be useful to drought early warning or evaluation of susceptibility to flooding in regions and periods with not completely overcasts days. Since this observation technique is not valid for totally cloud covered sky conditions, other sources of soil moisture data can potentially complement the information provided by thermal inertia to provide an all-weather daily monitoring of soil moisture.
Further research will concentrate on the complementarity between multiple remote sensing techniques, such as SAR, and sensors to achieve a better accuracy and spatial sampling. In this perspective, the disaggregation of the surface soil moisture from SEVIRI, or from microwave sensors, thanks to their combined use with the fine resolution soil moisture estimations from the Sentinel satellites, for example, could be a leap forward in achieving merged systems of more continuous, accurate and detailed surface soil moisture observations.

Author Contributions

Conceptualization, methodology, software, validation, formal analysis, investigation, N.G.; resources, J.-M.B., A.A., J.A., I.T.; data curation, N.G., I.T., A.A.; writing–original draft preparation, N.G.; writing—review and editing, N.G., A.A., J.-M.B., F.G.-M., J.A., O.B., I.T.; supervision, O.B., I.T., vizualization, N.G., J.-M.B.; project administration, F.G.-M.; funding acquisition, F.G.-M., I.T.

Funding

This research was funded by EUMETSAT and the European Space Agency through the PRODEX programme of the Belgian Science Policy.

Acknowledgments

The authors thank the scientists who have contributed to build the soil moisture databases either in the context of FLUXNET or in ISMN and to share this extremely valuable information freely through accessible platforms.

Conflicts of Interest

The authors declare no conflict of interest.

References

  1. Taylor, C.; de Jeu, R.A.M.; Guichard, F.; Harris, P.P.; Dorigo, W. Afternoon rain more likely over drier soils. Nature 2012, 489, 423–426. [Google Scholar] [CrossRef] [PubMed] [Green Version]
  2. Massari, C.; Brocca, L.; Barbetta, S.; Papathanasiou, C.; Mimikou, M.; Moramarco, T. Using globally available soil moisture indicators for flood modelling in Mediterranean catchments. Hydrol. Earth Syst. Sci. Discuss. 2013, 10, 10997–11033. [Google Scholar] [CrossRef]
  3. Gil, M.; Garrido, A.; Hernandez-Mora, N. Direct and indirect economic impacts of drought in the agri-food sector in the Ebro River basin (Spain). Nat. Hazards Earth Syst. Sci. 2013, 13, 2679–2694. [Google Scholar] [CrossRef] [Green Version]
  4. Turner, K.; Georgiou, S.; Clarck, R.; Brouwer, R.; Burke, J. FAO Water Report 27: Economic Valuation of Water Resources in Agriculture: From the Sectoral to a functional Perspective of Natural Resources Management; Technical Report; FAO: Rome, Italy, 2004. [Google Scholar]
  5. Hunsberger, C.; Evans, T.P.; Aide, T.M.; Montoro, J.A.; Borras, S.M.; del Valle, H.F.; Devisscher, T.; Jabbour, J.; Kant, S.; Lopez-Carr, D.; et al. The Fifth Global Environmental Outlook Report, Chapter 3: Land; UNEP: Nairobi, Kenya, 2012; 32p, Available online: http://people.uncw.edu/pricopen/documents/GEO5_report_C3_Land.pdf (accessed on 20 August 2019).
  6. Delworth, T.L.; Manabe, S. The influence of potential evaporation on the variabilities of simulated soil wetness and climate. J. Clim. 1988, 1, 523–547. [Google Scholar] [CrossRef]
  7. Macauley, M.K. Earth Observations in Social Science Research for Management of Natural Resources and the Environment: Identifying the Landsat Contribution. J. Terr. Obs. 2009, 1, 31–51. [Google Scholar]
  8. Koster, R.D.; Houser, P.R.; Engman, E.T.; Kustas, W.P. Remote sensing may provide unprecedented hydrological data. Eos Trans. AGU 1999, 80, 156. [Google Scholar] [CrossRef]
  9. Njoku, E.G.; Entekhabi, D. Passive microwave remote sensing of soil moisture. J. Hydrol. 1996, 184, 101–129. [Google Scholar] [CrossRef]
  10. Njoku, E.G.; Jackson, V.; Lakshmi, V.; Chan, T.; Nghiem, S.V. Soil moisture retrieval from AMSR-E. IEEE Trans. Geosci. Remote 2003, 41, 215–229. [Google Scholar] [CrossRef]
  11. Bartalis, Z.; Wagner, W.; Naeimi, V.; Hasenauer, S.; Scipal, K.; Bonekamp, H.; Figa, J.; Anderson, C. Initial soil moisture retrieval from the METOP-A Advanced Scatterometer. Geophys. Res. Lett. 2007, 34. [Google Scholar] [CrossRef]
  12. Owe, M.; de Jeu, R.; Holmes, T. Multisensor historical climatology of satellite-derived global land surface moisture. J. Geophys. Res. 2008, 113. [Google Scholar] [CrossRef]
  13. Chesters, D. The Scientific Basis for the Advanced Geosynchronous Studies Program; Technical Report; NASA: Washington, DC, USA, 1998. Available online: http://goes.gsfc.nasa.gov/text/ags_science.html (accessed on 20 August 2019).
  14. Wan, Z.M.; Dozier, J. A generalized split-window algorithm for retrieving land-surface temperature from space. IEEE Trans. Geosci. Remote 1996, 34, 892–905. [Google Scholar] [Green Version]
  15. Sellers, W.D. Physical Climatology; The University of Chicago Press: Chicago, IL, USA, 1965. [Google Scholar]
  16. Blanchard, M.B.; Greeley, R.; Goettelman, R. Use of Visible, near Infrared and Thermal Infrared Remote Sensing; NASA Technical Report TM X-62343, NASA: Washington, DC, USA, 1974. [Google Scholar]
  17. Carlson, T.N.; Boland, F.E. Analysis of urban-rural canopy using a surface heat flux/temperature model. J. Appl. Meteorol. 1978, 17, 998–1013. [Google Scholar] [CrossRef]
  18. Watson, K. Geologic applications of thermal infrared images. Proc. IEEE 1975, 63, 128–137. [Google Scholar] [CrossRef]
  19. Becker, F. Thermal Infrared Remote Sensing Principles and Applications; Ispre Courses; A. A. Balkema: Varese, Italy, 1980. [Google Scholar]
  20. Price, J.C. On the analysis of thermal infrared imagery: The limited utility of apparent thermal inertia. Remote Sens. Environ. 1985, 18, 59–73. [Google Scholar] [CrossRef]
  21. Abdellaoui, A.; Becker, F.; Olory-Hechinger, E. Use of Meteosat for mapping thermal inertia and evapotranspiration over a limited region of Mali. J. Clim. Appl. Meteorol. 1986, 25, 1489–1506. [Google Scholar] [CrossRef]
  22. Price, J.C. The Potential of Remotely Sensed Thermal Infrared Data to Infer Surface Soil Moisture and Evaporation. Water Resour. Res. 1980, 16, 787–795. [Google Scholar] [CrossRef]
  23. Carlson, T.N.; Dodd, J.K.; Benjamin, S.G.; Cooper, J.N. Satellite estimation of the surface energy balance, moisture availability and thermal inertia. J. Appl. Meteorol. 1981, 20, 67–87. [Google Scholar] [CrossRef]
  24. Gillies, K.K.; Carlson, T.N. Thermal remote sensing of surface soil water content with partial vegetation cover for incorporation into climate models. J. Appl. Meteorol. 1995, 34, 745–756. [Google Scholar] [CrossRef]
  25. Wagner, W.; Naeimi, V.; Scipal, K.; de Jeu, R.; Martinez-Fernandez, J. Soil moisture from operational meteorological satellites. Hydrolgeol. J. 2007, 15, 121–131. [Google Scholar] [CrossRef]
  26. Garcia, M.I.; Sandholt, P.C.; Ridler, M.; Mougin, E.; Kergoat, L.; Timouk, F.; Fensholt, R.; Domingo, F. Actual Evapotranspiration in Drylands derived from In-Situ and Satellite Data: Assessing Biophysical Constraints. Remote Sens. Environ. 2014, 131, 103–118. [Google Scholar] [CrossRef]
  27. Zhao, W.; Li, A. A Downscaling Method for Improving the Spatial Resolution of AMSR-E Derived Soil Moisture Product Based on MSG-SEVIRI Data. Remote Sens. 2013, 5, 6790–6811. [Google Scholar] [CrossRef] [Green Version]
  28. Song, X.; Leng, P.; Li, X.; Li, X.; Ma, J. Retrieval of daily evolution of soil moisture from satellite-derived land surface temperature and net surface shortwave radiation. Int. J. Remote Sens. 2013, 34, 3289–3298. [Google Scholar] [CrossRef]
  29. Leng, P.; Song, X.; Li, Z.L.; Ma, J.; Zhou, F.; Li, S. Bare surface soil moisture retrieval from the synergistic use of optical and thermal infrared data. Int. J. Remote Sens. 2014, 35, 988–1003. [Google Scholar] [CrossRef]
  30. Dorigo, W.A.; Wagner, W.; Hohensinn, R.; Hahn, S.; Paulik, C.; Xaver, A.; Gruber, A.; Drusch, M.; Mecklenburg, S.; van Oevelen, P.; et al. The International Soil Moisture Network: A data hosting facility for global in situ soil moisture measurements. Hydrol. Earth Syst. Sci. 2011, 15, 1675–1698. [Google Scholar] [CrossRef]
  31. Duguay-Tetzlaff, A.; Bento, V.A.; Göttsche, F.; Stöckli, R.; Martins, J.P.A.; Trigo, I.F.; Olesen, F.; Bojanowski, J.S.; da Camara, C.; Kunz, H. Meteosat Land Surface Temperature Climate Data Record: Achievable Accuracy and Potential Uncertainties. Remote Sens. 2015, 7, 13139–13156. [Google Scholar] [CrossRef] [Green Version]
  32. Murray, T.; Verhoef, A. Moving towards a more mechanistic approach in the determination of soil heat flux from remote measurements—I. A universal approach to calculate thermal inertia. Agric. For. Meteorol. 2007, 147, 80–87. [Google Scholar] [CrossRef]
  33. Mitra, D.S.; Majumdar, T.J. Thermal inertia mapping over the Brahmaputra basin, India using NOAA-AVHRR data and its possible geological applications. Int. J. Remote Sens. 2004, 25, 3245–3260. [Google Scholar] [CrossRef]
  34. Coppola, A.; Basile, A.; Menenti, M.; Buonannno, M.; Colin, J.; Mascellis, R.D.; Esposito, M.; Lazzaro, U.; Magliulo, V.; Manna, P. Spatial distribution and structure of remotely sensed surface water content estimated by a thermal inertia approach. In Remote Sensing for Environmental Monitoring and Change Detection; Owe, M., Neale, C., Eds.; IAHS Publisher: Wallingford, UK, 2007; Volume 316, pp. 1–12. [Google Scholar]
  35. Verstraeten, W.W.; Veroustraete, F.; van der Sande, C.J.; Grootaers, I.; Feyen, J. Soil moisture retrieval using thermal inertia, determined with visible and thermal spaceborne data, validated for European forests. Remote Sens. Environ. 2006, 101, 299–314. [Google Scholar] [CrossRef]
  36. Petropoulos, G.; Carlson, T.N.; Wooster, M.J.; Islam, S. A review of Ts/VI remote sensing based methods for the retrieval of land surface energy fluxes and soil surface moisture. Prog. Phys. Geogr. 2009, 33, 224–250. [Google Scholar] [CrossRef] [Green Version]
  37. Van Doninck, J.; Peters, J.; De Baets, B.; De Clercq, E.; Ducheyne, E.; Verhoest, N.E.C. The potential of multitemporal Aqua and Terra MODIS apparent thermal inertia as a soil moisture indicator. Int. J. Appl. Earth Obs. 2011, 13, 934–941. [Google Scholar] [CrossRef]
  38. Merlin, O.; Malbéteau, Y.; Notfi, Y.; Bacon, S.; Khabba, S.R.; Jarlan, L. Performance Metrics for Soil Moisture Downscaling Methods: Application to DISPATCH Data in Central Morocco. Remote Sens. 2015, 7, 3783–3807. [Google Scholar] [CrossRef] [Green Version]
  39. Wetzel, P.J.; Atlas, D.; Woodward, R.H. Determining soil moisture from geosynchronous satellite infrared data: A feasibility study. J. Clim. Appl. Meteorol. 1984, 23, 375–391. [Google Scholar] [CrossRef]
  40. Anderson, M.C.; Mecikalski, J.M.N.J.R.; Otkin, J.P.; Kustas, W.P. A climatological study of evapotranspiration and moisture stress across the continental U.S. based on thermal remote sensing: II. Surface moisture climatology. J. Geophys. Res. 2007, 112. [Google Scholar] [CrossRef]
  41. Hain, C.R.; Mecikalski, J.R.; Anderson, M.C. Retrieval of an available water-based soil moisture proxy from thermal infrared remote sensing. Part I: Methodology and validation. J. Hydrometeorol. 2009, 10, 663–683. [Google Scholar] [CrossRef]
  42. Parinussa, R.M.; Yilmaz, M.T.; Anderson, M.C.; Hain, C.R.; de Jeu, R.A.M. An intercomparison of remotely sensed soil oisture products at various spatial scales over the Iberian Peninsula. Hydrol. Process. 2014, 28, 4865–4876. [Google Scholar] [CrossRef]
  43. Stisen, S.; Sandholt, I.; Noergaard, A.; Fensholt, R.; Jensen, K.H. Combining the triangle method with thermal inertia to estimate regional evapotranspiration—Applied to MSG-SEVIRI data in the Senegal River basin. Rem. Sens. Environ. 2008, 112, 1242–1255. [Google Scholar] [CrossRef]
  44. Trigo, I.F.; DaCamara, C.C.; Viterbo, P.; Roujean, J.L.; Olesen, F.; Barroso, C.; de Coca, F.C.; Carrer, D.; Freitas, S.C.; Garcia-Haro, J.; et al. The Satellite Application Facility on Land Surface Analysis. Int. J. Remote Sens. 2011, 32, 2725–2744. [Google Scholar] [CrossRef]
  45. Trigo, I.F.; Monteiro, I.T.; Olesen, F.; Kabsch, E. An assessment of remotely sensed land surface temperature. J. Geophys. Res. 2008, 113. [Google Scholar] [CrossRef]
  46. Freitas, S.C.; Trigo, I.F.; Bioucas-Dias, J.M.; Göttsche, F. Quantifying the Uncertainty of Land Surface Temperature Retrievals from SEVIRI/Meteosat. IEEE Trans. Geosci. Remote 2010, 48, 523–534. [Google Scholar] [CrossRef]
  47. Göttsche, F. Validation of land surface temperature products with 5 years of permanent in-situ measurements in 4 different climate regions. In Proceedings of the EUMETSAT Meteorological Satellite Conference, Vienna, Austria, 16–20 September 2013. [Google Scholar]
  48. Ermida, S.L.; Trigo, I.F.; DaCamara, C.C.; Göttsche, F.M.; Olesen, F.S.; Hulley, G. Validation of remotely sensed surface temperature over an oak woodland landscape—The probel of viewing and illumination geometries. Remote Sens. Environ. 2014, 148, 16–27. [Google Scholar] [CrossRef]
  49. Göttsche, F.; Olesen, F.; Trigo, I.F.; Bork-Unkelbach, A.; Martin, M.A. Long term validation of land surface temperature retrieved from MSG/SEVIRI with continuous in-situ measurements in Africa. Remote Sens. 2016, 8, 410. [Google Scholar] [CrossRef]
  50. Rasmussen, M.O.; Pinheiro, A.C.; Proud, S.R.; Sandholt, I. Modeling Angular Dependences in Land Surface Temperatures From the SEVIRI Instrument Onboard the Geostationary Meteosat Second Generation Satellites. IEEE Trans. Geosci. Remote Sens. 2010, 48, 3123–3133. [Google Scholar] [CrossRef]
  51. Grant, I.; Heyraud, C.; Breon, F.M. Continental scale hotspot observations of Australia at sub-degree angular resolution from POLDER. Int. J. Remote Sens. 2004, 25, 3625–3636. [Google Scholar] [CrossRef]
  52. Prigent, C.; Aires, F.; Rossow, W.B.; Robock, A. Sensitivity of satellite microwave and infrared observations to soil moisture at a global scale: Relationship of satellite observations to in situ soil moisture measurements. J. Geophys. Res. 2005, 110. [Google Scholar] [CrossRef] [Green Version]
  53. Ermida, S.; Pires, A.; Trigo, I.F.; da Camara, C. Towards a Harmonized LST Product—The problem of angular anisotropy of LST. In Proceedings of the 6th LSA-SAF Workshop, Reading, UK, 8–10 June 2015. [Google Scholar]
  54. Vinnikov, K.Y.; Yu, Y.; Goldberg, M.D.; Tarpley, D.; Romanov, P.; Laszlo, I.; Chen, M. Angular anisotropy of satellite observations of land surface temperature. Geophys. Res. Lett. 2012, 39. [Google Scholar] [CrossRef]
  55. Vrugt, J.A.; Gupta, H.V.; Bouten, W.; Sorooshian, S. A Shuffled Complex Evolution Metropolis algorithm for optimization and uncertainty assessment of hydrologic model parameters. Water Resour. Res. 2003, 39. [Google Scholar] [CrossRef] [Green Version]
  56. Paulik, C.; Dorigo, W.; Wagner, W.; Kidd, R. Validation of the ASCAT Soil Water Index using in situ datafrom the International Soil Moisture Network. Int. J. Appl. Earth Obs. Geoinf. 2014, 30, 1–8. [Google Scholar] [CrossRef]
  57. Su, C.H.; Ryu, D.; Western, A.W.; Wagner, W. De-noising of passive and active microwave satellite soil moisture time series. Geophys. Res. Lett. 2013, 40, 3624–3630. [Google Scholar] [CrossRef]
  58. Merbold, L.; Ardö, J.; Arneth, A.; Scholes, R.J.; Nouvellon, Y.; de Grandcourt, A.; Archibald, S.; Bonnefond, J.M.; Boulain, N.; Brueggemann, N.; et al. Precipitation as driver of 20 carbon fluxes in 11 African ecosystems. Biogeosciences 2009, 6, 1027–1041. [Google Scholar] [CrossRef]
  59. Pellarin, T.; Laurent, J.; Cappelaere, B.; Decharme, B.; Descroix, L.; Ramier, D. Hydrological modelling and associated microwave emission of a semi-arid region in South-western Niger. J. Hydrol. 2009, 375, 262–272. [Google Scholar] [CrossRef]
  60. Mougin, E.; Hiernaux, P.; Kergoat, L.; Grippa, M.; de Rosnay, P.; Timouk, F.; Dantec, V.L.; Demarez, V.; Lavenu, F.; Arjounin, M.; et al. The AMMA-CATCH Gourma observatory site in Mali: Relating climatic variations to changes in vegetation, surface hydrology, fluxes and natural resources. J. Hydrol. 2009, 375, 14–33. [Google Scholar] [CrossRef] [Green Version]
  61. Cappelaere, B.; Descroix, L.; Lebel, T.; Boulain, N.; Ramier, D.; Laurent, J.P.; Favreau, G.; Boubkraoui, S.; Boucher, M.; Moussa, I.B.; et al. The AMMA Catch observing system in the cultivated Sahel of South West Niger- Strategy, Implementation and Site conditions. J. Hydrol. 2009, 375, 34–51. [Google Scholar] [CrossRef]
  62. de Rosnay, P.; Gruhier, C.; Timouk, F.; Baup, F.; Mougin, E.; Hiernaux, P.; Kergoat, L.; LeDantec, V. Multi-scale soil moisture measurements at the Gourma meso-scale site in Mali. J. Hydrol. 2009, 375, 241–252. [Google Scholar] [CrossRef] [Green Version]
  63. Albergel, C.; Rüdiger, C.; Pellarin, T.; Calvet, J.C.; Fritz, N.; Froissard, F.; Suquia, D.; Petitpa, A.; Piguet, B.; Martin, E. From near-surface to root-zone soilmoisture using an exponential filter: An assessment of the method based on insituobservations and model simulations. Hydrol. Earth Syst. Sci. 2008, 12, 1323–1337. [Google Scholar] [CrossRef]
  64. Calvet, J.C.; Fritz, N.; Froissard, F.; Suquia, D.; Petitpa, A.; Piguet, B. In situ soil moisture observations for the CAL/VAL of SMOS: The SMOSMANIA network. In Proceedings of the International Geoscience and Remote Sensing Symposium, Barcelona, Spain, 23–28 July 2007; pp. 1196–1199. [Google Scholar]
  65. Sánchez, N.; Martinez-Fernandez, J.; Scaini, A.; Perez-Gutierrez, C. Validation of the SMOS L2 Soil Moisture Data in the REMEDHUS Network (Spain). IEEE Trans. Geosci. Remote Sens. 2012, 50, 1602–1611. [Google Scholar] [CrossRef]
  66. Sánchez-Ruiz, S.; Piles, M.; Sánchez, N.; Martinez-Fernandez, J.; Vall-llossera, M.; Camps, A. Combining SMOS with visible and near/shortwave/thermal infrared satellite data for high resolution soil moisture estimates. J. Hydrol. 2014, 516, 273–283. [Google Scholar] [CrossRef]
  67. Bircher, S.; Skou, N.; Jensen, K.; Walker, J.; Rasmussen, L. A soil moisture and temperature network for SMOS validation in Western Denmark. Hydrol. Earth Syst. Sci. Discuss. 2011, 8, 991–10006. [Google Scholar] [CrossRef]
  68. Brocca, L.; Hasenauer, S.; Lacava, T.; Melone, F.; Moramarco, T.; Wagner, W.; Dorigo, W.; Matgen, P.; Martinez-Fernandez, J.; Llorens, P.; et al. Soil moisture estimation through ASCAT and AMSR-E sensors: An intercomparison and validation study across Europe. Remote Sens. Environ. 2011, 115, 3390–3408. [Google Scholar] [CrossRef]
  69. Brocca, L.; Melone, F.; Moramarco, T. On the estimation of antecedent wetness condition in rainfall-runoff modelling. Hydrol. Process. 2008, 22, 629–642. [Google Scholar] [CrossRef]
  70. Brocca, L.; Melone, F.; Moramarco, T.; Morbidelli, R. Antecedent wetness conditions based on ERS scatterometer data. J. Hydrol. 2009, 364, 73–87. [Google Scholar] [CrossRef]
  71. Zreda, M.; Shuttleworth, W.J.; Zeng, X.; Zweck, C.; Desilets, D.; Franz, T.; Rosolem, R.; Ferre, T.P. COSMOS: The cosmic-ray soil moisture observing system. Hydrol. Earth Syst. Sci. 2012, 9, 4505–4551. [Google Scholar] [CrossRef]
  72. Loew, A.; Dall’Amico, J.T.; Schlenz, F.; Mauser, W. The Upper Danube soil moisture validation site: Measurements and activities. In Proceedings of the Earth Observation and Water Cycle Conference, Frascati, Italy, 18 November 2009. [Google Scholar]
  73. Albergel, C.; de Rosnay, P.; Gruhier, C.; Munoz-Sabater, J.; Hasenauer, S.; Isaksen, L.; Kerr, Y.; Wagner, W. Evaluation of remotely sensed and modelled soil moisture products using global ground-based in situ observations. Remote Sens. Environ. 2012, 118, 215–226. [Google Scholar] [CrossRef]
  74. Srivastava, P.; Petropoulos, G.P.; Kerr, Y. Satellite Soil Moisture Retrieval, 1st ed.; Techniques and Applications; Elsevier: Amsterdam, The Netherlands, 2016; pp. 1–448. [Google Scholar]
  75. Hahn, S. Product Validation Report: H-SAF H25 Metop ASCAT DR2015 SSM Time Series 12.5 km Sampling. 2016. Available online: http://hsaf.meteoam.it/documents/PVR/H25_ASCAT_SSM_CDR_PVR_v0.1.pdf (accessed on 20 August 2019).
  76. Taylor, K.E. Summarizing multiple aspects of model performance in a single diagram. J. Geophys. Res. 2001, 106. [Google Scholar] [CrossRef]
  77. Peel, M.C.; Finlayson, B.L.; McMahon, T.A. Updated world map of the Köppen-Geiger climate classification. Hydrol. Earth Syst. Sci. 2007, 11, 1633–1644. [Google Scholar] [CrossRef]
  78. Crow, W.; Berg, A.A.; Cosh, M.H.; Loew, A.; Mohanty, B.P.; Panciera, R.; De Rosnay, P.; Ryu, D.; Walker, J. Upscaling sparse ground-based soil moisture observations for the validation of coarse-resolution satellite soil moisture products. Rev. Geophys. 2012, 50. [Google Scholar] [CrossRef] [Green Version]
  79. Maton, L. Représentation et Simulation des Pratiques Culturales des Agriculteurs à L’échelle Régionale pour Estimer la Demande en eau D’irrigation. Ph.D. Thesis, Institut National Polytechnique de Toulouse, Toulouse, France, 2006. [Google Scholar]
  80. Veroustraete, F.; Li, Q.; Verstraeten, W.W.; Chen, X.; Bao, A.; Dong, Q.; Liu, T.; Willems, P. Soil moisture content retrieval based on apparent thermal inertia for Xinjiang province in China. Int. J. Remote Sens. 2012, 33, 3870–3885. [Google Scholar] [CrossRef]
  81. Piles, M.; Petropoulos, G.P.; Sanchez, N.; Gonzalez-Zamora, A.; Ireland, G. Towards improved spatio-temporal resolution soil moisture retrievals from the synergy of SMOS and MSG SEVIRI spaceborne observations. Remote Sens. Environ. 2016, 180, 403–417. [Google Scholar] [CrossRef] [Green Version]
  82. Peng, J.; Niesel, J.; Loew, A. Evaluation of soil moisture downscaling using a simple thermal-based proxy—The REMEDHUS network (Spain) example. Hydrol. Earth Syst. Sci. 2015, 19, 4765–4782. [Google Scholar] [CrossRef]
  83. Maltese, A.; Capodici, F.; Ciraolo, G.; Loggia, G.L. Soil Water Content Assessment: Critical Issues Concerning the Operational Application of the Triangle Method. Remote Sens. 2015, 15, 6699–6718. [Google Scholar] [CrossRef]
  84. Castaldi, S.; de Grandcourt, A.; Rasile, A.; Skiba, U.; Valentini, R. CO2, CH4 and N2O fluxes from soil of a burned grassland in Central Africa. Biogeosciences 2010, 7, 3459–3471. [Google Scholar] [CrossRef]
  85. Legrand, M.; Plana-Fattori, A.; N’doumé, C. Satellite detection of dust using the IR imagery of Meteosat 1. Infrared difference dust index. J. Geophys. Res. 2001, 106, 18251–18274. [Google Scholar] [CrossRef]
  86. Kaurila, T.; Hagard, A.; Persson, R. Aerosol extinction models based on measurements at two sites in Sweden. Appl. Opt. 2006, 45, 6750–6761. [Google Scholar] [CrossRef] [PubMed]
  87. Mogili, P.K.; Yang, K.H.; Young, M.A.; Kleiber, P.D.; Grassian, V.H. Extinction spectra of mineral dust aerosol components in an environmental aerosol chamber: IR resonance studies. Atmos. Environ. 2008, 42, 1752–1761. [Google Scholar] [CrossRef]
  88. Laskina, O.; Young, M.A.; Kleiber, P.D.; Grassian, V.H. Infrared extinction spectra of mineral dust aerosol: Single components and complex mixtures. J. Geophys. Res. 2012, 117. [Google Scholar] [CrossRef] [Green Version]
  89. Ben-Ami, Y.; Koren, I.; Rudich, Y.; Artaxo, P.; Martin, S.T.; Andreae, M.O. Transport of North African dust from the Bodélé depression to the Amazon Basin: A case study. Atmos. Chem. Phys. 2010, 10, 7533–7544. [Google Scholar] [CrossRef]
  90. Carrer, D.; Roujean, J.L.; Hautecoeur, O.; Elias, T. Daily estimates of aerosol optical thickness over land surface based on a directional and temporal analysis of SEVIRI MSG visible observations. J. Geophys. Res. 2010, 115. [Google Scholar] [CrossRef] [Green Version]
  91. Carrer, D.; Ceamenos, X.; Six, B.; Roujean, J.L. AERUS-GEO: A newly available satellite-derived aerosol optical depth product over Europe and Africa. Geophys. Res. Lett. 2014, 41, 7731–7738. [Google Scholar] [CrossRef]
Figure 1. The viewing zenithal angle (VZA) from MSG/SEVIRI, expressed in degrees, is varying over the study area.
Remotesensing 11 01968 g001
Figure 2. The exponential relation between daily heating rates and ground measurements of surface soil moisture at Tojal, Portugal, has been calibrated with the SCEM-UA algorithm. Each parameters is determined as the median of the probability density function.
Remotesensing 11 01968 g002
Figure 3. The validation sites of the soil moisture retrievals are spread over Europe and Africa, some are situated in challenging environments or settings for satellite remote sensing in terms of complexity of landscapes or topography. Most of the validation sites are grouped in networks, sharing same measurement methodologies, but not necessarily grouped geographically.
Remotesensing 11 01968 g003
Figure 4. The topography around some SMOSMANIA-E sites is not favourable for MSG/SEVIRI soil moisture validation (two examples shown): the contrasts in topography within one pixel do not allow a fair comparison, as noted in the correlation results obtained in this study. Red and green markers indicate the location of the site within its overlapping MSG/SEVIRI pixel.
Remotesensing 11 01968 g004
Figure 5. Comparison of daily surface soil moisture retrieved from MSG/SEVIRI LST (black) and measured locally (grey), for a set of 8 sites from different networks and climates: Agoufou (Mali, AMMA, BWh), Demokeya (Sudan, CarboAfrica, BWh), Dahra (Senegal, AMMA, BSh), Cathedral Peak (South Africa, COSMOS, Cwb), Guarena (Spain, REMEDHUS, BSk), Las Majadas del Tietar (Spain, CarboEurope, Csa), St Felix (France, SMOSMANIA, Cfc), Friedling (Germany, UDC-SMOS, Dfc) (from (top left) to (bottom right)).
Remotesensing 11 01968 g005
Figure 6. The quality of sites representativity within the SEVIRI pixel affects the statistical results obtained. In Sabrès (France), soil moisture retrievals from SEVIRI (black) compares well with ground observations (grey) except in Summer: intensive irrigation is detected, while the ground observation are taken at a non-irrigated site. Removing the summer improves the statistics.
Remotesensing 11 01968 g006
Figure 7. Statistical scores of the comparison between local observations and soil moisture derived from LSASAF LST, presented in a Taylor diagram. Each colored point represents the comparison for a set of data at a in-situ validation site. Codes of colour indicate the climate type region associated to the data. Average of correlations par climate type is represented with bigger symbols next to the correlation curved axis.
Remotesensing 11 01968 g007
Figure 8. The comparison of MSG/SEVIRI (black), SMOS (magenta) and ASCAT (cyan) products (low-pass filter applied) with observations (red) at sites show sometimes strong consistency (R13, REMEDHUS Spain), or disagreement (Llano de los Juanes, Spain and Agoufou, Mali).
Remotesensing 11 01968 g008
Figure 9. The correlation (average (crosses), distribution (boxplot with median, inter-quartile and extrema)) of the SEVIRI retrieval with ground observations is compared to scores obtained with SMOS L3 and ASCAT H25 products. Highest correlations for SEVIRI are obtained in five groups. * Correlation is improved with SEVIRI when removing summer season due to irrigation in the SMOSMANIA area (second box). ** SMOS only available for a selection of site-years.
Remotesensing 11 01968 g009
Figure 10. Tri-monthly availability of daily soil moisture retrieval averaged over 5 years. Cloud cover affects the number of available retrieval, especially over the equator and during winter over Europe. Sahelian regions are well sampled.
Remotesensing 11 01968 g010
Figure 11. Daily heating rates are increasingly sensitive to wind speed over non vegetated areas with up to 15% of change under another wind speed regime.
Remotesensing 11 01968 g011
Figure 12. (Left) Apparent wet peaks from SSM retrieval in Bamba (Mali) are correlated with AOD forecast from MACCII. (Right) Soil moisture retrieved over Africa for 19 February 2008 displays an anomously large wet area in Sahara, due to a large dust storm and local fire emissions.
Remotesensing 11 01968 g012
Table 1. In-situ soil moisture datasets used in this study.
Soil MoistureSoil LayerNumber ofYearsMeasurement
DatasetDepth (cm)Stations Technique/Device
AMMA (West Africa)5132007–2012TDR CSC616
REMEDHUS (Spain)5212007, 2010TDR CSC616
UMSUOL (Italy)1012010TDR 100
UDC-SMOS (Germany)542010IMKO TDR
CALABRIA (Italy)3012010ThetaProbe ML2X
Hydrol-Net-Perugia (Italy)512010TDR-SM Eq Corp TRASE-BE
UMBRIA (Italy)5–1532010ThetaProbe ML2X
VAS (Spain)0–512010Stevens Hydraprobe
HOBE (Denmark)0–5182010Decagon 5TE
CarboItaly (Italy)252007, 2008, 2010, 2011TDR
CarboEurope (Spain & Portugal)0–552007, 2010, 2011ThetaProbe ML2X
CarboEurope (France)222007, 2010, 2011TDR
CarboEurope (Belgium, Netherlands)0–542007, 2010, 2011TDR
CarboEurope (Swiss, Germany, Hungary)0–542007, 2008, 2010TDR
SMOSMANIA (France)5122007, 2010, 2011ThetaProbe ML2X
SMOSMANIA-E (France)592010, 2011ThetaProbe ML2X
CarboAfrica612007–2011, 2013TDR
COSMOS-52007–2009, 2014CosmicRay Probes
Table 2. Climate classification of sites and grouping in this study. The number of sites that seem optimal are marked in bold. The reasons for non-optimality are classified in 3 classes: 1 proximity of large water body, 2 proximity to large irrigated areas, 3 set in a location which topography does not reflect the neighbourhood within the 5 km.
ClimateStations
Tropical Savannah(Aw)AMMA (2), CarboAfrica(1), COSMOS (2)
Arid Steppe hot (Bsh)AMMA (4), CarboAfrica (1)
Arid Steppe Cold (Bsk)VAS (1), REMEDHUS (20), CarboEurope (1 3 )
Arid Desert Hot (Bwh)AMMA (7), CarboAfrica(1)
Arid Desert Cold (Bwk)CarboEurope (2)
Temperate Dry Hot Summer (Csa)SMOSMANIA(-E) (1, 1 1 ), Calabria (1 3 ), Hydrol-Net-Perugia (1 3 ),
CarboEurope (2, 4 1 , 2 , 3 )
Temperate Dry warm Summer (Csb)SMOSMANIA(-E) (2,2 3 ), CarboAfrica (1)
Temperate without dry season, warm summer (Cfb)Umbria (3 3 ), SMOSMANIA (1, 1), COSMOS (1)
Temperate without dry season, cold summer (Cfc)CarboEurope (6), SMOSMANIA(-E) (1, 6 2 , 3 )
Temperate dry winter hot summer (Cwa)CarboAfrica (1), COSMOS (1)
Temperate dry winter warm summer (Cwb)COSMOS (1)
Cold without dry season, cold summer (Dfc)UDC-SMOS (4),
HOBE (18),
SMOSMANIA(-E) (5 2 , 3 )
Table 3. For each network, the average statistical scores of the comparison between the satellite retrievals and the in-situ observations shows the geographical variability of the performance of the developed retrieval strategy. The retrievals are the most accurate over the Mediterranean region and Sahel, and less correlated to soil moisture observations in temperate Europe.
DatasetsRBiasRMSobs/yr (Mean)st-yr
AMMA0.690.170.2620229
CALABRIA0.190.020.21481
COSMOS0.880.090.161545
CarboAfrica0.540.100.251707
CarboEurope
 BE&DE&NL0.39−0.090.30716
 FR&IT&CH0.45−0.010.291509
 ES&PT0.750.100.2122110
 HU0.33−0.070.271122
HOBE0.240.060.297718
Hydrol-Perugia0.56−0.250.351831
REMEDHUS0.680.040.2120824
SMOSMANIA0.390.080.2913926
SMOSMANIA-E0.540.040.2517114
UDC-SMOS0.48−0.160.211034
UMBRIA0.50−0.110.251632
Climate
Aw0.810.120.211718
Bsh0.650.170.2719216
Bsk0.640.030.2220226
Bwh0.610.180.2722311
Bwk0.690.120.232442
Csa0.580.070.2518217
Csb0.530.120.261598
Cwa0.600.070.181222
Cwb0.880.140.171261
Cfb0.660.060.221566
Cfc0.440.010.2713922
Dfc0.360.000.2910741

