Spatially Variable Glacier Changes in the Annapurna Conservation Area, Nepal, 2000 to 2016


1
School of Geography, Politics and Sociology, Newcastle University, Armstrong Building, Level 2, Newcastle upon Tyne NE1 7RU, UK
2
Department of Geography, Durham University, South Rd, Durham DH1 3LE, UK
*
Author to whom correspondence should be addressed.
Remote Sens. 2019, 11(12), 1452; https://doi.org/10.3390/rs11121452
Submission received: 21 May 2019
/
Revised: 5 June 2019
/
Accepted: 13 June 2019
/
Published: 19 June 2019
(This article belongs to the Special Issue Remote Sensing of Glaciers at Global and Regional Scales)
Abstract
:Himalayan glaciers have shrunk rapidly in recent decades, but the spatial pattern of ice loss is highly variable and appears to be modulated by factors relating to individual glacier characteristics. This hinders our ability to predict their future evolution, which is vital for water resource management. The aim of this study is to assess recent glacier changes in the little-studied Annapurna Conservation Area (ACA; area: 7629 km2) in Nepal, and to explore local controls influencing their behaviour. We map changes in glacier area, surface elevation, and ice flow velocity on a large sample of glaciers (n = 162) in the ACA between 2000 and 2016. We found that total glacier area decreased by 8.5% between 2000 and 2014/15. Ice surface velocity changes between 2002 and 2016 were variable, with no clear trend of acceleration or deceleration. The mean surface elevation change for a smaller sample of glaciers (n = 72) was −0.33 ± 0.22 m a−1 between 2000 and 2013/16, which equates to a mean mass balance of −0.28 ± 0.24 m w.e. a−1. There was a trend of increasingly less negative mass balance towards the north. Glaciers that lost the most mass in the north of the ACA tended to have lower maximum elevations, bottom-heavy hypsometries, and were more likely to be avalanche-fed. However, these patterns were not apparent in glaciers in central ACA. There was no significant difference in the mean surface elevation change rate on the ablation zones of debris-covered compared with debris-free glaciers. Our work shows that glaciers in the ACA are losing area and mass at variable rates, but that the influence of local controls is complex, which introduces large uncertainties when predicting their future evolution.

1. Introduction
Glaciers in High Mountain Asia (HMA) are an important component of the global cryosphere [1]. Many of these glaciers have lost mass and area, and have decelerated over the last few decades in response to climate change, e.g., [1,2,3,4], consistent with global trends [5]. For example, recent glacier mass balance estimates for HMA were −0.14 ± 0.08 m w.e. a−1 from 1999 to 2011 [6], −0.18 ± 0.04 m w.e. a−1 from 2000 to 2016 [7], and −0.21 ± 0.05 m w.e. a−1 from 2003 to 2008 [2]. However, there are broad regional spatial variations in mass balance across HMA: the central and eastern Himalayas (Figure 1) show moderate mass losses (−0.22 to −0.33 m w.e. a−1); the western Himalayas have the highest rates of loss (−0.45 to −0.55 m w.e. a−1); and the Karakoram and Pamir (Figure 1) are in balance or even showing mass gains (−0.03 to + 0.14 m w.e. a−1) [2,6]. These east to west gradients in ice loss are thought to reflect the greater influence of the Indian and East Asian monsoons in the central and eastern Himalayas versus the prevailing Mid Latitude Westerlies, which provide precipitation for glaciers in the northwest mountain ranges [8,9]. In general, glacier area change and mass loss also show north to south variation due to the sharp orographic precipitation gradient over the Himalayas caused by the mountains acting as a barrier to the southerly Indian monsoon winds [10,11,12,13]. Nonetheless, the impact of this gradient seems to be variable: some studies observe more positive mass balances [14], higher velocities [15], and smaller retreat rates [15] in the northern Himalayan glaciers compared with southern ones [14,15]. However, in the Everest region (Figure 1), larger surface-lowering rates were observed on glaciers flowing into the Tibetan Plateau on the north side of the mountain range, compared with glaciers in the southern part of the region [16].
Despite these overall trends relating to climatic gradients, glacier mass loss, area loss, and velocity also vary within regions, within catchments, and between neighbouring glaciers [2,16,17,18,19,20]. This has been attributed to controls specific to individual glaciers, including glacier surface gradient [18,19], glacier elevation [14,21], hypsometry (glacier area distribution with elevation) [14,15,22], avalanche inputs [23], and supraglacial debris [6,18]. However, this smaller-scale variability is often poorly captured by Himalayan-wide studies, which limits our ability to predict changes in ice volume in the Himalayas and to understand how glaciers will respond to near-future climate change [2,6]. This is important for forecasting cryospheric contributions to water resources as these glaciers feed into the Indus, Brahmaputra, and Ganges river catchments (Figure 1) that support ~800 million people [1]. Glacier melt helps to maintain baseflows in these catchments outside of the monsoon, reducing the impact of seasonal precipitation variations on discharge [1,24,25]. A better understanding of how glaciers will respond to climate change will also improve our ability to predict the likelihood of these glaciers generating hazards, particularly the formation and growth of glacial lakes, which can cause high magnitude floods if they break through their moraine dams [26,27].
The Annapurna Conservation Area (ACA) is 160 km northwest of Kathmandu and 30 km north of Pokhara (Figure 2). The ACA contains the Annapurna Himal in the south, the Muktinath Himal in the centre, and the Damodar Himal in the north (Figure 2). These upland areas host more than 170 summer accumulation-type glaciers with varying geometry, hypsometry, and supraglacial debris cover (Figure 2). The region also extends across a sharp south to north orographic divide and precipitation gradient, with mean annual rainfall ranging from >4 m a−1 in the south to <0.5 m a−1 in the north [28], and is characterised by highly variable topography and elevation, including several mountains over 7000 m asl (Figure 2). This makes it an excellent location to investigate the influence of local controls on recent glacier change.
The behaviour (area, surface elevation and velocity changes) of these glaciers has not previously been studied in detail, although hypsometry-driven spatially variable glacier behaviour has been inferred from palaeoglaciology research on the south side of the Annapurna Himal [29]. However, glaciers in the ACA covered an area of almost 500 km2 in 2000 (see Section 3.1), and therefore constitute a substantial component of the central Himalayan ice mass which is currently poorly represented in studies of glacier behaviour and mass loss. The ACA glaciers also feed rivers flowing into Pokhara, a large city and tourist hub in Nepal (population ~400,000; Figure 2), and therefore contribute to local water resources. Thus, it is crucial to document regional-scale ice losses and their spatial variability. To address this knowledge gap, the objectives of this study are to (1) investigate recent glacier change between 2000 and 2016 on a large sample of glaciers in the ACA using a range of satellite datasets including Landsat 7 and 8, Shuttle Radar Topography Mission (SRTM), Satellite Pour l’Observation de la Terre (SPOT) 7, and High Mountain Asia (HMA) digital elevation models (DEMs); and (2) assess how individual glacier controls (e.g., geometry, hypsometry, and supraglacial debris) influence spatial variations in area change and mass loss in the region. This is the first study to simultaneously investigate changes in area, surface elevation, and velocity in the ACA, and provides a comprehensive picture of recent glacier behaviour in the region.
2. Materials and Methods
2.1. Data Sources and Acquisition
The remotely sensed datasets used in this study are summarised in Table 1. We focus on glacier changes between 2000 and 2016 because satellite datasets in this period have greater spatial and temporal resolution, which allows us to measure several glacier variables (e.g., changes in glacier area, surface elevation, and ice flow velocity) over a comparable period. A Landsat 7 Enhanced Thermal Mapper Plus (ETM+) scene from 2000 and a Landsat 8 Operational Land Imager (OLI) and Thermal Infrared Sensor (TIRS) scene (2015) from the US Geological Survey (USGS: https://earthexplorer.usgs.gov/) were used to map glacier area changes over the study period (Table 1). A Landsat 8 scene from 2014 was used to map a small number of glaciers (n = 10 or 6% of glaciers) that were obscured by shadow in the 2015 scene. The similarity of the time of year between the 2000 and 2015 scenes (14 days apart in December) minimises the effect of seasonal variability. Two Landsat 7 scenes taken in January and December in 2002 and two Landsat 8 scenes from January and December in 2016 were used to calculate glacier surface velocities (Table 1). We selected imagery from 2016 for the velocity measurements, rather than 2015, because the image pairs had an appropriate interval for feature tracking (<1 year apart; see Section 2.4). All Landsat scenes were chosen because they were cloud-free and had minimal snow-cover.
The non-void-filled 1 Arc-Second Global SRTM digital elevation model (GDEM: USGS) from 2000, was used as the reference elevation dataset in this study because it had the most comprehensive coverage of the study area of any dataset. The absolute geolocation accuracy of the SRTM DEM in Eurasia is 8.8 m and the absolute vertical accuracy is 6.2 m (90% confidence) [30] but, in some areas, it has been shown to be even more accurate [31]. An Advanced Spaceborne Thermal Emission and Reflection Radiometer (ASTER) 14 DEM from 2000 (USGS) was used to fill in a large data void over glacierised areas in the Annapurna Himal in the SRTM GDEM after correcting the DEMs (see Section 2.3.2.), to conduct DEM differencing over this area. This DEM was derived from the closest appropriate ASTER scene to the SRTM capture date (Table 1). Four HMA 8 m resolution DEMs (from the National Snow and Ice Data Centre: https://nsidc.org/data/highmountainasia) [32] were acquired for recent surface elevation datasets. These were chosen for their proximity to 2015 and ranged from 2013 to 2016 (Table 1). The HMA DEMs are automatically generated from very-high resolution satellite imagery using NASA Ames Stereo Pipeline open source software (https://ti.arc.nasa.gov/tech/asr/groups/intelligent-robotics/ngt/stereo/) and have a geolocation accuracy of <5 m CE90/LE90 (circular/linear error at a confidence level of 90%) [32]. Two pairs of 1.5 m resolution SPOT 7 stereo images from 2015 and 2016 (Table 1), from the European Space Agency (ESA), were used to create two additional relative 8 m DEMs to fill in voids in the HMA DEMs. Some voids remained in the SRTM DEM, even after filling in with the ASTER DEM. Therefore, glacier hypsometry, gradient, and avalanche contribution area were derived from an additional SRTM DEM with all voids filled in with 1:50,000 topographic maps of Nepal, available pre-processed and online at Viewfinder Panoramas (http://viewfinderpanoramas.org/) [14,33]. This version of the SRTM DEM was not used to calculate surface elevation changes because the topographic maps used to fill in the DEM were not from a specific date.
2.2. Glacier Area Change
The Annapurna Himal, Muktinath Himal, and Damodar Himal upland areas in the ACA (Figure 2) span a sharp south (wetter) to north (drier) orographic precipitation gradient [28] which might be expected to influence glacier response [15,16]. We therefore analysed glacier changes in these subregions separately to assess the influence of this gradient on glacier change. One glacier previously identified as surge-type (Sabche Glacier, Global Land Ice Measurements from Space—GLIMS ID: G084014E28561N: Figure 2) is excluded from the study because its behaviour is driven by internal instabilities that are not directly related to climate forcing [34]. For simplicity, we developed our own numbering system for unnamed glaciers in the ACA. However, the GLIMS IDs for glaciers in this study are included in Spreadsheet S1, for reference.
Total glacier area in 2000 and 2015 was mapped using a semi-automated technique in Esri ArcMap 10.5. Debris-free glacier areas were mapped using a ratio of the red (wavelengths: 0.63–0.69 for Landsat 7 and 0.636–0.673 for Landsat 8) and near-infrared (NIR; wavelengths: 0.77–0.90 for Landsat 7 and 0.851–0.879 for Landsat 8) spectral bands (TM3/TM5) with a threshold value of 2 [35,36]. We chose this method because it is less time-consuming than manual digitising and because of its high accuracy in similar environments, e.g., [37]. However, we visually verified the accuracy of each glacier outline derived from the band ratio method against the Landsat scenes and edited errors manually. The spectral signature of supraglacial debris is very similar to the surrounding glacier-free terrain and, therefore, the boundary between debris-covered glacier area and non-glacierised terrain is not clearly identifiable using a band ratio method [36]. Instead, we mapped debris-covered glacier areas by deriving slope and plan and profile curvatures [38] from the Advanced Land Observing Satellite (ALOS) Global DEM (Japan Aerospace Exploration Agency: https://www.eorc.jaxa.jp/ALOS/en/aw3d30/index.htm) and applying a cluster analysis to the results using SAGA 2.3.2 software (http://www.saga-gis.org/en/index.html) [39]. Debris-free and debris-covered glacier areas were combined and edited manually during post processing using the Landsat imagery for reference. Ten glaciers (6% of mapped glaciers), which were partially obscured by shadow in the 2015 scene, were manually digitised using a Landsat 8 OLI TIRS scene from 11th October 2014 (marked in red in Spreadsheet S1). We could not map several glaciers (n = 18, 10%) in the ACA due to consistent shadows caused by topography in the satellite imagery. We calculated absolute total glacier area change (km2) and percentage total glacier area change (%) for a sample of 162 glaciers (90% of the glaciers in the ACA), which were clearly visible in both measurement years.
2.3. Surface Elevation Change and Mass Balance
2.3.1. SPOT DEM Generation
We generated the 2015 and 2016 SPOT DEMs in Erdas Imagine 2018 Photogrammetry Suite using the rational polynomial coefficients (RPCs) included with each stereo scene. Each pair of stereo scenes was tied together with ~100 tie points to minimise the triangulation model root mean square error (RMSE: 0.07 pixels for the 2015 DEM and 0.09 pixels for the 2016 DEM). The output spatial resolution of the generated DEMs was 8 m. The SPOT DEMs were relative DEMs, rather than absolute DEMs, because ground control points (GCPs) were not used in their generation. However, this was deemed sufficient for this study because we only assess relative changes. The geolocation accuracy of SPOT DEMs generated without GCPs is <18 m CE90. This is less than the spatial resolution of the SPOT DEMs once resampled to the 30 m reference 2000 SRTM DEM.
2.3.2. Digital Elevation Model Correction
To quantify surface elevation change, all DEMs, including the SPOT DEMs, had to be co-registered and corrected to the reference DEM (SRTM DEM), which was chosen as the reference due to its wide spatial coverage [40,41]. Prior to co-registration and correction, obvious interpolation artefacts (e.g., spikes and holes) in all DEMs were identified using hill-shade models and removed [14]. We then resampled all DEMs to 30 m spatial resolution to match the SRTM DEM. Following this, all DEMs were corrected following the 3-step correction procedure by Nuth and Kääb [40]. This included horizontally and vertically co-registering DEMs to the SRTM DEM by minimising the RMSE of the elevation differences between each DEM pair on stable, glacier-free areas, and checking for—and correcting—elevation-dependent biases and satellite acquisition biases [40]. All DEMs were co-registered separately to the SRTM DEM, apart from the ASTER DEM, which was co-registered to the 2016 SPOT DEM (Table S1) because of a large data void in the SRTM DEM. The mean, standard deviation, and normalised median absolute deviation (NMAD, a measurement of data dispersion which is less sensitive to outliers) [41] of elevation differences on stable off-glacier terrain were calculated for each DEM, before and after correction. These results are summarised in Table S1.
The SRTM DEM was corrected for C-band penetration into snow and ice [2]. A correction of +2.3 m was applied over areas of firn and snow and +1.7 m over clean ice, based on correction values for West Nepal used by Kääb et al. (Table S2 [2]) which they tested against ICESat elevation data [2]. A band ratio of (TM4 × TM2)/TM5 with a threshold of 200 was used to separate firn and snow areas from clean ice areas using a Landsat 7 ETM+ surface reflectance product (Table 1), following the methods of Kääb et al. [2].
2.3.3. DEM Differencing and Post-processing
Elevation change maps were created by differencing the corrected DEMs from the SRTM DEM. The ASTER DEM was differenced from the 2016 SPOT DEM (Table S1) because of a large data void in the SRTM DEM. Glaciers with surface elevation changes derived from the ASTER and SPOT DEMs were excluded from the calculation of mean surface elevation change for the region and analysed separately due to the different 2000 data source. We divided the elevation changes by the interval (in years) between the two DEMs to obtain an annual surface elevation change rate in m a−1. Unrealistic surface elevation changes, classified as pixels that exceeded ±120 m a−1, were removed following methods by King et al. [16]. These pixels were scattered across the study area and tended to be located in areas of very steep terrain and probably resulted from the larger errors that occur on steeper slopes during DEM generation [42]. However, these pixels amounted to <1% of total pixels. In addition, we filtered the elevation change data for outliers, defined as a pixel with a mean value that was more than three standard deviations away from the mean of the surrounding pixels in a moving 21 × 21 pixel (~600 m × 600 m) window. We chose this kernel size because it provided the best balance between removing outliers and not removing real (but large) surface-lowering values on the glacier tongues. Although the glacier surface elevation changes are derived from elevation difference maps spanning a range of intervals (2000 to 2013–2016), we analysed the data together after converting the surface elevation changes to a rate (in m a−1) to gain the most complete picture of regional elevation change possible, given the limited data availability. The footprints and intervals of the elevation difference maps are shown in Figure S1.
Voids in the surface elevation change data, derived from gaps in the HMA DEMs and the removal of obvious DEM errors and outliers, were filled in to estimate glacier mass balance. Small voids in the elevation change data were filled using the elevation void fill function in ArcMap, which uses an inverse distance weighted algorithm and plane fitting to fill in small holes (<2 × 2 pixels) [43]. Larger voids (>2 × 2 pixels) were filled using mean elevation change for the 100 m elevation band in which the pixel was located [6]. An example workflow of DEM correction, outlier filtering and void filling is provided in Figure S2. Glaciers with voids equating to more than 10% of total glacier area prior to infilling, and glaciers with surface elevation changes derived from the ASTER and SPOT DEMs were excluded from mass balance calculations. After removing glaciers with missing data, a final sample of 72 glaciers (41% of the glaciers in the ACA) was used to calculate glacier mean surface elevation change and geodetic mass balance. The glaciers in this smaller sample span a range of sizes and elevations. However, the majority of these glaciers are in the Muktinath Himal and the Damodar Himal with only three in the Annapurna Himal. This means they are not fully representative of the ACA and we focus on the Damodar Himal and Muktinath Himal when interpreting our mass balance results. Geodetic mass balance was calculated from the filled surface elevation change data, assuming an ice density of 850 kg m−3 to convert volume change to mass balance [44].
2.4. Glacier Surface Velocity
Surface displacement maps in the north/south and east/west directions were generated from pairs of Landsat panchromatic scenes from 2002 and 2016 (Table 1) using COSI-Corr software (http://www.tectonics.caltech.edu/slip_history/spot_coseis/download_software.html) [45]. Noise was filtered out by removing pixels with a signal-to-noise ratio < 0.9 [46], and striping in the correlation maps inherited from the source imagery was removed using the software’s in-built de-striping tool. Annual displacements were calculated and then converted to absolute velocity using Pythagoras theorem. An additional magnitude and direction filter was applied to the data by removing displacement vectors that varied in magnitude or direction by more than 30% from the mean value in a 3 × 3 pixel (90 m × 90 m) moving window filter [14]. Any remaining correlation mismatches due to snow, cloud cover, and shadow were identified by cross-referencing the velocity maps with the original imagery and removed manually. The velocity processing workflow is shown in Figure S3. The remotely sensed velocities measured on the lower half of the Annapurna South Glacier tongue in 2016 (ranging from 0 to 21 m a-1), were very similar to stake velocity measurements we obtained in the field in the same area between October 2016 and October 2017 [47], providing us with confidence in the accuracy of our data. Due to voids in the data in both years, it is not possible to quantify area averaged velocity change. However, we made qualitative observations of velocity change between the two years.
2.5. Quantification of Uncertainties
To estimate glacier area measurement uncertainty, we manually digitized a random sample of 10 debris-free and 10 debris-covered glaciers in the ACA five times, and compared the variation (standard deviation) in area between each outline following Paul et al. [37]. The variation between digitised outlines for individual glaciers ranged from <1% to 5% (Table S2), and the mean variation was 2%. The same individual digitised all of the glaciers to ensure consistency in glacier interpretation [37].
Glacier surface elevation change uncertainty was estimated for each elevation difference map using the standard error (SE; standard deviation of mean elevation change) of each 100 m elevation band combined with error estimates for the C-band penetration and seasonal variation [6,14,16,43].
The standard error per 100 m elevation band was calculated by
where SDSTABLE is the standard deviation of stable terrain for each elevation band and N is the effective number of observations, calculated by
where Ntot is the total number of pixels, PS is pixel size, and d is the spatial autocorrelation distance for which we used the value 600 m, following Bolch et al. [48] and King et al. [16]. We excluded elevation bands with fewer than 100 pixels because these added a strong bias to the uncertainty estimates. The total standard error per elevation change map is the sum of SE.
Additional errors associated with C-band penetration (wavelength: ~5.6 cm; frequency: 5.7 GHz) [6,49] and seasonal variation were 1.5 m and 0.15 m w.e. per winter month, respectively [6,14]. These three uncertainty elements were summed quadratically [16] to give a final glacier surface elevation uncertainty per elevation difference map, as summarised in Table S1. We also calculated uncertainty per glacier by weighting the error per elevation band by the hypsometry of each glacier [14,43]. This means that each glacier has an individual error which takes into account the glacier’s specific area-altitude distribution and the spatial variation of uncertainty (Spreadsheet S1). DEM uncertainty tends to increase with elevation and, therefore, glaciers at higher elevations have larger errors to reflect this [43]. When converting from volume to mass balance, an additional 7% error was added to account for uncertainty associated with the density conversion factor [44].
2.6. Topographic Controls
Glacier hypsometry (distribution of glacier area with elevation) has been identified as a control on glacier change rates [14,50]. Hypsometric curves were calculated for each glacier, using the 2000 glacier outlines, by dividing the glacier area into 100 m elevation bands, based on the filled in SRTM DEM, and calculating the area per elevation band. A hypsometric index, to categorise the glaciers into different hypsometry types, was subsequently calculated based on Jiskoot et al. [50] by
where Hmax is the maximum glacier elevation, Hmin is the minimum glacier elevation, and Hmed is the median glacier elevation.
Following this,
The indices were characterised into very top-heavy (HI < −1.5), top-heavy (−1.5 < HI < −1.2), equidimensional (−1.2 < HI < 1.2), bottom-heavy (1.2 < HI < 1.5) and very bottom-heavy (HI > 1.5) glaciers [50].
We assumed that the equilibrium line altitude (ELA) for each glacier was equal to the glacier’s median elevation: the balanced-budget ELAs of glaciers are highly correlated with their median elevations [16,51]. We note that the median glacier altitude tends to be slightly higher than the balanced-budget ELA and should therefore be considered a maximum estimate [51]. Accumulation and ablation zones for each glacier were derived from the ELAs.
Mean total surface gradient and mean gradients for the ablation and accumulation zones of each glacier were calculated as the gradient of a line drawn between (i) the glacier terminus and top of the accumulation zone, (ii) the glacier terminus and the ELA, and (iii) the ELA and the top of the accumulation zone, respectively [19,26].
An avalanche ratio was calculated to assess the importance of avalanche inputs to overall glacier accumulation [52]. This was the ratio between the total area susceptible to avalanche, defined as areas with >30° slopes that lead directly onto the glacier accumulation zone, derived from the pre-processed void-filled SRTM DEM [33] and the total glacier area [52]. We acknowledge that this is a simplification, but this is necessitated by the data available and the area and number of glaciers. We also note that these high altitudes areas, which tend to have steeper slopes, may be affected by a larger error in the DEM [31]. As such, it is used as an overall indicator of the potential relative contribution of avalanche inputs.
3. Results
3.1. Glacier Area Change (2000 to 2014/15)
Between 2000 and 2014/15, total glacier area in the ACA decreased by 41.33 km2 (-8.46%; −0.6% a−1; n = 162; Table 2). Individual glacier percentage area change ranged from +0.73% (MSM019) to −79.02% (M039; Figure 3). Some of the largest percentage area decreases were due to glacier fragmentation (e.g., M039: −79.02%; Figure 3), which added a further nine glaciers to the region over the period (Spreadsheet S1). The largest percentage decreases in glacier area occurred in the Muktinath Himal and the Damodar Himal (Figure 3) with mean percentage decreases of −11.89% and −11.15%, respectively, compared to −6.07% in the Annapurna Himal (Table 2 and Figure 4A). A Kruskal–Wallis test showed that percentage glacier area change was significantly smaller and less negative in the Annapurna Himal compared with the other two subregions (p < 0.05; Figure 4A). There was no significant difference in the rank means of percentage area change in the Muktinath Himal and the Damodar Himal.
3.2. Glacier Surface Elevation Change and Mass Balance (2000 to 2013/16)
Mean glacier surface elevation change (calculated from 72 glaciers: Spreadsheet S1) was −0.33 ± 0.22 m a-1 between 2000 and 2013/16 (Table 2). However, note that this mean value only includes three glaciers from the Annapurna Himal and, as such, may not be representative of the wider ACA region (Table 2). Mean surface elevation change rates on individual glaciers ranged from −1.12 ± 0.01 m a−1 on M134, located in the northwest of the Muktinath Himal (Figure 5B) to 0.24 ± 0.91 m a−1 on KG016, located in the west of the Damodar Himal (Figure 5A). Mean surface elevation change rate was most negative in the Muktinath Himal (−0.43 ± 0.15 m a−1), followed by the Annapurna Himal (−0.31 ± 0.31 m a−1) and the Damodar Himal (−0.19 ± 0.32 m a−1; Table 2). As expected, most glaciers experienced more negative elevation changes towards the glacier terminus (Figure 5). Surface elevation changes on Annapurna South Glacier and MSM005 (Figure 6), derived from the ASTER and 2016 SPOT DEMs (footprint location shown in Figure S1), also show distinctive surface lowering on the glacier tongues. However, on some glaciers (e.g., M018, MSM018, and M005 in Figure 5), maximum surface lowering occurred part-way up the glacier tongue with less negative surface changes at the terminus. The majority of these glaciers were debris-covered (Figure 5). Glacier thickening occurred in the accumulation zones of several glaciers and was most pronounced on glaciers in the Damodar Himal (Figure 5A).
Mean glacier mass balance was −0.28 ± 0.24 m w.e. a−1 between 2000 and 2013/16, based on a sample of 72 glaciers (Table 2). Individual glacier mass balances ranged from −0.95 ± 0.02 (M134) to +0.21 ± 0.97 m w.e. a−1 (KG016: Figure 7). Mean mass balance for the Muktinath Himal (−0.37 ± 0.16 m w.e. a−1) was significantly more negative than for the Damodar Himal (−0.16 ± 0.34 m w.e. a−1; Kruskal–Wallis: p < 0.05; Table 2 and Figure 4B). The mean mass balance in the Annapurna Himal (−0.26 ± 0.33 m w.e. a−1) was not significantly different from the other subregions. Ten glaciers in the ACA had negligible or slightly positive mass balances (0 to 0.21 m w.e. a−1; Figure 7). Six of these were located in the Damodar Himal and were clustered in the northwest of the subregion (e.g., KG016 and KG024; Figure 7). The other four glaciers with no discernible change or positive mass balances were located in the Muktinath Himal, including M025 and M109 (Figure 7). Glaciers with the most negative mass balances were also located in the Muktinath Himal and the majority of these were clustered on the west side of the subregion (e.g., M012 and M134; Figure 7). Mass balance was weakly correlated with area change over the entire region (R2 = 0.19, p < 0.05; Table 3 and Figure 8). Mass balance was strongly correlated with area change in the Damodar Himal (R2 = 0.51, p < 0.05) but there was no significant relationship in the Muktinath Himal (R2 = 0.08, p = 0.07; Table 3). There were not enough observations to assess whether mass balance and area change were related in the Annapurna Himal.
3.3. Glacier Surface Velocities (2002 to 2016).
Surface velocities on glacier tongues in the ACA ranged from 0 to 70 m a−1 in both 2002 (Figure 9A,C,E) and 2016 (Figure 9B,D,F). Surface velocity patterns in the upper glacier areas were less coherent but they exceeded 100 m a−1 on at least one glacier (MSM021; Figure 9E,F). The highest velocities (50 to >100 m a−1) occurred in the Annapurna Himal (Figure 9E,F). Lower velocities (0 to 70 m a−1) were observed on glaciers in the Muktinath Himal and the Damodar Himal and the tongues of several glaciers in these two subregions were stagnant or near-stagnant (0 to 10 m a−1), for example, M018 (Figure 9C,D). We could not quantify velocity change between 2002 and 2016 because of data voids, but from visual inspection of the velocity maps, we identify seven glacier that underwent deceleration in the area closest to the termini (indicated by red arrows in Figure 9). These glaciers were located across the ACA, but most were in the Damodar Himal (Figure 9A,B).
3.4. Local Controls on Glacier Change
3.4.1. Glacier Surface Gradient
Mean glacier surface gradient has been highlighted as an important control on glacier surface elevation change, specifically, that surface lowering is highest on glaciers with low surface gradients [18,19]. We tested this relationship on our sample of 72 glaciers using linear regression (Figure S5). There was no significant relationship between mean glacier gradient, accumulation zone gradient, or ablation zone gradient and glacier mass balance or area change. We also used linear regression to test the relationship between the mean gradient and mean surface elevation change of the ablation zone. There was a very weak positive relationship between the gradient and mean surface elevation change rate in glacier ablation zones in the ACA (R2 = 0.10, p < 0.05; Table 3). This relationship was slightly stronger in the Muktinath Himal (R2 = 0.19, p < 0.05; Table 3), but no significant relationship was found in the Damodar Himal. There were not enough data to test this relationship in the Annapurna Himal. Overall, our data suggest that mean surface gradient had limited impact on glacier elevation change.
3.4.2. Glacier Elevation
We used linear regression to assess the relationship between maximum glacier elevation and (i) mass balance (Figure S6A); and (ii) area change (Figure S6B). We repeated this analysis for minimum elevation. We hypothesised that glaciers with lower minimum and maximum elevations have more negative mass balances and lose more area for a given climate forcing [21]. We found no clear relationship between minimum elevation and mass balance or minimum elevation and area change. There was a very weak positive correlation between maximum elevation and mass balance (R2 = 0.17, p < 0.05; Table 3) and maximum elevation and area change (R2 = 0.16, p < 0.05; Table 3). These relationships were strongest in the Damodar Himal: maximum elevation and mass balance (R2 = 0.27, p < 0.05; Table 3) and maximum elevation and area change (R2 = 0.34, p < 0.05; Table 3). There was no significant relationship between maximum elevation and mass balance (Table 3) and a weak positive relationship between maximum elevation and area change (R2 = 0.11, p < 0.05; Table 3) in the Muktinath Himal (Table 3). There were not enough data to test this relationship in the Annapurna Himal. Our data suggest that glaciers in the Damodar Himal with higher maximum elevations lost less area and mass, but maximum elevation did not have a strong influence on glacier change in the Muktinath Himal.
3.4.3. Glacier Hypsometry
We tested the influence of glacier hypsometry on mass balance, hypothesising that glaciers with high and wide accumulation zones (top-heavy) should have more positive mass balances than bottom-heavy glaciers [14,29,50]. The boxplots in Figure 10 show that bottom or very bottom-heavy glaciers had more negative mass balances than top or very top-heavy glaciers, and equidimensional glaciers had positive and negative mass balances. A Kruskal–Wallis test revealed that the differences in the rank means of the five hypsometry classes were not significant when considered together (Figure 10). However, individual Wilcoxon rank sum tests identified significant differences in the mean mass balance of top-heavy and bottom-heavy glaciers (p < 0.05) and between top-heavy and very bottom-heavy glaciers (p < 0.05; Figure 10). This suggests that top-heavy glaciers had significantly less negative mass balance than bottom- or very bottom-heavy glaciers.
3.4.4. Avalanche Contributions
We assessed the influence of potential avalanche contribution on glacier mass balance and area change by using linear regression to test the hypothesis that glaciers with a higher avalanche likelihood ratio had less negative mass balance and area changes (Figure S7) [23,52]. We found no significant relationship between mass balance and avalanche ratio in all glaciers or in the Muktinath Himal (Table 3). However, there was a significant negative relationship between mass balance and avalanche ratio in the Damodar Himal (R2 = 0.49, p < 0.05; Table 3). No significant relationship was found between area change and avalanche ratio for all glaciers, or for glaciers in the Muktinath Himal, but a significant negative relationship was found between area change and avalanche ratio in the Damodar Himal glaciers (R2 = 0.46, p < 0.05; Table 3). There were not enough data to test these relationships in the Annapurna Himal. Overall, glaciers that were more likely to be avalanche fed in the Damodar Himal lost more area and mass, but the likelihood of avalanche contribution did not have an influence on glacier change in the Muktinath Himal.
3.4.5. Supraglacial Debris
We tested the hypothesis that surface-lowering rates are similar on debris-covered and debris-free glacier areas [6,53]. There was no significant difference in mean surface elevation change rate on the ablation zones of debris-covered glaciers compared with debris-free glaciers (Figure 11A). While some glaciers with debris-covered ablation zones underwent strong surface lowering (< −3 m a−1), e.g., M001 (Figure 5C) and M018 (Figure 5B), several other debris-covered glaciers down-wasted more slowly (−2 to 0 m a−1). Many debris-free glaciers showed comparable surface-lowering rates (<−3 to −2 m a−1) at their termini (Figure 5). We plotted mean surface elevation change rate per 100 m elevation band for both debris-covered and debris-free glacier areas in the ACA to compare surface-lowering rates on the different glacier surface types per elevation band (Figure 11B). There was a strong positive correlation between mean surface elevation change rate and elevation band for debris-free glacier areas (R2 = 0.82, p < 0.05; Figure 11B), showing that surface-lowering rates are greatest at lower elevations. This relationship was weaker on debris-covered glacier areas (R2 = 0.32, p < 0.05). Between elevation bands 4600–4700 m and 5000–5100 m, where debris-covered and debris-free glacier areas overlapped, mean elevation change on the debris-free glacier areas was significantly more negative (0.5 m a−1 on average, p < 0.05) than on debris-covered areas. Above the 5000–5100 m elevation band, elevation changes on both debris-covered and debris-free glacier areas were similar (Figure 11B). While most glaciers had increasingly negative surface elevation changes towards their termini (Figure 5), some glaciers (e.g., M018 and MSM018; Figure 5B,D) had more negative surface elevation changes further up-glacier from the terminus. These surface-lowering patterns tended to coincide with debris-covered areas or the transition areas between debris-covered and debris-free ice (Figure 5). Our data show that although mean surface-lowering rates are similar when directly comparing debris-covered and debris-free glacier ablation zones, the spatial patterns of surface lowering between debris-covered and debris-free glacier areas differ when comparing the surface cover types at the same elevations.
4. Discussion
4.1. Overall Glacier Changes in the ACA
4.1.1. Area Change
Between 2000 and 2014/15, most glaciers in the ACA lost area (total area change: −8.5% and -0.6% a−1) and several glaciers fragmented, creating new, smaller glaciers (Table 2 and Figure 3). This is consistent with general trends of glacier shrinkage across the Himalayas over the last ~50 years [14,21,54,55]. Glacier area in the neighbouring Manaslu region decreased by −8.2% for a comparable period (1999/2000 to 2013) [14]. Between 1962 and 2000, glaciers in the Kanchenjunga-Sikkim region in the eastern Himalayas lost area at a rate of -0.5% a−1 [20]. Glacier area in the Everest region decreased by −0.4% a−1 between 1962 and 2011 [13], and glaciers in the Himachal Pradesh region decreased by −0.5% a−1 between 1962 and 2001 [54].
Glacier area shrinkage was variable across the ACA. Glaciers in the Muktinath Himal (−11.85%) and the Damodar Himal (−11.15%) lost significantly larger mean percentage areas than glaciers in the Annapurna Himal (−6.07%; Figure 4A). We think this is because glaciers in the Annapurna Himal are significantly larger than in the other two subregions (Kruskal–Wallis: p < 0.05; Figure 12A) and therefore have slower response times to climate forcing [56].
Although the overall mean percentage glacier area change in the ACA (−8.5%) and Manaslu region (−8.2%) were similar, subregional patterns of area change differed between the regions. Glaciers in the south of the Manaslu region lost a larger mean percentage area than glaciers in the north [14], whereas our data demonstrate the opposite trend (Figure 3). Moreover, glaciers in the north of the ACA (the Damodar Himal) shrank more (−11.15%) than the northern glaciers in the Manaslu region (−6.7%) [14]. However, glaciers in the northern part of the Manaslu region are mostly larger than glaciers in the Damodar Himal, and are therefore probably responding more slowly to climate forcing.
4.1.2. Surface Elevation Change and Mass Balance
Between 2000 and 2013/16, the mean surface elevation change and mean mass balance of glaciers in the ACA were −0.33 m a−1 and −0.28 m w.e. a−1, respectively (Table 2). This is more negative than the overall mass balance estimates for HMA for similar periods (−0.14 to −0.21 w.e. a−1) [2,6,7] but consistent with moderate mass loss estimates for the central and eastern Himalayas (−0.22 to −0.33 m w.e. a−1) [2,6], and more positive than the strong mass loss in the western Himalayas (−0.45 to −0.55 m w.e. a−1) [2,6]. In comparison to other regions in the Nepalese Himalayas, mean mass balance in the ACA was more positive than in the Everest region (−0.52 m w.e. a−1 between 2000 and 2015) [16] and in line with estimates from the Langtang region (−0.22 m w.e. a−1 between 1974 to 2006 and −0.32 m w.e. a−1 between 1974 to 1999) [18,43]. However, the ACA was more negative than the Manaslu region, where mean surface elevation change was −0.25 m a−1 and mean mass balance was −0.21 m w.e. a−1 between 1999/2000 and 2013 [14]. This highlights important variability in the central Himalayas, within the broad east to west gradient of mass loss in HMA. However, note that glaciers in the Annapurna Himal are not well represented in our sample, which may influence our mean mass balance estimate for the ACA.
Mean mass balance in the Damodar Himal was significantly less negative than in the Muktinath Himal (Figure 4B), suggesting that mass balance in the ACA became increasingly less negative with distance north. Similar north to south glacier change trends have been observed in other parts of HMA. In the Manaslu region, northern glaciers had a significantly more positive mean mass balance than southern glaciers [14]. This was attributed to the higher elevations of the northern glaciers relative to the southern glaciers, which meant the northern glaciers were less vulnerable to warming air temperatures [14]. In the Bhutan Himalayas, glaciers on the northern slopes had lower retreat rates and higher velocities than glaciers on the southern slopes [15]. This was attributed to the decreasing monsoon influence and increasing continentality of glaciers towards the north that is controlled by the orographic barrier, making the northern glaciers less sensitive to changing precipitation and air temperatures [15]. In the Western Kunlun mountains on the Tibetan Plateau, less negative surface-lowering rates on north-facing glaciers compared with south-facing glaciers were thought to be controlled by aspect and/or orographically-driven differences in precipitation [57]. Interestingly, these trends differ from the Everest region, where glaciers north of the orographic divide have a more negative mean mass balance than glaciers in the south [16]. This was attributed to the sharp decrease in precipitation over the divide causing the northern glaciers to be both snow-deprived and subject to increased insolation, due to cloud-free conditions [16].
Our data show that although glaciers in the Damodar Himal have higher maximum elevations than in the Muktinath Himal (Figure 12), glacier mass balance and maximum elevation were only weakly related across the ACA (Table 3). This suggests that increased glacier elevation alone is not an important control on the more positive mass balances observed in the north of the ACA. We hypothesise that these variable spatial patterns of mass balance are also due to the decreasing sensitivity of glaciers to monsoonal variations towards the Tibetan Plateau. However, meteorological data is needed to test this hypothesis. To summarise, glaciers in the northern part of the ACA had more positive mass balances than glaciers further south, which may be due to a decreasing sensitivity to changes in precipitation.
4.1.3. Regional Climate Trends
Area changes (Figure 3) and mass balance (Figure 7) in the ACA are broadly consistent with Himalayan trends in precipitation and air temperature [58,59]. Since 1950, a significant decreasing trend in summer precipitation has been observed across the Himalayas [9] and, between 1981 and 2012, there was a decreasing trend in annual precipitation in the trans-Himalayan and mountain sections of the Gandaki river basin, in which the ACA is located [59]. Although long-term air temperature data are not available specifically for the ACA, air temperature increases were observed across several mountain stations in Nepal between 1980 and 2009, with an acceleration in warming during the last decade [58]. There was also a significant increase in air temperature, including at elevations above 5000 m asl, in the Everest region between 1994 and 2013 outside of the monsoon period [60]. The coincidence of recent glacier area reduction and mean negative mass balance in the ACA and long-term regional trends of increasing air temperature and decreasing precipitation suggests that the recent glacier change trends are related to climate change.
4.1.4. Relationship between Area Change and Mass Balance
There was a weak positive relationship between glacier mass balance and area change in the ACA (Table 3). This relationship was strong in the Damodar Himal but not significant in the Muktinath Himal (Table 3). This indicates that glaciers with the most negative mass balances in the Damodar Himal also lost the most area, but that this was not necessarily the case in the Muktinath Himal. Glaciers in the Muktinath Himal that underwent the smallest area changes (<30%) had some of the most positive and negative mass balances (Figure 8). This suggests that glaciers in this subregion underwent diverse morphological changes over the period, with concurrent area and mass loss occurring on some glaciers, while on other glaciers, these changes were de-coupled. This is particularly interesting because the Muktinath Himal had the smallest variability (range) of area, maximum elevation and hypsometric index values of the subregions, so we would expect similar glacier responses to climate change (Figure 12A–C). This complicates predictions of future glacier change in the subregion.
4.1.5. Ice Flow Velocities
Velocities at most glacier termini in the ACA were <10 m a−1 (Figure 9), indicating that these glaciers were very slow-flowing or stagnant in these areas. However, several glaciers had maximum glacier tongue velocities of between 40 and 70 m a−1 (Figure 9). This is slower than the maximum speeds observed on some of the glacier tongues in the Manaslu region [14] and on the north side of the Himalayan range in Bhutan [15], but faster than the velocities observed on the glacier tongues in the Everest region [22] and on the south-facing Bhutan mountain slopes [15]. This indicates that although many glaciers in the ACA lost mass and area over this period, some glaciers, particularly larger glaciers and those located in the Annapurna Himal, were still flowing relatively rapidly across their whole length. Glaciers with some of the highest velocities in the Annapurna Himal originated at the highest elevations in the region and had wide accumulation zones (e.g., M003 and MSM021; Figure 9E,F), suggesting that elevation and hypsometry were controls on flow speeds, as has been observed in the Everest region [22].
Despite apparent slowdowns on certain glacier tongues in the ACA, others continued to flow at speeds of 11 to 30 m a−1 in 2016 (e.g., KG035, KG041, and M034; Figure 9). These tended to be in balance or have only slightly negative mass balances (Figure 7). Velocity change patterns between 1999 and 2014 in the Manaslu region were similarly variable, with some glaciers accelerating, others decelerating and the remainder maintaining constant velocities [14]. This indicates that unlike in other Himalayan regions, where widespread stagnation has been observed in combination with glacier thinning and mass loss [4] (e.g., the Everest region [16,22]), the health of glaciers in the ACA (and Manaslu) is more variable, which is consistent with less negative mean mass balances observed in these regions [14].
4.2. Local Controls Modulating Glacier Behaviour in Relation to Regional Trends
We investigated the influence of several local controls on glacier change in the ACA to assess their relative importance. These were glacier surface gradient [18,19], minimum and maximum elevation [14], hypsometry [14], avalanche inputs [23,52], and supraglacial debris [6,53]. We will now discuss the significant relationships.
Previous observations in the Himalayas have shown that glaciers located at higher elevations tend to have more positive mass balances and less shrinkage because these elevations have cooler temperatures and more precipitation [14,21]. We found a significant relationship between maximum elevation and glacier change in the Damodar Himal, but this relationship was less strong, or insignificant, in the Muktinath Himal (Table 3). Mean maximum elevation in the Damodar Himal was significantly higher than in the Muktinath Himal (Wilcoxon rank sum test: p < 0.05; Figure 12B) which may mean that maximum elevation influences glacier behaviour but only at higher maximum elevations.
Glaciers in the bottom or very bottom-heavy hypsometric classes had more negative mass balances than top or very top-heavy glaciers (Figure 10). Our data are consistent with observations in the Manaslu region, where glaciers losing most mass in the region tended to have bottom-heavy hypsometries [14] and in the Everest region, where glaciers with more of their ice located in high altitude and wide accumulation zones tended to flow faster [22]. This suggests that glaciers with most of their ice at lower elevations are more vulnerable to climate change, both in the ACA and across the Himalayas. These findings are supported by previous research in the Annapurna Himal which showed that a glacier with a high altitude accumulation zone advanced while a neighbouring lower altitude glacier retreated during the onset of the Holocene [29]. The influence of hypsometry could be due to both warming air temperatures at lower elevations and bottom-heavy glaciers having smaller accumulation zones, which are more affected by changing precipitation trends, leading to shorter response times.
Glaciers with very steep and glacier-free headwalls are more likely to gain mass from avalanches [23]. The contribution of avalanches to Himalayan glacier mass balance is poorly constrained because measurement of these events is very difficult [23,61] but it is thought that avalanches can contribute >95% to total accumulation on some glaciers, allowing them to maintain higher velocities and lower surface-lowering rates than if they were not avalanche-fed [23,52]. However, we found significant negative correlations between glacier avalanche ratio and both mass balance (Table 3) and area change (Table 3) in the Damodar Himal, indicating that in this subregion, glaciers that were more likely to receive avalanche inputs had more negative mass balances and lost more area. This could be because glaciers that were predominantly avalanche-fed were able to exist in locations that would not have been possible if they relied on precipitation inputs alone, and these locations may have become more vulnerable under changing climatic conditions. However, we acknowledge that the avalanche ratio is only a simplified proxy for avalanche inputs which is potentially susceptible to large uncertainties associated with steep slopes, and similar relationships between avalanche ratio and glacier change were not found in the Muktinath Himal (Table 3).
While supraglacial debris over a critical thickness threshold (~2 cm) is thought to inhibit glacier melt [62,63,64,65], several multi-glacier remote sensing studies have observed similar surface-lowering rates on debris-covered and debris-free glaciers [2,6,53]. This demonstrates that its role in accelerating or inhibiting melt over larger spatial scales is still not fully understood [6,18]. We found no significant difference between surface elevation lowering rates in the ablation zones of debris-covered and debris-free glaciers in the ACA (Figure 11A), supporting these previous studies [2,6,19,43,53]. This is attributed to differential melting on debris-covered ice and the development of ice cliffs and supraglacial meltwater pools, which can significantly enhance melt over larger spatial scales, e.g., [66,67,68]. However, we found that while surface elevation change was strongly linearly correlated with elevation on debris-free glacier areas, the same relationship on debris-covered glacier areas was much weaker (Figure 11B). In the lower elevation bands, between 4500–4600 and 5000–5100 m asl, the surface elevation change rate on the debris-covered glacier areas were more positive than on the debris-free areas. However, above the 5000–5100 elevation band, surface elevation change on both debris-covered and debris-free areas were very similar (Figure 11B). This is consistent with the notion that the mass balance gradient on the lower sections of debris-covered glaciers is inverted due to the increasing protective effects of thicker debris towards the terminus [65,69]. Several debris-covered glaciers underwent maximum surface lowering at mid-elevations, rather than at the terminus, further supporting this theory (Figure 5). Similarly, non-linear relationships between surface lowering and elevation on debris-covered glacier areas have been observed in other parts of the Himalayas [14,43,53]. However, it should be noted that debris extent does not give an indication of supraglacial debris thickness on these glaciers, which is an important control on sub-debris ablation rates [70].
A number of Himalayan glacier change studies looking at smaller sample sizes (5 to 30 glaciers) have identified relatively strong links between individual glacier controls and recent glacier change [18,19,43]. However, our study suggests that when looking at larger data samples (>70 glaciers), the influence of these controls can be less clear, due to a more complex dataset (in terms of size, location etc.). This highlights the difficulty of predicting the future evolution of large samples of glaciers and, in particular, those located within the ACA.
5. Conclusions
Our study shows that glaciers in the Annapurna Conservation Area (ACA), central Nepal, thinned and lost mass and area between 2000 and 2016. Glaciers underwent an 8.5% reduction in area (2000 to 2014/15; n = 162) and we recorded a mean surface elevation change of −0.33 m a−1 and a mean mass balance of −0.28 m w.e. a−1 for a smaller sample of 72 glaciers (2000 to 2013/16). These changes are consistent with recent trends in increasing air temperature and decreasing precipitation across the Nepal Himalayas. However, no region-wide trend in velocity was apparent (2002 to 2016) and several glacier tongues were still flowing >10 m a−1, indicating that widespread glacier stagnation has not yet occurred in the ACA as has been reported elsewhere in the Central Himalayas [4]. We observed north to south trends in glacier area change and mass balance, which we attribute to differences in glacier geometry and the orographic divide. The largest glacier mass and area losses occurred in the Muktinath Himal, suggesting that this subregion will be most vulnerable to future increases in air temperature and decreases in precipitation. While surface elevation change rates on the ablation zones of debris-covered and debris-free glaciers across the ACA were not significantly different, supraglacial debris influenced the spatial patterns of glacier surface lowering at specific elevations.
Within these regional trends, glacier changes were heterogeneous and there were distinct differences in behaviour between the Damodar Himal and Muktinath Himal. In the Damodar Himal, glaciers that had lower maximum elevations, bottom-heavy hypsometries, and were more likely to receive inputs from avalanches tended to have more negative mass balances. By contrast, in the Muktinath Himal, these relationships were weak or did not exist, and glacier area change and mass balance were decoupled. This shows that the influence of local controls on individual glacier behaviour in the ACA is complex and varies spatially, especially across large samples of glaciers, presenting an important challenge to predicting their future behaviour. Further research is needed to assess how glacier changes in the ACA relate to local climate conditions and influence local water resources.
Supplementary Materials
The following are available online at https://www.mdpi.com/2072-4292/11/12/1452/s1. Spreadsheet S1: Summary of glacier change data per glacier. Table S1: DEM correction and uncertainties. Table S2: Area change uncertainties. Table S3: Velocity errors on stable terrain. Figure S1: Surface elevation changes. Figure S2: Example workflow to correct, filter, and fill surface elevation difference maps. Figure S3: The surface velocity processing workflow. Figure S4: Velocity error sampling point locations. Figure S5: Scatterplot of mean gradient of the ablation zone and mean surface elevation change of the ablation zone (n = 72). Figure S6: Scatterplots of a) mass balance against maximum elevation and b) area change against maximum elevation. Figure S7: Scatterplots of a) mass balance against avalanche ratio and b) area change against avalanche ratio. The glacier area, surface elevation, mass balance and velocity data from this study are freely available via the lead and corresponding author (A.M.L.).
Author Contributions
A.M.L. designed the study and led the work; J.R.C. and C.R.S. provided guidance on the conceptualization, research content, manuscript structure and suggested figures; A.M.L. conducted the data collection and analysis, led the writing of the manuscript and designed the figures. A.M.L., J.R.C. and C.R.S. contributed to the discussion and interpretation of the results and edited the manuscript.
Funding
This work was funded by the IAPETUS Natural Environment Research Council Doctoral Training Partnership. Grant code: NE/L002590/1.
Acknowledgments
The SPOT stereo satellite images were provided by ESA; the Landsat, SRTM and ASTER satellite datasets were provided by the USGS; the HMA DEMs were provided by National Snow and Ice Data Centre; the SRTM DEM with all voids filled in with 1:50000 topographic maps of Nepal was provided by http://viewfinderpanoramas.org/; and the ALOS Global DEM was provided by Japan Aerospace Exploration Agency. We thank R. Hattersley for assistance with the co-registration of the DEMs.
Conflicts of Interest
The authors declare no conflict of interest. The funders had no role in the design of the study; in the collection, analyses, or interpretation of data; in the writing of the manuscript, or in the decision to publish the results.
References
- Bolch, T.; Kulkarni, A.; Kaab, A.; Huggel, C.; Paul, F.; Cogley, J.G.; Frey, H.; Kargel, J.S.; Fujita, K.; Scheel, M.; et al. The state and fate of Himalayan glaciers. Science 2012, 336, 310–314. [Google Scholar] [CrossRef] [PubMed]
- Kääb, A.; Berthier, E.; Nuth, C.; Gardelle, J.; Arnaud, Y. Contrasting patterns of early twenty-first-century glacier mass change in the Himalayas. Nature 2012, 488, 495–498. [Google Scholar] [CrossRef] [PubMed]
- Azam, M.F.; Wagnon, P.; Berthier, E.; Vincent, C.; Fujita, K.; Kargel, J.S. Review of the status and mass changes of Himalayan-Karakoram glaciers. J. Glaciol. 2018, 64, 61–74. [Google Scholar] [CrossRef] [Green Version]
- Dehecq, A.; Gourmelen, N.; Gardner, A.S.; Brun, F.; Goldberg, D.; Nienow, P.W.; Berthier, E.; Vincent, C.; Wagnon, P.; Trouvé, E. Twenty-first century glacier slowdown driven by mass loss in High Mountain Asia. Nat. Geosci. 2018, 12, 22–27. [Google Scholar] [CrossRef]
- Zemp, M.; Huss, M.; Thibert, E.; Eckert, N.; McNabb, R.; Huber, J.; Barandun, M.; Machguth, H.; Nussbaumer, S.U.; Gartner-Roer, I.; et al. Global glacier mass changes and their contributions to sea-level rise from 1961 to 2016. Nature 2019, 568, 382–386. [Google Scholar] [CrossRef] [PubMed]
- Gardelle, J.; Berthier, E.; Arnaud, Y.; Kääb, A. Region-wide glacier mass balances over the Pamir-Karakoram-Himalaya during 1999–2011. Cryosphere 2013, 7, 1263–1286. [Google Scholar] [CrossRef]
- Brun, F.; Berthier, E.; Wagnon, P.; Kaab, A.; Treichler, D. A spatially resolved estimate of High Mountain Asia glacier mass balances, 2000–2016. Nat. Geosci. 2017, 10, 668–673. [Google Scholar] [CrossRef]
- Yao, T.; Thompson, L.; Yang, W.; Yu, W.; Gao, Y.; Guo, X.; Yang, X.; Duan, K.; Zhao, H.; Xu, B.; et al. Different glacier status with atmospheric circulations in Tibetan Plateau and surroundings. Nat. Clim. Chang. 2012, 2, 663–667. [Google Scholar] [CrossRef]
- Palazzi, E.; von Hardenberg, J.; Provenzale, A. Precipitation in the Hindu-Kush Karakoram Himalaya: Observations and future scenarios. J. Geophys. Res. Atmos. 2013, 118, 85–100. [Google Scholar] [CrossRef]
- Shrestha, A.B.; Wake, C.P.; Mayewski, P.A.; Dibb, J.E. Maximum Temperature Trends in the Himalaya and Its Vicinity: An Analysis Based on Temperature Records from Nepal for the Period 1971–94. J. Clim. 1999, 12, 2775–2786. [Google Scholar] [CrossRef]
- Bookhagen, B.; Burbank, D.W. Topography, relief, and TRMM-derived rainfall variations along the Himalaya. Geophys. Res. Lett. 2006, 33. [Google Scholar] [CrossRef] [Green Version]
- Azam, M.F.; Wagnon, P.; Vincent, C.; Ramanathan, A.L.; Favier, V.; Mandal, A.; Pottakkal, J.G. Processes governing the mass balance of Chhota Shigri Glacier (western Himalaya, India) assessed by point-scale surface energy balance measurements. Cryosphere 2014, 8, 2195–2217. [Google Scholar] [CrossRef] [Green Version]
- Thakuri, S.; Salerno, F.; Smiraglia, C.; Bolch, T.; D’Agata, C.; Viviano, G.; Tartari, G. Tracing glacier changes since the 1960s on the south slope of Mt. Everest (central Southern Himalaya) using optical satellite imagery. Cryosphere 2014, 8, 1297–1315. [Google Scholar] [CrossRef] [Green Version]
- Robson, B.A.; Nuth, C.; Nielsen, P.R.; Girod, L.; Hendrickx, M.; Dahl, S.O. Spatial Variability in Patterns of Glacier Change across the Manaslu Range, Central Himalaya. Front. Earth Sci. 2018, 6. [Google Scholar] [CrossRef] [Green Version]
- Kääb, A. Combination of SRTM3 and repeat ASTER data for deriving alpine glacier flow velocities in the Bhutan Himalaya. Remote Sens. Environ. 2005, 94, 463–474. [Google Scholar] [CrossRef]
- King, O.; Quincey, D.J.; Carrivick, J.L.; Rowan, A.V. Spatial variability in mass loss of glaciers in the Everest region, central Himalayas, between 2000 and 2015. Cryosphere 2017, 11, 407–426. [Google Scholar] [CrossRef] [Green Version]
- Scherler, D.; Bookhagen, B.; Strecker, M.R. Spatially variable response of Himalayan glaciers to climate change affected by debris cover. Nat. Geosci. 2011, 4, 156–159. [Google Scholar] [CrossRef]
- Pellicciotti, F.; Stephan, C.; Miles, E.; Herreid, S.; Immerzeel, W.W.; Bolch, T. Mass-balance changes of the debris-covered glaciers in the Langtang Himal, Nepal, from 1974 to 1999. J. Glaciol. 2015, 61, 373–386. [Google Scholar] [CrossRef] [Green Version]
- Salerno, F.; Thakuri, S.; Tartari, G.; Nuimura, T.; Sunako, S.; Sakai, A.; Fujita, K. Debris-covered glacier anomaly? Morphological factors controlling changes in the mass balance, surface area, terminus position, and snow line altitude of Himalayan glaciers. Earth Planet. Sci. Lett. 2017, 471, 19–31. [Google Scholar] [CrossRef]
- Racoviteanu, A.E.; Arnaud, Y.; Williams, M.W.; Manley, W.F. Spatial patterns in glacier characteristics and area changes from 1962 to 2006 in the Kanchenjunga–Sikkim area, eastern Himalaya. Cryosphere 2015, 9, 505–523. [Google Scholar] [CrossRef]
- Ojha, S.; Fujita, K.; Asahi, K.; Sakai, A.; Lamsal, D.; Nuimura, T.; Nagai, H. Glacier area shrinkage in eastern Nepal Himalaya since 1992 using high-resolution inventories from aerial photographs and ALOS satellite images. J. Glaciol. 2016, 62, 512–524. [Google Scholar] [CrossRef] [Green Version]
- Quincey, D.J.; Luckman, A.; Benn, D. Quantification of Everest region glacier velocities between 1992 and 2002, using satellite radar interferometry and feature tracking. J. Glaciol. 2009, 55, 596–606. [Google Scholar] [CrossRef] [Green Version]
- Laha, S.; Kumari, R.; Singh, S.; Mishra, A.; Sharma, T.; Banerjee, A.; Nainwal, H.C.; Shankar, R. Evaluating the contribution of avalanching to the mass balance of Himalayan glaciers. Ann. Glaciol. 2017, 58, 110–118. [Google Scholar] [CrossRef] [Green Version]
- Immerzeel, W.W.; van Beek, L.P.; Bierkens, M.F. Climate change will affect the Asian water towers. Science 2010, 328, 1382–1385. [Google Scholar] [CrossRef] [PubMed]
- Rowan, A.V.; Quincey, D.J.; Gibson, M.J.; Glasser, N.F.; Westoby, M.J.; Irvine-Fynn, T.D.L.; Porter, P.R.; Hambrey, M.J. The sustainability of water resources in High Mountain Asia in the context of recent and future glacier change. Geol. Soc. Lond. Spec. Publ. 2018, 462, 189–204. [Google Scholar] [CrossRef]
- Quincey, D.J.; Richardson, S.D.; Luckman, A.; Lucas, R.M.; Reynolds, J.M.; Hambrey, M.J.; Glasser, N.F. Early recognition of glacial lake hazards in the Himalaya using remote sensing datasets. Glob. Planet. Chang. 2007, 56, 137–152. [Google Scholar] [CrossRef]
- Rounce, D.; Watson, C.; McKinney, D. Identification of Hazard and Risk for Glacial Lakes in the Nepal Himalaya Using Satellite Imagery from 2000–2015. Remote Sens. 2017, 9, 654. [Google Scholar] [CrossRef]
- Bookhagen, B.; Burbank, D.W. Toward a complete Himalayan hydrological budget: Spatiotemporal distribution of snowmelt and rainfall and their impact on river discharge. J. Geophys. Res. 2010, 115. [Google Scholar] [CrossRef] [Green Version]
- Pratt-Sitaula, B.; Burbank, D.W.; Heimsath, A.M.; Humphrey, N.F.; Oskin, M.; Putkonen, J. Topographic control of asynchronous glacial advances: A case study from Annapurna, Nepal. Geophys. Res. Lett. 2011, 38. [Google Scholar] [CrossRef] [Green Version]
- Farr, T.G.; Rosen, P.A.; Caro, E.; Crippen, R.; Duren, R.; Hensley, S.; Kobrick, M.; Paller, M.; Rodriguez, E.; Roth, L.; et al. The Shuttle Radar Topography Mission. Rev. Geophys. 2007, 45. [Google Scholar] [CrossRef] [Green Version]
- Becek, K. Investigating error structure of shuttle radar topography mission elevation data product. Geophys. Res. Lett. 2008, 35. [Google Scholar] [CrossRef]
- Shean, D.E.; Alexandrov, O.; Moratto, Z.M.; Smith, B.E.; Joughin, I.R.; Porter, C.; Morin, P. An automated, open-source pipeline for mass production of digital elevation models (DEMs) from very-high-resolution commercial stereo satellite imagery. ISPRS J. Photogramm. Remote Sens. 2016, 116, 101–117. [Google Scholar] [CrossRef] [Green Version]
- De Ferranti, J. Viewfinder Panorama DEMs [Online]. 2012. Available online: http://viewfinderpanoramas.org/ (accessed on 22 March 2019).
- Lovell, A.M.; Carr, J.R.; Stokes, C.R. Topographic controls on the surging behaviour of Sabche Glacier, Nepal (1967 to 2017). Remote Sens. Environ. 2018, 210, 434–443. [Google Scholar] [CrossRef] [Green Version]
- Racoviteanu, A.E.; Paul, F.; Raup, B.; Khalsa, S.J.S.; Armstrong, R. Challenges and recommendations in mapping of glacier parameters from space: Results of the 2008 Global Land Ice Measurements from Space (GLIMS) workshop, Boulder, Colorado, USA. Ann. Glaciol. 2009, 50, 53–69. [Google Scholar] [CrossRef]
- Paul, F.; Bolch, T.; Kääb, A.; Nagler, T.; Nuth, C.; Scharrer, K.; Shepherd, A.; Strozzi, T.; Ticconi, F.; Bhambri, R.; et al. The glaciers climate change initiative: Methods for creating glacier area, elevation change and velocity products. Remote Sens. Environ. 2015, 162, 408–426. [Google Scholar] [CrossRef] [Green Version]
- Paul, F.; Barrand, N.E.; Baumann, S.; Berthier, E.; Bolch, T.; Casey, K.; Frey, H.; Joshi, S.P.; Konovalov, V.; Bris, R.L.; et al. On the accuracy of glacier outlines derived from remote-sensing data. Ann. Glaciol. 2013, 54, 171–182. [Google Scholar] [CrossRef]
- Alifu, H.; Tateishi, R.; Johnson, B. A new band ratio technique for mapping debris-covered glaciers using Landsat imagery and a digital elevation model. Int. J. Remote Sens. 2015, 36, 2063–2075. [Google Scholar] [CrossRef]
- Bhambri, R.; Bolch, T.; Chaujar, R.K. Mapping of debris-covered glaciers in the Garhwal Himalayas using ASTER DEMs and thermal data. Int. J. Remote Sens. 2011, 32, 8095–8119. [Google Scholar] [CrossRef] [Green Version]
- Nuth, C.; Kääb, A. Co-registration and bias corrections of satellite elevation data sets for quantifying glacier thickness change. Cryosphere 2011, 5, 271–290. [Google Scholar] [CrossRef] [Green Version]
- Berthier, E.; Vincent, C.; Magnússon, E.; Gunnlaugsson, Á.Þ.; Pitte, P.; Le Meur, E.; Masiokas, M.; Ruiz, L.; Pálsson, F.; Belart, J.M.C.; et al. Glacier topography and elevation changes derived from Pléiades sub-meter stereo images. Cryosphere 2014, 8, 2275–2291. [Google Scholar] [CrossRef]
- Toutin, T. Three-dimensional topographic mapping with ASTER stereo data in rugged topography. IEEE Trans. Geosci. Remote Sens. 2002, 40, 2241–2247. [Google Scholar] [CrossRef] [Green Version]
- Ragettli, S.; Bolch, T.; Pellicciotti, F. Heterogeneous glacier thinning patterns over the last 40 years in Langtang Himal, Nepal. Cryosphere 2016, 10, 2075–2097. [Google Scholar] [CrossRef] [Green Version]
- Huss, M. Density assumptions for converting geodetic glacier volume change to mass change. Cryosphere 2013, 7, 877–887. [Google Scholar] [CrossRef] [Green Version]
- Sam, L.; Bhardwaj, A.; Singh, S.; Kumar, R. Remote sensing flow velocity of debris-covered glaciers using Landsat 8 data. Prog. Phys. Geogr. Earth Environ. 2015, 40, 305–321. [Google Scholar] [CrossRef]
- Scherler, D.; Leprince, S.; Strecker, M. Glacier-surface velocities in alpine terrain from optical satellite imagery—Accuracy improvement and quality assessment. Remote Sens. Environ. 2008, 112, 3806–3819. [Google Scholar] [CrossRef]
- Lovell, A.M.; Carr, J.R.; Rowan, A.V.; Stokes, C.R. The spatial variation of supraglacial debris characteristics and their influence on glacier melt on Annapurna South Glacier, Nepal [abstract]. In Proceedings of the 20th EGU General Assembly, EGU2018, Vienna, Austria, 4–13 April 2018; p. 9622. [Google Scholar]
- Bolch, T.; Pieczonka, T.; Benn, D.I. Multi-decadal mass loss of glaciers in the Everest area (Nepal Himalaya) derived from stereo imagery. Cryosphere 2011, 5, 349–358. [Google Scholar] [CrossRef] [Green Version]
- Rignot, E.; Echelmeyer, K.; Krabill, W. Penetration depth of interferometric synthetic-aperture radar signals in snow and ice. Geophys. Res. Lett. 2001, 28, 3501–3504. [Google Scholar] [CrossRef] [Green Version]
- Jiskoot, H.; Curran, C.J.; Tessler, D.L.; Shenton, L.R. Changes in Clemenceau Icefield and Chaba Group glaciers, Canada, related to hypsometry, tributary detachment, length–slope and area–aspect relations. Ann. Glaciol. 2009, 50, 133–143. [Google Scholar] [CrossRef]
- Braithwaite, R.J.; Raper, S.C.B. Estimating equilibrium-line altitude (ELA) from glacier inventory data. Ann. Glaciol. 2009, 50, 127–132. [Google Scholar] [CrossRef] [Green Version]
- Hughes, P. Response of a Montenegro glacier to extreme summer heatwaves in 2003 and 2007. Geogr. Ann. Ser. A Phys. Geogr. 2008, 90, 259–267. [Google Scholar] [CrossRef]
- Banerjee, A. Brief communication: Thinning of debris-covered and debris-free glaciers in a warming climate. Cryosphere 2017, 11, 133–138. [Google Scholar] [CrossRef] [Green Version]
- Kulkarni, A.V.; Bahuguna, I.; Rathore, B.; Singh, S.; Randhawa, S.; Sood, R.; Dhar, S. Glacial retreat in Himalaya using Indian Remote Sensing satellite data. Curr. Sci. 2007, 92, 69–74. [Google Scholar]
- Bolch, T.; Buchroithner, M.; Pieczonka, T.; Kunert, A. Planimetric and volumetric glacier changes in the Khumbu Himal, Nepal, since 1962 using Corona, Landsat TM and ASTER data. J. Glaciol. 2008, 54, 592–600. [Google Scholar] [CrossRef] [Green Version]
- Bahr, D.B.; Pfeffer, W.T.; Sassolas, C.; Meier, M.F. Response time of glaciers as a function of size and mass balance: 1. Theory. J. Geophys. Res. Solid Earth 1998, 103, 9777–9782. [Google Scholar] [CrossRef]
- Phan, V.H.; Lindenbergh, R.; Menenti, M. Assessing Orographic Variability in Glacial Thickness Changes at the Tibetan Plateau Using ICESat Laser Altimetry. Remote Sens. 2017, 9, 160. [Google Scholar] [CrossRef]
- Kattel, D.B.; Yao, T. Recent temperature trends at mountain stations on the southern slope of the central Himalayas. J. Earth Syst. Sci. 2013, 122, 215–227. [Google Scholar] [CrossRef] [Green Version]
- Panthi, J.; Dahal, P.; Shrestha, M.; Aryal, S.; Krakauer, N.; Pradhanang, S.; Lakhankar, T.; Jha, A.; Sharma, M.; Karki, R. Spatial and Temporal Variability of Rainfall in the Gandaki River Basin of Nepal Himalaya. Climate 2015, 3, 210–226. [Google Scholar] [CrossRef] [Green Version]
- Salerno, F.; Guyennon, N.; Thakuri, S.; Viviano, G.; Romano, E.; Vuillermoz, E.; Cristofanelli, P.; Stocchi, P.; Agrillo, G.; Ma, Y.; et al. Weak precipitation, warm winters and springs impact glaciers of south slopes of Mt. Everest (central Himalaya) in the last 2 decades (1994–2013). Cryosphere 2015, 9, 1229–1247. [Google Scholar] [CrossRef]
- Scherler, D.; Bookhagen, B.; Strecker, M.R. Hillslope-glacier coupling: The interplay of topography and glacial dynamics in High Asia. J. Geophys. Res. 2011, 116. [Google Scholar] [CrossRef]
- Östrem, G. Ice melting under a thin layer of moraine, and the existence of ice cores in moraine ridges. Geogr. Ann. 1959, 41, 228–230. [Google Scholar] [CrossRef]
- Mattson, L. Ablation on debris covered glaciers: An example from the Rakhiot Glacier, Panjab, Himalaya. IAHS Publ. 1993, 218, 289–296. [Google Scholar]
- Kayastha, R.B.; Takeuchi, Y.; Nakawo, M.; Ageta, Y. Practical prediction of ice melting beneath various thickness of debris cover on Khumbu Glacier, Nepal, using a positive degree-day factor. IAHS Publ. 2000, 264, 71–82. [Google Scholar]
- Vincent, C.; Wagnon, P.; Shea, J.M.; Immerzeel, W.W.; Kraaijenbrink, P.; Shrestha, D.; Soruco, A.; Arnaud, Y.; Brun, F.; Berthier, E.; et al. Reduced melt on debris-covered glaciers: Investigations from Changri Nup Glacier, Nepal. Cryosphere 2016, 10, 1845–1858. [Google Scholar] [CrossRef]
- Brun, F.; Buri, P.; Miles, E.S.; Wagnon, P.; Steiner, J.; Berthier, E.; Ragettli, S.; Kraaijenbrink, P.; Immerzeel, W.W.; Pellicciotti, F. Quantifying volume loss from ice cliffs on debris-covered glaciers using high-resolution terrestrial and aerial photogrammetry. J. Glaciol. 2016, 62, 684–695. [Google Scholar] [CrossRef] [Green Version]
- Watson, C.S.; Quincey, D.J.; Carrivick, J.L.; Smith, M.W. The dynamics of supraglacial ponds in the Everest region, central Himalaya. Glob. Planet. Chang. 2016, 142, 14–27. [Google Scholar] [CrossRef]
- Miles, E.S.; Willis, I.; Buri, P.; Steiner, J.; Arnold, N.S.; Pellicciotti, F. Surface pond energy absorption across four Himalayan glaciers accounts for 1/8 of total catchment ice loss. Geophys. Res. Lett. 2018. [Google Scholar] [CrossRef] [PubMed]
- Benn, D.I.; Bolch, T.; Hands, K.; Gulley, J.; Luckman, A.; Nicholson, L.I.; Quincey, D.; Thompson, S.; Toumi, R.; Wiseman, S. Response of debris-covered glaciers in the Mount Everest region to recent warming, and implications for outburst flood hazards. Earth-Sci. Rev. 2012, 114, 156–174. [Google Scholar] [CrossRef] [Green Version]
- Nicholson, L.I.; McCarthy, M.; Pritchard, H.D.; Willis, I. Supraglacial debris thickness variability: Impact on ablation and relation to terrain properties. Cryosphere 2018, 12, 3719–3734. [Google Scholar] [CrossRef]
Figure 1.
Map of High Mountain Asia showing the glacierised area and Indus and Ganges–Brahmaputra river basins (outlines provided by HydroSHEDS, courtesy of World Wildlife Fund) and location of the Annapurna Conservation Area (ACA).
Figure 1.
Map of High Mountain Asia showing the glacierised area and Indus and Ganges–Brahmaputra river basins (outlines provided by HydroSHEDS, courtesy of World Wildlife Fund) and location of the Annapurna Conservation Area (ACA).

Figure 2.
The Annapurna Conservation Area (ACA) including glacier outlines mapped in 2000 for the Damodar Himal, Muktinath Himal, and Annapurna Himal subregions and the location of Pokhara, Sabche Glacier, and peaks over 7000 m asl. The background image is a Landsat Operational Land Imager and Thermal Infrared Sensor (OLI TIRS) pan-sharpened composite image from 01/12/2015.

Figure 3.
Percentage total glacier area change in the ACA from 2000 to 2014/15. Glaciers that underwent the most positive and negative area changes are highlighted. Glacier outlines are from 2015.
Figure 3.
Percentage total glacier area change in the ACA from 2000 to 2014/15. Glaciers that underwent the most positive and negative area changes are highlighted. Glacier outlines are from 2015.

Figure 4.
Boxplots of (a) percentage area change and (b) mass balance for glaciers in the Annapurna Himal (AH), Muktinath Himal (MH), and Damodar Himal (DH) subregions. The outliers (red crosses) are values that are >1.5 times the interquartile range from the box.
Figure 4.
Boxplots of (a) percentage area change and (b) mass balance for glaciers in the Annapurna Himal (AH), Muktinath Himal (MH), and Damodar Himal (DH) subregions. The outliers (red crosses) are values that are >1.5 times the interquartile range from the box.

Figure 5.
Surface elevation change (m a−1) from 2000 to 2013/16 in (a) the Damodar Himal, (b) the Muktinath Himal, and (c)–(e) the Annapurna Himal. Glaciers mentioned in the text are labelled. Dashed black and white lines indicate debris-covered parts of the glaciers. Glacier outlines are from 2000.

Figure 6.
Glacier surface elevation change in the Annapurna Himal (2000 to 2016) derived from the ASTER and 2016 SPOT DEMs. Elevation change (m a-1) values within the elevation change uncertainty (0.97 m a-1) are grey. Clear surface elevation lowering is observed on the ablation zones of Annapurna South Glacier (GLIMS ID: G083858E28587N) and MSM005 (G083912E28572N). Glacier outlines are from 2000.

Figure 7.
Glacier mass balance (m w.e. a−1) (2000 to 2013/16) for a sample of 72 glaciers in the ACA. Glaciers with the most positive and most negative mass balances are labelled. Glacier outlines are from 2000.
Figure 7.
Glacier mass balance (m w.e. a−1) (2000 to 2013/16) for a sample of 72 glaciers in the ACA. Glaciers with the most positive and most negative mass balances are labelled. Glacier outlines are from 2000.

Figure 8.
Scatterplot of percentage glacier area change against mass balance (n = 72) in the ACA. The green line is the line of best fit for all glaciers and the red and blue lines are the lines of best fit for the Damodar Himal and the Muktinath Himal, respectively. The Annapurna Himal did not have enough data for a line of best fit. Each line is labelled with its R2 and p-values, in corresponding colours.

Figure 9.
Glacier surface velocities (m a−1) in the ACA measured between 03/01/2002–05/12/2002 and 02/01/2016–10/12/2016 in (a) the Damodar Himal, 2002; (b) the Damodar Himal, 2016; (c) the Muktinath Himal, 2002; (d) the Muktinath Himal, 2016; (e) the Annapurna Himal, 2002; and (f) the Annapurna Himal, 2016. Red arrows highlight glaciers that decelerated in their ablation zones during this period. Dashed black and white lines indicate debris-covered glacier areas. Glacier outlines are from 2000.

Figure 10.
Boxplots of mass balance against hypsometric index class (n = 72). VTH = very top-heavy, TH = top-heavy, E = equidimensional, BH = bottom-heavy, and VBH = very bottom-heavy.
Figure 10.
Boxplots of mass balance against hypsometric index class (n = 72). VTH = very top-heavy, TH = top-heavy, E = equidimensional, BH = bottom-heavy, and VBH = very bottom-heavy.

Figure 11.
Influence of supraglacial debris on glacier surface elevation change: (a) boxplots of mean elevation change in the ablation zones of debris-covered and debris-free glaciers and (b) plots of mean elevation change against 100 m elevation band for the debris-free (blue) and debris-covered (orange) components of glacier area in the ACA. The shaded areas are 1 standard deviation.

Figure 12.
Boxplots of glacier characteristics in the Annapurna Himal (AH), Muktinath Himal (MH), and Damodar Himal (DH) subregions and all glaciers in the ACA (All): (a) glacier area, (b) maximum elevation, (c) hypsometric index, and (d) debris-covered glacier area (%) (measured in 2000). The outliers (red crosses) are values that are >1.5 times the interquartile range from the box.


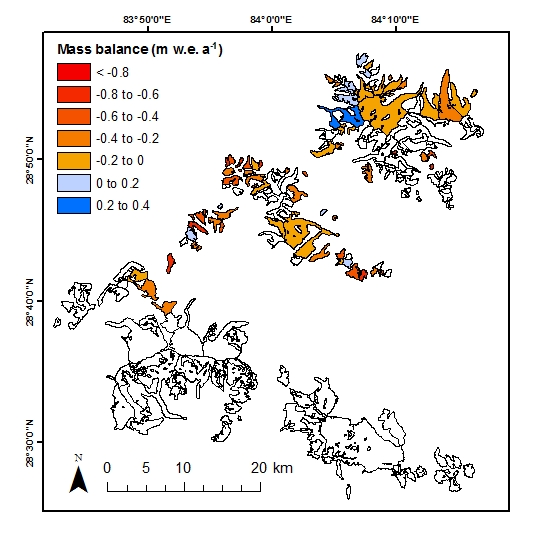
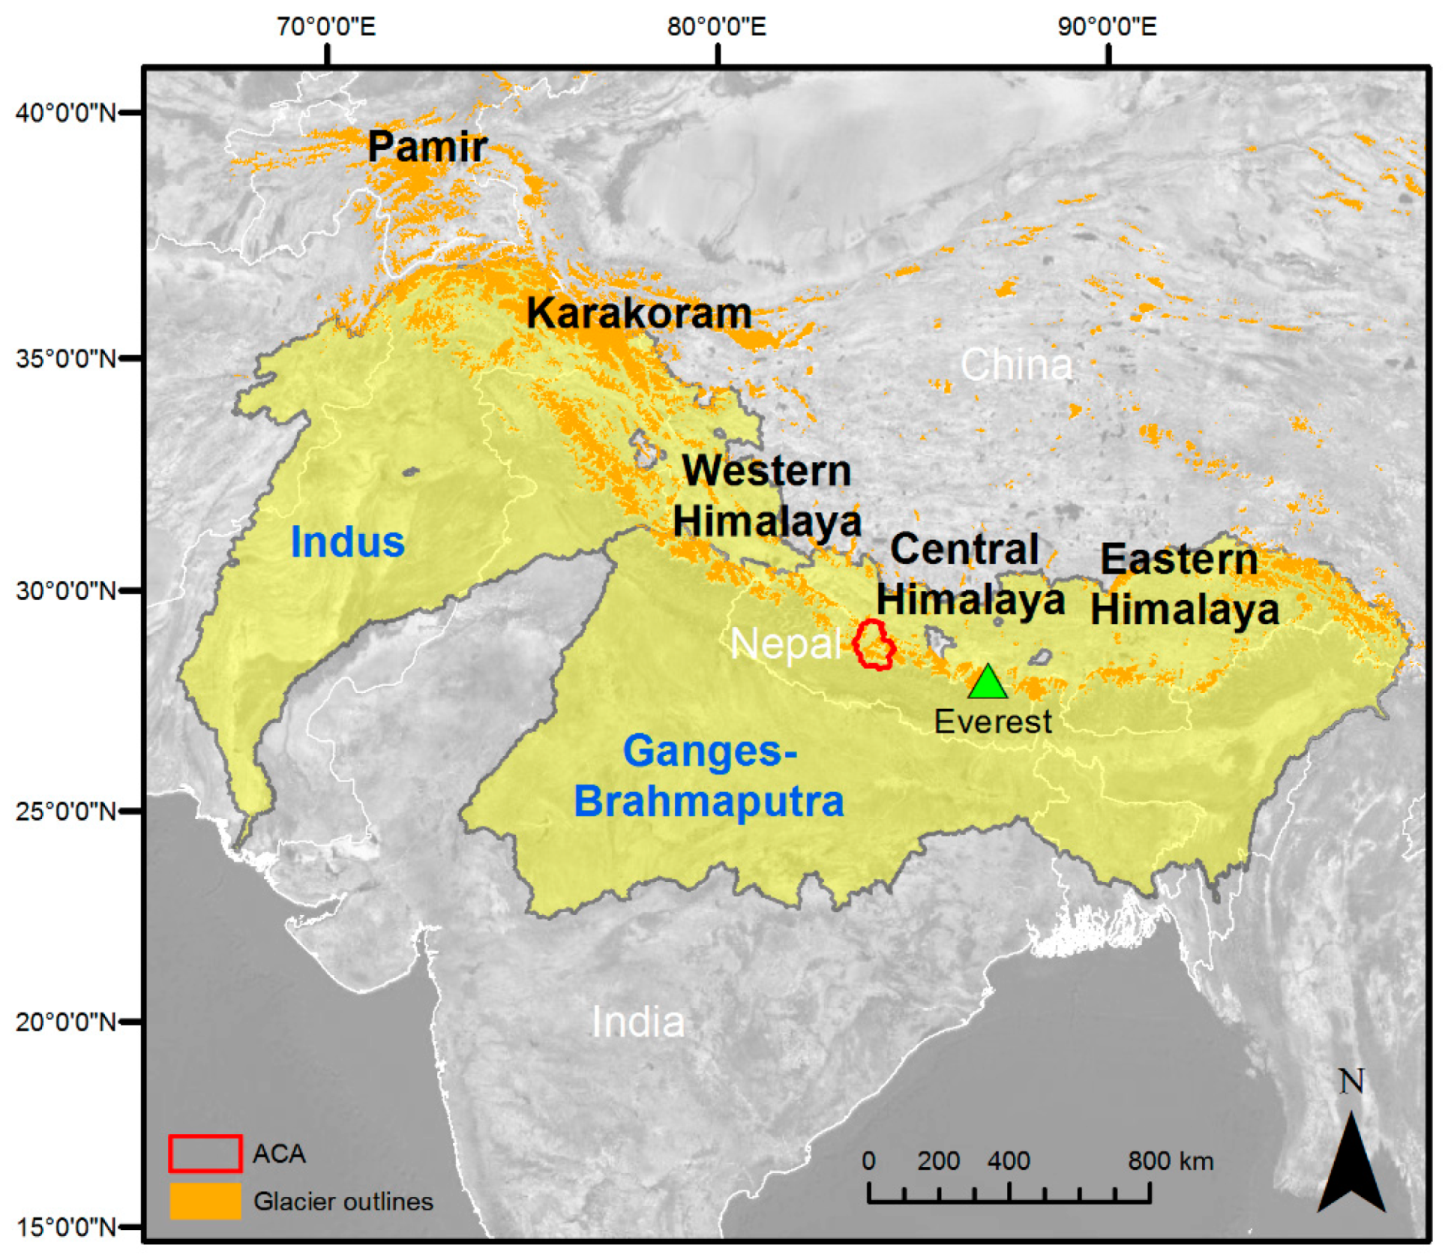
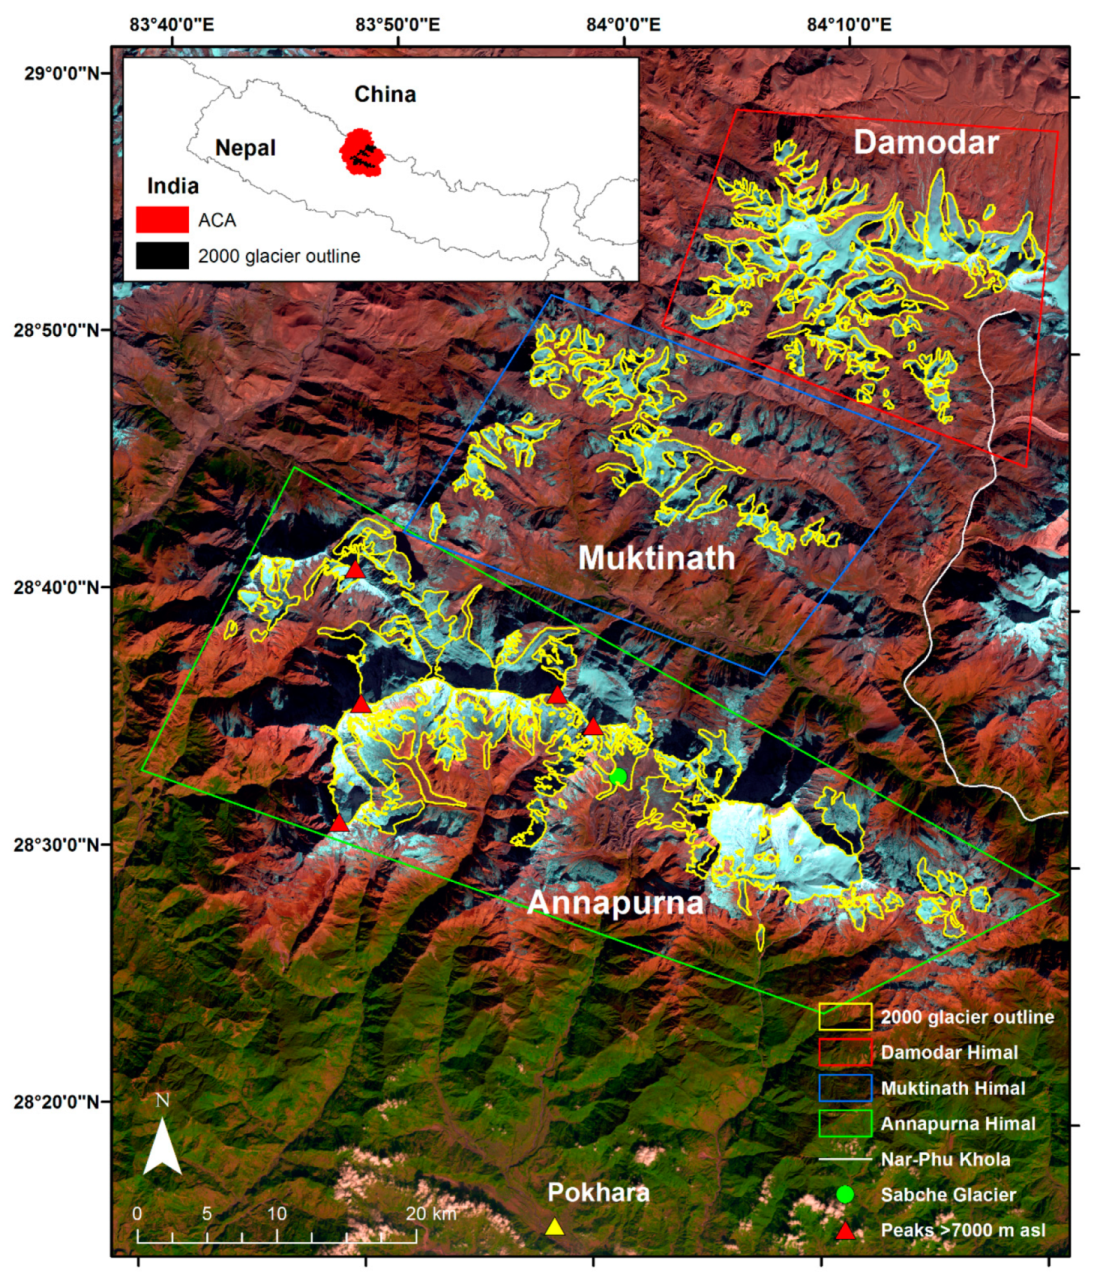
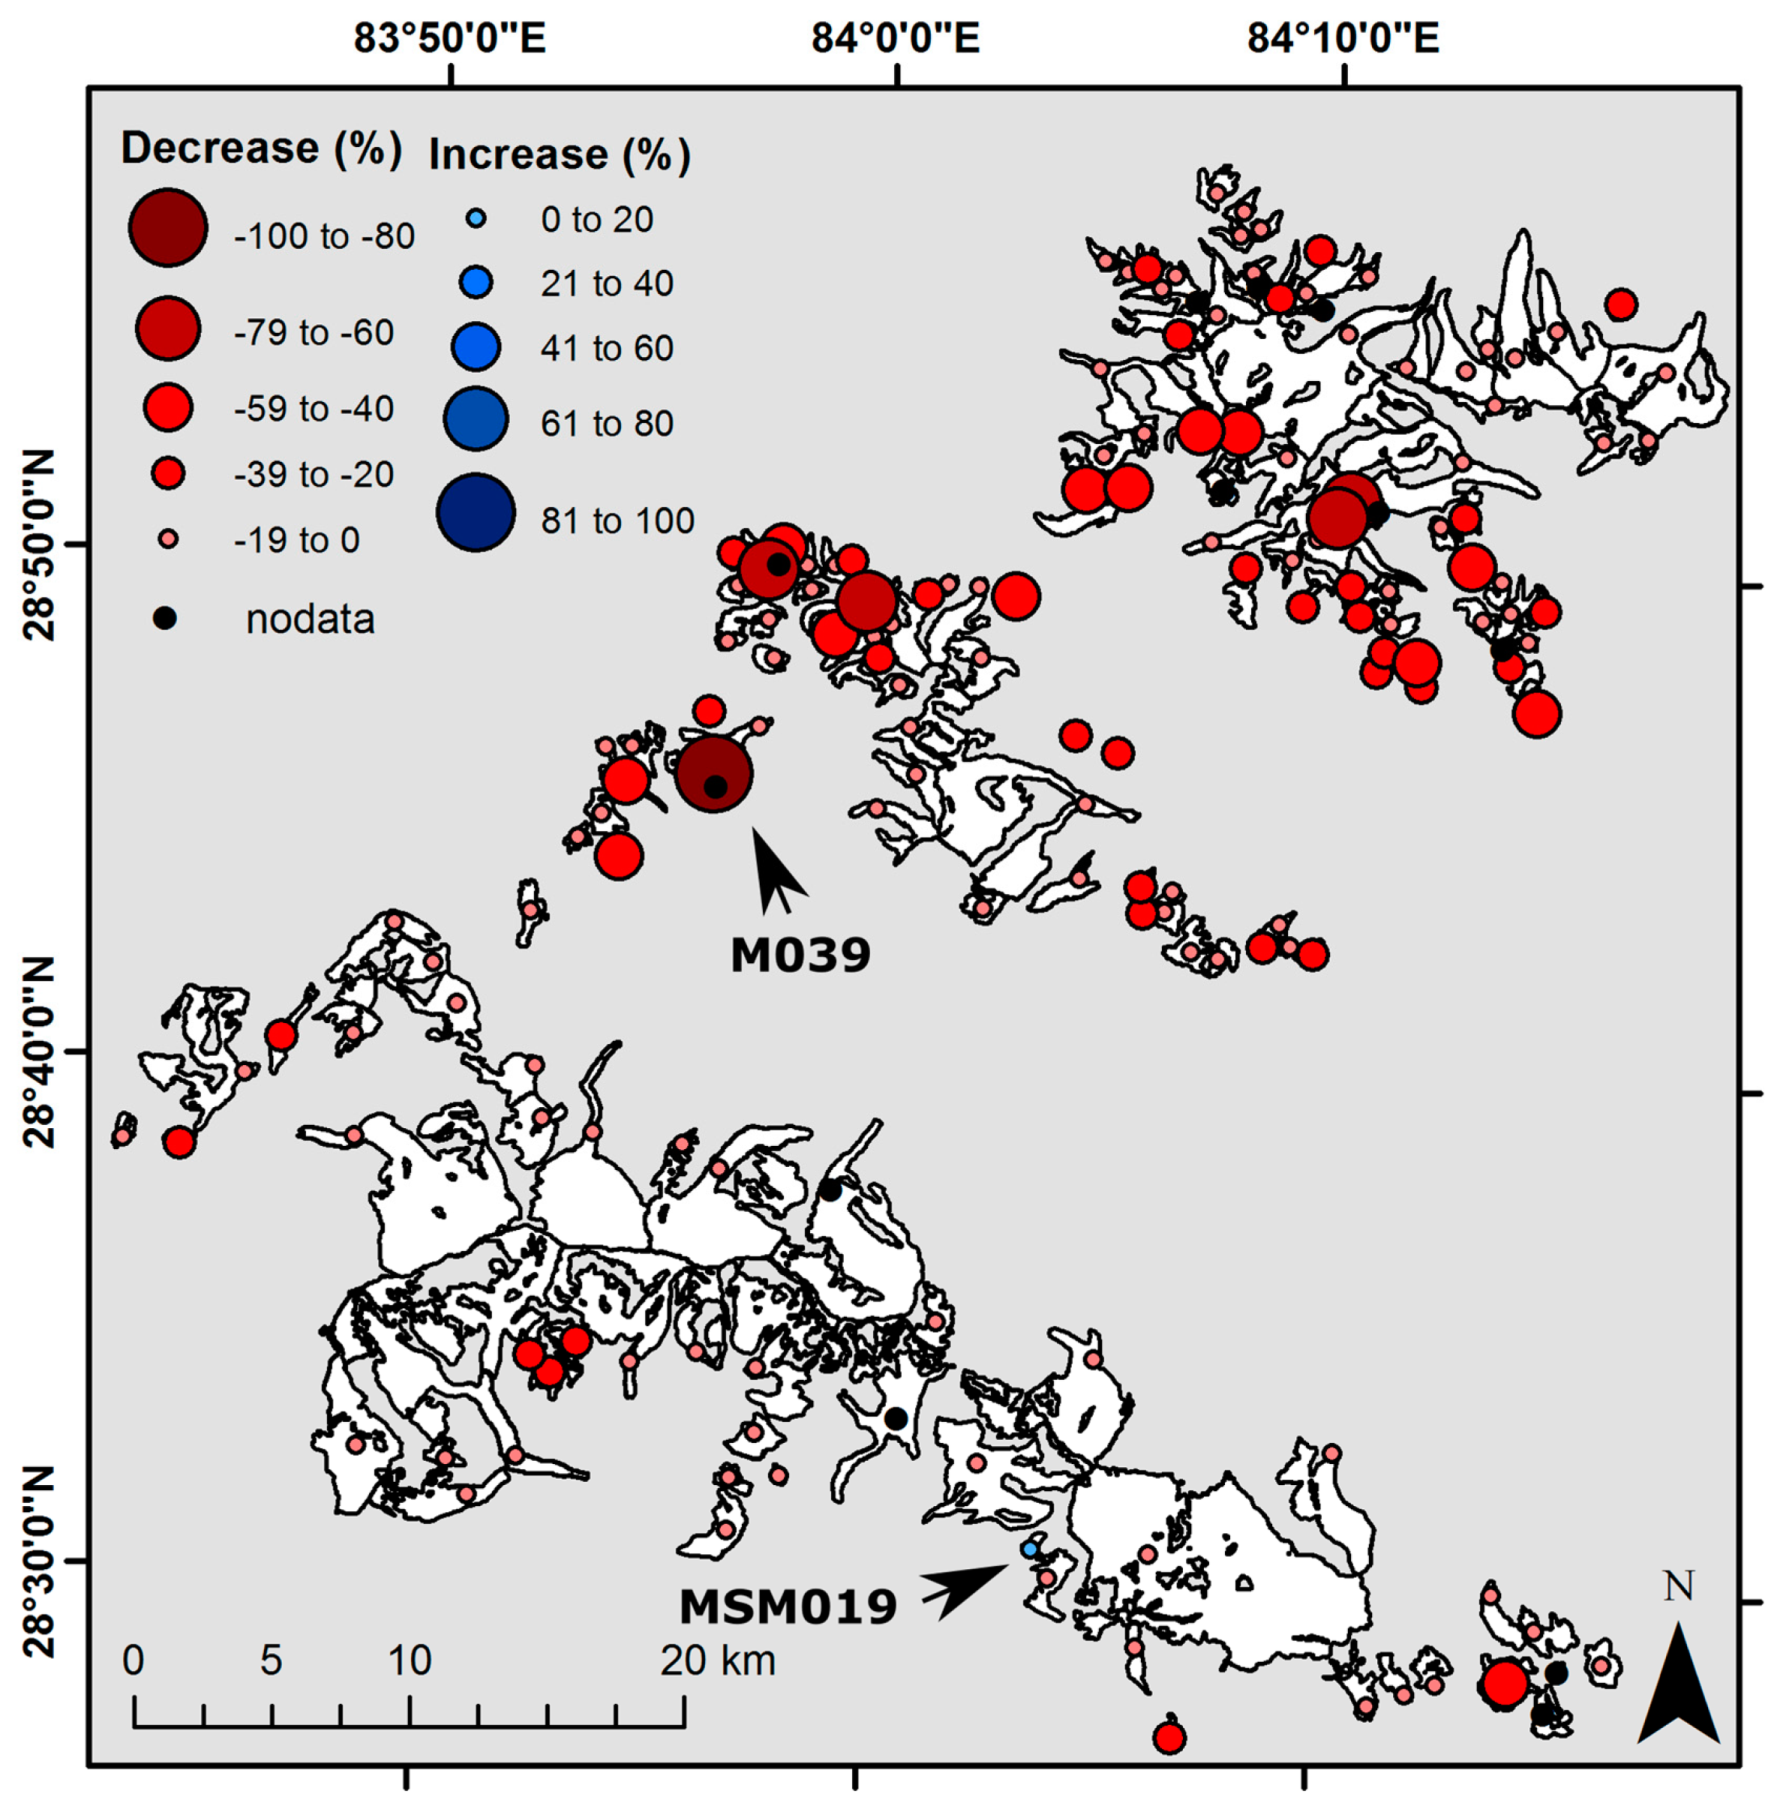
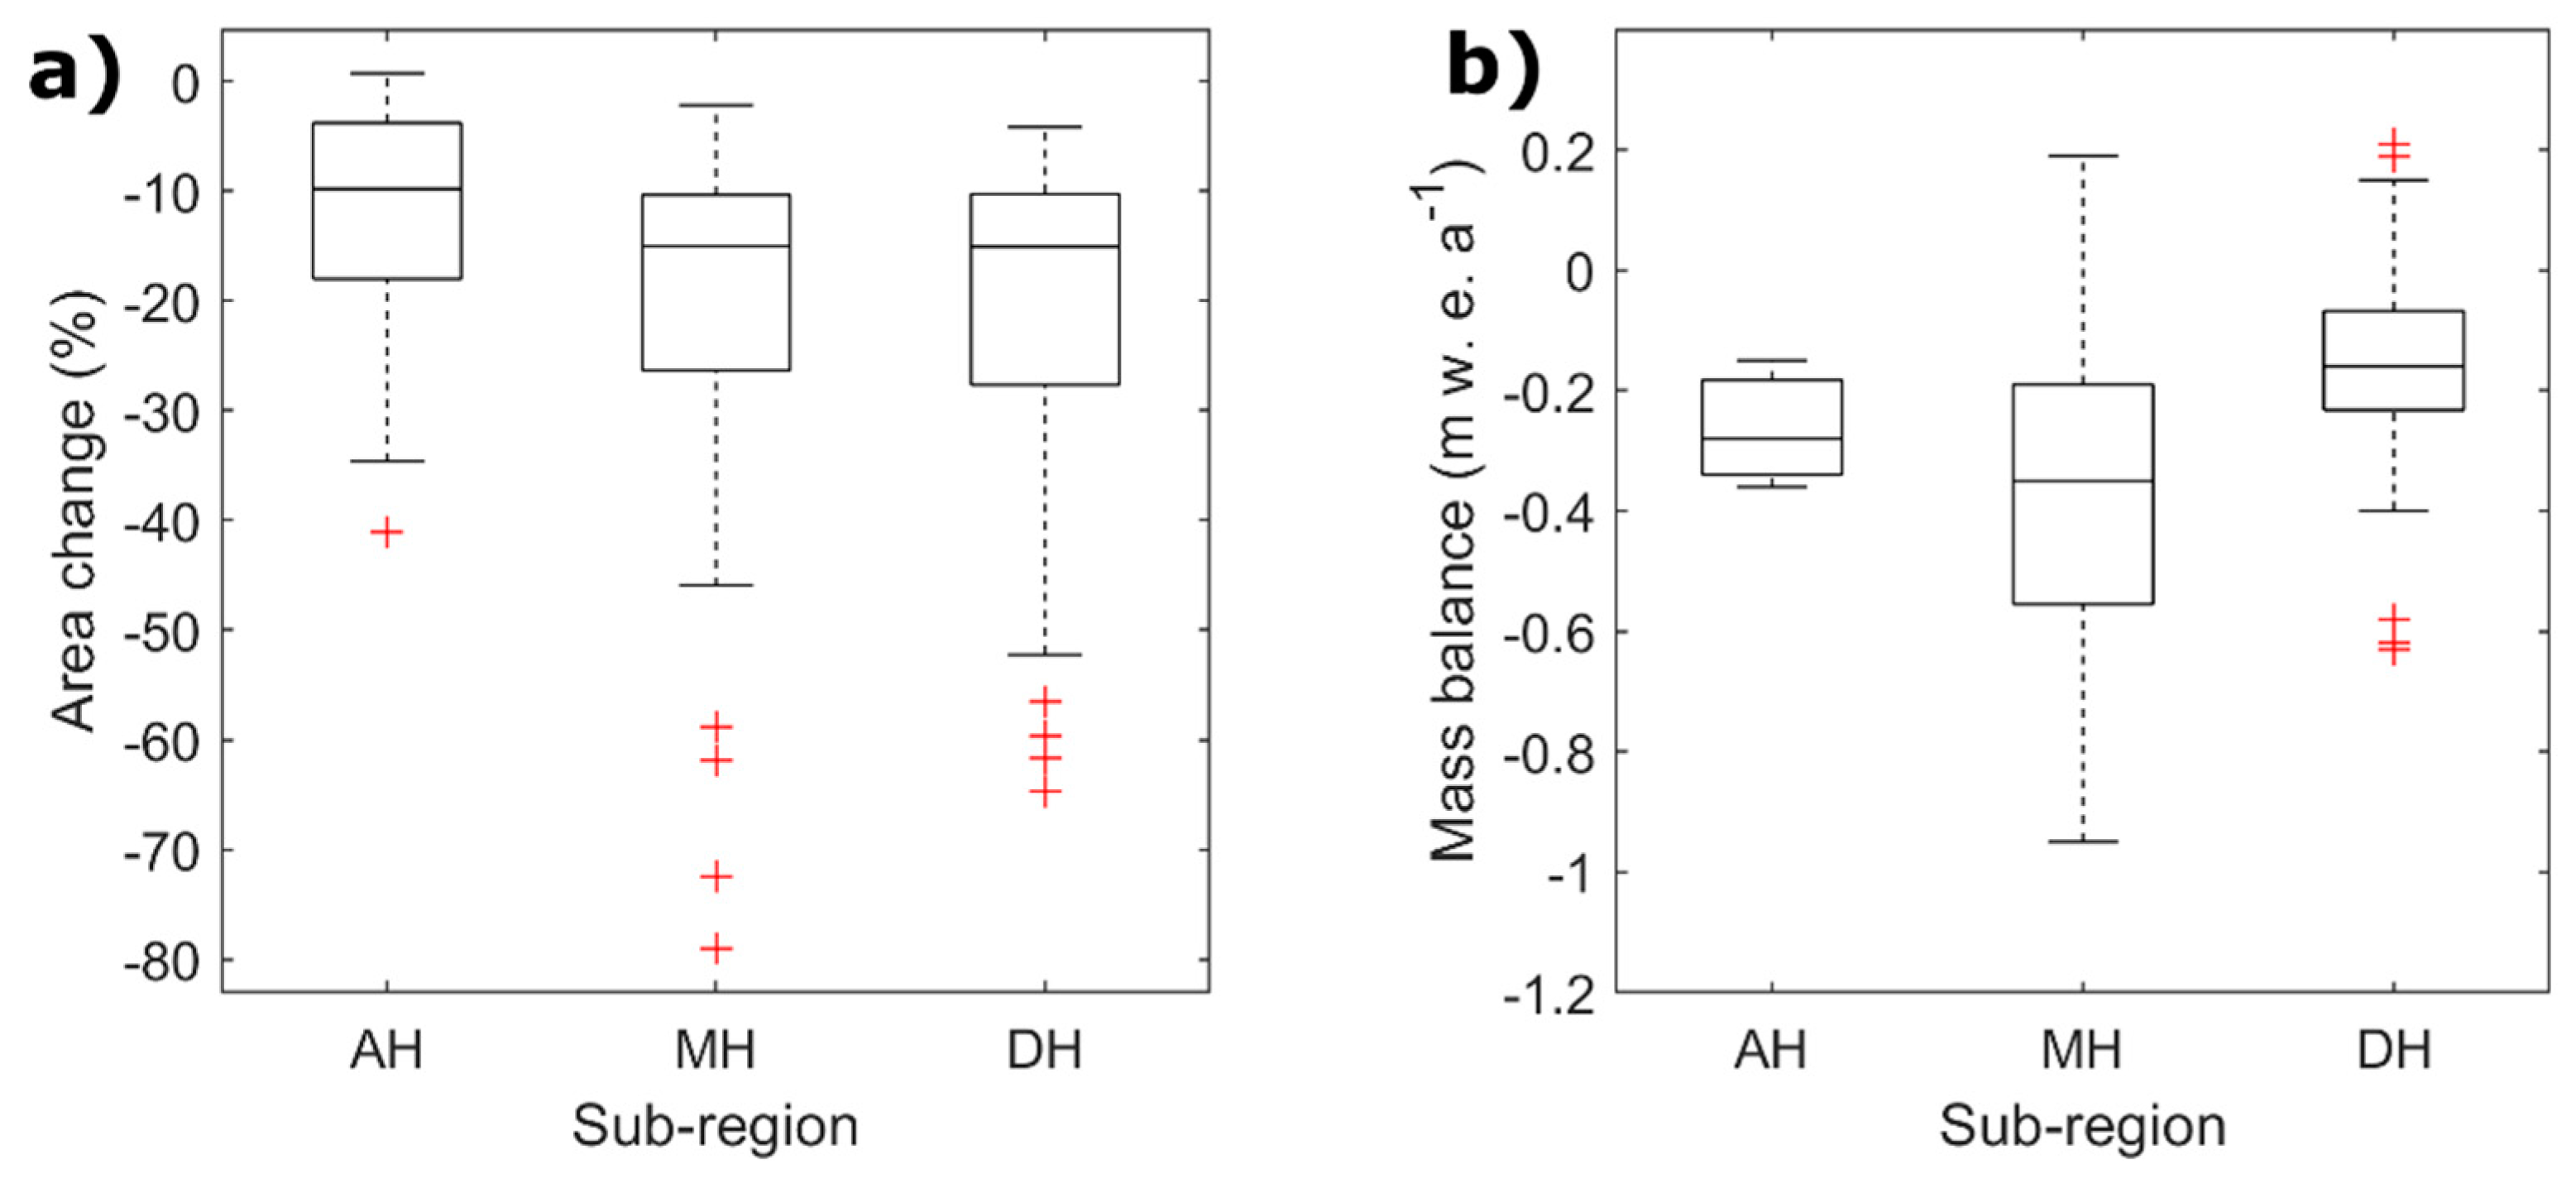
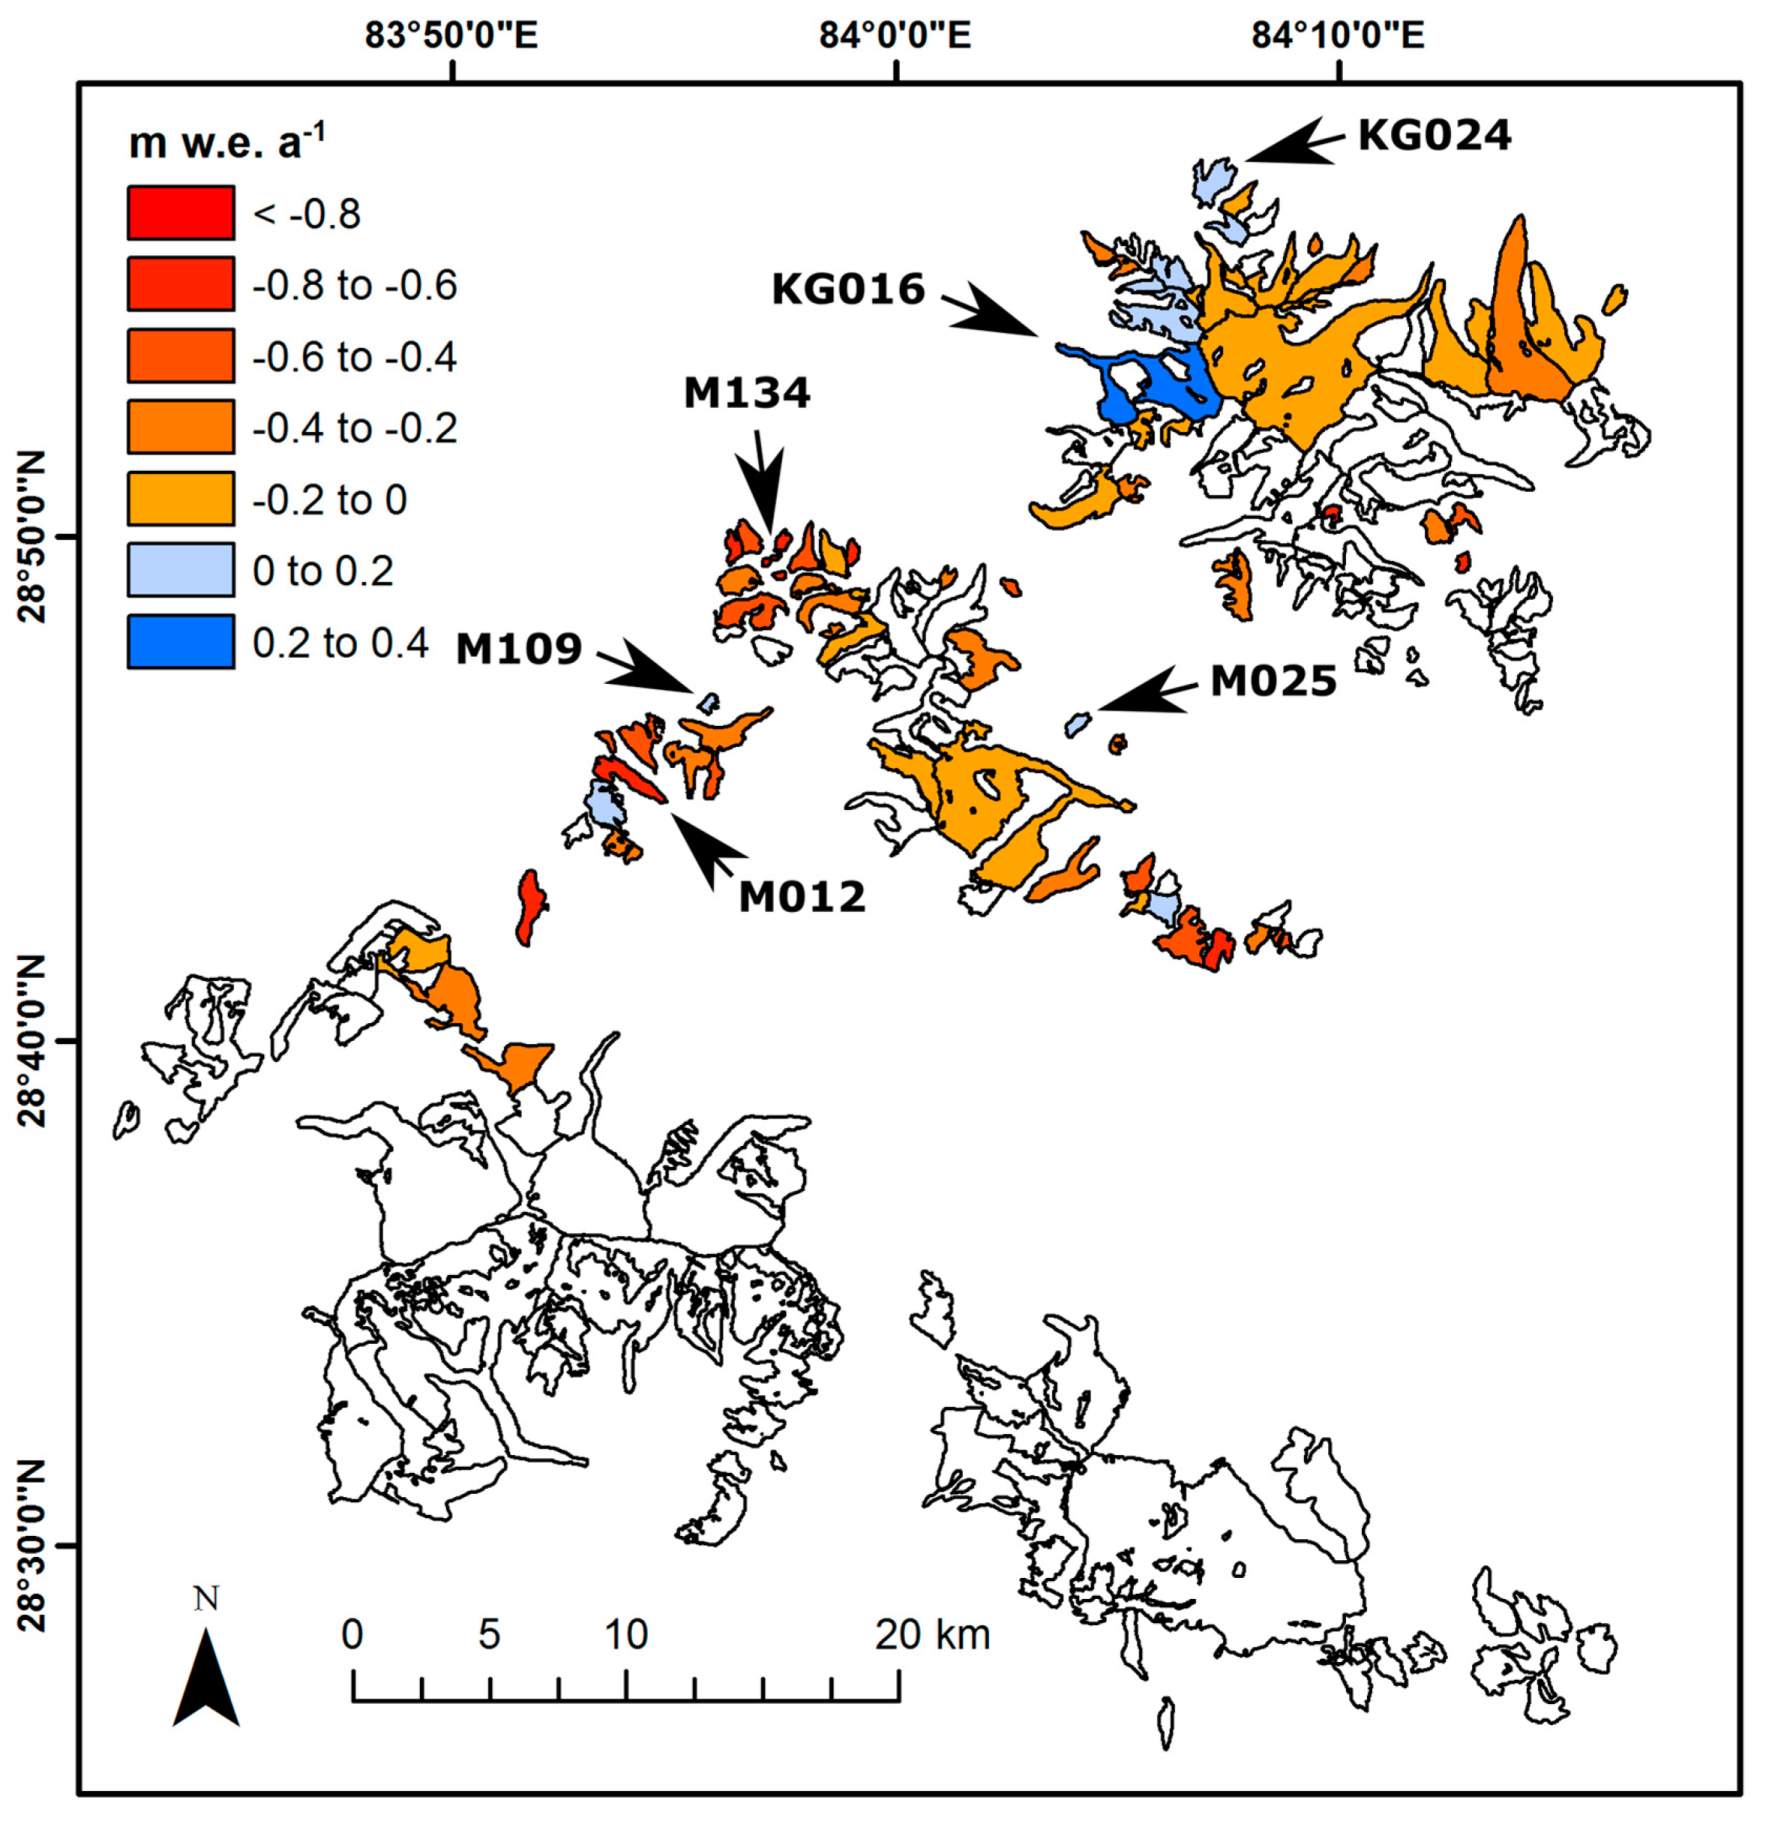
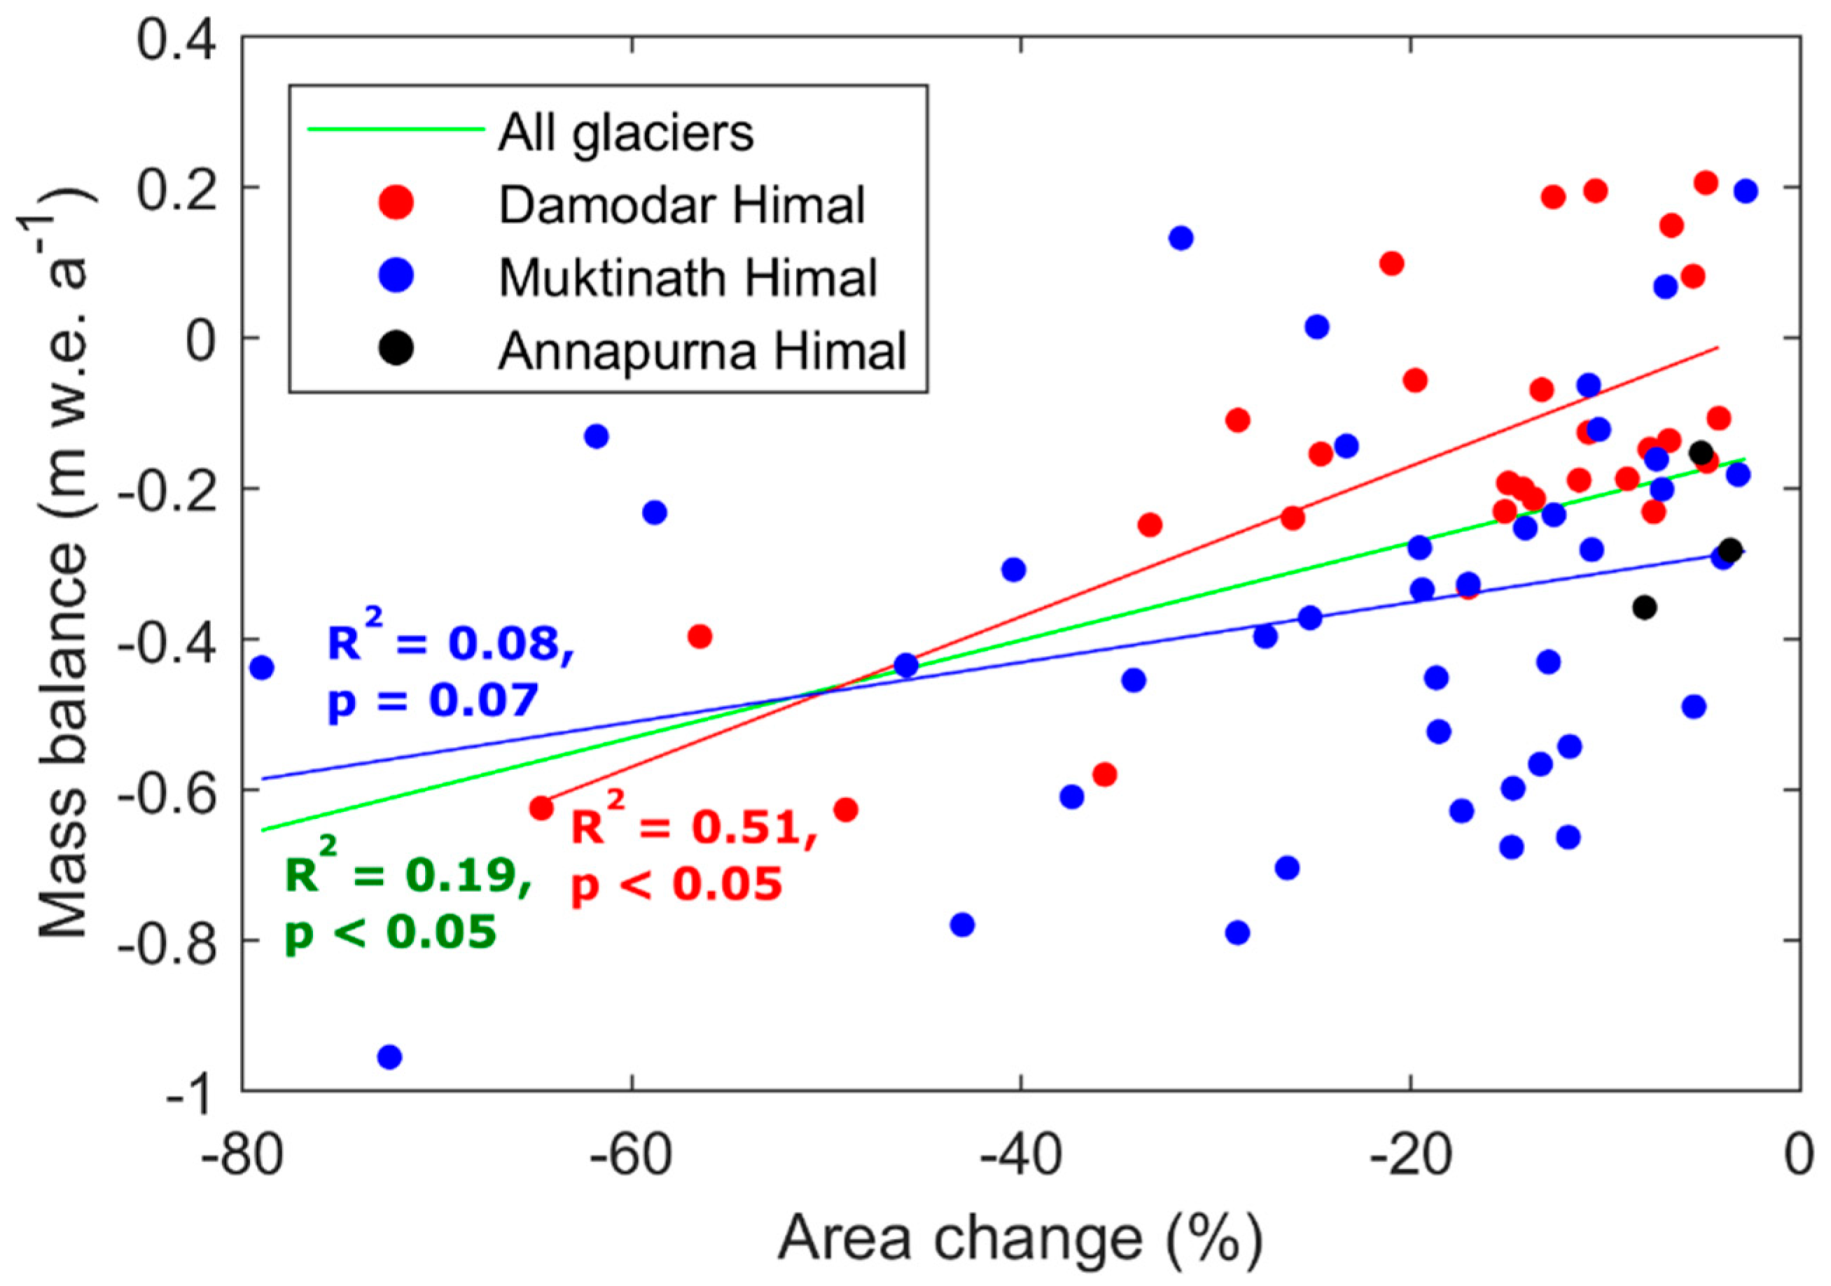
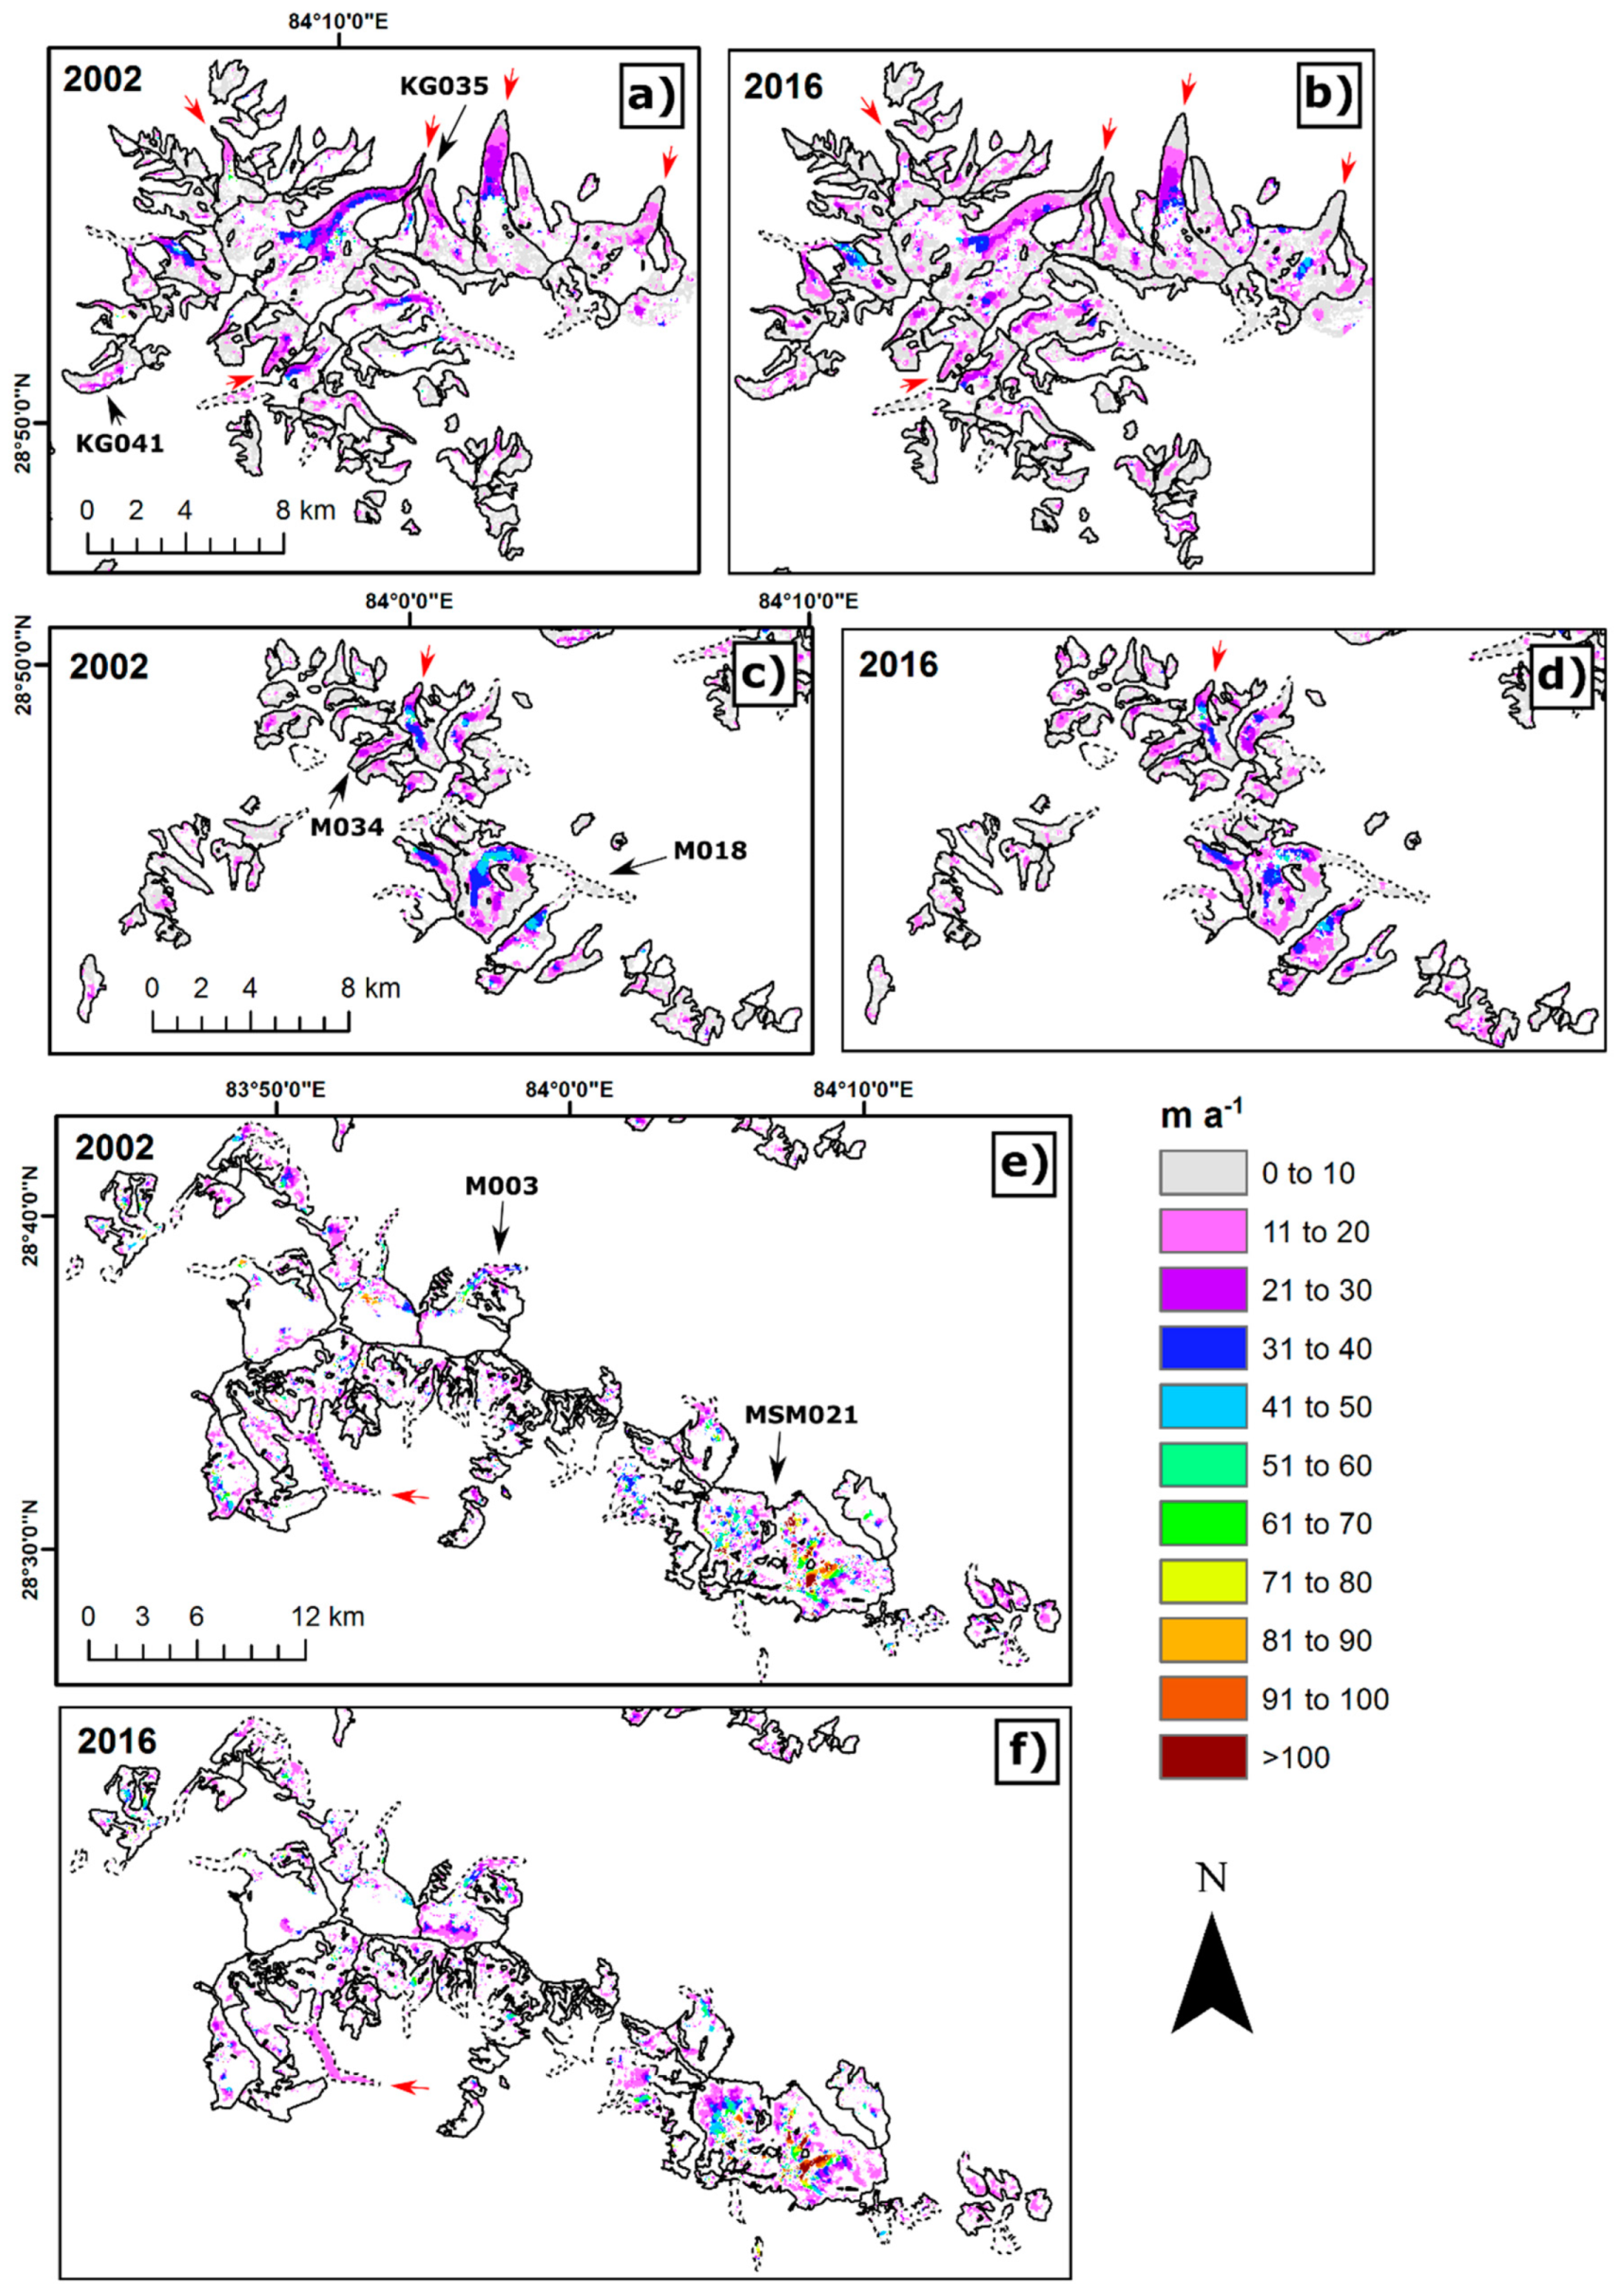
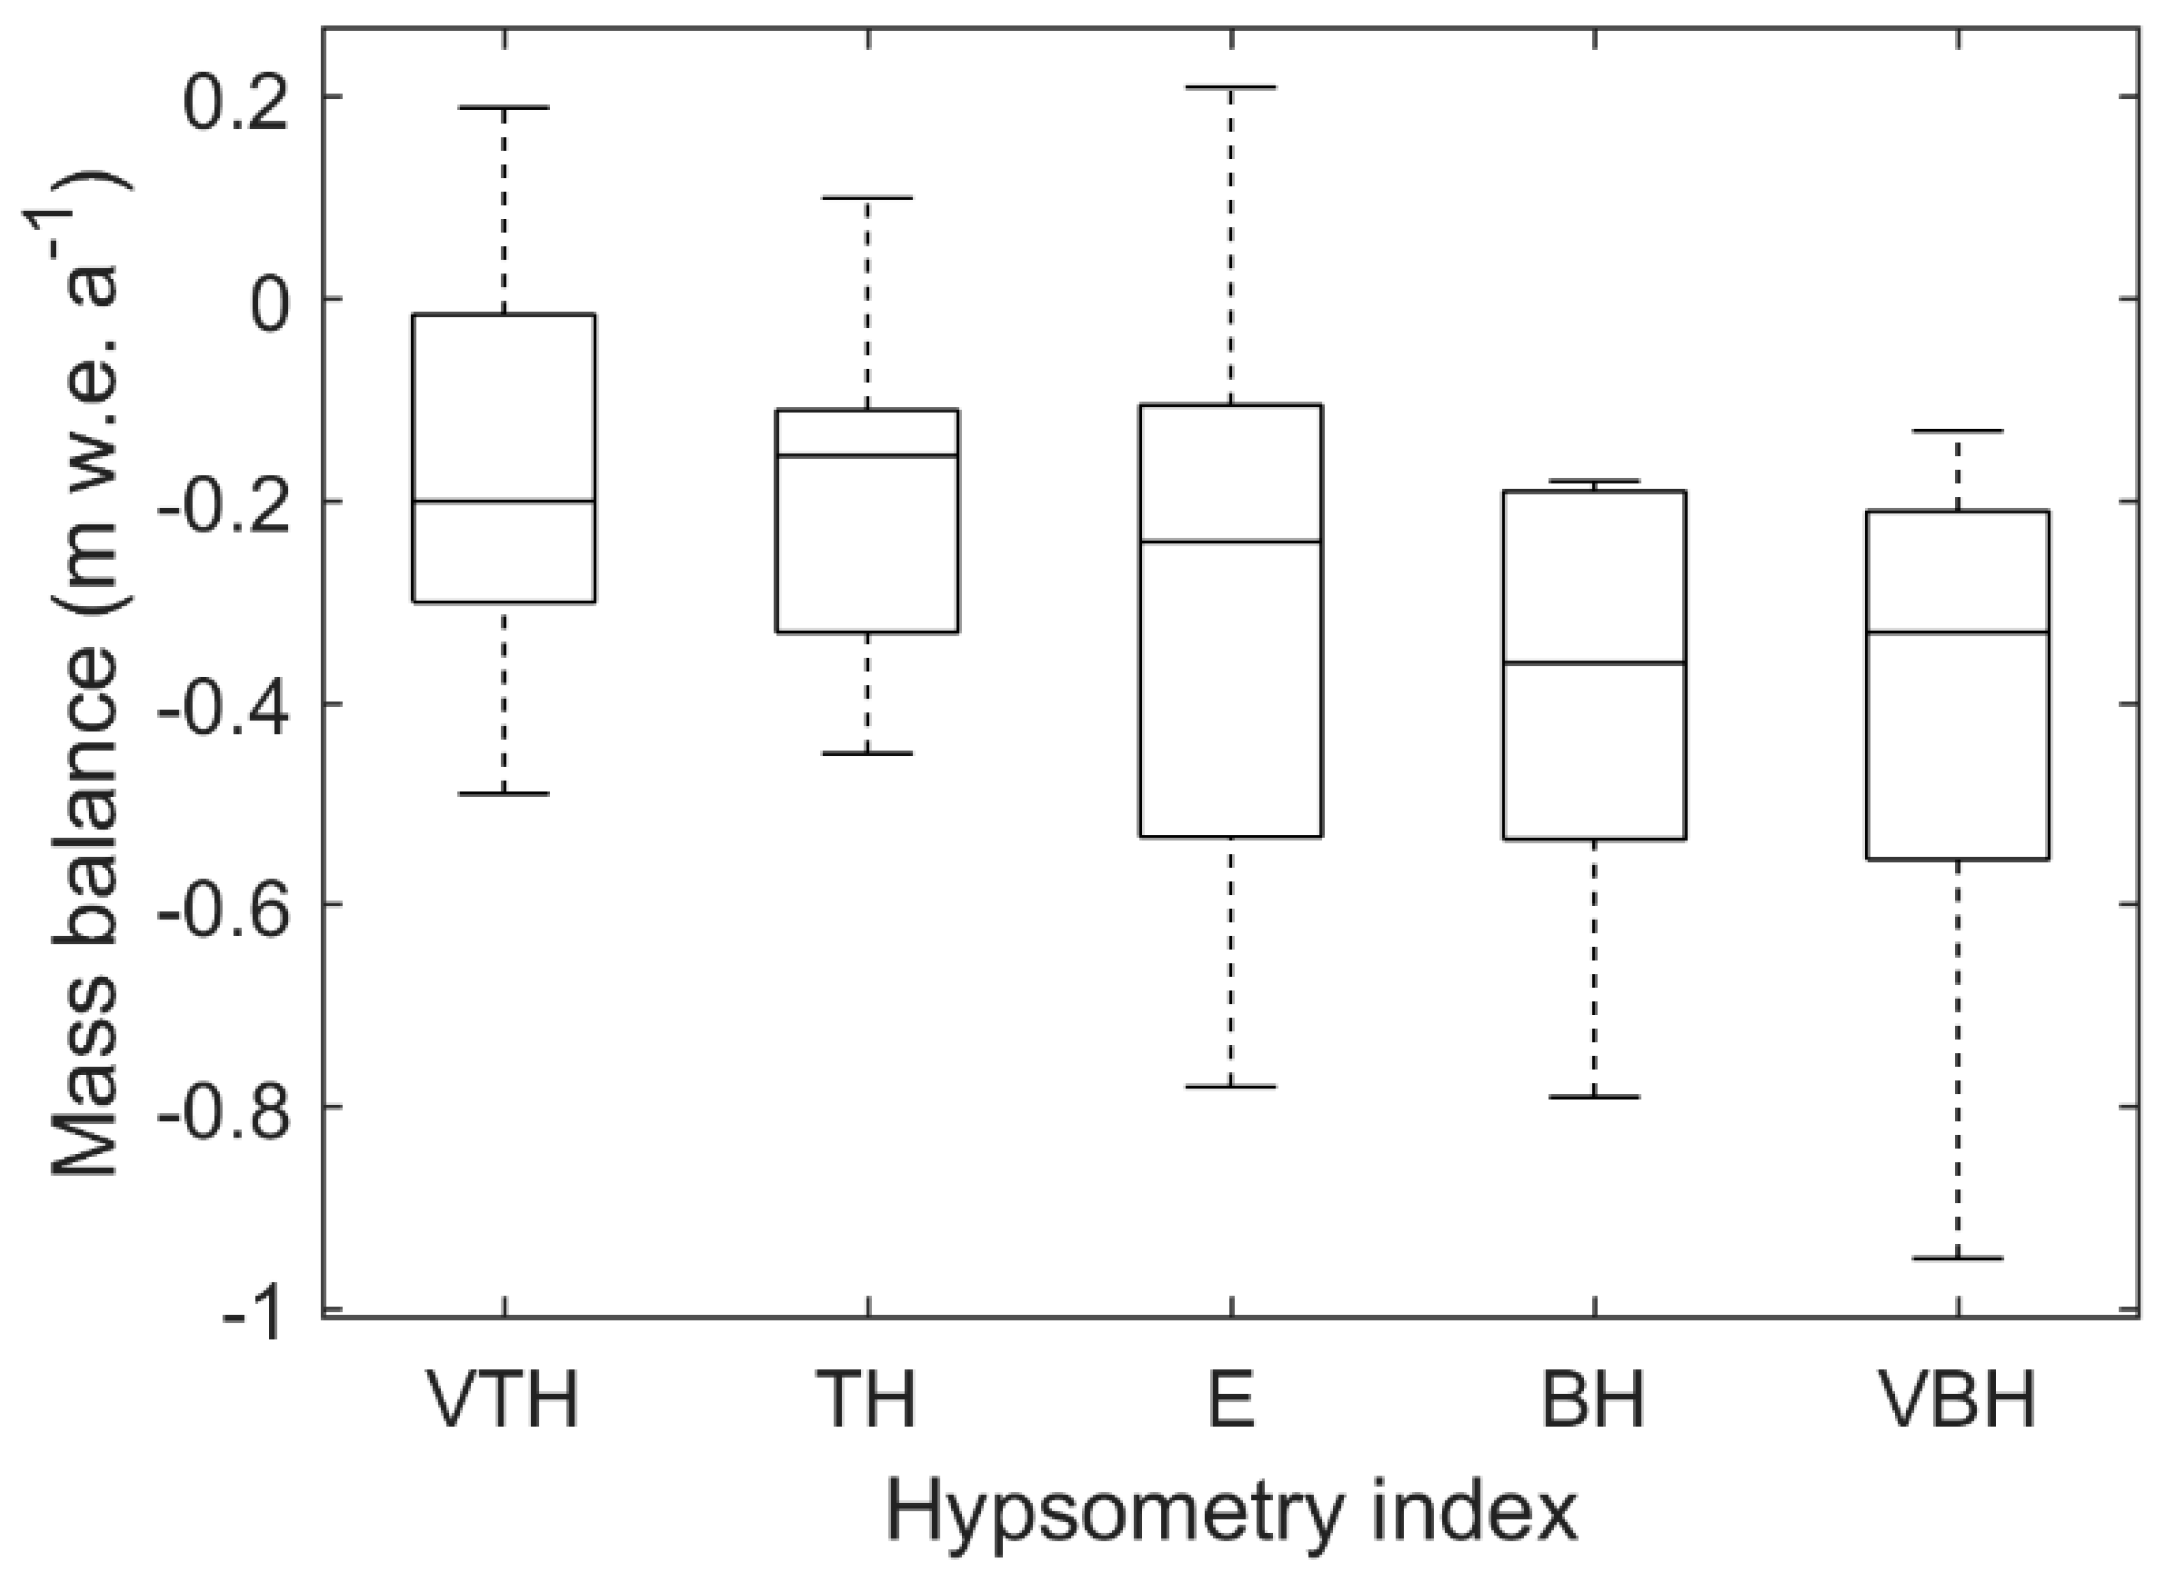
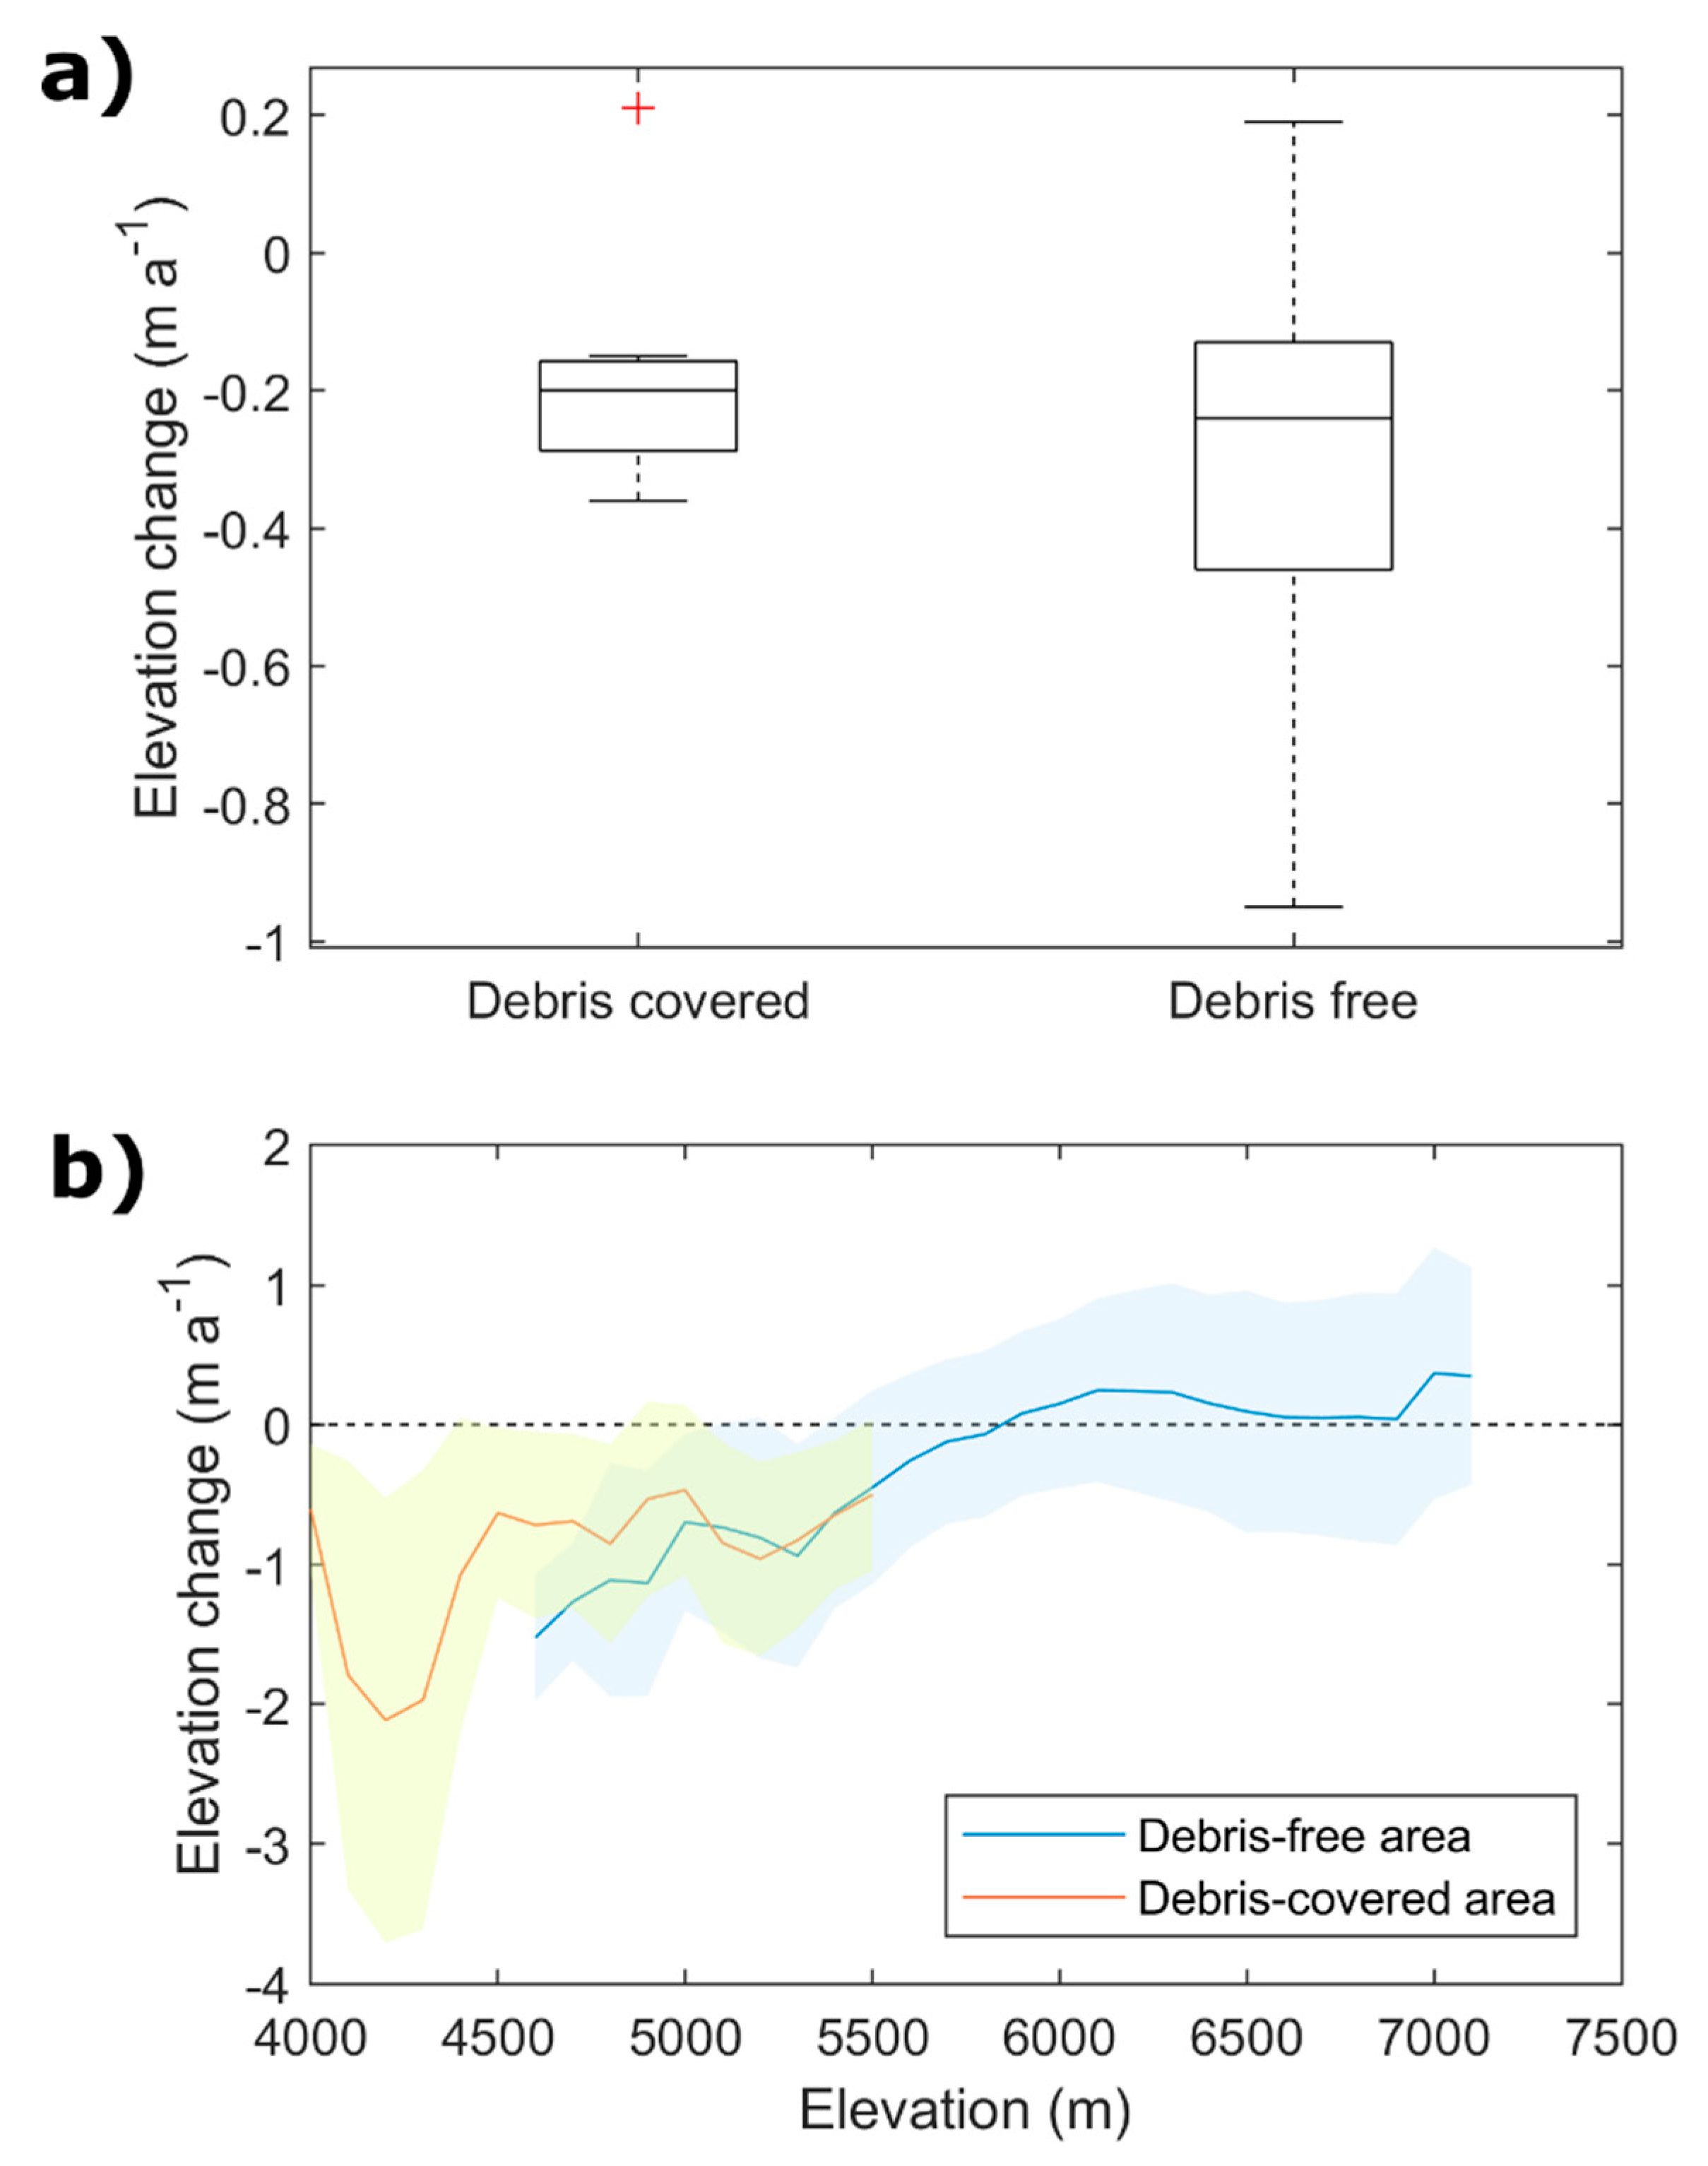
Table 1.
Summary of the datasets used in this study. A = glacier area, FSCM = firn, snow, and clean ice mask, SE = glacier surface elevation, V = glacier velocity, T = topographic controls.
Table 1.
Summary of the datasets used in this study. A = glacier area, FSCM = firn, snow, and clean ice mask, SE = glacier surface elevation, V = glacier velocity, T = topographic controls.
| Dataset Name | Date | Sensor | Spatial Resolution (m) | Purpose |
|---|---|---|---|---|
| LE71420402000350SGS00 | 15/12/2000 | Landsat 7 ETM+ | 15 to 30 | A |
| LC81420402014284LGN00 | 11/10/2014 | Landsat 8 OLI | 15 to 30 | A |
| LC81420402015335LGN00 | 01/12/2015 | Landsat 8 OLI | 15 to 30 | A |
| ALOS GLOBAL DSM | Multiple | PRISM | 30 | A |
| LE07_L1TP_142040_20001215_20170208_01_T1_sr | 15/12/2000 | Landsat 7 ETM+ | 15 to 30 | FSCM |
| SRTM Global DEM non void-filled | 11/02/2000 to 22/02/2000 | SRTM | 30 | SE |
| AST14DEM_00312152000052420 | 15/12/2000 | ASTER | 30 | SE |
| HMA_DEM8m_AT_20131120_0508_1020010028D38100 | 20/11/2013 | Worldview-1 panchromatic | 8 | SE |
| HMA_DEM8m_AT_20140119_0459_102001002B466800 | 19/01/2014 | Worldview-1 panchromatic | 8 | SE |
| HMA_DEM8m_AT_20151001_0511_104001001299E800 | 01/10/2015 | Worldview-3 panchromatic | 8 | SE |
| IMG_SPOT7_P_001_A : SPOT 7 2015-10-20:04:30:48.6 SENSOR P | 20/10/2015 | SPOT 7 NAOMI | 1.5 | SE |
| IMG_SPOT7_P_001_C : SPOT 7 2015-10-20:04:31:25.1 SENSOR P | 20/10/2015 | SPOT 7 NAOMI | 1.5 | SE |
| IMG_SPOT7_P_001_A : SPOT 7 2016-02-25:04:47:49.9 SENSOR P | 25/02/2016 | SPOT 7 NAOMI | 1.5 | SE |
| IMG_SPOT7_P_001_B : SPOT 7 2016-02-25:04:48:21.2 SENSOR P | 25/02/2016 | SPOT 7 NAOMI | 1.5 | SE |
| LE71420402002003SGS00 | 03/01/2002 | Landsat 7 ETM+ | 15 to 30 | V |
| LE71420402002339SGS00 | 05/12/2002 | Landsat 7 ETM+ | 15 to 30 | V |
| LC81420402016002LGN00 | 02/01/2016 | Landsat 8 OLI | 15 to 30 | V |
| LC81420402016354LGN00 | 10/12/2016 | Landsat 8 OLI | 15 to 30 | V |
| SRTM Global DEM void-filled | Multiple | SRTM | 30 | T |
Table 2.
Glacier area changes in the ACA and per subregion (n = 162). Mean surface elevation change and mass balance measured for the smaller sample of 72 glaciers (indicated by *) in the ACA and per subregion between 2000 and 2013/16. Surface elevation change and mass balance uncertainty for the elevation difference maps are summarised in Table S1.
| Region | Number of Glaciers | Total Glacier Area (2000) (km2) | Total Glacier Area (2014/15) (km2) | Total Glacier Area Change (%) | Mean dh (m a−1) (Void-filled) | Mass Balance (m w. e. a−1) | Number of Glaciers* |
|---|---|---|---|---|---|---|---|
| ACA | 162 | 488.45 | 447.13 | −8.46 | −0.33 ± 0.22 | −0.28 ± 0.24 | 72* |
| Damodar Himal | 64 | 144.06 | 127.99 | −11.15 | −0.19 ± 0.32 | −0.16 ± 0.34 | 29* |
| Muktinath Himal | 54 | 75.29 | 66.37 | −11.85 | −0.43 ± 0.15 | −0.37 ± 0.16 | 40* |
| Annapurna Himal | 44 | 269.11 | 252.77 | −6.07 | −0.31 ± 0.31 | −0.26 ± 0.33 | 3* |
Table 3.
Summary of linear regression results for different controls on glacier area change, surface elevation change, and mass balance.
Table 3.
Summary of linear regression results for different controls on glacier area change, surface elevation change, and mass balance.
| Mass Balance vs. Area Change | ||
| Subregion | R2 | p-value |
| All glaciers | 0.19 | <0.05 |
| Damodar Himal | 0.51 | <0.05 |
| Muktinath Himal | 0.08 | 0.07 |
| Surface Elevation Change vs. Surface Gradient | ||
| Subregion | R2 | p-value |
| All glaciers | 0.1 | <0.05 |
| Damodar Himal | 0.1 | 0.1 |
| Muktinath Himal | 0.19 | <0.05 |
| Mass Balance vs. Maximum Elevation | ||
| Subregion | R2 | p-value |
| All glaciers | 0.17 | <0.05 |
| Damodar Himal | 0.27 | <0.05 |
| Muktinath Himal | 0 | 0.87 |
| Area Change vs. Maximum Elevation | ||
| Subregion | R2 | p-value |
| All glaciers | 0.16 | <0.05 |
| Damodar Himal | 0.34 | <0.05 |
| Muktinath Himal | 0.11 | <0.05 |
| Mass Balance vs. Avalanche Ratio | ||
| Subregion | R2 | p-value |
| All glaciers | 0.08 | <0.05 |
| Damodar Himal | 0.49 | <0.05 |
| Muktinath Himal | 0 | 0.8 |
| Area Change vs. Avalanche Ratio | ||
| Subregion | R2 | p-value |
| All glaciers | 0.09 | <0.05 |
| Damodar Himal | 0.46 | <0.05 |
| Muktinath Himal | 0.09 | 0.06 |
© 2019 by the authors. Licensee MDPI, Basel, Switzerland. This article is an open access article distributed under the terms and conditions of the Creative Commons Attribution (CC BY) license (http://creativecommons.org/licenses/by/4.0/).
Share and Cite
MDPI and ACS Style
Lovell, A.M.; Carr, J.R.; Stokes, C.R. Spatially Variable Glacier Changes in the Annapurna Conservation Area, Nepal, 2000 to 2016. Remote Sens. 2019, 11, 1452. https://doi.org/10.3390/rs11121452
AMA Style
Lovell AM, Carr JR, Stokes CR. Spatially Variable Glacier Changes in the Annapurna Conservation Area, Nepal, 2000 to 2016. Remote Sensing. 2019; 11(12):1452. https://doi.org/10.3390/rs11121452
Chicago/Turabian StyleLovell, Arminel M., J. Rachel Carr, and Chris R. Stokes. 2019. "Spatially Variable Glacier Changes in the Annapurna Conservation Area, Nepal, 2000 to 2016" Remote Sensing 11, no. 12: 1452. https://doi.org/10.3390/rs11121452
Note that from the first issue of 2016, this journal uses article numbers instead of page numbers. See further details here.