Remote Sensing Approach to Detect Burn Severity Risk Zones in Palo Verde National Park, Costa Rica

1
Department of Environmental Studies, Carleton College, Northfield, MN 55057, USA
2
Department of Forestry & Wildland Resources and Department of Environmental Science & Management, Humboldt State University, Arcata, CA 95521, USA
3
Department of Geology, Carleton College, Northfield, MN 55057, USA
*
Author to whom correspondence should be addressed.
Remote Sens. 2018, 10(9), 1427; https://doi.org/10.3390/rs10091427
Submission received: 26 July 2018
/
Revised: 30 August 2018
/
Accepted: 4 September 2018
/
Published: 7 September 2018
(This article belongs to the Special Issue Remote Sensing of Wildfire)
Abstract
:This study develops a site specific burn severity modelling using remote sensing techniques to develop severity patterns on vegetation and soil in the fire prone region of the Palo Verde National Park in Guanacaste, Costa Rica. Terrain physical features, soil cover, and scorched vegetation characteristics were examined to develop a fire risk model and to quantify probable burned areas. Spectral signatures of affected areas were captured through multi-spectral analysis; i.e., Normalized Burn Ratio (NBR), Landsat derived differenced Normalized Burn Ratio (dNBR) and relativized dNBR (RdNBR). A partial unmixing algorithm, Mixture Tuned Matched Filtering (MTMF) was used to isolate endmembers for scorched vegetation and soil. The performance of dNBR and RdNBR for predicting ground cover components was acceptable with an overall accuracy of 84.4% and Cohen’s Kappa 0.82 for dNBR and an overall accuracy of 89.4% and Cohen’s Kappa 0.82 for RdNBR. Landsat derived RdNBR showed a strong correlation with scorched vegetation (r2 = 0.76) and moderate correlation with soil cover (r2 = 0.53), which outperformed dNBR. The ecologically diverse and unique park area is threatened by wetland fires, which pose a potential threat to various species. Human induced fires by poachers are a common occurrence in such areas to gain access to these species. This paper aims to prioritize areas that are at a higher risk from fire and model spatial adaptations in relation to the direction of fire within the affected wetlands. This assessment will help wildlife personnel in managing disturbed wetland ecosystems.
1. Introduction
Forest fires pose a threat to natural resources as well as flora and fauna in various regions of the world [1,2]. The negative impacts associated with large scale uncontrolled forest fires have increased over the past two decades [2,3,4]. Therefore, it is vital to identify such risk zones for prevention and sustainable management of existing resources. Tropical rainforests, which were once thought to be fire resistant, are now experiencing large scale fires due to shifting cultivation at the forest fringe of the buffer zone [5]. Temperate forests in the United States in which fire was deliberately suppressed for management and political reasons are now experiencing devastating wildfires due to an accumulation of fuel [6]. Wetlands are more threatened than any other ecosystem, with loss exceeding 50% of their original extent worldwide because of the conversion to agricultural and residential uses [7,8]. The effect of fire on wetland ecology depends upon the frequency and intensity of its occurrence within a region. Fire can be both beneficial and harmful since fire is a natural process in many ecosystems. If properly controlled, prescribed fire can help manage plant succession, the structure and composition of an ecosystem, and influence nutrient cycles and energy flow. However, fire can also destroy human property, life, and ecosystems if it is not controlled [9]. As a result, better fire management methods are needed to accurately report the extent of human induced fire, the burn severity, and the recovery process after fire. These goals can be achieved by mapping the burned area using remote sensing techniques, especially extracting the reflectance of the vegetation and soil of the burned areas [10]. The spectral reflectance of vegetation and soil properties within burned areas is characterized largely, so the burnt area is distinguishable through the Near Infrared (NIR) and Short Wave Infrared (SWIR) region in remote sensing imagery [11].
In large forest fire assessment, use of multi-spectral analysis has been proven to be beneficial in detecting risk zones [12]. Landsat data is best suited for this type of study [13,14]. The mid-infrared regions typically have the greatest response to burning among the reflective spectral regions [15,16]. Landsat 4 images are available since 1982, so the burn severity of historical fires may be estimated using these data. TM and ETM+ are often used because of the transformed reflectance (ρ) values of two bands, NIR (band 4: 750–900 nm), and mid-infrared (MIR; band 7: 2090–2350 nm), represented by R4 and R7. These are particularly sensitive to fire-induced changes in surface conditions mostly in vegetation and soil [15,17]. A decrease in green vegetation and moisture content causes R4 to decrease with burn, while R7 increases because of the decrease in soil moisture and increased exposure of soil, rock, and fewer shadows from trees [17]. The Normalized Burn Ratio (NBR) of these bands, was used along with differenced Normalized Burn Ratio (dNBR) and relativized dNBR (RdNBR) as a viable method in this study [17]. However, it is important to use filtering methods to extract accurate burned endmembers before using NBR and dNBR models. In addition to the existing dNBR method, the RdNBR method outperformed for classifications, which produces high accuracies for the high burn severity category [18,19]. For example, RdNBR based classification were more accurate in vegetation with a mix of grass and shrubland or with a mix of forest and non-forest [18,20,21,22].
Studies done by Landmann [23] and Smith et al. [24] used a spectral mixture model with hyperspectral data to determine the correlation between burn severity and high surface reflectance resulting from burned vegetation, implying reflectance was high when the soil was covered in white ash after fire. A spectral mixture filtering analysis known as Mixture Tuned Matched Filtering (MTMF) is usually performed to identify only a single, user-defined endmember at a time [25]. The endmember of interest is extracted and the unknown background is suppressed [26]. The result is similar to traditional spectral linear mixing analysis by the grayscale images (scale 0–1, where 1 is a perfect match) of the endmember of interest are produced. The MTMF is an efficient and advantageous technique for vegetation mapping [27,28,29,30,31]. Often after a fire, dominant spectral signatures, such as charred blackness or exposed soil make it difficult to detect minor vegetation changes due to sub-pixel occurrence. This can be determined by MTMF [25,32]. Minimum Noise Fraction (MNF) is a traditional method also used to determine the inherent dimensionality of image data to segregate noise in the data and to reduce the computational requirements for subsequent processing [33]. The ability to distinguish even small patches of remaining vegetation or patches of ash would provide a better indication of fire effects on surface conditions. Thus, MNF was used in conjunction with MTMF to segregate noise as well as extract endmembers of interest in this study.
In general, the study area of Guanacaste is a mosaic of national parks, wildlife refuge, and biological reserve. The region has the best preserved tropical dry forest, home to rare and endangered species and is largely fire-prone. However, spread of Jaragua (Hyparrhenia rufa) in the Palo Verde National Park (PVNP) turned a large-scale ecological transformation from tropical forest to savanna resulting in extremely flammable grass that can quickly resprout after hot fires [34]. In these forests, burn severity plays a key role in the recovery capacity of both vegetation and soil [35,36]. Regeneration of dominant species and understories are affected by fire depending on the severity. In turn, species are also affected, jeopardizing their recovery [37,38,39]. In addition to the species and vegetation, soil is also severely affected during high burn severity. Loss of organic matter and soil structure degradation are some common issues [40].
The primary objective of this study was to determine how remotely sensed multispectral data can be used to analyze and map fire risk areas. The specific objectives were (1) to use spectral mixing analysis, dNBR and RdNBR on multispectral imagery to map fire risk areas; (2) to discriminate between ground characteristics, such as vegetation and soil cover post fire, and (3) to better test correlations between the ground and multispectral image data. This can be useful for policymakers to conserve flora and fauna in this region.
Study Site
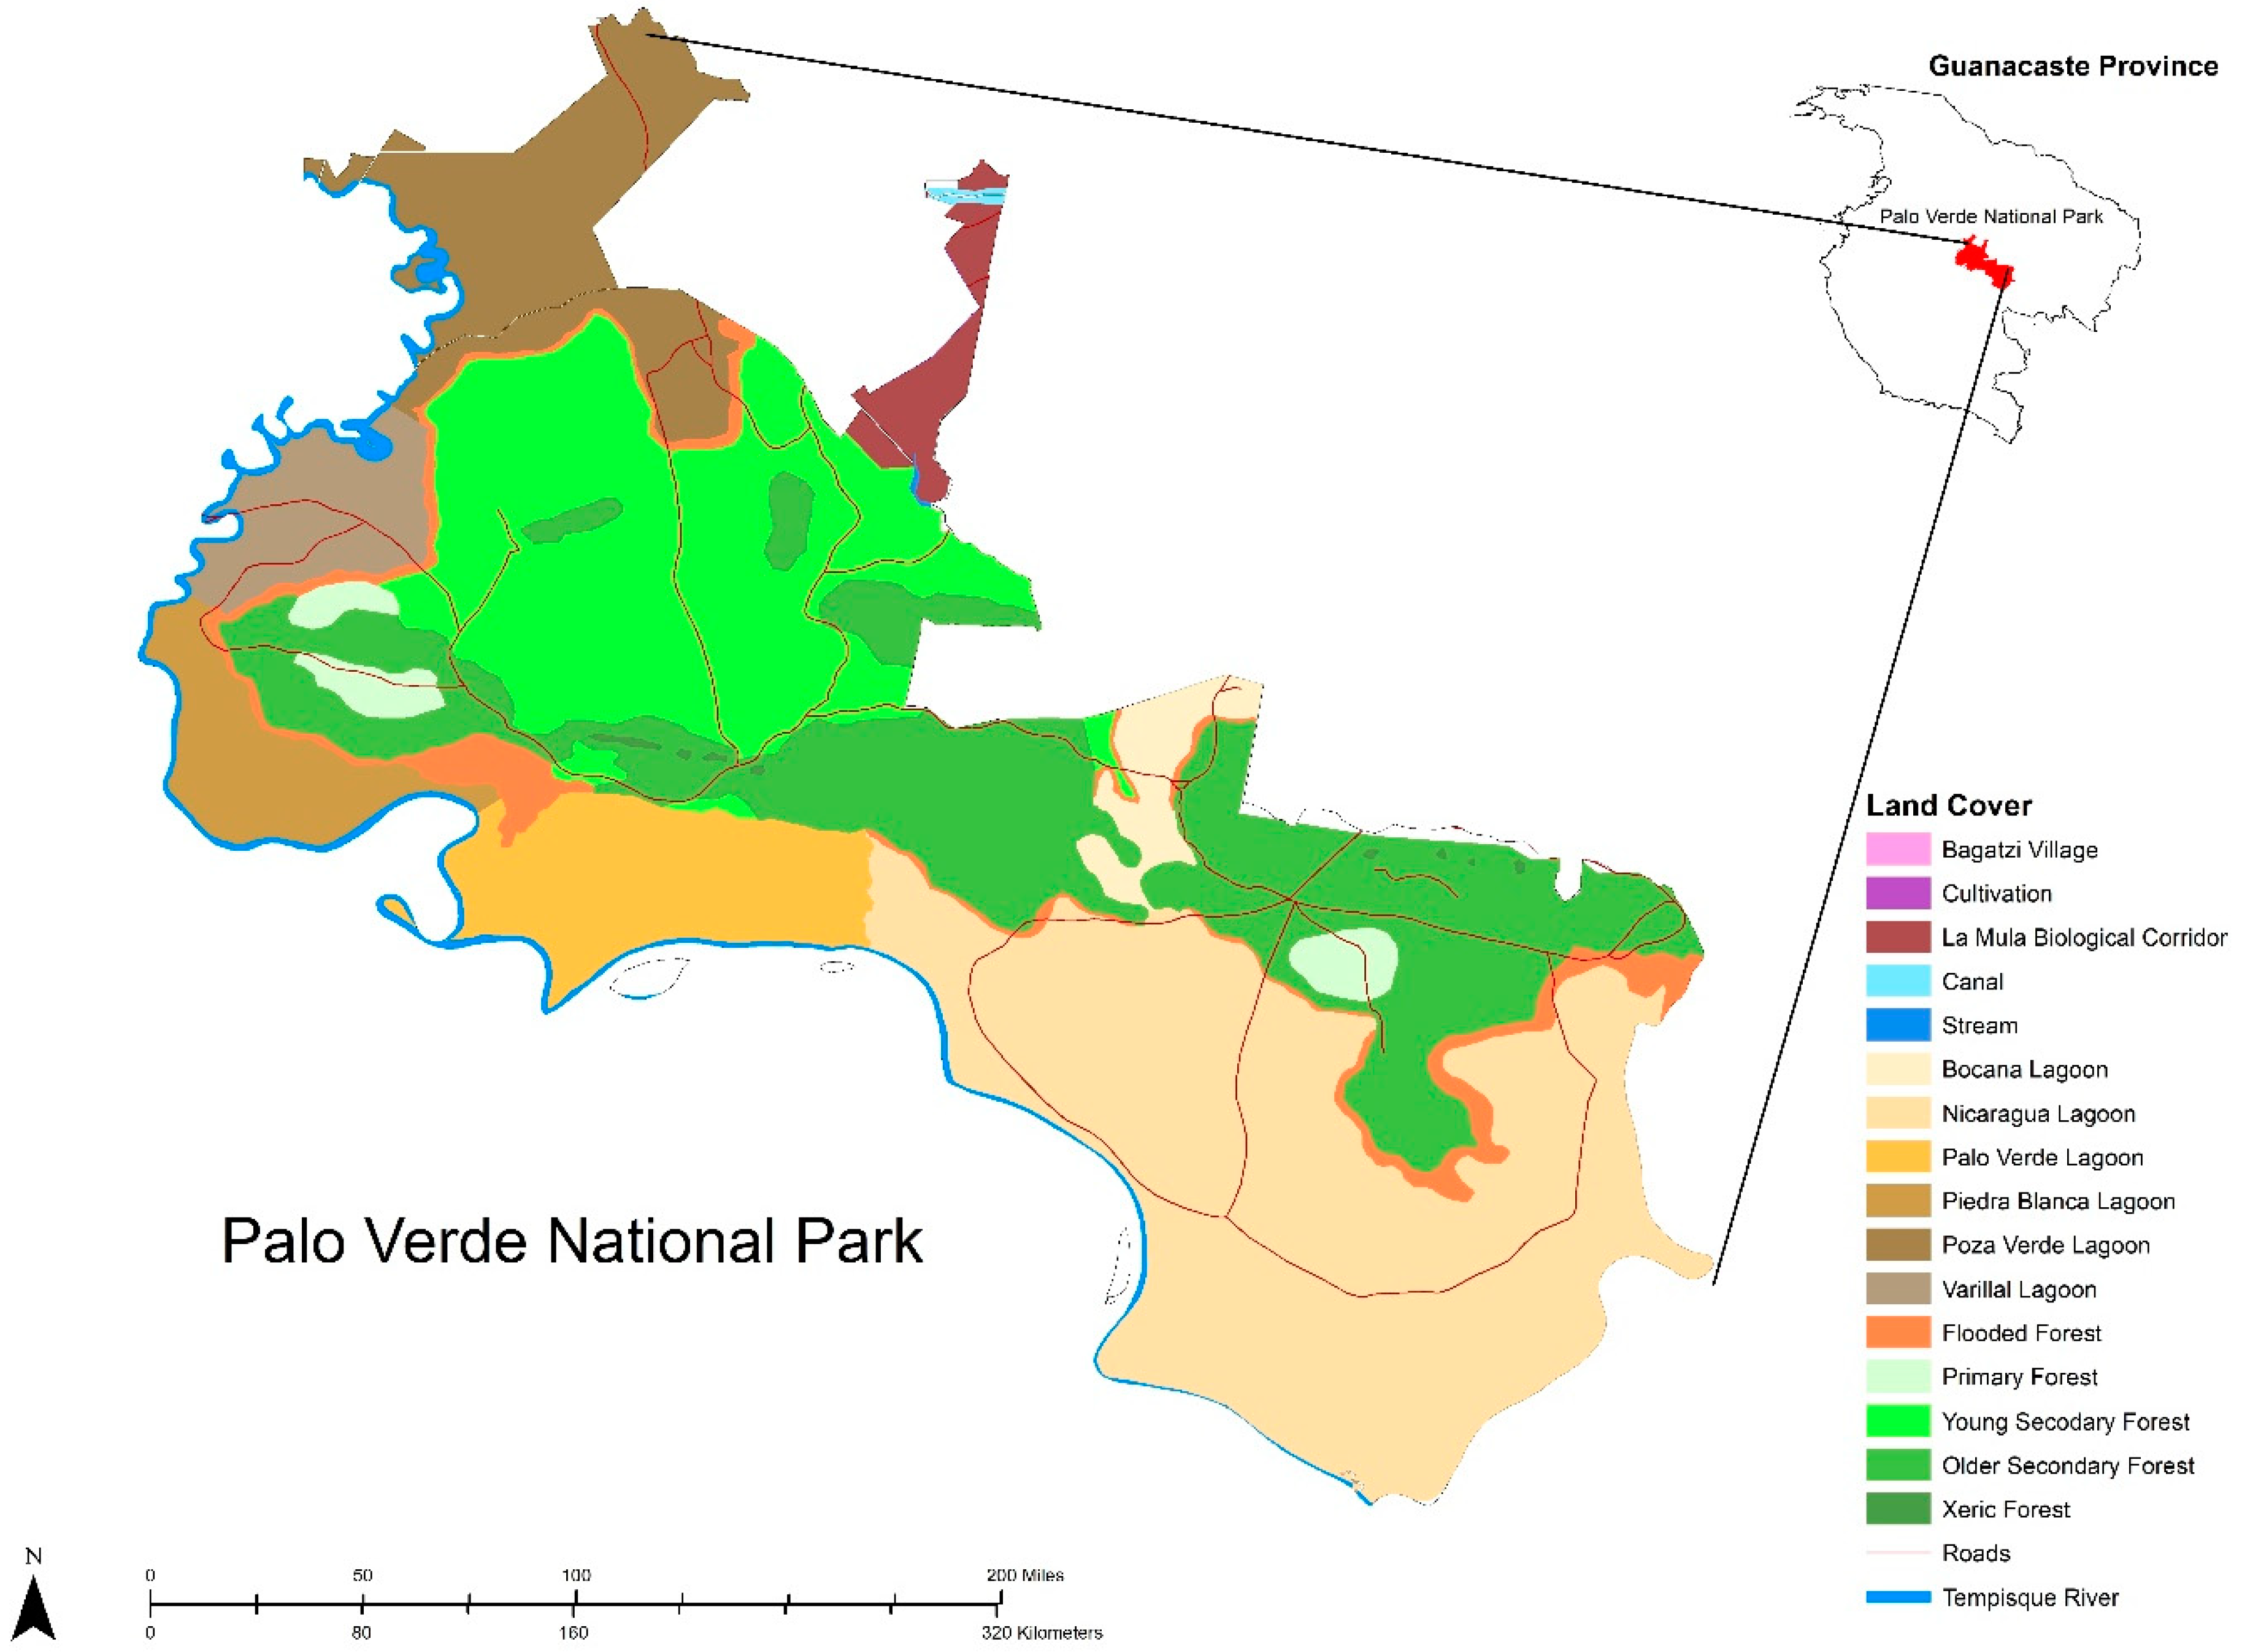
Palo Verde National Park (PVNP) is in the province of Guanacaste in northwestern Costa Rica, at the terminal point of the Tempisque-Bebedero watershed before the Tempisque River flows into the Gulf of Nicoya, and is an integral element of this river basin (Figure 1). It covers 45,492 acres in the Guanacaste Province and the area is comprised of both deciduous and evergreen tropical dry forest, brackish and freshwater wetlands, mangrove swamps, and the tidal estuarine ecosystem of the lower Tempisque River. Its borders also contain a wetland ecosystem that provides the habitat for several residential and migratory waterfowl [41]. The park and adjacent non-protected wetlands were declared as a Ramsar site in 1991, which are wetlands protected by national governments to fulfill their obligations under the Convention on Wetlands of International Importance, commonly called the Ramsar Convention [42]. The region comprised of wet and dry seasons each year and has a mean temperature of 27.58 °C. The mean annual precipitation is 1817 mm occurring between May and November, though a break in the rainy season corresponds roughly to the month of July [42]. The natural vegetation in the watershed is dominated by tropical dry forest governed by a highly seasonal precipitation regime. The Tempisque River drains into the Palo Verde wetland and exits through the Gulf of Nicoya. There was a significant local and landscape-level change in the Tempisque watershed and in the Palo Verde wetland during the late 1900s. In 1980, Palo Verde was converted to a National Park. Thereafter, cattle grazing, which may have historically contributed to habitat heterogeneity, was eliminated from the wetland. This was followed by extensive drought in the Guanacaste region lasting for about a decade. In the park, the effects of this decade long drought were compounded by the construction of a road to Puerto Chamorro, which impeded the flow of Quebrada Huerton from entering the Palo Verde wetland. This ephemeral creek was historically important for maintaining higher water levels and extending the duration of the wet season in the wetland. With this huge alteration in hydrology and scanty rainfall, severe forest fires swept through the park, causing changes in canopy composition in the dry forest and decreased species diversity in the wetland [43]. Palo Verde National Park has experienced anthropogenic activities viz., human induced fire, and poaching especially for crocodiles and cattle ranching [7,44]. As of 2017, the province of Guanacaste was reported to have the highest number of forest fires in the country, mostly attributed to vandalism and hunting, according to the System of Conservation Areas’ (SINAC-MINAE) National Fire Management Program. On 11 February 2015, wildfires destroyed almost 158 hectares of pastureland and secondary forests within the park area, suspected to be caused by farmers and/or arsonists [45].
2. Materials and Methods
The flowchart for the overall methodology is shown in Figure 2. The burn severity mapping procedure consists of four steps: (1) data acquisition and preprocessing; (2) slope analysis; (3) image analysis and (4) statistical analysis. The details of each step are described under the sub-sections and using the relevant literature.
2.1. Data Acquisition and Preprocessing
Landsat 7 ETM+ data for year 2013 and Landsat 8 OLI/TIRS data for year 2015 were acquired from the Global Land Cover Facility (GLCF) Earth Science Data Directory [46] and the Landsat Imagery Program due to their high spatial and spectral resolutions. One meter spatial resolution ortho-imagery for the year 2015 was also acquired from the Earth Explorer. Layer stacking and georeferencing were performed on the uncalibrated images [47,48]. As a way of radiometric correction and preprocessing, the digital numbers were converted to Top of Atmosphere (ToA) reflectance values to correct the effect of the solar zenith angles. ToA reflectance was calculated with Equations (1) and (2) below, using the reflectance rescaling coefficients of the datasets [49]:
where:
- ρλ’ = ToA planetary reflectance, without correction for solar angle. Note that ρλ’ does not contain a correction for the sun angle
- Mρ = Band-specific multiplicative rescaling factor from the metadata
- (REFLECTANCE_MULTI_BAND_x, where x is the band number)
- Aρ = Band-specific additive rescaling factor from the metadata
- (REFLECTANCE_ADD_BAND_x, where x is the band number)
- Qcal = Quantized and calibrated standard product pixel values (DN)
- ρλ = ToA planetary reflectance
- θSE = Local sun elevation angle as SUN_ELEVATION
- θSZ = Local solar zenith angle; θSZ = 90° − θSE
Dark object subtraction was performed to remove the effect of atmospheric scattering on the reflectance of dark objects. The darkest pixel value was selected from clear water objects in each band based on the assumption that the dark objects reflect no light. Any value greater than zero would result from atmospheric scattering since dark objects were assumed to reflect no light. By subtracting this value from every pixel, the datasets would be devoid of scattering. Topographic corrected values were then rescaled to land surface reflectance in percentage (ρ). These corrections are convenient due to the relevant effect of atmosphere on some bands and because of differential terrain within the study site. A single scene from 3 March 2013 was selected as a pre-fire data and the scene from 2 March 2015 was selected as post-fire data since it was acquired after the major wildfire incident on 11 February 2015.
2.2. Slope Analysis
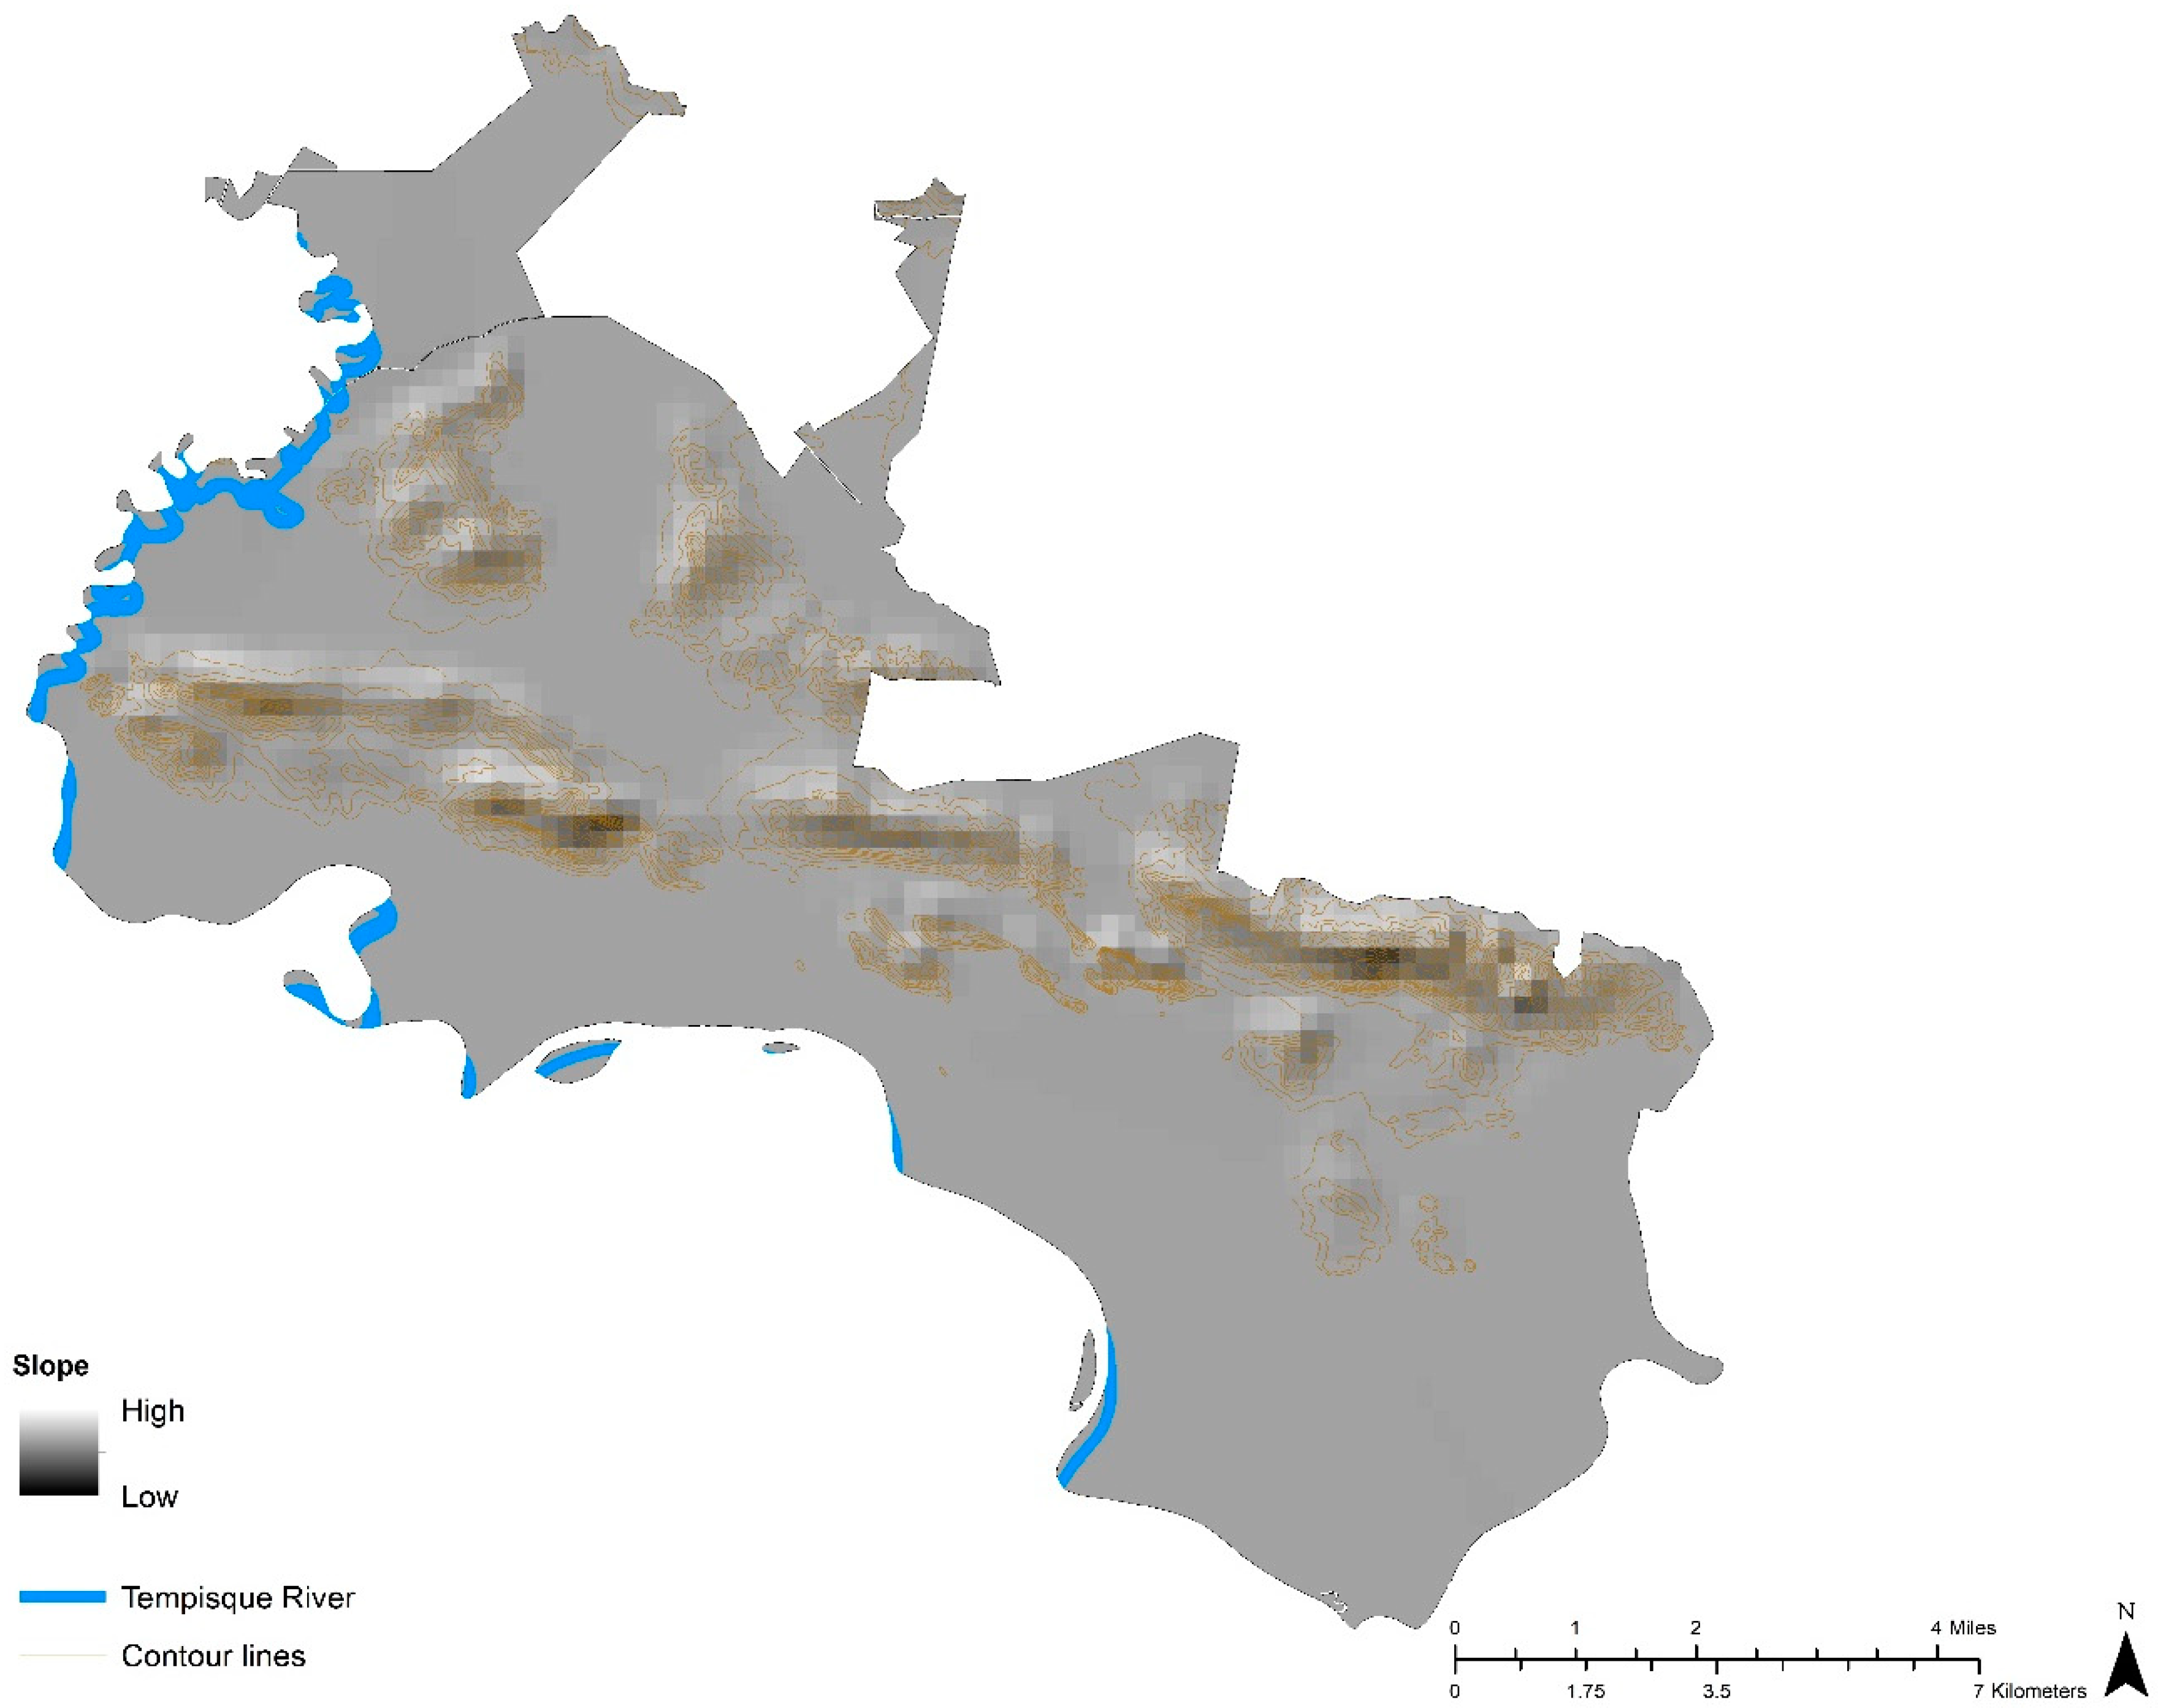
Terrain-corrections and topographic normalization were done where slopes were computed from a Digital Elevation Model (DEM) dataset acquired of the study area to identify areas with higher slope that would aid in higher run-off rates. Figure 3 shows elevation data for PVNP with contour overlays. The area has very few contour lines (values ranging from 80 m to 200 m) indicating that it is a low-lying area, but it is surrounded by an elevated region with contour values ranging from 590 m to 320 m. Raster slices were then applied to delineate visually higher slope areas. Finally, spectral subsetting on the datasets was performed to limit the application of masking in order to select bands of an image. Subsetting was applied using a pre-defined region of interest of the burn region (PVNP). The areas with values of 1 were retained while masked 0 values in the calculations were ignored. Masks were built on the subsetted DEM dataset to extract steep terrain areas. The new mask datasets depicted areas with slope values greater than 25 degrees in white. This method ensured segregation of steep terrain values from low terrain values.
2.3. Image Analysis
Terrain-corrected masked images were used as inputs for the image analysis. To derive the risk zones, Principal Component Analysis followed by Forward MNF rotation statistics were computed to reduce noise and to the resultant MNF datasets, MTMF was applied (Figure 4). The post-fire ortho-imagery was used to collect forty ground control points to classify the image. Lighter colored areas represent higher fractional cover on a scale of 0–1. These datasets were used as inputs for dNBR (Figure 4), computed from NBR developed by the National Park Service and the U.S. Geological Survey [50]. Near infrared (band 4) and short-wave infrared band (band 7) can provide the best contrast to isolate burned vegetation and healthy vegetation [51]. The formula for NBR is very similar to that of NDVI except that it uses NIR and the short-wave infrared (SWIR-2) wavelengths [11,50,52] as shown in Equation(3).
NBR = (NIR − SWIR)/(NIR + SWIR)
There is usually evidence of change in vegetation and soil properties post-fire so measuring this change in surface conditions is a better estimation of burn severity, hence a dNBR was computed by subtracting the post-fire NBR from the pre-fire NBR as shown in Equation(4) [17]. RdNBR was computed using Equation (5) [18].
dNBR = NBRpre − NBRpost
Ground data of the areas with high dNBR and RdNBR were acquired as ROIs from the high resolution ortho-imagery.
2.4. Statistical Analysis
2.4.1. Comparison of Ground Data with Image Pixels
Ground observation points were acquired from 40 regions of interest (ROI) within the PVNP accounting for burned areas from the ortho-imagery. In addition, these values corresponded to scorched vegetation and soil cover. Historical Google Earth images were used as reference observation data for burn severity. The ground data values were then used to derive correlation between MTMF scores, NBR values, and dNBR values for each endmember using Pearson correlation statistics in SAS (Base SAS(R) 9.4). All correlations were regarded as a statistically significant difference when the p value < 0.05 [53]. To examine the relationship between ground data and spectral data, linear regressions were computed on MTMF scores. MTMF scores negative or greater than one were rescored as 0 or 1 indicating no data or high score. All the scores were multiplied by 100 to derive the 1:1 correlation with ground data acquired from 2015 aerial imagery.
2.4.2. Accuracy Assessment
We conducted a preliminary assessment of the accuracy and the result was evaluated using an error matrix approach to generate accuracy parameters; i.e., confusion matrices, user’s and producer’s accuracies, Kappa Coefficient, and overall accuracies for the entire target region. Typically, an accuracy assessment using an error matrix (or confusion matrix) is conducted by selecting a sample of pixels, blocks of pixels, or polygons from within the mapped area and obtaining the reference classification for each sampled location, where the reference classification is defined as the best available assessment of ground condition [54]. In this study, the assessment unit is assumed to be a pixel. The matrix provides a quantitative method of characterizing classification accuracy where it compares ground truth data with the results of classification. Kappa coefficient assesses the viability of the classification compared to a random classification, subject to the observed marginal in the true classes [55].
3. Results
The results of this study are presented under four major subheadings comparable with methods. In Section 3.1 and Section 3.2 the data acquisition and preprocessing and slope analysis are reported respectively. The image analysis and the accuracy assessment results are described under Section 3.3 and Section 3.4 respectively.
3.1. Data Acquisition and Preprocessing
Spectral reflectance endmembers were collected from the pre-fire (3 March 2013) and post-fire (2 March 2015) Landsat images after Dark Object subtraction was applied to them. The fire occurred on 11 February 2015 and the post-fire images were selected based on close proximity to the incident and availability. Figure 5 shows spectral reflectance curve of healthy green vegetation has a significant minimum of reflectance in the visible portion of the electromagnetic spectrum resulting from the pigments in plant leaves. Reflectance increases dramatically in the near infrared (0.7–0.9 μm). Scorched or charred vegetation can be detected at a significantly lower reflectance in the infrared. Charred soil shows a much lower reflectance than uncharred soil cover.
3.2. Slope Analysis
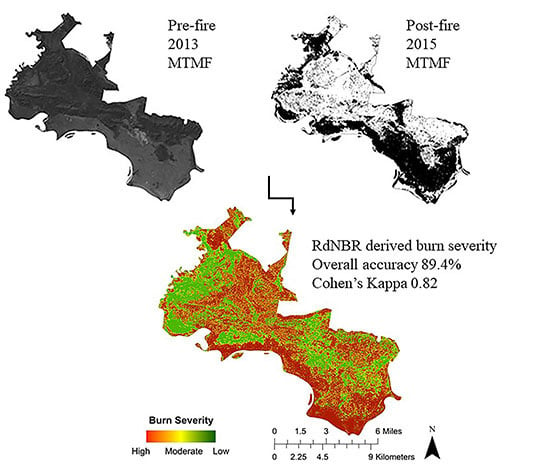
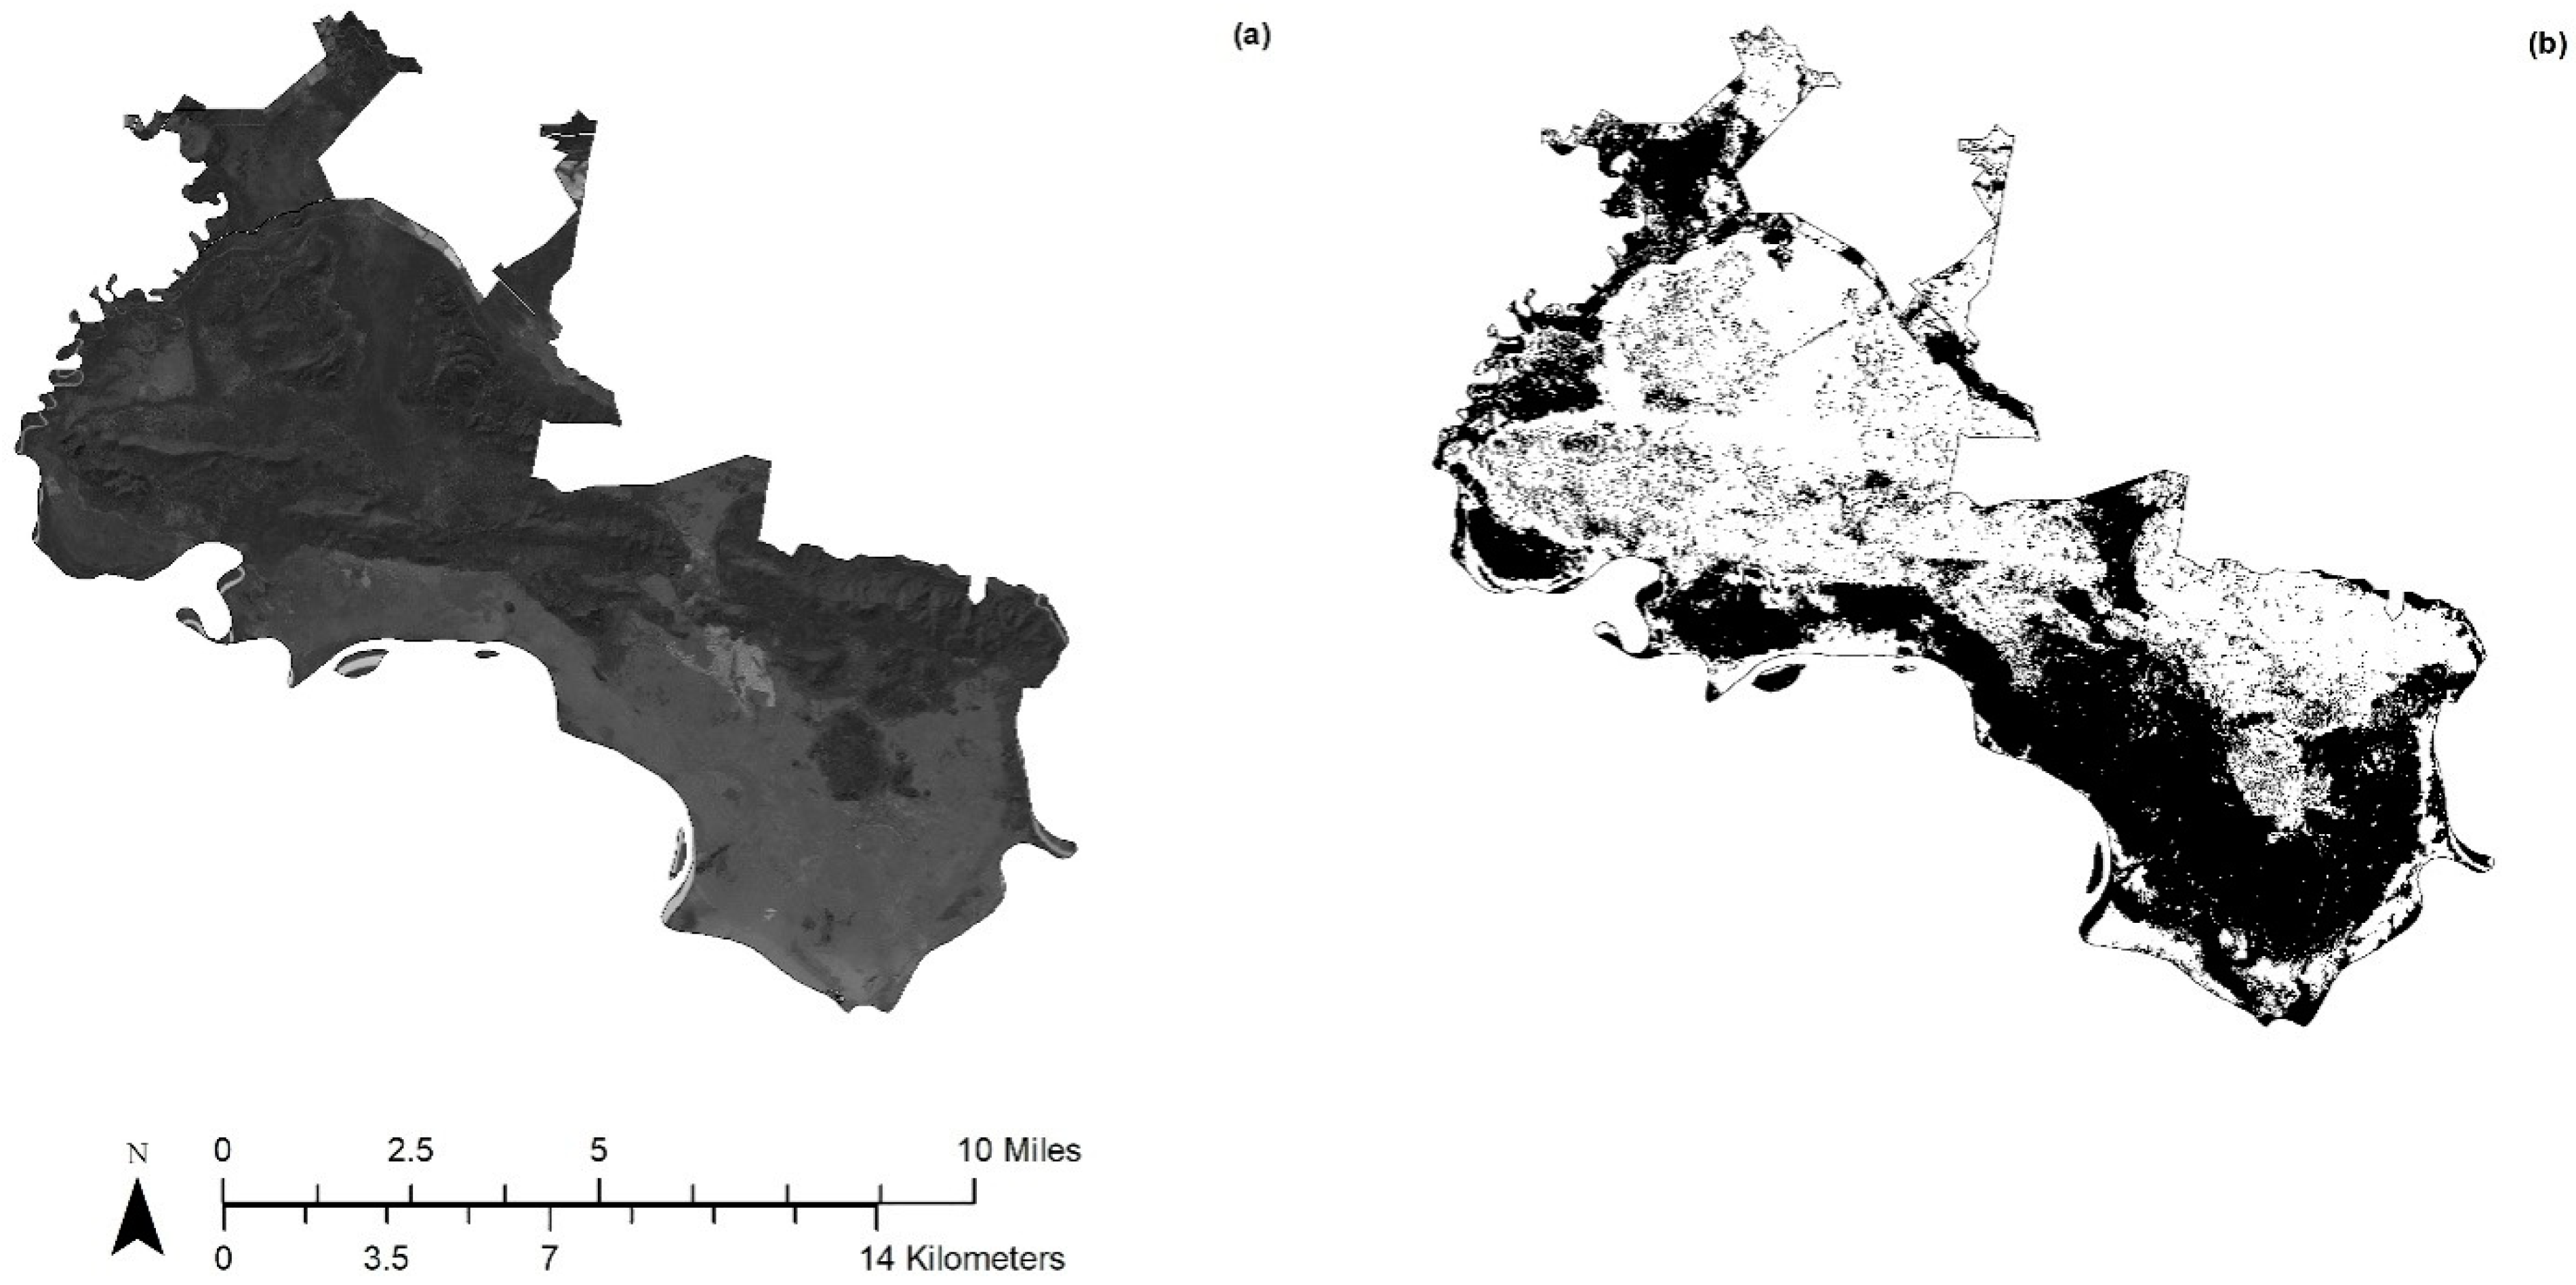
Areas with concentrated contour lines have a higher elevation and well-distributed secondary forests (Figure 1 and Figure 3). The pre-fire MTMF image of year 2013 did not show much variation, (Figure 3) while post fire image of 2015 showed dark-colored regions indicating low fractional cover. Bright areas indicated high fractional cover. The majority of the high severity areas has a low elevation and is part of the Palo Verde, Nicaragua, Piedra Blanca, and Poza Verde Lagoon.
3.3. Image Analysis
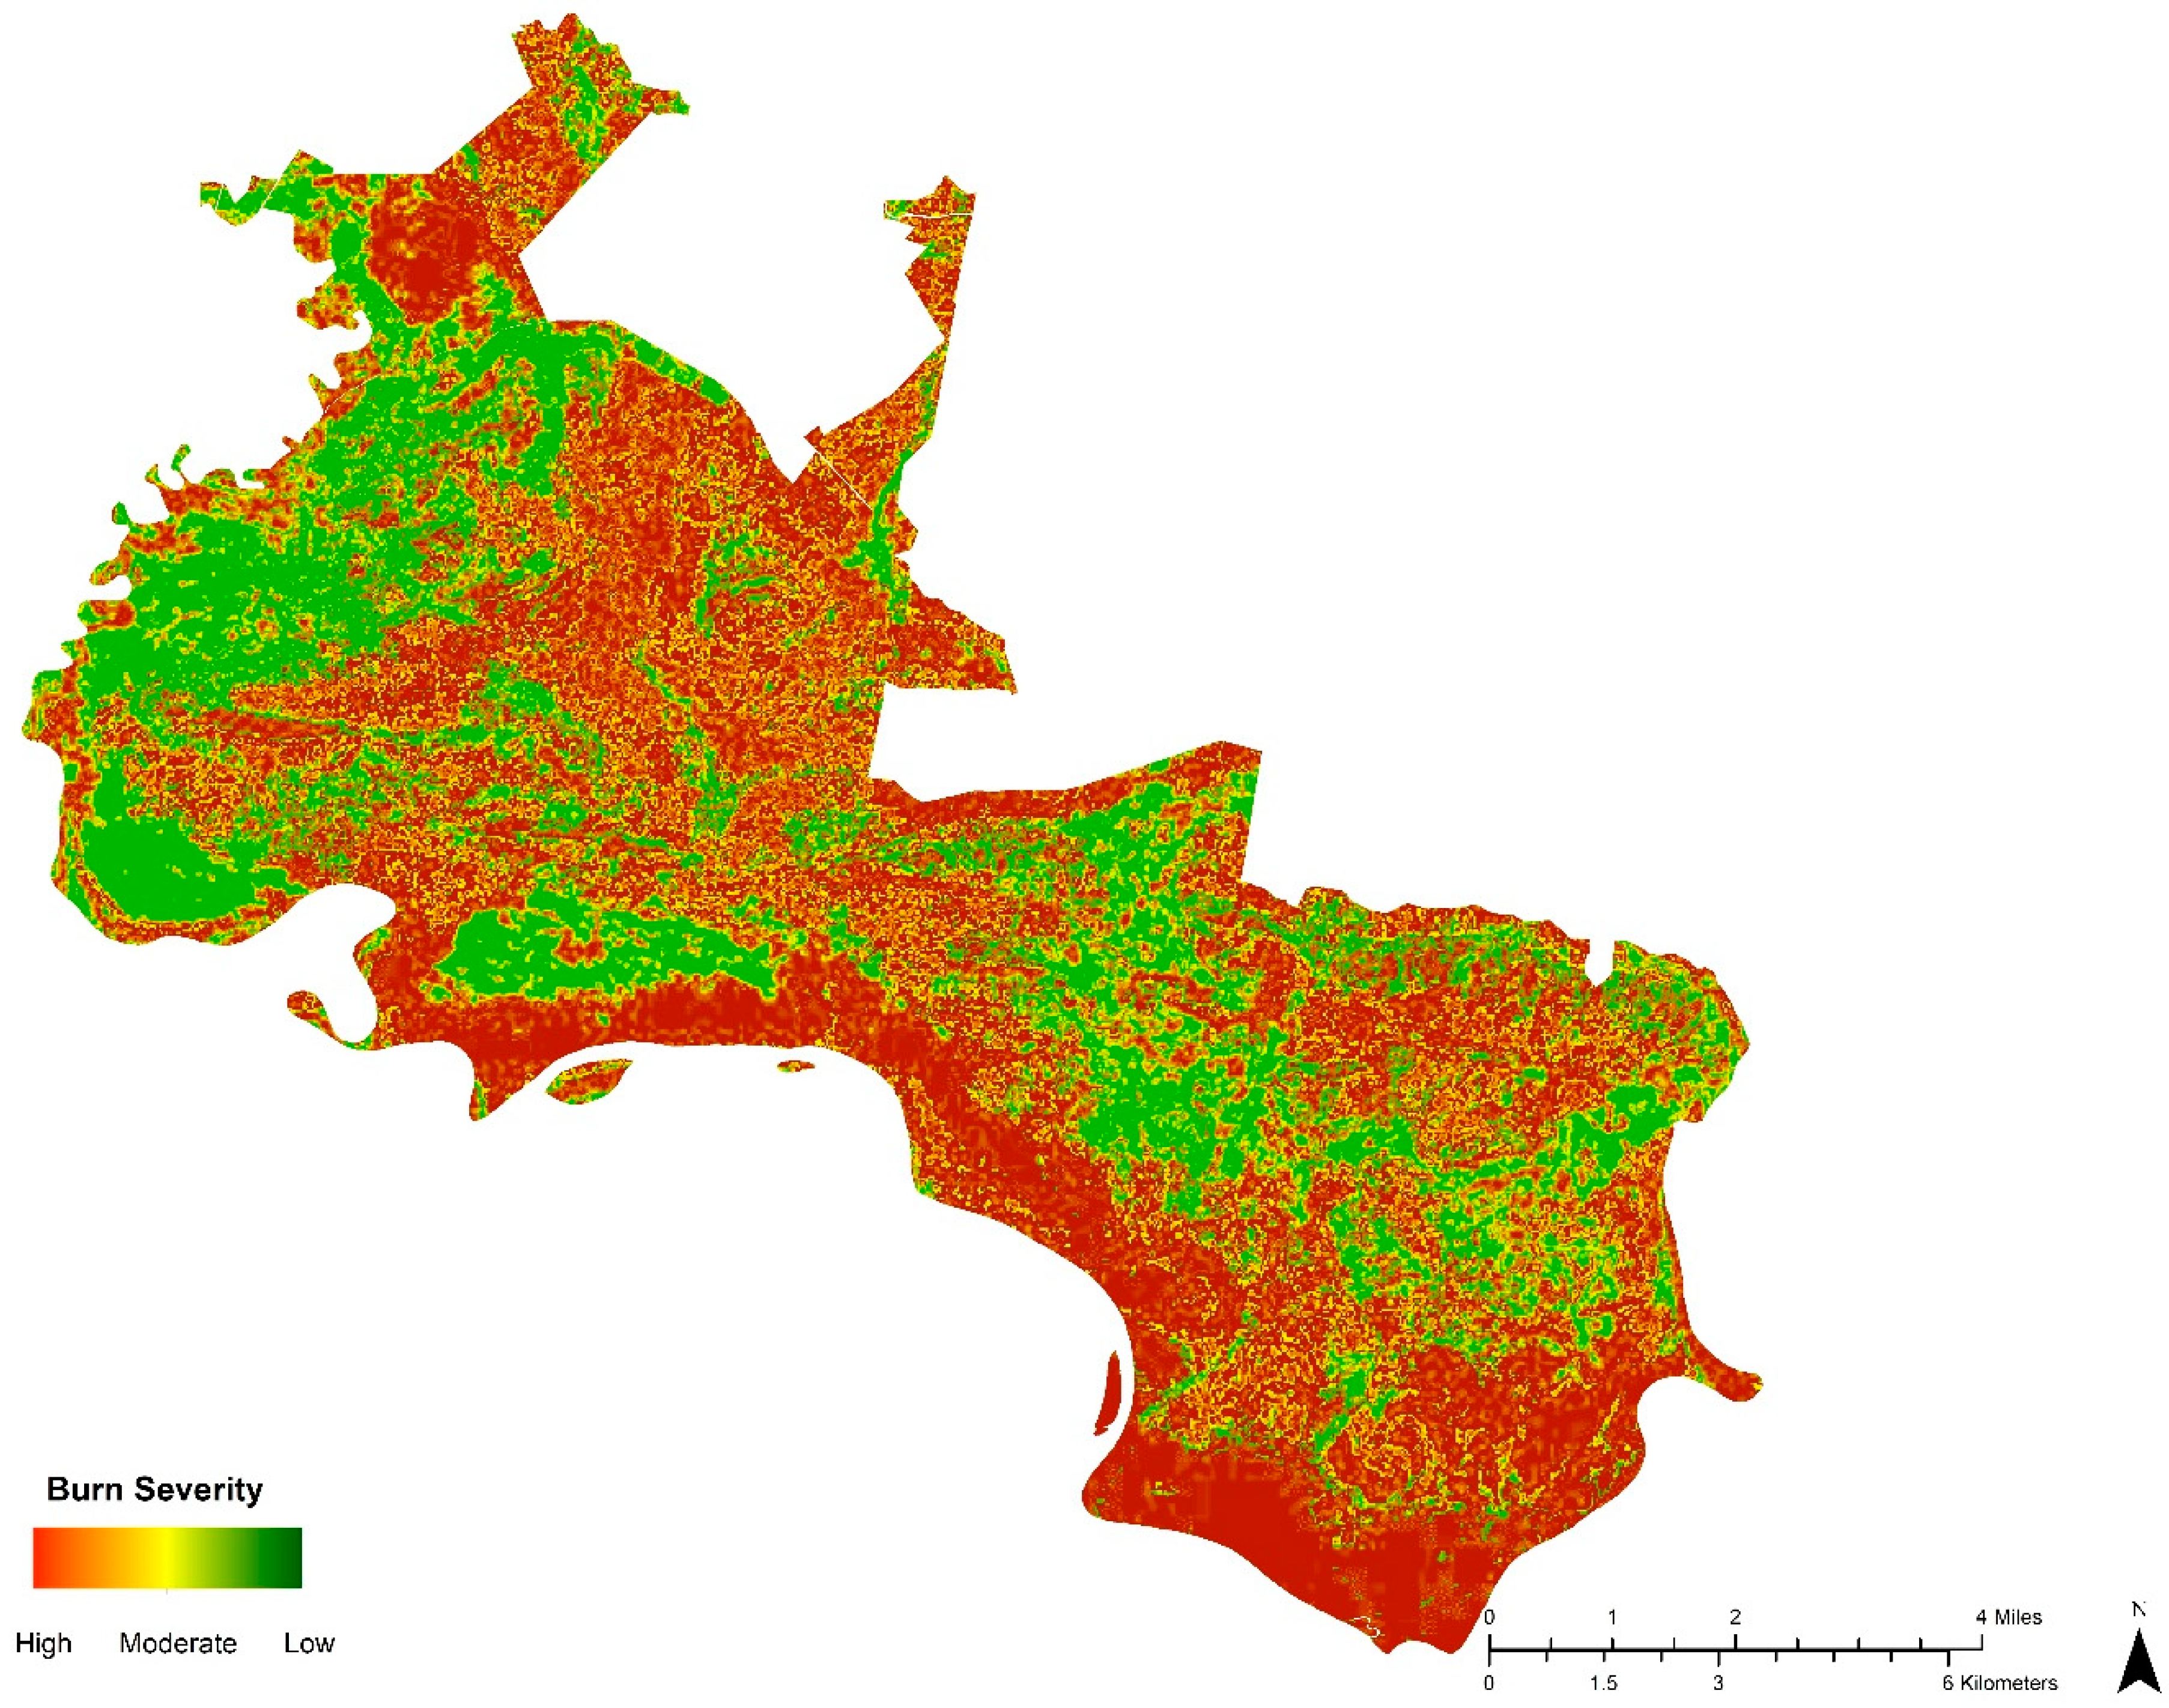
Burn severity was computed from dNBR and RdNBR. The final image was derived (Figure 6), where red areas depicted high severity, yellow areas depicted moderate severity, and the green areas depicted low severity. The threshold values were determined based on the USGS Fire Effects Monitoring and Inventory Protocol (FireMON) program [17]. The charred vegetation/soil characteristics obtained from the endmember collection were considered when identifying burn severity classes. The gradient of RdNBR has been stratified to identify burn severity levels, including: unburned or low change, low (green), moderate-low (yellow), moderate-high (orange), and high (red).The values from dNBR ranging from −0.1 to 0.66 were classified into categories listed in Table 1 where, −0.1 was rated as unburned and above 0.66 was marked as a high severity area, appearing as red on the map. Unburned areas were not visible within the study area.
3.4. Statistical Analysis
3.4.1. Comparison of Ground Data with Image Pixels
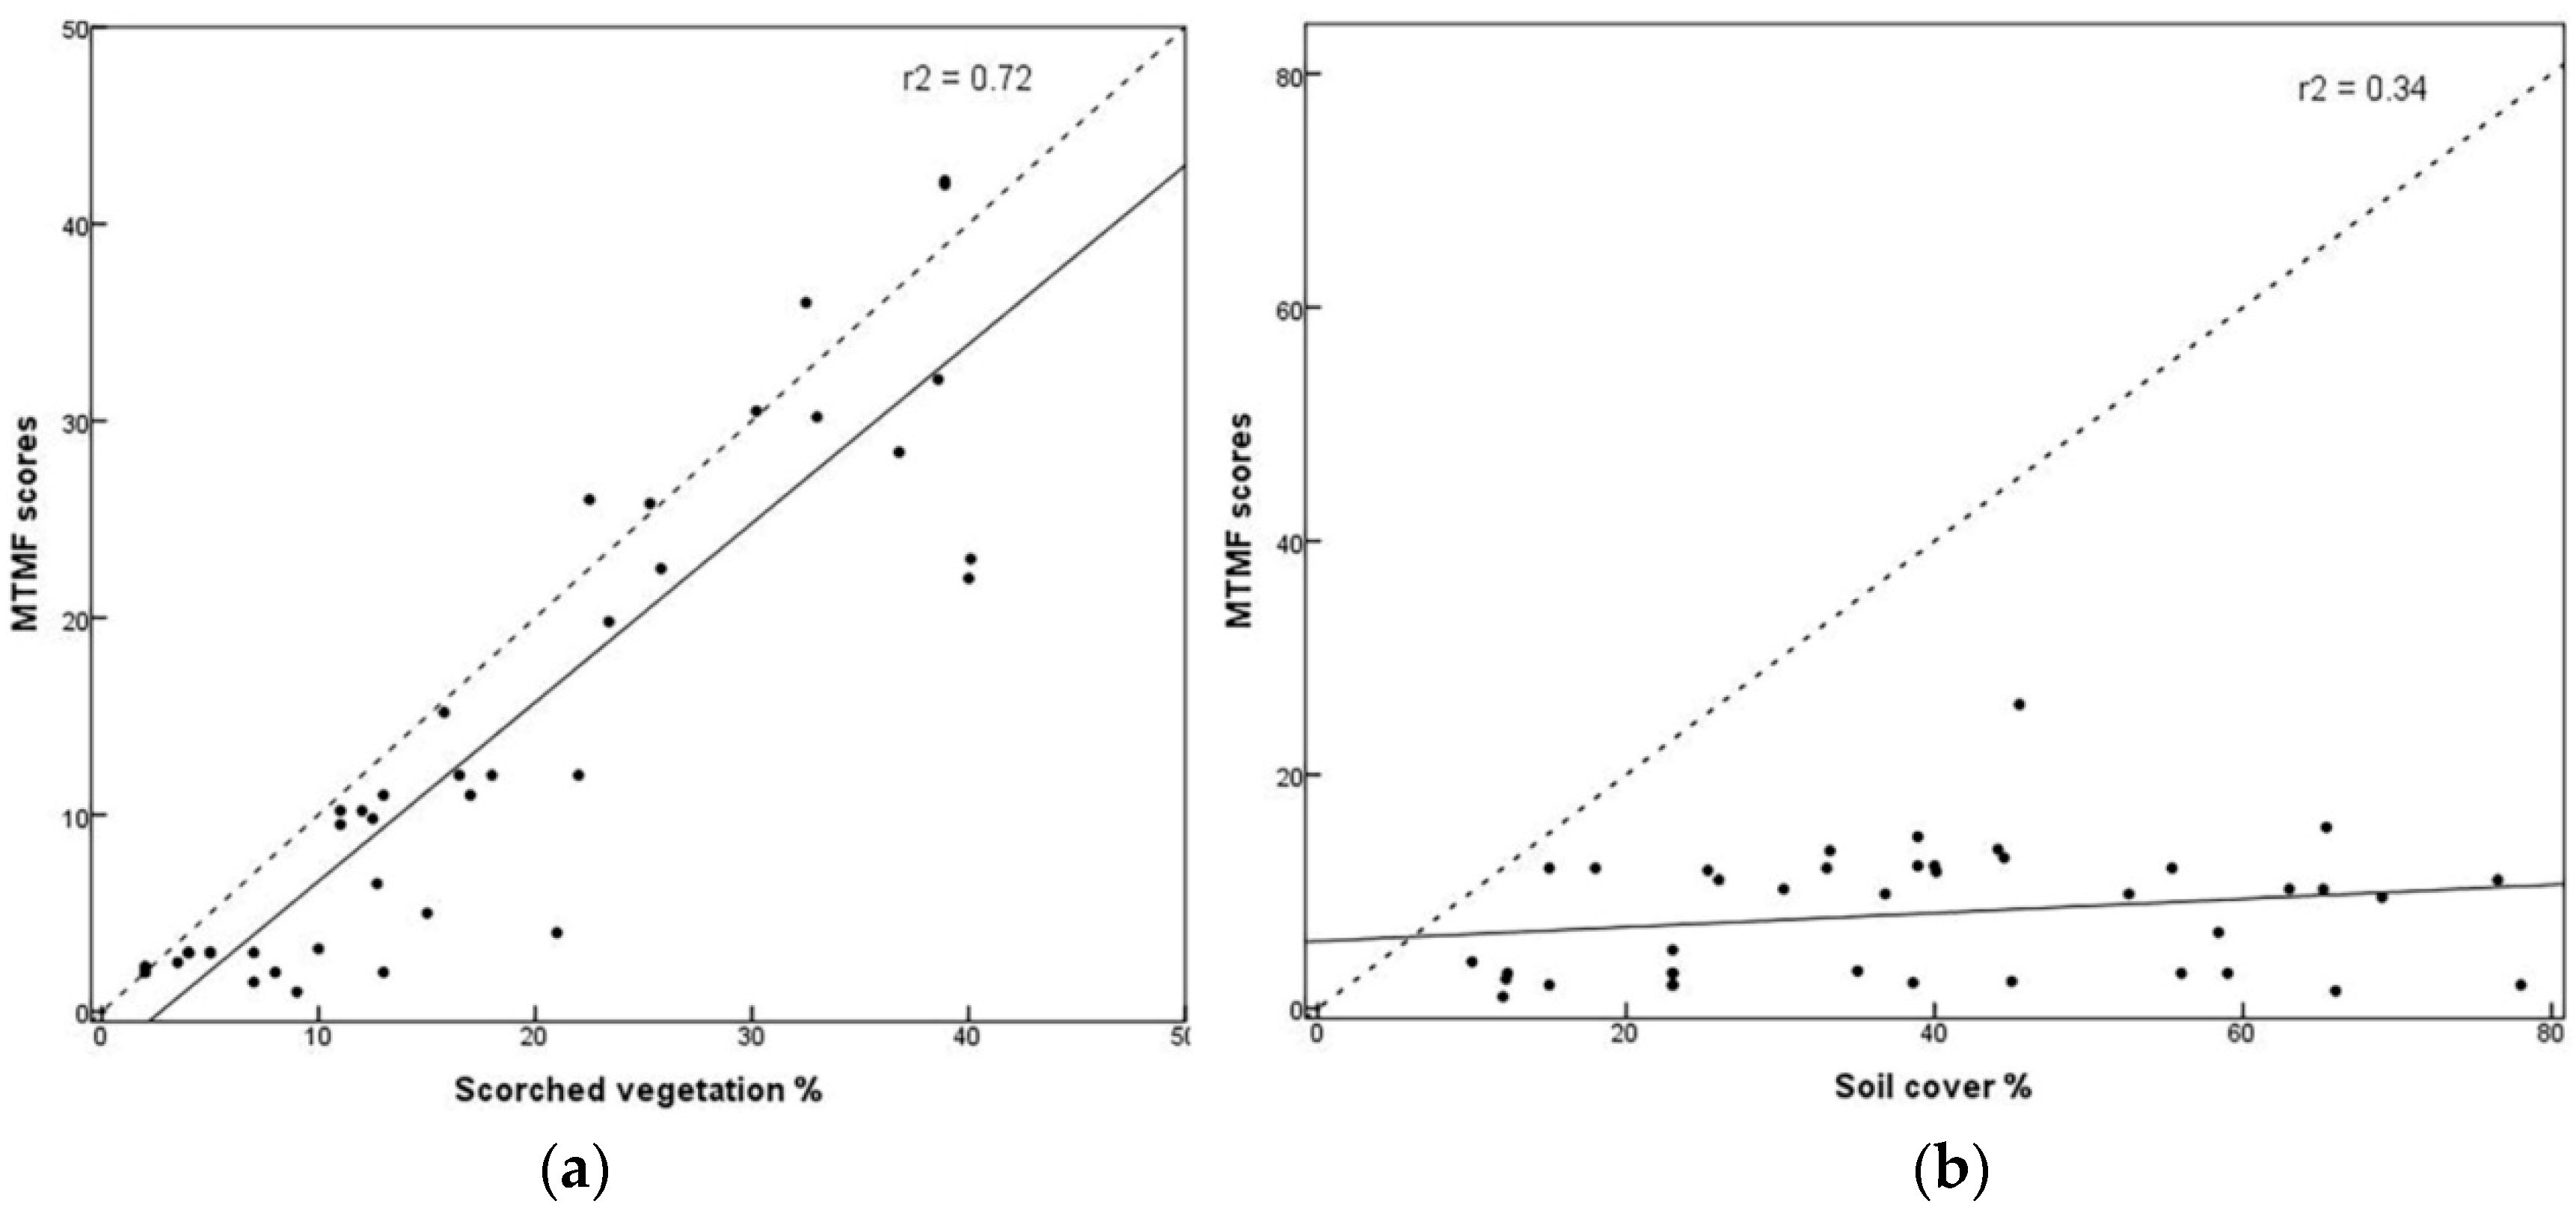
Table 2 shows Pearson correlation coefficients between ground values for 40 ROIs and image pixels from MTMF, NBR, dNBR, and RdNBR. Strong correlation between ground data, MTMF scores, NBR, dNBR, and RdNBR values for vegetation can be seen as indicative of a high susceptibility to fire. The values ranged from 0.70 to 0.76. The RdNBR values for charred/scorched vegetation were 0.76 compared to the MTMF values of 0.72. The soil cover showed a much lower correlation with values ranging from 0.34 for MTNF to 0.53 for RdNBR. Increases in values from dNBR to RdNBR were noted from 0.75 to 0.76 for scorched vegetation and 0.51 to 0.53 for soil cover. This can be attributed to the fact that the region is covered in unexploited dense vegetation, predominantly mixed deciduous forest, and minimal soil cover.
The scatterplots derived from correlations of ground data and MTMF scores for vegetation cover resulted in a higher R squared value of 0.72 for vegetation compared to soil data that was 0.34 (Figure 7), which were attributed to the driest and partially charred vegetation components. NBR values were also significantly high for the ground cover classes. The increase in dNBR and RdNBR values for ground classes is attributed to the magnitude of change from pre-fire conditions. The strongest correlation was found in vegetation that was 0.76. The results from the linear regressions show that the groundcover and MTMF scores for the two endmembers were statistically related and that MTMF scores may be used to quantitatively predict ground cover components, especially scorched vegetation.
3.4.2. Accuracy Assessment
The dNBR and RdNBR analysis of Landsat imagery with MTMF shows a heterogeneous fire affected area in the northeast and southeast part. In the southwest part, the RdNBR detects the more homogeneously burnt surface. The dNBR analysis had an overall accuracy of 84.4% and a Cohen’s Kappa coefficient of 0.82 (Table 3). The RdNBR analysis had an overall accuracy of 89.4% and a Cohen’s Kappa coefficient of 0.82 (Table 4). The user’s accuracy for both classification categories was the highest (98%) for the high burn severity class and the lowest (40%) for the unburnt/no change class. Results of the producer’s accuracy demonstrate difficulty in detecting lower burn severity classes compared to classes of higher burn severity.
4. Discussion
4.1. Data Acquisition and Preprocessing
Typically, healthy green vegetation exhibits strong reflectance in the red/infrared boundary near 0.7 μm. The reflectance is nearly constant from 0.7 to 1.0 μm and gradually decreases for longer wavelengths as seen in Figure 5. The study area of PVNP comprises eight forest zones, with dry forests being the most abundant, and the layered structure of the vegetation largely responsible for the variation in the reflectance curve [41]. The endmember reflectance curve of uncharred soil is considerably less variable since it is affected by moisture content, soil texture, surface roughness, the presence of iron oxide, and organic matter [56]. These factors are less dominant than the absorbance features observed in vegetation reflectance spectra. The soil around PVNP have lower moisture content, attributed to a low reflectance, which is seen to be lowered further in charred soil collected from the post-fire image of 2015.
Several studies used hyperspectral data to collect endmember fractions together with field plot data and/or Landsat multispectral data (For example, [57]). In this study, we had to rely on Landsat 7 ETM+, Landsat 8 OLI/TIRS and high resolution ortho-imagery due to the limitation of hyperspectral data between the pre-fire and post-fire period. However, the reflectance spectra of four endmember fractions of this study (Figure 5) are comparable with the spectra gathered using hyperspectral data [57,58]. For example, as Lewis et al. [57] reported, the charred soil reflectance is slightly higher than charred vegetation and reflectance is increased from 0.7 μm to 1.7 μm wavelength by 0.2 reflectance (from 0.1 to 0.3), which clearly showed from this study. Amraoui et al. [58] found in their study that stressed vegetation is often seen to have a slightly higher reflectance in the near infrared area mostly around 1.0–1.8 μm. This study reflected similar results for charred/scorched vegetation where a slight increase in reflectance was noticed between 1.5 and 1.9 μm from the darker colored burned vegetation.
4.2. Slope Analysis
Surface conditions such as slope, vegetation and soil were the key factors for identifying burn risk areas in this study. Topography was particularly considered an important physiographic factor, which is related to wind behavior, and hence affects the fire ignitions in an area. Fire travels most rapidly uphill and less downhill. If the fire originated in low elevation regions then it could rapidly spread towards a higher terrain of Xeric forest, which would be more prone to fire due to their low moisture content. The high burn wetland areas are home to spectacled Caiman crocodiles, American saltwater crocodiles, Olive Ridley turtles, Green Chelonia mydas, leatherback turtles, and hawksbill turtles [59]. In addition, these beaches are nesting grounds for such species and potential fire would pose a high risk.
4.3. Image Analysis
MNF transformation was used on the masked images to determine the inherent dimensionality of image data, to segregate noise in the data, and to reduce the computational requirements for subsequent processing [33]. The MNF transformation is essentially a two-phase Principal Component Analysis that segregates the noise from the data resulting in a reduced number of bands, which contained the most meaningful information [60]. The first transformation, based on an estimated noise covariance matrix, de-correlated and rescaled the noise in the data. This step resulted in transformed data in which the noise had unit variance and no band-to-band correlations. The second step was a standard Principal Component transformation of the noise-whitened data. For the purposes of further spectral processing, the inherent dimensionality of the data was determined by examination of the final values and the associated image. The data space was divided into two parts: one part associated with large values and coherent images, and a complementary part with near-unity values and noise-dominated images. By using only the coherent portions, the noise was separated from the data, thus improving spectral processing results.
The MTMF score in Figure 4 measures how spectrally abundant the measured material (endmember) is in the image pixel. Spectral abundance in an image pixel corresponds to physical abundance in the same location on the ground. A score of zero means no match to the input endmember and no presence of the material in a pixel, while a score closer to one indicates a better match to the input endmember and greater abundance of the material in the pixel. The infeasibility (IF) value generated as part of the MTMF analysis, shows how likely or unlikely the match is. In general, pixels with a combination of high MTMF scores with low IF values are a better match to the endmember spectrum [61]. The MTMF processed datasets reflected mostly soil and scorched vegetation endmembers. The scores of MTMF summation at each pixel was almost less than unity since almost all pixels had unidentified background material. MTMF combines features of Linear Spectral Mixing model and Matched Filter model while avoiding the drawbacks of each of these methods. Unlike traditional Spectra Mixture modeling, it has the ability to acquire a single known target without acquiring other background endmember signature [62]. It can leverage the constraints on feasibility including the unit-sum and positivity requirements. As a result, MTMF can outperform traditional mixing model methods, especially in cases of subtle, sub-pixel occurrences such as wildfires.
The fire severity map derived in this study indicated that combining unmixing techniques with noise segregation greatly improved accuracy. The results found in this study successfully constitute to initial fire risk zone assessment using multispectral remote sensing imagery. The evaluation of dNBR, RdNBR, and MTMF of scorched vegetation and soil cover produced suitable matches to burn severity areas. The advantage of using MTMF with respect to dNBR and RdNBR is that it discriminates physical ground characteristics (i.e., ash, soil, and scorched/green vegetation) of dNBR and RdNBR classes while improving the burn severity map than previous mapping methods [63,64]. The dNBR reflective values for vegetation (0.75) fit best with ground values of burn severity. The RdNBR reflective values for vegetation and soil were slightly higher than dNBR (Table 2), which resulted in better classification accuracies for mixed vegetation types as highlighted by several studies [18,20,21,22]. RdNBR results showed a slight lower correlation to pre-fire NBR than dNBR, proving RdNBR is more effective at high severity burn detection, similar to a previous study [19]. Unmixing results greatly improve severity detection in fire-prone Xeric and secondary forest region by identifying the relative abundance of ground components (scorched vegetation and soil). The measured ground endmembers are significantly related to the corresponding spectral MTMF scores based on an assessment of 40 ROIs. This, when compared to Landsat data, which are currently used for post-fire assessment, makes it possible to more accurately assess the effects of fire on the soil surface. Use of such remote sensing techniques to evaluate and predict burn severity areas has great potential and can be used to access post-fire rapid response assessments.
4.4. Accuracy Assessment
Cohen’s Kappa statistic is widely employed by the remote sensing community as a standard measure for accuracy assessment of the classified images, although we acknowledge criticisms of this technique [65,66]. It was evident from the error matrix approach that high burn fire risk areas can be detected most accurately compared to low burn risk areas owing to the burnt forest canopy and unobstructed view of the ground area. Using dNBR and RdNBR in conjunction with MTMF to derive fire risk zones improved overall accuracy compared to using only multispectral data for traditional fire assessment similar to studies done by Walz et al. [67] and Epting et al. [13]. Previous studies concerned either with pixel-based or polygon based procedures for accuracy assessment reported 85% overall accuracy. In our pixel-based approach, we obtained 89.4% overall accuracy, which is considered as a moderate accuracy for classification [68,69]. However, the Cohen’ Kappa statistics have limitations on accuracy measures due to randomness, quantity disagreement, and allocation disagreement, and is redundant with overall accuracy [65,68].
4.5. Application and Implications
A wide set of users have used Landsat data for mapping fire/burn severity of vegetation using classification and spectral indices. For example, the supervised classification for fire severity classes [16,70], dNDVI for tree mortality and RdNBR for fire severity classes [71,72], dNBR and CBI (composite burn index) for fire severity classes [73,74], and dNBR for estimating live trees and forest floor biomass [75]. In the study done by van Wagtendonk et al. [15], the dNBR values from the Landsat data projected lower correlation compared to this study, which provided slightly stronger correlation with ground data when applied with MTMF. RdNBR detected a change in pre-fire low vegetation conditions in this study, similar to Parks et al. [19]. The differences between the Landsat-derived RdNBR, dNBR, and hyperspectral NBR values were found minimal in studies done by Kokaly et al. [76] and others [16,63]. This would not justify the greater acquisition cost or even processing time of hyperspectral data versus Landsat data. Greater overall accuracy in using the MTMF method approach would be because unidentified background material that exists in every pixel post fire could be readily detected. Although tested in previous research for fire severity assessment [61,76], multispectral data, and the partial unmixing approach are for the first time used in the present study to derive fire severity maps. In addition to Landsat data, some studies utilized SPOT [77,78], AVIRIS [63], MODIS [67,79] and hyperspectral data [57,63] for assessing fire severity classes, and fractional components of post ground cover. Moreover, MODIS applications are useful in bushfire mapping and that uses a highly technical approach like deep learning on fire intensity using climatic data [80,81]. Using spectral mixture techniques on Landsat data has been reported to generate higher accuracy, ranging from 77% to 85% Kappa values, in terms of post-fire detection [82]. As previous studies reported, this studies also obtained high correlation for scorched vegetation, dNBR values (0.75) and RdNBR values (0.76) resulting in high accuracy for moderately burn and high burn vegetation classes (Table 2). Therefore, the fire severity map of PVNP is useful for fire and land managers to look for high-severity sites for vulnerability to soil erosion and plant regeneration.
The diverse group of wetland habitats in PVNP housed by bordered rivers and a row of limestone hills has faced forest fires intentionally set for the past years. Thus, the present approach has value for resource managers because it emphasizes the distinction between measures of severity after a fire and the resource impact of the fire. This study also generated the extent to which fire reflects potential ecosystem responses.
5. Conclusions
Remote sensing techniques to derive fire risk areas after wildfires or human-induced fires using multispectral data were useful. The unmixing results identified the relative abundance of ground components, predominantly soil and green vegetation, that were determined to be important for evaluating surface burn severity. Landsat data are widely used for post-fire change detection; for example, we used dNBR and RdNBR to assess the effects of the fire on the soil surface. In addition to dNBR and RdNBR, Laneve et al. [82] developed fire damage-severity indices using the composite burn index (CBI), burn severity index, and modified NBR to map the level of damage caused in vegetated areas by fire. Quantifying ground cover characteristics derived from satellite imagery provided a better evaluation of the physical condition of the soil surface. Some of these surface fire effects, especially soil cover and the lack of any remaining vegetative cover, are indicative of potential watershed responses. The methodology presented in this paper has certain implementation limitations in case of post-fire stabilization decisions. During this study, several parameters of concern became apparent in terms of data acquisition. Immediate post-fire images were often difficult to acquire due to smoke from fire and weather conditions. Ground data collections immediately after fire posed safety concerns and hence unfeasible at times. Further research is required to incorporate and make available immediate post-fire data for analysis.
Author Contributions
P.F.R. analyzed the data and wrote the paper; B.D.M. wrote, reviewed, and edited; Y.W. data preprocessed.
Funding
This research received no external funding.
Conflicts of Interest
The authors declare no conflict of interest.
References
- AL-Dhief, F.T.; Sabri, N.; Fouad, S.; Latiff, N.A.; Albader, M.A.A. A review of forest fire surveillance technologies: Mobile ad-hoc network routing protocols perspective. J. King Saud Univ.-Comput. Inf. Sci. 2017. [Google Scholar] [CrossRef]
- Goldammer, J.G. Forest on Fire. Science 1999, 284, 1782–1783. [Google Scholar] [CrossRef]
- Goldammer, J.G.; Jenkins, M.J. Fire in Ecosystem Dynamics, Mediterranean and Northern Perspectives; SPB Academic Publishing: The Hague, The Netherlands, 1990. [Google Scholar]
- Nepstad, D.C.; Verssimo, A.; Alencar, A.; Nobre, C.; Lima, E.; Lefebvre, P.; Schlesinger, P.; Potter, C.; Moutinho, P.; Mendoza, E.; et al. Large-scale impoverishment of Amazonian forests by logging and fire. Nature 1999, 398, 505. [Google Scholar] [CrossRef]
- Madurapperuma, B.D.; Kuruppuarachchi, K.A.J.M. Detecting land-cover change using mappable vegetation related indices: A case study from Sinharaja Man and the Biosphere Reserve. J. Trop. For. Environ. 2014, 4, 50–58. [Google Scholar] [CrossRef]
- Agee, J.K. Fire Ecology of Pacific Northwest Forests; Island Press: Washington, DC, USA, 1993. [Google Scholar]
- Daniels, A.E.; Cumming, G.S. Conversion or conservation? Understanding wetland change in Northwest Costa Rica. Ecol. Appl. 2008, 18, 49–63. [Google Scholar] [CrossRef] [PubMed]
- Millennium Ecosystem Assessment. Ecosystems and Human Well-Being: Wetlands and Water Synthesis; World Resources Institute: Washington, DC, USA, 2005. [Google Scholar]
- Leblon, B.; Bourgeau-Chavez, L.; San-Miguel-Ayanz, J. Use of remote sensing in wildfire management. In Sustainable Development-Authoritative and Leading Edge Content for Environmental Management; IntechOpen: London, UK, 2012. [Google Scholar] [CrossRef]
- Chuvieco, E.; Kasischke, E.S. Remote sensing information for fire management and fire effects assessment. J. Geophys. Res. 2007, 112. [Google Scholar] [CrossRef] [Green Version]
- Lanorte, A.; Danese, M.; Lasaponara, R.; Murgante, B. Multiscale mapping of burn area and severity using multisensor satellite data and spatial autocorrelation analysis. Int. J Appl. Earth Obs. 2013, 20, 42–51. [Google Scholar] [CrossRef]
- Meng, R.; Wu, J.; Schwager, K.L.; Zhao, F.; Dennison, P.E.; Cook, B.D.; Brewster, K.; Green, T.M.; Serbin, S.P. Using high spatial resolution satellite imagery to map forest burn severity across spatial scales in a Pine Barrens ecosystem. Remote Sens. Environ. 2017, 191, 95–109. [Google Scholar] [CrossRef]
- Epting, I.; Verbyla, D.; Sorbel, B. Evaluation of remotely sensed indices for assessing burn severity in interior Alaska using Landsat TM and ETM+. Remote Sens. Environ. 2005, 96, 328–339. [Google Scholar] [CrossRef]
- Fernández-García, V.; Quintano, C.; Taboada, A.; Marcos, E.; Calvo, L.; Fernández-Manso, A. Remote sensing applied to the study of fire regime attributes and their influence on post-fire greenness recovery in Pine ecosystems. Remote Sens. 2018, 10, 733. [Google Scholar] [CrossRef]
- Van Wagtendonk, J.W.; Root, R.R.; Key, C.C. Comparison of AVIRIS and Landsat ETM+ detection capabilities for burn severity. Remote Sens. Environ. 2004, 92, 397–408. [Google Scholar] [CrossRef]
- White, J.D.; Ryan, K.C.; Key, C.C.; Running, S.W. Remote sensing of forest fire severity and vegetation recovery. Int. J. Wildland Fire 1996, 6, 125–136. [Google Scholar] [CrossRef]
- Lutes, D.C.; Keane, R.E.; Caratti, J.F.; Key, C.H.; Benson, N.C.; Sutherland, S.; Gangi, L.J. FIREMON: Fire Effects Monitoring and Inventory System; Tech. Rep. RMRS-GTR-164-CD; US Department of Agriculture Forest Service, Rocky Mountain Research Station: Fort Collins, CO, USA, 2006. [Google Scholar]
- Miller, J.D.; Thode, A.E. Quantifying burn severity in a heterogeneous landscape with a relative version of the delta Normalized Burn Ratio (dNBR). Remote Sens. Environ. 2007, 109, 66–80. [Google Scholar] [CrossRef]
- Parks, S.A.; Dillon, G.K.; Miller, C. A new metric for quantifying burn severity: The relativized burn ratio. Remote Sens. 2014, 6, 1827–1844. [Google Scholar] [CrossRef]
- Miller, J.D.; Knapp, E.E.; Key, C.H.; Skinner, C.N.; Isbell, C.J.; Creasy, R.M.; Sherlock, J.W. Calibration and validation of the relative differenced Normalized Burn Ratio (RdNBR) to three measures of fire severity in the Sierra Nevada and Klamath Mountains, California, USA. Remote Sens. Environ. 2009, 113, 645–656. [Google Scholar] [CrossRef]
- Zhu, Z.; Key, C.; Ohlen, D.; Benson, N. Evaluate Sensitivities of Burn-Severity Mapping Algorithms for Different Ecosystems and Fire Histories in the United States; Final Report to the Joint Fire Science Program; Project: JFSP 01-1-4-12; USGS EROS: Sioux Falls, SD, USA, 2006.
- Cansler, C.A.; McKenzie, D. How robust are burn severity indices when applied in a new region? Evaluation of alternate field-based and remote-sensing methods. Remote Sens. 2012, 4, 456–483. [Google Scholar] [CrossRef]
- Landmann, T. Characterizing sub-pixel Landsat ETM+ fire severity on experimental fires in the Kruger National Park, South Africa. S. Afr. J. Sci. 2003, 99, 357–360. [Google Scholar]
- Smith, A.M.S.; Wooster, M.J.; Drake, N.A.; Dipotso, F.M.; Falkowski, M.J.; Hudak, A.T. Testing the potential of multi-spectral remote sensing for retrospectively estimating fire severity in African Savannahs. Remote Sens. Environ. 2005, 97, 92–115. [Google Scholar] [CrossRef]
- Boardman, J.W. Leveraging the high dimensionality of AVIRIS data for improved subpixel target unmixing and rejection of false positives: Mixture tuned matched filtering. In Proceedings of the Summaries of the Seventh Annual JPL Airborne Earth Science Workshop, Pasadena, CA, USA, 12–16 January 1998. [Google Scholar]
- Harsanyi, J.C.; Chang, C.I. Hyperspectral image classification and dimensionality reduction: An orthogonal subspace projection approach. IEEE Trans. Geosci. Remote Sens. 1994, 32, 779–785. [Google Scholar] [CrossRef]
- Boardman, J.W.; Kruse, F.A.; Green, R.O. Mapping target signatures via partial unmixing of AVIRIS data. In Proceedings of the Summaries of the Fifth Annual JPL Airborne Earth Science Workshop, Pasadena, CA, USA, 23–26 January 1995; Green, R.O., Ed.; NASA JPL: Pasadena, CA, USA, 1995; pp. 23–26. [Google Scholar]
- Glenn, N.F.; Mundt, J.T.; Weber, K.T.; Prather, T.S.; Lass, L.W.; Pettingill, J. Hyperspectral data processing for repeat detection of small infestations of leafy spurge. Remote Sens. Environ. 2005, 95, 399–412. [Google Scholar] [CrossRef]
- Harris, A.; Bryant, R.G.; Baird, A.J. Mapping the effects of water stress on Sphagnum: Preliminary observations using airborne remote sensing. Remote Sens. Environ. 2006, 100, 363–378. [Google Scholar] [CrossRef]
- Mundt, J.T.; Glenn, N.F.; Weber, K.T.; Prather, T.S.; Lass, L.W.; Pettingill, J. Discrimination of hoary cress and determination of its detection limits via hyperspectral image processing and accuracy assessment techniques. Remote Sens. Environ. 2005, 96, 509–517. [Google Scholar] [CrossRef]
- Williams, A.P.; Hunt, E.R. Estimation of leafy spurge cover from hyperspectral imagery using mixture tuned matched filtering. Remote Sens. Environ. 2002, 82, 446–456. [Google Scholar] [CrossRef]
- Smith, M.O.; Ustin, S.L.; Adams, J.B.; Gillespie, A.R. Vegetation in deserts: I. A regional measure of abundance from multi-spectral images. Remote Sens. Environ. 1990, 31, 1–26. [Google Scholar] [CrossRef]
- Boardman, J.W.; Kruse, F.A. Automated spectral analysis: A geological example using AVIRIS data, North Grapevine Mountains, Nevada. In Proceedings of the Tenth Thematic Conference on Geological Remote Sensing, San Antonio, TX, USA, 9–12 May 1994; Environmental Research Institute of Michigan: San Antonio, TX, USA, 1994; pp. 407–418. [Google Scholar]
- Kirksey, E. Living with parasites in Palo Verde national park. Environ. Hum. 2012, 1, 23–55. [Google Scholar] [CrossRef]
- Lindner, M.; Garcia-Gonzalo, J.; Kolström, M.; Geen, T.; Reguera, R.; Maroschek, M.; Seidl, R.; Lexer, M.J.; Netherer, S.; Schopf, A.; et al. Impacts of Climate Change on European Forests and Options for Adaptation. Available online: https://ec.europa.eu/agriculture/external-studies/euro-forests_en (accessed on 6 September 2018).
- Pausas, J.G.; Llovet, J.; Rodrigo, A.; Vallejo, R. Are wildfires a disaster in the Mediterranean basin?—A review. Int. J. Wildland Fires 2008, 17, 713–723. [Google Scholar] [CrossRef]
- González-de-Vega, S.; De las Heras, J.; Moya, D. Resilience of Mediterranean Terrestrial ecosystems and fire severity in semiarid areas: Responses of Aleppo pine forests in the short, mid and long term. Sci. Total Environ. 2016, 573, 1171–1177. [Google Scholar] [CrossRef] [PubMed]
- Céspedes, B.; Luna, B.; Pérez, B.; Urbieta, I.R.; Moreno, J. Burning season effects on the short-term post-fire vegetation dynamics of a Mediterranean heathland. Appl. Veg. Sci. 2014, 17, 86–96. [Google Scholar] [CrossRef]
- Pausas, J.G.; Keeley, J.E. Evolutionary ecology of resprouting and seeding in fireprone ecosystems. New Phytol. 2014, 204, 55–65. [Google Scholar] [CrossRef] [PubMed]
- Varela, M.E.; Benito, E.; Keizer, J.J. Influence of wildfire severity on soil physical degradation in two pine forest stands of NW Spain. Catena 2015, 133, 342–348. [Google Scholar] [CrossRef]
- Alvarado Quesada, G.M. The importance of Costa Rica for resident and migratory waterbirds. In Waterbirds around the World; Boere, G.C., Galbraith, C.A., Stroud, D.A., Eds.; The Stationery Office: Edinburgh, UK, 2006; pp. 161–165. [Google Scholar]
- Mateo-Varga, J. Caracteristicasgenerales de la Cuenca del Rio Tempisque. In La Cuenca del Rio Tempisque, Perspectivas para un ManejoIntegrado; Jime´nez, J.A., Gonzalez, E., Eds.; Organizacio´n para EstudiosTropicales: San Jose, Costa Rica, 2001; pp. 32–72. Available online: http://www.wetlands.org/Reports/SiteReports/CostaRica/6CR001/6CR001_ManPlansp.pdf (accessed on 27 July 2017).
- Adair, C.; Mora, N.B.; Laing, J.; Rogers, Z. Restoration of the Wetlands in Palo Verde National Park: A Legal and Ecological Analysis; Final Report to Joint Program in Environmental Law; University of Florida and University of Costa Rica: San Jose, Costa Rica, 2012; Available online: https://www.law.ufl.edu/_pdf/academics/academic-programs/study-abroad/costa-rica/Ramsar-Report.pdf (accessed on 25 May 2018).
- Luger, P.; Guinn, J. Geospatial analysis of effects of human-induced wetland fire on semi-fossorial turtles in Palo Verde, Costa Rica. In Proceedings of the First Americans Land-Grant Consortium (Falcon), Poster Presentations, NIFA Waterfront Centre, Washington, DC, USA, 17–20 October 2009; Volume 4. [Google Scholar]
- Arias, L. Wildfire Destroys 5 Hectares of Costa Rica’s Palo Verde National Park. The Tico Times. 2015. Available online: http://www.ticotimes.net/2015/02/11/wildfire-destroys-5-hectares-of-costa-ricas-palo-verde-national-park (accessed on 20 April 2018).
- GLCF. Global Land Cover Facility. Available online: http://glcfapp.glcf.umd.edu:8080/esdi/index.jsp (accessed on 1 May 2018).
- Rozario, P.F.; Oduor, P.; Kotchman, L.; Kangas, M. Transition modeling of land-use dynamics in the Pipestem Creek, North Dakota, USA. J. Geosci. Environ. Prot. 2017, 5, 182–201. [Google Scholar] [CrossRef]
- Gomes, R.; Straub, J. Genetic algorithm for flood detection and evacuation route planning. In Proceedings of the Algorithms and Technologies for Multispectral, Hyperspectral, and Ultraspectral Imagery XXIII, Anaheim, CA, USA, 5 May 2017; Volume 10198, p. 1019816. [Google Scholar]
- Baloloy, A.B.; Blanco, A.C.; Gana, B.S.; Ana, R.C.; Olalia, L.C. LANDSAT-based detection and severity analysis of burned sugarcane plots in Tarlac, Philippines using differenced normalized burn ratio (dNBR). ISPRS Int. Arch. Photogramm. 2016, XLII-4/W1, 173–179. [Google Scholar] [CrossRef]
- Key, C.H.; Benson, N.C. Landscape assessment: Remote sensing of severity, the Normalized Burn Ratio; and ground measure of severity, the Composite Burn Index. In FIREMON: Fire Effects Monitoring and Inventory System, RMRS-GTR; USDA Forest Service, Rocky Mountain Research Station: Ogden, UT, USA, 2006. [Google Scholar]
- Howard, S.; Ohlen, D.; McKinley, R.; Zhu, Z.; Kitchen, J. Historical fire severity mapping from Landsat data. In Proceedings of the Pecora 15/Land Satellite Information IV/ISPRS Commission I/FIEOS Conference, Denver, CO, USA, 10–15 November 2002. [Google Scholar]
- Lopez Garcia, M.J.; Caselles, V. Mapping burns and natural reforestation using Thematic Mapper data. Geocarto Int. 1991, 1, 31–37. [Google Scholar] [CrossRef]
- McGrew, J.C., Jr.; Monroe, C.B. An Introduction to Statistical Problem Solving in Geography; Waveland Press: Long Grove, IL, USA, 2009. [Google Scholar]
- Zimmerman, P.L.; Housman, I.W.; Perry, C.H.; Chastain, R.A.; Webb, J.B.; Finco, M.V. An accuracy assessment of forest disturbance mapping in the western Great Lakes. Remote Sens. Environ. 2013, 128, 176–185. [Google Scholar] [CrossRef]
- Jensen, J.R. Remote Sensing of the Environment: An Earth Resource Perspective 2/e; Pearson Prentice Hall: Upper Saddle River, NJ, USA, 2007. [Google Scholar]
- Chang, C.W.; Laird, D.A.; Mausbach, M.J.; Hurburgh, C.R. Near-infrared reflectance spectroscopy–principal components regression analyses of soil properties. Soil Sci. Soc. Am. J. 2001, 65, 480–490. [Google Scholar] [CrossRef]
- Lewis, S.A.; Lentile, L.B.; Hudak, A.T.; Robichaud, P.R.; Morgan, P.; Bobbitt, M.J. Mapping ground cover using hyperspectral remote sensing after the 2003 Simi and Old wildfires in Southern California. Fire Ecol. 2007, 3, 109–128. [Google Scholar] [CrossRef]
- Amraoui, M.; DaCamara, C.C.; Pereira, J.M. Fire detection and monitoring over Africa. In Proceedings of the 2008 EUMETSAT Meteorological Satellite Conference, Darmstadt, Germany, 8–12 September 2008; p. 52. [Google Scholar]
- Santidrián-Tomillo, P.; Robinson, N.J.; Fonseca, L.G.; Quirós-Pereira, W.; Arauz, R.; Beange, M.; Piedra, R.; Vélez, E.; Paladino, F.V.; et al. Secondary nesting beaches for leatherback turtles on the Pacific coast of Costa Rica. Lat. Am. J. Aquat. Res. 2017, 45, 563–571. [Google Scholar] [CrossRef]
- Green, A.A.; Berman, M.; Switzer, P.; Craig, M.D. A transformation for ordering multispectral data in terms of image quality with implications for noise removal. IEEE Trans. Geosci. Remote Sens. 1988, 26, 65–74. [Google Scholar] [CrossRef] [Green Version]
- Fernández-García, V.; Santamarta, M.; Fernández-Manso, A.; Quintano, C.; Marcos, E.; Calvo, L. Burn severity metrics in fire-prone pine ecosystems along a climatic gradient using Landsat imagery. Remote Sens. Environ. 2018, 206, 205–217. [Google Scholar] [CrossRef]
- Chang, C.I.; Heinz, D.C. Constrained subpixel target detection for remotely sensed imagery. IEEE Trans. Geosci. Remote Sens. 2000, 38, 1144–1159. [Google Scholar] [CrossRef]
- Robichaud, P.R.; Lewis, S.A.; Laes, D.Y.; Hudak, A.T.; Kokaly, R.F.; Zamudio, J.A. Postfire soil burn severity mapping with hyperspectral image unmixing. Remote Sens. Environ. 2007, 108, 467–480. [Google Scholar] [CrossRef]
- Jia, G.J.; Burke, I.C.; Goetz, A.F.H.; Kaufmann, M.R.; Kindel, B.C. Assessing spatial patterns of forest fuel using AVIRIS data. Remote Sens. Environ. 2006, 102, 318–327. [Google Scholar] [CrossRef]
- Pontius, R.G., Jr.; Millones, M. Death to Kappa: Birth of quantity disagreement and allocation disagreement for accuracy assessment. Int. J. Remote Sens. 2011, 32, 4407–4429. [Google Scholar] [CrossRef]
- Stein, A.; Aryal, J.; Gort, G. Use of the Bradley-Terry model to quantify association in remotely sensed images. IEEE Trans. Geosci. Remote 2005, 43, 852–856. [Google Scholar] [CrossRef]
- Walz, Y.; Maier, S.W.; Dech, S.W.; Conrad, C.; Colditz, R.R. Classification of burn severity using Moderate Resolution Imaging Spectroradiometer (MODIS): A case study in the jarrah-marri forest of southwest Western Australia. J. Geophys. Res. Biogeosci. 2007, 112. [Google Scholar] [CrossRef] [Green Version]
- Ye, S.; Pontius, R.G.; Rakshit, R. A review of accuracy assessment for object-based image analysis: From per-pixel to per-polygon approaches. ISPRS J. Photogramm. 2018, 141, 137–147. [Google Scholar] [CrossRef]
- Jensen, J.R. Introductory Digital Image Processing: A Remote Sensing Perspective, 3rd ed.; Prentice-Hall, Inc.: Upper Saddle River, NJ, USA, 2005. [Google Scholar]
- Michalek, J.L.; French, N.H.F.; Kasischke, E.S.; Johnson, R.D.; Colwell, J.E. Using Landsat TM data to estimate carbon release from burned biomass in an Alaskan spruce forest complex. Int. J. Remote Sens. 2000, 21, 323–338. [Google Scholar] [CrossRef] [Green Version]
- Isaev, A.S.; Korovin, G.N.; Bartalev, S.A.; Ershov, D.V.; Janetos, A.; Kasischke, E.S.; Shugart, H.H.; French, N.H.F.; Orlick, B.E.; Murphy, T.L. Using remote sensing to assess Russian forest fire carbon emissions. Clim. Chang. 2002, 55, 235–249. [Google Scholar] [CrossRef]
- Díaz-Delgado, R.; Lloret, F.; Pons, X. Influence of fire severity on plant regeneration by means of remote sensing imagery. Int. J. Remote Sens. 2003, 24, 1751–1763. [Google Scholar] [CrossRef] [Green Version]
- Cocke, A.E.; Fulé, P.Z.; Crouse, J.E. Comparison of burn severity assessments using Differenced Normalized Burn Ratio and ground data. Int. J. Wildland Fire 2005, 14, 189–198. [Google Scholar] [CrossRef]
- Hall, R.J.; Freeburn, J.T.; De Groot, W.J.; Pritchard, J.M.; Lynham, T.J.; Landry, R. Remote sensing of burn severity: Experience from western Canada boreal fires. Int. J. Wildland Fire 2008, 17, 476–489. [Google Scholar] [CrossRef]
- Smith, A.M.S.; Lentile, L.B.; Hudak, A.T.; Morgan, P. Evaluation of linear spectral unmixing and ΔNBR for predicting post-fire recovery in a North American ponderosa pine forest. Int. J. Remote Sens. 2007, 28, 5159–5166. [Google Scholar] [CrossRef]
- Kokaly, R.F.; Rockwell, B.W.; Haire, S.L.; King, T.V. Characterization of post-fire surface cover, soils, and burn severity at the Cerro Grande Fire, New Mexico, using hyperspectral and multispectral remote sensing. Remote Sens. Environ. 2007, 106, 305–325. [Google Scholar] [CrossRef]
- Hammill, K.A.; Bradstock, R.A. Remote sensing of fire severity in the Blue Mountains: Influence of vegetation type and inferring fire intensity. Int. J. Wildland Fire 2006, 15, 213–226. [Google Scholar] [CrossRef]
- González-Alonso, F.; Merino-De-Miguel, S.; Roldán-Zamarrón, A.; García-Gigorro, S.; Cuevas, J.M. MERIS Full Resolution data for mapping level-of-damage caused by forest fires: The Valencia de Alcántara event in August 2003. Int. J. Remote Sens. 2007, 28, 797–809. [Google Scholar] [CrossRef]
- Alleaume, S.; Hely, C.; Le Roux, J.; Korontzi, S.; Swap, R.J.; Shugart, H.H.; Justice, C.O. Using MODIS to evaluate heterogeneity of biomass burning in southern African savannahs: A case study in Etosha. Int. J. Remote Sens. 2005, 26, 4219–4237. [Google Scholar] [CrossRef]
- Dutta, R.; Aryal, J.; Das, A.; Kirkpatrick, J.B. Deep cognitive imaging systems enable estimation of continental-scale fire incidence from climate data. Sci. Rep. 2013, 3, 3188. [Google Scholar] [CrossRef] [PubMed]
- Wooster, M.J.; Zhukov, B.; Oertel, D. Fire radiative energy for quantitative study of biomass burning: Derivation from the BIRD experimental satellite and comparison to MODIS fire products. Remote Sens. Environ. 2003, 86, 83–107. [Google Scholar] [CrossRef]
- Laneve, G.; Fusilli, L.; Marzialetti, P.; De Bonis, R.; Bernini, G.; Tampellini, L. Development and validation of fire damage-severity indices in the framework of the PREFER project. IEEE J. Sel. Top. Appl. 2016, 9, 2806–2817. [Google Scholar] [CrossRef]
Figure 1.
Map of the study site. Palo Verde National Park in Guanacaste showing distribution of land-cover within the area.
Figure 1.
Map of the study site. Palo Verde National Park in Guanacaste showing distribution of land-cover within the area.

Figure 2.
Flowchart for the overall methodology of the burn severity mapping in the Palo Verde National Park, Costa Rica.
Figure 2.
Flowchart for the overall methodology of the burn severity mapping in the Palo Verde National Park, Costa Rica.
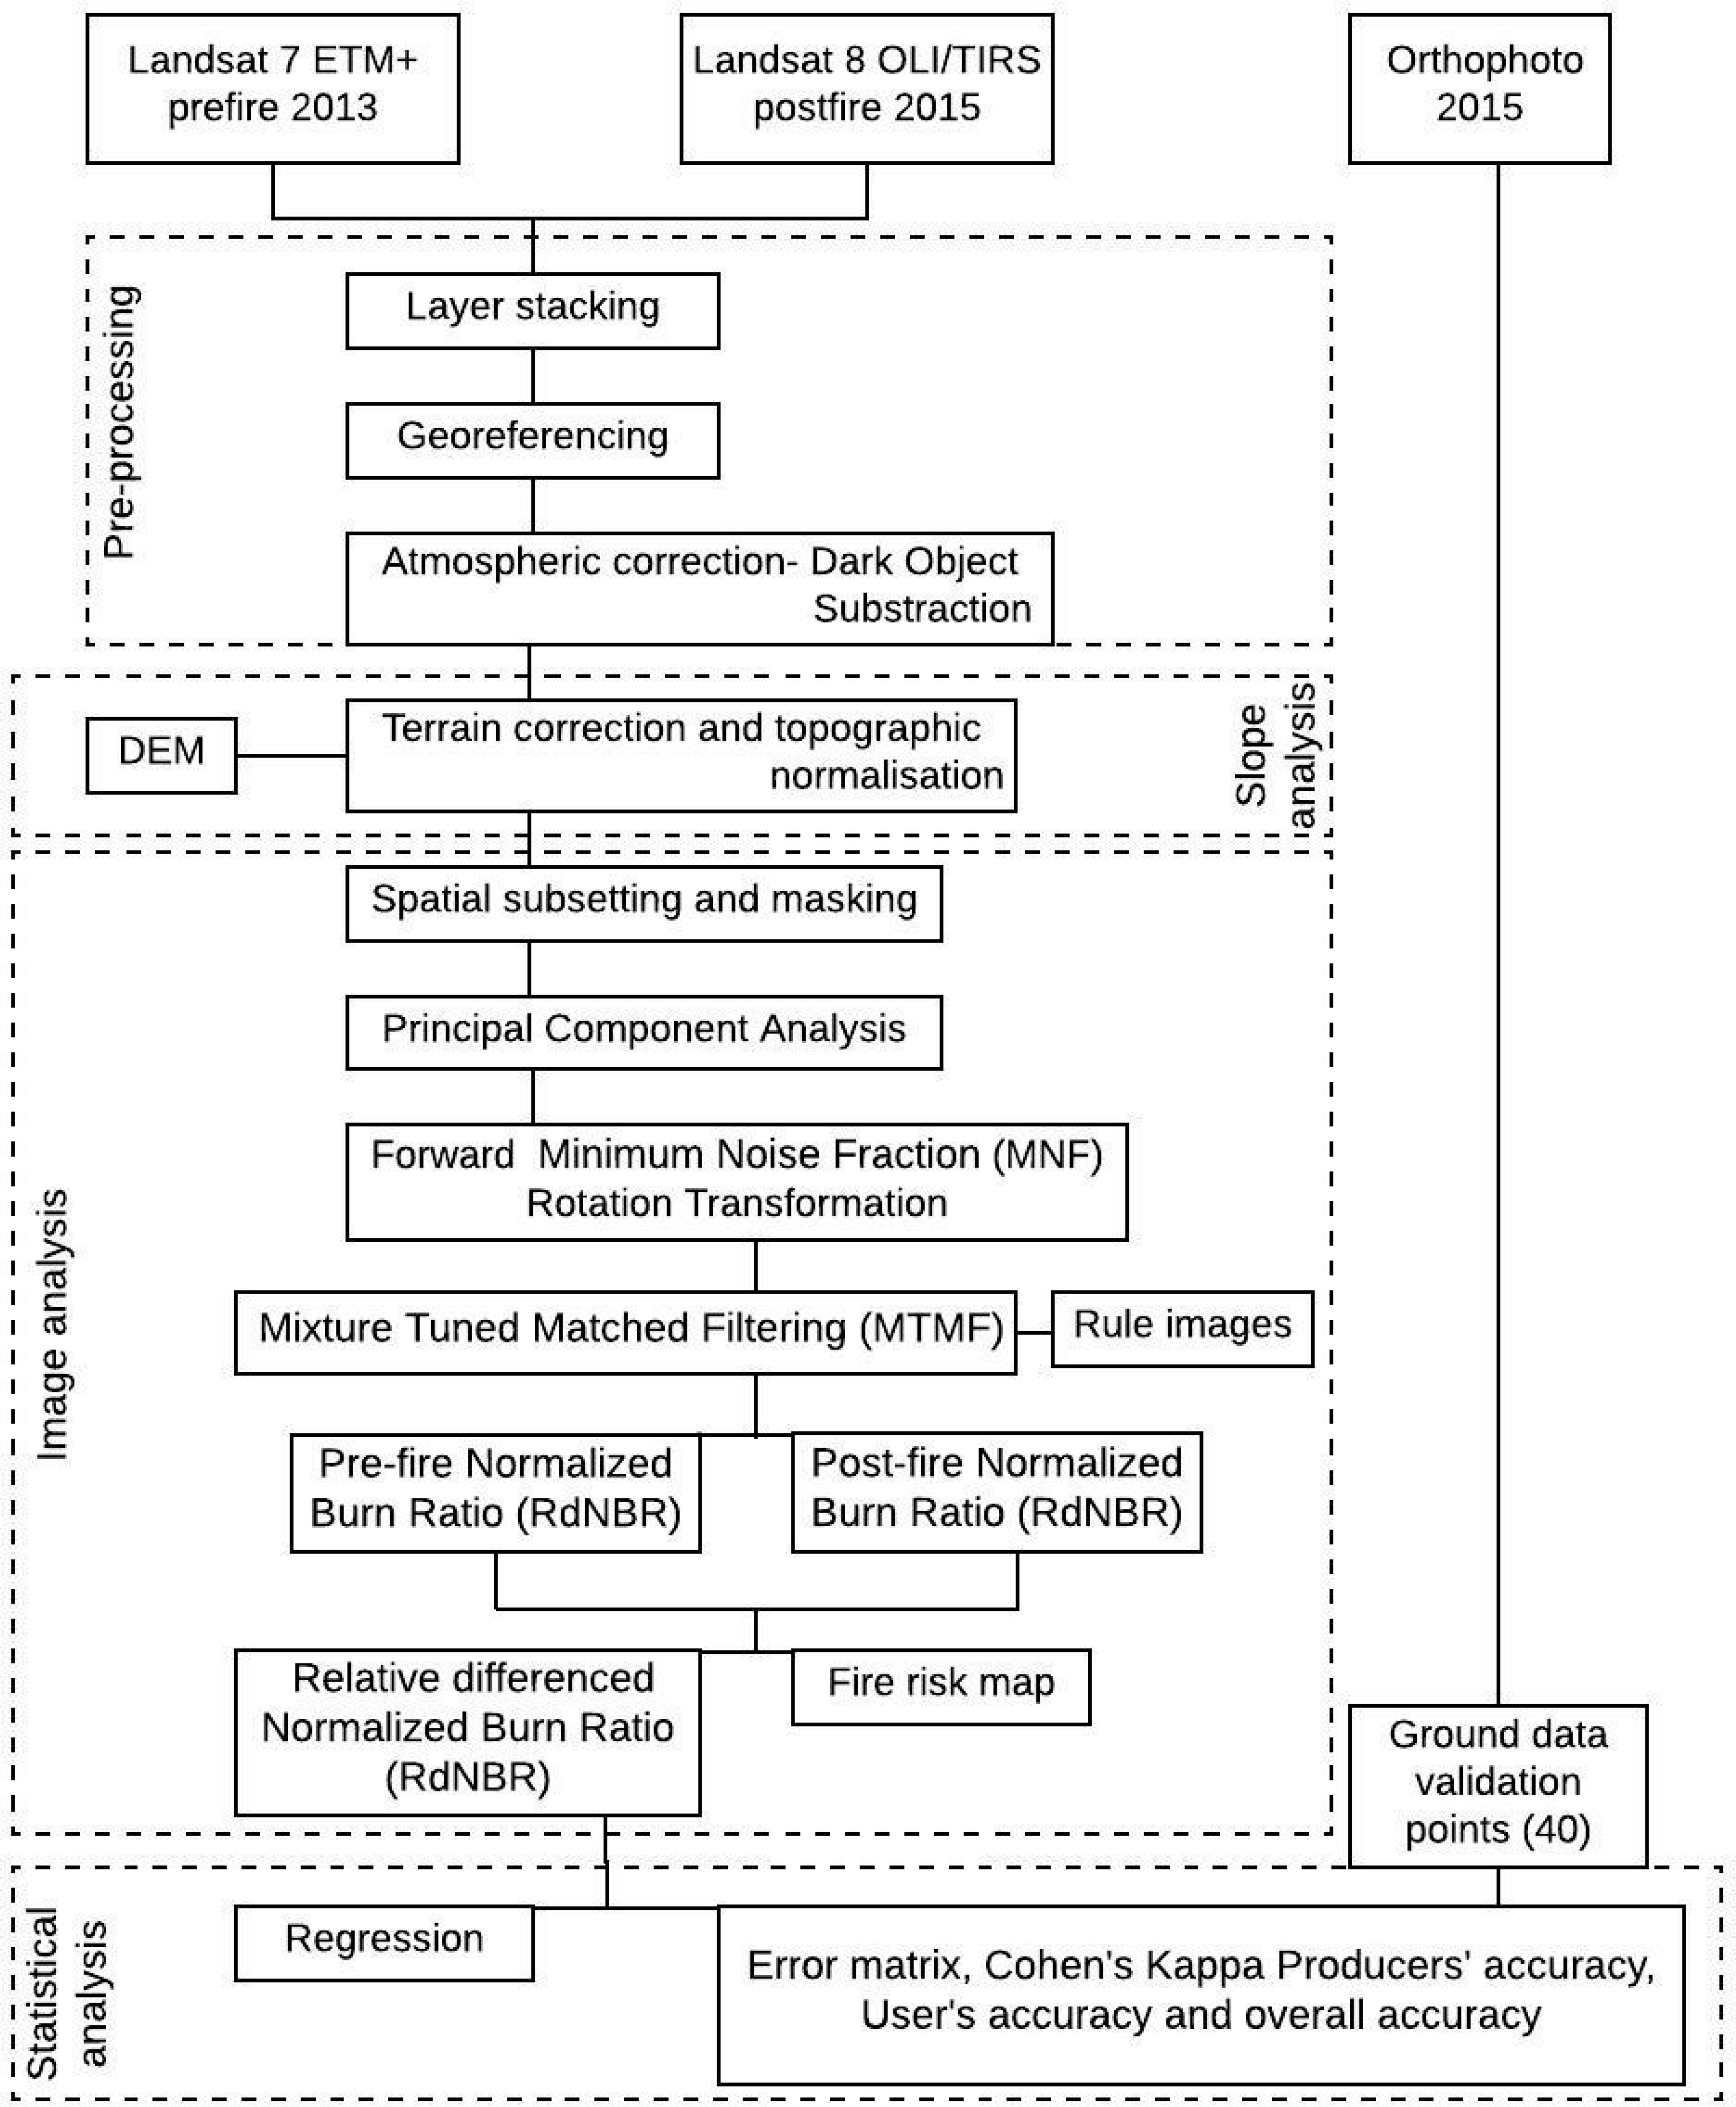
Figure 3.
Elevation map of Palo Verde National Park in Guanacaste showing the relief of the area.

Figure 4.
Rule images of Mixture Tuned Matched Filtering (MTMF) scores: (a) pre-fire MTMF, (b) post fire MTMF.
Figure 4.
Rule images of Mixture Tuned Matched Filtering (MTMF) scores: (a) pre-fire MTMF, (b) post fire MTMF.

Figure 5.
Reflectance spectra from Dark Object Subtraction. Landsat images showing green vegetation and uncharred soil reflectance curves from pre-fire image year 2013 and charred soil and charred/scorched vegetation reflectance curves from post-fire image year 2015.
Figure 5.
Reflectance spectra from Dark Object Subtraction. Landsat images showing green vegetation and uncharred soil reflectance curves from pre-fire image year 2013 and charred soil and charred/scorched vegetation reflectance curves from post-fire image year 2015.
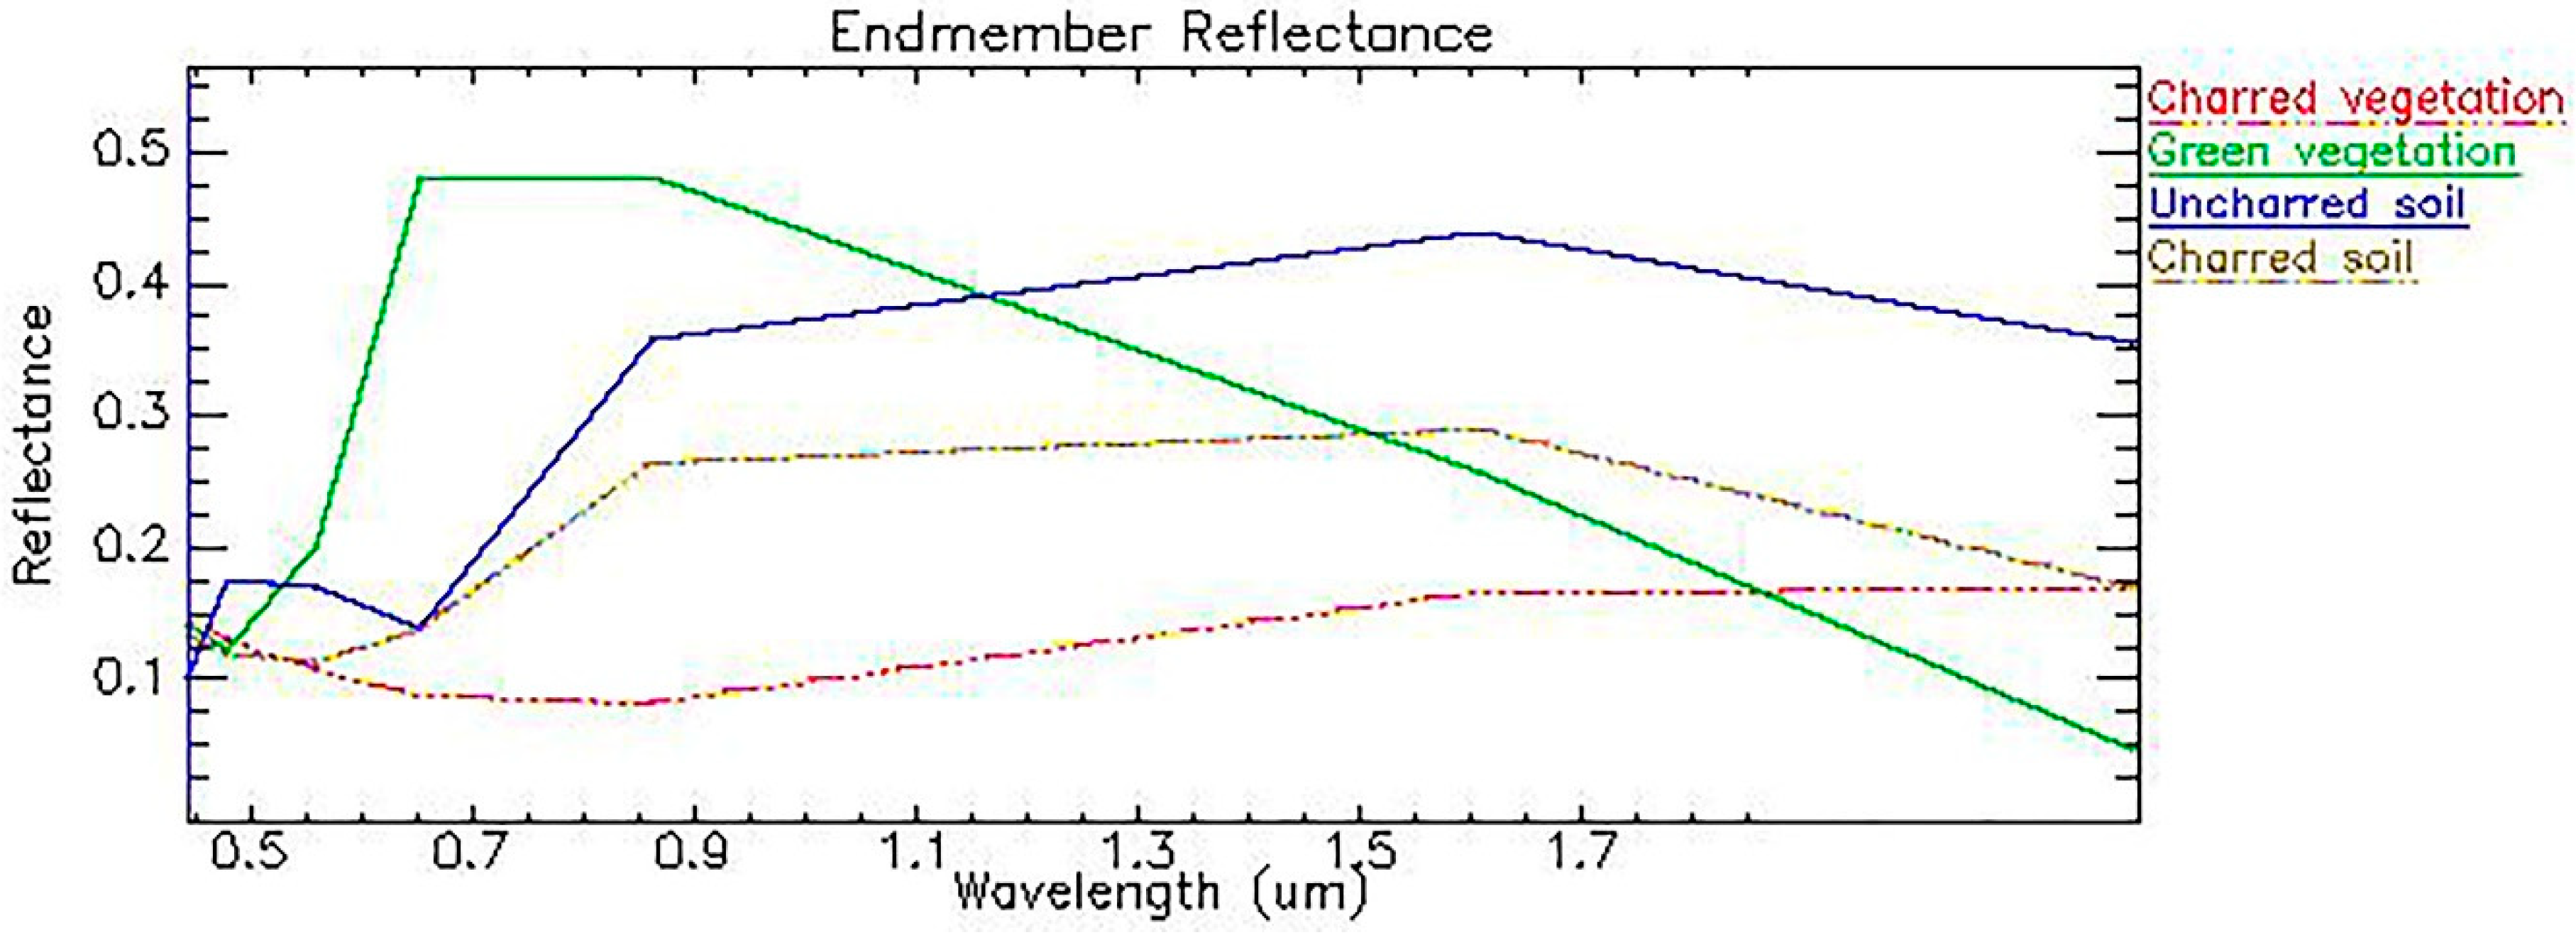
Figure 6.
Thematic burn severity layer of Palo Verde National Park (PVNP) derived from RdNBR depicting severity as low, moderate, high; Transition areas between the zones are also noticed.
Figure 6.
Thematic burn severity layer of Palo Verde National Park (PVNP) derived from RdNBR depicting severity as low, moderate, high; Transition areas between the zones are also noticed.

Figure 7.
Scatterplots showing comparison of MTMF scores with ground data: (a) MTMF scores versus scorched vegetation cover in %, (b) MTMF scores versus soil cover in %.
Figure 7.
Scatterplots showing comparison of MTMF scores with ground data: (a) MTMF scores versus scorched vegetation cover in %, (b) MTMF scores versus soil cover in %.


Table 1.
Values derived from dNBR indicating burn severity and classified based on the USGS Fire Effects Monitoring and Inventory Protocol (FireMON) program [17].
Table 1.
Values derived from dNBR indicating burn severity and classified based on the USGS Fire Effects Monitoring and Inventory Protocol (FireMON) program [17].
| dNBR | Burn Severity |
|---|---|
| −0.1 to 0.1 | Unburned or no change |
| 0.1 to 0.27 | Low-severity burn |
| 0.27 to 0.44 | Moderate-low severity burn |
| 0.44 to 0.66 | Moderate-high severity burn |
| >0.66 | High-severity burn |
Table 2.
Pearson correlation coefficients between ground values (n = 40) and image pixels.
| Ground Cover | MTMF Scores | NBR Values | dNBR Values | RdNBR Values |
|---|---|---|---|---|
| Scorched vegetation (%) | 0.72 | 0.70 | 0.75 | 0.76 |
| Soil cover (%) | 0.34 | 0.55 | 0.51 | 0.53 |
Table 3.
Error Matrix of dNBR derived data 1.
| Category | Unburnt | Low | Moderate | High | Sum | User’s in % |
|---|---|---|---|---|---|---|
| Unburnt/No change | 5 | 5 | 0 | 0 | 10 | 50.00 |
| Low | 6 | 24 | 0 | 0 | 30 | 80.00 |
| Moderate | 0 | 6 | 55 | 4 | 65 | 84.62 |
| High | 0 | 0 | 1 | 78 | 79 | 98.73 |
| Sum | 11 | 35 | 56 | 82 | 184 | |
| Producers in % | 45.45 | 68.57 | 98.21 | 95.12 |
1 Overall accuracy 84.4, Kappa Coefficient 0.82.
Table 4.
Error Matrix of RdNBR derived data 1.
| Category | Unburnt | Low | Moderate | High | Sum | User’s in % |
|---|---|---|---|---|---|---|
| Unburnt/No change | 4 | 5 | 0 | 0 | 9 | 44.44 |
| Low | 6 | 22 | 0 | 0 | 28 | 78.57 |
| Moderate | 0 | 6 | 63 | 4 | 73 | 86.30 |
| High | 0 | 0 | 1 | 79 | 80 | 98.75 |
| Sum | 10 | 33 | 64 | 83 | 190 | |
| Producers in % | 40 | 66.67 | 98.44 | 95.18 |
1 Overall accuracy 89.4, Kappa Coefficient 0.82.
© 2018 by the authors. Licensee MDPI, Basel, Switzerland. This article is an open access article distributed under the terms and conditions of the Creative Commons Attribution (CC BY) license (http://creativecommons.org/licenses/by/4.0/).
Share and Cite
MDPI and ACS Style
Rozario, P.F.; Madurapperuma, B.D.; Wang, Y. Remote Sensing Approach to Detect Burn Severity Risk Zones in Palo Verde National Park, Costa Rica. Remote Sens. 2018, 10, 1427. https://doi.org/10.3390/rs10091427
AMA Style
Rozario PF, Madurapperuma BD, Wang Y. Remote Sensing Approach to Detect Burn Severity Risk Zones in Palo Verde National Park, Costa Rica. Remote Sensing. 2018; 10(9):1427. https://doi.org/10.3390/rs10091427
Chicago/Turabian StyleRozario, Papia F., Buddhika D. Madurapperuma, and Yijun Wang. 2018. "Remote Sensing Approach to Detect Burn Severity Risk Zones in Palo Verde National Park, Costa Rica" Remote Sensing 10, no. 9: 1427. https://doi.org/10.3390/rs10091427
Note that from the first issue of 2016, this journal uses article numbers instead of page numbers. See further details here.